Embed Size (px)
Citation preview
Applications of Nonlinear Optics
and Optical Fibers
Thomas Vestergaard AndersenDepartment of Physics and Astronomy &NKT Academy, Department of Chemistry
University of Aarhus, Denmark
PhD thesisApril 2006

This thesis is submitted to the Faculty of Science at the University ofAarhus, Denmark, in order to fulfill the requirements for obtaining thePhD degree in Physics. The studies have been carried out at the De-partment of Physics and Astronomy under the supervision of Prof. SørenKeiding.
List of Publications
Journals:
[I] High-power intracavity frequency doubling of a Ti:Sapphire femtosecondoscillator.T. V. Andersen, J. Thøgersen, S. R. Keiding, J. J. Larsen. Appl. Phys.B, Vol 76 (6), 639-644 (2003).
[II] Supercontinuum generation in a photonic crystal fiber with two zero dis-persion wavelengths.K. M. Hilligsøe, T. V. Andersen, H. N. Paulsen, C. K. Nielsen, K. Mølmer,S. R. Keiding, R. Kristiansen, K. P. Hansen, J. J. Larsen. Opt. Express,12, 1045 (2004).
[III] Continuous-wave wavelength conversion in a photonic crystal fiber withtwo closely lying zero dispersion wavelengths.T. V. Andersen, K. M. Hilligsøe, C. K. Nielsen, J. J. Larsen, J. Thøgersen,S. R. Keiding. Optics Express, 12 (17), 4113 (2004).
[IV] Stability analysis of an all-fiber coupled cavity Fabry-Perot additive pulsemodelocked laser.C. K. Nielsen, T. V. Andersen, S. R. Keiding. J. Quantum Electronics 41(2), 198 (2005).
[V] All-fiber actively Q-switched Yb-laser.T. V. Andersen, P. Perez-Milan, R. Duchowicz, S. R. Keiding, S. Agger,M. Andres. Opt. Comm. 260 (1), 251 (2006)
[VI] Supercontinuum generation by femtosecond single and dual wavelengthpumping in photonic crystal fibers with two zero dispersion wavelengths.T. Schreiber, T. V. Andersen, D. Schimpf, J. Limpert, A. Tunnermann.Optics Express 13, 9556-9569 (2005)
iii
iv
[VI] High repetition rate tunable femtosecond pulses and broadband amplifica-tion from a fiber laser pumped parametric amplifier.T. V. Andersen, O. Schmidt, J. Limpert, A. Tunnermann, C. Aguergaray,E. Cormier. Optics Express 14, 4765-4773 (2006)
Conference Contributions:
[i] Large mode area photonic crystal fiber laser passively Q-switched withCr4+:YAG.S. Buchter, Y. Qian, T. V. Andersen, J. R. Folkenberg, C. F. Pedersen,P. M. Skovgard, H. Simonsen. The proceedings of SPIE Conference, 2004.
[ii] Supercontinuum generation in a photonic crystal fiber with two closely ly-ing zero dispersion wavelengths.K. M. Hilligsøe, T. V. Andersen, H. N. Paulsen, C. K. Nielsen, K. Mølmer,S. R. Keiding, R. Kristiansen, K. P. Hansen, J. J. Larsen. CLEO/IQECand PhAST Technical Digest on CDROM (The Optical Society of Amer-ica, Washington, DC, 2004), CWK5.
[iii] Supercontinuum generation by femtosecond single and dual wavelengthpumping in photonic crystal fibers with two zero dispersion wavelengths.T. Schreiber, T. V. Andersen, D. Schimpf, J. Limpert, A. Tunnermann.Photonics West, San Jose, 2006
[iv] High repetition rate tunable femtosecond pulses and broadband amplifica-tion from fiber laser pumped parametric amplifier.T. V. Andersen, O. Schmidt, J. Limpert, A. Tunnermann, C. Aguergaray,E. Cormier. Advanced Solid State Photonics (ASSP), Lake Tahoe, 2006
[iv] Ultrashort pulse generation by fiber laser pumped parametric amplification.T. V. Andersen, O. Schmidt, J. Limpert, A. Tunnermann, C. Aguergaray,E. Cormier. CLEO/IQEC and PhAST, Long Beach, California, 2006
Contents
Contents v
1 Introduction 1
2 Nonlinear optics and optical fibers 72.1 Nonlinear optics . . . . . . . . . . . . . . . . . . . . . . . . . . . 82.2 Basic properties of optical fibers . . . . . . . . . . . . . . . . . . 10
2.2.1 The nonlinear Schrodinger equation . . . . . . . . . . . . 122.2.2 Dispersion . . . . . . . . . . . . . . . . . . . . . . . . . . . 132.2.3 Self phase modulation . . . . . . . . . . . . . . . . . . . . 16
2.3 Rare Earth doped fibers . . . . . . . . . . . . . . . . . . . . . . . 172.4 Photonic crystal fibers . . . . . . . . . . . . . . . . . . . . . . . . 192.5 Super continuum generation in PCFs . . . . . . . . . . . . . . . . 22
3 Intracavity frequency doubling of a Ti:Sapphire oscillator 253.1 Introduction . . . . . . . . . . . . . . . . . . . . . . . . . . . . . . 263.2 Intracavity second harmonic generation . . . . . . . . . . . . . . 26
3.2.1 Setup . . . . . . . . . . . . . . . . . . . . . . . . . . . . . 263.2.2 Cavity dispersion . . . . . . . . . . . . . . . . . . . . . . . 293.2.3 Characterization . . . . . . . . . . . . . . . . . . . . . . . 30
3.3 Optical parametric amplification . . . . . . . . . . . . . . . . . . 313.4 Summary . . . . . . . . . . . . . . . . . . . . . . . . . . . . . . . 32
4 Continuous wave four-wave mixing in a photonic crystal fiber 354.1 Introduction . . . . . . . . . . . . . . . . . . . . . . . . . . . . . . 364.2 Four wave mixing . . . . . . . . . . . . . . . . . . . . . . . . . . . 364.3 Phasematching in CF NL-PM-750 . . . . . . . . . . . . . . . . . 384.4 Experimental results . . . . . . . . . . . . . . . . . . . . . . . . . 404.5 Summary . . . . . . . . . . . . . . . . . . . . . . . . . . . . . . . 43
v

vi CONTENTS
5 Q-switched fiber laser 455.1 Introduction . . . . . . . . . . . . . . . . . . . . . . . . . . . . . . 465.2 Experimental setup . . . . . . . . . . . . . . . . . . . . . . . . . . 475.3 Results . . . . . . . . . . . . . . . . . . . . . . . . . . . . . . . . . 505.4 Outlook . . . . . . . . . . . . . . . . . . . . . . . . . . . . . . . . 535.5 Summary . . . . . . . . . . . . . . . . . . . . . . . . . . . . . . . 54
6 Fiber dispersion measurements with white-light interferometry 576.1 Introduction . . . . . . . . . . . . . . . . . . . . . . . . . . . . . . 586.2 Experimental setup . . . . . . . . . . . . . . . . . . . . . . . . . . 596.3 Theory . . . . . . . . . . . . . . . . . . . . . . . . . . . . . . . . . 606.4 Example - HC 1060-02 air guiding fiber . . . . . . . . . . . . . . 616.5 Summary . . . . . . . . . . . . . . . . . . . . . . . . . . . . . . . 64
7 Dual-wavelength pumping of photonic crystal fibers 657.1 Introduction . . . . . . . . . . . . . . . . . . . . . . . . . . . . . . 667.2 Experimental setup . . . . . . . . . . . . . . . . . . . . . . . . . . 667.3 Results . . . . . . . . . . . . . . . . . . . . . . . . . . . . . . . . . 677.4 Picosecond dual-wavelength pumping . . . . . . . . . . . . . . . . 727.5 Nanosecond dual-wavelength pumping . . . . . . . . . . . . . . . 737.6 Summary . . . . . . . . . . . . . . . . . . . . . . . . . . . . . . . 74
8 Fiber laser pumped optical parametric amplifier 758.1 Introduction . . . . . . . . . . . . . . . . . . . . . . . . . . . . . . 768.2 Theory of optical parametric amplification . . . . . . . . . . . . . 77
8.2.1 Non-collinear optical parametric amplification . . . . . . . 798.3 Experimental setup . . . . . . . . . . . . . . . . . . . . . . . . . . 818.4 Tunable parametric amplification . . . . . . . . . . . . . . . . . . 83
8.4.1 Broadband phasematching . . . . . . . . . . . . . . . . . . 838.4.2 Narrowband phasematching . . . . . . . . . . . . . . . . . 84
8.5 Short-pulse amplification . . . . . . . . . . . . . . . . . . . . . . . 868.6 Summary and outlook . . . . . . . . . . . . . . . . . . . . . . . . 90
9 Summary and acknowledgements 919.1 Summary . . . . . . . . . . . . . . . . . . . . . . . . . . . . . . . 92
9.1.1 Perspectives . . . . . . . . . . . . . . . . . . . . . . . . . . 939.2 Acknowledgements . . . . . . . . . . . . . . . . . . . . . . . . . . 94
A List of abbreviations 95
B Numerical model 97
References 105

Chapter 1
Introduction
1
2 Introduction
Optical fibers are probably one of the most important scientific achievementsin the last century. They form the backbone of our communication infrastruc-ture and allow us to access almost any information in a matter of secondsthrough the internet. But there is more to optical fibers than their well-knownability to guide signals around the globe and this thesis will investigate some oftheir alternative applications.This project is a collaboration between the Arhus University and the NKT-Photonics group. NKT-Photonics is a constellation of relatively small spin-offcompanies of which three have been relevant for the work presented here: Ko-heras, Crystal Fibre and NKT-Research & Innovation (NKT-Research). Ko-heras produces various types of fiber lasers, mainly for sensing and surveillancepurposes, while Crystal Fibre is manufacturing a special type of optical fibers- the photonic crystal fibers (PCFs). NKT-Research carries out relevant basicresearch to support further development of the companies within the NKT-Photonics group.The NKT-Photonics adventure really took off in the year 2000 when the NKT-owned spin-off company, Giga was sold to Intel for about 1.3 billion Euros. Thesale spurred further growth of other spin-offs - among those Koheras and Crys-tal Fibre - and significant investments were made in production facilities andfundamental research. Additionally, the NKT-Academy [1] was founded and nu-merous photonics-related PhD-projects were initiated in Denmark and abroad.At the University of Arhus, the present and three additional NKT-AcademyPhD-projects were started in 2001-2002 in collaboration with Søren Keiding atthe Institute of Chemistry. The initial work was focused on understanding andusing the properties of the recently emerged PCFs made by Crystal Fibre. Thenew fibers drew much attention at the time, mostly because of the spectacu-lar super continuum generation which had been demonstrated by Herrmann in2001 [2, 3]. The prospect of using the demonstrated bandwidth of more than1000 nm for telecommunication purposes brought the PCFs to the front pagesand rose the expectations for the future of Crystal Fibre. Shortly after however,the telecommunication market collapsed and numerous companies disappearedfrom the scene. In the following months it became clear that it would takeyears for the telecommunication industry to recover, so NKT-Photonics decidedto shift the focus away from telecommunication applications and developmentof new fiber lasers for industry, sensing and medicine became the main priority.The shift made sense since the existing knowledge about fiber lasers in Koherascould be combined with the unique fibers from Crystal Fibre to give a compet-itive edge.As a NKT-Academy student with close contact to NKT-Research, the transitionalso had an impact on the focus areas of my PhD. My first year was dedicated tofinding new applications of the PCFs and I focused on parametric amplificationof super continua from PCFs and continuous wave four-wave mixing (chapters
3
3 and 4). With NKT-Research focussing on fiber lasers it was natural to shiftto this field as well and I started working on fiber amplifiers and Q-switchingof fiber lasers. These projects were made in direct collaboration with NKT-Research and their partner at the University of Valencia, Spain. The results aredescribed in chapter 5.
In the following two years Crystal Fiber developed new types of PCFs. Withthe production of fiber lasers in mind, the original small core, highly nonlinear,fibers were now accompanied by a variety of doped Large Mode Area (LMA)fibers. The versatility of the PCF technology enabled scaling of the fiber dimen-sions without sacrificing mode quality. The increased mode size implied verylow nonlinearity and thereby the capacity to guide high power levels.Driven by the new fibers from Crystal Fibre and other fiber manufacturers,the development of high power fiber lasers has virtually exploded and todayfiber lasers can almost match conventional solid state lasers in terms of out-put power. Q-switched fiber lasers and femtosecond fiber oscillators are alsoemerging in these years and rapidly approach the performance level of tradi-tional systems. The USA-based company IMRA [4] and Frank Wise´s groupat Cornell University [5] have been major driving forces in the development offiber oscillators. Today, more than ten nanojoule femtosecond pulses can beobtained from environmentally stable fiber oscillators [6].The high-power development has mainly been pushed by the German companyIPG [7] and Andreas Tunnermann’s group in Jena [8]. IPG has demonstratedmore than 1.5 kW of continuous wave from a fiber laser [7] and is now devel-oping commercial fiber laser systems. The group in Jena has pushed the limitsof average power and pulse energy from fiber lasers and has been a valuablecooperator for Crystal Fibre in the development process. The combination ofcutting edge fiber technology and high power expertise has led to rapid progress.One of the latest results from Jena is a 100 W 220 fs laser [9].
I stayed in Jena during summer and fall of 2005 and worked on super contin-uum generation in collaboration with Thomas Schreiber, a NKT-Academy stu-dent and member of the Jena group. Specifically, we investigated super contin-uum generation in PCFs with femtosecond pulses in a two-pump configuration.The experiments were motivated by a newly developed nanosecond whitelightsource from Koheras which was based on a similar dual-pump scheme. The fem-tosecond experiments were therefore made to obtain a deeper understanding ofthe fundamental processes of the dual-pumping scheme. The outcome of thiswork is described in chapter 7.The last part of my stay in Jena was dedicated to a larger project combining thework with super continua and high power fiber lasers. Returning to the formeridea of making parametric amplification of super continua from PCFs (chapter
4 Introduction
3), a high power fiber laser pumped parametric amplifier was built. The ex-periment demonstrated a new way of making optical parametric amplificationand introduced fiber lasers as pump sources for such setups. The potential andadvantages of fiber laser pumped optical parametric amplifiers will be describedin chapter 8.
Outline of the thesis
The thesis starts with a broad introduction to nonlinear optics and opticalfibers with emphasis on PCFs and nonlinear fiber optics. The following chap-ters chronologically describe the main topics of this project.
Chapter 2 Nonlinear optics and optical fibers.A brief introduction to nonlinear optics and a description of the fundamentalproperties of optical fibers. The nonlinear Schrodinger equation is derived andmicrostructured fibers are introduced.
Chapter 3 Intracavity frequency doubling of a Ti:Sapphire oscillator.The first part of my PhD was focused on re-designing a femtosecond Ti:Sapphirelaser cavity. The aim was to make intracavity frequency doubling in order toobtain a strong blue pump source which could pump a parametric amplifier.The synchronized seed for the amplifier was a supercontinuum generated in aPCF by the remaining fundamental power from the Ti:Sapphire oscillator.The chapter is based on publication I. (see publication list)
Chapter 4 Continuous wave four-wave-mixing in a photonic crystal fiber.The unique dispersion of some PCFs allows nonlinear effects to take place atlow power levels. Four-wave-mixing is usually only important in the spectralregion close to the zero dispersion wavelength, but in PCFs it can take placeover hundreds of nanometers. The chapter is based on publication II.
Chapter 5 Q-switched fiber laser.This chapter describes the work with nanosecond Q-switched fiber lasers. Sev-eral approaches to obtain pulsed sources were attempted and this chapter willdescribe the work with an all-fiber Q-switched laser based on modulation of afiber Bragg grating. The chapter is based on publication III.
Chapter 6 Fiber dispersion measurements with white-light interferometry.One of the main advantages of PCFs is the ability to tailor the dispersion profile.Precise knowledge of the dispersion is crucial for understanding the nonlineareffects taking place in the fibers. White-light interferometry is a simple, reliabletechnique to measure dispersion and this chapter describes a fiber based setup
5
made on request from NKT-Research. Dispersion profiles from well-known fibersas well as novel designs are presented.
Chapter 7 Dual-wavelength pumping of photonic crystal fibers.Co-propagating two femtosecond pulses in a PCF is shown to result in su-per continua displaying exceptional flatness in the blue and green part of thespectrum. The underlying mechanism is identified as cross-phase modulation.Deeper understanding of the process may help to improve existing white-lightsources relying on the dual-pump technique. The chapter is based on publica-tions IV and iii.
Chapter 8 Fiber laser pumped optical parametric amplifier.The power scalability of fiber lasers make them ideal pump sources for highaverage power optical parametric amplifiers. Building on the idea from Chapter3, a super continuum generated in a PCF is amplified in a nonlinear crystalpumped by the frequency doubled output from a fiber amplifier. The chapteris based on publication V and iv.
Chapter 9 Summary and acknowledgements.

6 Introduction
Chapter 2
Nonlinear optics and optical fibers
A brief introduction to nonlinear optics and the fundamentals of fiber optics.The governing equations for pulse propagation in optical fibers are describedand micro-structured fibers are introduced.
7
8 Nonlinear optics and optical fibers
2.1 Nonlinear optics
The field of nonlinear optics is complex and encompasses myriads of interestingeffects and practical applications. In spite of its richness, most of the effectscan be described accurately with just a few equations. This introduction tononlinear optics is therefore limited to a simple analysis of Maxwell’s equationswhich govern the propagation of light.In dielectric media and in absence of free charges or currents the equations aregiven by
∇ ·D(r, t) = 0 (2.1)∇ · B(r, t) = 0 (2.2)
∇× E(r, t) = −∂B(r, t)∂t
(2.3)
∇× H(r, t) =∂D(r, t)
∂t(2.4)
where D is the electric displacement and B, E are the magnetic and electricfields respectively. H and D are related to the magnetic and electric fieldsaccording to
B(r, t) = µ0H(r, t) D(r, t) = ε0E(r, t) + P(r, t) (2.5)
where P is the polarization and µ0,ε0 are the permeability and permittivity offree space respectively. Equations 2.1-2.5 can be decoupled and, by assuming∇ ·E = 0, the following expression is obtained
−∇2E(r, t) +1c2
∂2E(r, t)∂2t
= −µ0∂2P(r, t)
∂t2(2.6)
where c is the speed of light in vacuum. The polarization is given by
P(r, t) = ε0χE(r, t) (2.7)
where χ is the optical susceptibility. χ can be calculated by an iterative pro-cedure employing first order perturbation methods [10] and the polarization istherefore conveniently expressed as a sum of a linear term and nonlinear terms
P = Pl + Pnl = ε0χ(1) ·E + ε0
∑j>2
χ(j)E(j) (2.8)
Introducing the linear refractive index n2(ω) = ε(ω) = 1 + χ(1), eq. 2.6 can bewritten as
−∇2E(r, t) +n(ω)2
c2
∂2E(r, t)∂2t
= −µ0∂2Pnl(r, t)
∂t2(2.9)
2.1 Nonlinear optics 9
where ε(ω) is the dielectric function. This expression shows that the nonlinearpolarization acts as a source term for a driven wave equation. In absence of Pnl
the radiation simply propagates as a free wave with speed v = c/n.Most nonlinear effects are well described with this equation and can be
related to a given χ(j)-tensor. For example, the real part of χ(2) is responsiblefor second harmonic generation (SHG) and the real part of χ(3) enables thirdharmonic generation, self-phase-modulation (SPM), self-focusing and four-wave-mixing. The imaginary part of χ(3) is responsible for two-photon absorption,Raman-gain and more. Still higher order processes are weak and can usually beneglected. In optical fibers all even orders of χ vanish due to inversion symmetryin the amorphous SiO2 [10] and the only significant nonlinear contribution istherefore from χ(3). The nonlinear polarization is then reduced to
Pnl(r, t) = ε0
∫ ∫ ∫ ∞
−∞χ(3)(t, t1, t2, t3)E(r, t1)E(r, t2)E(r, t3)dt1dt2dt3
(2.10)
where χ(3)(t, t1, t2, t3) is approximated by χ(3)(t, t1, t2, t3) = χ(3)R(t − t1)δ(t −t2)δ(t − t3) [11]. The interaction between light and the vibrational modes ofsilica are included through the following functional form of R(t)
R(t) = (1 − fR)δ(t) + fRhR(t) (2.11)
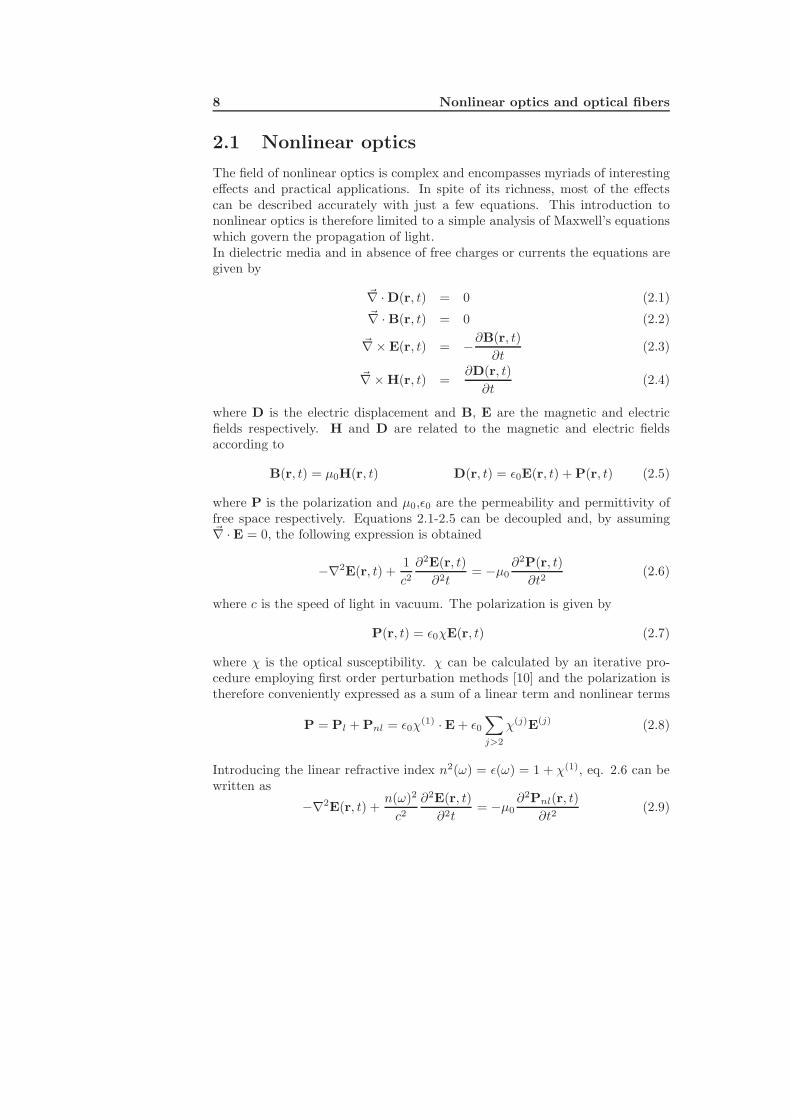
fR is the fractional part of the response dominated by Raman scattering andhR is the Raman response function which can be estimated through analysisof the Raman gain curve[11–13]. Figure 2.1 illustrates Raman scattering whereenergy is lost due to vibrational excitation of the material. In absence of Raman
p
s
0
1
Figure 2.1: The excitation energy between the vibrational states |0 > and |1 >in silica is lost to the material in Raman scattering.
scattering, the nonlinear response is dominated by the fast motion of electronsand the polarization can be modelled by replacing hR(t) with a delta function[12].
In the following section, basic properties of optical fibers will be investi-gated. The equations governing the mode structure and pulse propagation willbe developed and the electronic nonlinear response (Kerr nonlinearity) will beincluded to obtain the nonlinear Schrodinger equation.
10 Nonlinear optics and optical fibers
2.2 Basic properties of optical fibers
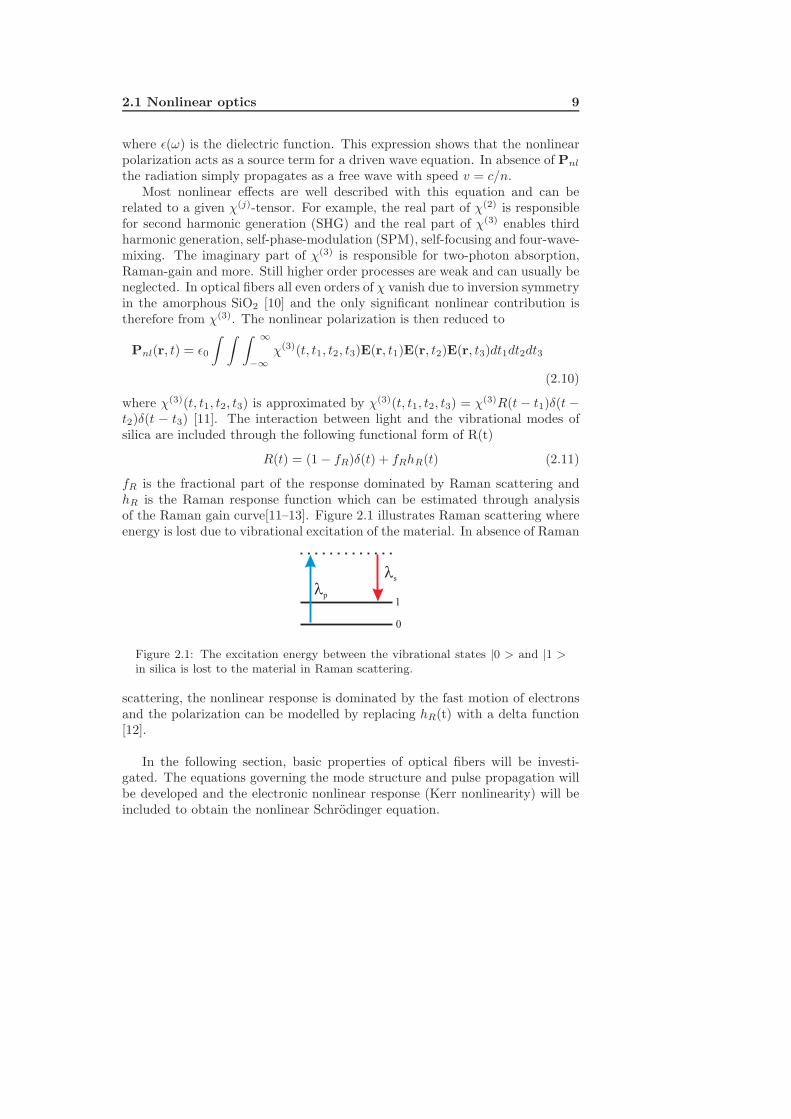
Conventional optical fibers guide light by total internal reflection. A core withhigh index of refraction is surrounded by a cladding with lower index of refrac-tion and the index-difference determines how tightly the light is confined in thecore. Various index-profiles have been made in order to enhance the guidingproperties [14], but the most commonly used type is the simple step index fiber.Figure 2.2 shows typical dimensions of such a fiber. A small silica core with adiameter of 5-12 µm with index n1 is surrounded by a cladding layer of roughly125 µm in diameter with index n2. An additional layer of a polymer is added toenhance the strength of the fiber and leaves the fiber with an outer diameter of250 µm. The fiber’s numerical aperture, NA =
√ncore − nclad directly relates
125 µm 250 µm5-12 µm
n
n1
n2
125 µm 250 µm5-12 µm
n
n1
n2
c
1
Figure 2.2: Left: Schematic view of a step-index fiber. The size of the coredepends on the purpose of the fiber, but single-mode fibers in the near-infraredtypically have core diameters of 5-12 µm. Right: At incident angles below thecritical angle given by θc = sin−1(NA) the rays are captured by the fiber, whilebigger angles allow the light to escape through the cladding.
the index-difference to the maximally allowed angle between the fiber axis andthe wave-vectors of the incident light: NA = sin(θc) (see right panel of figure2.2). The choice of coupling optics therefore depends on the size of the fibercore as well as on the fibers ability to capture the light.
In single-mode fibers the typical index difference between core and claddingis of the order of 0.2-1% so NA-values are not exceeding 0.25 (θc < 15). Hardfocussing is therefore not possible and high brightness sources are generallyneeded to get significant coupling into a guided mode. Increasing the NA makesit easier to couple light into the fiber and also reduces bend losses since thecondition for total internal reflection is relaxed. The price is however thatthe fiber may support several spatial modes, which greatly diminish the beamquality after the fiber. In most applications, it is desired, if not mandatory, to
2.2 Basic properties of optical fibers 11
have only one spatial mode.To get a better understanding of the important quantities in fiber optics, it isbeneficial to return to eq. 2.9. Neglecting the nonlinear terms, the equation isconveniently solved in Fourier-space by replacing the operator ∂2
∂t2 with −ω2
∇2E(r, ω) =ω2
c2n2(ω)E(r, ω) (2.12)
A superposition of plane waves is a solution to this equation and since thelight must also be confined in the transverse dimension of the fiber, a linearlypolarized solution must be of the form
E(r, ω − ω0) = xF (x, y) · A(z, ω − ω0) · e−i(β0z−ω0t) (2.13)
where F is the transverse field distribution, A is a slowly varying envelope,ω0 is a fast carrier frequency and β0 is the wave-number corresponding to thecentral frequency. A is normalized such that |A|2 represents the optical power.The product of the independent transverse and longitudinal parts leads to twoconditional equations [12, 15]
(∂2
∂x2+
∂2
∂y2)F (x, y) + n2(ω)
ω2
c2F (x, y) = β2F (x, y) (2.14)
2iβ0∂
∂zA(z, ω) + 2β0(β − β0)A(z, ω) = 0 (2.15)
where the second derivative of the slowly varying envelope A(z,ω−ω0) has beenneglected and the approximation (β2 − β2
0) ∼ 2β0(β − β0) has been used in de-riving eq. 2.15. Both measures are justified as long as ∆ω << ω. Equation 2.14is known as the scalar Helmholtz equation and it leads to the conditions for theguided modes and their field distribution F(x,y) in the fiber. Propagation alongthe fiber is governed by equation 2.15 which will finally result in a nonlinearSchrodinger equation.
The scalar Helmholtz equation (eq. 2.14) is an eigenvalue problem whereβ is an eigenvalue of the transverse field distribution F(x,y). In absence ofnonlinear polarization, the solutions for F(x,y) are superpositions of Bessel andNeumann functions and it can be shown that there are only confined modes whenk2n2
1 > β2 > k2n22 [16]. There may be several values of β fulfilling this condition
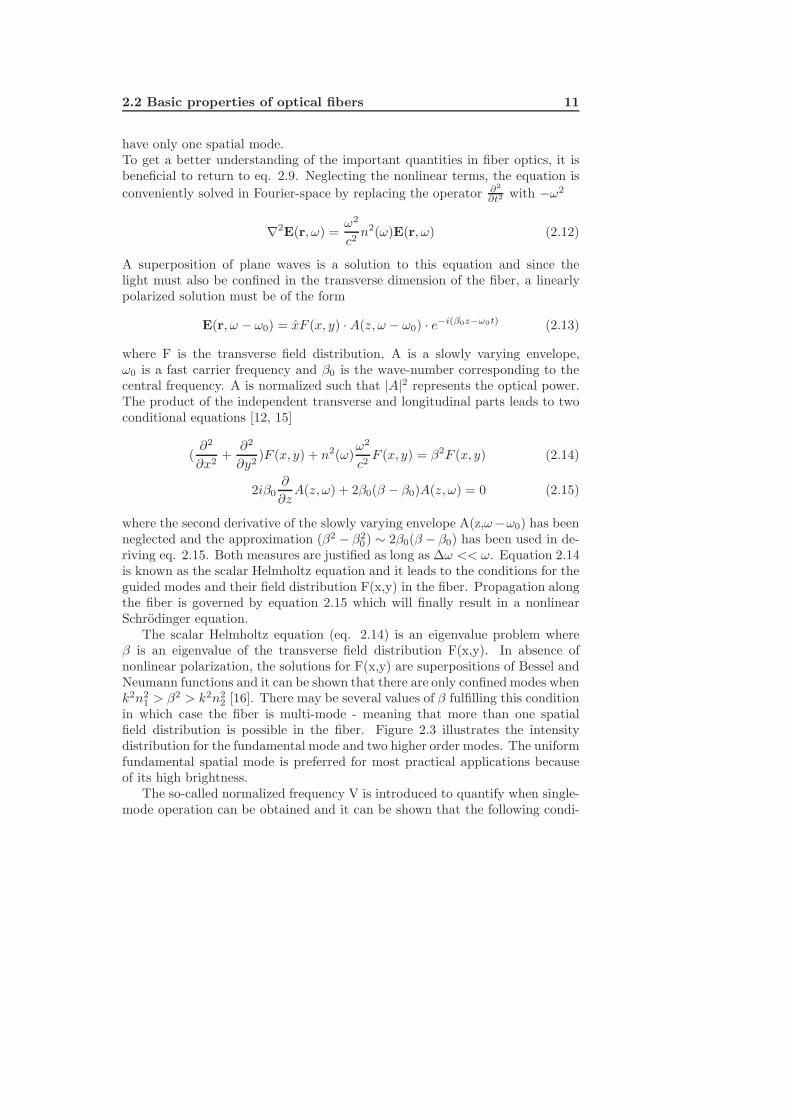
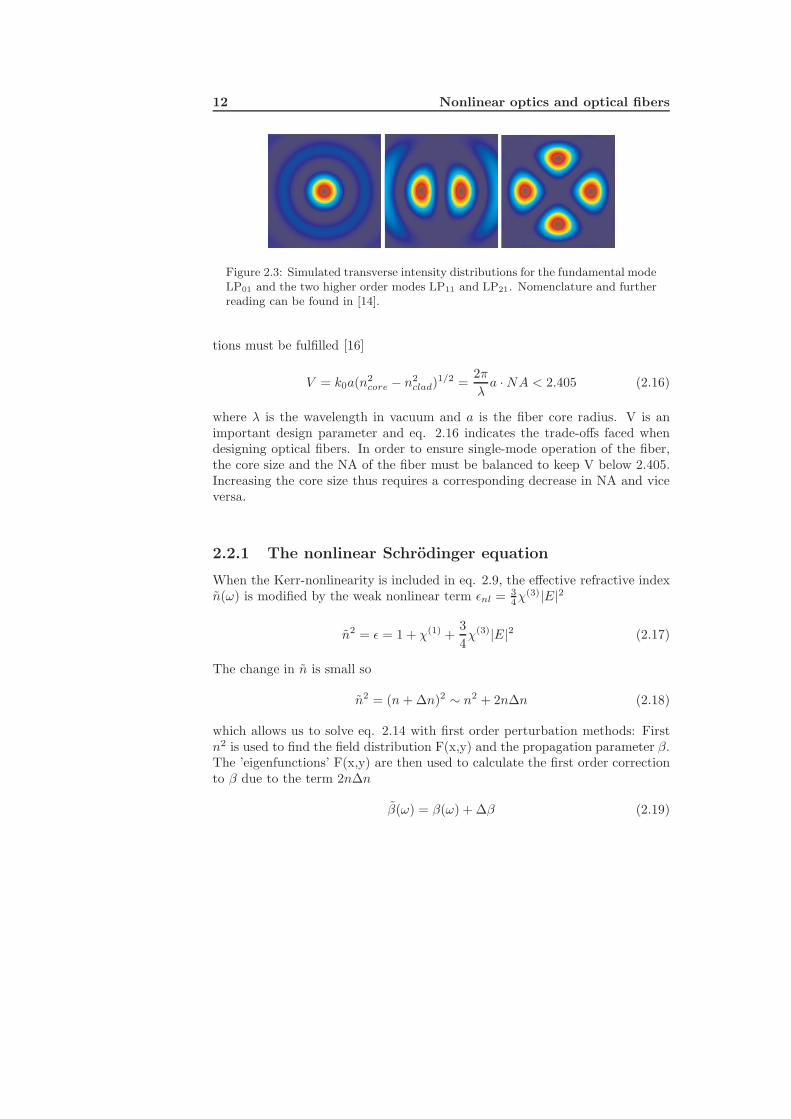
in which case the fiber is multi-mode - meaning that more than one spatialfield distribution is possible in the fiber. Figure 2.3 illustrates the intensitydistribution for the fundamental mode and two higher order modes. The uniformfundamental spatial mode is preferred for most practical applications becauseof its high brightness.
The so-called normalized frequency V is introduced to quantify when single-mode operation can be obtained and it can be shown that the following condi-
12 Nonlinear optics and optical fibers
Figure 2.3: Simulated transverse intensity distributions for the fundamental modeLP01 and the two higher order modes LP11 and LP21. Nomenclature and furtherreading can be found in [14].
tions must be fulfilled [16]
V = k0a(n2core − n2
clad)1/2 =
2π
λa · NA < 2.405 (2.16)
where λ is the wavelength in vacuum and a is the fiber core radius. V is animportant design parameter and eq. 2.16 indicates the trade-offs faced whendesigning optical fibers. In order to ensure single-mode operation of the fiber,the core size and the NA of the fiber must be balanced to keep V below 2.405.Increasing the core size thus requires a corresponding decrease in NA and viceversa.
2.2.1 The nonlinear Schrodinger equation
When the Kerr-nonlinearity is included in eq. 2.9, the effective refractive indexn(ω) is modified by the weak nonlinear term εnl = 3
4χ(3)|E|2
n2 = ε = 1 + χ(1) +34χ(3)|E|2 (2.17)
The change in n is small so
n2 = (n + ∆n)2 ∼ n2 + 2n∆n (2.18)
which allows us to solve eq. 2.14 with first order perturbation methods: Firstn2 is used to find the field distribution F(x,y) and the propagation parameter β.The ’eigenfunctions’ F(x,y) are then used to calculate the first order correctionto β due to the term 2n∆n
β(ω) = β(ω) + ∆β (2.19)
2.2 Basic properties of optical fibers 13
The unperturbed linear propagation constant is approximated by a Taylor-expansion around the carrier frequency, ω0
β(ω) = β0 + β1(ω − ω0) +12β2(ω − ω0)2 +
16β3(ω − ω0)3 + ... (2.20)
where βi = ∂iβ∂ωi |ω0 .
This expression is inserted in eq. 2.15 and a Fourier transformation backto the time domain gives the following equation for the time-dependent slowlyvarying envelope
∂A
∂z+
∑n=1
βnin−1
n!∂n
∂tnA = i∆βA (2.21)
For a given field distribution, ∆β is given by:
∆β =ω0
∫ ∫ ∞−∞ ∆n|F (x, y)|2dxdy
c∫ ∫ ∞
−∞ |F (x, y)|2dxdy(2.22)
with
∆n =38n
Re[χ(3)]|E|2 + i(12n
Im[χ(1)] +38n
Im[χ(3)]|E|2 ) (2.23)
Neglecting the imaginary parts of χ(j) (absorption) eq. 2.22 simplifies consid-erably:
∆β =n2ω0
cAeff|A|2 = γ|A|2 (2.24)
where n2 is the nonlinear refractive index which in silica is ∼ 3 ·10−20(W ·m)−1
and Aeff is the effective mode area. The final result thus becomes
∂A
∂z+
∑n=1
βnin−1
n!∂n
∂tnA = iγ|A|2A (2.25)
where γ is termed the nonlinear parameter. Equation 2.25 describes the basiceffects during propagation of an optical pulse in single-mode fibers and is referredto as the nonlinear Schrodinger equation.
2.2.2 Dispersion
When electromagnetic radiation is incident on a material, the constituting atomsare polarized and the resulting macroscopic polarization radiates at the samefrequency as the incoming light, but with a frequency dependent delay [17].Different frequencies therefore propagate with different speeds in the material
14 Nonlinear optics and optical fibers
which causes a spreading, or dispersion, in time. There are several causes oftemporal dispersion in optical systems. Presence of atomic resonances causecontinuous absorption and emission of matched frequencies which are therebydelayed. Multi-mode beams may be dispersed in time if the various modes ex-perience different indexes of refraction due to their spatial extension. This isimportant in multi-mode optical fibers where higher order modes extend farinto the cladding of the fiber and thereby see a lower index of refraction (seefigure 2.3). Finally there is waveguide dispersion which is only important insingle mode fibers. It arises because the mode is not completely confined to thecore of the fiber. Depending on the size of the core and the index differencebetween core and cladding, a part of the mode will leak into the cladding andthus experience a lower index. Waveguide dispersion can be tailored by varyingthe mentioned parameters and it is possible to shift the zero dispersion wave-length (ZDW) of the fiber considerably. This has been done successfully withtelecommunication fibers where it is advantageous to have zero dispersion inthe low-loss window around 1550 nm [18] and with PCFs where ZDWs can berealized deep into the visible [19].
All types of dispersion, are included in the expansion of β(ω) in eq. 2.20. Thefirst terms are related to the group velocity (β1), group velocity dispersion (β2),third order dispersion (β3) and so forth. It is useful to change to a coordinatesystem moving with the group velocity (retarded frame) with the followingtransformation T = t − z/vgroup = t − β1z. Equation 2.21 is then reducedto
∂A
∂z+
∑n=2
βnin−1
n!∂n
∂T nA = iγ|A|2A (2.26)
The effect of group velocity dispersion (GVD) can be illustrated by neglectinghigher order dispersion terms and nonlinearities (γ = 0). Fourier transformingeq. 2.26 then yields
∂A(z, ω)∂z
− i
2β2ω
2A(z, ω) = 0 (2.27)
which is solved by
A(z, ω) = A(0, ω)exp(i
2β2ω
2z) (2.28)
The solution shows that the pulse spectrum is not changed by GVD, but a fre-quency dependent phase is introduced. Transforming back to the time-domainresults in the following expression for the time dependent pulse envelope
A(z, T ) =12π
∫ ∞
−∞A(0, ω)exp(
i
2β2ω
2z − iωT )dω (2.29)
For a gaussian input pulse A(0, T ) = exp(−Γ0T2) · exp(iω0T ) the integral is
2.2 Basic properties of optical fibers 15
easily solved to give
A(z, T ) = exp(i[φ0 + ω0T +2Γ2
0β2zT 2
1 + (2Γ0β2z)2]) · exp(− Γ0 T 2
1 + (2Γ0β2z)2) (2.30)
which reveals that the pulse acquires a time dependent phase and is temporallybroadened. The phase is quadratic in time which means that the instantaneouscarrier frequency ω(T ) = ∂φ
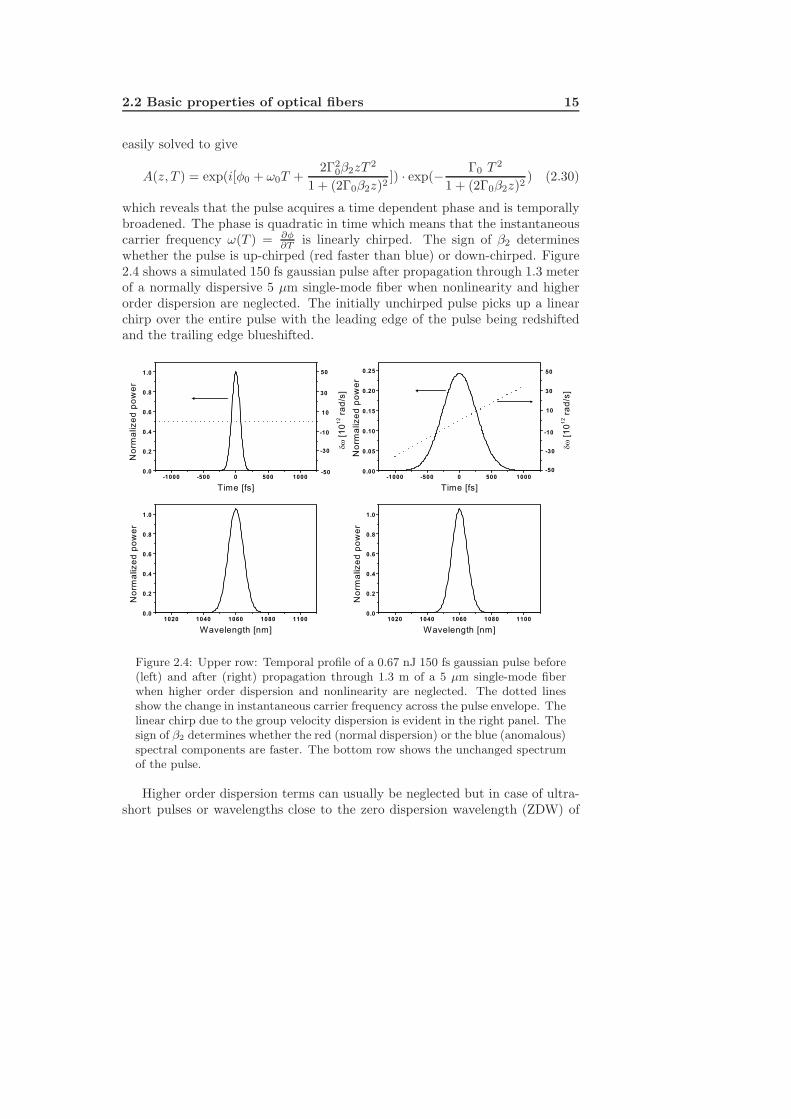
∂T is linearly chirped. The sign of β2 determineswhether the pulse is up-chirped (red faster than blue) or down-chirped. Figure2.4 shows a simulated 150 fs gaussian pulse after propagation through 1.3 meterof a normally dispersive 5 µm single-mode fiber when nonlinearity and higherorder dispersion are neglected. The initially unchirped pulse picks up a linearchirp over the entire pulse with the leading edge of the pulse being redshiftedand the trailing edge blueshifted.
Figure 2.4: Upper row: Temporal profile of a 0.67 nJ 150 fs gaussian pulse before(left) and after (right) propagation through 1.3 m of a 5 µm single-mode fiberwhen higher order dispersion and nonlinearity are neglected. The dotted linesshow the change in instantaneous carrier frequency across the pulse envelope. Thelinear chirp due to the group velocity dispersion is evident in the right panel. Thesign of β2 determines whether the red (normal dispersion) or the blue (anomalous)spectral components are faster. The bottom row shows the unchanged spectrumof the pulse.
Higher order dispersion terms can usually be neglected but in case of ultra-short pulses or wavelengths close to the zero dispersion wavelength (ZDW) of
16 Nonlinear optics and optical fibers
the fiber, third and even fourth order dispersion may have to be included in eq.2.26. Like β2, the higher order terms do not change the spectrum of the pulsebut significantly alter the temporal shape [12].
From a practical point of view, second order dispersion is not a problem sincea linear chirp is conveniently removed by simple prism or grating sequences [20].In contrast, higher order dispersion is not easily compensated and therefore leadsto decreased pulse quality.
2.2.3 Self phase modulation
The effect of the nonlinear term in eq. 2.26 is best illustrated by neglectingdispersion. The equation then reduces to
∂A
∂z= iγ|A|2A (2.31)
which is solved by
A(z, T ) = A(0, T ) exp(iγ|A(z, T )|2 z) (2.32)
Equation 2.32 shows that the nonlinearity does not change the pulse shape butmerely imposes a nonlinear phase which depends on the temporal profile of thepulse itself - hence the effect is named self phase modulation (SPM).
Figure 2.5 shows a simulated 0.67 nJ 150 fs gaussian pulse after propagationthrough 30 cm of a 5 µm single-mode fiber when dispersion is neglected. Thechirp is seen to be linear at the center and nonlinear at the wings of the pulse.The central chirp is similar to the chirp caused by positive GVD (see figure 2.4)with red frequency components being shifted to the leading edge of the pulseand blue components to the trailing edge.
The joint action of positive GVD and SPM is therefore to rapidly chirpand broaden the pulse. However, negative GVD can in some cases balance thelinear part of the SPM chirp and the pulse can propagates without changingits form in time and frequency. This type of solution is called a fundamentalsoliton [12]. Physically, the negative GVD shifts the blue spectral componentsto the leading edge of the pulse where they get redshifted back again by SPM.Fundamental solitons can propagate through thousands of kilometers of fiberwithout degrading and have been used successfully for data transmission intelecommunication lines [21].
If the dispersion is not exactly balanced by SPM, the pulse will ”breathe”in the sense that it broadens and contracts periodically in time and frequencyas it propagates along the fiber. This type of solution is called a higher ordersoliton and fission of such solitons is fundamental for the understanding of supercontinuum generation in optical fibers.

2.3 Rare Earth doped fibers 17
Figure 2.5: The upper row show the temporal profile of a 0.67 nJ 150 fs gaussianpulse before (left) and after (right) propagation through 0.3 m 5 µm single-modefiber when dispersion is neglected. The central part of the pulse gets linearlychirped while the wings of the pulse pick up higher order phase. The bottom rowshows the spectral evolution and the creation of new frequencies is clearly seen.
Full modelling of propagation of ultrashort pulses in optical fibers requiresinclusion of higher order nonlinear effects. Especially Raman scattering provesto be important, but also cross-phase modulation, self-steepening and fourwave mixing have to be included. The derivation of the extended nonlinearSchrodinger equation follows the derivation presented in section 2.2.1 but allelements of χ(3) must be included. As the mathematics get extensive the resultwill merely be introduced without proof when super continuum generation inPCFs is discussed in section 2.5.
2.3 Rare Earth doped fibers
Rare Earth (RE) doped glass has been investigated and used as a laser media formore than four decades. Since the eighties, RE doped fibers have been availableand fiber lasers and amplifiers have been an active field of research ever since.When RE elements are dissolved in a glass host, they become triply ionized byremoval of the two outer 6s electrons and an inner 4f electron [22]. The opticalproperties of the dopants are then determined by the partially filled 4f orbital
18 Nonlinear optics and optical fibers
and since the outer 5p and 5s electrons effectively shield the 4f electrons fromthe field of the host material, the laser characteristics, such as wavelength andgain bandwidth, are almost independent of the host. Today, optical fibers canbe doped with a variety of REs with Erbium, Ytterbium (Yb), Neodynium andThulium being the most used. In this thesis, only Yb-doped fibers have beenemployed.
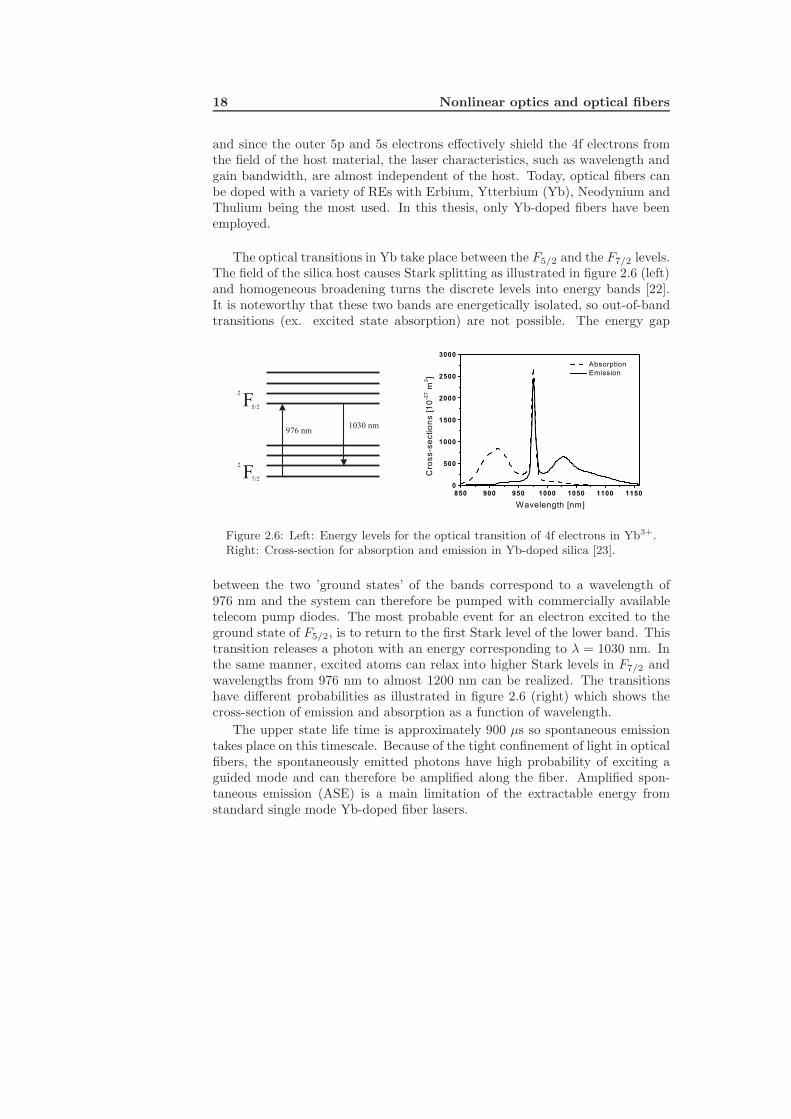
The optical transitions in Yb take place between the F5/2 and the F7/2 levels.The field of the silica host causes Stark splitting as illustrated in figure 2.6 (left)and homogeneous broadening turns the discrete levels into energy bands [22].It is noteworthy that these two bands are energetically isolated, so out-of-bandtransitions (ex. excited state absorption) are not possible. The energy gap
1030 nm976 nm
F7/2
2
F5/2
2
Figure 2.6: Left: Energy levels for the optical transition of 4f electrons in Yb3+.Right: Cross-section for absorption and emission in Yb-doped silica [23].
between the two ’ground states’ of the bands correspond to a wavelength of976 nm and the system can therefore be pumped with commercially availabletelecom pump diodes. The most probable event for an electron excited to theground state of F5/2, is to return to the first Stark level of the lower band. Thistransition releases a photon with an energy corresponding to λ = 1030 nm. Inthe same manner, excited atoms can relax into higher Stark levels in F7/2 andwavelengths from 976 nm to almost 1200 nm can be realized. The transitionshave different probabilities as illustrated in figure 2.6 (right) which shows thecross-section of emission and absorption as a function of wavelength.
The upper state life time is approximately 900 µs so spontaneous emissiontakes place on this timescale. Because of the tight confinement of light in opticalfibers, the spontaneously emitted photons have high probability of exciting aguided mode and can therefore be amplified along the fiber. Amplified spon-taneous emission (ASE) is a main limitation of the extractable energy fromstandard single mode Yb-doped fiber lasers.
2.4 Photonic crystal fibers 19
2.4 Photonic crystal fibers
In the beginning of the 1990’s, the field of fiber optics was dominated by telecom-munication applications. The physics behind light propagation in fibers wasfully understood and, apart from being media for data transmission, fibers werealso used as nonlinear frequency converters, sensors and even lasers. The in-vention of Erbium-doped fiber amplifiers really pushed the development of fiberbased communication lines and an impressive development of fiber based opticalcomponents took place. On a more fundamental physical level, there was how-ever not much development. This changed dramatically in 1996 when Russelsuggested and demonstrated a revolutionary new type of optical fiber [24]. In-stead of guiding light by total internal reflection, these fibers relied on a bandgapeffect similar to what is known from semiconductors. Russel suggested to makedefects in the silica matrix to prevent light at a given wavelength from propa-gating in the transverse direction and thereby confine it to the core of the fiber[19]. The mathematical description of the photonic bandgap is not straightfor-
Silica
Air Aird
k
k||
kt d = n
Silica Silica
Silica
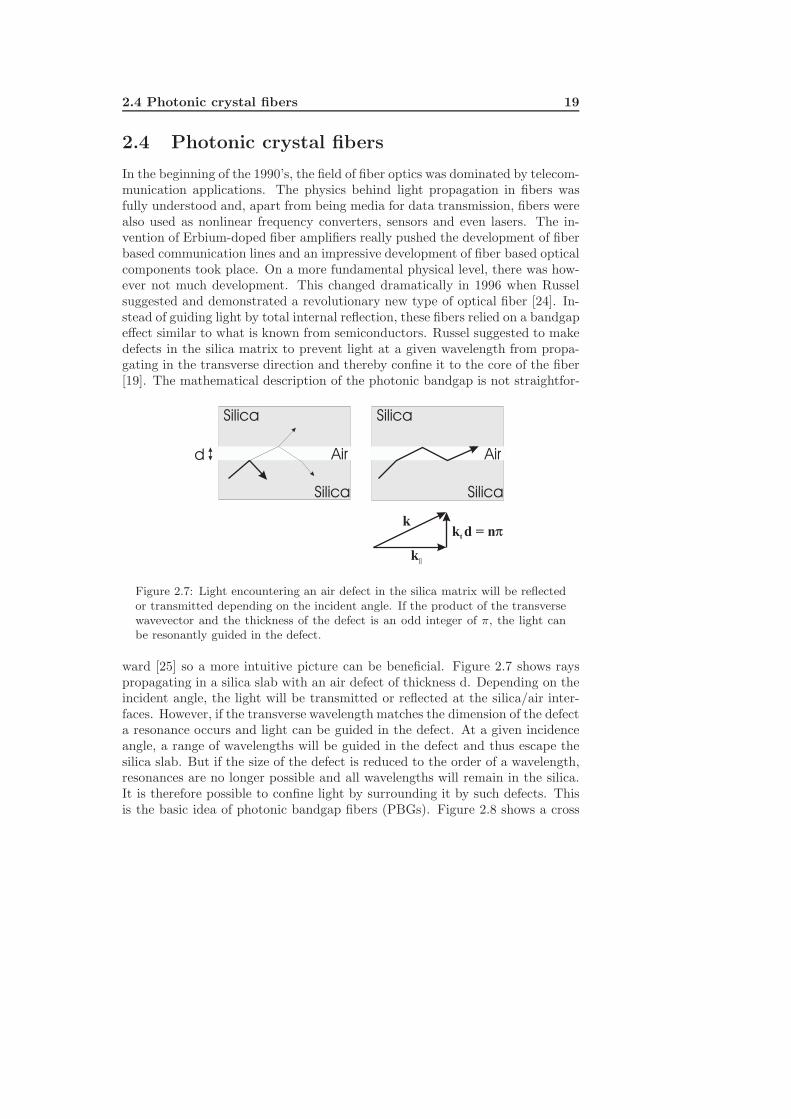
Figure 2.7: Light encountering an air defect in the silica matrix will be reflectedor transmitted depending on the incident angle. If the product of the transversewavevector and the thickness of the defect is an odd integer of π, the light canbe resonantly guided in the defect.
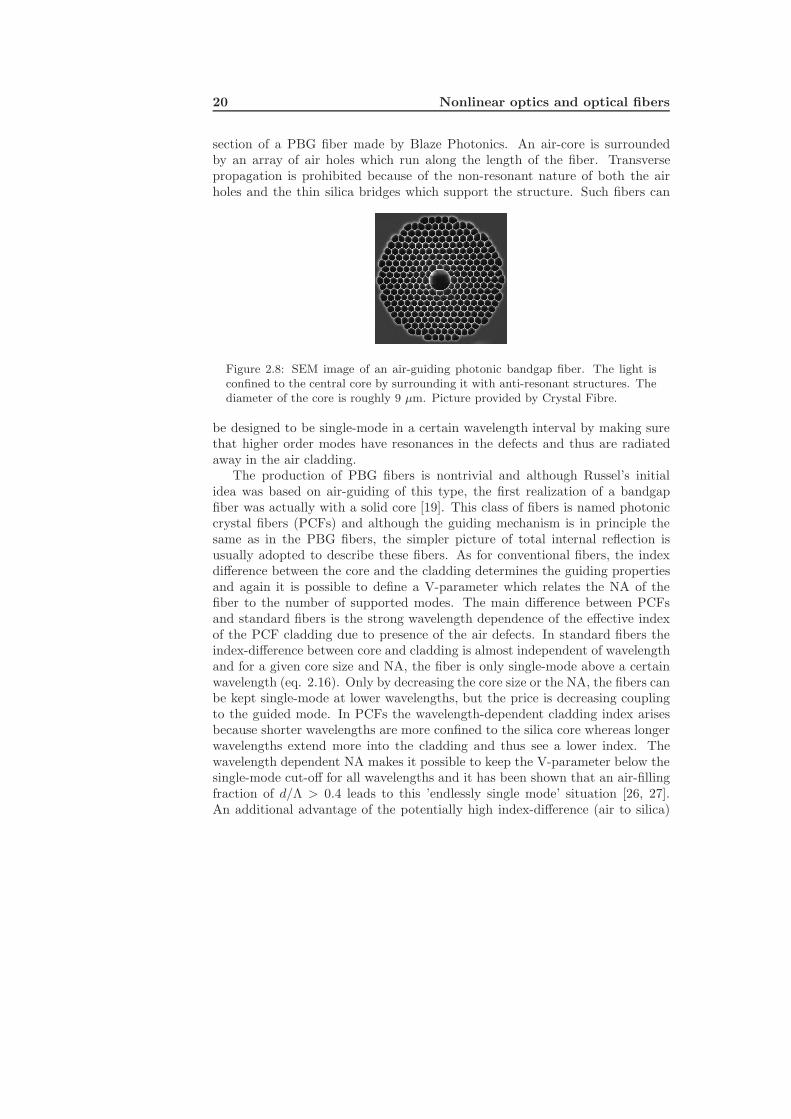
ward [25] so a more intuitive picture can be beneficial. Figure 2.7 shows rayspropagating in a silica slab with an air defect of thickness d. Depending on theincident angle, the light will be transmitted or reflected at the silica/air inter-faces. However, if the transverse wavelength matches the dimension of the defecta resonance occurs and light can be guided in the defect. At a given incidenceangle, a range of wavelengths will be guided in the defect and thus escape thesilica slab. But if the size of the defect is reduced to the order of a wavelength,resonances are no longer possible and all wavelengths will remain in the silica.It is therefore possible to confine light by surrounding it by such defects. Thisis the basic idea of photonic bandgap fibers (PBGs). Figure 2.8 shows a cross
20 Nonlinear optics and optical fibers
section of a PBG fiber made by Blaze Photonics. An air-core is surroundedby an array of air holes which run along the length of the fiber. Transversepropagation is prohibited because of the non-resonant nature of both the airholes and the thin silica bridges which support the structure. Such fibers can
Figure 2.8: SEM image of an air-guiding photonic bandgap fiber. The light isconfined to the central core by surrounding it with anti-resonant structures. Thediameter of the core is roughly 9 µm. Picture provided by Crystal Fibre.
be designed to be single-mode in a certain wavelength interval by making surethat higher order modes have resonances in the defects and thus are radiatedaway in the air cladding.
The production of PBG fibers is nontrivial and although Russel’s initialidea was based on air-guiding of this type, the first realization of a bandgapfiber was actually with a solid core [19]. This class of fibers is named photoniccrystal fibers (PCFs) and although the guiding mechanism is in principle thesame as in the PBG fibers, the simpler picture of total internal reflection isusually adopted to describe these fibers. As for conventional fibers, the indexdifference between the core and the cladding determines the guiding propertiesand again it is possible to define a V-parameter which relates the NA of thefiber to the number of supported modes. The main difference between PCFsand standard fibers is the strong wavelength dependence of the effective indexof the PCF cladding due to presence of the air defects. In standard fibers theindex-difference between core and cladding is almost independent of wavelengthand for a given core size and NA, the fiber is only single-mode above a certainwavelength (eq. 2.16). Only by decreasing the core size or the NA, the fibers canbe kept single-mode at lower wavelengths, but the price is decreasing couplingto the guided mode. In PCFs the wavelength-dependent cladding index arisesbecause shorter wavelengths are more confined to the silica core whereas longerwavelengths extend more into the cladding and thus see a lower index. Thewavelength dependent NA makes it possible to keep the V-parameter below thesingle-mode cut-off for all wavelengths and it has been shown that an air-fillingfraction of d/Λ > 0.4 leads to this ’endlessly single mode’ situation [26, 27].An additional advantage of the potentially high index-difference (air to silica)
2.4 Photonic crystal fibers 21
between core and cladding is the possibility of making NA values as high as 0.6which enables efficient coupling to even very small cores.
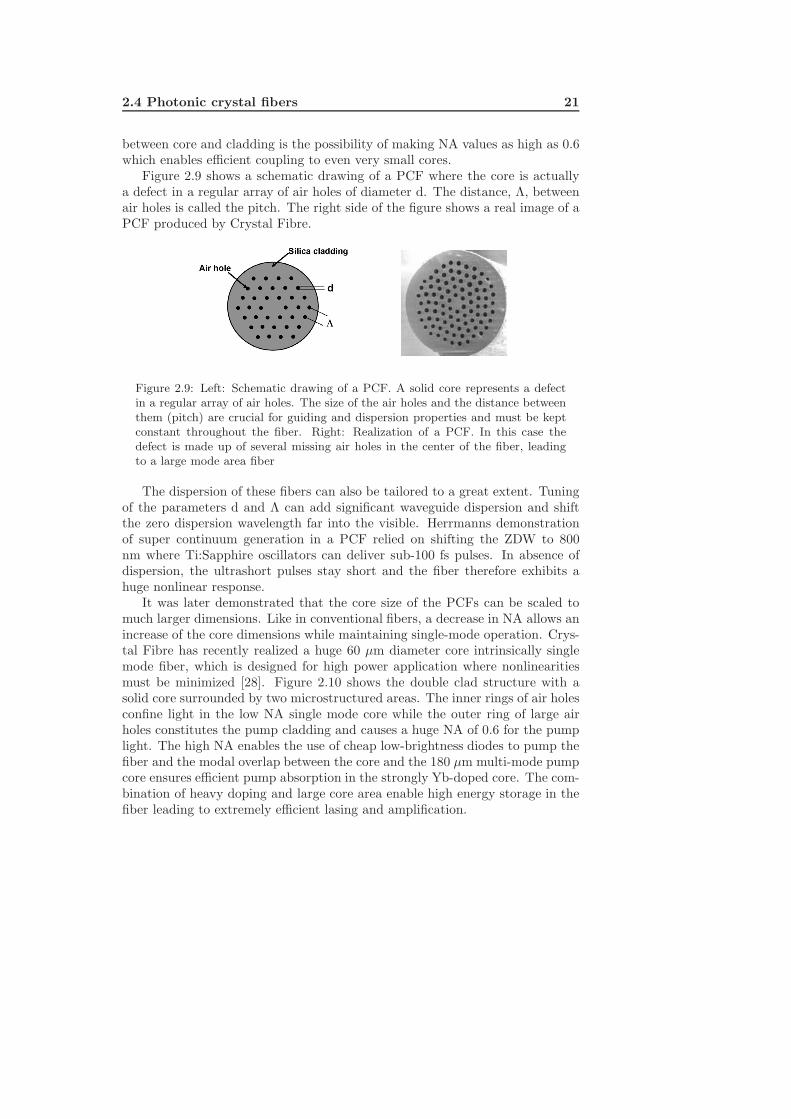
Figure 2.9 shows a schematic drawing of a PCF where the core is actuallya defect in a regular array of air holes of diameter d. The distance, Λ, betweenair holes is called the pitch. The right side of the figure shows a real image of aPCF produced by Crystal Fibre.
Figure 2.9: Left: Schematic drawing of a PCF. A solid core represents a defectin a regular array of air holes. The size of the air holes and the distance betweenthem (pitch) are crucial for guiding and dispersion properties and must be keptconstant throughout the fiber. Right: Realization of a PCF. In this case thedefect is made up of several missing air holes in the center of the fiber, leadingto a large mode area fiber
The dispersion of these fibers can also be tailored to a great extent. Tuningof the parameters d and Λ can add significant waveguide dispersion and shiftthe zero dispersion wavelength far into the visible. Herrmanns demonstrationof super continuum generation in a PCF relied on shifting the ZDW to 800nm where Ti:Sapphire oscillators can deliver sub-100 fs pulses. In absence ofdispersion, the ultrashort pulses stay short and the fiber therefore exhibits ahuge nonlinear response.
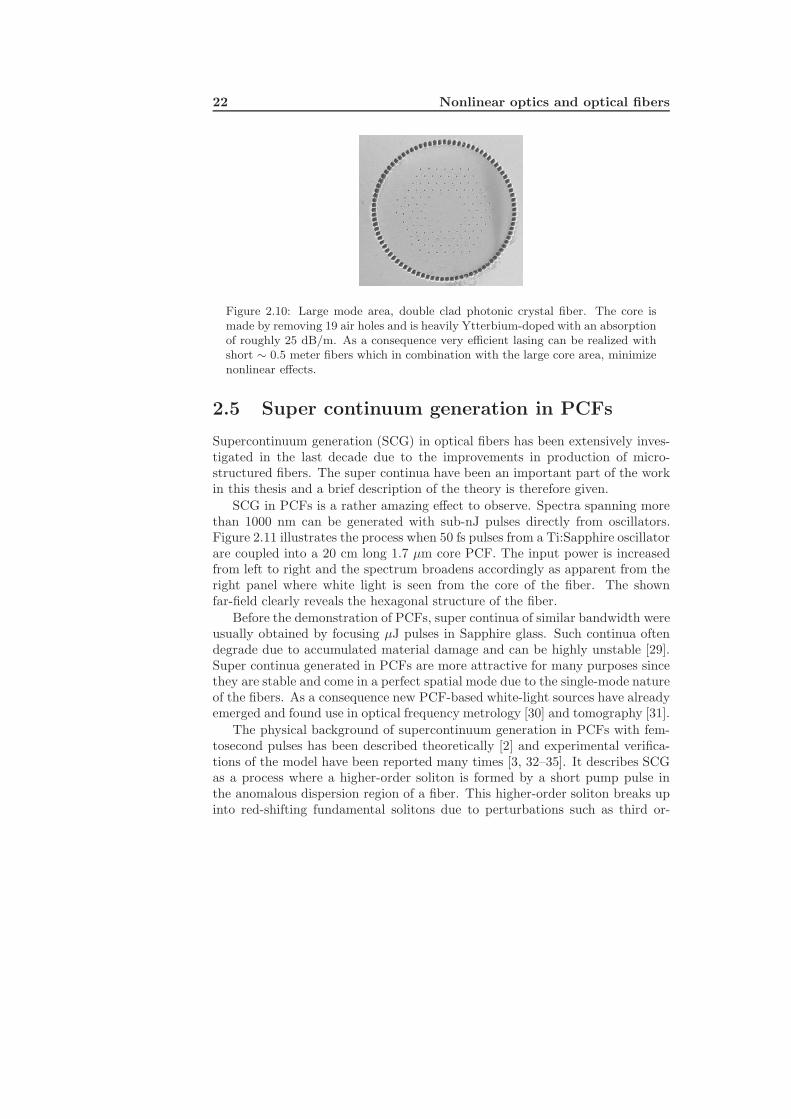
It was later demonstrated that the core size of the PCFs can be scaled tomuch larger dimensions. Like in conventional fibers, a decrease in NA allows anincrease of the core dimensions while maintaining single-mode operation. Crys-tal Fibre has recently realized a huge 60 µm diameter core intrinsically singlemode fiber, which is designed for high power application where nonlinearitiesmust be minimized [28]. Figure 2.10 shows the double clad structure with asolid core surrounded by two microstructured areas. The inner rings of air holesconfine light in the low NA single mode core while the outer ring of large airholes constitutes the pump cladding and causes a huge NA of 0.6 for the pumplight. The high NA enables the use of cheap low-brightness diodes to pump thefiber and the modal overlap between the core and the 180 µm multi-mode pumpcore ensures efficient pump absorption in the strongly Yb-doped core. The com-bination of heavy doping and large core area enable high energy storage in thefiber leading to extremely efficient lasing and amplification.
22 Nonlinear optics and optical fibers
Figure 2.10: Large mode area, double clad photonic crystal fiber. The core ismade by removing 19 air holes and is heavily Ytterbium-doped with an absorptionof roughly 25 dB/m. As a consequence very efficient lasing can be realized withshort ∼ 0.5 meter fibers which in combination with the large core area, minimizenonlinear effects.
2.5 Super continuum generation in PCFs
Supercontinuum generation (SCG) in optical fibers has been extensively inves-tigated in the last decade due to the improvements in production of micro-structured fibers. The super continua have been an important part of the workin this thesis and a brief description of the theory is therefore given.
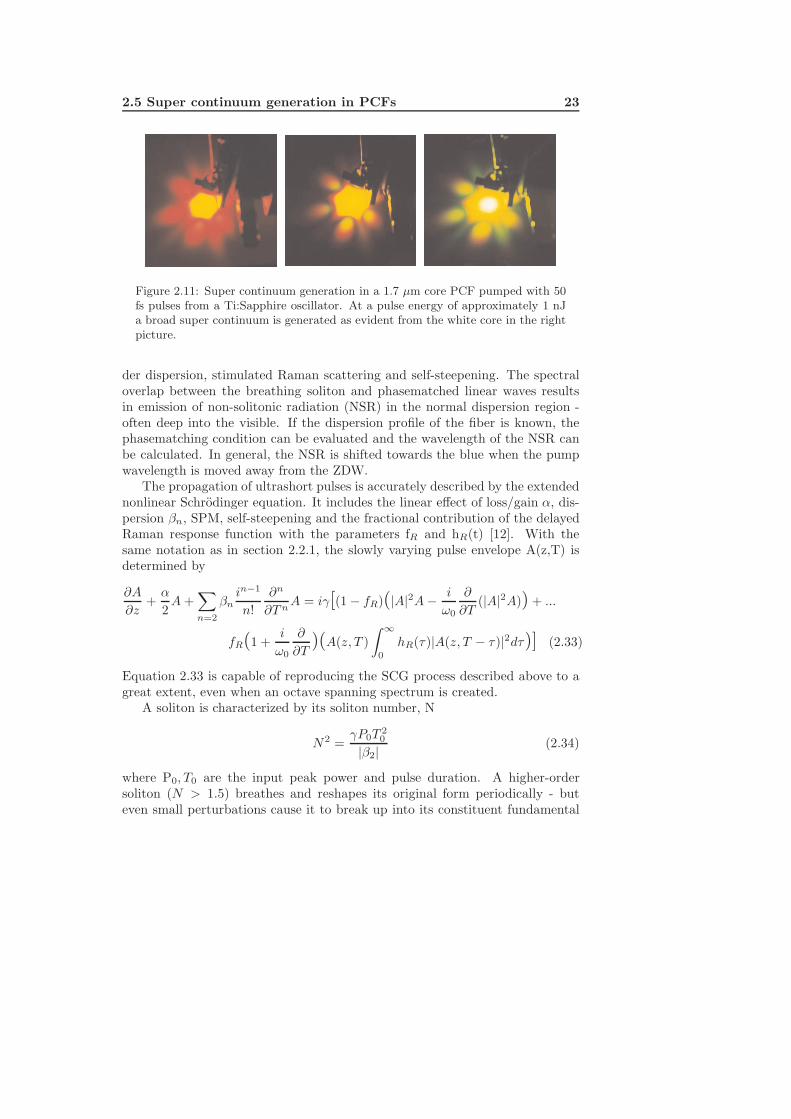
SCG in PCFs is a rather amazing effect to observe. Spectra spanning morethan 1000 nm can be generated with sub-nJ pulses directly from oscillators.Figure 2.11 illustrates the process when 50 fs pulses from a Ti:Sapphire oscillatorare coupled into a 20 cm long 1.7 µm core PCF. The input power is increasedfrom left to right and the spectrum broadens accordingly as apparent from theright panel where white light is seen from the core of the fiber. The shownfar-field clearly reveals the hexagonal structure of the fiber.
Before the demonstration of PCFs, super continua of similar bandwidth wereusually obtained by focusing µJ pulses in Sapphire glass. Such continua oftendegrade due to accumulated material damage and can be highly unstable [29].Super continua generated in PCFs are more attractive for many purposes sincethey are stable and come in a perfect spatial mode due to the single-mode natureof the fibers. As a consequence new PCF-based white-light sources have alreadyemerged and found use in optical frequency metrology [30] and tomography [31].
The physical background of supercontinuum generation in PCFs with fem-tosecond pulses has been described theoretically [2] and experimental verifica-tions of the model have been reported many times [3, 32–35]. It describes SCGas a process where a higher-order soliton is formed by a short pump pulse inthe anomalous dispersion region of a fiber. This higher-order soliton breaks upinto red-shifting fundamental solitons due to perturbations such as third or-
2.5 Super continuum generation in PCFs 23
Figure 2.11: Super continuum generation in a 1.7 µm core PCF pumped with 50fs pulses from a Ti:Sapphire oscillator. At a pulse energy of approximately 1 nJa broad super continuum is generated as evident from the white core in the rightpicture.
der dispersion, stimulated Raman scattering and self-steepening. The spectraloverlap between the breathing soliton and phasematched linear waves resultsin emission of non-solitonic radiation (NSR) in the normal dispersion region -often deep into the visible. If the dispersion profile of the fiber is known, thephasematching condition can be evaluated and the wavelength of the NSR canbe calculated. In general, the NSR is shifted towards the blue when the pumpwavelength is moved away from the ZDW.
The propagation of ultrashort pulses is accurately described by the extendednonlinear Schrodinger equation. It includes the linear effect of loss/gain α, dis-persion βn, SPM, self-steepening and the fractional contribution of the delayedRaman response function with the parameters fR and hR(t) [12]. With thesame notation as in section 2.2.1, the slowly varying pulse envelope A(z,T) isdetermined by
∂A
∂z+
α
2A +
∑n=2
βnin−1
n!∂n
∂T nA = iγ[(1 − fR)(|A|2A − i
ω0
∂
∂T(|A|2A)) + ...
fR(1 +i
ω0
∂
∂T)(A(z, T )
∫ ∞
0
hR(τ)|A(z, T − τ)|2dτ)] (2.33)
Equation 2.33 is capable of reproducing the SCG process described above to agreat extent, even when an octave spanning spectrum is created.
A soliton is characterized by its soliton number, N
N2 =γP0T
20
|β2| (2.34)
where P0, T0 are the input peak power and pulse duration. A higher-ordersoliton (N > 1.5) breathes and reshapes its original form periodically - buteven small perturbations cause it to break up into its constituent fundamental

24 Nonlinear optics and optical fibers
solitons. Each of these obtain peak powers and pulse durations according to[36]
Pk =(2N − 2k + 1)2
N2Pp, Tk =
T0
2N − 2k + 1(2.35)
Upon fission, the fundamental solitons experience the soliton self-frequency shift(SSFS) due to the overlap of its spectrum with the Raman gain spectrum. Thesoliton emitted first (k=1) has the highest peak power and is therefore shiftedfaster towards the infrared spectral region. Four wave mixing (FWM) andcross-phase modulation (XPM) fill the gap between the infrared pump and thevisible NSR when temporal overlap and phasematching between the variouscomponents are present. FWM and XPM will be described in greater detail inchapters 4 and 7.
Chapter 3
Intracavity frequency doubling
of a femtosecond Ti:Sapphire
oscillator
A Ti:Sapphire femtosecond cavity is extended and intracavity frequency dou-bled. The purpose is to obtain a powerful 400 nm source to pump an opticalparametric amplifier. The remaining fundamental power from the oscillator isused to generate a super continuum in a PCF which serves as a synchronizedseed signal for the parametric amplifier.
25
26 Intracavity frequency doubling of a Ti:Sapphire oscillator
3.1 Introduction
The main focus of this work has been to rebuild a Ti:Sapphire femtosecondoscillator to enable intra cavity frequency doubling while still having enoughfundamental power to generate a super continuum in a PCF. The second har-monic (SH) beam is used to pump an optical parametric amplifier (OPA) seededwith the synchronized output from the PCF. The large nonlinear response ofPCFs enables generation of visible seed pulses - even with infrared pJ pumppulses [37] and tunability across the gain bandwidth of the OPA can be ob-tained by means of crystal angle tuning and by varying the power coupled tothe PCF.
3.2 Intracavity second harmonic generation
Generation of sub-100 femtosecond pulses in the blue spectral region can con-veniently be done by frequency doubling of Ti:sapphire lasers. By using a lowrepetition rate amplified laser system, high peak powers and thereby high con-version efficiency can be obtained. If higher repetition rates are needed, theoutput directly from the oscillator can be frequency doubled, but the relativelylow peak power implies a reduced conversion [10]. A good compromise betweenthe two techniques can be made by placing the doubling crystal inside the cav-ity of the oscillator where the peak power is typically 10-100 times larger thanextracavity. Intracavity frequency doubling (IFD) of Ti:sapphire femtosecondoscillators was first demonstrated by Petrov [38] in 1991 and has later been pur-sued by several authors [39–41]. Depending on the application, an IFD-systemcan be constructed aiming at the shortest possible pulses or with the highestpossible power in mind. In 1992 Ellingson et al [40] reported 1.6 nJ, 89 fs pulsesat 430 nm and Kang has obtained 1.5 nJ at 422 nm with a pulse duration of29 fs [39].
In the work presented here, the intention has been to maximize averagepower which resulted in 73 fs, 4 nJ pulses at 405 nm. The more than two-fold increase in pulse energy compared to previous reports is a result of usinga thicker nonlinear crystal and the extended cavity length which reduces therepetition rate to 50 MHz.
3.2.1 Setup
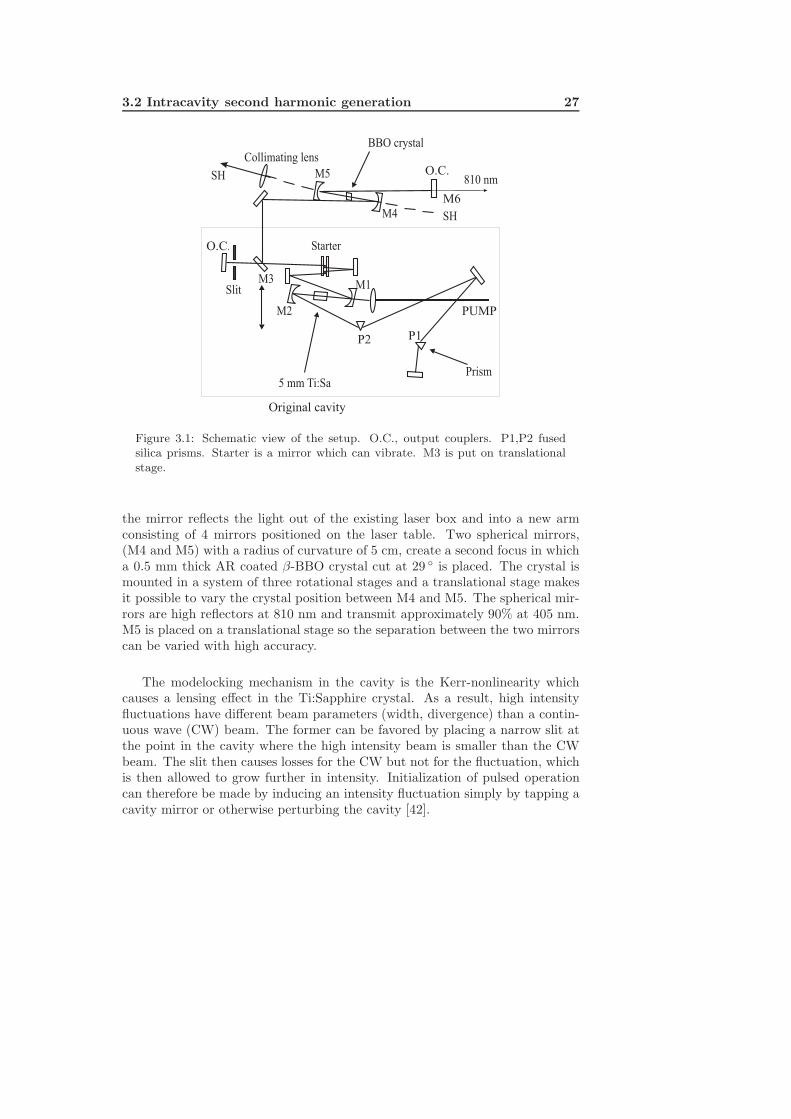
The setup for IFD is shown in Figure 3.1. A commercially available Ti:sapphirefemtosecond oscillator (”Mira Seed” from Coherent Inc.) is redesigned by in-troducing a mirror M3 about 10 cm from the slit and the output coupler. Themirror is put on a translational stage in order to facilitate the return to normaloperation of the laser and the stage is secured in the cavity floor. Once inserted,
3.2 Intracavity second harmonic generation 27
Original cavity
5 mm Ti:Sa
M3
BBO crystal
810 nm
SH
Prism
Slit
Starter
Collimating lens
SH
M1
M2
M4
M5
PUMP
O.C.
O.C.
M6
P2 P1
Figure 3.1: Schematic view of the setup. O.C., output couplers. P1,P2 fusedsilica prisms. Starter is a mirror which can vibrate. M3 is put on translationalstage.
the mirror reflects the light out of the existing laser box and into a new armconsisting of 4 mirrors positioned on the laser table. Two spherical mirrors,(M4 and M5) with a radius of curvature of 5 cm, create a second focus in whicha 0.5 mm thick AR coated β-BBO crystal cut at 29 is placed. The crystal ismounted in a system of three rotational stages and a translational stage makesit possible to vary the crystal position between M4 and M5. The spherical mir-rors are high reflectors at 810 nm and transmit approximately 90% at 405 nm.M5 is placed on a translational stage so the separation between the two mirrorscan be varied with high accuracy.
The modelocking mechanism in the cavity is the Kerr-nonlinearity whichcauses a lensing effect in the Ti:Sapphire crystal. As a result, high intensityfluctuations have different beam parameters (width, divergence) than a contin-uous wave (CW) beam. The former can be favored by placing a narrow slit atthe point in the cavity where the high intensity beam is smaller than the CWbeam. The slit then causes losses for the CW but not for the fluctuation, whichis then allowed to grow further in intensity. Initialization of pulsed operationcan therefore be made by inducing an intensity fluctuation simply by tapping acavity mirror or otherwise perturbing the cavity [42].
28 Intracavity frequency doubling of a Ti:Sapphire oscillator
The right position for the slit is estimated by simple ABCD-matrix calcula-tions [43] and when the slit is put in the predicted position, the laser actuallymodelocks. However, when the BBO crystal is inserted in the secondary focus,modelocking is not possible. The high cavity losses associated with increasedSHG because of pulsed operation make a CW solution more favorable and stablemodelocking can not be sustained. Trial and error have however revealed that aslight reduction of the separation, d, between the two spherical mirrors M4, M5leads to very stable modelocking. In fact, modelocking seems to be facilitatedby the presence of the nonlinear crystal and, at certain values of d, the lasereven modelocks without any slit. This effect originates from an improved spa-tial overlap of the pump and signal mode in the Ti:Sapphire crystal. With theextended cavity set for modelocking, the CW mode is larger than usual whenit impinges on the spherical mirrors M1 and M2 surrounding the Ti:Sapphirecrystal. In contrast, the modelocked beam resembles the beam produced by theoriginal setup and is thereby more similar to the pump mode. Thus, the CWmode is not weakened by a slit but by a poor overlap with the pump.
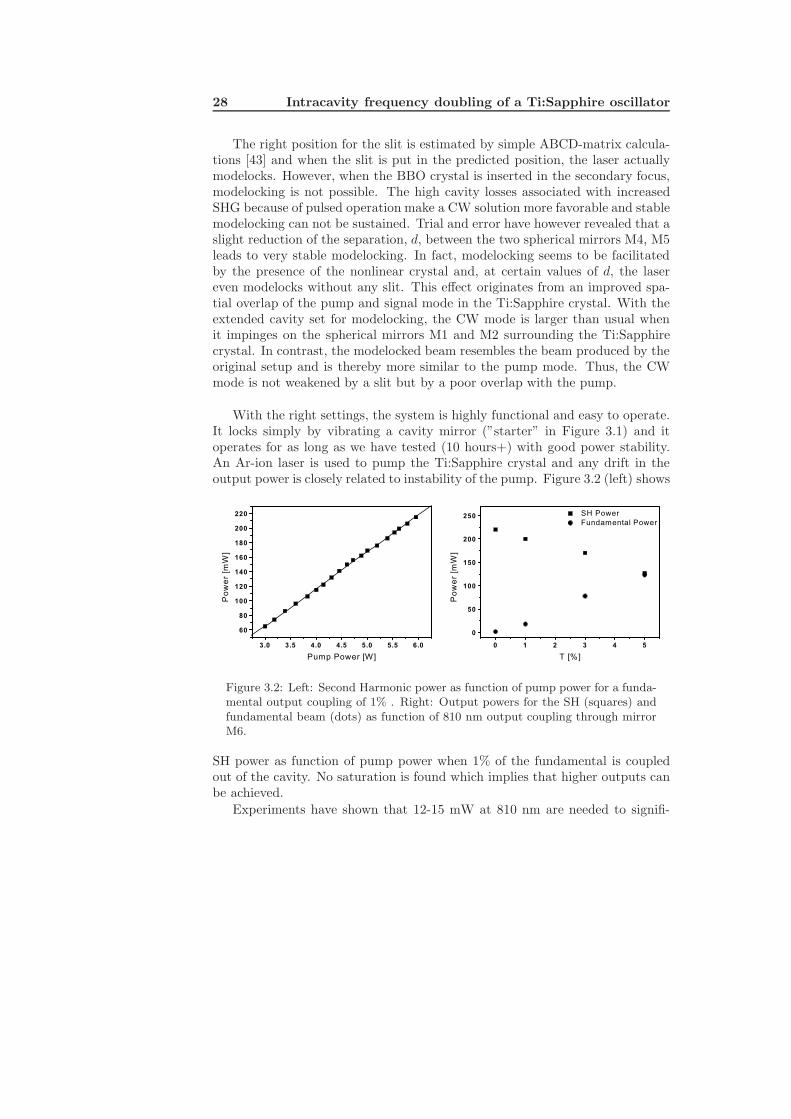
With the right settings, the system is highly functional and easy to operate.It locks simply by vibrating a cavity mirror (”starter” in Figure 3.1) and itoperates for as long as we have tested (10 hours+) with good power stability.An Ar-ion laser is used to pump the Ti:Sapphire crystal and any drift in theoutput power is closely related to instability of the pump. Figure 3.2 (left) shows
Figure 3.2: Left: Second Harmonic power as function of pump power for a funda-mental output coupling of 1% . Right: Output powers for the SH (squares) andfundamental beam (dots) as function of 810 nm output coupling through mirrorM6.
SH power as function of pump power when 1% of the fundamental is coupledout of the cavity. No saturation is found which implies that higher outputs canbe achieved.
Experiments have shown that 12-15 mW at 810 nm are needed to signifi-
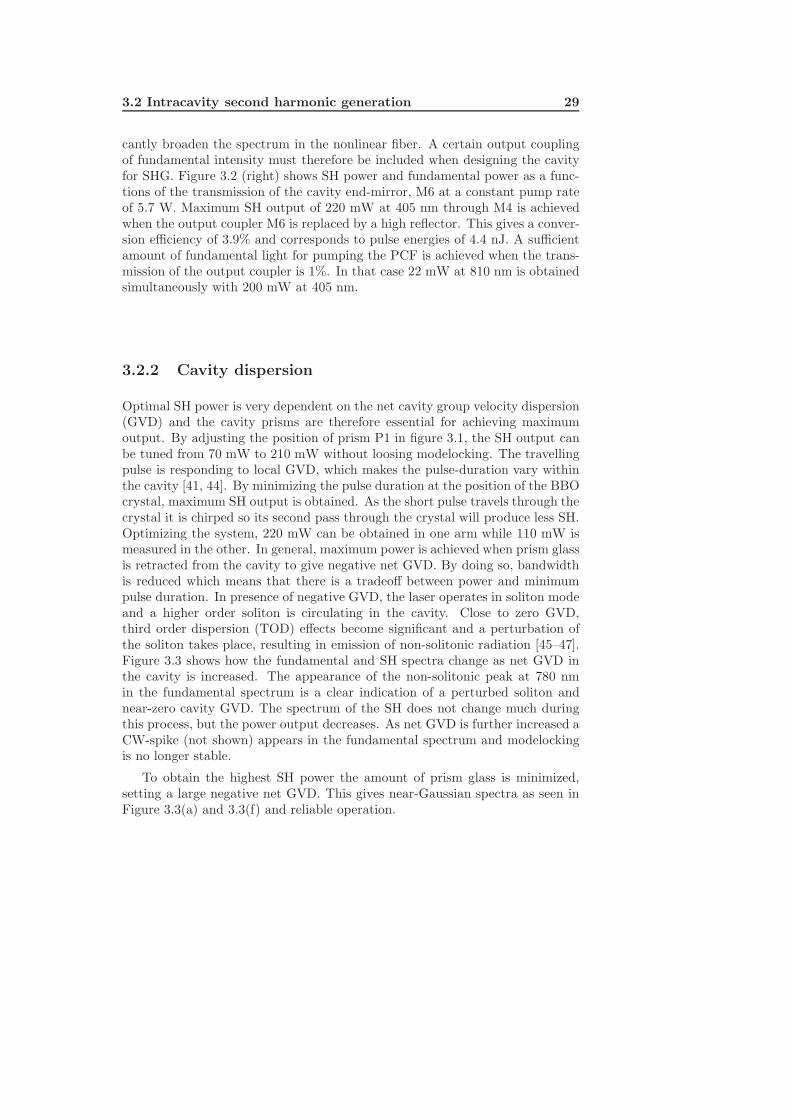
3.2 Intracavity second harmonic generation 29
cantly broaden the spectrum in the nonlinear fiber. A certain output couplingof fundamental intensity must therefore be included when designing the cavityfor SHG. Figure 3.2 (right) shows SH power and fundamental power as a func-tions of the transmission of the cavity end-mirror, M6 at a constant pump rateof 5.7 W. Maximum SH output of 220 mW at 405 nm through M4 is achievedwhen the output coupler M6 is replaced by a high reflector. This gives a conver-sion efficiency of 3.9% and corresponds to pulse energies of 4.4 nJ. A sufficientamount of fundamental light for pumping the PCF is achieved when the trans-mission of the output coupler is 1%. In that case 22 mW at 810 nm is obtainedsimultaneously with 200 mW at 405 nm.
3.2.2 Cavity dispersion
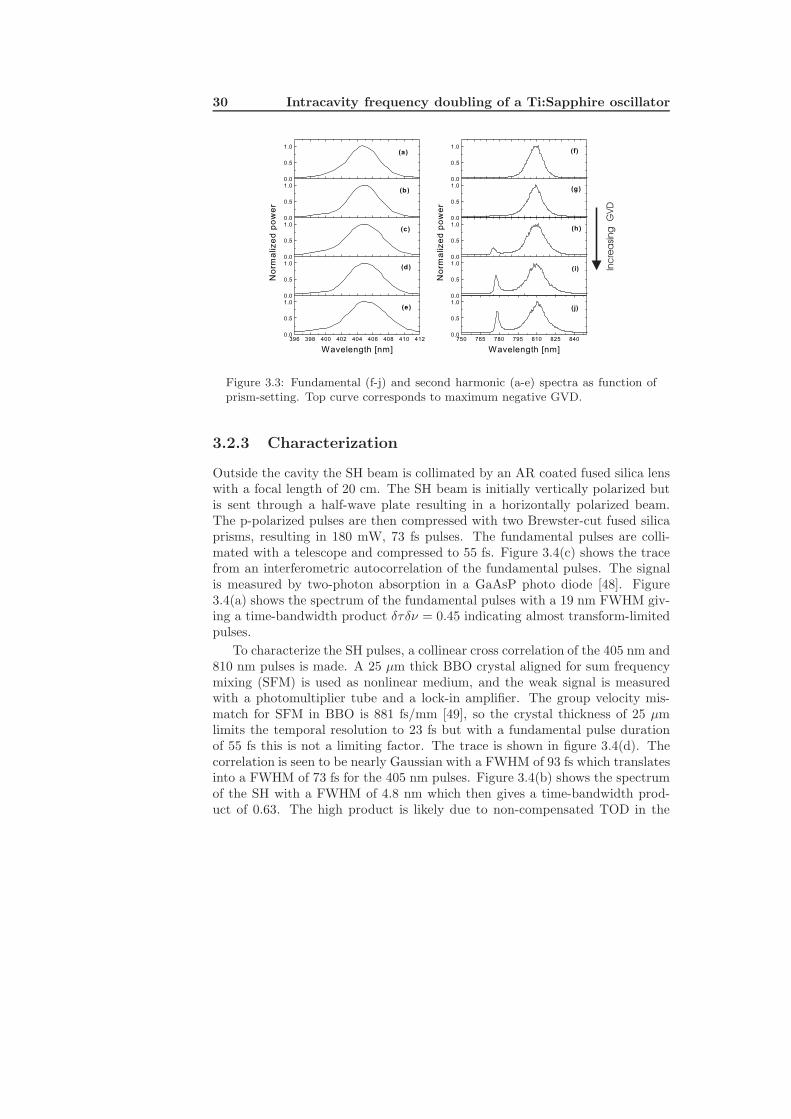
Optimal SH power is very dependent on the net cavity group velocity dispersion(GVD) and the cavity prisms are therefore essential for achieving maximumoutput. By adjusting the position of prism P1 in figure 3.1, the SH output canbe tuned from 70 mW to 210 mW without loosing modelocking. The travellingpulse is responding to local GVD, which makes the pulse-duration vary withinthe cavity [41, 44]. By minimizing the pulse duration at the position of the BBOcrystal, maximum SH output is obtained. As the short pulse travels through thecrystal it is chirped so its second pass through the crystal will produce less SH.Optimizing the system, 220 mW can be obtained in one arm while 110 mW ismeasured in the other. In general, maximum power is achieved when prism glassis retracted from the cavity to give negative net GVD. By doing so, bandwidthis reduced which means that there is a tradeoff between power and minimumpulse duration. In presence of negative GVD, the laser operates in soliton modeand a higher order soliton is circulating in the cavity. Close to zero GVD,third order dispersion (TOD) effects become significant and a perturbation ofthe soliton takes place, resulting in emission of non-solitonic radiation [45–47].Figure 3.3 shows how the fundamental and SH spectra change as net GVD inthe cavity is increased. The appearance of the non-solitonic peak at 780 nmin the fundamental spectrum is a clear indication of a perturbed soliton andnear-zero cavity GVD. The spectrum of the SH does not change much duringthis process, but the power output decreases. As net GVD is further increased aCW-spike (not shown) appears in the fundamental spectrum and modelockingis no longer stable.
To obtain the highest SH power the amount of prism glass is minimized,setting a large negative net GVD. This gives near-Gaussian spectra as seen inFigure 3.3(a) and 3.3(f) and reliable operation.
30 Intracavity frequency doubling of a Ti:Sapphire oscillator
Inc
rea
sing
GVD
Figure 3.3: Fundamental (f-j) and second harmonic (a-e) spectra as function ofprism-setting. Top curve corresponds to maximum negative GVD.
3.2.3 Characterization
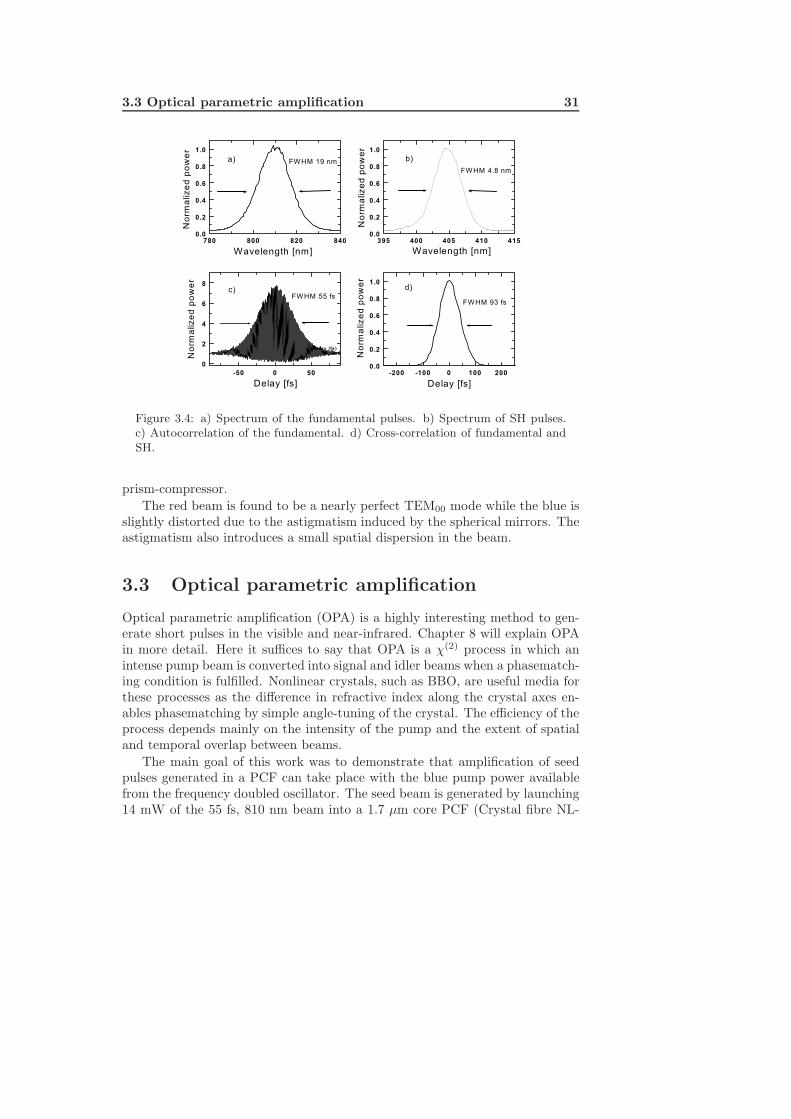
Outside the cavity the SH beam is collimated by an AR coated fused silica lenswith a focal length of 20 cm. The SH beam is initially vertically polarized butis sent through a half-wave plate resulting in a horizontally polarized beam.The p-polarized pulses are then compressed with two Brewster-cut fused silicaprisms, resulting in 180 mW, 73 fs pulses. The fundamental pulses are colli-mated with a telescope and compressed to 55 fs. Figure 3.4(c) shows the tracefrom an interferometric autocorrelation of the fundamental pulses. The signalis measured by two-photon absorption in a GaAsP photo diode [48]. Figure3.4(a) shows the spectrum of the fundamental pulses with a 19 nm FWHM giv-ing a time-bandwidth product δτδν = 0.45 indicating almost transform-limitedpulses.
To characterize the SH pulses, a collinear cross correlation of the 405 nm and810 nm pulses is made. A 25 µm thick BBO crystal aligned for sum frequencymixing (SFM) is used as nonlinear medium, and the weak signal is measuredwith a photomultiplier tube and a lock-in amplifier. The group velocity mis-match for SFM in BBO is 881 fs/mm [49], so the crystal thickness of 25 µmlimits the temporal resolution to 23 fs but with a fundamental pulse durationof 55 fs this is not a limiting factor. The trace is shown in figure 3.4(d). Thecorrelation is seen to be nearly Gaussian with a FWHM of 93 fs which translatesinto a FWHM of 73 fs for the 405 nm pulses. Figure 3.4(b) shows the spectrumof the SH with a FWHM of 4.8 nm which then gives a time-bandwidth prod-uct of 0.63. The high product is likely due to non-compensated TOD in the
3.3 Optical parametric amplification 31
Figure 3.4: a) Spectrum of the fundamental pulses. b) Spectrum of SH pulses.c) Autocorrelation of the fundamental. d) Cross-correlation of fundamental andSH.
prism-compressor.The red beam is found to be a nearly perfect TEM00 mode while the blue is
slightly distorted due to the astigmatism induced by the spherical mirrors. Theastigmatism also introduces a small spatial dispersion in the beam.
3.3 Optical parametric amplification
Optical parametric amplification (OPA) is a highly interesting method to gen-erate short pulses in the visible and near-infrared. Chapter 8 will explain OPAin more detail. Here it suffices to say that OPA is a χ(2) process in which anintense pump beam is converted into signal and idler beams when a phasematch-ing condition is fulfilled. Nonlinear crystals, such as BBO, are useful media forthese processes as the difference in refractive index along the crystal axes en-ables phasematching by simple angle-tuning of the crystal. The efficiency of theprocess depends mainly on the intensity of the pump and the extent of spatialand temporal overlap between beams.
The main goal of this work was to demonstrate that amplification of seedpulses generated in a PCF can take place with the blue pump power availablefrom the frequency doubled oscillator. The seed beam is generated by launching14 mW of the 55 fs, 810 nm beam into a 1.7 µm core PCF (Crystal fibre NL-
32 Intracavity frequency doubling of a Ti:Sapphire oscillator
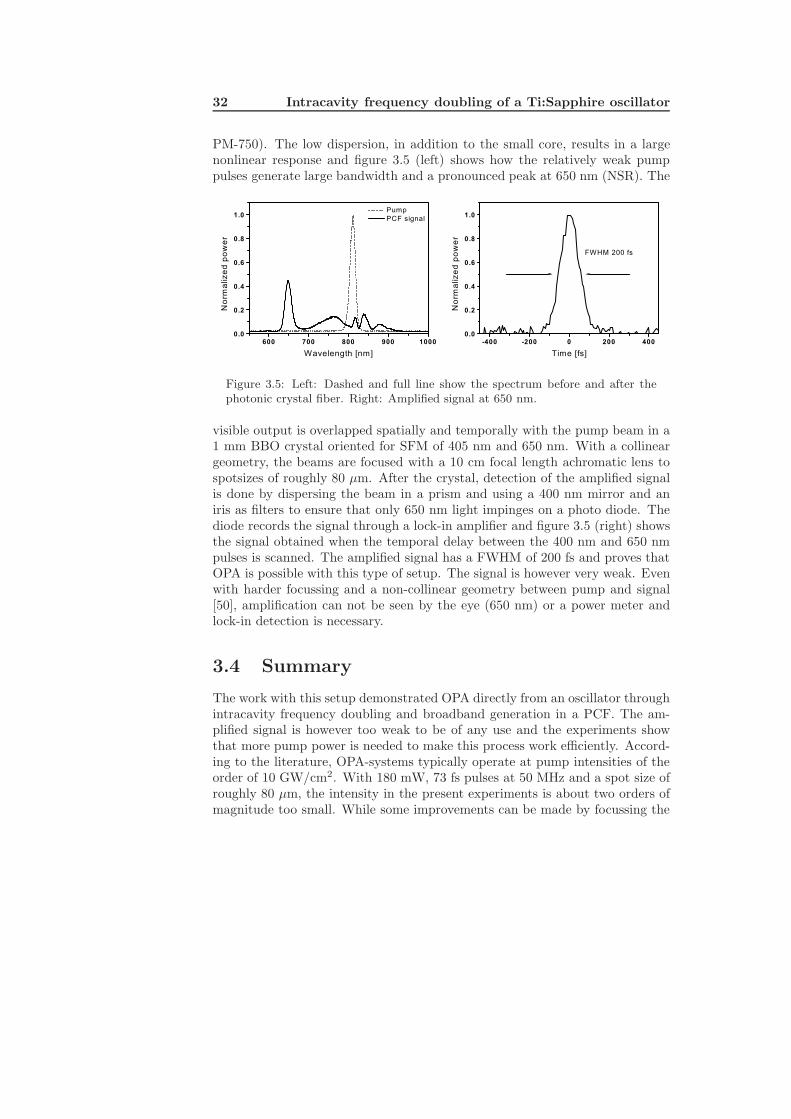
PM-750). The low dispersion, in addition to the small core, results in a largenonlinear response and figure 3.5 (left) shows how the relatively weak pumppulses generate large bandwidth and a pronounced peak at 650 nm (NSR). The
Figure 3.5: Left: Dashed and full line show the spectrum before and after thephotonic crystal fiber. Right: Amplified signal at 650 nm.
visible output is overlapped spatially and temporally with the pump beam in a1 mm BBO crystal oriented for SFM of 405 nm and 650 nm. With a collineargeometry, the beams are focused with a 10 cm focal length achromatic lens tospotsizes of roughly 80 µm. After the crystal, detection of the amplified signalis done by dispersing the beam in a prism and using a 400 nm mirror and aniris as filters to ensure that only 650 nm light impinges on a photo diode. Thediode records the signal through a lock-in amplifier and figure 3.5 (right) showsthe signal obtained when the temporal delay between the 400 nm and 650 nmpulses is scanned. The amplified signal has a FWHM of 200 fs and proves thatOPA is possible with this type of setup. The signal is however very weak. Evenwith harder focussing and a non-collinear geometry between pump and signal[50], amplification can not be seen by the eye (650 nm) or a power meter andlock-in detection is necessary.
3.4 Summary
The work with this setup demonstrated OPA directly from an oscillator throughintracavity frequency doubling and broadband generation in a PCF. The am-plified signal is however too weak to be of any use and the experiments showthat more pump power is needed to make this process work efficiently. Accord-ing to the literature, OPA-systems typically operate at pump intensities of theorder of 10 GW/cm2. With 180 mW, 73 fs pulses at 50 MHz and a spot size ofroughly 80 µm, the intensity in the present experiments is about two orders ofmagnitude too small. While some improvements can be made by focussing the

3.4 Summary 33
pump beam harder or optimizing the modal overlap in the BBO crystal, it willnot be possible to find two orders of magnitude.
However, the idea of using a PCF as a white-light source for OPA is quiteinteresting and is actually being pursued by other groups now [51]. Chapter 8will describe a second and more successful attempt of making this type of setupbut this time with a high power fiber laser as pump source.

34 Intracavity frequency doubling of a Ti:Sapphire oscillator
Chapter 4
Continuous wave four-wave
mixing in a photonic crystal fiber
Degenerate four wave mixing in a highly nonlinear PCF is investigated. Thedispersion profile of the fiber enables phasematching over a broad spectral rangeeven at vanishing power levels and continuous wave wavelength conversion istherefore possible. The fiber could potentially be used as gain media for anoptical parametric oscillator or as an optical switch.
35
36 Continuous wave four-wave mixing in a photonic crystal fiber
4.1 Introduction
The work presented in this chapter was inspired by previous experiments withsuper continuum generation (SCG) in a highly nonlinear PCF with two zero-dispersion-wavelengths (ZDW) [52]. The experiments revealed that the SCGprocess was dominated by degenerate four-wave mixing (FWM) and not solitonfission as is usually the case [3]. The presence of two ZDW changed the disper-sion of the fiber to such an extent that phasematching for FWM was fulfilledin the entire anomalous dispersion regime. Since FWM has very high gain [12],soliton dynamics were effectively arrested and the output consisted of two peakscentered at the ZDWs in accordance with predictions based on calculated FWMphasematching curves. The output was largely unaffected by the input pulseparameters and the simulations showed that FWM would always dominate andeven take place at continuous wave power levels.
The experiments presented here confirm these ideas and demonstrate meansof wavelength conversion without the need of intense pulses.
4.2 Four wave mixing
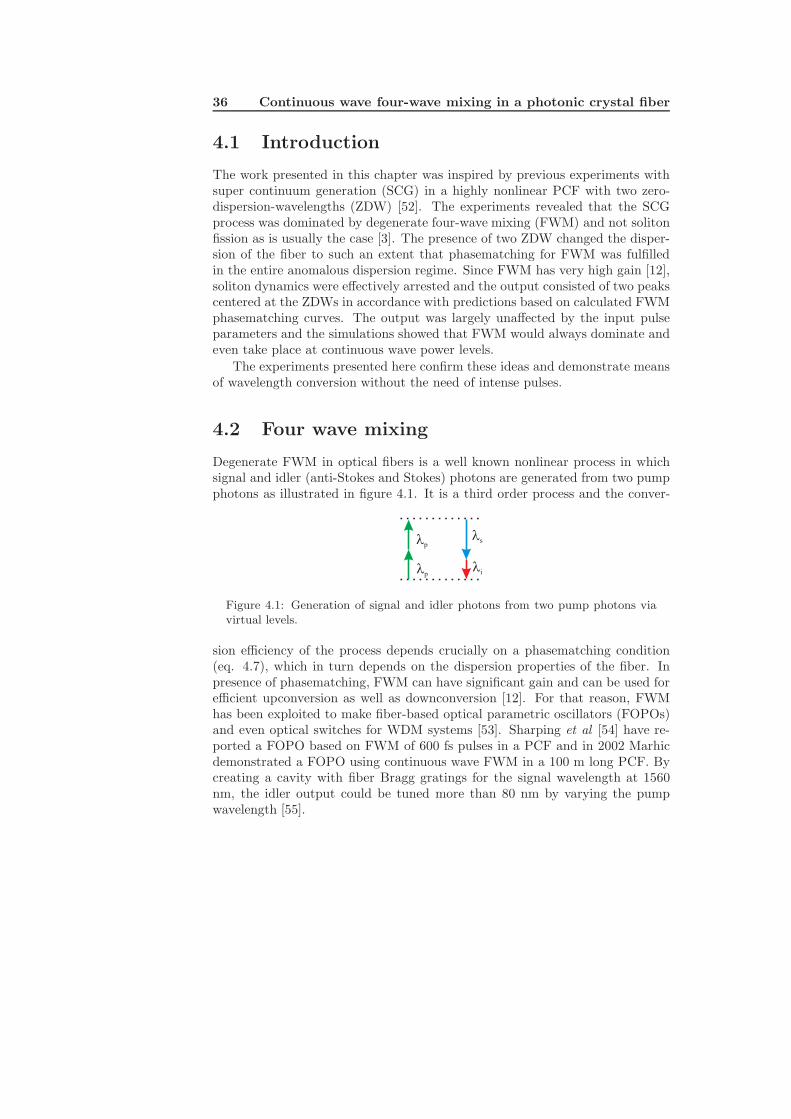
Degenerate FWM in optical fibers is a well known nonlinear process in whichsignal and idler (anti-Stokes and Stokes) photons are generated from two pumpphotons as illustrated in figure 4.1. It is a third order process and the conver-
p
s
i
p
Figure 4.1: Generation of signal and idler photons from two pump photons viavirtual levels.
sion efficiency of the process depends crucially on a phasematching condition(eq. 4.7), which in turn depends on the dispersion properties of the fiber. Inpresence of phasematching, FWM can have significant gain and can be used forefficient upconversion as well as downconversion [12]. For that reason, FWMhas been exploited to make fiber-based optical parametric oscillators (FOPOs)and even optical switches for WDM systems [53]. Sharping et al [54] have re-ported a FOPO based on FWM of 600 fs pulses in a PCF and in 2002 Marhicdemonstrated a FOPO using continuous wave FWM in a 100 m long PCF. Bycreating a cavity with fiber Bragg gratings for the signal wavelength at 1560nm, the idler output could be tuned more than 80 nm by varying the pumpwavelength [55].
4.2 Four wave mixing 37
In this chapter, continuous wave FWM in a polarization maintaining PCFwith two ZDWs is presented. The dispersion profile enables phasematchedFWM to take place in the anomalous dispersion region and several nanometersbelow the high frequency ZDW. A tunable output can therefore be obtained bypumping the fiber in this range while seeding with an appropriate idler.
The theory of FWM is well described in the literature [56]. In case of de-generate FWM, the electric field can be represented by
E(z, t) = 2Epei(kpz−ωpt) + Ese
i(ksz−ωst) + Eiei(kiz−ωit) + c.c. (4.1)
The nonlinear polarization Pnl = ε0χ(3)EEE of the material is then found
to oscillate at many different frequencies, but for this analysis only the termsoscillating at ωp, ωs, ωi are interesting. The following equations for the slowlyvarying envelopes of the three fields can then be derived [12]
∂Ap
∂z= iγ[(|Ap|2 + 2(|Ai|2 + |As|2))Ap + 2AiAsA
∗p exp(i∆βz)] (4.2)
∂Ai(s)
∂z= iγ[(|Ai(s)|2 + 2(|Ap|2 + |As(i)|2))Ai(s) + A2
pA∗s(i) exp(−i∆βz)]
(4.3)
where Ap, Ai and As are the normalized field amplitudes of the pump, idlerand signal respectively and ∆β is the difference in the propagation constantsgiven by ∆β = βs + βi − 2βp. Equation 4.2 and 4.3 generally have to be solvednumerically but assuming an un-depleted pump (∂Ap
∂z = 0) it is possible toobtain an analytical expression for the signal power [12, 56]
Ps(L) = Ps(0)(1 + γP0/g)2sinh2(gL) (4.4)
where g is the gain:
g =
√(γP0)2 − (
κ
2)2
(4.5)
with κ given by
κ = ∆β + 2γP0 (4.6)
and P0 is the pump power. Maximum gain of g = γP0 is obtained when κ = 0,which occurs when the nonlinear phase shift (2γP0) is compensated by a negativewave vector mismatch, ∆β. Expanding β(ω) around the pump frequency resultsin the phasematching condition:
Ω2s β2 +
112
Ω4s β4 +
1360
Ω6s β6 + .... + 2γP0 = 0 (4.7)
38 Continuous wave four-wave mixing in a photonic crystal fiber
where β2, β4 and β6 are the second, fourth and sixth derivative of β with respectto ω evaluated at the pump frequency and Ωs is the frequency shift from thepump to the signal/idler frequencies.
In conventional single mode fibers, the higher order terms are generally smalland it is sufficient to include only β2 when evaluating eq. 4.7 (except at theZDW). In this approximation, phasematching can only occur in the anomalousdispersion regime where a negative β2 can compensate for the positive nonlinearphase shift [12]. In highly nonlinear PCFs the significant waveguide dispersioncan profoundly change the dispersion profile and higher order terms can nolonger be neglected [57, 58].
4.3 Phasematching in CF NL-PM-750
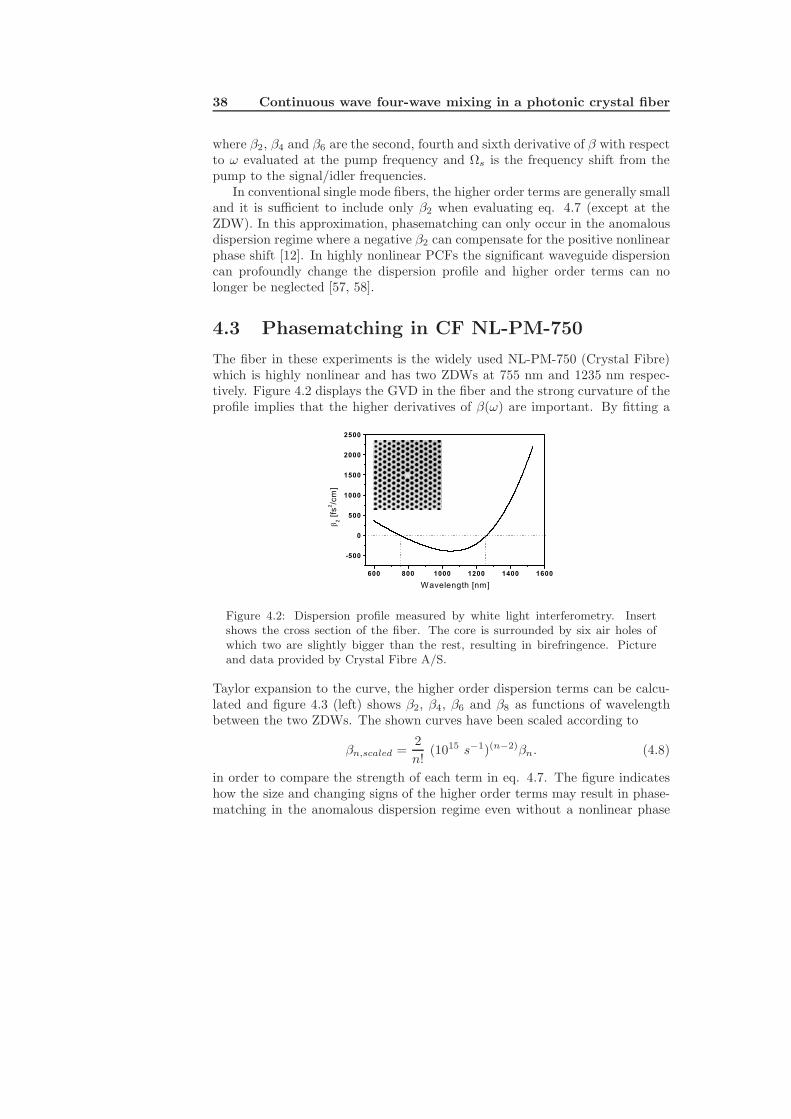
The fiber in these experiments is the widely used NL-PM-750 (Crystal Fibre)which is highly nonlinear and has two ZDWs at 755 nm and 1235 nm respec-tively. Figure 4.2 displays the GVD in the fiber and the strong curvature of theprofile implies that the higher derivatives of β(ω) are important. By fitting a
Figure 4.2: Dispersion profile measured by white light interferometry. Insertshows the cross section of the fiber. The core is surrounded by six air holes ofwhich two are slightly bigger than the rest, resulting in birefringence. Pictureand data provided by Crystal Fibre A/S.
Taylor expansion to the curve, the higher order dispersion terms can be calcu-lated and figure 4.3 (left) shows β2, β4, β6 and β8 as functions of wavelengthbetween the two ZDWs. The shown curves have been scaled according to
βn,scaled =2n!
(1015 s−1)(n−2)βn. (4.8)
in order to compare the strength of each term in eq. 4.7. The figure indicateshow the size and changing signs of the higher order terms may result in phase-matching in the anomalous dispersion regime even without a nonlinear phase
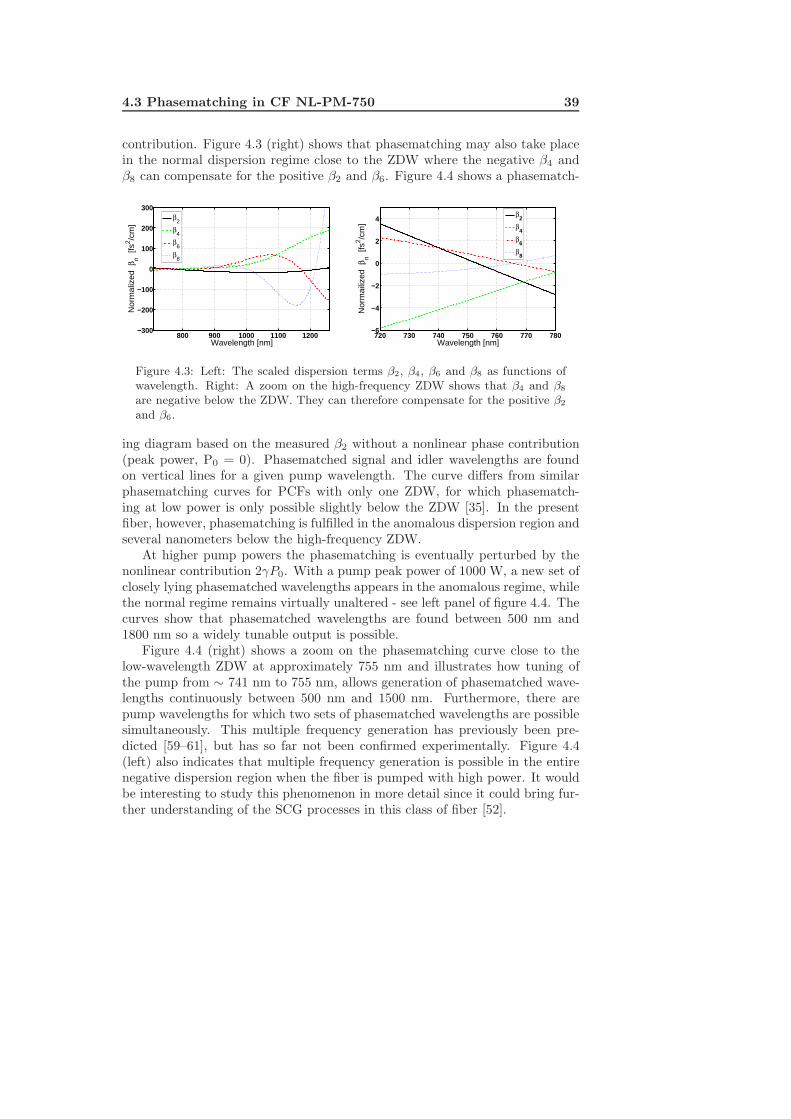
4.3 Phasematching in CF NL-PM-750 39
contribution. Figure 4.3 (right) shows that phasematching may also take placein the normal dispersion regime close to the ZDW where the negative β4 andβ8 can compensate for the positive β2 and β6. Figure 4.4 shows a phasematch-
800 900 1000 1100 1200−300
−200
−100
0
100
200
300
Wavelength [nm]
Nor
mal
ized
βn [
fs2 /c
m]
β2
β4
β6
β8
720 730 740 750 760 770 780−6
−4
−2
0
2
4
Wavelength [nm]
Nor
mai
lized
βn [
fs2 /c
m]
β2
β4
β6
β8
Figure 4.3: Left: The scaled dispersion terms β2, β4, β6 and β8 as functions ofwavelength. Right: A zoom on the high-frequency ZDW shows that β4 and β8
are negative below the ZDW. They can therefore compensate for the positive β2
and β6.
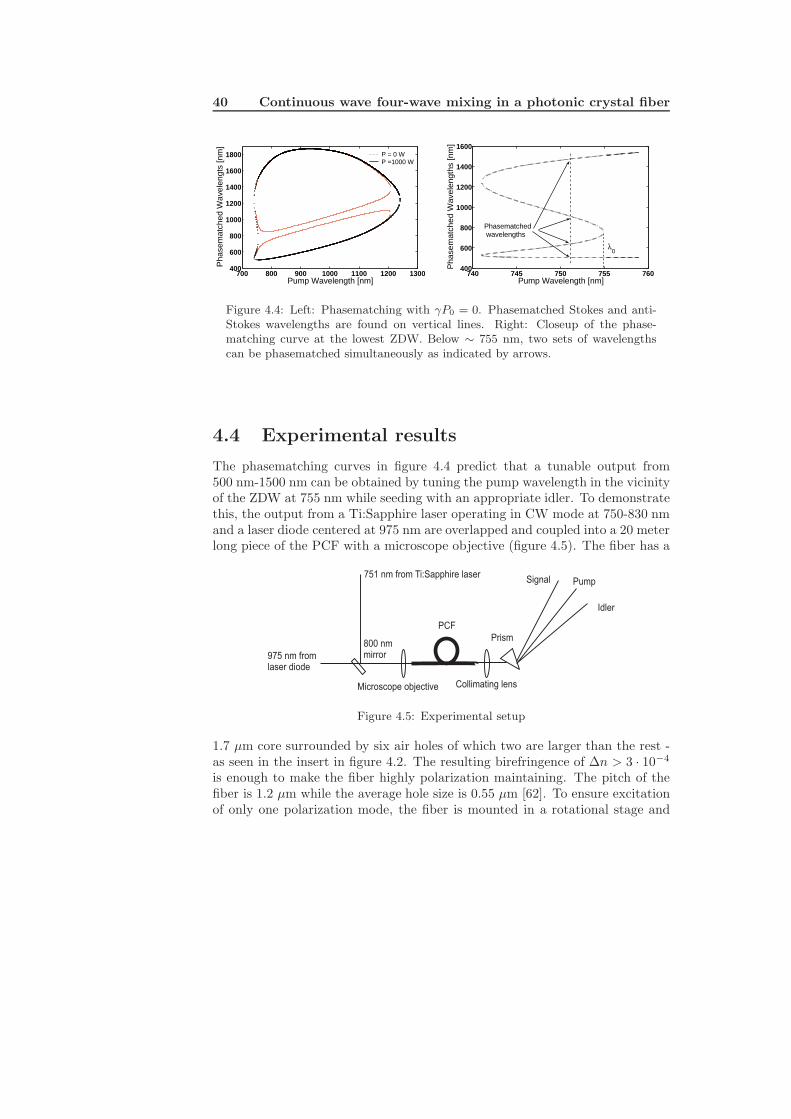
ing diagram based on the measured β2 without a nonlinear phase contribution(peak power, P0 = 0). Phasematched signal and idler wavelengths are foundon vertical lines for a given pump wavelength. The curve differs from similarphasematching curves for PCFs with only one ZDW, for which phasematch-ing at low power is only possible slightly below the ZDW [35]. In the presentfiber, however, phasematching is fulfilled in the anomalous dispersion region andseveral nanometers below the high-frequency ZDW.
At higher pump powers the phasematching is eventually perturbed by thenonlinear contribution 2γP0. With a pump peak power of 1000 W, a new set ofclosely lying phasematched wavelengths appears in the anomalous regime, whilethe normal regime remains virtually unaltered - see left panel of figure 4.4. Thecurves show that phasematched wavelengths are found between 500 nm and1800 nm so a widely tunable output is possible.
Figure 4.4 (right) shows a zoom on the phasematching curve close to thelow-wavelength ZDW at approximately 755 nm and illustrates how tuning ofthe pump from ∼ 741 nm to 755 nm, allows generation of phasematched wave-lengths continuously between 500 nm and 1500 nm. Furthermore, there arepump wavelengths for which two sets of phasematched wavelengths are possiblesimultaneously. This multiple frequency generation has previously been pre-dicted [59–61], but has so far not been confirmed experimentally. Figure 4.4(left) also indicates that multiple frequency generation is possible in the entirenegative dispersion region when the fiber is pumped with high power. It wouldbe interesting to study this phenomenon in more detail since it could bring fur-ther understanding of the SCG processes in this class of fiber [52].
40 Continuous wave four-wave mixing in a photonic crystal fiber
700 800 900 1000 1100 1200 1300400
600
800
1000
1200
1400
1600
1800
Pump Wavelength [nm]
Pha
sem
atch
ed W
avel
engt
s [n
m]
P = 0 WP =1000 W
740 745 750 755 760400
600
800
1000
1200
1400
1600
Pump Wavelength [nm]
Pha
sem
atch
ed W
avel
engt
hs [n
m]
λ0
Phasematched wavelengths
Figure 4.4: Left: Phasematching with γP0 = 0. Phasematched Stokes and anti-Stokes wavelengths are found on vertical lines. Right: Closeup of the phase-matching curve at the lowest ZDW. Below ∼ 755 nm, two sets of wavelengthscan be phasematched simultaneously as indicated by arrows.
4.4 Experimental results
The phasematching curves in figure 4.4 predict that a tunable output from500 nm-1500 nm can be obtained by tuning the pump wavelength in the vicinityof the ZDW at 755 nm while seeding with an appropriate idler. To demonstratethis, the output from a Ti:Sapphire laser operating in CW mode at 750-830 nmand a laser diode centered at 975 nm are overlapped and coupled into a 20 meterlong piece of the PCF with a microscope objective (figure 4.5). The fiber has a
Microscope objective
751 nm from Ti:Sapphire laser
975 nm fromlaser diode
800 nmmirror
Collimating lens
Prism
Signal Pump
Idler
PCF
Figure 4.5: Experimental setup
1.7 µm core surrounded by six air holes of which two are larger than the rest -as seen in the insert in figure 4.2. The resulting birefringence of ∆n > 3 · 10−4
is enough to make the fiber highly polarization maintaining. The pitch of thefiber is 1.2 µm while the average hole size is 0.55 µm [62]. To ensure excitationof only one polarization mode, the fiber is mounted in a rotational stage and
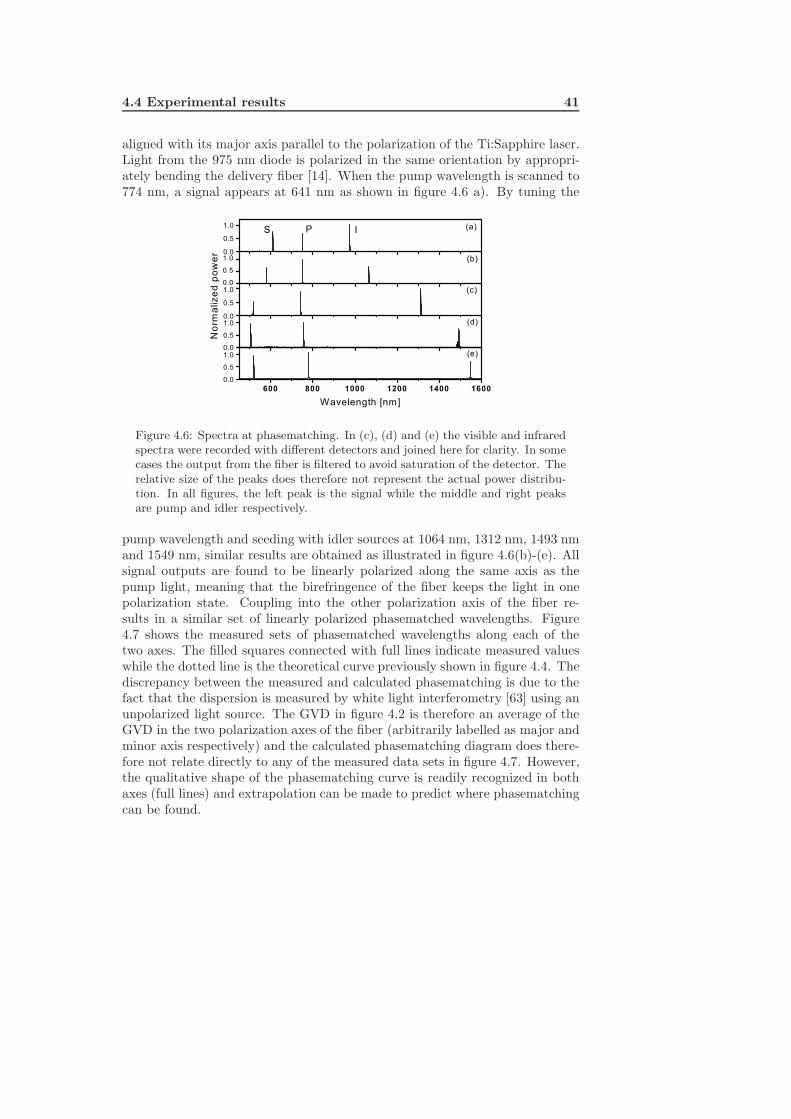
4.4 Experimental results 41
aligned with its major axis parallel to the polarization of the Ti:Sapphire laser.Light from the 975 nm diode is polarized in the same orientation by appropri-ately bending the delivery fiber [14]. When the pump wavelength is scanned to774 nm, a signal appears at 641 nm as shown in figure 4.6 a). By tuning the
Figure 4.6: Spectra at phasematching. In (c), (d) and (e) the visible and infraredspectra were recorded with different detectors and joined here for clarity. In somecases the output from the fiber is filtered to avoid saturation of the detector. Therelative size of the peaks does therefore not represent the actual power distribu-tion. In all figures, the left peak is the signal while the middle and right peaksare pump and idler respectively.
pump wavelength and seeding with idler sources at 1064 nm, 1312 nm, 1493 nmand 1549 nm, similar results are obtained as illustrated in figure 4.6(b)-(e). Allsignal outputs are found to be linearly polarized along the same axis as thepump light, meaning that the birefringence of the fiber keeps the light in onepolarization state. Coupling into the other polarization axis of the fiber re-sults in a similar set of linearly polarized phasematched wavelengths. Figure4.7 shows the measured sets of phasematched wavelengths along each of thetwo axes. The filled squares connected with full lines indicate measured valueswhile the dotted line is the theoretical curve previously shown in figure 4.4. Thediscrepancy between the measured and calculated phasematching is due to thefact that the dispersion is measured by white light interferometry [63] using anunpolarized light source. The GVD in figure 4.2 is therefore an average of theGVD in the two polarization axes of the fiber (arbitrarily labelled as major andminor axis respectively) and the calculated phasematching diagram does there-fore not relate directly to any of the measured data sets in figure 4.7. However,the qualitative shape of the phasematching curve is readily recognized in bothaxes (full lines) and extrapolation can be made to predict where phasematchingcan be found.
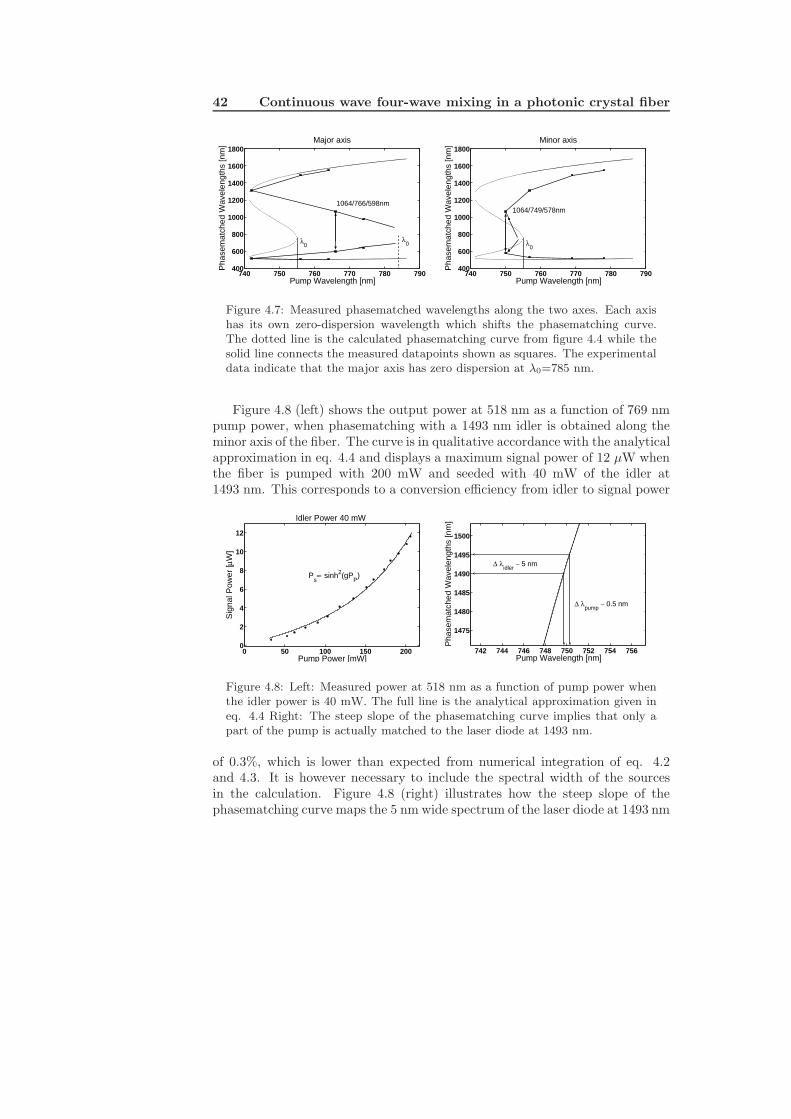
42 Continuous wave four-wave mixing in a photonic crystal fiber
740 750 760 770 780 790400
600
800
1000
1200
1400
1600
1800Major axis
Pump Wavelength [nm]
Pha
sem
atch
ed W
avel
engt
hs [n
m]
λ0 λ
0
1064/766/598nm
740 750 760 770 780 790400
600
800
1000
1200
1400
1600
1800Minor axis
Pump Wavelength [nm]
Pha
sem
atch
ed W
avel
engt
hs [n
m]
1064/749/578nm
λ0
Figure 4.7: Measured phasematched wavelengths along the two axes. Each axishas its own zero-dispersion wavelength which shifts the phasematching curve.The dotted line is the calculated phasematching curve from figure 4.4 while thesolid line connects the measured datapoints shown as squares. The experimentaldata indicate that the major axis has zero dispersion at λ0=785 nm.
Figure 4.8 (left) shows the output power at 518 nm as a function of 769 nmpump power, when phasematching with a 1493 nm idler is obtained along theminor axis of the fiber. The curve is in qualitative accordance with the analyticalapproximation in eq. 4.4 and displays a maximum signal power of 12 µW whenthe fiber is pumped with 200 mW and seeded with 40 mW of the idler at1493 nm. This corresponds to a conversion efficiency from idler to signal power
0 50 100 150 2000
2
4
6
8
10
12
Pump Power [mW]
Sig
nal P
ower
[µW
]
Idler Power 40 mW
Ps∝ sinh2(gP
P)
742 744 746 748 750 752 754 756
1475
1480
1485
1490
1495
1500
Pump Wavelength [nm]
Pha
sem
atch
ed W
avel
engt
hs [n
m]
∆ λpump
∼ 0.5 nm
∆ λidler
∼ 5 nm
Figure 4.8: Left: Measured power at 518 nm as a function of pump power whenthe idler power is 40 mW. The full line is the analytical approximation given ineq. 4.4 Right: The steep slope of the phasematching curve implies that only apart of the pump is actually matched to the laser diode at 1493 nm.
of 0.3%, which is lower than expected from numerical integration of eq. 4.2and 4.3. It is however necessary to include the spectral width of the sourcesin the calculation. Figure 4.8 (right) illustrates how the steep slope of thephasematching curve maps the 5 nm wide spectrum of the laser diode at 1493 nm
4.5 Summary 43
onto an interval of 0.5 nm on the pump axis. The Ti:Sapphire laser is designedfor pulsed operation so even when it is forced to run CW, the line-width is about4 nm. Therefore, only a part of the pump power actually participates in themixing process which explains that the measured conversion efficiency is lowerthan expected. The theoretical expressions (eq. 4.2-4.3) predict that 200 mW ofpump power, combined with 40 mW of idler power, should result in 2 mW at thesignal wavelength if the bandwidths were matched. This corresponds to an idler-to-signal conversion efficiency of 5%. With the advent of high power, narrowline width diode lasers [64] such conversions will be possible with simple andcompact setups. Additional improvements can be obtained by seeding the fiberat the signal wavelength as well. This could be done with a simple re-couplingof signal power or by creating a cavity around the fiber (FOPO) [54, 65]. Itshould be noted that fluctuations in the core dimensions along the length ofthe fiber are known to cause a reduction in bandwidth and gain of the FWMprocess [66] so the quality of the fibers is also critical for optimum performance.
4.5 Summary
Continuous wave FWM in a PCF with two zero-dispersion wavelengths is demon-strated. The dispersion profile of the fiber allows phasematched degenerateFWM to take place in the anomalous dispersion regime at low CW pump pow-ers and the experiments verify predicted phasematching at five different pumpwavelengths. In combination with calculated phasematching curves, the exper-iments indicate that a large span of wavelengths can be matched by tuningthe pump laser only a few nanometers in the vicinity of the lowest ZDW. Aconversion efficiency of 0.3 % from an idler at 1493 nm to a signal at 518 nmis obtained but is limited by the low spectral density of the available pump.Improved conversion can be obtained by employing narrow-band pump sourcesor using the fiber in a FOPO setup.

44 Continuous wave four-wave mixing in a photonic crystal fiber
Chapter 5
Q-switched fiber laser
An all-fiber Q-switched laser is developed with industrial applications in mind.The experiments presented here serve as a proof of principle and show thatpulsed sources can be made with simple means.
45
46 Q-switched fiber laser
Aiming at the marking industry, NKT-Research set out to make pulsed fiberlasers. Typical target parameters were 100 ns pulses at a repetition rate of 10kHz so Q-switching was the natural route to take. The basic idea was to useexisting (cheap) telecom components to make a pulsed source and then amplifythe output in a high power double-clad large mode area (LMA) fiber. SeveralQ-switching schemes were tested, and in this chapter an all-fiber solution willbe described. The laser was developed in collaboration with Miguel Andres’group at the University of Valencia in Spain.
5.1 Introduction
Fiber lasers represent an attractive alternative to conventional solid state lasersdue to superior beam quality, efficiency and compactness. In recent years theperformance of fiber lasers has greatly improved, and pulsed as well as con-tinuous wave fiber lasers can now deliver power levels comparable to those ofstandard workhorses such as the Nd:YAG [67, 68].
Q-switching is a well known technique to obtain powerful pulses of 1-500 nsduration and Q-switched lasers are used extensively in laboratories and in indus-try. Q-switching of fiber lasers has been demonstrated in a variety of ways [22]and the potential simplicity of such lasers makes them interesting for various ap-plications in medicine, sensing and material processing. In general, Q-switchedfiber lasers are however flawed by the inclusion of a bulk switching device suchas acousto-optic modulators [69] or saturable absorbers [70–73]. These compo-nents greatly increase the complexity of the setups since light must be coupledin and out of the fiber. The necessary mechanical stability may be incompati-ble with practical applications and it is therefore highly interesting to developall-fiber alternatives. Self-Q-switching in optical fibers due to Brillouin andRayleigh scattering [74, 75] may be exploited for this purpose, and it has alsobeen suggested to use Samarium-doped fiber as a saturable absorber to Q-switchEr-doped lasers [76]. However, in passively Q-switched lasers, important param-eters such as pulse duration and repetition rate are partly determined by thecharacteristics of the saturable absorber and cannot be controlled directly. Forsome applications, it is necessary to control these factors and simpler all-fiberactively Q-switched solutions are therefore desirable.
There are very few examples of all-fiber actively Q-switched lasers in the lit-erature. In 1993, Chandonnet et al used a side-polished coupler to modulate thecavity losses and obtained Q-switching in an Er-doped fiber laser [77]. Anotherattempt relied on modulating a Bragg grating with a piezoelectric element, butto get sufficient modulation it was necessary to work at the mechanical reso-nance of the piezoelectric and operation was therefore bound to take place atharmonics of this resonance frequency [78].
More recently, an all-fiber actively Q-switched laser based on magnetostric-
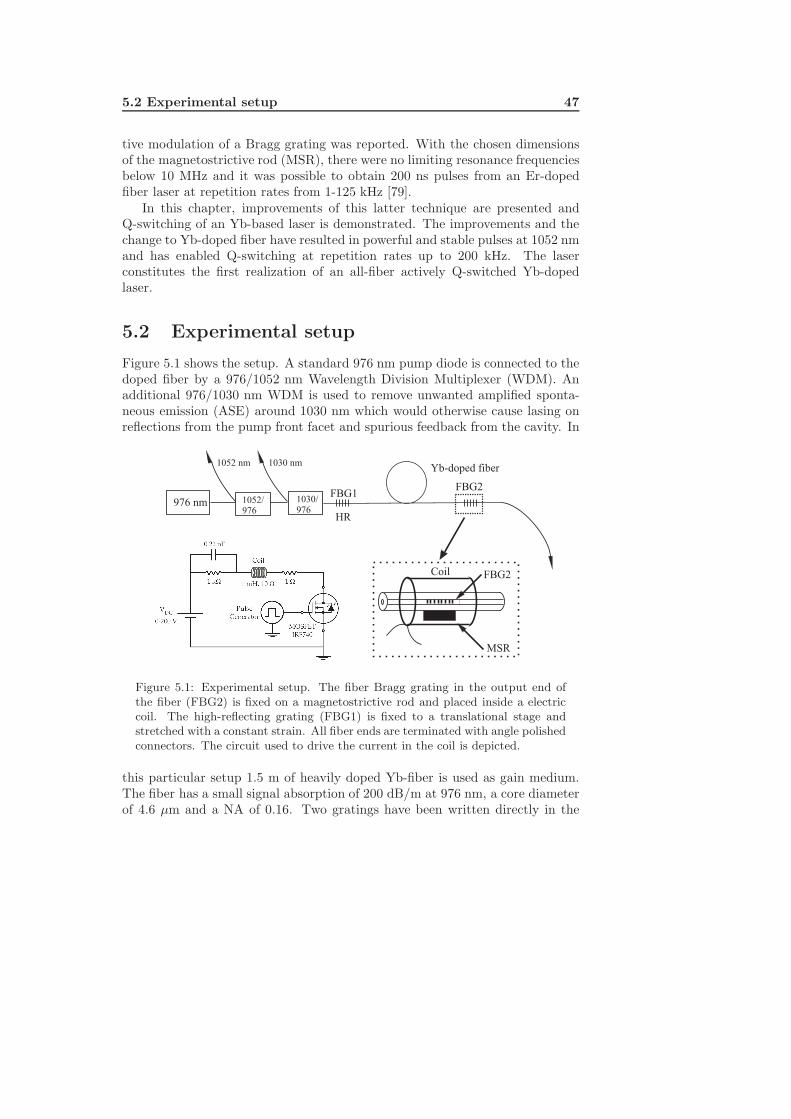
5.2 Experimental setup 47
tive modulation of a Bragg grating was reported. With the chosen dimensionsof the magnetostrictive rod (MSR), there were no limiting resonance frequenciesbelow 10 MHz and it was possible to obtain 200 ns pulses from an Er-dopedfiber laser at repetition rates from 1-125 kHz [79].
In this chapter, improvements of this latter technique are presented andQ-switching of an Yb-based laser is demonstrated. The improvements and thechange to Yb-doped fiber have resulted in powerful and stable pulses at 1052 nmand has enabled Q-switching at repetition rates up to 200 kHz. The laserconstitutes the first realization of an all-fiber actively Q-switched Yb-dopedlaser.
5.2 Experimental setup
Figure 5.1 shows the setup. A standard 976 nm pump diode is connected to thedoped fiber by a 976/1052 nm Wavelength Division Multiplexer (WDM). Anadditional 976/1030 nm WDM is used to remove unwanted amplified sponta-neous emission (ASE) around 1030 nm which would otherwise cause lasing onreflections from the pump front facet and spurious feedback from the cavity. In
Yb-doped fiber
HR
976 nm
1030 nm
Coil
MSR
FBG2
1030/976
1052/976
1052 nm
FBG2FBG1
Figure 5.1: Experimental setup. The fiber Bragg grating in the output end ofthe fiber (FBG2) is fixed on a magnetostrictive rod and placed inside a electriccoil. The high-reflecting grating (FBG1) is fixed to a translational stage andstretched with a constant strain. All fiber ends are terminated with angle polishedconnectors. The circuit used to drive the current in the coil is depicted.
this particular setup 1.5 m of heavily doped Yb-fiber is used as gain medium.The fiber has a small signal absorption of 200 dB/m at 976 nm, a core diameterof 4.6 µm and a NA of 0.16. Two gratings have been written directly in the
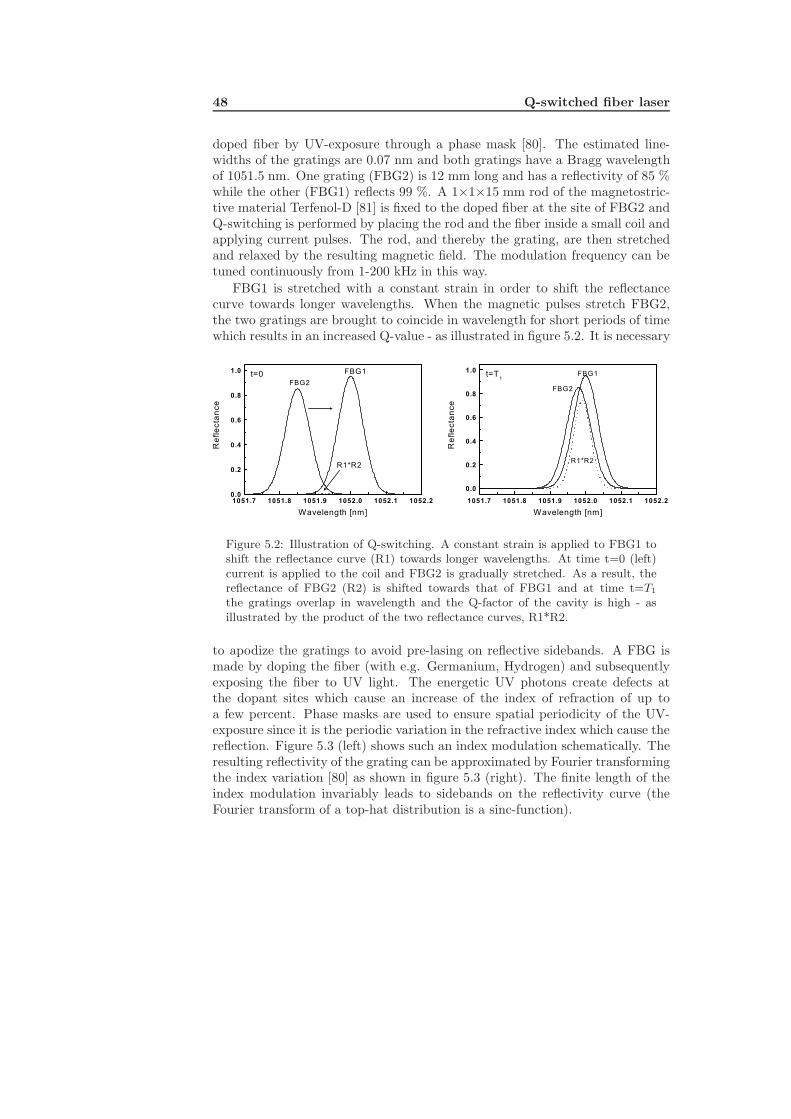
48 Q-switched fiber laser
doped fiber by UV-exposure through a phase mask [80]. The estimated line-widths of the gratings are 0.07 nm and both gratings have a Bragg wavelengthof 1051.5 nm. One grating (FBG2) is 12 mm long and has a reflectivity of 85 %while the other (FBG1) reflects 99 %. A 1×1×15 mm rod of the magnetostric-tive material Terfenol-D [81] is fixed to the doped fiber at the site of FBG2 andQ-switching is performed by placing the rod and the fiber inside a small coil andapplying current pulses. The rod, and thereby the grating, are then stretchedand relaxed by the resulting magnetic field. The modulation frequency can betuned continuously from 1-200 kHz in this way.
FBG1 is stretched with a constant strain in order to shift the reflectancecurve towards longer wavelengths. When the magnetic pulses stretch FBG2,the two gratings are brought to coincide in wavelength for short periods of timewhich results in an increased Q-value - as illustrated in figure 5.2. It is necessary
Figure 5.2: Illustration of Q-switching. A constant strain is applied to FBG1 toshift the reflectance curve (R1) towards longer wavelengths. At time t=0 (left)current is applied to the coil and FBG2 is gradually stretched. As a result, thereflectance of FBG2 (R2) is shifted towards that of FBG1 and at time t=T1
the gratings overlap in wavelength and the Q-factor of the cavity is high - asillustrated by the product of the two reflectance curves, R1*R2.
to apodize the gratings to avoid pre-lasing on reflective sidebands. A FBG ismade by doping the fiber (with e.g. Germanium, Hydrogen) and subsequentlyexposing the fiber to UV light. The energetic UV photons create defects atthe dopant sites which cause an increase of the index of refraction of up toa few percent. Phase masks are used to ensure spatial periodicity of the UV-exposure since it is the periodic variation in the refractive index which cause thereflection. Figure 5.3 (left) shows such an index modulation schematically. Theresulting reflectivity of the grating can be approximated by Fourier transformingthe index variation [80] as shown in figure 5.3 (right). The finite length of theindex modulation invariably leads to sidebands on the reflectivity curve (theFourier transform of a top-hat distribution is a sinc-function).
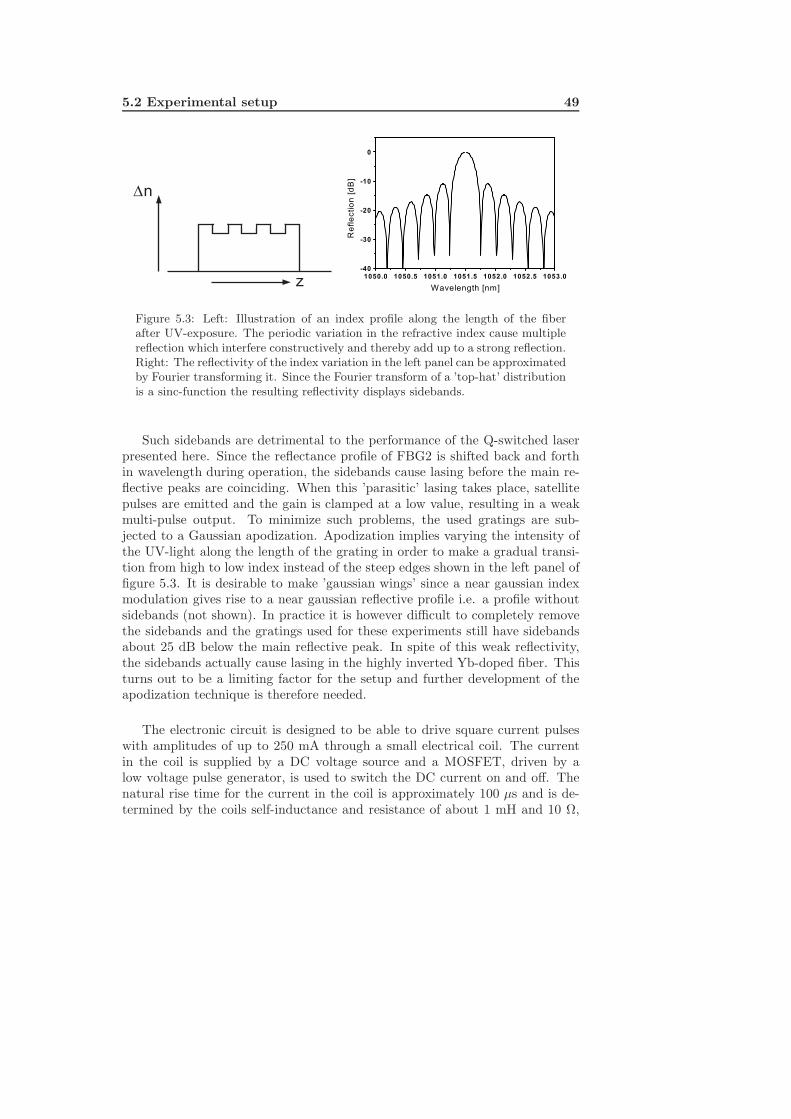
5.2 Experimental setup 49
n
z
Figure 5.3: Left: Illustration of an index profile along the length of the fiberafter UV-exposure. The periodic variation in the refractive index cause multiplereflection which interfere constructively and thereby add up to a strong reflection.Right: The reflectivity of the index variation in the left panel can be approximatedby Fourier transforming it. Since the Fourier transform of a ’top-hat’ distributionis a sinc-function the resulting reflectivity displays sidebands.
Such sidebands are detrimental to the performance of the Q-switched laserpresented here. Since the reflectance profile of FBG2 is shifted back and forthin wavelength during operation, the sidebands cause lasing before the main re-flective peaks are coinciding. When this ’parasitic’ lasing takes place, satellitepulses are emitted and the gain is clamped at a low value, resulting in a weakmulti-pulse output. To minimize such problems, the used gratings are sub-jected to a Gaussian apodization. Apodization implies varying the intensity ofthe UV-light along the length of the grating in order to make a gradual transi-tion from high to low index instead of the steep edges shown in the left panel offigure 5.3. It is desirable to make ’gaussian wings’ since a near gaussian indexmodulation gives rise to a near gaussian reflective profile i.e. a profile withoutsidebands (not shown). In practice it is however difficult to completely removethe sidebands and the gratings used for these experiments still have sidebandsabout 25 dB below the main reflective peak. In spite of this weak reflectivity,the sidebands actually cause lasing in the highly inverted Yb-doped fiber. Thisturns out to be a limiting factor for the setup and further development of theapodization technique is therefore needed.
The electronic circuit is designed to be able to drive square current pulseswith amplitudes of up to 250 mA through a small electrical coil. The currentin the coil is supplied by a DC voltage source and a MOSFET, driven by alow voltage pulse generator, is used to switch the DC current on and off. Thenatural rise time for the current in the coil is approximately 100 µs and is de-termined by the coils self-inductance and resistance of about 1 mH and 10 Ω,
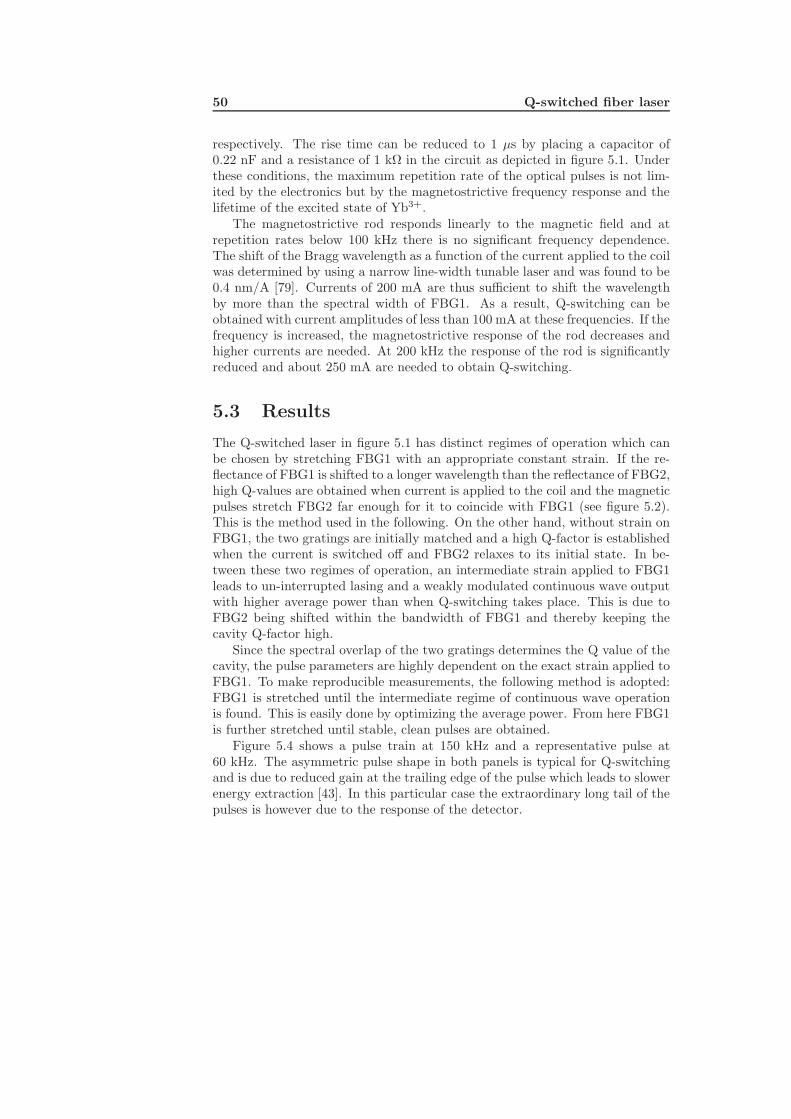
50 Q-switched fiber laser
respectively. The rise time can be reduced to 1 µs by placing a capacitor of0.22 nF and a resistance of 1 kΩ in the circuit as depicted in figure 5.1. Underthese conditions, the maximum repetition rate of the optical pulses is not lim-ited by the electronics but by the magnetostrictive frequency response and thelifetime of the excited state of Yb3+.
The magnetostrictive rod responds linearly to the magnetic field and atrepetition rates below 100 kHz there is no significant frequency dependence.The shift of the Bragg wavelength as a function of the current applied to the coilwas determined by using a narrow line-width tunable laser and was found to be0.4 nm/A [79]. Currents of 200 mA are thus sufficient to shift the wavelengthby more than the spectral width of FBG1. As a result, Q-switching can beobtained with current amplitudes of less than 100 mA at these frequencies. If thefrequency is increased, the magnetostrictive response of the rod decreases andhigher currents are needed. At 200 kHz the response of the rod is significantlyreduced and about 250 mA are needed to obtain Q-switching.
5.3 Results
The Q-switched laser in figure 5.1 has distinct regimes of operation which canbe chosen by stretching FBG1 with an appropriate constant strain. If the re-flectance of FBG1 is shifted to a longer wavelength than the reflectance of FBG2,high Q-values are obtained when current is applied to the coil and the magneticpulses stretch FBG2 far enough for it to coincide with FBG1 (see figure 5.2).This is the method used in the following. On the other hand, without strain onFBG1, the two gratings are initially matched and a high Q-factor is establishedwhen the current is switched off and FBG2 relaxes to its initial state. In be-tween these two regimes of operation, an intermediate strain applied to FBG1leads to un-interrupted lasing and a weakly modulated continuous wave outputwith higher average power than when Q-switching takes place. This is due toFBG2 being shifted within the bandwidth of FBG1 and thereby keeping thecavity Q-factor high.
Since the spectral overlap of the two gratings determines the Q value of thecavity, the pulse parameters are highly dependent on the exact strain applied toFBG1. To make reproducible measurements, the following method is adopted:FBG1 is stretched until the intermediate regime of continuous wave operationis found. This is easily done by optimizing the average power. From here FBG1is further stretched until stable, clean pulses are obtained.
Figure 5.4 shows a pulse train at 150 kHz and a representative pulse at60 kHz. The asymmetric pulse shape in both panels is typical for Q-switchingand is due to reduced gain at the trailing edge of the pulse which leads to slowerenergy extraction [43]. In this particular case the extraordinary long tail of thepulses is however due to the response of the detector.
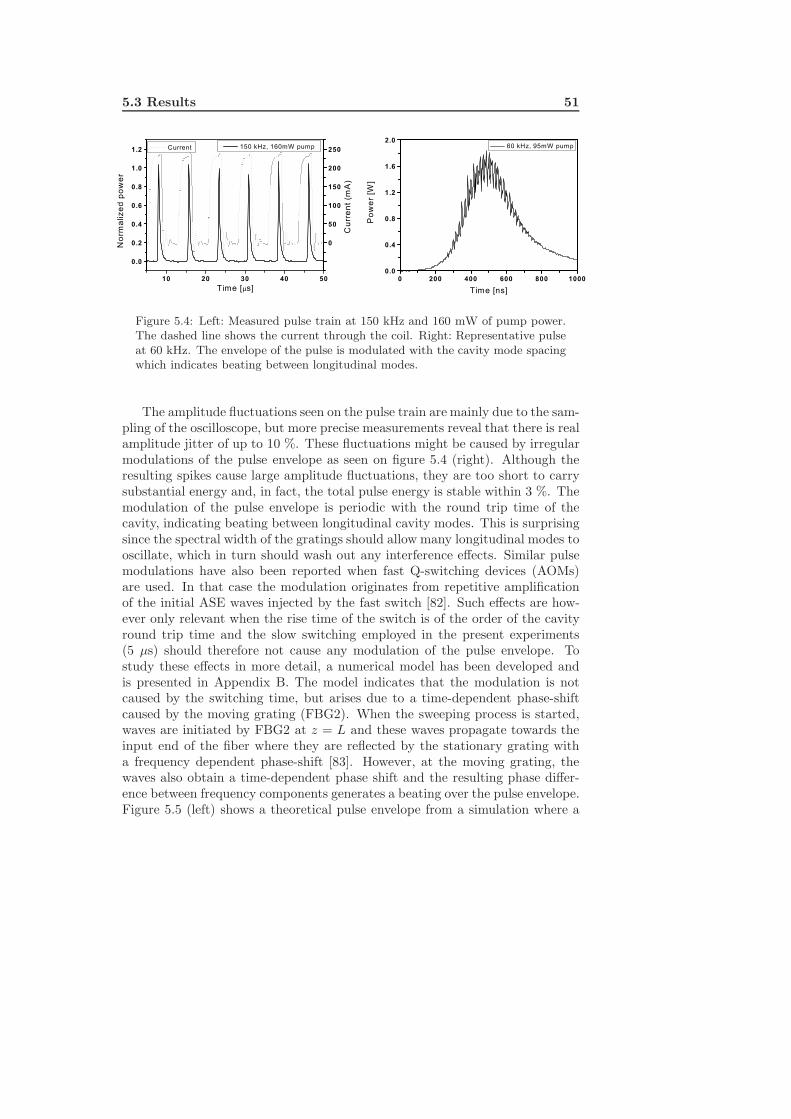
5.3 Results 51
Figure 5.4: Left: Measured pulse train at 150 kHz and 160 mW of pump power.The dashed line shows the current through the coil. Right: Representative pulseat 60 kHz. The envelope of the pulse is modulated with the cavity mode spacingwhich indicates beating between longitudinal modes.
The amplitude fluctuations seen on the pulse train are mainly due to the sam-pling of the oscilloscope, but more precise measurements reveal that there is realamplitude jitter of up to 10 %. These fluctuations might be caused by irregularmodulations of the pulse envelope as seen on figure 5.4 (right). Although theresulting spikes cause large amplitude fluctuations, they are too short to carrysubstantial energy and, in fact, the total pulse energy is stable within 3 %. Themodulation of the pulse envelope is periodic with the round trip time of thecavity, indicating beating between longitudinal cavity modes. This is surprisingsince the spectral width of the gratings should allow many longitudinal modes tooscillate, which in turn should wash out any interference effects. Similar pulsemodulations have also been reported when fast Q-switching devices (AOMs)are used. In that case the modulation originates from repetitive amplificationof the initial ASE waves injected by the fast switch [82]. Such effects are how-ever only relevant when the rise time of the switch is of the order of the cavityround trip time and the slow switching employed in the present experiments(5 µs) should therefore not cause any modulation of the pulse envelope. Tostudy these effects in more detail, a numerical model has been developed andis presented in Appendix B. The model indicates that the modulation is notcaused by the switching time, but arises due to a time-dependent phase-shiftcaused by the moving grating (FBG2). When the sweeping process is started,waves are initiated by FBG2 at z = L and these waves propagate towards theinput end of the fiber where they are reflected by the stationary grating witha frequency dependent phase-shift [83]. However, at the moving grating, thewaves also obtain a time-dependent phase shift and the resulting phase differ-ence between frequency components generates a beating over the pulse envelope.Figure 5.5 (left) shows a theoretical pulse envelope from a simulation where a
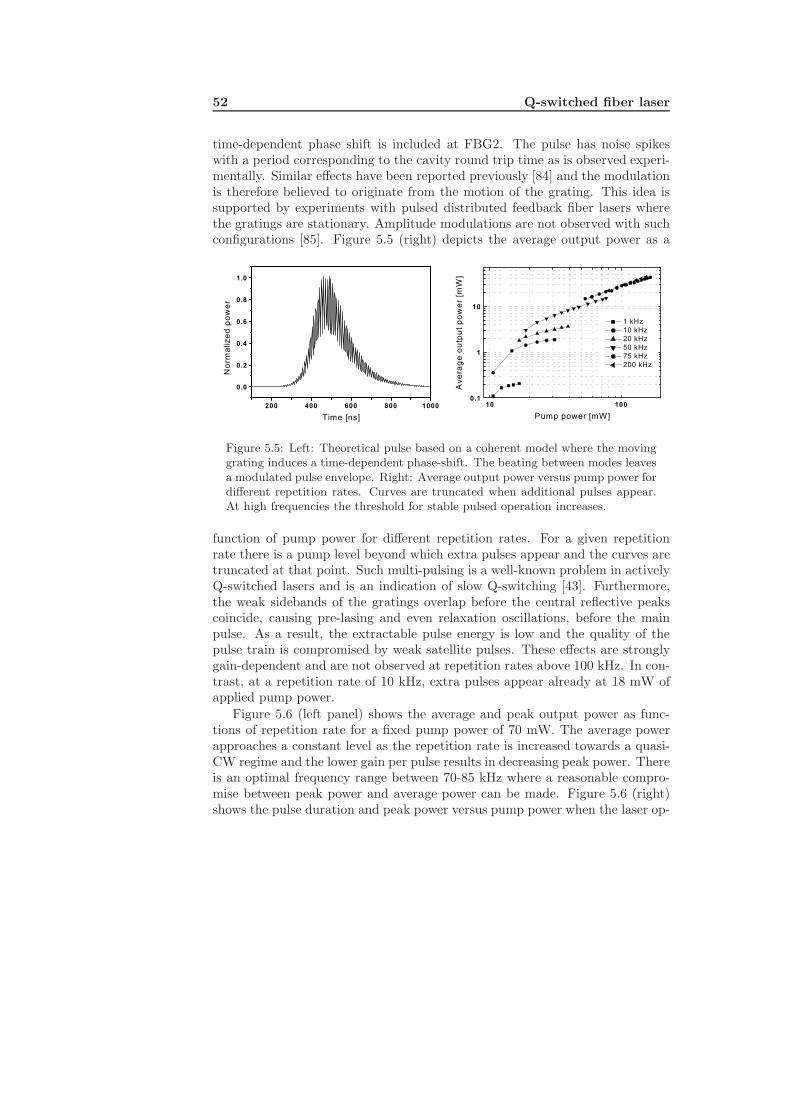
52 Q-switched fiber laser
time-dependent phase shift is included at FBG2. The pulse has noise spikeswith a period corresponding to the cavity round trip time as is observed experi-mentally. Similar effects have been reported previously [84] and the modulationis therefore believed to originate from the motion of the grating. This idea issupported by experiments with pulsed distributed feedback fiber lasers wherethe gratings are stationary. Amplitude modulations are not observed with suchconfigurations [85]. Figure 5.5 (right) depicts the average output power as a
Figure 5.5: Left: Theoretical pulse based on a coherent model where the movinggrating induces a time-dependent phase-shift. The beating between modes leavesa modulated pulse envelope. Right: Average output power versus pump power fordifferent repetition rates. Curves are truncated when additional pulses appear.At high frequencies the threshold for stable pulsed operation increases.
function of pump power for different repetition rates. For a given repetitionrate there is a pump level beyond which extra pulses appear and the curves aretruncated at that point. Such multi-pulsing is a well-known problem in activelyQ-switched lasers and is an indication of slow Q-switching [43]. Furthermore,the weak sidebands of the gratings overlap before the central reflective peakscoincide, causing pre-lasing and even relaxation oscillations, before the mainpulse. As a result, the extractable pulse energy is low and the quality of thepulse train is compromised by weak satellite pulses. These effects are stronglygain-dependent and are not observed at repetition rates above 100 kHz. In con-trast, at a repetition rate of 10 kHz, extra pulses appear already at 18 mW ofapplied pump power.
Figure 5.6 (left panel) shows the average and peak output power as func-tions of repetition rate for a fixed pump power of 70 mW. The average powerapproaches a constant level as the repetition rate is increased towards a quasi-CW regime and the lower gain per pulse results in decreasing peak power. Thereis an optimal frequency range between 70-85 kHz where a reasonable compro-mise between peak power and average power can be made. Figure 5.6 (right)shows the pulse duration and peak power versus pump power when the laser op-
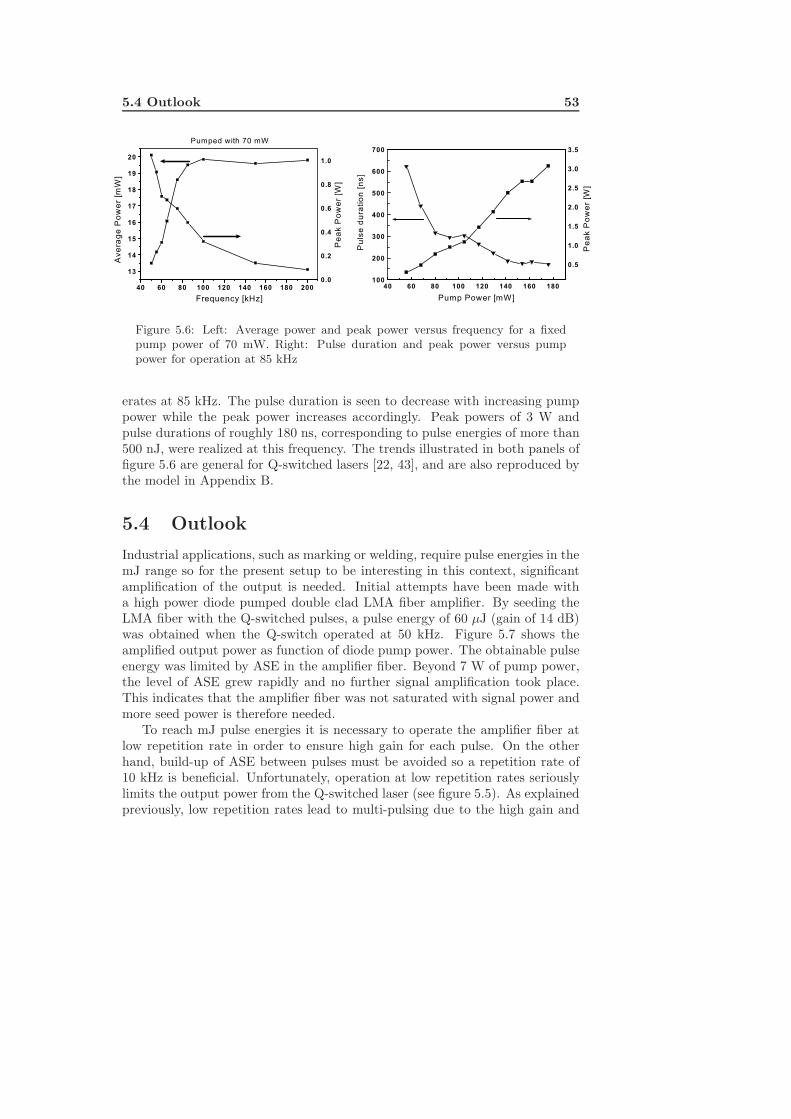
5.4 Outlook 53
Figure 5.6: Left: Average power and peak power versus frequency for a fixedpump power of 70 mW. Right: Pulse duration and peak power versus pumppower for operation at 85 kHz
erates at 85 kHz. The pulse duration is seen to decrease with increasing pumppower while the peak power increases accordingly. Peak powers of 3 W andpulse durations of roughly 180 ns, corresponding to pulse energies of more than500 nJ, were realized at this frequency. The trends illustrated in both panels offigure 5.6 are general for Q-switched lasers [22, 43], and are also reproduced bythe model in Appendix B.
5.4 Outlook
Industrial applications, such as marking or welding, require pulse energies in themJ range so for the present setup to be interesting in this context, significantamplification of the output is needed. Initial attempts have been made witha high power diode pumped double clad LMA fiber amplifier. By seeding theLMA fiber with the Q-switched pulses, a pulse energy of 60 µJ (gain of 14 dB)was obtained when the Q-switch operated at 50 kHz. Figure 5.7 shows theamplified output power as function of diode pump power. The obtainable pulseenergy was limited by ASE in the amplifier fiber. Beyond 7 W of pump power,the level of ASE grew rapidly and no further signal amplification took place.This indicates that the amplifier fiber was not saturated with signal power andmore seed power is therefore needed.
To reach mJ pulse energies it is necessary to operate the amplifier fiber atlow repetition rate in order to ensure high gain for each pulse. On the otherhand, build-up of ASE between pulses must be avoided so a repetition rate of10 kHz is beneficial. Unfortunately, operation at low repetition rates seriouslylimits the output power from the Q-switched laser (see figure 5.5). As explainedpreviously, low repetition rates lead to multi-pulsing due to the high gain and
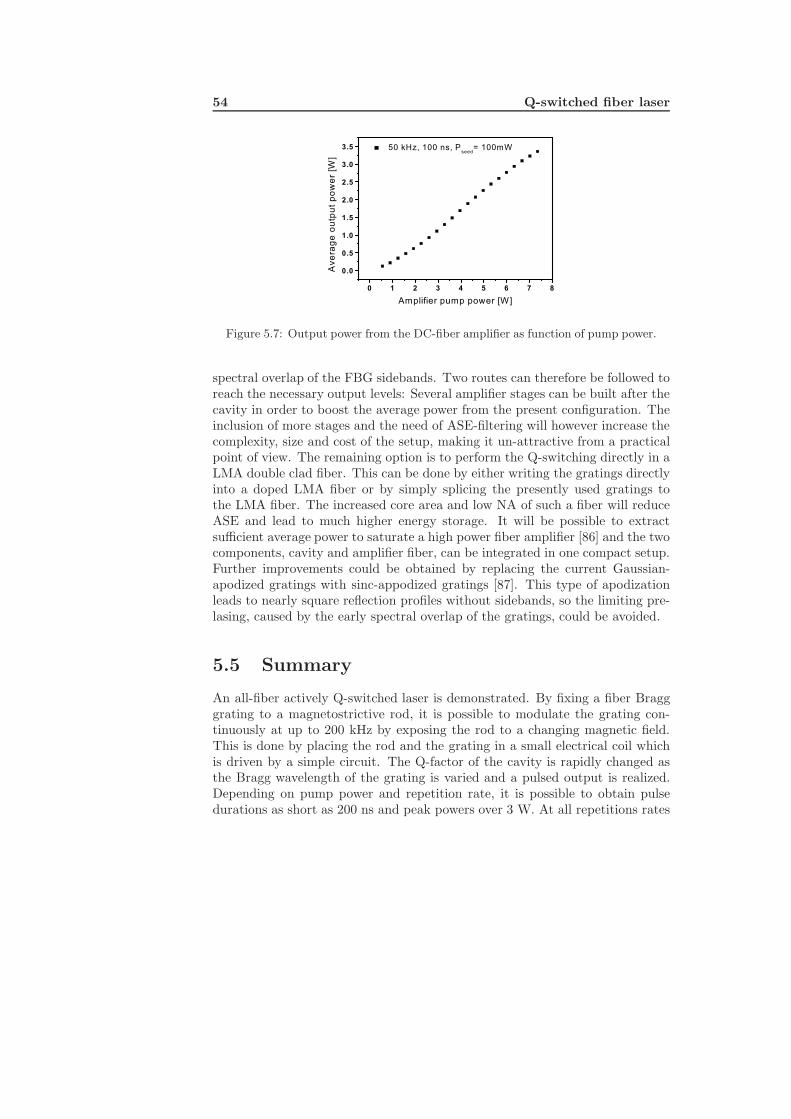
54 Q-switched fiber laser
Figure 5.7: Output power from the DC-fiber amplifier as function of pump power.
spectral overlap of the FBG sidebands. Two routes can therefore be followed toreach the necessary output levels: Several amplifier stages can be built after thecavity in order to boost the average power from the present configuration. Theinclusion of more stages and the need of ASE-filtering will however increase thecomplexity, size and cost of the setup, making it un-attractive from a practicalpoint of view. The remaining option is to perform the Q-switching directly in aLMA double clad fiber. This can be done by either writing the gratings directlyinto a doped LMA fiber or by simply splicing the presently used gratings tothe LMA fiber. The increased core area and low NA of such a fiber will reduceASE and lead to much higher energy storage. It will be possible to extractsufficient average power to saturate a high power fiber amplifier [86] and the twocomponents, cavity and amplifier fiber, can be integrated in one compact setup.Further improvements could be obtained by replacing the current Gaussian-apodized gratings with sinc-appodized gratings [87]. This type of apodizationleads to nearly square reflection profiles without sidebands, so the limiting pre-lasing, caused by the early spectral overlap of the gratings, could be avoided.
5.5 Summary
An all-fiber actively Q-switched laser is demonstrated. By fixing a fiber Bragggrating to a magnetostrictive rod, it is possible to modulate the grating con-tinuously at up to 200 kHz by exposing the rod to a changing magnetic field.This is done by placing the rod and the grating in a small electrical coil whichis driven by a simple circuit. The Q-factor of the cavity is rapidly changed asthe Bragg wavelength of the grating is varied and a pulsed output is realized.Depending on pump power and repetition rate, it is possible to obtain pulsedurations as short as 200 ns and peak powers over 3 W. At all repetitions rates
5.5 Summary 55
there are pulse amplitude fluctuations of about 10 % due to beating betweenlongitudinal modes. The resulting spikes are short and carry very little energyand the pulse-energy fluctuations are therefore small (3 %).
Amplification of the pulsed output in a high power double clad LMA fiberresulted in 60 µJ pulses but the seed power was not sufficiently high to saturatethe amplifier. Consequently, further power scaling depends on the ability togenerate more seed power. The output from the Q-switched laser is limited byASE and pre-lasing which lowers the gain and constrains the applicable pumppower.
It would be interesting to use this technique to Q-switch a LMA fiber.The increased energy storage would allow better power extraction and provideenough seed for a power amplifier. Further research will reveal whether thisconcept can deliver sufficient pulse energy to address industrial applications.

56 Q-switched fiber laser
Chapter 6
Fiber dispersion measurements
with white-light interferometry
A compact and user friendly setup for dispersion measurement, based on thewhite-light-interferometry spectral technique, is presented. The setup was madeon request from NKT-Research and is now used to characterize the productsfrom Koheras and Crystal Fibre. The work was done in collaboration withCarsten Krogh Nielsen.
57
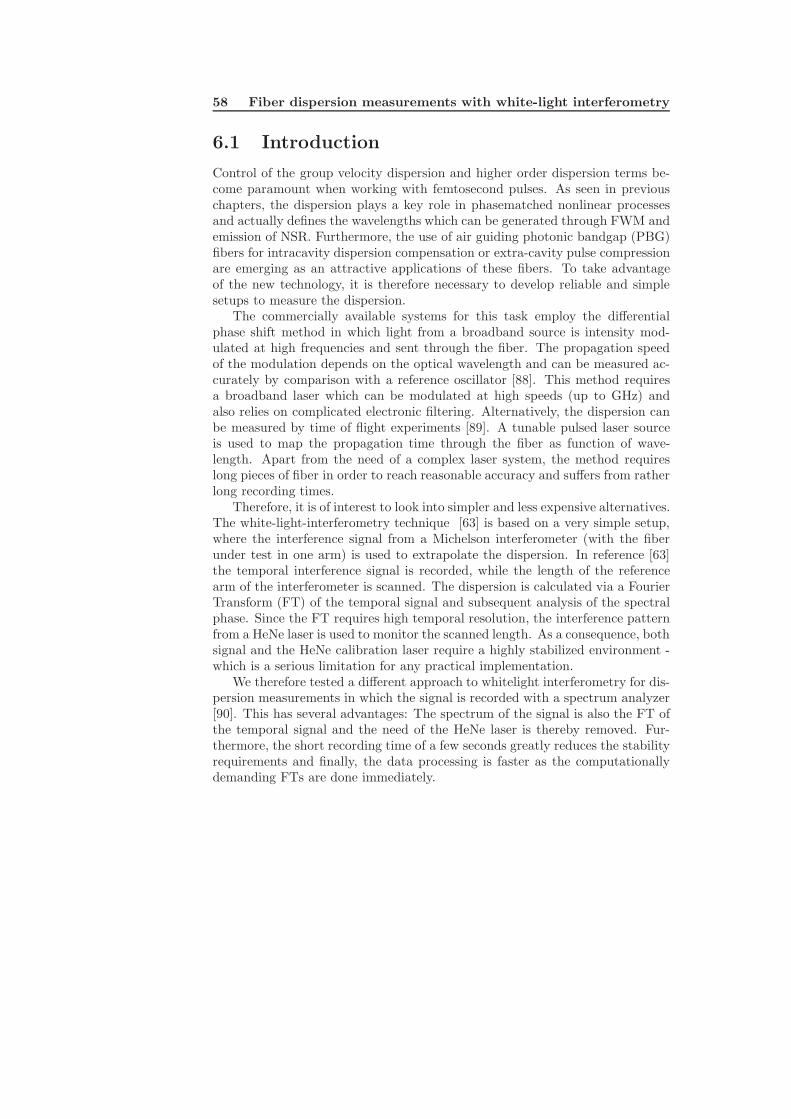
58 Fiber dispersion measurements with white-light interferometry
6.1 Introduction
Control of the group velocity dispersion and higher order dispersion terms be-come paramount when working with femtosecond pulses. As seen in previouschapters, the dispersion plays a key role in phasematched nonlinear processesand actually defines the wavelengths which can be generated through FWM andemission of NSR. Furthermore, the use of air guiding photonic bandgap (PBG)fibers for intracavity dispersion compensation or extra-cavity pulse compressionare emerging as an attractive applications of these fibers. To take advantageof the new technology, it is therefore necessary to develop reliable and simplesetups to measure the dispersion.
The commercially available systems for this task employ the differentialphase shift method in which light from a broadband source is intensity mod-ulated at high frequencies and sent through the fiber. The propagation speedof the modulation depends on the optical wavelength and can be measured ac-curately by comparison with a reference oscillator [88]. This method requiresa broadband laser which can be modulated at high speeds (up to GHz) andalso relies on complicated electronic filtering. Alternatively, the dispersion canbe measured by time of flight experiments [89]. A tunable pulsed laser sourceis used to map the propagation time through the fiber as function of wave-length. Apart from the need of a complex laser system, the method requireslong pieces of fiber in order to reach reasonable accuracy and suffers from ratherlong recording times.
Therefore, it is of interest to look into simpler and less expensive alternatives.The white-light-interferometry technique [63] is based on a very simple setup,where the interference signal from a Michelson interferometer (with the fiberunder test in one arm) is used to extrapolate the dispersion. In reference [63]the temporal interference signal is recorded, while the length of the referencearm of the interferometer is scanned. The dispersion is calculated via a FourierTransform (FT) of the temporal signal and subsequent analysis of the spectralphase. Since the FT requires high temporal resolution, the interference patternfrom a HeNe laser is used to monitor the scanned length. As a consequence, bothsignal and the HeNe calibration laser require a highly stabilized environment -which is a serious limitation for any practical implementation.
We therefore tested a different approach to whitelight interferometry for dis-persion measurements in which the signal is recorded with a spectrum analyzer[90]. This has several advantages: The spectrum of the signal is also the FT ofthe temporal signal and the need of the HeNe laser is thereby removed. Fur-thermore, the short recording time of a few seconds greatly reduces the stabilityrequirements and finally, the data processing is faster as the computationallydemanding FTs are done immediately.
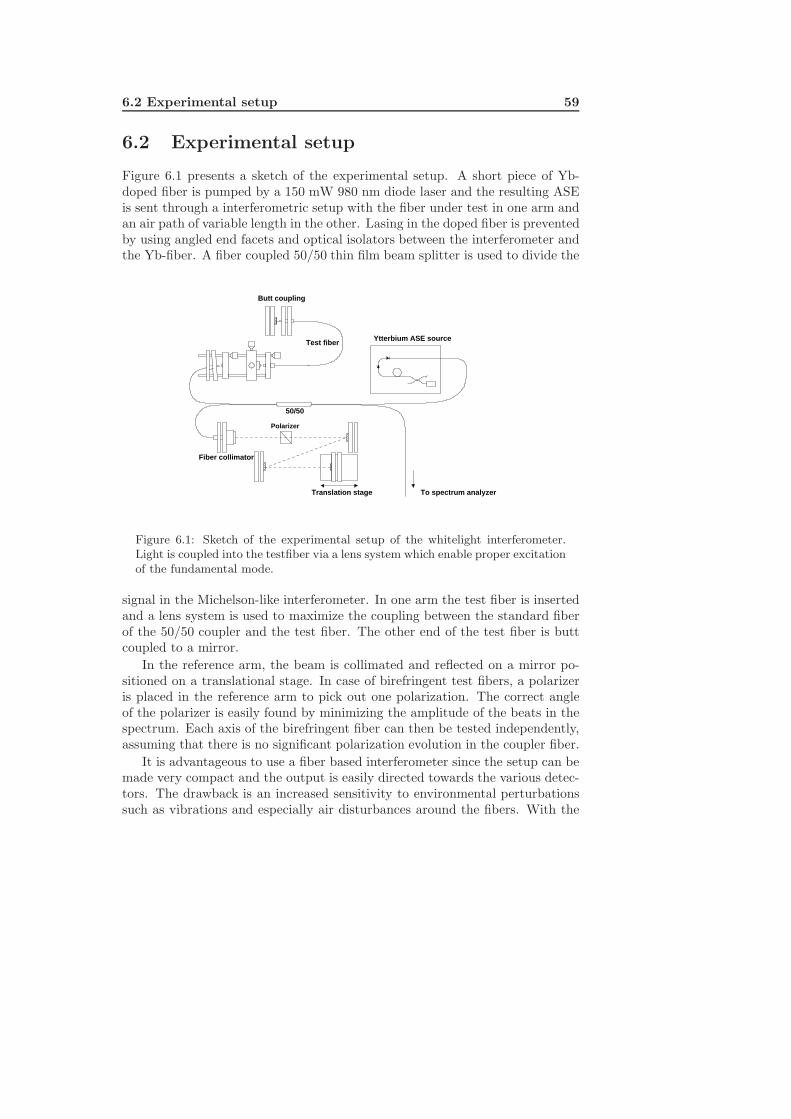
6.2 Experimental setup 59
6.2 Experimental setup
Figure 6.1 presents a sketch of the experimental setup. A short piece of Yb-doped fiber is pumped by a 150 mW 980 nm diode laser and the resulting ASEis sent through a interferometric setup with the fiber under test in one arm andan air path of variable length in the other. Lasing in the doped fiber is preventedby using angled end facets and optical isolators between the interferometer andthe Yb-fiber. A fiber coupled 50/50 thin film beam splitter is used to divide the
Fiber collimator
50/50
Butt coupling
To spectrum analyzer
Test fiber
Polarizer
Translation stage
Ytterbium ASE source
Figure 6.1: Sketch of the experimental setup of the whitelight interferometer.Light is coupled into the testfiber via a lens system which enable proper excitationof the fundamental mode.
signal in the Michelson-like interferometer. In one arm the test fiber is insertedand a lens system is used to maximize the coupling between the standard fiberof the 50/50 coupler and the test fiber. The other end of the test fiber is buttcoupled to a mirror.
In the reference arm, the beam is collimated and reflected on a mirror po-sitioned on a translational stage. In case of birefringent test fibers, a polarizeris placed in the reference arm to pick out one polarization. The correct angleof the polarizer is easily found by minimizing the amplitude of the beats in thespectrum. Each axis of the birefringent fiber can then be tested independently,assuming that there is no significant polarization evolution in the coupler fiber.
It is advantageous to use a fiber based interferometer since the setup can bemade very compact and the output is easily directed towards the various detec-tors. The drawback is an increased sensitivity to environmental perturbationssuch as vibrations and especially air disturbances around the fibers. With the
60 Fiber dispersion measurements with white-light interferometry
fiber lying freely, phase fluctuations of 2π occur on a timescale of a few hun-dred milliseconds, but by placing the setup in an air tight box, the few-secondsmeasurements can be made with a stable phase.
6.3 Theory
Let Er and Ef be the electric fields of the reference arm and fiber arm at theoutput of the interferometer
Er = E0,r exp(ik2d− iωt)Ef = E0,f exp(iβ2L − iωt + iφ0)
where L is the length of the test fiber and d is the length of the air path in thereference arm. β and k = ω
c are the propagation constants in the fiber and airpath respectively and φ0 is any relative phase difference that may appear dueto unbalanced arms in the interferometer.The intensity measured by the detector in the spectrometer is then given by
I(ω) = |E0,r|2 + |E0,f |2 + 2E0,fE0,r cos(φ(ω)) (6.1)
where φ(ω) = φ0(ω) + 2[β(ω)L − ωc d]. By expanding the propagation constant
around a center frequency ω0, we get the following expression for φ(ω)
φ(ω) = φ0(ω) + 2[β(ω0)L − ω0
cd + [L
∂β
∂ω(ω0) − d
c](ω − ω0)
+L
2∂2β
∂ω2(ω0)(ω − ω0)2 +
L
6∂3β
∂ω3(ω0)(ω − ω0)3 + .... ] (6.2)
φ(ω) can be constructed from the spectral interference pattern by noting thateach peak of the fringe pattern implies a phase increase of 2π. The group velocitydispersion (GVD), ∂2β
∂ω2 is then calculated by making a suitable polynomial fitto the found phase and deriving it twice:
β2(ω) ≡ ∂2β(ω)∂ω2
=1
2L[∂2φ(ω)
∂ω2− ∂2φ0(ω)
∂ω2] (6.3)
The GVD from the components of the setup, ∂2φ0(ω)∂ω2 is easily removed by making
a background measurement without a test fiber inserted. As before the phaseis reconstructed and a polynomial fit is used to calculate the second derivativenow given by
∂2φ(ω)∂ω2
=∂2φ0(ω)
∂ω2(6.4)
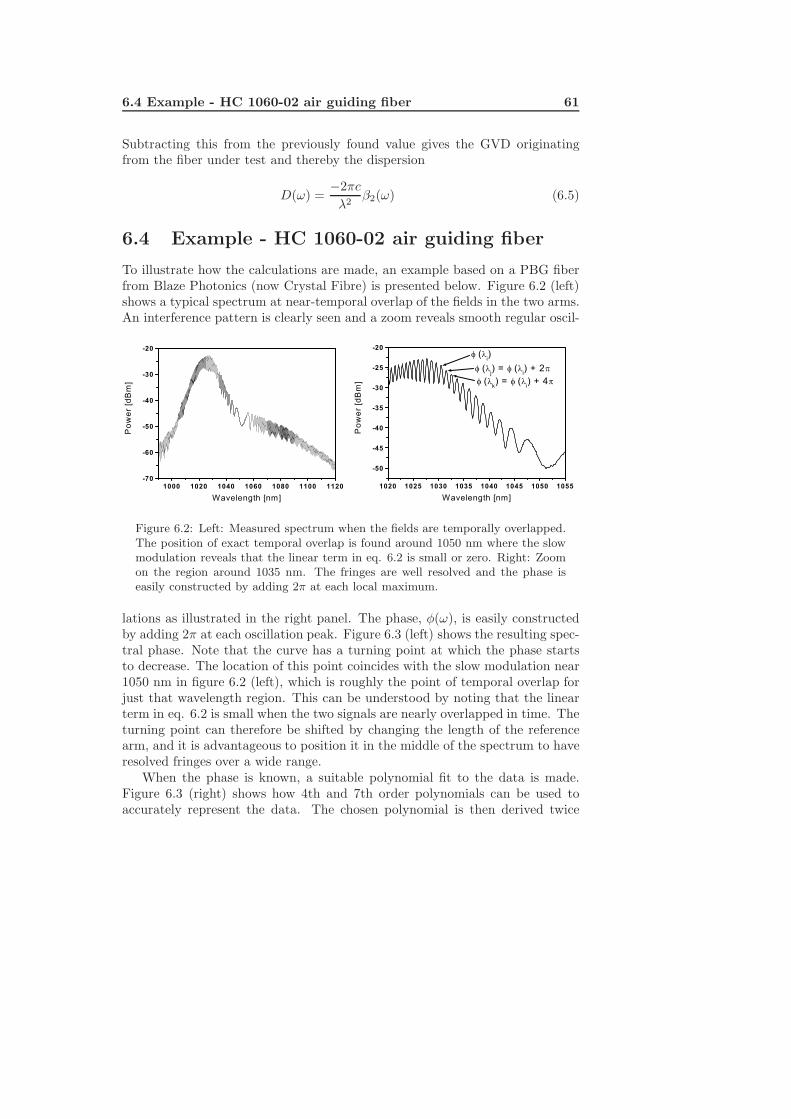
6.4 Example - HC 1060-02 air guiding fiber 61
Subtracting this from the previously found value gives the GVD originatingfrom the fiber under test and thereby the dispersion
D(ω) =−2πc
λ2β2(ω) (6.5)
6.4 Example - HC 1060-02 air guiding fiber
To illustrate how the calculations are made, an example based on a PBG fiberfrom Blaze Photonics (now Crystal Fibre) is presented below. Figure 6.2 (left)shows a typical spectrum at near-temporal overlap of the fields in the two arms.An interference pattern is clearly seen and a zoom reveals smooth regular oscil-
Figure 6.2: Left: Measured spectrum when the fields are temporally overlapped.The position of exact temporal overlap is found around 1050 nm where the slowmodulation reveals that the linear term in eq. 6.2 is small or zero. Right: Zoomon the region around 1035 nm. The fringes are well resolved and the phase iseasily constructed by adding 2π at each local maximum.
lations as illustrated in the right panel. The phase, φ(ω), is easily constructedby adding 2π at each oscillation peak. Figure 6.3 (left) shows the resulting spec-tral phase. Note that the curve has a turning point at which the phase startsto decrease. The location of this point coincides with the slow modulation near1050 nm in figure 6.2 (left), which is roughly the point of temporal overlap forjust that wavelength region. This can be understood by noting that the linearterm in eq. 6.2 is small when the two signals are nearly overlapped in time. Theturning point can therefore be shifted by changing the length of the referencearm, and it is advantageous to position it in the middle of the spectrum to haveresolved fringes over a wide range.
When the phase is known, a suitable polynomial fit to the data is made.Figure 6.3 (right) shows how 4th and 7th order polynomials can be used toaccurately represent the data. The chosen polynomial is then derived twice
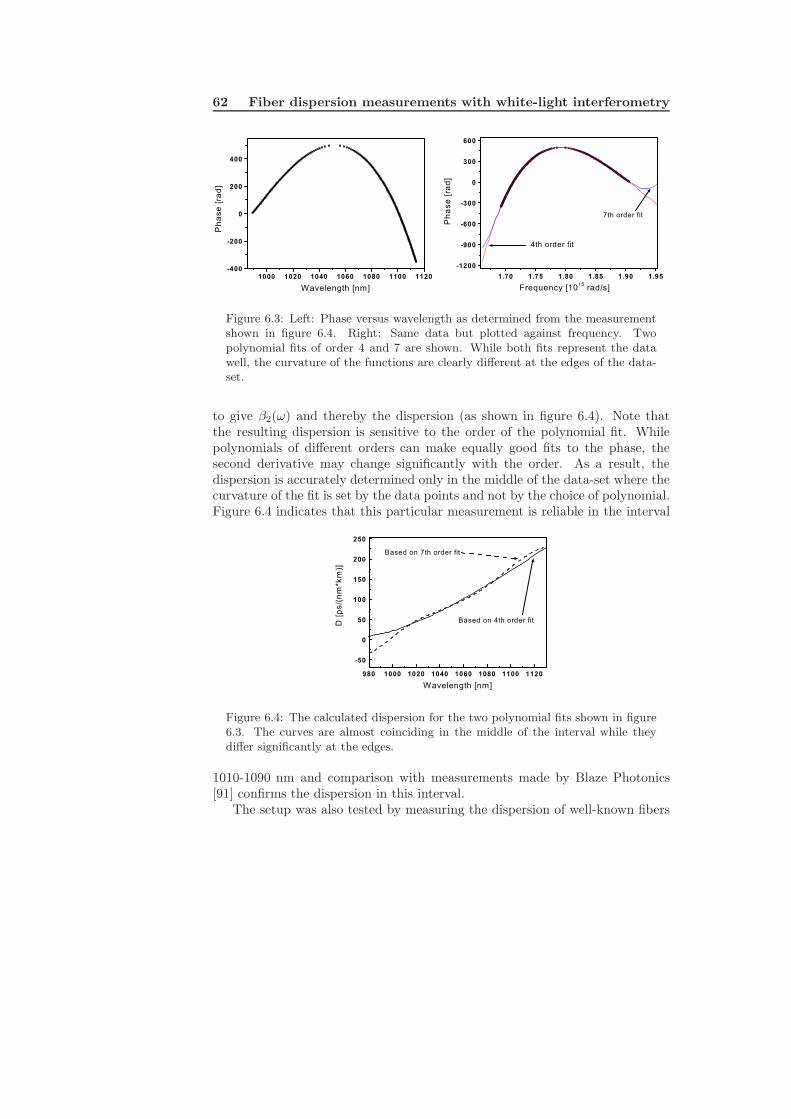
62 Fiber dispersion measurements with white-light interferometry
Figure 6.3: Left: Phase versus wavelength as determined from the measurementshown in figure 6.4. Right: Same data but plotted against frequency. Twopolynomial fits of order 4 and 7 are shown. While both fits represent the datawell, the curvature of the functions are clearly different at the edges of the data-set.
to give β2(ω) and thereby the dispersion (as shown in figure 6.4). Note thatthe resulting dispersion is sensitive to the order of the polynomial fit. Whilepolynomials of different orders can make equally good fits to the phase, thesecond derivative may change significantly with the order. As a result, thedispersion is accurately determined only in the middle of the data-set where thecurvature of the fit is set by the data points and not by the choice of polynomial.Figure 6.4 indicates that this particular measurement is reliable in the interval
Figure 6.4: The calculated dispersion for the two polynomial fits shown in figure6.3. The curves are almost coinciding in the middle of the interval while theydiffer significantly at the edges.
1010-1090 nm and comparison with measurements made by Blaze Photonics[91] confirms the dispersion in this interval.
The setup was also tested by measuring the dispersion of well-known fibers
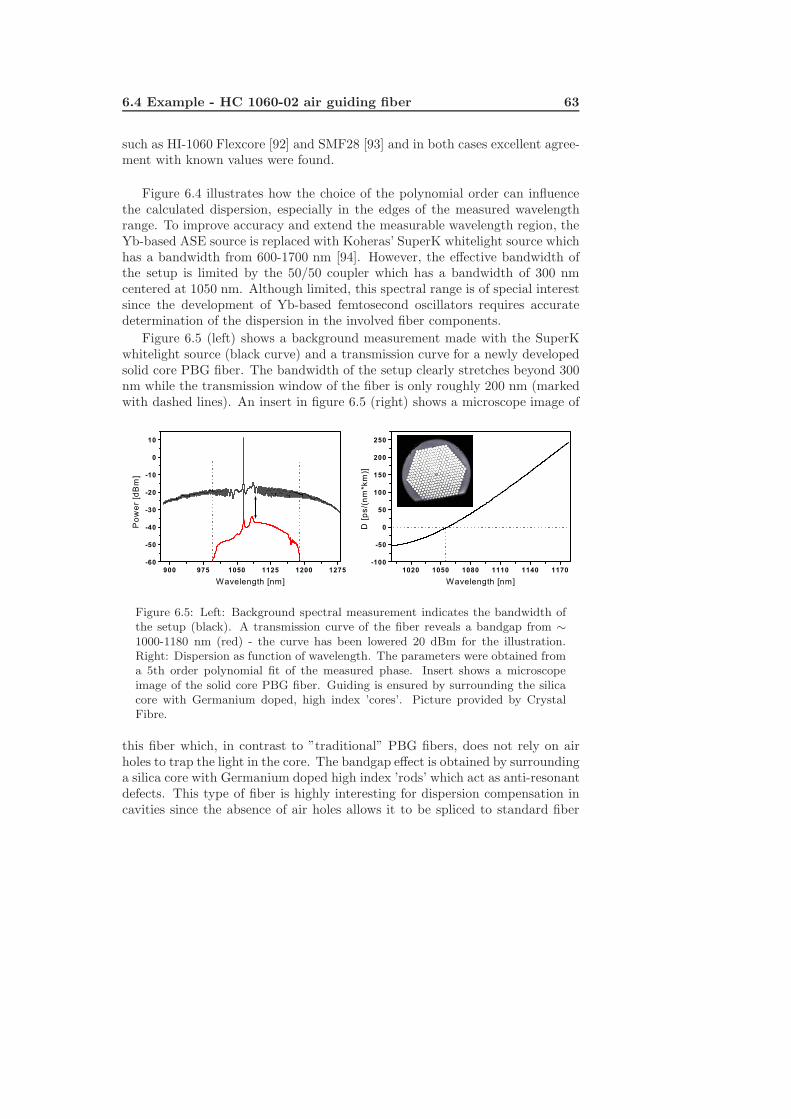
6.4 Example - HC 1060-02 air guiding fiber 63
such as HI-1060 Flexcore [92] and SMF28 [93] and in both cases excellent agree-ment with known values were found.
Figure 6.4 illustrates how the choice of the polynomial order can influencethe calculated dispersion, especially in the edges of the measured wavelengthrange. To improve accuracy and extend the measurable wavelength region, theYb-based ASE source is replaced with Koheras’ SuperK whitelight source whichhas a bandwidth from 600-1700 nm [94]. However, the effective bandwidth ofthe setup is limited by the 50/50 coupler which has a bandwidth of 300 nmcentered at 1050 nm. Although limited, this spectral range is of special interestsince the development of Yb-based femtosecond oscillators requires accuratedetermination of the dispersion in the involved fiber components.
Figure 6.5 (left) shows a background measurement made with the SuperKwhitelight source (black curve) and a transmission curve for a newly developedsolid core PBG fiber. The bandwidth of the setup clearly stretches beyond 300nm while the transmission window of the fiber is only roughly 200 nm (markedwith dashed lines). An insert in figure 6.5 (right) shows a microscope image of
Figure 6.5: Left: Background spectral measurement indicates the bandwidth ofthe setup (black). A transmission curve of the fiber reveals a bandgap from ∼1000-1180 nm (red) - the curve has been lowered 20 dBm for the illustration.Right: Dispersion as function of wavelength. The parameters were obtained froma 5th order polynomial fit of the measured phase. Insert shows a microscopeimage of the solid core PBG fiber. Guiding is ensured by surrounding the silicacore with Germanium doped, high index ’cores’. Picture provided by CrystalFibre.
this fiber which, in contrast to ”traditional” PBG fibers, does not rely on airholes to trap the light in the core. The bandgap effect is obtained by surroundinga silica core with Germanium doped high index ’rods’ which act as anti-resonantdefects. This type of fiber is highly interesting for dispersion compensation incavities since the absence of air holes allows it to be spliced to standard fiber
64 Fiber dispersion measurements with white-light interferometry
components [95]. The obtained fiber dispersion is shown in the right panel offigure 6.5.
6.5 Summary
Fiber dispersion is a critical parameter when working with ultrashort pulses andcareful characterization is necessary if nonlinear devices or laser oscillators arebased on fiber components. Through spectral analysis of the output from a sim-ple Michelson-interferometer, the dispersion in a test fiber can be extrapolatedby simple calculations. By implementing a PCF-based white light source, accu-racy as well as bandwidth are enhanced and characterization in the importantYb-window is possible. The setup has been used to characterize various typesof fiber and is now routinely used at NKT-Research.
Chapter 7
Dual-wavelength pumping of
photonic crystal fibers
Two-pump super continuum generation in PCFs is described and the dual-pumping scheme is shown to increase the spectral bandwidth in the visible. Asimilar setup is used in the SuperK whitelight source from Koheras, so properunderstanding of the process is useful for further development of this type oflight source.
65
66 Dual-wavelength pumping of photonic crystal fibers
7.1 Introduction
Usually SCG in microstructured fibers has been obtained by pumping the fiberin the anomalous dispersion regime where fission of solitons provides a widespectrum through SPM, Raman-scattering and FWM. The fission of a higherorder soliton into its constituent fundamental solitons also gives rise to growthof dispersive waves which are often found deep in the visible [2]. However, it wasrecently reported that extraordinary wide and flat spectra could be obtained inthe visible by simultaneously pumping a PCF in the normal and anomalousregime with picosecond pulses [96]. By co-propagating the second harmonic(SH) at 532 nm and the fundamental at 1064 nm it was found that the discreteRaman lines in the visible were smoothened out, resulting in a flat spectrum cen-tered at 532 nm. This was believed to origin from an arrest of stimulated Ramanscattering (SRS) due to a four wave mixing (FWM) process which, in case ofphasematching, has higher gain [12]. The demonstration of a broadband visiblelight source with a simple setup, spurred interest in dual-wavelength pumping ofphotonic crystal fibers and it was later suggested that co-propagating two fem-tosecond pulses could lead to significant spectral broadening of the SH pulse dueto cross phase modulation (XPM) imposed by fundamental solitons [36]. Sim-ulations showed that a co-propagating SH pulse at 450 nm could be broadenedwith more than 100 nm in this way. In this chapter, it is demonstrated experi-mentally that femtosecond dual pumping indeed leads to a spectral broadeningof the co-propagating SH pulse due to cross phase modulation.
7.2 Experimental setup
The experimental setup is shown in figure 7.1. A Yb:KGW oscillator is deliv-ering 1028 nm, transform-limited 380 femtosecond pulses at a repetition rate of9.8 MHz and a pulse energy up to 250 nJ. The pulses are frequency doubledin a 17 mm long LBO (Lithium Triborate) crystal with an efficiency of up to60%. The fundamental and second harmonic beams are then separated witha dichroic mirror reflecting 1028 nm and transmitting 514 nm. Each beam isre-collimated and sent through appropriate telescopes in order to ensure propermode matching at the position of the fiber tip. The IR beam is sent througha delay stage before it is recombined with the SH and coupled into 35 cm ofthe PCF. Using a regular aspheric lens (C230TM from Thorlabs) with a focallength of 4.5 mm it is possible to get approximately 30 % of both colors throughthe fiber simultaneously. After the fiber, an achromatic microscope objectivecollimate the super continuum.
The fiber is birefringent and half-wave plates are used to ensure that bothbeams are coupled into the main axis of the fiber. Temporal overlap is conve-niently found by monitoring the spectrum diffracted off a grating onto a white
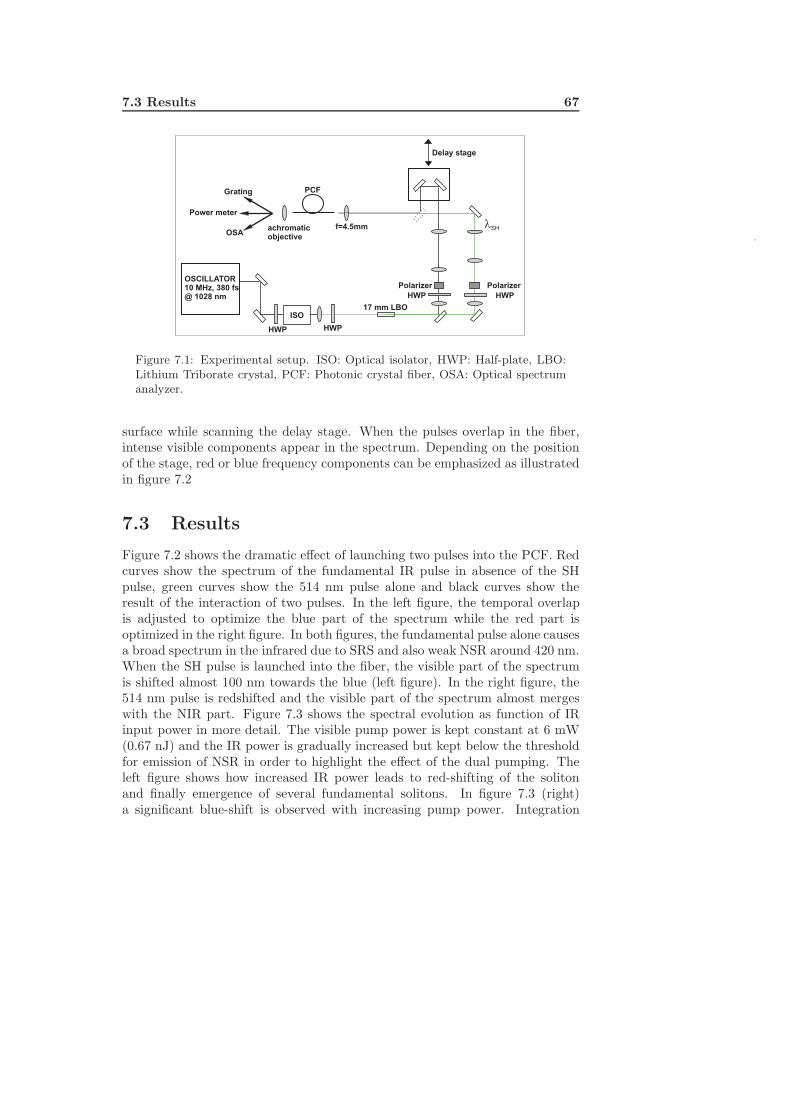
7.3 Results 67
Delay stage
ISO
HWP
17 mm LBO
OSCILLATOR10 MHz, 380 fs@ 1028 nm
PCF
HWP
HWP
Polarizer
HWP
Polarizer
Grating
OSA
Power meter
achromaticobjective
f=4.5mm SH
Figure 7.1: Experimental setup. ISO: Optical isolator, HWP: Half-plate, LBO:Lithium Triborate crystal, PCF: Photonic crystal fiber, OSA: Optical spectrumanalyzer.
surface while scanning the delay stage. When the pulses overlap in the fiber,intense visible components appear in the spectrum. Depending on the positionof the stage, red or blue frequency components can be emphasized as illustratedin figure 7.2
7.3 Results
Figure 7.2 shows the dramatic effect of launching two pulses into the PCF. Redcurves show the spectrum of the fundamental IR pulse in absence of the SHpulse, green curves show the 514 nm pulse alone and black curves show theresult of the interaction of two pulses. In the left figure, the temporal overlapis adjusted to optimize the blue part of the spectrum while the red part isoptimized in the right figure. In both figures, the fundamental pulse alone causesa broad spectrum in the infrared due to SRS and also weak NSR around 420 nm.When the SH pulse is launched into the fiber, the visible part of the spectrumis shifted almost 100 nm towards the blue (left figure). In the right figure, the514 nm pulse is redshifted and the visible part of the spectrum almost mergeswith the NIR part. Figure 7.3 shows the spectral evolution as function of IRinput power in more detail. The visible pump power is kept constant at 6 mW(0.67 nJ) and the IR power is gradually increased but kept below the thresholdfor emission of NSR in order to highlight the effect of the dual pumping. Theleft figure shows how increased IR power leads to red-shifting of the solitonand finally emergence of several fundamental solitons. In figure 7.3 (right)a significant blue-shift is observed with increasing pump power. Integration
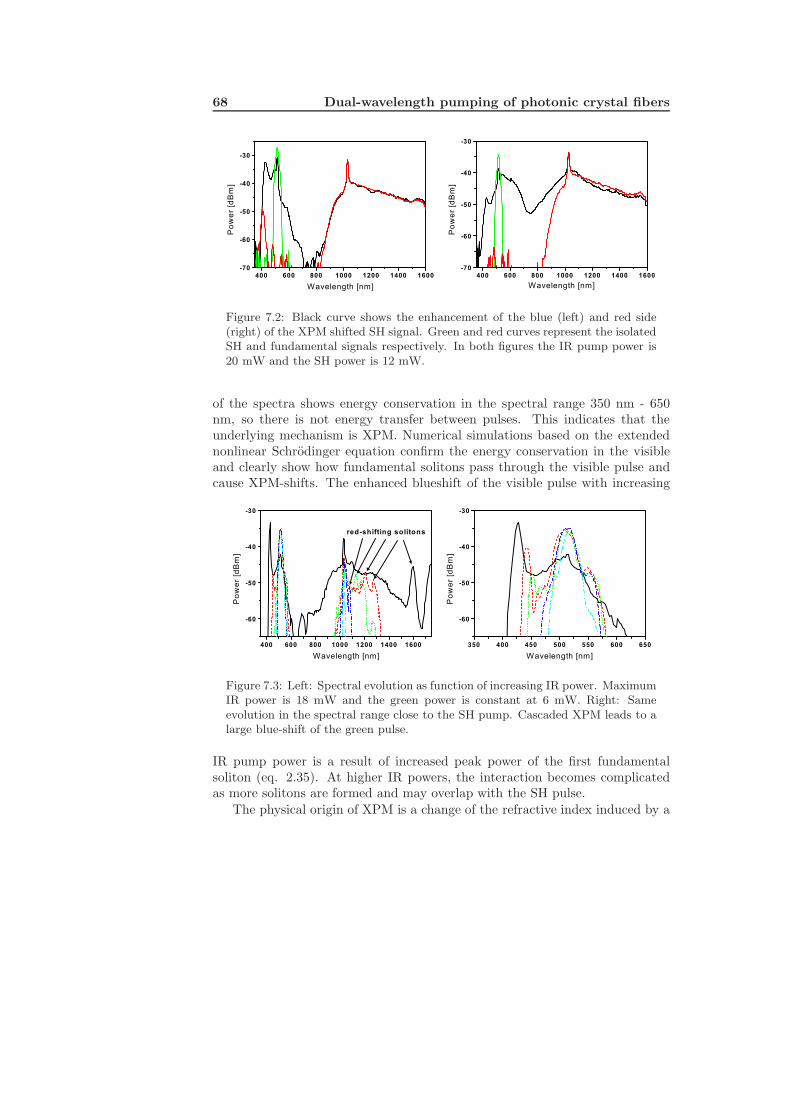
68 Dual-wavelength pumping of photonic crystal fibers
Figure 7.2: Black curve shows the enhancement of the blue (left) and red side(right) of the XPM shifted SH signal. Green and red curves represent the isolatedSH and fundamental signals respectively. In both figures the IR pump power is20 mW and the SH power is 12 mW.
of the spectra shows energy conservation in the spectral range 350 nm - 650nm, so there is not energy transfer between pulses. This indicates that theunderlying mechanism is XPM. Numerical simulations based on the extendednonlinear Schrodinger equation confirm the energy conservation in the visibleand clearly show how fundamental solitons pass through the visible pulse andcause XPM-shifts. The enhanced blueshift of the visible pulse with increasing
Figure 7.3: Left: Spectral evolution as function of increasing IR power. MaximumIR power is 18 mW and the green power is constant at 6 mW. Right: Sameevolution in the spectral range close to the SH pump. Cascaded XPM leads to alarge blue-shift of the green pulse.
IR pump power is a result of increased peak power of the first fundamentalsoliton (eq. 2.35). At higher IR powers, the interaction becomes complicatedas more solitons are formed and may overlap with the SH pulse.
The physical origin of XPM is a change of the refractive index induced by a
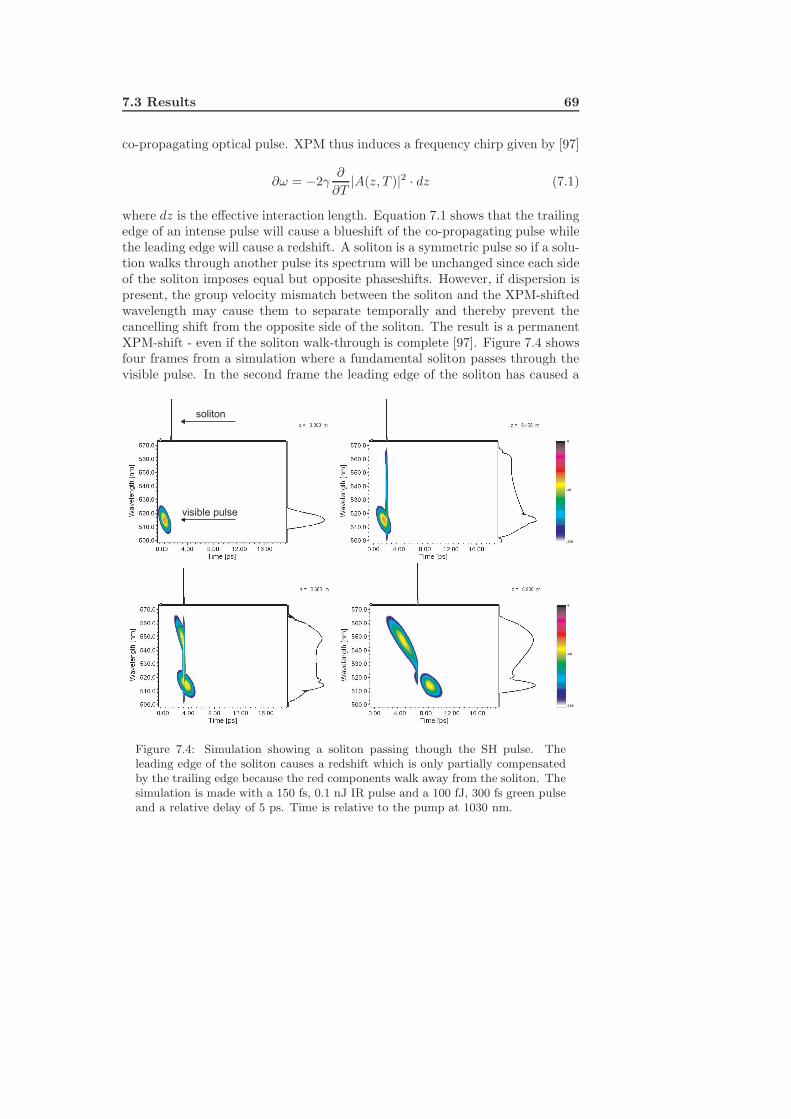
7.3 Results 69
co-propagating optical pulse. XPM thus induces a frequency chirp given by [97]
∂ω = −2γ∂
∂T|A(z, T )|2 · dz (7.1)
where dz is the effective interaction length. Equation 7.1 shows that the trailingedge of an intense pulse will cause a blueshift of the co-propagating pulse whilethe leading edge will cause a redshift. A soliton is a symmetric pulse so if a solu-tion walks through another pulse its spectrum will be unchanged since each sideof the soliton imposes equal but opposite phaseshifts. However, if dispersion ispresent, the group velocity mismatch between the soliton and the XPM-shiftedwavelength may cause them to separate temporally and thereby prevent thecancelling shift from the opposite side of the soliton. The result is a permanentXPM-shift - even if the soliton walk-through is complete [97]. Figure 7.4 showsfour frames from a simulation where a fundamental soliton passes through thevisible pulse. In the second frame the leading edge of the soliton has caused a
soliton
visible pulse
-120
-60
0
-120
-60
0
Figure 7.4: Simulation showing a soliton passing though the SH pulse. Theleading edge of the soliton causes a redshift which is only partially compensatedby the trailing edge because the red components walk away from the soliton. Thesimulation is made with a 150 fs, 0.1 nJ IR pulse and a 100 fJ, 300 fs green pulseand a relative delay of 5 ps. Time is relative to the pump at 1030 nm.
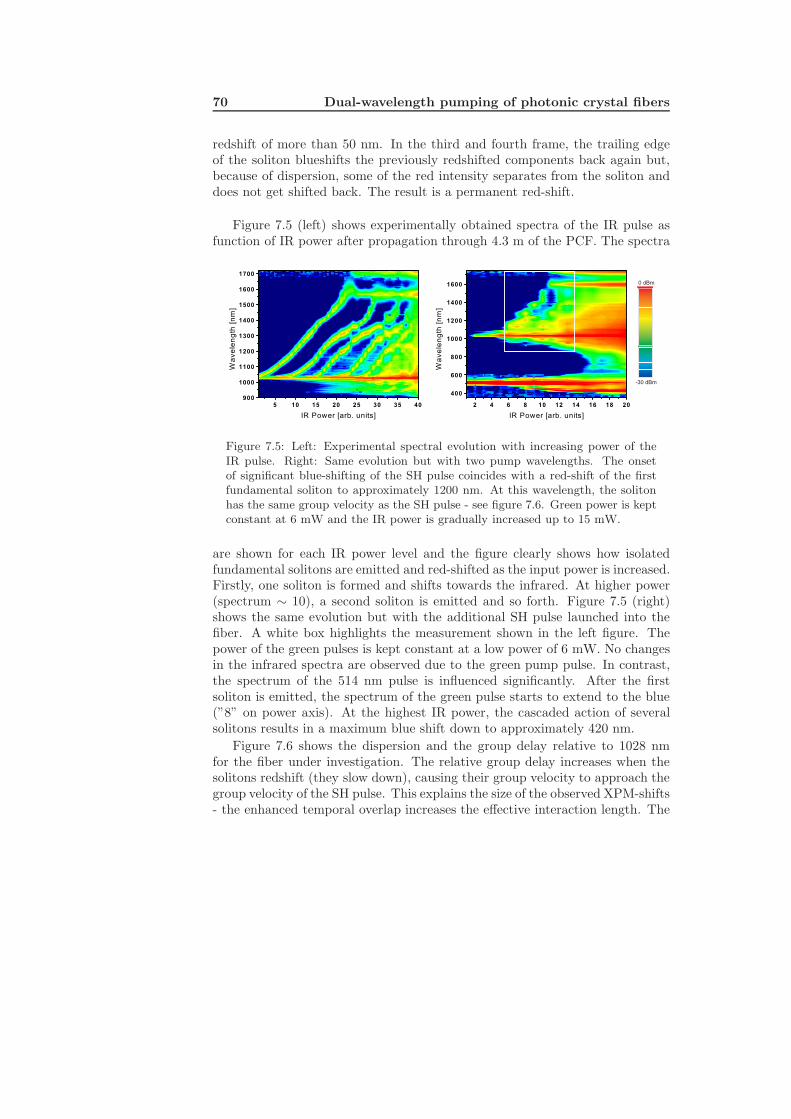
70 Dual-wavelength pumping of photonic crystal fibers
redshift of more than 50 nm. In the third and fourth frame, the trailing edgeof the soliton blueshifts the previously redshifted components back again but,because of dispersion, some of the red intensity separates from the soliton anddoes not get shifted back. The result is a permanent red-shift.
Figure 7.5 (left) shows experimentally obtained spectra of the IR pulse asfunction of IR power after propagation through 4.3 m of the PCF. The spectra
-30 dBm
0 dBm
Figure 7.5: Left: Experimental spectral evolution with increasing power of theIR pulse. Right: Same evolution but with two pump wavelengths. The onsetof significant blue-shifting of the SH pulse coincides with a red-shift of the firstfundamental soliton to approximately 1200 nm. At this wavelength, the solitonhas the same group velocity as the SH pulse - see figure 7.6. Green power is keptconstant at 6 mW and the IR power is gradually increased up to 15 mW.
are shown for each IR power level and the figure clearly shows how isolatedfundamental solitons are emitted and red-shifted as the input power is increased.Firstly, one soliton is formed and shifts towards the infrared. At higher power(spectrum ∼ 10), a second soliton is emitted and so forth. Figure 7.5 (right)shows the same evolution but with the additional SH pulse launched into thefiber. A white box highlights the measurement shown in the left figure. Thepower of the green pulses is kept constant at a low power of 6 mW. No changesin the infrared spectra are observed due to the green pump pulse. In contrast,the spectrum of the 514 nm pulse is influenced significantly. After the firstsoliton is emitted, the spectrum of the green pulse starts to extend to the blue(”8” on power axis). At the highest IR power, the cascaded action of severalsolitons results in a maximum blue shift down to approximately 420 nm.
Figure 7.6 shows the dispersion and the group delay relative to 1028 nmfor the fiber under investigation. The relative group delay increases when thesolitons redshift (they slow down), causing their group velocity to approach thegroup velocity of the SH pulse. This explains the size of the observed XPM-shifts- the enhanced temporal overlap increases the effective interaction length. The
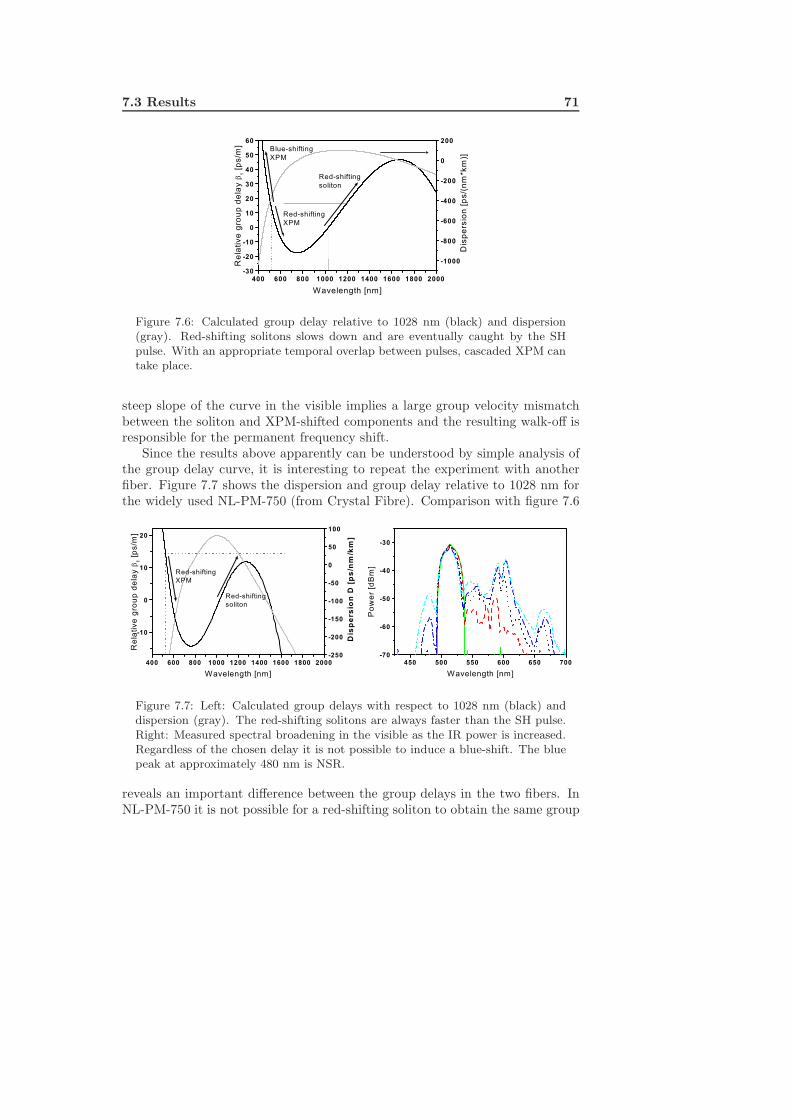
7.3 Results 71
Figure 7.6: Calculated group delay relative to 1028 nm (black) and dispersion(gray). Red-shifting solitons slows down and are eventually caught by the SHpulse. With an appropriate temporal overlap between pulses, cascaded XPM cantake place.
steep slope of the curve in the visible implies a large group velocity mismatchbetween the soliton and XPM-shifted components and the resulting walk-off isresponsible for the permanent frequency shift.
Since the results above apparently can be understood by simple analysis ofthe group delay curve, it is interesting to repeat the experiment with anotherfiber. Figure 7.7 shows the dispersion and group delay relative to 1028 nm forthe widely used NL-PM-750 (from Crystal Fibre). Comparison with figure 7.6
Figure 7.7: Left: Calculated group delays with respect to 1028 nm (black) anddispersion (gray). The red-shifting solitons are always faster than the SH pulse.Right: Measured spectral broadening in the visible as the IR power is increased.Regardless of the chosen delay it is not possible to induce a blue-shift. The bluepeak at approximately 480 nm is NSR.
reveals an important difference between the group delays in the two fibers. InNL-PM-750 it is not possible for a red-shifting soliton to obtain the same group
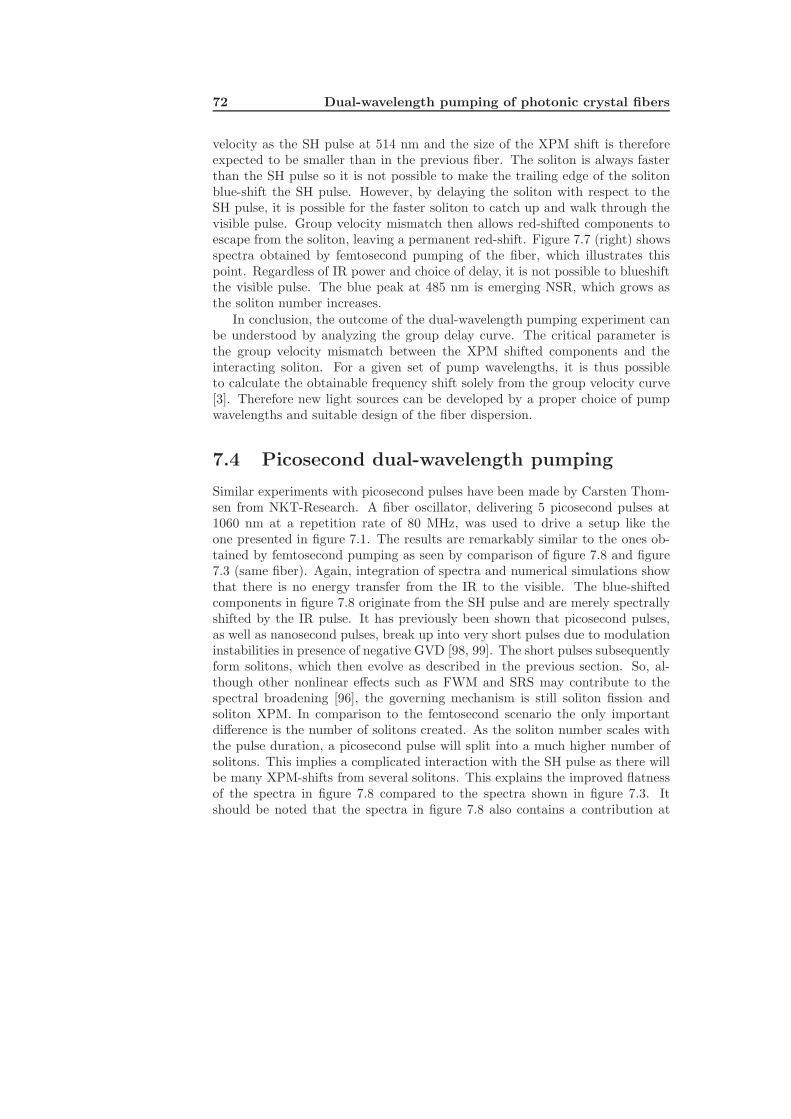
72 Dual-wavelength pumping of photonic crystal fibers
velocity as the SH pulse at 514 nm and the size of the XPM shift is thereforeexpected to be smaller than in the previous fiber. The soliton is always fasterthan the SH pulse so it is not possible to make the trailing edge of the solitonblue-shift the SH pulse. However, by delaying the soliton with respect to theSH pulse, it is possible for the faster soliton to catch up and walk through thevisible pulse. Group velocity mismatch then allows red-shifted components toescape from the soliton, leaving a permanent red-shift. Figure 7.7 (right) showsspectra obtained by femtosecond pumping of the fiber, which illustrates thispoint. Regardless of IR power and choice of delay, it is not possible to blueshiftthe visible pulse. The blue peak at 485 nm is emerging NSR, which grows asthe soliton number increases.
In conclusion, the outcome of the dual-wavelength pumping experiment canbe understood by analyzing the group delay curve. The critical parameter isthe group velocity mismatch between the XPM shifted components and theinteracting soliton. For a given set of pump wavelengths, it is thus possibleto calculate the obtainable frequency shift solely from the group velocity curve[3]. Therefore new light sources can be developed by a proper choice of pumpwavelengths and suitable design of the fiber dispersion.
7.4 Picosecond dual-wavelength pumping
Similar experiments with picosecond pulses have been made by Carsten Thom-sen from NKT-Research. A fiber oscillator, delivering 5 picosecond pulses at1060 nm at a repetition rate of 80 MHz, was used to drive a setup like theone presented in figure 7.1. The results are remarkably similar to the ones ob-tained by femtosecond pumping as seen by comparison of figure 7.8 and figure7.3 (same fiber). Again, integration of spectra and numerical simulations showthat there is no energy transfer from the IR to the visible. The blue-shiftedcomponents in figure 7.8 originate from the SH pulse and are merely spectrallyshifted by the IR pulse. It has previously been shown that picosecond pulses,as well as nanosecond pulses, break up into very short pulses due to modulationinstabilities in presence of negative GVD [98, 99]. The short pulses subsequentlyform solitons, which then evolve as described in the previous section. So, al-though other nonlinear effects such as FWM and SRS may contribute to thespectral broadening [96], the governing mechanism is still soliton fission andsoliton XPM. In comparison to the femtosecond scenario the only importantdifference is the number of solitons created. As the soliton number scales withthe pulse duration, a picosecond pulse will split into a much higher number ofsolitons. This implies a complicated interaction with the SH pulse as there willbe many XPM-shifts from several solitons. This explains the improved flatnessof the spectra in figure 7.8 compared to the spectra shown in figure 7.3. Itshould be noted that the spectra in figure 7.8 also contains a contribution at
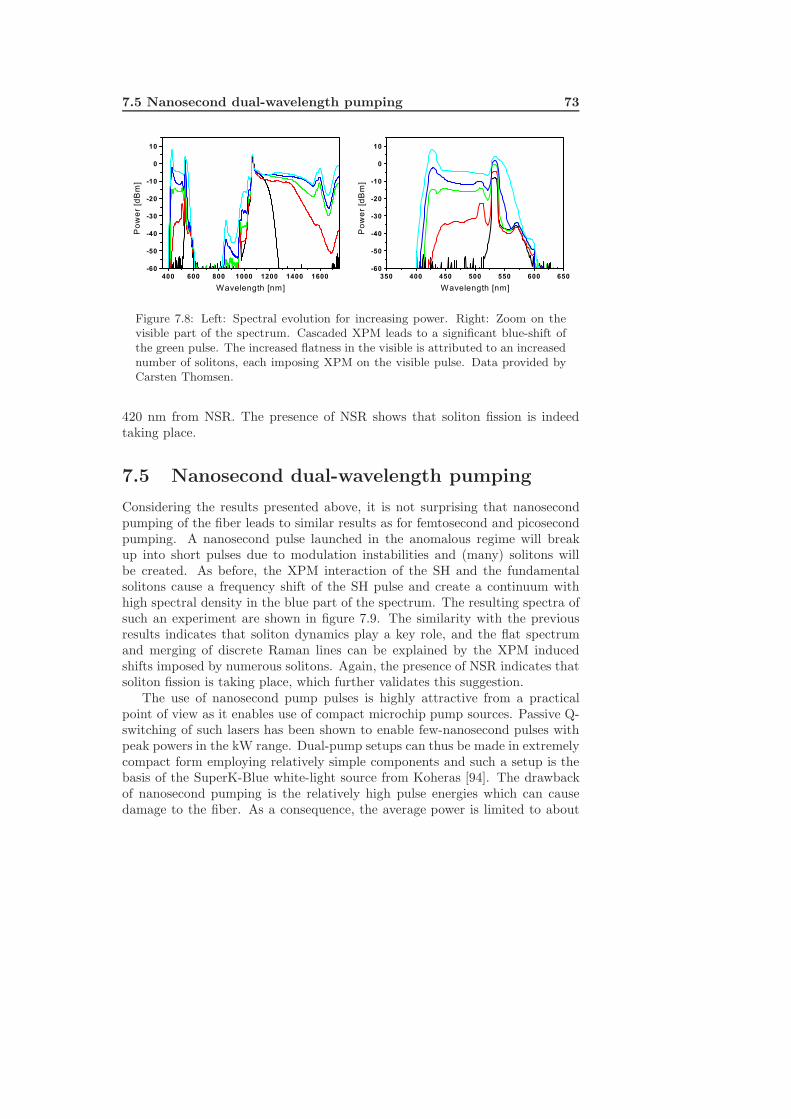
7.5 Nanosecond dual-wavelength pumping 73
Figure 7.8: Left: Spectral evolution for increasing power. Right: Zoom on thevisible part of the spectrum. Cascaded XPM leads to a significant blue-shift ofthe green pulse. The increased flatness in the visible is attributed to an increasednumber of solitons, each imposing XPM on the visible pulse. Data provided byCarsten Thomsen.
420 nm from NSR. The presence of NSR shows that soliton fission is indeedtaking place.
7.5 Nanosecond dual-wavelength pumping
Considering the results presented above, it is not surprising that nanosecondpumping of the fiber leads to similar results as for femtosecond and picosecondpumping. A nanosecond pulse launched in the anomalous regime will breakup into short pulses due to modulation instabilities and (many) solitons willbe created. As before, the XPM interaction of the SH and the fundamentalsolitons cause a frequency shift of the SH pulse and create a continuum withhigh spectral density in the blue part of the spectrum. The resulting spectra ofsuch an experiment are shown in figure 7.9. The similarity with the previousresults indicates that soliton dynamics play a key role, and the flat spectrumand merging of discrete Raman lines can be explained by the XPM inducedshifts imposed by numerous solitons. Again, the presence of NSR indicates thatsoliton fission is taking place, which further validates this suggestion.
The use of nanosecond pump pulses is highly attractive from a practicalpoint of view as it enables use of compact microchip pump sources. Passive Q-switching of such lasers has been shown to enable few-nanosecond pulses withpeak powers in the kW range. Dual-pump setups can thus be made in extremelycompact form employing relatively simple components and such a setup is thebasis of the SuperK-Blue white-light source from Koheras [94]. The drawbackof nanosecond pumping is the relatively high pulse energies which can causedamage to the fiber. As a consequence, the average power is limited to about
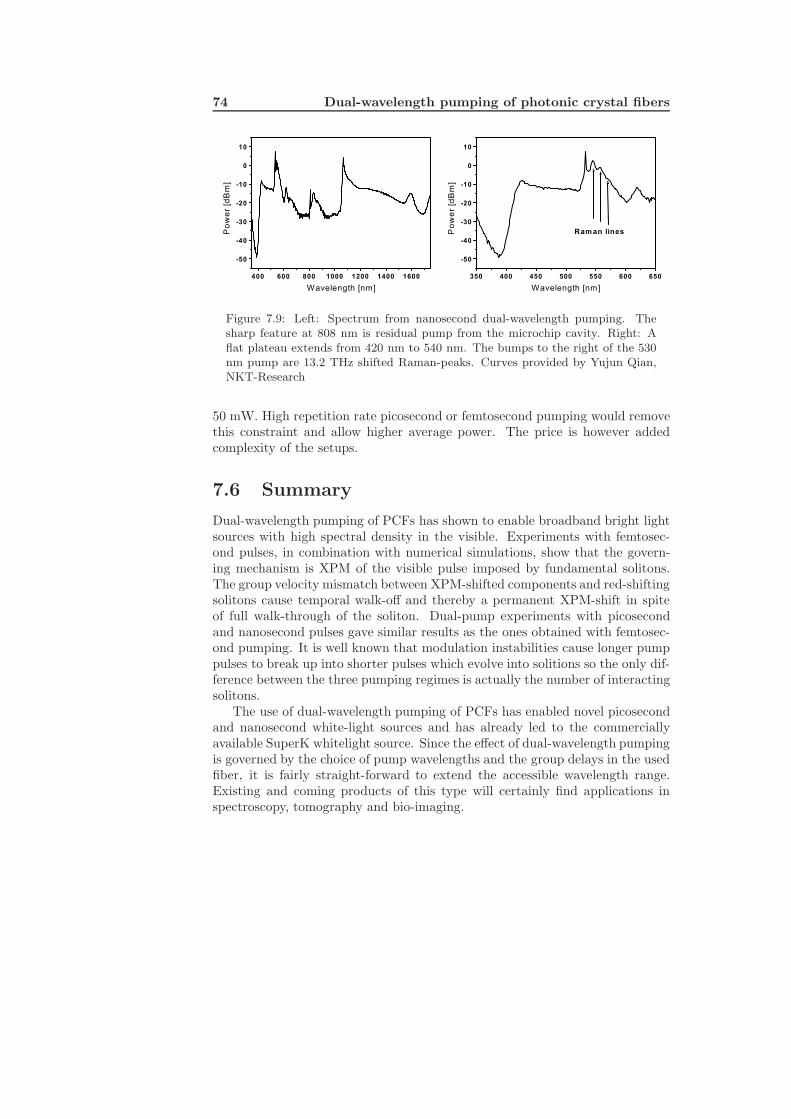
74 Dual-wavelength pumping of photonic crystal fibers
Figure 7.9: Left: Spectrum from nanosecond dual-wavelength pumping. Thesharp feature at 808 nm is residual pump from the microchip cavity. Right: Aflat plateau extends from 420 nm to 540 nm. The bumps to the right of the 530nm pump are 13.2 THz shifted Raman-peaks. Curves provided by Yujun Qian,NKT-Research
50 mW. High repetition rate picosecond or femtosecond pumping would removethis constraint and allow higher average power. The price is however addedcomplexity of the setups.
7.6 Summary
Dual-wavelength pumping of PCFs has shown to enable broadband bright lightsources with high spectral density in the visible. Experiments with femtosec-ond pulses, in combination with numerical simulations, show that the govern-ing mechanism is XPM of the visible pulse imposed by fundamental solitons.The group velocity mismatch between XPM-shifted components and red-shiftingsolitons cause temporal walk-off and thereby a permanent XPM-shift in spiteof full walk-through of the soliton. Dual-pump experiments with picosecondand nanosecond pulses gave similar results as the ones obtained with femtosec-ond pumping. It is well known that modulation instabilities cause longer pumppulses to break up into shorter pulses which evolve into solitions so the only dif-ference between the three pumping regimes is actually the number of interactingsolitons.
The use of dual-wavelength pumping of PCFs has enabled novel picosecondand nanosecond white-light sources and has already led to the commerciallyavailable SuperK whitelight source. Since the effect of dual-wavelength pumpingis governed by the choice of pump wavelengths and the group delays in the usedfiber, it is fairly straight-forward to extend the accessible wavelength range.Existing and coming products of this type will certainly find applications inspectroscopy, tomography and bio-imaging.

Chapter 8
Fiber laser pumped optical
parametric amplifier
Optical parametric amplification of a super continuum from a PCF enables ahigh power tunable femtosecond source in the visible and near infrared. Thelarge bandwidth of the seed, as well as the amplifier, is used to generate sub-50 fs pulses and simulations indicate that it may be possible to obtain pulsedurations below 20 fs. The setup is power scalable and represents an interestingroute towards compact high power ultra-fast laser systems.
75
76 Fiber laser pumped optical parametric amplifier
In summer 2005 I visited the fiber laser group in Jena to carry out experi-ments with optical parametric amplification (OPA). Fiber lasers are ideal pumpsources for OPA and I made a fiber laser pumped OPA based on the idea fromchapter 3 of amplifying a super continuum from a PCF. The first attempt hadfailed due to limited pump power but, with access to almost unlimited pumppower in Jena, that was no longer a limitation. The following pages describethe resulting high power fiber laser pumped femtosecond source and the exper-iments with ultra-short pulse amplification.
8.1 Introduction
Sources of tunable ultrashort laser pulses are essential tools for probing fast phe-nomena in physics, chemistry and biology. Kerr-lens modelocked Ti:Sapphirelasers [42] have proven to be very reliable sources of femtosecond pulses and”turn-key” devices supplying sub-20 fs are now commercially available [100].However, in spite of the outstanding performance of these lasers, the tunabilityis restricted to the region around 800 nm and the second harmonic around 400nm. The limited tuning range can be greatly expanded through OPA, whichhas become a widely used technique [101]. In OPA, coupling of three waves viathe nonlinear polarization enables photons from the intense pump wave to beefficiently converted into (lower energy) signal photons and the same number ofidler photons. Such a scheme requires fulfilled energy and momentum conser-vation, also termed as phase-matching, determining the interacting wavelengthsand, in particular, the tunability and bandwidth of the parametric amplification.
It has been demonstrated that waiving of traditional collinear pumping ge-ometry leads to a significant increase of the phase-matched bandwidth whichcan be obtained in OPA [102]. As a result, ultrashort laser pulses are now rou-tinely generated throughout the visible and near infrared spectral region withhigh efficiency employing non-collinear optical parametric amplifiers (NOPAs)[50, 101, 103].
A typical NOPA is driven by an amplified Ti:Sapphire laser system deliver-ing 100-200 fs pulses with energies up to a few mJ. The high pulse energy andresulting peak power ensure highly efficient nonlinear conversion in the OPAstages, and several tens of µJ can usually be obtained across the desired wave-length range [101]. However, the average power from the Ti:Sapphire systemsis limited by the thermal load on the gain crystal as thermal lensing deterio-rates the beam quality. Without special precautions, the available pump powerpower is therefore of the order of a few Watts [104]. In contrast, the parametricamplification itself does not suffer from thermal effects. The fulfilled energyconservation and high optical quality of the nonlinear crystals ensure minimalheating of the crystal. For that reason parametric amplification is well suited
8.2 Theory of optical parametric amplification 77
for high repetition-rate and high average power applications.In this context, fiber lasers and amplifiers represent an interesting alterna-
tive to the conventional Ti:Sapphire-based systems since they can supply highaverage powers as well as high pulse energies [9]. Due to excellent heat dissi-pation and strong confinement of the light in fibers, diffraction limited beamquality can be obtained even with continuous wave powers well above 1 kW[67]. Additionally, the high optical conversion efficiencies (up to 80%) from low-brightness laser pump diodes [105] enable a great reduction in price as well ascomplexity of such systems. Short-pulse fiber lasers are therefore predestinatedpump sources for high repetition rate parametric amplifiers.
In this chapter, the implementation of a 1 MHz repetition rate parametricamplifier pumped by a chirped pulse fiber amplification system is described. Thesetup is based on a single pass fiber amplifier and yet femtosecond pulses withenergies above 1 µJ can be obtained and tunability in the range < 700 nm to> 1500 nm has been observed. A broadband signal generated in a PCF providesa reliable and nearly flat supercontinuum which is an ideal seed for OPA whentunability is desired. Additionally, short pulse generation is demonstrated. Byreducing the power in the PCF, soliton fission is avoided and the amplifiedspectrum is compressed to sub-40 fs pulses. Simulations indicate that pulsedurations as low as 20 fs are feasible.
8.2 Theory of optical parametric amplification
OPA is a χ(2) process in which a high intensity beam (pump) amplifies a weaksignal and generates a third wave, an idler, in the process. Quantum mechani-cally, a pump photon is divided into lower energy signal and idler photons underenergy and momentum conservation (phasematching)
ωp = ωs + ωi, kp = ks + ki (8.1)
Assuming χ(2) >> χ(3), the nonlinear polarization is approximated by Pnl ≈χ(2)EE. The electric field can be represented by a sum of three pulses withcentral frequencies ωp, ωs, ωi
E(r, t) = F (x, y)∑
n=p,s,i
An(z, t) exp(iknz − iωnt) + c.c. (8.2)
where F (x, y) is the frequency independent transverse area and An is the slowlyvarying envelope. Choosing the polarization terms oscillating at ωp, ωs, ωi, thewave equation (eq. 2.9) can be solved for each frequency component to give thefollowing set of equations for the slowly varying amplitudes of pump, signal and
78 Fiber laser pumped optical parametric amplifier
idler respectively (j =√−1 is used to avoid confusion with the idler index i)
∂Ap
∂z+
1vg,p
∂Ap
∂t= −j
ωp deff
np cAiAs exp(j∆kz) (8.3)
∂As
∂z+
1vg,s
∂As
∂t= −j
ωs deff
ns cA∗
i Ap exp(−j∆kz) (8.4)
∂Ai
∂z+
1vg,i
∂Ai
∂t= −j
ωi deff
ni cA∗
sAp exp(−j∆kz) (8.5)
where vg is the group velocity for the pulses, deff is the effective nonlinearcoefficient and ∆k = kp − ks − ki. Dispersion has been neglected which is a rea-sonable approximation since the pulses in these experiments are longer than 100fs. Equations 8.3-8.5 can be solved numerically but with a few approximations,an analytical solution can be derived as well: Assuming negligible difference ingroup velocity the equations reduce to
∂Ap
∂z= −j
ωp deff
np cA∗
sAi exp(j∆kz) (8.6)
∂As,i
∂z= −j
ωs,i deff
ns,i cA∗
i,sAp exp(−j∆kz) (8.7)
This approximation is valid for long pulses for which a small temporal walk-off does not change the amplitudes significantly. Section 8.2.1 will show howgroup velocity matching can be obtained even with ultrashort pulses by ap-plying an non-collinear geometry between the beams. Furthermore, assumingphasematching and un-depleted pump, the equations can be simplified to
∂Ap
∂z= 0
∂As,i
∂z= −j
ωs,i deff
ns,i cA∗
i,sAp (8.8)
which are readily de-coupled to show that the intensity of the signal and idlergrows exponentially with pump power and the interaction length. In practice,gains of the order of 103 − 106 can be obtained in short (1-5 mm) nonlinearcrystals [101].
Apart from the huge gain, OPA has another important quality which be-comes apparent when eq. 8.6-8.7 are solved for the phase of the amplitude.Assuming As,i = |As,i| exp(j φs,i) the following solutions for the phase of thesignal and idler can be found [106–108]
φs(z) = φs(0) − ∆kz
2+
∆kz
2· K (8.9)
φi(z) = φp(0) − φs(0) − ∆kz
2− π
2(8.10)
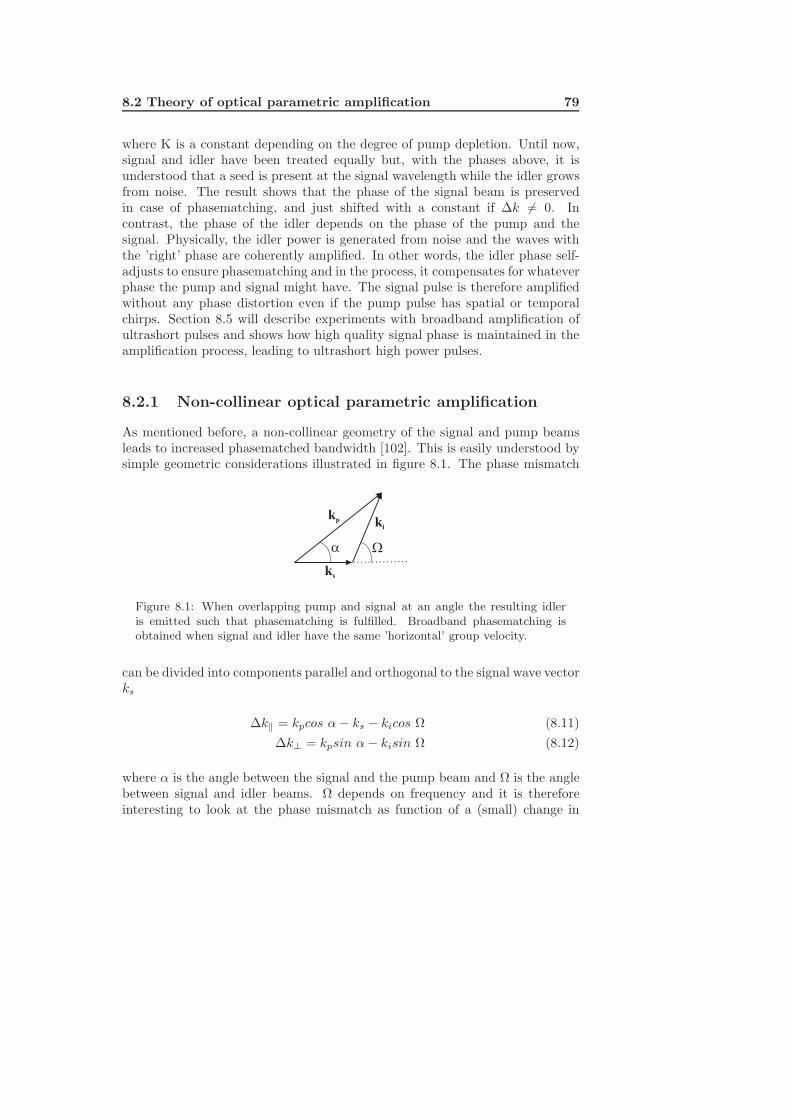
8.2 Theory of optical parametric amplification 79
where K is a constant depending on the degree of pump depletion. Until now,signal and idler have been treated equally but, with the phases above, it isunderstood that a seed is present at the signal wavelength while the idler growsfrom noise. The result shows that the phase of the signal beam is preservedin case of phasematching, and just shifted with a constant if ∆k = 0. Incontrast, the phase of the idler depends on the phase of the pump and thesignal. Physically, the idler power is generated from noise and the waves withthe ’right’ phase are coherently amplified. In other words, the idler phase self-adjusts to ensure phasematching and in the process, it compensates for whateverphase the pump and signal might have. The signal pulse is therefore amplifiedwithout any phase distortion even if the pump pulse has spatial or temporalchirps. Section 8.5 will describe experiments with broadband amplification ofultrashort pulses and shows how high quality signal phase is maintained in theamplification process, leading to ultrashort high power pulses.
8.2.1 Non-collinear optical parametric amplification
As mentioned before, a non-collinear geometry of the signal and pump beamsleads to increased phasematched bandwidth [102]. This is easily understood bysimple geometric considerations illustrated in figure 8.1. The phase mismatch
ki
kp
ks
Figure 8.1: When overlapping pump and signal at an angle the resulting idleris emitted such that phasematching is fulfilled. Broadband phasematching isobtained when signal and idler have the same ’horizontal’ group velocity.
can be divided into components parallel and orthogonal to the signal wave vectorks
∆k‖ = kpcos α − ks − kicos Ω (8.11)∆k⊥ = kpsin α − kisin Ω (8.12)
where α is the angle between the signal and the pump beam and Ω is the anglebetween signal and idler beams. Ω depends on frequency and it is thereforeinteresting to look at the phase mismatch as function of a (small) change in
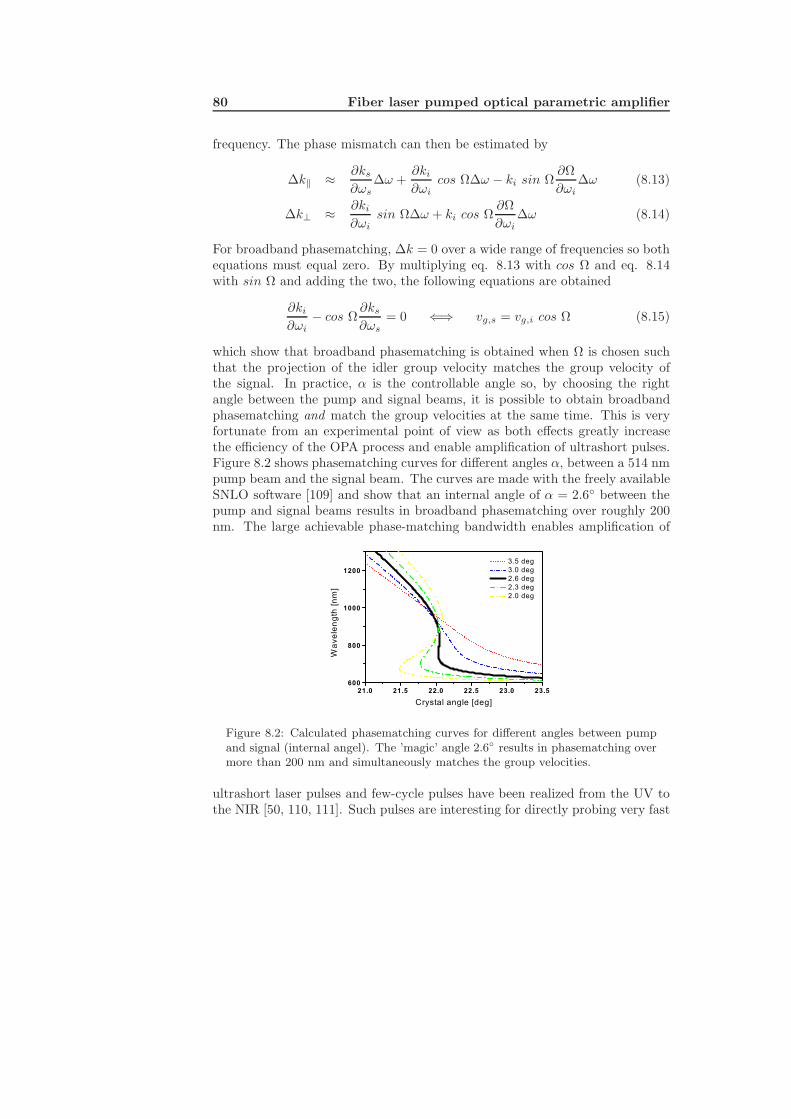
80 Fiber laser pumped optical parametric amplifier
frequency. The phase mismatch can then be estimated by
∆k‖ ≈ ∂ks
∂ωs∆ω +
∂ki
∂ωicos Ω∆ω − ki sin Ω
∂Ω∂ωi
∆ω (8.13)
∆k⊥ ≈ ∂ki
∂ωisin Ω∆ω + ki cos Ω
∂Ω∂ωi
∆ω (8.14)
For broadband phasematching, ∆k = 0 over a wide range of frequencies so bothequations must equal zero. By multiplying eq. 8.13 with cos Ω and eq. 8.14with sin Ω and adding the two, the following equations are obtained
∂ki
∂ωi− cos Ω
∂ks
∂ωs= 0 ⇐⇒ vg,s = vg,i cos Ω (8.15)
which show that broadband phasematching is obtained when Ω is chosen suchthat the projection of the idler group velocity matches the group velocity ofthe signal. In practice, α is the controllable angle so, by choosing the rightangle between the pump and signal beams, it is possible to obtain broadbandphasematching and match the group velocities at the same time. This is veryfortunate from an experimental point of view as both effects greatly increasethe efficiency of the OPA process and enable amplification of ultrashort pulses.Figure 8.2 shows phasematching curves for different angles α, between a 514 nmpump beam and the signal beam. The curves are made with the freely availableSNLO software [109] and show that an internal angle of α = 2.6 between thepump and signal beams results in broadband phasematching over roughly 200nm. The large achievable phase-matching bandwidth enables amplification of
Figure 8.2: Calculated phasematching curves for different angles between pumpand signal (internal angel). The ’magic’ angle 2.6 results in phasematching overmore than 200 nm and simultaneously matches the group velocities.
ultrashort laser pulses and few-cycle pulses have been realized from the UV tothe NIR [50, 110, 111]. Such pulses are interesting for directly probing very fast
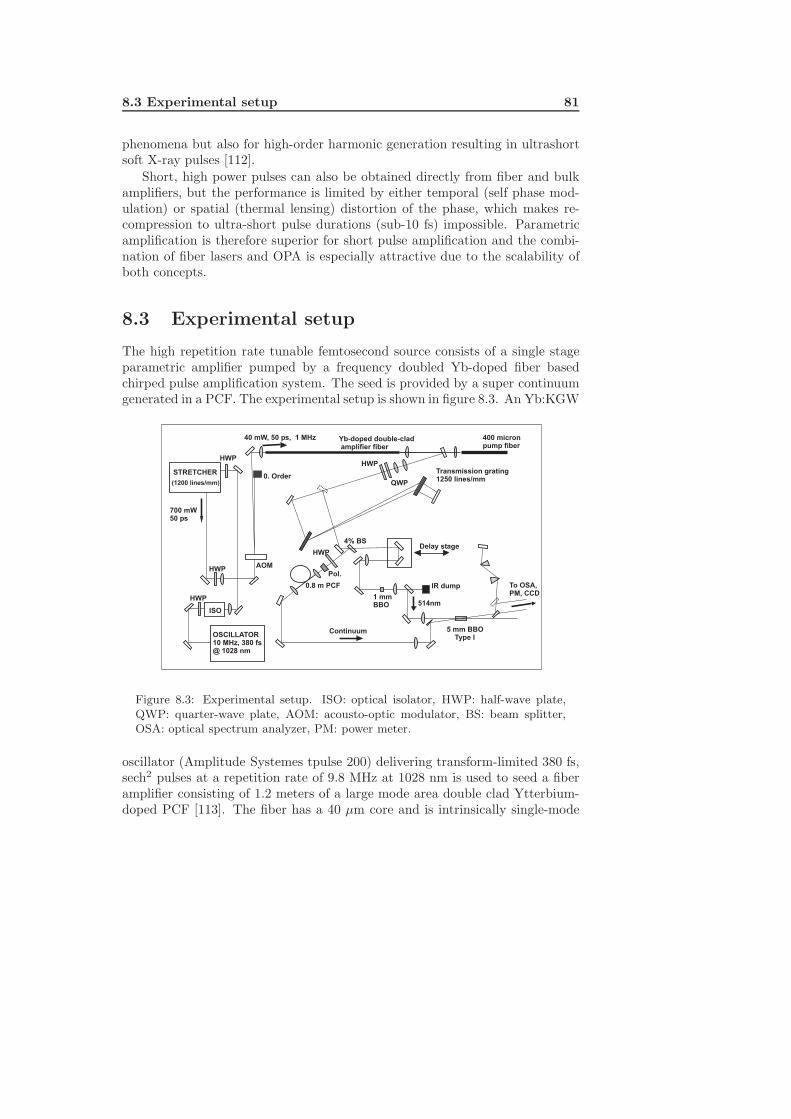
8.3 Experimental setup 81
phenomena but also for high-order harmonic generation resulting in ultrashortsoft X-ray pulses [112].
Short, high power pulses can also be obtained directly from fiber and bulkamplifiers, but the performance is limited by either temporal (self phase mod-ulation) or spatial (thermal lensing) distortion of the phase, which makes re-compression to ultra-short pulse durations (sub-10 fs) impossible. Parametricamplification is therefore superior for short pulse amplification and the combi-nation of fiber lasers and OPA is especially attractive due to the scalability ofboth concepts.
8.3 Experimental setup
The high repetition rate tunable femtosecond source consists of a single stageparametric amplifier pumped by a frequency doubled Yb-doped fiber basedchirped pulse amplification system. The seed is provided by a super continuumgenerated in a PCF. The experimental setup is shown in figure 8.3. An Yb:KGW
Delay stage
400 micronpump fiber
HWP
QWP
0.8 m PCF
4% BS
HWP
Pol.
1 mmBBO
IR dump
Transmission grating1250 lines/mm
40 mW, 50 ps, 1 MHz
To OSA,PM, CCD
ISO
HWP
AOM
0. Order
OSCILLATOR10 MHz, 380 fs@ 1028 nm
STRETCHER
700 mW50 ps
HWP
HWP
(1200 lines/mm)
5 mm BBOType I
Continuum
514nm
Yb-doped double-cladamplifier fiber
Figure 8.3: Experimental setup. ISO: optical isolator, HWP: half-wave plate,QWP: quarter-wave plate, AOM: acousto-optic modulator, BS: beam splitter,OSA: optical spectrum analyzer, PM: power meter.
oscillator (Amplitude Systemes tpulse 200) delivering transform-limited 380 fs,sech2 pulses at a repetition rate of 9.8 MHz at 1028 nm is used to seed a fiberamplifier consisting of 1.2 meters of a large mode area double clad Ytterbium-doped PCF [113]. The fiber has a 40 µm core and is intrinsically single-mode
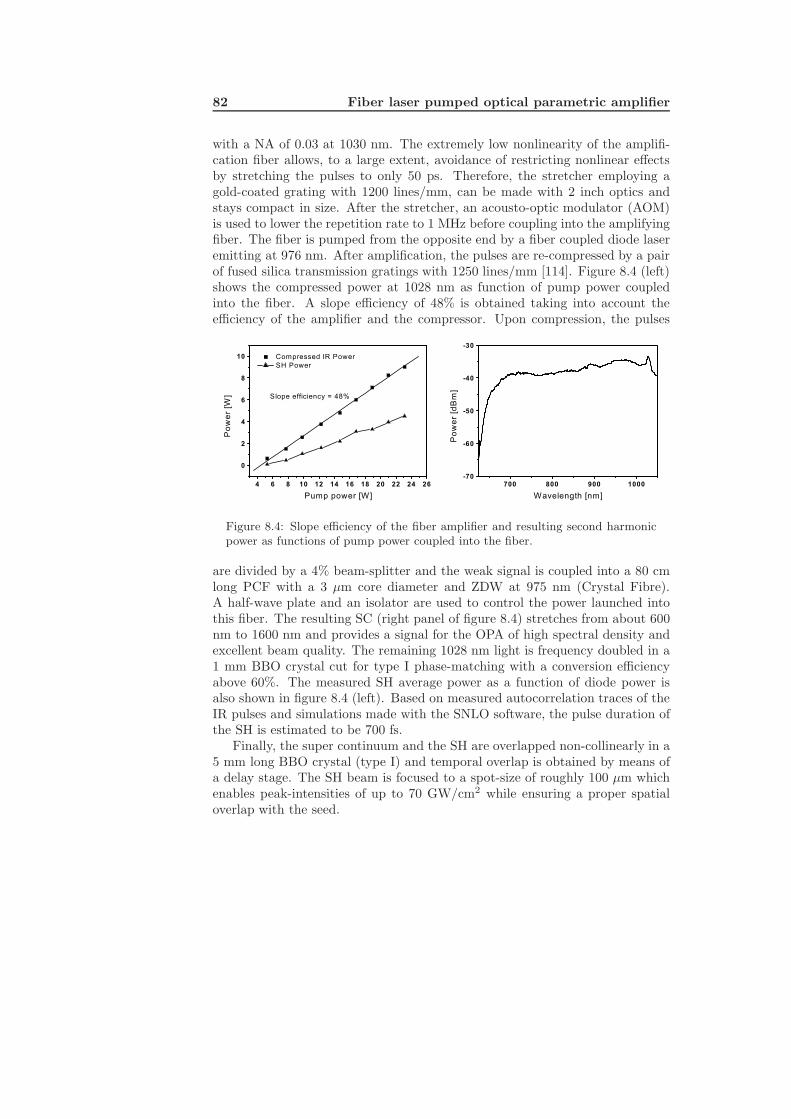
82 Fiber laser pumped optical parametric amplifier
with a NA of 0.03 at 1030 nm. The extremely low nonlinearity of the amplifi-cation fiber allows, to a large extent, avoidance of restricting nonlinear effectsby stretching the pulses to only 50 ps. Therefore, the stretcher employing agold-coated grating with 1200 lines/mm, can be made with 2 inch optics andstays compact in size. After the stretcher, an acousto-optic modulator (AOM)is used to lower the repetition rate to 1 MHz before coupling into the amplifyingfiber. The fiber is pumped from the opposite end by a fiber coupled diode laseremitting at 976 nm. After amplification, the pulses are re-compressed by a pairof fused silica transmission gratings with 1250 lines/mm [114]. Figure 8.4 (left)shows the compressed power at 1028 nm as function of pump power coupledinto the fiber. A slope efficiency of 48% is obtained taking into account theefficiency of the amplifier and the compressor. Upon compression, the pulses
Figure 8.4: Slope efficiency of the fiber amplifier and resulting second harmonicpower as functions of pump power coupled into the fiber.
are divided by a 4% beam-splitter and the weak signal is coupled into a 80 cmlong PCF with a 3 µm core diameter and ZDW at 975 nm (Crystal Fibre).A half-wave plate and an isolator are used to control the power launched intothis fiber. The resulting SC (right panel of figure 8.4) stretches from about 600nm to 1600 nm and provides a signal for the OPA of high spectral density andexcellent beam quality. The remaining 1028 nm light is frequency doubled in a1 mm BBO crystal cut for type I phase-matching with a conversion efficiencyabove 60%. The measured SH average power as a function of diode power isalso shown in figure 8.4 (left). Based on measured autocorrelation traces of theIR pulses and simulations made with the SNLO software, the pulse duration ofthe SH is estimated to be 700 fs.
Finally, the super continuum and the SH are overlapped non-collinearly in a5 mm long BBO crystal (type I) and temporal overlap is obtained by means ofa delay stage. The SH beam is focused to a spot-size of roughly 100 µm whichenables peak-intensities of up to 70 GW/cm2 while ensuring a proper spatialoverlap with the seed.
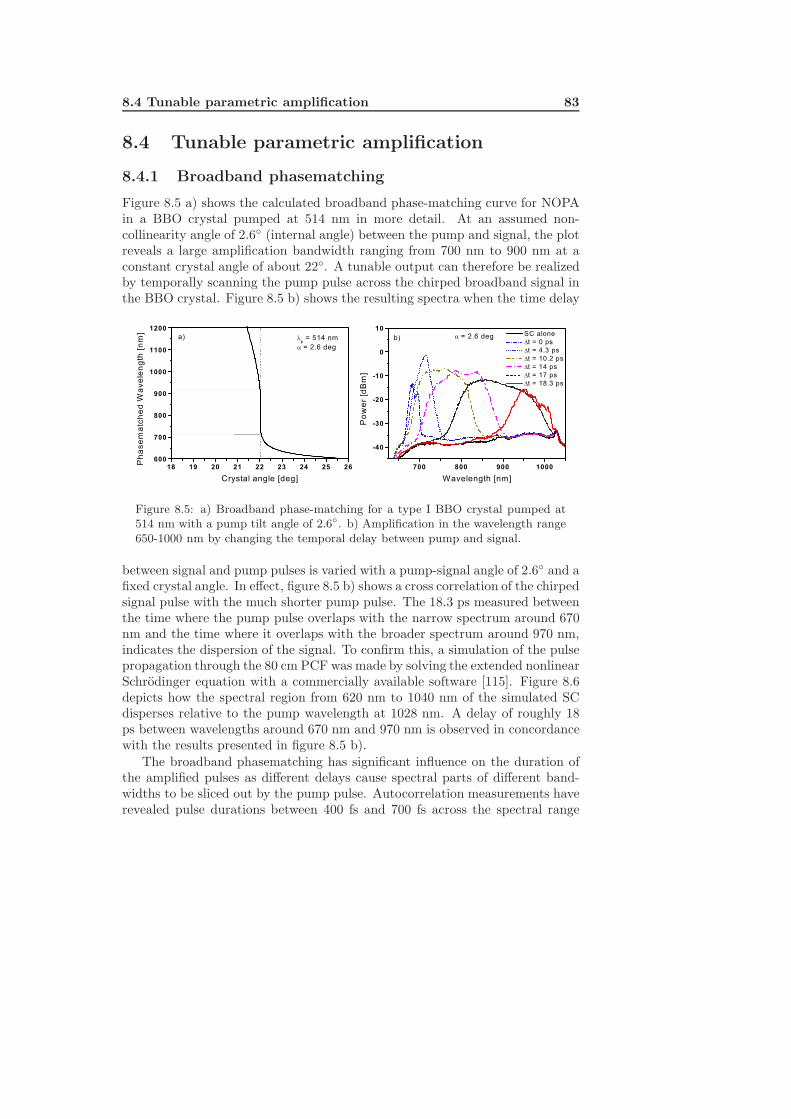
8.4 Tunable parametric amplification 83
8.4 Tunable parametric amplification
8.4.1 Broadband phasematching
Figure 8.5 a) shows the calculated broadband phase-matching curve for NOPAin a BBO crystal pumped at 514 nm in more detail. At an assumed non-collinearity angle of 2.6 (internal angle) between the pump and signal, the plotreveals a large amplification bandwidth ranging from 700 nm to 900 nm at aconstant crystal angle of about 22. A tunable output can therefore be realizedby temporally scanning the pump pulse across the chirped broadband signal inthe BBO crystal. Figure 8.5 b) shows the resulting spectra when the time delay
Figure 8.5: a) Broadband phase-matching for a type I BBO crystal pumped at514 nm with a pump tilt angle of 2.6. b) Amplification in the wavelength range650-1000 nm by changing the temporal delay between pump and signal.
between signal and pump pulses is varied with a pump-signal angle of 2.6 and afixed crystal angle. In effect, figure 8.5 b) shows a cross correlation of the chirpedsignal pulse with the much shorter pump pulse. The 18.3 ps measured betweenthe time where the pump pulse overlaps with the narrow spectrum around 670nm and the time where it overlaps with the broader spectrum around 970 nm,indicates the dispersion of the signal. To confirm this, a simulation of the pulsepropagation through the 80 cm PCF was made by solving the extended nonlinearSchrodinger equation with a commercially available software [115]. Figure 8.6depicts how the spectral region from 620 nm to 1040 nm of the simulated SCdisperses relative to the pump wavelength at 1028 nm. A delay of roughly 18ps between wavelengths around 670 nm and 970 nm is observed in concordancewith the results presented in figure 8.5 b).
The broadband phasematching has significant influence on the duration ofthe amplified pulses as different delays cause spectral parts of different band-widths to be sliced out by the pump pulse. Autocorrelation measurements haverevealed pulse durations between 400 fs and 700 fs across the spectral range
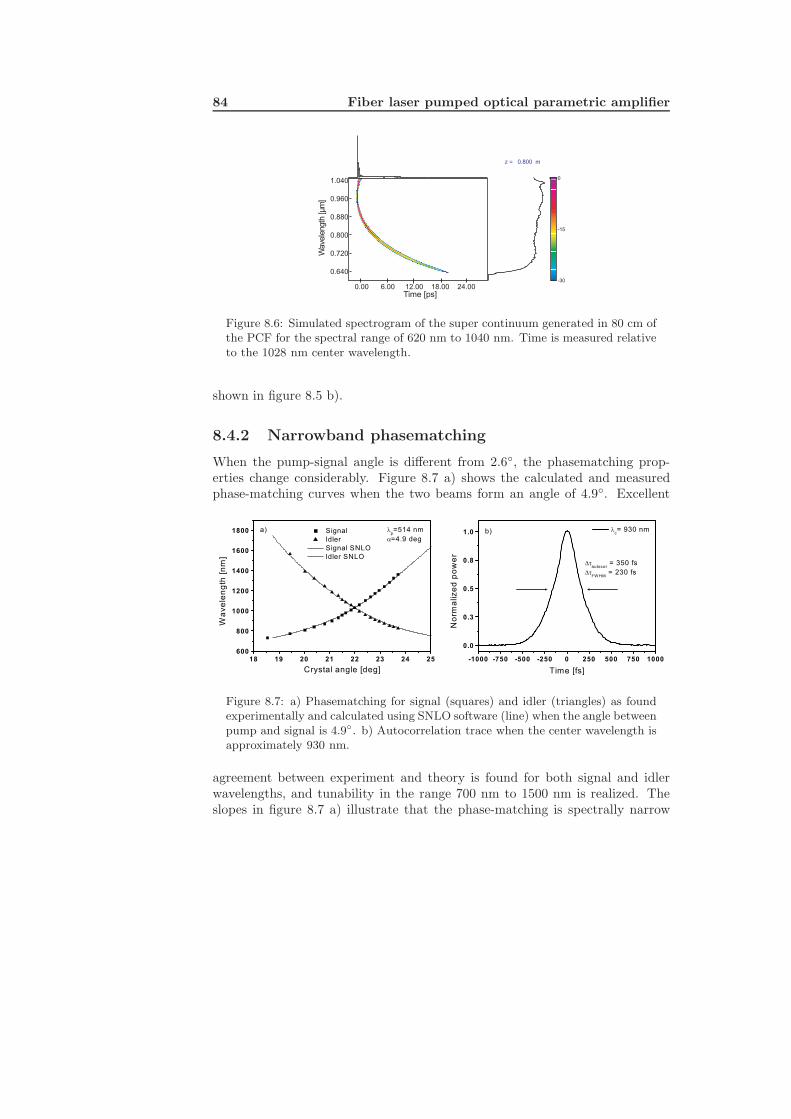
84 Fiber laser pumped optical parametric amplifier
z = 0.800 m
0.00 6.00 12.00 18.00 24.00Time [ps]
0.640
0.720
0.800
0.880
0.960
1.040
Wave
length
[µm
]
-30
-15
0
Figure 8.6: Simulated spectrogram of the super continuum generated in 80 cm ofthe PCF for the spectral range of 620 nm to 1040 nm. Time is measured relativeto the 1028 nm center wavelength.
shown in figure 8.5 b).
8.4.2 Narrowband phasematching
When the pump-signal angle is different from 2.6, the phasematching prop-erties change considerably. Figure 8.7 a) shows the calculated and measuredphase-matching curves when the two beams form an angle of 4.9. Excellent
Figure 8.7: a) Phasematching for signal (squares) and idler (triangles) as foundexperimentally and calculated using SNLO software (line) when the angle betweenpump and signal is 4.9. b) Autocorrelation trace when the center wavelength isapproximately 930 nm.
agreement between experiment and theory is found for both signal and idlerwavelengths, and tunability in the range 700 nm to 1500 nm is realized. Theslopes in figure 8.7 a) illustrate that the phase-matching is spectrally narrow
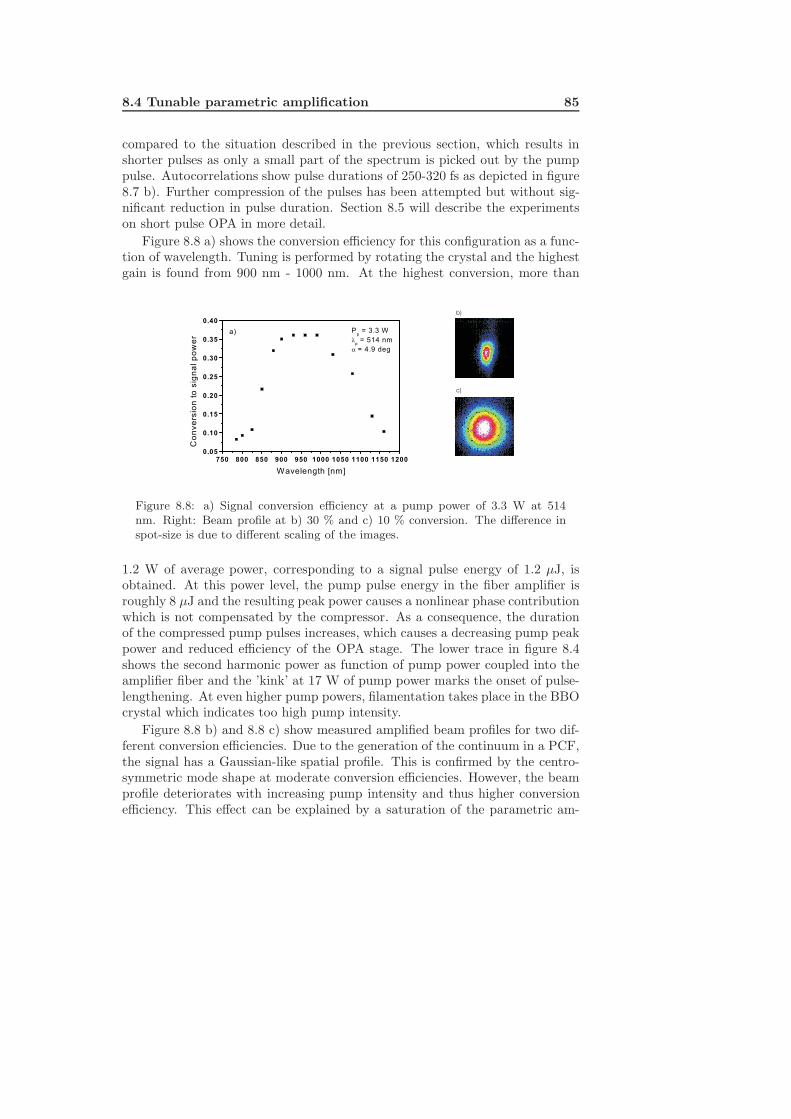
8.4 Tunable parametric amplification 85
compared to the situation described in the previous section, which results inshorter pulses as only a small part of the spectrum is picked out by the pumppulse. Autocorrelations show pulse durations of 250-320 fs as depicted in figure8.7 b). Further compression of the pulses has been attempted but without sig-nificant reduction in pulse duration. Section 8.5 will describe the experimentson short pulse OPA in more detail.
Figure 8.8 a) shows the conversion efficiency for this configuration as a func-tion of wavelength. Tuning is performed by rotating the crystal and the highestgain is found from 900 nm - 1000 nm. At the highest conversion, more than
b)
c)
Figure 8.8: a) Signal conversion efficiency at a pump power of 3.3 W at 514nm. Right: Beam profile at b) 30 % and c) 10 % conversion. The difference inspot-size is due to different scaling of the images.
1.2 W of average power, corresponding to a signal pulse energy of 1.2 µJ, isobtained. At this power level, the pump pulse energy in the fiber amplifier isroughly 8 µJ and the resulting peak power causes a nonlinear phase contributionwhich is not compensated by the compressor. As a consequence, the durationof the compressed pump pulses increases, which causes a decreasing pump peakpower and reduced efficiency of the OPA stage. The lower trace in figure 8.4shows the second harmonic power as function of pump power coupled into theamplifier fiber and the ’kink’ at 17 W of pump power marks the onset of pulse-lengthening. At even higher pump powers, filamentation takes place in the BBOcrystal which indicates too high pump intensity.
Figure 8.8 b) and 8.8 c) show measured amplified beam profiles for two dif-ferent conversion efficiencies. Due to the generation of the continuum in a PCF,the signal has a Gaussian-like spatial profile. This is confirmed by the centro-symmetric mode shape at moderate conversion efficiencies. However, the beamprofile deteriorates with increasing pump intensity and thus higher conversionefficiency. This effect can be explained by a saturation of the parametric am-
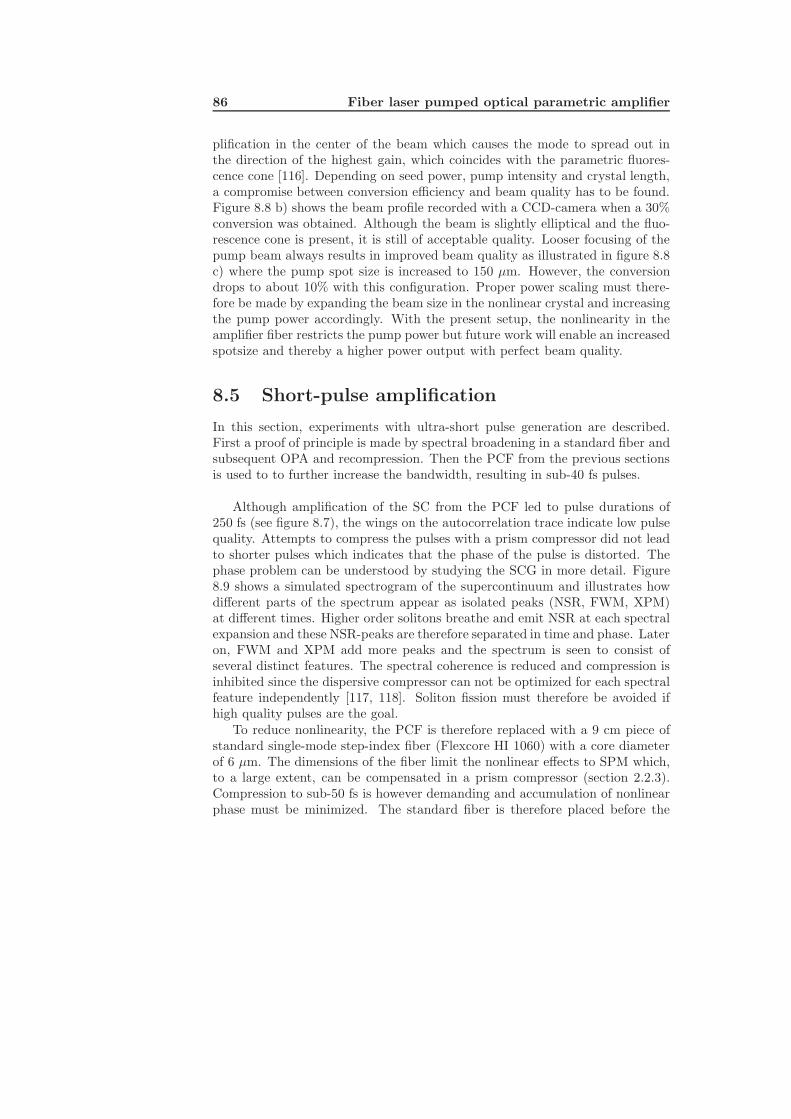
86 Fiber laser pumped optical parametric amplifier
plification in the center of the beam which causes the mode to spread out inthe direction of the highest gain, which coincides with the parametric fluores-cence cone [116]. Depending on seed power, pump intensity and crystal length,a compromise between conversion efficiency and beam quality has to be found.Figure 8.8 b) shows the beam profile recorded with a CCD-camera when a 30%conversion was obtained. Although the beam is slightly elliptical and the fluo-rescence cone is present, it is still of acceptable quality. Looser focusing of thepump beam always results in improved beam quality as illustrated in figure 8.8c) where the pump spot size is increased to 150 µm. However, the conversiondrops to about 10% with this configuration. Proper power scaling must there-fore be made by expanding the beam size in the nonlinear crystal and increasingthe pump power accordingly. With the present setup, the nonlinearity in theamplifier fiber restricts the pump power but future work will enable an increasedspotsize and thereby a higher power output with perfect beam quality.
8.5 Short-pulse amplification
In this section, experiments with ultra-short pulse generation are described.First a proof of principle is made by spectral broadening in a standard fiber andsubsequent OPA and recompression. Then the PCF from the previous sectionsis used to to further increase the bandwidth, resulting in sub-40 fs pulses.
Although amplification of the SC from the PCF led to pulse durations of250 fs (see figure 8.7), the wings on the autocorrelation trace indicate low pulsequality. Attempts to compress the pulses with a prism compressor did not leadto shorter pulses which indicates that the phase of the pulse is distorted. Thephase problem can be understood by studying the SCG in more detail. Figure8.9 shows a simulated spectrogram of the supercontinuum and illustrates howdifferent parts of the spectrum appear as isolated peaks (NSR, FWM, XPM)at different times. Higher order solitons breathe and emit NSR at each spectralexpansion and these NSR-peaks are therefore separated in time and phase. Lateron, FWM and XPM add more peaks and the spectrum is seen to consist ofseveral distinct features. The spectral coherence is reduced and compression isinhibited since the dispersive compressor can not be optimized for each spectralfeature independently [117, 118]. Soliton fission must therefore be avoided ifhigh quality pulses are the goal.
To reduce nonlinearity, the PCF is therefore replaced with a 9 cm piece ofstandard single-mode step-index fiber (Flexcore HI 1060) with a core diameterof 6 µm. The dimensions of the fiber limit the nonlinear effects to SPM which,to a large extent, can be compensated in a prism compressor (section 2.2.3).Compression to sub-50 fs is however demanding and accumulation of nonlinearphase must be minimized. The standard fiber is therefore placed before the
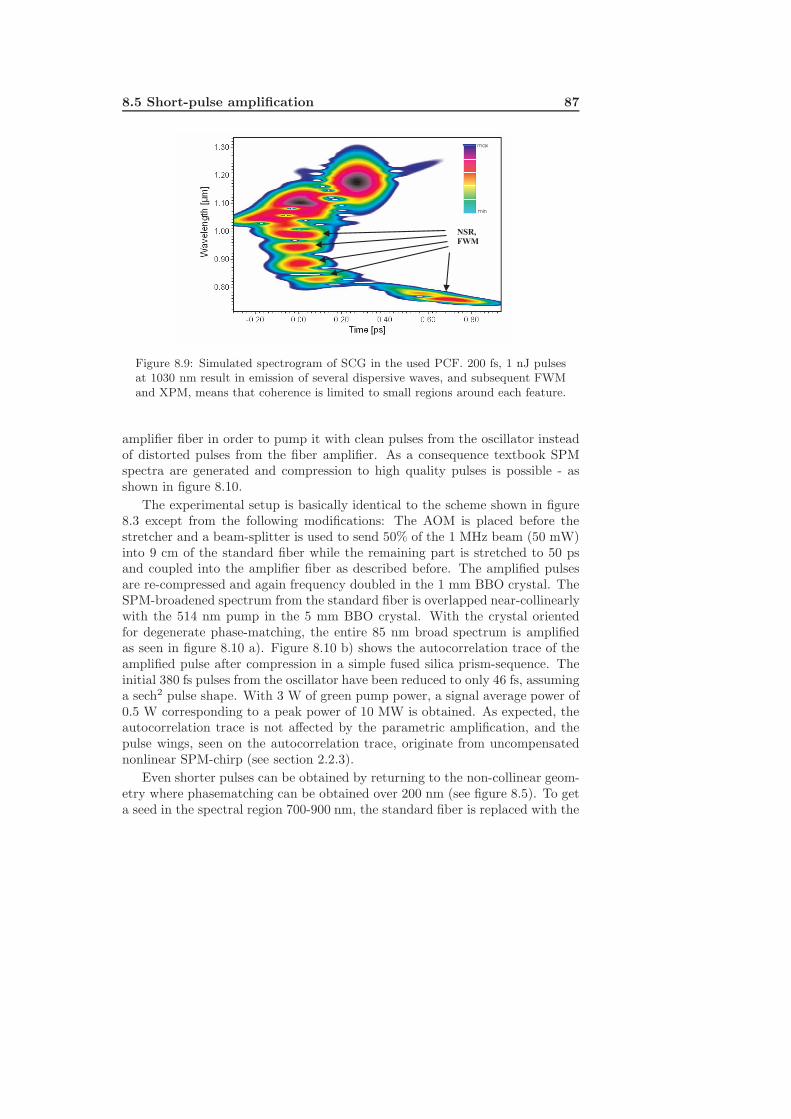
8.5 Short-pulse amplification 87
NSR,FWM
max
min
Figure 8.9: Simulated spectrogram of SCG in the used PCF. 200 fs, 1 nJ pulsesat 1030 nm result in emission of several dispersive waves, and subsequent FWMand XPM, means that coherence is limited to small regions around each feature.
amplifier fiber in order to pump it with clean pulses from the oscillator insteadof distorted pulses from the fiber amplifier. As a consequence textbook SPMspectra are generated and compression to high quality pulses is possible - asshown in figure 8.10.
The experimental setup is basically identical to the scheme shown in figure8.3 except from the following modifications: The AOM is placed before thestretcher and a beam-splitter is used to send 50% of the 1 MHz beam (50 mW)into 9 cm of the standard fiber while the remaining part is stretched to 50 psand coupled into the amplifier fiber as described before. The amplified pulsesare re-compressed and again frequency doubled in the 1 mm BBO crystal. TheSPM-broadened spectrum from the standard fiber is overlapped near-collinearlywith the 514 nm pump in the 5 mm BBO crystal. With the crystal orientedfor degenerate phase-matching, the entire 85 nm broad spectrum is amplifiedas seen in figure 8.10 a). Figure 8.10 b) shows the autocorrelation trace of theamplified pulse after compression in a simple fused silica prism-sequence. Theinitial 380 fs pulses from the oscillator have been reduced to only 46 fs, assuminga sech2 pulse shape. With 3 W of green pump power, a signal average power of0.5 W corresponding to a peak power of 10 MW is obtained. As expected, theautocorrelation trace is not affected by the parametric amplification, and thepulse wings, seen on the autocorrelation trace, originate from uncompensatednonlinear SPM-chirp (see section 2.2.3).
Even shorter pulses can be obtained by returning to the non-collinear geom-etry where phasematching can be obtained over 200 nm (see figure 8.5). To geta seed in the spectral region 700-900 nm, the standard fiber is replaced with the
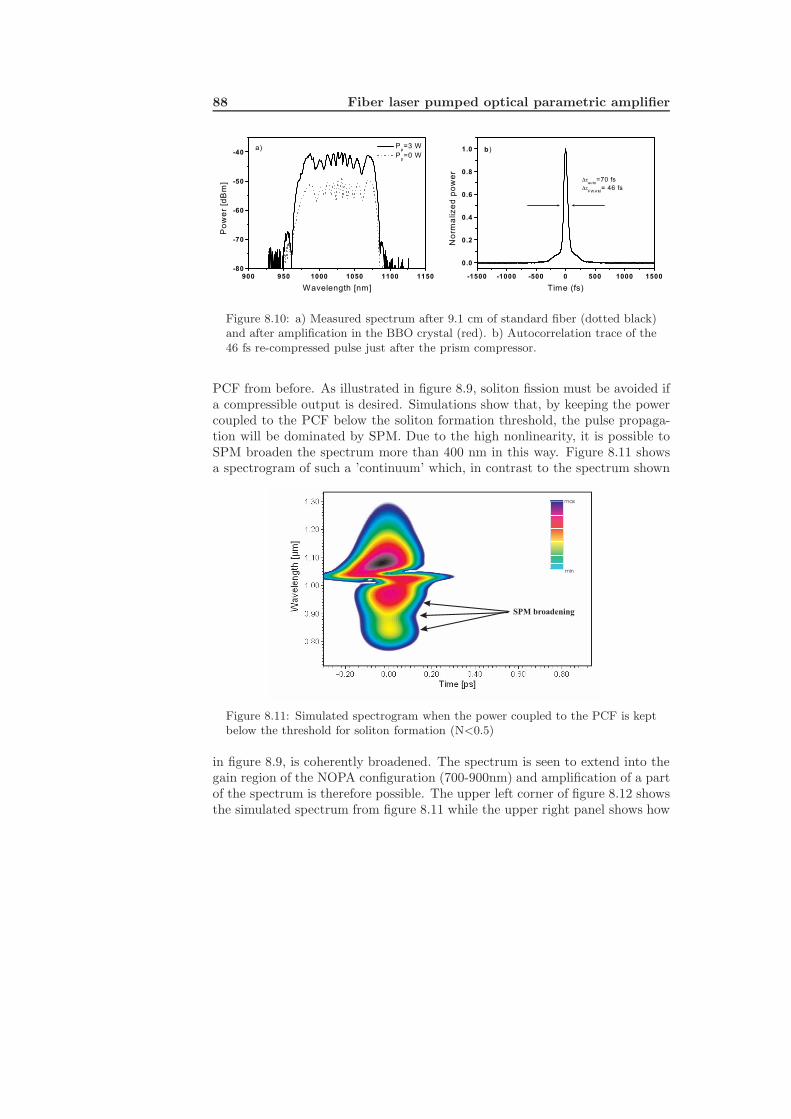
88 Fiber laser pumped optical parametric amplifier
Figure 8.10: a) Measured spectrum after 9.1 cm of standard fiber (dotted black)and after amplification in the BBO crystal (red). b) Autocorrelation trace of the46 fs re-compressed pulse just after the prism compressor.
PCF from before. As illustrated in figure 8.9, soliton fission must be avoided ifa compressible output is desired. Simulations show that, by keeping the powercoupled to the PCF below the soliton formation threshold, the pulse propaga-tion will be dominated by SPM. Due to the high nonlinearity, it is possible toSPM broaden the spectrum more than 400 nm in this way. Figure 8.11 showsa spectrogram of such a ’continuum’ which, in contrast to the spectrum shown
min
max
SPM broadening
Figure 8.11: Simulated spectrogram when the power coupled to the PCF is keptbelow the threshold for soliton formation (N<0.5)
in figure 8.9, is coherently broadened. The spectrum is seen to extend into thegain region of the NOPA configuration (700-900nm) and amplification of a partof the spectrum is therefore possible. The upper left corner of figure 8.12 showsthe simulated spectrum from figure 8.11 while the upper right panel shows how
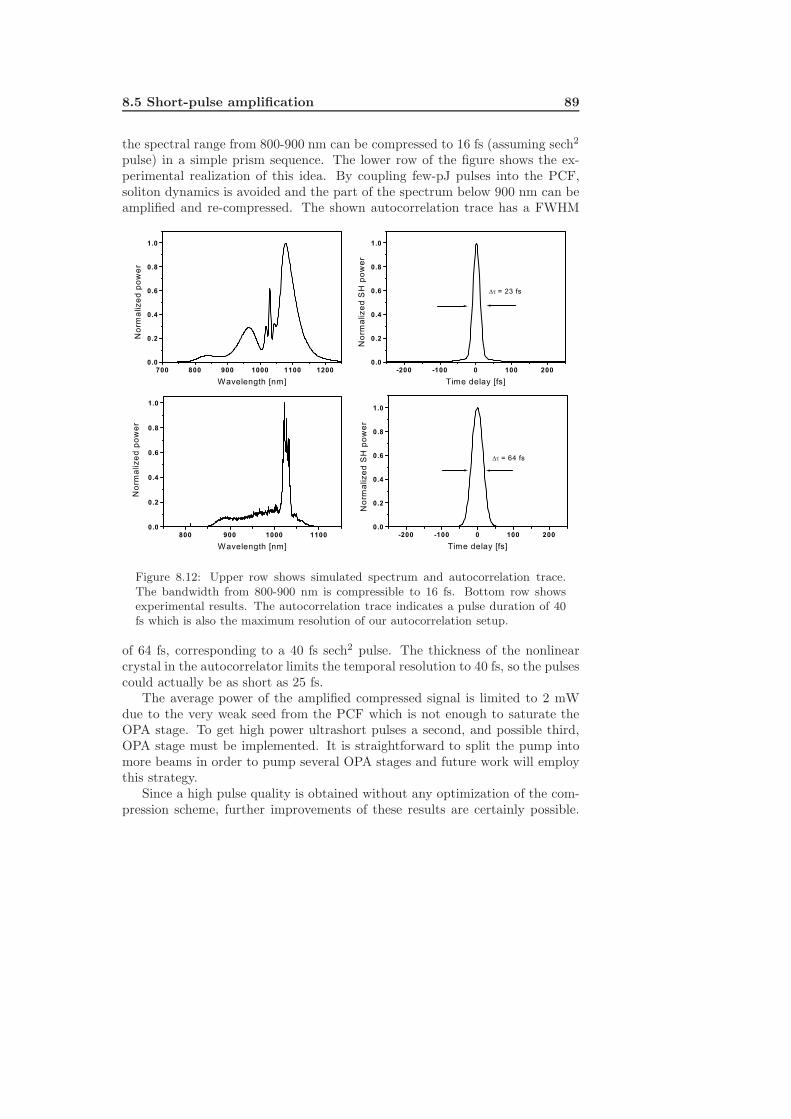
8.5 Short-pulse amplification 89
the spectral range from 800-900 nm can be compressed to 16 fs (assuming sech2
pulse) in a simple prism sequence. The lower row of the figure shows the ex-perimental realization of this idea. By coupling few-pJ pulses into the PCF,soliton dynamics is avoided and the part of the spectrum below 900 nm can beamplified and re-compressed. The shown autocorrelation trace has a FWHM
Figure 8.12: Upper row shows simulated spectrum and autocorrelation trace.The bandwidth from 800-900 nm is compressible to 16 fs. Bottom row showsexperimental results. The autocorrelation trace indicates a pulse duration of 40fs which is also the maximum resolution of our autocorrelation setup.
of 64 fs, corresponding to a 40 fs sech2 pulse. The thickness of the nonlinearcrystal in the autocorrelator limits the temporal resolution to 40 fs, so the pulsescould actually be as short as 25 fs.
The average power of the amplified compressed signal is limited to 2 mWdue to the very weak seed from the PCF which is not enough to saturate theOPA stage. To get high power ultrashort pulses a second, and possible third,OPA stage must be implemented. It is straightforward to split the pump intomore beams in order to pump several OPA stages and future work will employthis strategy.
Since a high pulse quality is obtained without any optimization of the com-pression scheme, further improvements of these results are certainly possible.
90 Fiber laser pumped optical parametric amplifier
Furthermore, the amount of power coupled to the PCF must be optimized sincemore bandwidth should be possible while still avoiding soliton dynamics. Itwould also be interesting to experiment with different PCFs as varying theZDW may allow increased bandwidth within the NOPA gain region.
8.6 Summary and outlook
In conclusion, an efficient optical parametric amplifier pumped by a fiber am-plifier is demonstrated and shows the potential of this approach. Tunable fem-tosecond pulses at a repetition rate of 1 MHz and pulse energies up to 1.2 µJare obtained. The simplicity of the setup and the potential for power scalingmakes this configuration an interesting alternative to traditional Ti:Sapphirebased NOPA-schemes.
Inability to compress the amplified SC pulses to less than 250-300 fs is foundto originate in soliton dynamics and avoidance of soliton fission is necessary forhigh quality pulse compression. By using a standard fiber to SPM-broaden thespectrum, compression to 46 fs corresponding to peak powers of 10 MW, isachieved. Numerical simulations predict that sub-20 fs pulses are possible if aPCF is used for spectral broadening while keeping the power below the solitonformation threshold. Preliminary experiments indicate that this might actuallybe achievable in practice and sub-40 fs pulses are demonstrated without anyoptimization of the SC or the compression scheme.
Future work will focus on power scaling and further reduction of the pulseduration. It will be necessary to improve the performance of the fiber amplifierin order to avoid the accumulation of nonlinear phase and the resulting pumppulse-broadening when operating at high powers. It is fairly straight-forwardto solve this problem as it is simply a matter of reducing the peak-intensity inthe fiber. Using gratings with higher groove density and large-aperture optics,it is possible to stretch the pulses to more than 1 ns as opposed to the 50 psused here. The onset of pulse-broadening will then be pushed with factor of 20or more. Additionally, the amplifier fiber will be replaced with a short-length,LMA Ytterbium doped rod-type fiber which can deliver the same gain as thepresent fiber but with significantly reduced nonlinearity [28]. With relativelysimple changes, the fiber amplifier will therefore be able to deliver compressiblepulses at power levels many times higher than presented here. Using this conceptas pump laser for two or more OPA-stages will enable generation of high averagepower, high peak power ultrashort (potentially sub-10 fs pulses) laser pulses.

Chapter 9
Summary and acknowledgements
91
92 Summary and acknowledgements
9.1 Summary
This thesis has investigated several applications of nonlinear optics and opticalfibers.Chapter 3 described how an intra cavity frequency doubled Ti:Sapphire laserwas used to pump an optical parametric amplifier seeded by a super continuumfrom a photonic crystal fiber (PCF). Amplification of the super continuum wasdemonstrated but the limited available pump power reduced the impact of theexperiment to a proof of principle.Chapter 4 investigated four wave mixing in a highly nonlinear PCF. The un-usual dispersion of the fiber enabled four wave mixing to take place over a widewavelength range when the fiber was pumped in the anomalous regime and closeto the zero-dispersion wavelength. A tunable output was therefore possible evenwith low pump powers and wavelength conversion with continuous wave laserswas demonstrated. Fibers with this type of dispersion profile may be interestingmedia for optical parametric oscillation.Chapter 5 described an all-fiber Q-switched fiber laser based on magnetostric-tive modulation of a fiber Bragg grating. An Yb-doped single-mode fiber wasused as gain medium and 500 nJ, 200 ns pulses were demonstrated. The outputwas limited by pre-lasing on the weakly reflective sidebands of the gratings andemployment of strongly apodized gratings is required for further progress. Itmay be possible to use the magnetostrictive technique to directly Q-switch alarge mode area fiber which would greatly enhance the power extraction.Chapter 6 described a fiber based interferometric setup to measure dispersionin optical fibers. The method is simple, fast and allows accurate determinationof the fiber dispersion in the wavelength range 900-1200 nm.In Chapter 7, dual-wavelength pumping of PCFs was studied. Experiments,as well as simulations, showed that co-propagating two femtosecond pulses atopposite sides of the zero dispersion wavelength led to spectral broadening dueto cross phase modulation of the dispersive pulse by fundamental solitons. Themechanism is used commercially in a white-light source from Koheras and theimproved understanding of the process may lead to further product develop-ment.In Chapter 8 the idea of amplifying a super continuum from a PCF in an opticalparametric amplifier stage was pursued with a high power fiber laser pumpedsetup. The performance of the fiber laser allowed demonstration of a MHz rep-etition rate, µJ-level, tunable femtosecond source. Furthermore, pulses fromthe amplified super continuum were compressed to sub-40 fs and simulationsindicated that sub-20 fs pulses are possible. Since the setup is power scalable,it may represent a new route to a compact, high power ultra-fast laser system.
9.1 Summary 93
9.1.1 Perspectives
Optical fibers and PCFs in particular, are ’hot topics’ in the research commu-nity and will continue to be so in the coming decade. Compact fiber baseddevices and lasers are already emerging and will without doubt replace manyconventional solid state lasers in research labs and eventually in industry. Thepotential simplicity of fiber based systems may even allow real-world applica-tions of the ultra-fast laser technology. Femtosecond laser systems are nowinvaluable tools in many branches of science, but industrial implementation hasso far been excluded by the complexity of the setups. Lifting this technologyout of the science labs is certain to bring new and interesting applications.
Since the first demonstration of the PCFs in 1996, a lot of research activityhas been focused on understanding the properties of these fibers. The spectacu-lar super continua from small core, highly nonlinear PCFs are now understoodand have already found applications in tomography and frequency metrology.The frequency standard of today is actually based on the frequency comb in theoutput from a PCF [119].
But the PCF technology offers many other possibilities than high nonlinear-ity and dispersion management. High birefringence, multi-core and multi-claddesigns, high power carriage and hosting of Rare-Earth dopants can all be im-plemented in the fiber design. The latter has enabled a new generation of highpower fiber lasers which are performing as well or better than conventional solidstate lasers. High power fiber lasers are actually emerging as an increasinglyhot topic on their own. Apart from the interesting physics of high power gener-ation, there is also a significant financial motivation to improve the performanceof these lasers. The prospect of getting a share of a prosperous laser market hasencouraged investments in the development of these fiber lasers, and as a resultthe technology has matured in just a few years. It will be most interesting tosee what the future brings for high power fiber lasers. If they can be made tofulfil the necessary requirements for durability and stability, there is no doubtthat they will successfully take over many laser applications.
94 Summary and acknowledgements
9.2 Acknowledgements
I have had a great time as a student at the Aarhus University and I wish to thanka number of people for contributing to this experience. First of all I acknowledgemy supervisor Søren Keiding for his support during the last 4 years. I am mostgrateful for Søren accepting me as a PhD student and it has been a thrill to bea member of his group. Søren has managed to function as professor, protectorand supervisor while still maintaining an informal and humoristic atmosphere.I also thank Jan Thøgersen for all his help - Jan has been an inspiration in thelab and has contributed to most of the work presented here. Likewise, I thankJakob Juul Larsen for his support. Jakob functioned as external supervisor forthe NKT-Academy students in Arhus for about two years and was an invaluablehelp for all of us.
All members of Femtolab and NKT-lab are gratefully acknowledged for theircompanionship and for creating an inspiring and pleasant environment. Specialthanks to Victoria Birkedal for proof-reading this thesis.
I also acknowledge the helpfulness of the people at Crystal Fibre and Ko-heras and thank NKT Academy for partially financing my Ph.D. studies. NKT-Research is especially acknowledged for their financial and technical supportduring the last four years. Visiting NKT-Research has always brought inspira-tion and drive to my projects and I am most grateful for the attention and helpI have received from their side. Special thanks to Claus Friis Pedersen for hissupport and engagement in the work in Aarhus.
The members of the fiber laser group in Jena are thankfully acknowledged fortheir hospitality and excellent company. It was highly motivating to experiencethe attitude and work ethics in their labs and I really appreciate the time Ispent there.
Finally, I would like to thank my friends and family outside the university.They have always been supportive and showed interest for my project. The last’gracias’ is for Dolores who has lived through four Danish winters to give methe opportunity to pursue this PhD. She has been extremely supportive and hasalso helped me with this thesis.
Thomas Vestergaard Andersen

Appendix A
List of Abbrevations
ASE Amplified spontaneous emissionBBO β-Barium BorateBS Beam splitterCCD Charge-coupled deviceD Dispersion parameterDC Double cladEr ErbiumFD Finite differencefs FemtosecondFT Fourier transformFWHM Full-width at half maximumFWM Four wave mixingFOPO Fiber optical parametric oscillatorGVD Group velocity dispersionHWHM Half-width at half maximum
95

96 List of abbreviations
IR InfraredLMA Large mode areaMF Microstructured fiberMOSFET Metal oxide semiconductor field effect transistorns NanosecondNA Numerical apertureNd:YAG Neodymium:Yttrium Aluminum GarnetNIR Near-infraredNL NonlinearNSR Non-solitonic radiationNOPA Non-collinear parametric amplificationOPA Optical parametric amplificationPBG Photonic bandgapPCF Photonic crystal fiberPM Polarization maintainingps PicosecondRE Rare EarthSC SupercontinuumSCG Super continuum generationSEM Scanning electron microscopeSPM Self-phase modulationTi:Sapphire Titanium SapphireTOD Third order dispersionWDM Wavelength division multiplexingXPM Cross phase modulationYb YtterbiumZDW Zero dispersion wavelength

Appendix B
Numerical model
A numerical model is made to investigate the origin of the envelope modulationobserved from the all-fiber Q-switched laser presented in chapter 5. The schemepresented here has also been used to simulate fiber amplifiers.
97
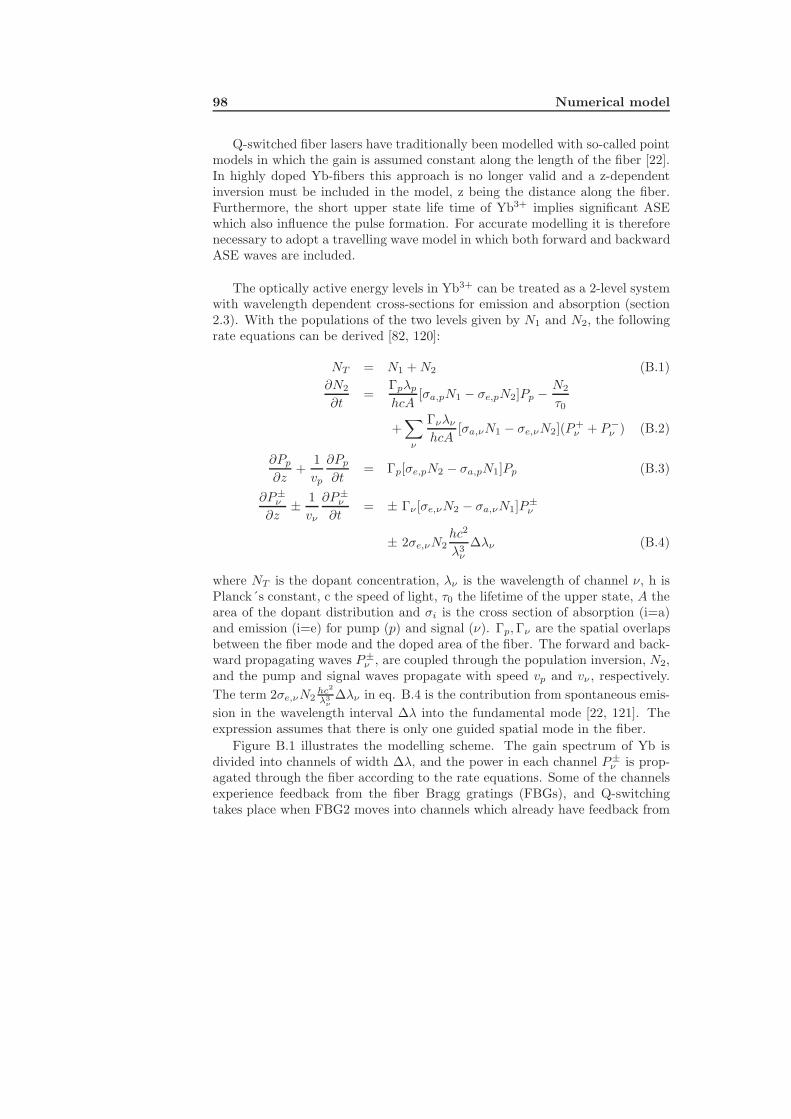
98 Numerical model
Q-switched fiber lasers have traditionally been modelled with so-called pointmodels in which the gain is assumed constant along the length of the fiber [22].In highly doped Yb-fibers this approach is no longer valid and a z-dependentinversion must be included in the model, z being the distance along the fiber.Furthermore, the short upper state life time of Yb3+ implies significant ASEwhich also influence the pulse formation. For accurate modelling it is thereforenecessary to adopt a travelling wave model in which both forward and backwardASE waves are included.
The optically active energy levels in Yb3+ can be treated as a 2-level systemwith wavelength dependent cross-sections for emission and absorption (section2.3). With the populations of the two levels given by N1 and N2, the followingrate equations can be derived [82, 120]:
NT = N1 + N2 (B.1)∂N2
∂t=
Γpλp
hcA[σa,pN1 − σe,pN2]Pp − N2
τ0
+∑
ν
Γνλν
hcA[σa,νN1 − σe,νN2](P+
ν + P−ν ) (B.2)
∂Pp
∂z+
1vp
∂Pp
∂t= Γp[σe,pN2 − σa,pN1]Pp (B.3)
∂P±ν
∂z± 1
vν
∂P±ν
∂t= ± Γν [σe,νN2 − σa,νN1]P±
ν
± 2σe,νN2hc2
λ3ν
∆λν (B.4)
where NT is the dopant concentration, λν is the wavelength of channel ν, h isPlanck´s constant, c the speed of light, τ0 the lifetime of the upper state, A thearea of the dopant distribution and σi is the cross section of absorption (i=a)and emission (i=e) for pump (p) and signal (ν). Γp, Γν are the spatial overlapsbetween the fiber mode and the doped area of the fiber. The forward and back-ward propagating waves P±
ν , are coupled through the population inversion, N2,and the pump and signal waves propagate with speed vp and vν , respectively.The term 2σe,νN2
hc2
λ3ν
∆λν in eq. B.4 is the contribution from spontaneous emis-sion in the wavelength interval ∆λ into the fundamental mode [22, 121]. Theexpression assumes that there is only one guided spatial mode in the fiber.
Figure B.1 illustrates the modelling scheme. The gain spectrum of Yb isdivided into channels of width ∆λ, and the power in each channel P±
ν is prop-agated through the fiber according to the rate equations. Some of the channelsexperience feedback from the fiber Bragg gratings (FBGs), and Q-switchingtakes place when FBG2 moves into channels which already have feedback from
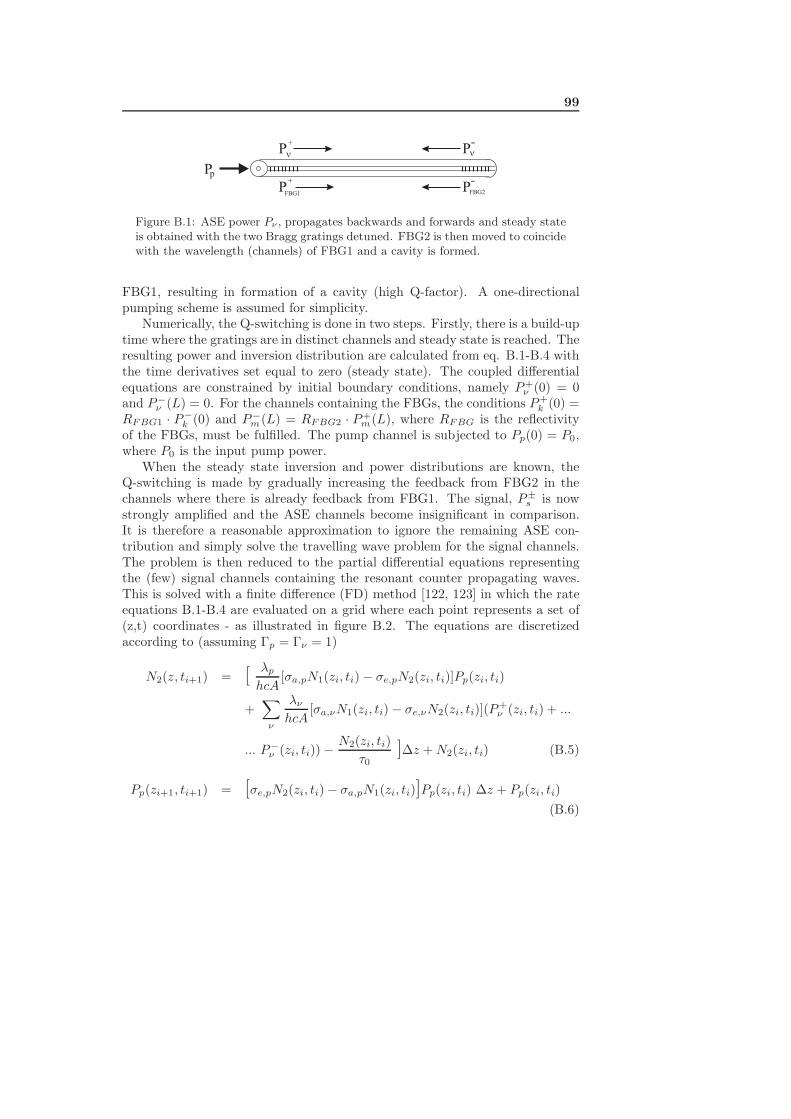
99
P+
P-
P+
FBG1P
-FBG2
Pp
Figure B.1: ASE power Pν , propagates backwards and forwards and steady stateis obtained with the two Bragg gratings detuned. FBG2 is then moved to coincidewith the wavelength (channels) of FBG1 and a cavity is formed.
FBG1, resulting in formation of a cavity (high Q-factor). A one-directionalpumping scheme is assumed for simplicity.
Numerically, the Q-switching is done in two steps. Firstly, there is a build-uptime where the gratings are in distinct channels and steady state is reached. Theresulting power and inversion distribution are calculated from eq. B.1-B.4 withthe time derivatives set equal to zero (steady state). The coupled differentialequations are constrained by initial boundary conditions, namely P+
ν (0) = 0and P−
ν (L) = 0. For the channels containing the FBGs, the conditions P+k (0) =
RFBG1 · P−k (0) and P−
m(L) = RFBG2 · P+m(L), where RFBG is the reflectivity
of the FBGs, must be fulfilled. The pump channel is subjected to Pp(0) = P0,where P0 is the input pump power.
When the steady state inversion and power distributions are known, theQ-switching is made by gradually increasing the feedback from FBG2 in thechannels where there is already feedback from FBG1. The signal, P±
s is nowstrongly amplified and the ASE channels become insignificant in comparison.It is therefore a reasonable approximation to ignore the remaining ASE con-tribution and simply solve the travelling wave problem for the signal channels.The problem is then reduced to the partial differential equations representingthe (few) signal channels containing the resonant counter propagating waves.This is solved with a finite difference (FD) method [122, 123] in which the rateequations B.1-B.4 are evaluated on a grid where each point represents a set of(z,t) coordinates - as illustrated in figure B.2. The equations are discretizedaccording to (assuming Γp = Γν = 1)
N2(z, ti+1) = [ λp
hcA[σa,pN1(zi, ti) − σe,pN2(zi, ti)]Pp(zi, ti)
+∑
ν
λν
hcA[σa,νN1(zi, ti) − σe,νN2(zi, ti)](P+
ν (zi, ti) + ...
... P−ν (zi, ti)) − N2(zi, ti)
τ0]∆z + N2(zi, ti) (B.5)
Pp(zi+1, ti+1) = [σe,pN2(zi, ti) − σa,pN1(zi, ti)]Pp(zi, ti) ∆z + Pp(zi, ti)(B.6)
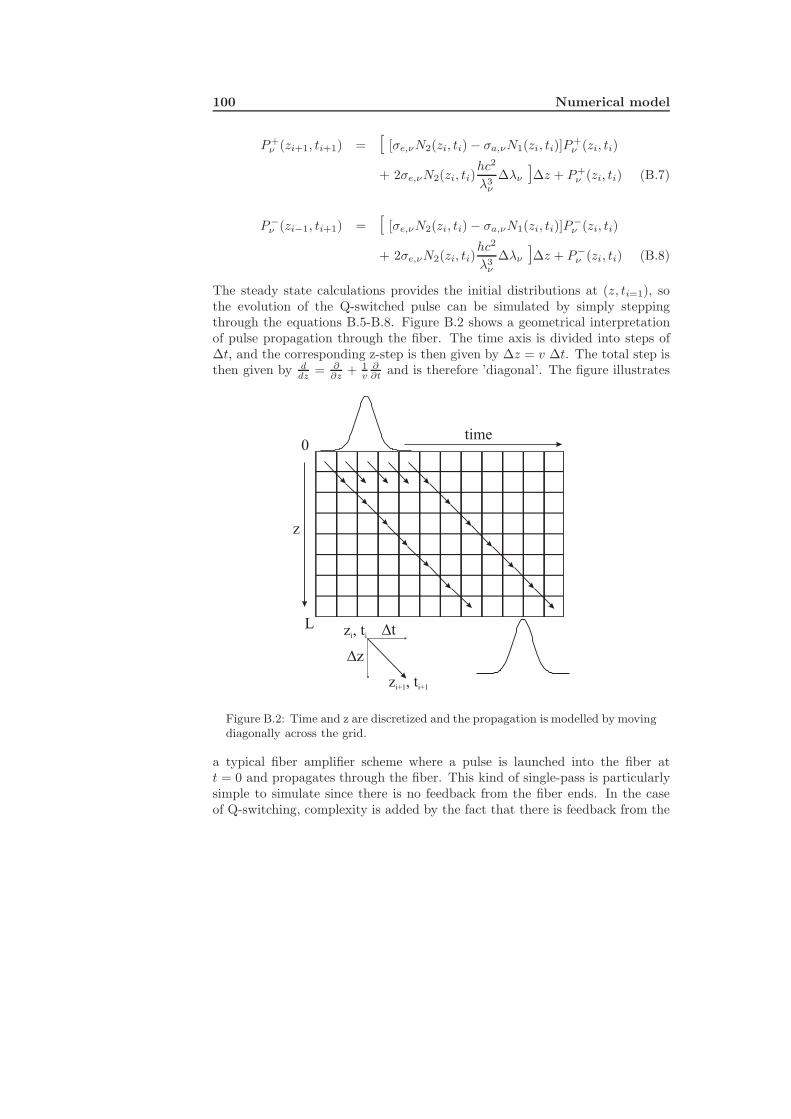
100 Numerical model
P+ν (zi+1, ti+1) = [ [σe,νN2(zi, ti) − σa,νN1(zi, ti)]P+
ν (zi, ti)
+ 2σe,νN2(zi, ti)hc2
λ3ν
∆λν ]∆z + P+ν (zi, ti) (B.7)
P−ν (zi−1, ti+1) = [ [σe,νN2(zi, ti) − σa,νN1(zi, ti)]P−
ν (zi, ti)
+ 2σe,νN2(zi, ti)hc2
λ3ν
∆λν ]∆z + P−ν (zi, ti) (B.8)
The steady state calculations provides the initial distributions at (z, ti=1), sothe evolution of the Q-switched pulse can be simulated by simply steppingthrough the equations B.5-B.8. Figure B.2 shows a geometrical interpretationof pulse propagation through the fiber. The time axis is divided into steps of∆t, and the corresponding z-step is then given by ∆z = v ∆t. The total step isthen given by d
dz = ∂∂z + 1
v∂∂t and is therefore ’diagonal’. The figure illustrates
0
L
time
t
z
z
z , ti i
z , ti+1 i+1
Figure B.2: Time and z are discretized and the propagation is modelled by movingdiagonally across the grid.
a typical fiber amplifier scheme where a pulse is launched into the fiber att = 0 and propagates through the fiber. This kind of single-pass is particularlysimple to simulate since there is no feedback from the fiber ends. In the caseof Q-switching, complexity is added by the fact that there is feedback from the
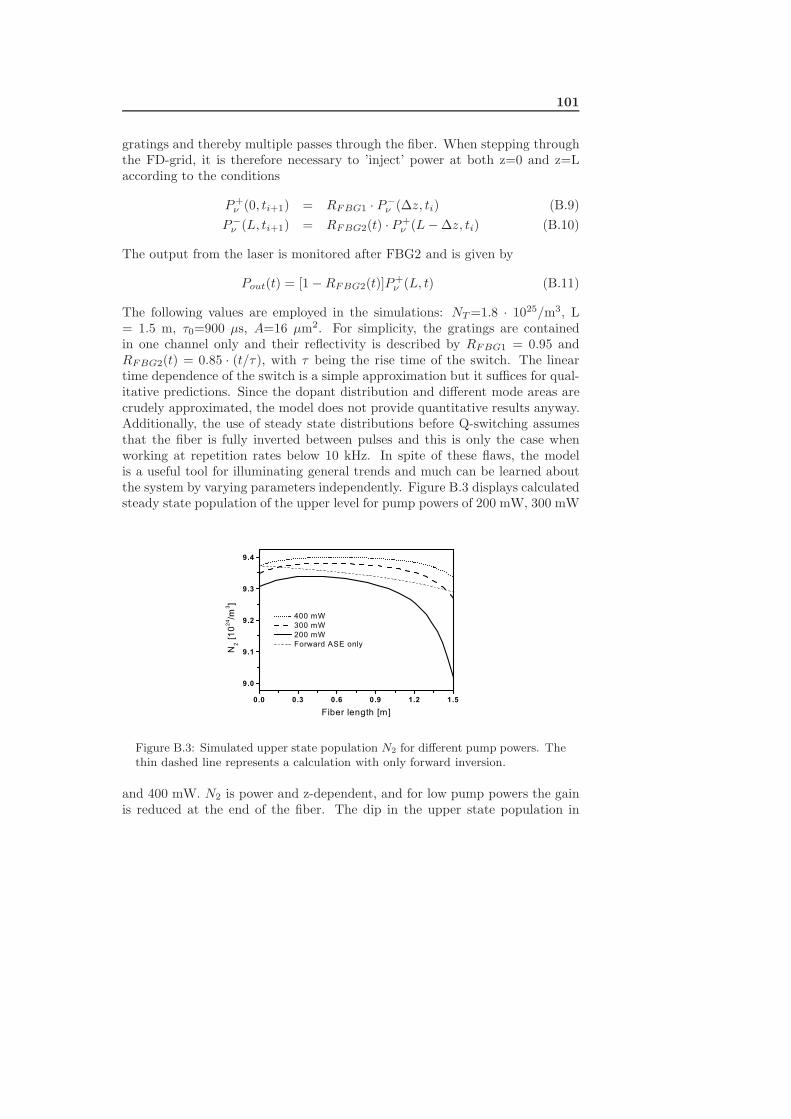
101
gratings and thereby multiple passes through the fiber. When stepping throughthe FD-grid, it is therefore necessary to ’inject’ power at both z=0 and z=Laccording to the conditions
P+ν (0, ti+1) = RFBG1 · P−
ν (∆z, ti) (B.9)P−
ν (L, ti+1) = RFBG2(t) · P+ν (L − ∆z, ti) (B.10)
The output from the laser is monitored after FBG2 and is given by
Pout(t) = [1 − RFBG2(t)]P+ν (L, t) (B.11)
The following values are employed in the simulations: NT =1.8 · 1025/m3, L= 1.5 m, τ0=900 µs, A=16 µm2. For simplicity, the gratings are containedin one channel only and their reflectivity is described by RFBG1 = 0.95 andRFBG2(t) = 0.85 · (t/τ), with τ being the rise time of the switch. The lineartime dependence of the switch is a simple approximation but it suffices for qual-itative predictions. Since the dopant distribution and different mode areas arecrudely approximated, the model does not provide quantitative results anyway.Additionally, the use of steady state distributions before Q-switching assumesthat the fiber is fully inverted between pulses and this is only the case whenworking at repetition rates below 10 kHz. In spite of these flaws, the modelis a useful tool for illuminating general trends and much can be learned aboutthe system by varying parameters independently. Figure B.3 displays calculatedsteady state population of the upper level for pump powers of 200 mW, 300 mW
Figure B.3: Simulated upper state population N2 for different pump powers. Thethin dashed line represents a calculation with only forward inversion.
and 400 mW. N2 is power and z-dependent, and for low pump powers the gainis reduced at the end of the fiber. The dip in the upper state population in
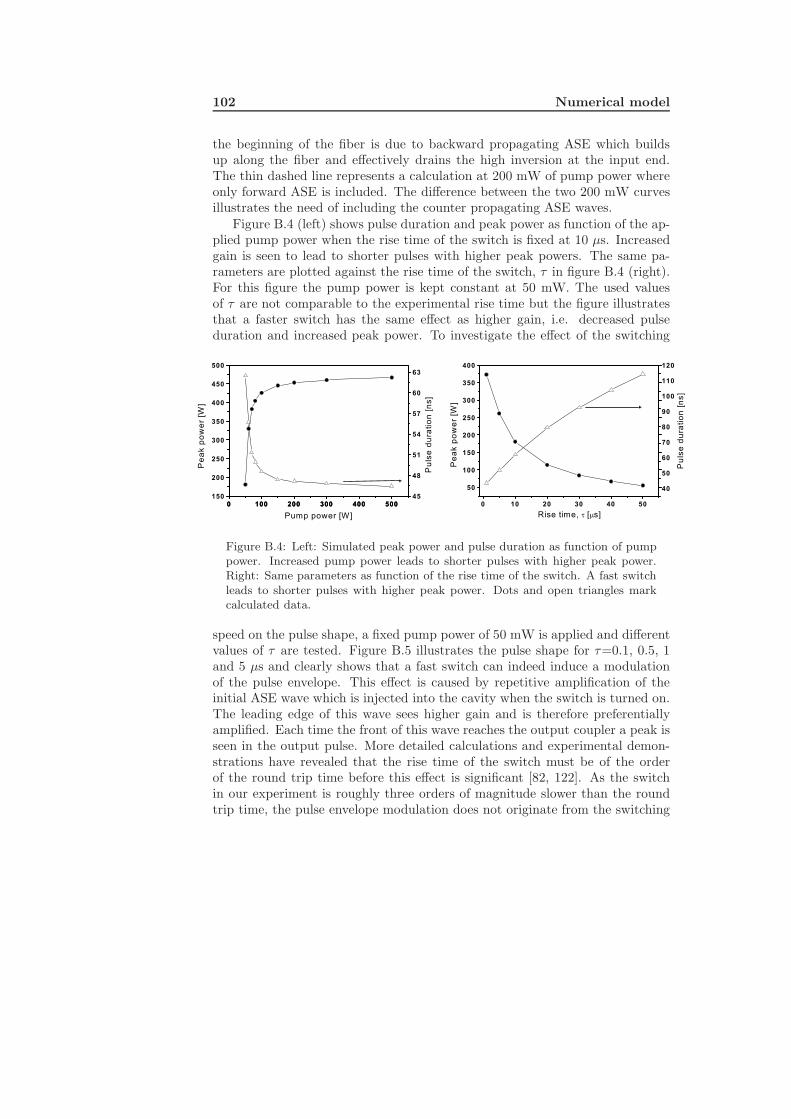
102 Numerical model
the beginning of the fiber is due to backward propagating ASE which buildsup along the fiber and effectively drains the high inversion at the input end.The thin dashed line represents a calculation at 200 mW of pump power whereonly forward ASE is included. The difference between the two 200 mW curvesillustrates the need of including the counter propagating ASE waves.
Figure B.4 (left) shows pulse duration and peak power as function of the ap-plied pump power when the rise time of the switch is fixed at 10 µs. Increasedgain is seen to lead to shorter pulses with higher peak powers. The same pa-rameters are plotted against the rise time of the switch, τ in figure B.4 (right).For this figure the pump power is kept constant at 50 mW. The used valuesof τ are not comparable to the experimental rise time but the figure illustratesthat a faster switch has the same effect as higher gain, i.e. decreased pulseduration and increased peak power. To investigate the effect of the switching
Figure B.4: Left: Simulated peak power and pulse duration as function of pumppower. Increased pump power leads to shorter pulses with higher peak power.Right: Same parameters as function of the rise time of the switch. A fast switchleads to shorter pulses with higher peak power. Dots and open triangles markcalculated data.
speed on the pulse shape, a fixed pump power of 50 mW is applied and differentvalues of τ are tested. Figure B.5 illustrates the pulse shape for τ=0.1, 0.5, 1and 5 µs and clearly shows that a fast switch can indeed induce a modulationof the pulse envelope. This effect is caused by repetitive amplification of theinitial ASE wave which is injected into the cavity when the switch is turned on.The leading edge of this wave sees higher gain and is therefore preferentiallyamplified. Each time the front of this wave reaches the output coupler a peak isseen in the output pulse. More detailed calculations and experimental demon-strations have revealed that the rise time of the switch must be of the orderof the round trip time before this effect is significant [82, 122]. As the switchin our experiment is roughly three orders of magnitude slower than the roundtrip time, the pulse envelope modulation does not originate from the switching
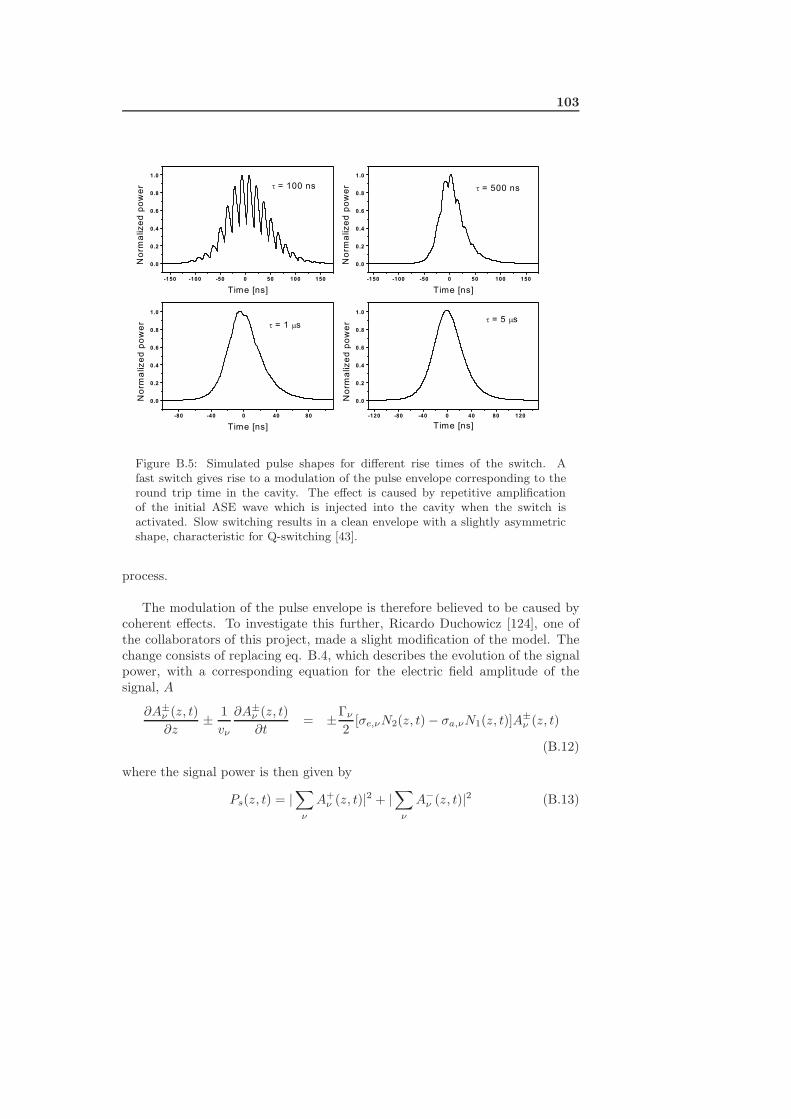
103
Figure B.5: Simulated pulse shapes for different rise times of the switch. Afast switch gives rise to a modulation of the pulse envelope corresponding to theround trip time in the cavity. The effect is caused by repetitive amplificationof the initial ASE wave which is injected into the cavity when the switch isactivated. Slow switching results in a clean envelope with a slightly asymmetricshape, characteristic for Q-switching [43].
process.
The modulation of the pulse envelope is therefore believed to be caused bycoherent effects. To investigate this further, Ricardo Duchowicz [124], one ofthe collaborators of this project, made a slight modification of the model. Thechange consists of replacing eq. B.4, which describes the evolution of the signalpower, with a corresponding equation for the electric field amplitude of thesignal, A
∂A±ν (z, t)∂z
± 1vν
∂A±ν (z, t)∂t
= ±Γν
2[σe,νN2(z, t) − σa,νN1(z, t)]A±
ν (z, t)
(B.12)
where the signal power is then given by
Ps(z, t) = |∑
ν
A+ν (z, t)|2 + |
∑ν
A−ν (z, t)|2 (B.13)
104 Numerical model
This expression allows simulation of beating between co-propagating waves, andby dividing the bandwidth of the grating into k channels, a time and wavelengthdependent phase-shift can be incorporated as well.
As before, a steady state solution to the rate equations is first obtained andthe resulting power distributions are propagated through the FD grid. Counter-propagating waves are only coupled through the FBGs which are simulated byassuming a homogeneous refractive index distribution and an added phase shiftwhen the frequency of the incoming wave is different from the Bragg frequency[83]. The boundary conditions, including the (complex) reflection coefficients ofboth gratings, are then given by
Pp(t, z = 0) = P0
A+ν (t, z = 0) = A−
ν (t, z = 0)r0,ν (B.14)A−
ν (t, z = L) = A+ν (t, z = L)rL,ν(f(t))
where P0 is the incident pump power and ri are the reflection coefficients in ref.[83]. The time dependent Bragg frequency, f(t) is modelled by the followingexpression
f(t) = f0 − ∆f [1 − sin2(2πFt)] (B.15)
where ∆f=0.3 nm and F is the frequency with which the grating is modulated.The calculations give rise to the pulse shape displayed in figure 5.5 which
shows qualitative agreement with the experimentally observed pulse. It shouldbe noted that the time-dependent phase shift upon reflection at FBG2 is re-quired for obtaining the modulation. Similar effects have been reported in othersystems [84], and it seems probable that the motion of FBG2 is the cause of theenvelope modulation. In this context, it is interesting that experiments withpulsed distributed feedback fiber lasers where the gratings are stationary, donot lead to these amplitude modulations [85].
References
[1] (http://www.nkt.dk).
[2] A. V. Husakou and J. Herrmann, “Supercontinuum generation of higher-order solitons by fission in photonic crystal fibers,” Phys. Rev. Lett 87,901 (2001).
[3] J. Herrmann, U. Griebner, N. Zhavoronkov, A. Husakou, D. Nickel, J. C.Knight, W. J. Wadsworth, and P. S. J. Russell, “Experimental evidence forsupercontinuum generation by fission of higher-order solitons in photoniccrystal fibers,” Phys. Rev. Lett. 88, 901–904 (2002).
[4] (http://www.imra.com).
[5] (http://www.aep.cornell.edu).
[6] J. R. Buckley, F. W. Wise, F. O. Ilday, and T. Sosnowski, “Femtosecondfiber lasers with pulse energies above 10 nJ,” Opt. Lett. 30, 1888–1890(2005).
[7] (http://www.ipgphotonics.com).
[8] (http://www.iap.uni-jena.de).
[9] F. Roser, J. Rothhard, B. Ortac, O. Schmidt, T. Schreiber, J. Limpert,and A. Tunnermann, “131 W 220 fs fiberlaser system,” Opt. Lett. 30,2754–2756 (2005).
[10] R. Boyd, Nonlinear optics (Academic Press, 1992).
[11] K. J. Blow and D. Wood, “Theoretical description of transient stimulatedRaman scattering in optical fibers,” J. Quantum Electronics 25, 2665(1989).
[12] G. P. Agrawal, Nonlinear fiber optics (Academic, New York, 1995).
105
106 REFERENCES
[13] R. H. Stolen, J. P. Gordon, W. J. Tomlinson, and H. A. Haus, “Ramanresponse function of silica-core fibers,” J. Opt. Soc. Am. B 6, 1159 (1989).
[14] A. Ghatak and K. Thyagarajan, Introduction to fiber optics, chap. 17, pp.384–386 (Cambridge, 2000).
[15] P. V. Mamyshev and S. V. Chernikov, “Ultrashort-pulse propagation inoptical fibers,” Opt. Lett. 15, 1076 (1990).
[16] D. Gloge, “Weakly guiding fibers,” Appl. Optics 10, 2252 (1971).
[17] J. D. Jackson, Classical Electrodynamics (John Wiley and Sons, 1999).
[18] Z. Jiang, S.-D. Yang, D. E. Leaird, and A. M. Weiner, “Fully dispersion-compensated 500 fs pulse transmission over 50 km single-mode fiber,”Opt. Lett. 30, 1449 (2005).
[19] P. Russel, “Photonic crystal fibers,” Science 299, 358–362 (2003).
[20] O. E. Martinez, J. P. Gordon, and R. L. Fork, “Negative group velocitydispersion using refraction,” J. Opt. Soc. Am. A 1, 1003 (1984).
[21] M. Suzuki, N. Edagawa, H. Taga, H. Tanaka, S. Yamamoto, and S. Ak-iba, “10 Gb/s, over 12200 km soliton data transmission with alternating-amplitude solitons,” IEEE Photonics Techn. Lett 6, 757 (1994).
[22] M. J. F. Digonnet, Rare-Earth-doped fiber lasers and amplifiers (MarcelDekker Inc., New York, 2001). (see page 389 for an extensive overview).
[23] H. M. Pask, R. J. Carman, D. C. Hanna, A. C. Tropper, C. J. M. ansP. R. Barber, and J. M. Dawes, “Ytterbium-doped silica fiber Lasers : Ver-satile sources for the 1-1.2 µm region,” J. Quantum Electronics 1, 2 (1995).
[24] J. C. Knight, T. A. Birks, P. S. J. Russell, and D. M. Atkin, “All-silicasingle-mode fiber with photonic crystal cladding,” Opt. Lett. 21, 1547–1549 (1996).
[25] J. Broeng, S. E. Barkou, T. Søndergaard, and A. Bjarklev, “Analysis ofair-guiding photonic bandgap fibers,” Opt. Lett. 25, 96 (2000).
[26] T. A. Birks, J. C. Knight, and P. S. J. Russell, “Endlessly single-modephotonic crystal fiber,” Opt. Lett. 22, 961 (1997).
[27] M. Koshiba and K. Saitoh, “Applicability of classical optical fiber theoriesto holey fibers,” Opt. Lett. 29, 1739 (2004).
REFERENCES 107
[28] J. Limpert, N. Deguil-Robin, I. Manek-Honninger, F. Salin, F. Roser,A. Liem, T. Schreiber, S. Nolte, H. Zellmer, A. Tunnermann, J. Broeng,A. Petersson, and C. Jakobsen, “High-power rod-type photonic crystalfiber laser,” Opt. Express 13, 1055–1058 (2005).
[29] A. L. Gaeta, “Catastrophic collapse of ultrashort pulses,” Phys. Rev. Lett.84, 3582 (2000).
[30] R. Holzwarth, M. Zimmermann, T. Udem, T. W. Hansch, P. Russbuldt,K. Gabel, R. Poprawe, J. C. Knight, W. J. Wadsworth, and P. S. J.Russell, “White-light frequency comb generation with a diode-pumpedCr:LiSAF laser,” Opt. Lett. 26, 1376 (2001).
[31] H. Lim, Y. Jiang, Y. Wang, Y. C. Huang, Z. Chen, and F. W. Wise,“Ultrahigh-resolution optical coherence tomography with a fiber lasersource at 1 mm,” Opt. Lett. 30, 1171 (2005).
[32] A. Ortigosa-Blanch, J. C. Knight, and P. S. J. Russell, “Pulse breaking andsupercontinuum generation with 200-fs pump pulses in photonic crystalfibers,” J. Opt. Soc. Am. B 19, 2567–2572 (2002).
[33] W. Wadsworth, A. Ortigosa-Blanch, J. Knight, T. Birks, T. Man, andP. Russell, “Supercontinuum generation in photonic crystal fibers andoptical fiber tapers: a novel light source,” J. Opt. Soc. Am. B 19, 2148–2155 (2002).
[34] G. Genty, M. Lehtonen, H. Ludvigsen, J. Broeng, and M. Kaivola, “Spec-tral broadening of femtosecond pulses into continuum radiation in mi-crostructured fibers,” Opt. Express 9, 1083–1098 (2002).
[35] J. Dudley, L. Provino, N. Grossard, H. Maillotte, R. Windeler, B. Eggle-ton, and S. Coen, “Supercontinuum generation in air-silica microstruc-tured fibers with nanosecond and femtosecond pulse pumping,” J. Opt.Soc. Am. B 19, 765–771 (2002).
[36] G. Genty, M. Lehtonen, and H. Ludvigsen, “Route to broadband blue-lightgeneration in microstructured fibers,” Opt. Lett. 30, 756–758 (2005).
[37] J. K. Ranka, R. S. Windeler, and A. J. Stentz, “Visible continuum gen-eration in air-silica microstructure fibers with anomalous dispersion at800 nm,” Opt. Lett. 25, 25 (2000).
[38] V. Petrov, D. Georgiev, and U. Stamm, “Improved modelocking of a fem-tosecond Titanium doped Sapphire laser by intracavity second harmonicgeneration,” Appl. Phys. Lett. 60, 1550 (1992).
108 REFERENCES
[39] Y. Kang, Y. Chan, and C. Nam, “Intracavity frequency doubling in afemtosecond Ti:Sapphire laser using Lithium triborate and beta-Bariumborate,” Jpn. J. Appl. Phys. 38, 85 (1999).
[40] R. Ellingson and C. Tang, “High-repetition rate femtosecond pulse gener-ation in the blue,” Opt. Lett. 17, 343 (1992).
[41] S. Backus, M. Asaki, C. Shi, H. Kapteyn, and M. Murnane, “Intracavityfrequency doubling in a Ti:Sapphire laser : Generation of 14-fs pulses at416 nm,” Opt. Lett. 19, 399 (1994).
[42] D. E. Spence, P. N. Kean, and W. Sibbett, “60-fs pulse generation froma self-mode-locked Ti:Sapphire laser,” Opt. Lett. 16, 42 (1991).
[43] A. Siegmann, Lasers (University Science Books, 1986).
[44] J. Zhou, G. Taft, C. Huang, M. Murnane, and H. Kapteyn, “Pulse evolu-tion in a broad-bandwidth Ti:Sapphire laser,” Opt. Lett. 19, 1149 (1994).
[45] Q. Lin and I. Sorokina, “Higher order dispersion effects in solitary mode-locked lasers : Sideband generation,” Opt. Commun. 153, 285 (1998).
[46] T. Brabec and S. Kelly, “Third-order dispersion as a limiting factor tomodelocking in femtosecond solitory lasers,” Opt. Lett. 18, 2002 (1993).
[47] J. Elgin, T. Brabec, and S. Kelly, “A pertubative theory of soliton propa-gation in the presence of third order dispersion,” Opt. Commun. 114, 321(1995).
[48] J. Ranka, A. Gaeta, A. Baltuska, M. Pshenichnikov, and D. Wiersma,“Autocorrelation measurements of 6 fs pulses based on the two-photon-induced photocurrent in a GaAsP photodiode,” Opt. Lett. 17, 1344(1997).
[49] (http://www.eksma.it/crystals.non/ultrath.htm).
[50] E. Riedle, M. Beutter, S. Lochbrunner, and J. Piel, “Generation of 10 to50 fs pulses tunable through all of the visible and the NIR,” Appl. Phys.B 71, 457 (2000).
[51] A. Steinmann, A. Killi, G. Palmer, U. Morgner, H. Bartelt, and J. Ko-belke, “Tunable fs pulses from OPA with MHz repetition rate,” Conf.contribution, Advanced Solid State Phototonics, ASSP. p. TuC6 (2006).
[52] K. M. Hilligsøe, T. V. Andersen, H. N. Paulsen, C. K. Nielsen, K. Mølmer,S. Keiding, and J. J. Larsen, “Supercontinuum generation in a photoniccrystal fiber with two zero dispersion wavelengths,” Opt. Express 12(6),1045–1054 (2004).
REFERENCES 109
[53] S. Watanabe, S. Takeda, and T. Chikama, “Interband wavelength conver-sion using a polarization-insensitive fiber four-wave mixer,” EU Confer-ence on Optical Communication 3, 83–87 (1998).
[54] J. E. Sharping, M. Fiorentino, and P. Kumar, “Optical parametric os-cillator based on four-wave mixing in microstructured fiber,” Opt. Lett.27(19), 1675–1677 (2002).
[55] M. E. Marhic, K. K. Y. Wong, and L. G. Kazovsky, “Continuous wavefiber optical parametric oscillator,” Opt. Lett. 27(16), 1439–1441 (2002).
[56] R. H. Stolen and J. E. Bjorkholm, “Parametric amplification and fre-quency conversion in optical fibers,” J. Quantum Electronics 18(7), 1062–1071 (1982).
[57] S. Coen, A. H. C. Chau, R. Leonhardt, J. D. Harvey, J. C. Knight, W. J.Wadsworth, and P. S. J. Russell, “Supercontinuum generation by stim-ulated Raman scattering and parametric four-wave mixing in photoniccrystal fibers,” J. Opt. Soc. Am. B 19(4), 753–764 (2002).
[58] J. D. Harvey, R. Leonhardt, S. Coen, G. K. Wong, J. C. Knight, W. J.Wadsworth, and P. S. J. Russel, “Scalar modulation instability in thenormal dispersion regime by use of a photonic crystal fiber,” Opt. Lett.28(22), 2225–2227 (2003).
[59] F. Biancalana, D. V. Skryabin, and P. S. Russel, “Four-wave mixing insta-bilities in photonic-crystal and tapered fibers,” Phys. Rev. E 68(4), 31–38(2003).
[60] R. A. Sammut and S. J. Garth, “Multiple-frequency generation on single-mode optical fibers,” J. Opt. Soc. Am. B 6(9), 1732–1735 (1989).
[61] M. Yu, C. J. McKinstrie, and G. P. Agrawal, “Modulation instabilities indispersion flattended fibers,” Phys. Rev. E 52(1), 1072–1080 (1995).
[62] (http://www.crystal-fibre.com/Products/nonlinear/datasheets/NL-PM-750.pdf).
[63] S. Diddams and J. C. Diels, “Dispersion measurements with white-lightinterferometry,” J. Opt. Soc. Am. B 13(6), 1120–1129 (1996).
[64] H. Wenzel, A. Klehr, M. Braun, F. Bugge, G. Erbert, J. Fricke, A. Knauer,M. Weyers, and G. Trankle, “High-power 783 nm distributed-feedbacklaser,” Electron. Lett. 40(2), 123–124 (2004).
[65] C. J. S. de Matos, K. P. Hansen, and J. R. Taylor, “Continuous wave,totally fiber integrated optical parametric oscillator using holey fiber,”Opt. Lett. 29(9), 983–985 (2004).
110 REFERENCES
[66] M. Karlsson, “Four-wave mixing in fibers with randomly varying zero-dispersion wavelength,” J. Opt. Soc. Am. B 15, 2269–2275 (1998).
[67] Y. Jeong, J. K. Sahu, D. N. Payne, and J. Nilsson, “Ytterbium-dopedlarge-core fiber laser with 1.36 kW continuous wave output power,” Opt.Express 12(25), 6088–6092 (2004).
[68] J. Limpert, T. Schreiber, T. Clausnitzer, K. Zollner, H. J. Fuchs, E. B.Kley, H. Zellmer, and A. Tunnermann, “High power femtosecond Yb-doped fiber amplifier,” Opt. Express 10(14), 628–638 (2002).
[69] J. A. Alvarez-Chavez, H. L. Offerhaus, J. Nilsson, P. W. Turner, W. A.Clarkson, and D. J. Richardson, “High-energy, high-power Ytterbium-doped Q-switched fiber laser,” Opt. Lett. 25, 37–39 (2000).
[70] L. A. Zenteno, H. Po, and N. M. Cho, “All-solid state passively Q-switchedmodelocked Nd-doped fiber laser,” Opt. Lett. 15, 115–117 (1990).
[71] R. Paschotta, R. Haring, E. Gini, H. Melchior, and U. Keller, “PassivelyQ-switched 0.1 mJ fiber laser system at 1.53µm,” Opt. Lett. 24, 388–390(1999).
[72] V. N. Filippov, A. N. Starodumov, and A. V. Kir’yanov, “All-fiber pas-sively Q-switched low-threshold Erbium laser,” Opt. Lett. 26, 343–345(2001).
[73] M. Laroche, A. M. Chardon, J. Nilsson, D. P. Shepherd, and W. A. Clark-son, “Compact diode-pumped passively Q-switched tunable Er-Yb doubleclad fiber laser,” Opt. Lett. 27, 1980–1982 (2002).
[74] A. A. Fotiadi, P. Megret, and M. Blondel, “Dynamics of a self-Q-switchedfiber laser with a Rayleigh-simulated Brillouin scattering ring mirror,”Opt. Lett. 29(10), 1078–1080 (2004).
[75] S. V. Chernikov, Y. Zhu, J. R. Taylor, and V. P. Gapontsev, “Supercon-tinuum self-Q-switched Ytterbium fiber laser,” Opt. Lett. 22(5), 298–300(2005).
[76] L. Luo and P. L. Chu, “Passive Q-switched Erbium-doped fibre laser withsaturable absorber,” Opt. Commun. 161, 257–263 (1999).
[77] A. Chandonnet and G. Larose, “High power Q-switched Erbium fiber laserusing an all-fiber intensity modulator,” Opt. Eng. 32, 2031–2035 (1993).
[78] N. A. Russo, R. Duchowicz, J. Mora, J. L. Cruz, and M. V. Andres,“High efficiency Q-switched Erbium fiber laser using a Bragg grating-based modulator,” Opt. Commun. 210, 361–366 (2002).

REFERENCES 111
[79] P. Perez-Millan, A. Diez, M. V. Andres, D. Zalvidea, and R. Duchow-icz, “Q-switched all-fiber laser based on magnetostriction modulation ofa Bragg Grating,” Opt. Express 13 (2005).
[80] R. Kashyap, Fiber Bragg Gratings (Academic Press, 1999). Chapt. 5.
[81] Http://etrema-usa.com/products/terfenol/.
[82] Y. Wang and C. Q. Xu, “Switching-induced perturbation and influence onactively Q-switched fiber lasers,” J. Quantum Electronics 40, 1583–1596(2004).
[83] G. Agrawal, Applications of nonlinear fiber optics (Academic Press, 2001).
[84] C. C. Cutler, “Why does linear phase shift cause mode-locking?” J. Quan-tum Electronics 28, 282–288 (1992).
[85] D. Huang, W. Liu, and C. C. Yang, “Q-switched all-fiber laser with anacoustically modulated fiber attenuator,” IEEE Phot. Tech. Lett. 12,1153–1155 (2000).
[86] Y. Sintov, O. Katz, Y. Glick, S. Acco, Y. Nafcha, A. Englander, andR. Lavi, “Extractable energy from Ytterbium-doped high-energy pulsedfiber amplifiers and lasers,” J. Opt. Soc. Am. B 23, 218 (2006).
[87] H. Deyerl, N. Plougmann, J. B. Jensen, F. Floreani, H. R. Sørensen, andM. Kristensen, “Fabrication of advanced Bragg gratings with complexapodization profiles by use of the polarization control method,” J. Appl.Optics 43, 3513 (2004).
[88] (http://www.exfo.com).
[89] D. Ouzounov, D. Homoelle, W. Zipfel, W. W. Webb, A. L. Gaeta, J. A.West, J. C. Fajardo, and K. W. Koch, “Dispersion measurements of mi-crostructured fibers using femtosecond laser pulses,” Opt. Com. 192(3-6),219 (2001).
[90] D. Muller, J. West, and K. Koch, “Interferonmetric chromatic dispersionmeasurement of a photonic band-gap fiber,” Proceedings of Spie, Activeand Passive Optical Components for WDM Communications II II, 4870(2002).
[91] (http://www.crystal-fibre.com/datasheets/HC-1060-02.pdf).
[92] (http://www.corning.com/photonicmaterials/pdf/pi1441.pdf).
[93] (http://www.corning.com/photonicmaterials/pdf/pi1446.pdf).
112 REFERENCES
[94] (http://www.koheras.com).
[95] A. Isomaki and O. G. Okhotnikov, “All-fiber Ytterbium soliton mode-locked laser with dispersion control by solid-core photonic bandgap fiber,”Opt. Express 14, 4368 (2006).
[96] P. Champert, V. Couderc, P. Leproux, S. Fevrier, V. Tombelaine,L. Labonte, P. Roy, C. Froehly, and P. Nerin, “White-light supercontin-uum generation in normally dispersive optical fiber using original multi-wavelength pumping system,” Opt. Express 12, 4366–4371 (2004).
[97] G. P. Agrawal, P. L. Baldeck, and R. R. Alfano, “Temporal and spectraleffects of cross-phase modulation on copropagating ultrashort pulses inoptical fibers,” Phys. Rev.A A 40, 5063–5072 (1989).
[98] A. V. Husakou and J. Herrmann, “Supercontinuum generation, four-wavemixing, and fission of higher-order solitons in photonic crystal fibers,” J.Opt. Soc. Am. B 19, 2171–2182 (2002).
[99] T. Schreiber, J. Limpert, H. Zellmer, A. Tunnermann, and K. P. Hansen,“High average power supercontinuum generation in photonic crystalfibers,” Opt. Commun. 228, 71–78 (2003).
[100] Http://www.femtosecondsystems.com).
[101] G. Cerullo and S. Silvestri, “Ultrafast optical parametric amplifiers,” Re-view of Scientific Instruments 74, 1–18 (2003).
[102] G. M. Gale, M. Cavallari, T. J. Driscoll, and F. Hache, “Sub-20 fs pulsestunable pulses in the visible from an 82 MHz optical parametric oscillator,”Opt. Lett. 20, 1562–1564 (1995).
[103] R. Danielius, A. Piskarskas, A. Stabinis, G. P. Banfi, P. D. Trapani,and R. Righini, “Travelling-wave parametric generation of widely tun-able highly coherent femtosecond light pulses,” J. Opt. Soc. Am. B 10,2222–2232 (1993).
[104] S. Barkus, C. G. Durfee, M. M. Murnane, and H. C. Kapteyn, “Highpower ultrafast lasers,” Review of Scientific Instruments 69, 1207–1223(1998).
[105] L. Goldberg, J. P. Koplow, and D. A. V. Kliner, “Highly efficient 4-W Yb-doped fiber amplifier pumped by a broad-stripe laser diode,” Opt. Lett.24, 673–675 (1999).
[106] J. A. Armstrong, N. Bloembergen, J. Ducuing, and P. S. Pershan, “In-teraction between light waves in nonlinear dielectric,” Phys. Rev. 127,1918–1939 (1962).
REFERENCES 113
[107] I. N. Ross, P. Matousek, G. H. C. New, and K. Osvay, “Analysis andoptimization of optical parametric chirped pulse amplification,” J. Opt.Soc. Am. B 19, 2945–2956 (2002).
[108] C. P. Hauri, P. Schlup, G. Arisholm, J. Biegert, and U. Keller, “Phase-preserving chirped-pulse optical parametric amplification to 17.3 fs di-rectly from a Ti:Sapphire oscillator,” Opt. Lett. 29, 1369–1371 (2004).
[109] (http://www.sandia.gov/imrl/X1118/xxtal.htm)).
[110] P. Baum, S. Lochenbrunner, and E. Riedle, “Generation of tunable 7-fsultraviolet pulses : Achromatic phasematching and chirp management,”Appl. Phys. B 75, 427–443 (2002).
[111] G. Cerullo, M. Nisoli, S. Stagira, and S. D. Silvestri, “Sub 8-fs pulses froman ultra broadband optical parametric amplifier in the visible,” Opt. Lett.23, 1283–1285 (1998).
[112] M. Drescher, M. Hentschel, R. Kleinberger, G. Tempea, C. Spielmann,G. A. Reider, P. B. Corkum, and F. Krausz, “X-ray pulses approachingthe attosecond frontier,” Science 291, 1923–1927 (2001).
[113] J. Limpert, A. Liem, M. Reich, T. Schreiber, S. Nolte, H. Zellmer,A. Tunnermann, J. Broeng, A. Petersson, and C. Jakobsen, “Low-nonlinearity single-transverse-mode Ytterbium-doped photonic crystalfiber amplifier,” Opt. Express 12, 1313–1319 (2004).
[114] T. Clausnitzer, J. Limpert, K. Zollner, H. Zellmer, H.-J. Fuchs, E.-B. Kley,A. Tunnermann, M. Jupe, and D. Ristau, “Highly efficient transmissiongratings in fused silica for chirped pulse amplification systems,” AppliedOptics 42, 6934–6938 (2003).
[115] (http://www.fiberdesk.com).
[116] A. Baltuska and T. Koayashi, “Adaptive shaping of two-cycle visiblepulses using a flexible mirror,” Appl. Phys. B 75, 427–443 (2002).
[117] J. M. Dudley and S. Coen, “Coherence properties of supercontinuum spec-tra generated in photonic crystal and tapered optical fibers,” Opt. Lett.27, 1180–1182 (2002).
[118] B. Schenkel, R. Paschotta, and U. Keller, “Pulse compression with super-continuum generation in microstructure fibers,” J. Opt. Soc. Am. B 22,687 (2005).
[119] (http://www.menlosystems.de).
114 REFERENCES
[120] R. Oron and A. A. Hardy, “Rayleigh backscattering and amplified spon-taneous emission in high power Yb-doped fiber amplifiers,” J. Opt. Soc.Am. B 16(5), 695 (1999).
[121] A. Yariv, Quantum Electronics, 2nd ed. (John Wiley and Sons, 1967).
[122] Y. Huo, R. T. Brown, G. G. King, and P. K. Cheo, “Kinetic modellingof high-power Ytterbium doped fiber lasers,” J. Appl. Optics 43, 1404(2004).
[123] J. W. Thomas, Numerical partial differential equations: Finite differencemethods (Springer, 1995).
[124] Centro de Investigaciones Opticas, Camino Parque, 1900 La Plata, Ar-gentina.