Embed Size (px)
Citation preview
Approximate Evaluation of Range Nearest
Neighbor Queries with Quality Guarantee?
Chi-Yin Chow1, Mohamed F. Mokbel1, Joe Naps1, and Suman Nath2
1 Department of Computer Science and Engineering, University of Minnesota,Minneapolis, MN 55455, USA
2 Microsoft Research, One Microsoft Way, Redmond, WA 98052, USA{cchow,mokbel,naps}@cs.umn.edu [email protected]
Abstract. The range nearest-neighbor (NN) query is an importantquery type in location-based services, as it can be applied to the casethat an NN query has a spatial region, instead of a location point, asthe query location. Examples of the applications of range NN queriesinclude uncertain locations and privacy-preserving queries. Given a setof objects, the range NN answer is a set of objects that includes thenearest object(s) to every point in a given spatial region. The answerset size would significantly increase as the spatial region gets larger.Unfortunately, mobile users in wireless environments suffer from scarcebandwidth and low-quality communication, transmitting a large answerset from a database server to the user would pose very high responsetime. To this end, we propose an approximate range NN query process-ing algorithm to balance a performance tradeoff between query responsetime and the quality of answers. The distinct features of our algorithmare that (1) it allows the user to specify an approximation tolerance levelk, so that we guarantee to provide an answer set A such that each objectin A is one of the k nearest objects to every point in a given query region;and (2) it minimizes the number of objects returned in an answer set, inorder to minimize the transmission time of sending the answer set to theuser. Extensive experimental results show that our proposed algorithmis scalable and effectively reduces query response time while providingapproximate query answers that satisfy the user specified approximationtolerance level.
1 Introduction
Nearest-neighbor (NN) queries have been widely used in location-based services(e.g., see [1, 2, 3, 4, 5]). The problem of traditional NN queries can be definedas follows: “given a set of objects and a query location point p, find the nearestobject(s) to p”; and thus, they are referred to as point NN queries. Point NNqueries have been extended to find all NNs for line segments [6] and spatialregions [7, 8, 9] that are referred to as linear and range NN queries, respectively.
? This work is supported in part by the National Science Foundation under GrantsIIS-0811998, IIS-0811935, and CNS-0708604.
A linear NN query returns an answer set that includes the nearest object(s)to every point in a given line segment. On the other hand, a range NN queryreturns an answer set that includes the nearest object(s) to every point in a givenspatial region, where the spatial region can be either a rectangular region [7, 9]or a circular region [8].
Recent research efforts have shown the importance of range NN queries inlocation-based services, as it can be applied to the following realistic scenarios:
– Uncertain locations. We have two kinds of location uncertainty, measure-ment imprecision and sampling imprecision. The measurement imprecisionis due to the limitation of the underlying positioning techniques of networkenvironments, e.g., 2G/3G and Wi-Fi. On the other hand, the sampling im-precision is due to continuous motion, network delays, and location updatefrequency even with highly accurate positioning devices, e.g., GPS. Thus, wehave to use a spatial region where the user is guaranteed to be therein to rep-resent the user location information in order to capture location uncertainty(e.g., see [10, 11, 12, 13, 14]).
– Privacy-preserving queries. Mobile users are not willing to reveal theirexact location information to location-based service providers, as theywant to preserve their location privacy. The most commonly used privacy-enhancing technique is to blur the user’s exact location into a spatial region,i.e., spatial cloaking, that satisfies the user’s specified privacy requirements(e.g., see [8, 9, 15, 16, 17, 18, 19]).
In these two scenarios, the mobile user sends her NN query along with a spatialregion as the query location, i.e., a range NN query. Then, a database serverreturns an answer set that includes the nearest object(s) to every point withinthe spatial region. The answer set size would substantially increase as the queryregion gets larger. Unfortunately, the communication bandwidth between theuser and the database server is very limited in a mobile environment, i.e., thedownlink bandwidth ranges from 128 kbps at vehicular speeds to 2 Mbps atstationary or very slow speeds for 3G mobile subscribers. Transmitting largeanswer sets to the user would pose very high query response time. Furthermore,as mobile users receive their answer handheld devices with a small screen, it isconvenient to return to the users very few answers with high quality.
In this paper, we propose a new approximate range NN query processingalgorithm that enables the user to tune a trade off between query response timeand the quality of query answers. Our proposed algorithm allows the user tospecify an approximation tolerance level k, where we return an answer set Asuch that each object in A is one of the k nearest objects of every point in thequery region. The larger the value of k, the smaller the answer set returned by adatabase server. Thus, the approximation tolerance level is a tuning parameterthat trades off between query response time and the quality of answers. In thecase that k = 1, we return the exact range NN answer of maximal size to theuser. On the other hand, if k > 1, we return an approximate answer set, whichis smaller than the exact answer, to the user; and thus, the transmission time
�
�
�
��
(a) 1-NN of each region
��
��
��
��
��
��
��
(b) 2-NN of each region
���
���
���
���
���
(c) 3-NN of each region
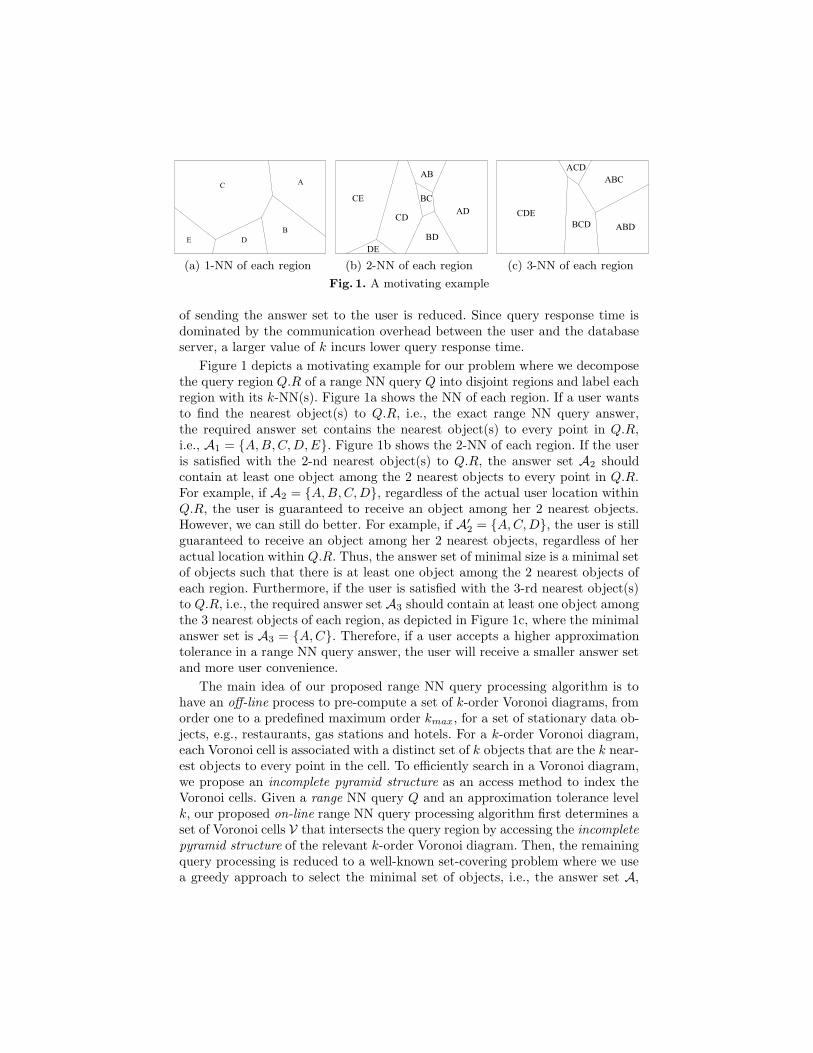
Fig. 1. A motivating example
of sending the answer set to the user is reduced. Since query response time isdominated by the communication overhead between the user and the databaseserver, a larger value of k incurs lower query response time.
Figure 1 depicts a motivating example for our problem where we decomposethe query region Q.R of a range NN query Q into disjoint regions and label eachregion with its k-NN(s). Figure 1a shows the NN of each region. If a user wantsto find the nearest object(s) to Q.R, i.e., the exact range NN query answer,the required answer set contains the nearest object(s) to every point in Q.R,i.e., A1 = {A, B, C, D, E}. Figure 1b shows the 2-NN of each region. If the useris satisfied with the 2-nd nearest object(s) to Q.R, the answer set A2 shouldcontain at least one object among the 2 nearest objects to every point in Q.R.For example, if A2 = {A, B, C, D}, regardless of the actual user location withinQ.R, the user is guaranteed to receive an object among her 2 nearest objects.However, we can still do better. For example, if A′2 = {A, C, D}, the user is stillguaranteed to receive an object among her 2 nearest objects, regardless of heractual location within Q.R. Thus, the answer set of minimal size is a minimal setof objects such that there is at least one object among the 2 nearest objects ofeach region. Furthermore, if the user is satisfied with the 3-rd nearest object(s)to Q.R, i.e., the required answer set A3 should contain at least one object amongthe 3 nearest objects of each region, as depicted in Figure 1c, where the minimalanswer set is A3 = {A, C}. Therefore, if a user accepts a higher approximationtolerance in a range NN query answer, the user will receive a smaller answer setand more user convenience.
The main idea of our proposed range NN query processing algorithm is tohave an off-line process to pre-compute a set of k-order Voronoi diagrams, fromorder one to a predefined maximum order kmax, for a set of stationary data ob-jects, e.g., restaurants, gas stations and hotels. For a k-order Voronoi diagram,each Voronoi cell is associated with a distinct set of k objects that are the k near-est objects to every point in the cell. To efficiently search in a Voronoi diagram,we propose an incomplete pyramid structure as an access method to index theVoronoi cells. Given a range NN query Q and an approximation tolerance levelk, our proposed on-line range NN query processing algorithm first determines aset of Voronoi cells V that intersects the query region by accessing the incompletepyramid structure of the relevant k-order Voronoi diagram. Then, the remainingquery processing is reduced to a well-known set-covering problem where we usea greedy approach to select the minimal set of objects, i.e., the answer set A,
from the objects associated with the Voronoi cells in V such that at least oneobject from each Voronoi cell in V is selected. As a result, each object in A isone of the k nearest objects to every Voronoi cell in V , i.e., each object in A isone of the k nearest objects to every point in the query region. With a largervalue of k, there are more common objects associated among the Voronoi cells inV ; and hence, we would get smaller answer sets that incur lower query responsetime. In general, the contributions of this paper can be summarized as follows:
– We introduce a new location-based query type, approximate range nearestneighbor (NN) query, that returns an answer set A such that each object inA is one of the k nearest object(s) to every point in a given query region. k
is a user specified approximation tolerance level that can be used to tune aperformance tradeoff between query response time and answer quality.
– We design an incomplete pyramid structure as an access method for efficientlyretrieving a set of Voronoi cells that intersects a given query region from aVoronoi diagram for our proposed query processing algorithm.
– We propose an approximate range NN query processing algorithm that aimsto minimize the number of objects returned in an answer set to improve queryresponse time and user convenience while guaranteeing that the answer setsatisfies the user specified approximation tolerance level.
– We provide experimental evidence through a comparison between the state-of-the-art techniques that our proposed query processing algorithm is scal-able in terms of query processing time, and it significantly reduces queryresponse time while the returned approximate answer is guaranteed to besatisfied with the user desired approximation tolerance level.
The rest of the paper is organized as follows. Section 2 reviews related works.Section 3 describes our system model. Our proposed approximate range NNquery processing algorithm is presented in Section 4. The extensive experimentalresults are analyzed in Section 5. Finally, Section 6 concludes the paper.
2 Related Works
In location-based services, point nearest-neighbor (NN) queries have been exten-sively studied, e.g., [1, 2, 3, 4, 5]. Existing point NN query processing algorithmsmainly focus on the scalability and efficiency of finding the nearest object(s) toa given query point. By considering user mobility, the concept of NN searches isextended to line segments [6] (referred to as linear NN query). The basic idea oflinear NN query processing algorithm is to split a line segment into subsegmentssuch that each subsegment has the same nearest object(s). All such nearest ob-jects constitute the answer set of a linear NN query. Recently, the concept of NNsearches is further extended to rectangular regions [7, 9] (referred to as range NNquery). A minimal answer set for a range NN query includes all objects locatedin query region and the nearest objects to each edge of the query region [7]. Byrelaxing the minimality requirement, another existing range NN query process-ing algorithm, Casper, computes a candidate answer set that includes the exact
��
��
��
��
��
��
��
��
��
��
(a) 1-order Voronoi diagram
��
��
��
��
��
��
��
��
�
��
��
��
(b) 2-order Voronoi diagram
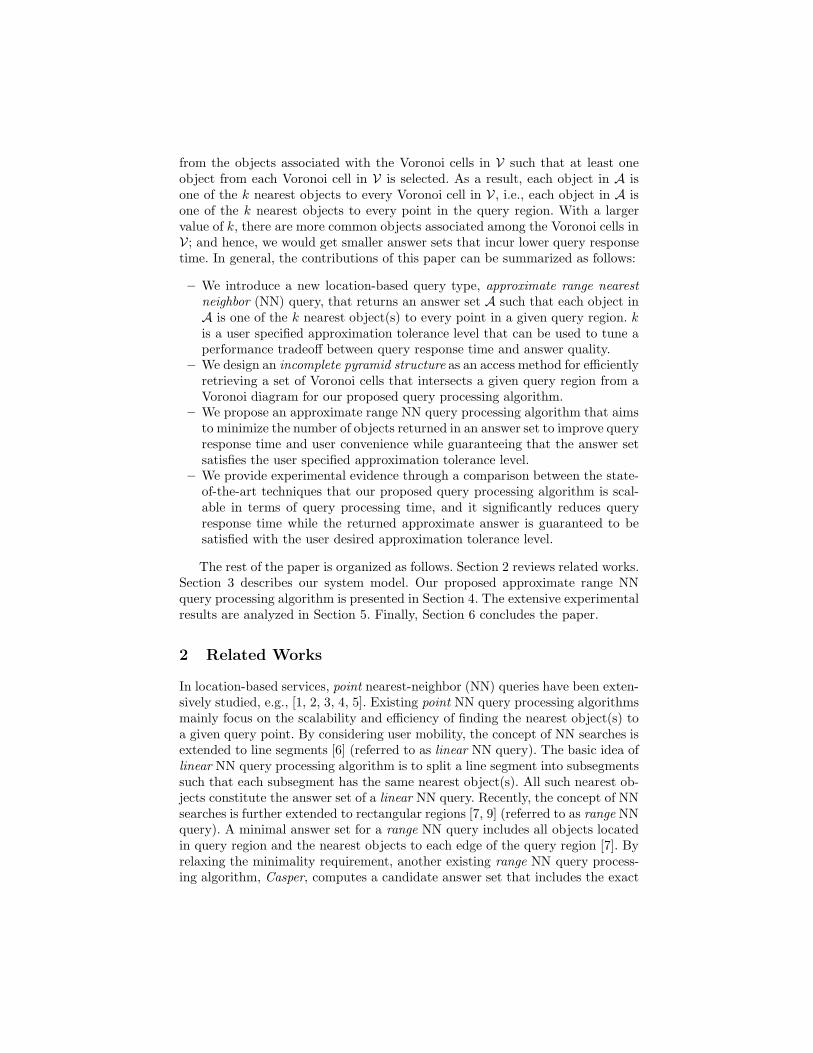
Fig. 2. The 1-order and 2-order Voronoi diagrams for five sites s1 to s5
answer [9]. The Casper algorithm first finds the nearest object to each vertex ofthe query region as filters, and then extends each edge of the query region toa minimal distance that is computed based on the filters to form an extendedquery region. The candidate answer set is a set of objects that is included in theextended query region. Also, a range NN query processing algorithm is proposedfor finding the minimal answer set for a circular query region [8].
Our proposed approximate range NN query processing algorithm distin-guishes itself from all previous techniques, as (1) it allows the user to specifyan approximation tolerance level k for a range NN query, so that each object inthe answer set is one of the k nearest objects to every point in a given queryregion; and (2) it aims to minimize the number of objects returned in the answerset to improve query response time, as the response time is dominated by thetransmission time of sending the answer set to the user. In Section 5, we willcompare the performance of our proposed algorithm with the state-of-the-artrange NN query processing algorithms (i.e., [7, 9]).
3 System Model
In this section, we first formally define our problem, and then present the basicconcept of Voronoi diagrams and the underlying system architecture.
Problem definition. Our problem is defined as follows: given a set of ob-jects, a range nearest-neighbor query Q with a query region Q.R, and an approx-imation tolerance level k, find the minimal set of objects A such that each objectin A is one of the k nearest objects to every point in Q.R.
Voronoi diagrams. Given a set of points S on the plane, which are theVoronoi sites, the Voronoi diagram of S, denoted as V (S), is a decompositionof the space into disjoint regions, cells, such that each site si is associated witha cell Vj , denoted as Vj = {si}, containing all the points in the plane that arecloser to si than any other site in S. In other words, si is the nearest site toevery point in Vj . Figure 2a depicts a Voronoi diagram of a set of five sites
S = {s1, s2, s3, s4, s5}, V (S). V (S) decomposes the space into five cells V1, V2,V3, V4, and V5 that are associated with the sites s1, s2, s3, s4, and s5, respectively.For example, given a point p in cell V1, s1 is the nearest site to p.
Higher-order Voronoi diagrams. The k-order Voronoi diagram extendsthe concept of the Voronoi diagram by defining cells based on the k nearestneighbors. The k-order Voronoi diagram of S, where 1 < k ≤ |S| − 1, denotedas Vk(S), is a decomposition of the space into disjoint cells, such that a distinctset of k sites Si = {si1 , si2 , . . . , sik
} is associated with a cell Vj , Vj = {Si},containing all the points in the plane that have the sites in Si as their k nearestsites. In other words, Si contains k nearest sites to every point in Vj . Figure 2bdepicts the 2-order Voronoi diagram of S, V2(S), that decomposes the spaceinto seven cells, i.e., V1 = {s1, s3}, V2 = {s1, s2}, V3 = {s2, s3}, V4 = {s1, s4},V5 = {s3, s4}, V6 = {s4, s5}, and V7 = {s3, s5}. For example, given a point p incell V3, the sites s2 and s3 are the two nearest sites to p.
System architecture. We consider a mobile environment where mobileusers communicate with a location-based database server through a (2G/3G)cellular network. The data/control flow of our system is as follows: The mobileuser sends range NN queries to the database server. Our proposed approximaterange NN query processing algorithm that is implemented in the database servercomputes an answer set, and then the server sends the answer set to the user.We use the Euclidean distance as our distance metric.
4 Approximate Range NN Query Processing
In this section, we first describe an off-line process to compute Voronoi diagrams,from order one to order kmax, where kmax is the maximum allowable user speci-fied approximation tolerance level, and present our proposed incomplete pyramidstructure that is used as an access method for each Voronoi diagram. Then, wepresent an on-line query processing algorithm for approximate range NN queries.
4.1 Building Voronoi Diagrams
We use an off-line process to build k Voronoi diagrams for a set of objects,e.g., restaurants, hotels and gas stations, from order one to order kmax, wherekmax is the maximum user specified approximation tolerance level. Thus, theuser can specify her desired approximation tolerance level k from one to kmax.Notice that if k = 1, our algorithm provides an exact answer set of the minimalsize for range NN queries. Given a set of objects S, building a set of Voronoidiagrams, from order one to order kmax, i.e., V1(S), V2(S), . . . , and Vkmax
(S),
takes O(k2maxN log N) time and O(
∑kmax
k=1 k2(N − k)) space, where N is thenumber of objects in S [20]. After we build the k Voronoi diagrams, they arestored for later use in our proposed range NN query processing algorithm. Foreach Voronoi diagram, we maintain a table to store each Voronoi cell with itsassociated objects.
������������
�����
������ ��
������ ��
��
������ ����
����� ������
������ �
������ �
�� ��� �
�
�� � � ��
�����
�����������
�
��
�
��
�
��
��
��
�
��
�
� � � � � � � �
�
�
�
�
�
�
�
�
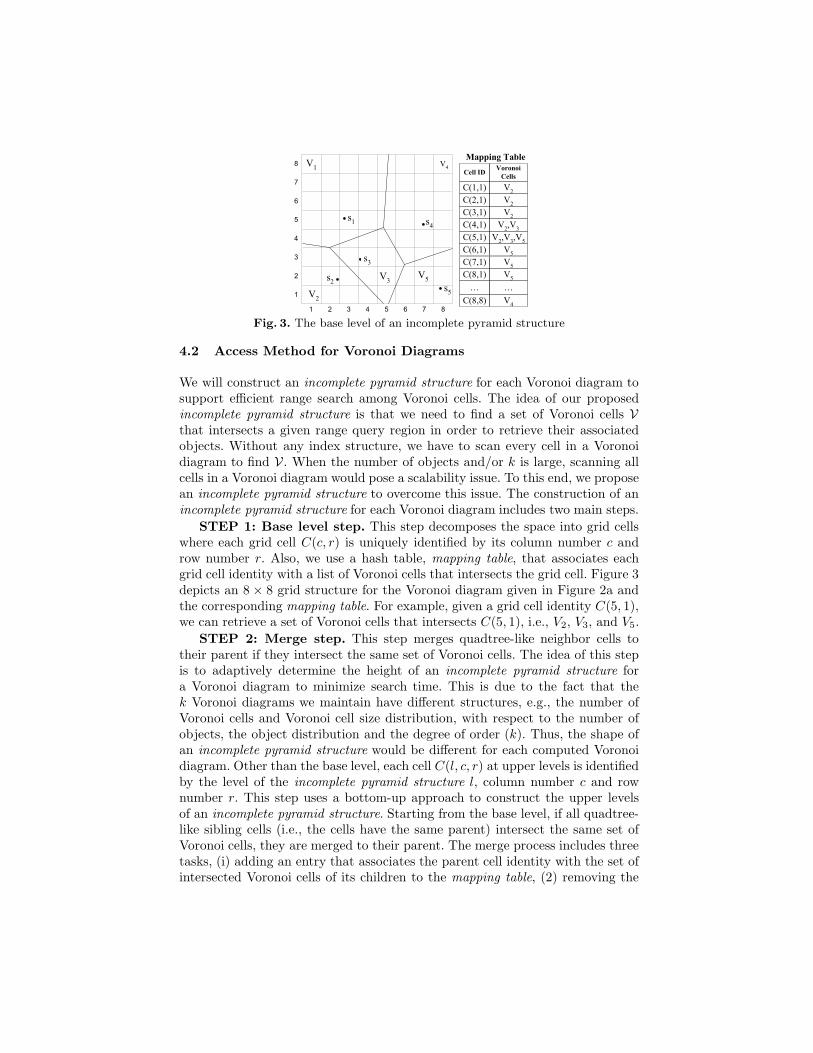
Fig. 3. The base level of an incomplete pyramid structure
4.2 Access Method for Voronoi Diagrams
We will construct an incomplete pyramid structure for each Voronoi diagram tosupport efficient range search among Voronoi cells. The idea of our proposedincomplete pyramid structure is that we need to find a set of Voronoi cells Vthat intersects a given range query region in order to retrieve their associatedobjects. Without any index structure, we have to scan every cell in a Voronoidiagram to find V . When the number of objects and/or k is large, scanning allcells in a Voronoi diagram would pose a scalability issue. To this end, we proposean incomplete pyramid structure to overcome this issue. The construction of anincomplete pyramid structure for each Voronoi diagram includes two main steps.
STEP 1: Base level step. This step decomposes the space into grid cellswhere each grid cell C(c, r) is uniquely identified by its column number c androw number r. Also, we use a hash table, mapping table, that associates eachgrid cell identity with a list of Voronoi cells that intersects the grid cell. Figure 3depicts an 8 × 8 grid structure for the Voronoi diagram given in Figure 2a andthe corresponding mapping table. For example, given a grid cell identity C(5, 1),we can retrieve a set of Voronoi cells that intersects C(5, 1), i.e., V2, V3, and V5.
STEP 2: Merge step. This step merges quadtree-like neighbor cells totheir parent if they intersect the same set of Voronoi cells. The idea of this stepis to adaptively determine the height of an incomplete pyramid structure fora Voronoi diagram to minimize search time. This is due to the fact that thek Voronoi diagrams we maintain have different structures, e.g., the number ofVoronoi cells and Voronoi cell size distribution, with respect to the number ofobjects, the object distribution and the degree of order (k). Thus, the shape ofan incomplete pyramid structure would be different for each computed Voronoidiagram. Other than the base level, each cell C(l, c, r) at upper levels is identifiedby the level of the incomplete pyramid structure l, column number c and rownumber r. This step uses a bottom-up approach to construct the upper levelsof an incomplete pyramid structure. Starting from the base level, if all quadtree-like sibling cells (i.e., the cells have the same parent) intersect the same set ofVoronoi cells, they are merged to their parent. The merge process includes threetasks, (i) adding an entry that associates the parent cell identity with the set ofintersected Voronoi cells of its children to the mapping table, (2) removing the
���
� ��
��
�����
�� �
�� �
�� �
��
� � � � � � � �
��
��
��
��
������������
�����
�����������
�������� ��
�������� ��
��
��������
��������
������
������
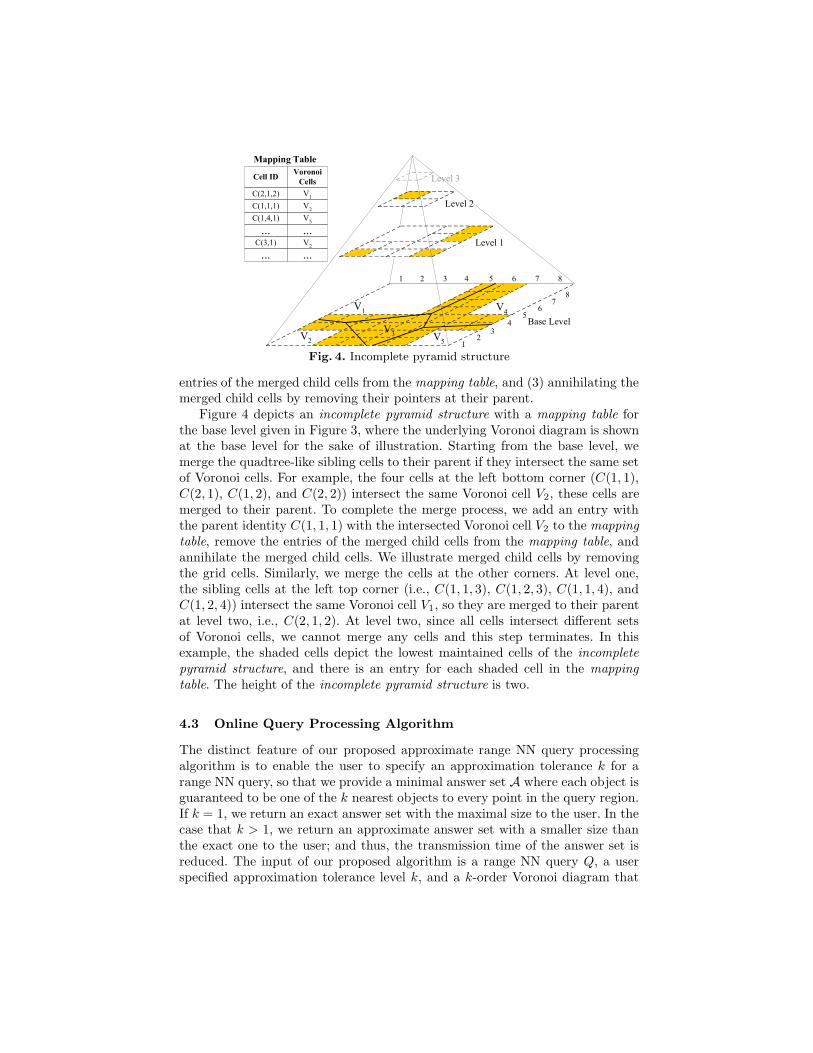
Fig. 4. Incomplete pyramid structure
entries of the merged child cells from the mapping table, and (3) annihilating themerged child cells by removing their pointers at their parent.
Figure 4 depicts an incomplete pyramid structure with a mapping table forthe base level given in Figure 3, where the underlying Voronoi diagram is shownat the base level for the sake of illustration. Starting from the base level, wemerge the quadtree-like sibling cells to their parent if they intersect the same setof Voronoi cells. For example, the four cells at the left bottom corner (C(1, 1),C(2, 1), C(1, 2), and C(2, 2)) intersect the same Voronoi cell V2, these cells aremerged to their parent. To complete the merge process, we add an entry withthe parent identity C(1, 1, 1) with the intersected Voronoi cell V2 to the mappingtable, remove the entries of the merged child cells from the mapping table, andannihilate the merged child cells. We illustrate merged child cells by removingthe grid cells. Similarly, we merge the cells at the other corners. At level one,the sibling cells at the left top corner (i.e., C(1, 1, 3), C(1, 2, 3), C(1, 1, 4), andC(1, 2, 4)) intersect the same Voronoi cell V1, so they are merged to their parentat level two, i.e., C(2, 1, 2). At level two, since all cells intersect different setsof Voronoi cells, we cannot merge any cells and this step terminates. In thisexample, the shaded cells depict the lowest maintained cells of the incompletepyramid structure, and there is an entry for each shaded cell in the mappingtable. The height of the incomplete pyramid structure is two.
4.3 Online Query Processing Algorithm
The distinct feature of our proposed approximate range NN query processingalgorithm is to enable the user to specify an approximation tolerance k for arange NN query, so that we provide a minimal answer set A where each object isguaranteed to be one of the k nearest objects to every point in the query region.If k = 1, we return an exact answer set with the maximal size to the user. In thecase that k > 1, we return an approximate answer set with a smaller size thanthe exact one to the user; and thus, the transmission time of the answer set isreduced. The input of our proposed algorithm is a range NN query Q, a userspecified approximation tolerance level k, and a k-order Voronoi diagram that
��
��
��
��
��
��
��
��
��
��
� � � � � � � �
�
�
�
�
�
�
�
�
�
(a) Voronoi diagram
��
��
��
��
��
��
��
��
�
��
��
��
� � � � � � � �
�
�
�
�
�
�
�
�
(b) 2-order Voronoi diagram
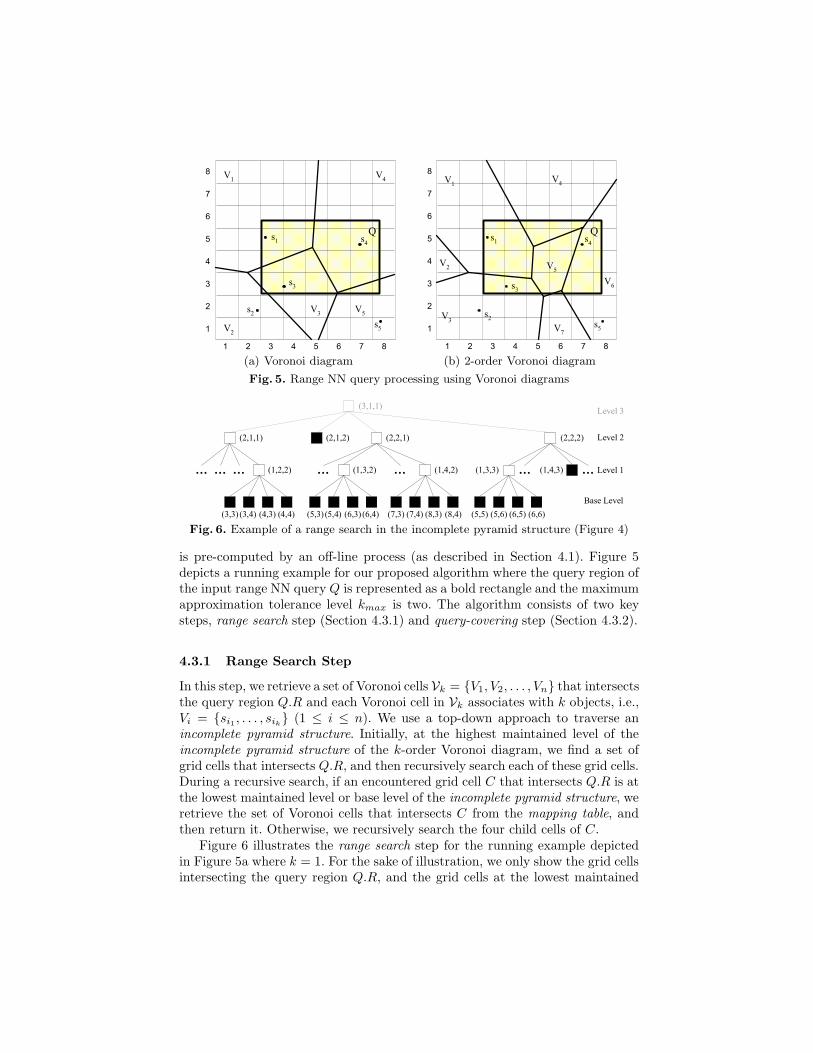
Fig. 5. Range NN query processing using Voronoi diagrams
����������
�������
�������
����� ����� ����� �����
�������
��������
�������
����� ����� ��������
�
�����
�������
�������
���� ���� ���
��������� �������
���� ���� ����� �����
� ��������
�������
�������
�������
Fig. 6. Example of a range search in the incomplete pyramid structure (Figure 4)
is pre-computed by an off-line process (as described in Section 4.1). Figure 5depicts a running example for our proposed algorithm where the query region ofthe input range NN query Q is represented as a bold rectangle and the maximumapproximation tolerance level kmax is two. The algorithm consists of two keysteps, range search step (Section 4.3.1) and query-covering step (Section 4.3.2).
4.3.1 Range Search Step
In this step, we retrieve a set of Voronoi cells Vk = {V1, V2, . . . , Vn} that intersectsthe query region Q.R and each Voronoi cell in Vk associates with k objects, i.e.,Vi = {si1 , . . . , sik
} (1 ≤ i ≤ n). We use a top-down approach to traverse anincomplete pyramid structure. Initially, at the highest maintained level of theincomplete pyramid structure of the k-order Voronoi diagram, we find a set ofgrid cells that intersects Q.R, and then recursively search each of these grid cells.During a recursive search, if an encountered grid cell C that intersects Q.R is atthe lowest maintained level or base level of the incomplete pyramid structure, weretrieve the set of Voronoi cells that intersects C from the mapping table, andthen return it. Otherwise, we recursively search the four child cells of C.
Figure 6 illustrates the range search step for the running example depictedin Figure 5a where k = 1. For the sake of illustration, we only show the grid cellsintersecting the query region Q.R, and the grid cells at the lowest maintained
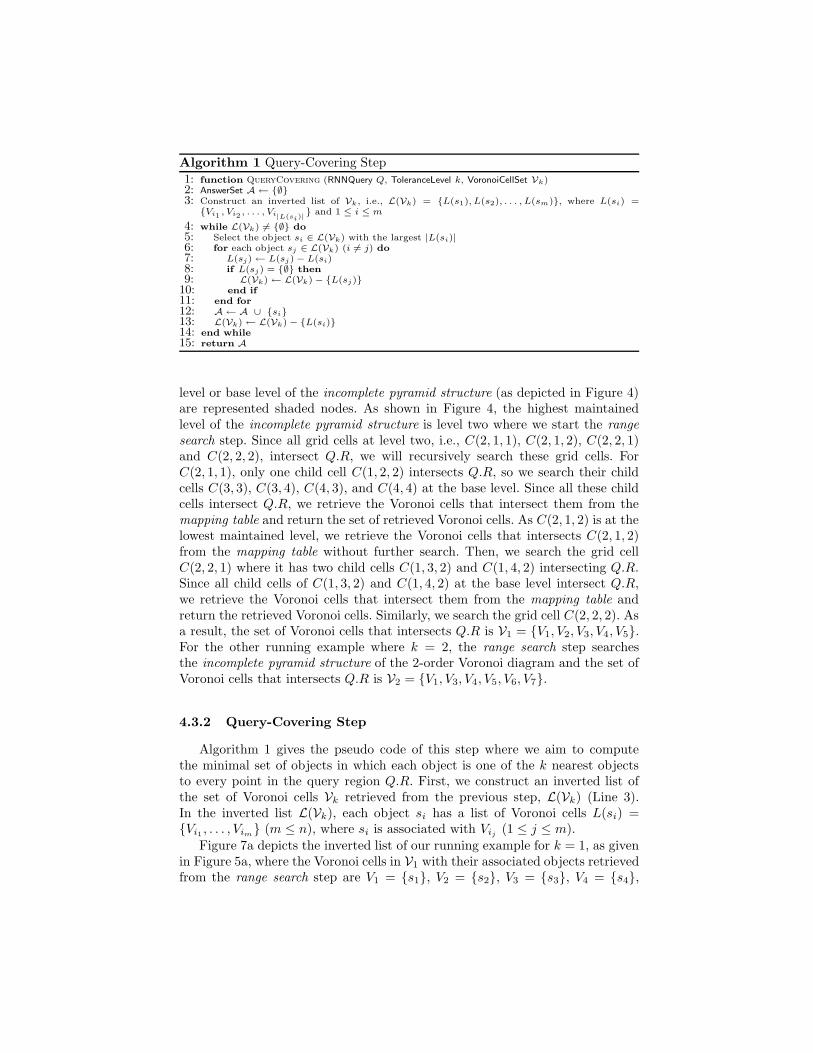
Algorithm 1 Query-Covering Step1: function QueryCovering (RNNQuery Q, ToleranceLevel k, VoronoiCellSet Vk)2: AnswerSet A ← {∅}3: Construct an inverted list of Vk, i.e., L(Vk) = {L(s1), L(s2), . . . , L(sm)}, where L(si) ={Vi1 , Vi2 , . . . , Vi|L(si)|
} and 1 ≤ i ≤ m
4: while L(Vk) 6= {∅} do
5: Select the object si ∈ L(Vk) with the largest |L(si)|6: for each object sj ∈ L(Vk) (i 6= j) do
7: L(sj)← L(sj)− L(si)8: if L(sj) = {∅} then
9: L(Vk)← L(Vk)− {L(sj)}10: end if
11: end for
12: A ← A ∪ {si}13: L(Vk)← L(Vk)− {L(si)}14: end while
15: return A
level or base level of the incomplete pyramid structure (as depicted in Figure 4)are represented shaded nodes. As shown in Figure 4, the highest maintainedlevel of the incomplete pyramid structure is level two where we start the rangesearch step. Since all grid cells at level two, i.e., C(2, 1, 1), C(2, 1, 2), C(2, 2, 1)and C(2, 2, 2), intersect Q.R, we will recursively search these grid cells. ForC(2, 1, 1), only one child cell C(1, 2, 2) intersects Q.R, so we search their childcells C(3, 3), C(3, 4), C(4, 3), and C(4, 4) at the base level. Since all these childcells intersect Q.R, we retrieve the Voronoi cells that intersect them from themapping table and return the set of retrieved Voronoi cells. As C(2, 1, 2) is at thelowest maintained level, we retrieve the Voronoi cells that intersects C(2, 1, 2)from the mapping table without further search. Then, we search the grid cellC(2, 2, 1) where it has two child cells C(1, 3, 2) and C(1, 4, 2) intersecting Q.R.Since all child cells of C(1, 3, 2) and C(1, 4, 2) at the base level intersect Q.R,we retrieve the Voronoi cells that intersect them from the mapping table andreturn the retrieved Voronoi cells. Similarly, we search the grid cell C(2, 2, 2). Asa result, the set of Voronoi cells that intersects Q.R is V1 = {V1, V2, V3, V4, V5}.For the other running example where k = 2, the range search step searchesthe incomplete pyramid structure of the 2-order Voronoi diagram and the set ofVoronoi cells that intersects Q.R is V2 = {V1, V3, V4, V5, V6, V7}.
4.3.2 Query-Covering Step
Algorithm 1 gives the pseudo code of this step where we aim to computethe minimal set of objects in which each object is one of the k nearest objectsto every point in the query region Q.R. First, we construct an inverted list ofthe set of Voronoi cells Vk retrieved from the previous step, L(Vk) (Line 3).In the inverted list L(Vk), each object si has a list of Voronoi cells L(si) ={Vi1 , . . . , Vim
} (m ≤ n), where si is associated with Vij(1 ≤ j ≤ m).
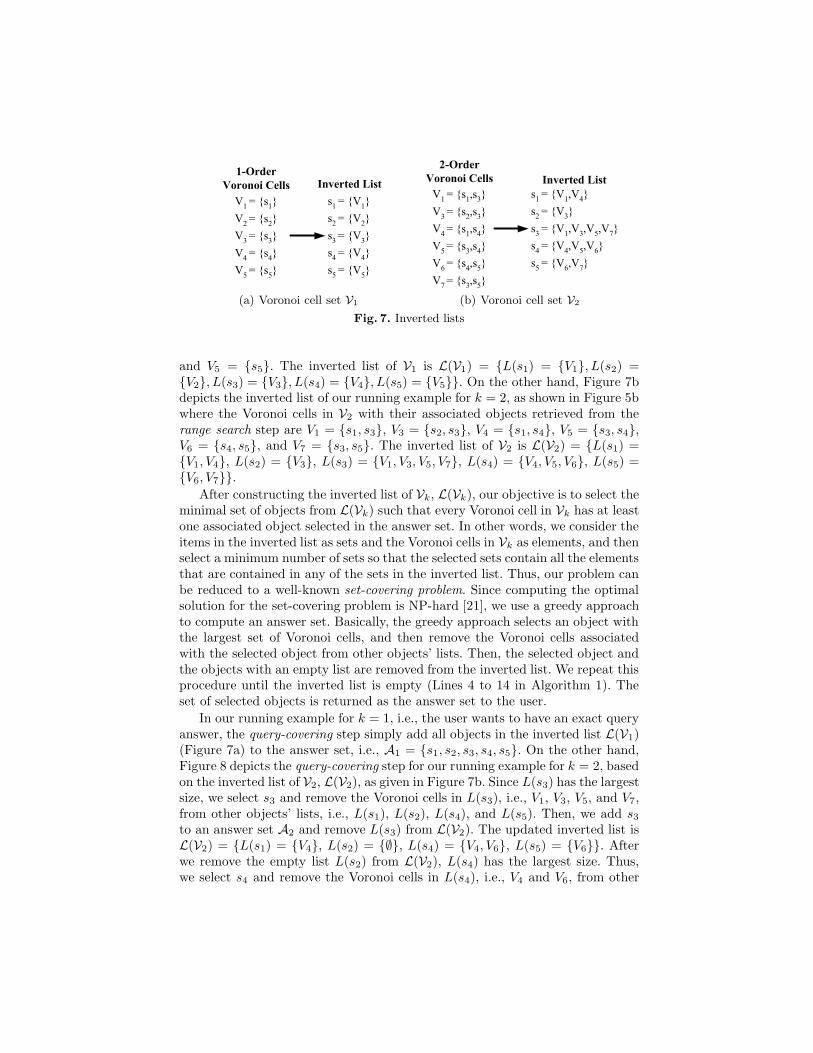
Figure 7a depicts the inverted list of our running example for k = 1, as givenin Figure 5a, where the Voronoi cells in V1 with their associated objects retrievedfrom the range search step are V1 = {s1}, V2 = {s2}, V3 = {s3}, V4 = {s4},
�������
��
�������
��
������
�
������
�
�������
��
�������
��
�������
��
������
�
������
�
�������
��
�����������
� �����
������������
(a) Voronoi cell set V1
�������
����
�������
���
�������
����
�������
����
� �����
����
�������
����
������
�
�������
����������
�������
������
�������
���
�������
����
�������
�������� � �����������
(b) Voronoi cell set V2
Fig. 7. Inverted lists
and V5 = {s5}. The inverted list of V1 is L(V1) = {L(s1) = {V1}, L(s2) ={V2}, L(s3) = {V3}, L(s4) = {V4}, L(s5) = {V5}}. On the other hand, Figure 7bdepicts the inverted list of our running example for k = 2, as shown in Figure 5bwhere the Voronoi cells in V2 with their associated objects retrieved from therange search step are V1 = {s1, s3}, V3 = {s2, s3}, V4 = {s1, s4}, V5 = {s3, s4},V6 = {s4, s5}, and V7 = {s3, s5}. The inverted list of V2 is L(V2) = {L(s1) ={V1, V4}, L(s2) = {V3}, L(s3) = {V1, V3, V5, V7}, L(s4) = {V4, V5, V6}, L(s5) ={V6, V7}}.
After constructing the inverted list of Vk, L(Vk), our objective is to select theminimal set of objects from L(Vk) such that every Voronoi cell in Vk has at leastone associated object selected in the answer set. In other words, we consider theitems in the inverted list as sets and the Voronoi cells in Vk as elements, and thenselect a minimum number of sets so that the selected sets contain all the elementsthat are contained in any of the sets in the inverted list. Thus, our problem canbe reduced to a well-known set-covering problem. Since computing the optimalsolution for the set-covering problem is NP-hard [21], we use a greedy approachto compute an answer set. Basically, the greedy approach selects an object withthe largest set of Voronoi cells, and then remove the Voronoi cells associatedwith the selected object from other objects’ lists. Then, the selected object andthe objects with an empty list are removed from the inverted list. We repeat thisprocedure until the inverted list is empty (Lines 4 to 14 in Algorithm 1). Theset of selected objects is returned as the answer set to the user.
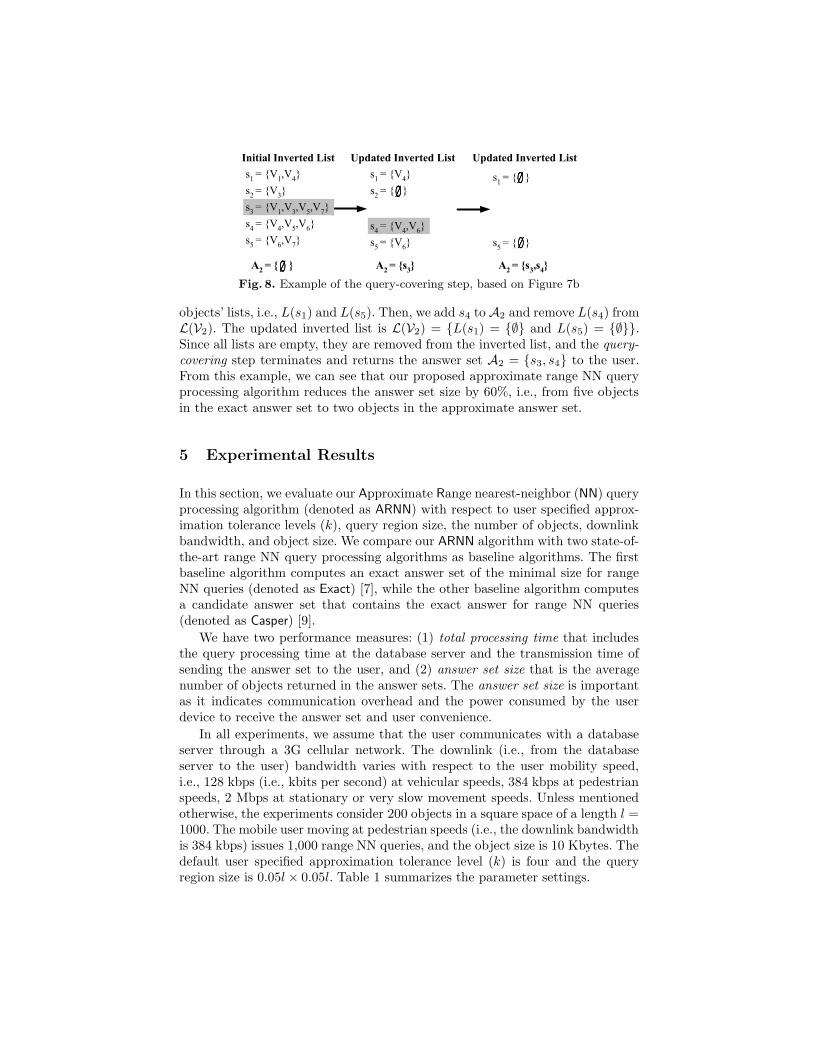
In our running example for k = 1, i.e., the user wants to have an exact queryanswer, the query-covering step simply add all objects in the inverted list L(V1)(Figure 7a) to the answer set, i.e., A1 = {s1, s2, s3, s4, s5}. On the other hand,Figure 8 depicts the query-covering step for our running example for k = 2, basedon the inverted list of V2, L(V2), as given in Figure 7b. Since L(s3) has the largestsize, we select s3 and remove the Voronoi cells in L(s3), i.e., V1, V3, V5, and V7,from other objects’ lists, i.e., L(s1), L(s2), L(s4), and L(s5). Then, we add s3
to an answer set A2 and remove L(s3) from L(V2). The updated inverted list isL(V2) = {L(s1) = {V4}, L(s2) = {∅}, L(s4) = {V4, V6}, L(s5) = {V6}}. Afterwe remove the empty list L(s2) from L(V2), L(s4) has the largest size. Thus,we select s4 and remove the Voronoi cells in L(s4), i.e., V4 and V6, from other
� ∅∅∅∅
�������
����
������
�
�������
���������
�������
�������
�������
���
���������������� �
����������
� ∅∅∅∅ �������
�
��������
�������
����
�������
�
��������������� �
�����
��
� ∅∅∅∅ ��������������� �
� ∅∅∅∅
���������
���������
������
�� ��
Fig. 8. Example of the query-covering step, based on Figure 7b
objects’ lists, i.e., L(s1) and L(s5). Then, we add s4 to A2 and remove L(s4) fromL(V2). The updated inverted list is L(V2) = {L(s1) = {∅} and L(s5) = {∅}}.Since all lists are empty, they are removed from the inverted list, and the query-covering step terminates and returns the answer set A2 = {s3, s4} to the user.From this example, we can see that our proposed approximate range NN queryprocessing algorithm reduces the answer set size by 60%, i.e., from five objectsin the exact answer set to two objects in the approximate answer set.
5 Experimental Results
In this section, we evaluate our Approximate Range nearest-neighbor (NN) queryprocessing algorithm (denoted as ARNN) with respect to user specified approx-imation tolerance levels (k), query region size, the number of objects, downlinkbandwidth, and object size. We compare our ARNN algorithm with two state-of-the-art range NN query processing algorithms as baseline algorithms. The firstbaseline algorithm computes an exact answer set of the minimal size for rangeNN queries (denoted as Exact) [7], while the other baseline algorithm computesa candidate answer set that contains the exact answer for range NN queries(denoted as Casper) [9].
We have two performance measures: (1) total processing time that includesthe query processing time at the database server and the transmission time ofsending the answer set to the user, and (2) answer set size that is the averagenumber of objects returned in the answer sets. The answer set size is importantas it indicates communication overhead and the power consumed by the userdevice to receive the answer set and user convenience.
In all experiments, we assume that the user communicates with a databaseserver through a 3G cellular network. The downlink (i.e., from the databaseserver to the user) bandwidth varies with respect to the user mobility speed,i.e., 128 kbps (i.e., kbits per second) at vehicular speeds, 384 kbps at pedestrianspeeds, 2 Mbps at stationary or very slow movement speeds. Unless mentionedotherwise, the experiments consider 200 objects in a square space of a length l =1000. The mobile user moving at pedestrian speeds (i.e., the downlink bandwidthis 384 kbps) issues 1,000 range NN queries, and the object size is 10 Kbytes. Thedefault user specified approximation tolerance level (k) is four and the queryregion size is 0.05l × 0.05l. Table 1 summarizes the parameter settings.
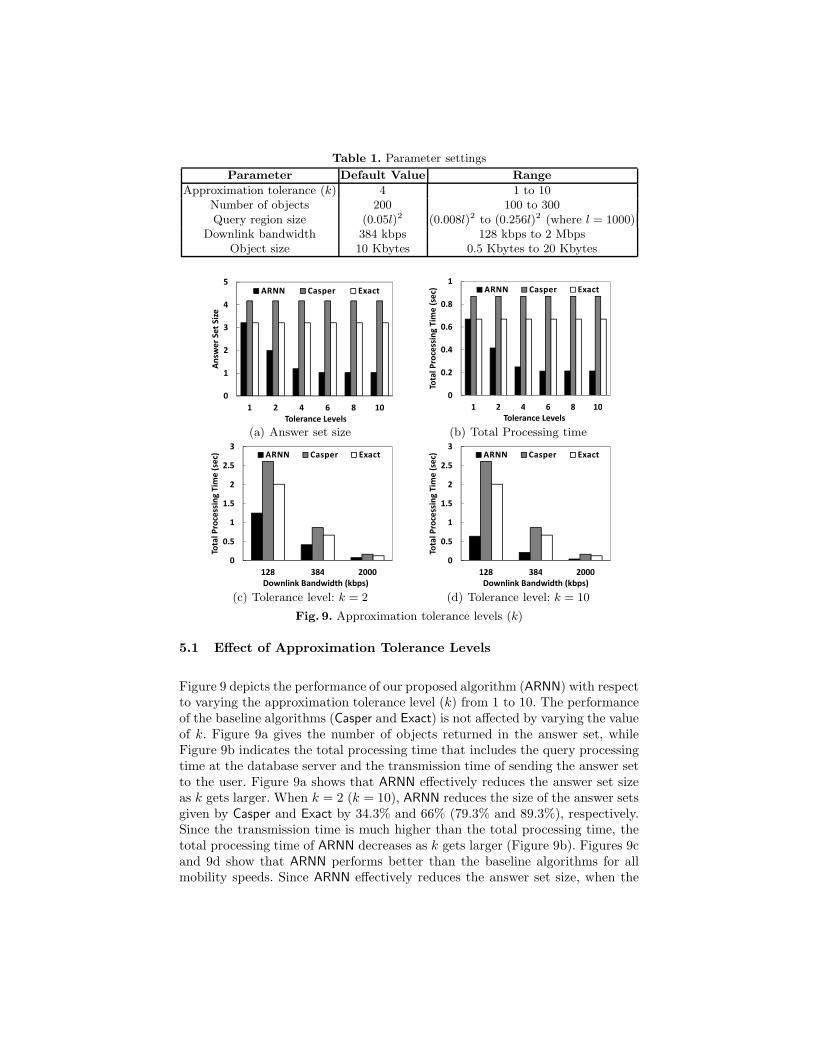
Table 1. Parameter settings
Parameter Default Value Range
Approximation tolerance (k) 4 1 to 10Number of objects 200 100 to 300Query region size (0.05l)2 (0.008l)2 to (0.256l)2 (where l = 1000)
Downlink bandwidth 384 kbps 128 kbps to 2 MbpsObject size 10 Kbytes 0.5 Kbytes to 20 Kbytes
�
�
�
�
�
�
� � � � � ��
��
��� �����
��� ��� �� � ��
�� � ���� � � ���
(a) Answer set size
�
���
���
���
���
�
� � � � � ��
��� ��������� ���
� �����
�������� ������
��� � ������ !��
(b) Total Processing time
�
���
�
���
�
���
�
��� ��� ����
�� �������������
�������
�� � ��������� ������� !��
"#$ $ %��!�� &'���
(c) Tolerance level: k = 2
�
���
�
���
�
���
�
��� ��� ����
�� �������������
�������
�� � ��������� ������� !��
"#$ $ %��!�� &'���
(d) Tolerance level: k = 10
Fig. 9. Approximation tolerance levels (k)
5.1 Effect of Approximation Tolerance Levels
Figure 9 depicts the performance of our proposed algorithm (ARNN) with respectto varying the approximation tolerance level (k) from 1 to 10. The performanceof the baseline algorithms (Casper and Exact) is not affected by varying the valueof k. Figure 9a gives the number of objects returned in the answer set, whileFigure 9b indicates the total processing time that includes the query processingtime at the database server and the transmission time of sending the answer setto the user. Figure 9a shows that ARNN effectively reduces the answer set sizeas k gets larger. When k = 2 (k = 10), ARNN reduces the size of the answer setsgiven by Casper and Exact by 34.3% and 66% (79.3% and 89.3%), respectively.Since the transmission time is much higher than the total processing time, thetotal processing time of ARNN decreases as k gets larger (Figure 9b). Figures 9cand 9d show that ARNN performs better than the baseline algorithms for allmobility speeds. Since ARNN effectively reduces the answer set size, when the
�
�
��
��
��
��
��
��
��
��
��
����� ���� ����� ���� ����� ����
��
�����������
� ����������������
�� �
������
� �!�
(a) Answer set size
�
�
�
�
�
��
��
����� ����� ����� ����� ����� ����
�� ���������������
�������
� �������������� �
!�" "
# �$��
%& ��
(b) Total processing time
�
���
���
���
���
�
���
��� ��� ����
�� �������������
�������
�� � ��������� ������� !��
"#$ $
%��!��
&'���
(c) Query region size: (0.008l)2
�
�
��
��
��
��
��
��
��� ��� ����
��� ��������� ���
� �����
�� ����� ����� ��� ��� ��
!"# #
$�� ��
%&��
(d) Query region size: (0.256l)2
Fig. 10. Query region size
downlink bandwidth is more limited, ARNN performs much better than Casper
and Exact.
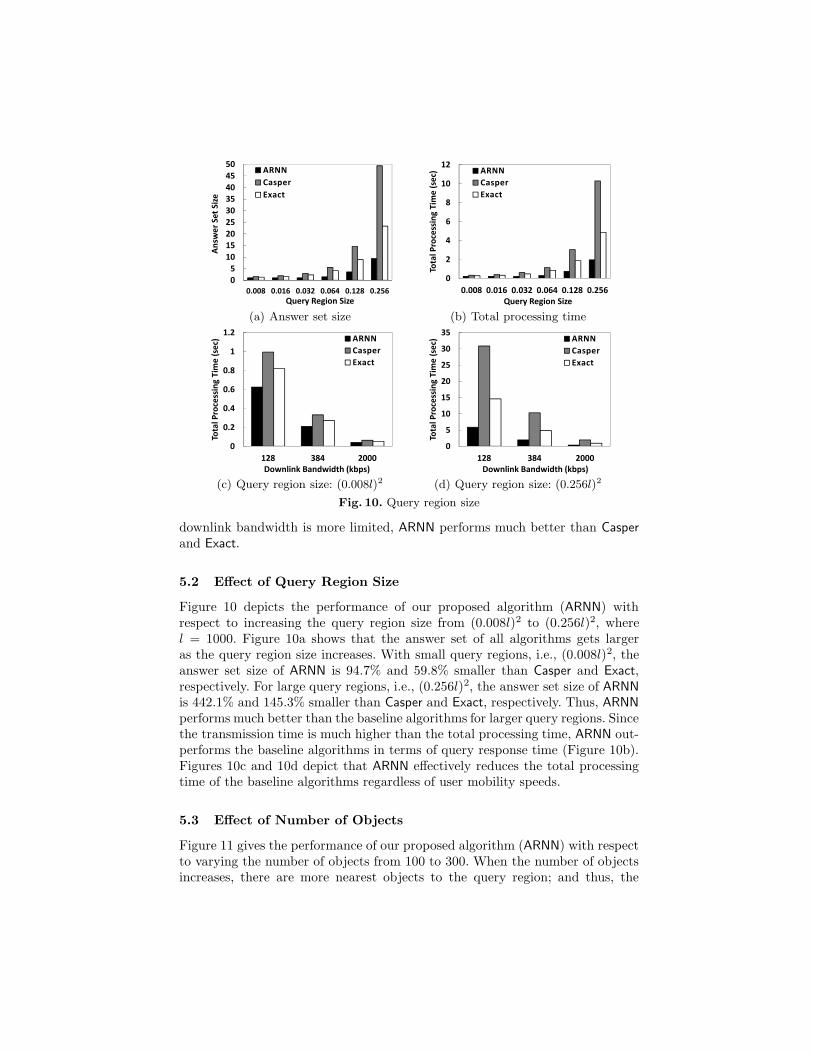
5.2 Effect of Query Region Size
Figure 10 depicts the performance of our proposed algorithm (ARNN) withrespect to increasing the query region size from (0.008l)2 to (0.256l)2, wherel = 1000. Figure 10a shows that the answer set of all algorithms gets largeras the query region size increases. With small query regions, i.e., (0.008l)2, theanswer set size of ARNN is 94.7% and 59.8% smaller than Casper and Exact,respectively. For large query regions, i.e., (0.256l)2, the answer set size of ARNN
is 442.1% and 145.3% smaller than Casper and Exact, respectively. Thus, ARNN
performs much better than the baseline algorithms for larger query regions. Sincethe transmission time is much higher than the total processing time, ARNN out-performs the baseline algorithms in terms of query response time (Figure 10b).Figures 10c and 10d depict that ARNN effectively reduces the total processingtime of the baseline algorithms regardless of user mobility speeds.
5.3 Effect of Number of Objects
Figure 11 gives the performance of our proposed algorithm (ARNN) with respectto varying the number of objects from 100 to 300. When the number of objectsincreases, there are more nearest objects to the query region; and thus, the
�
�
�
�
�
�
�
��� ��� ��� ��� ���
��
� ���������
��� �� ����� �����
��� � ���� !���
(a) Answer set size
�
���
���
���
���
�
���
��� ��� ��� ��� ��
�� ���������������
�������
��� �������� � ����
!"� � # �$�� %& ��
(b) Total processing time
�
���
�
���
�
���
��� ��� ����
�� �������������
�������
�� � ��������� ������� !��
"#$ $ %��!�� &'���
(c) 100 objects
�
���
�
���
�
���
�
���
��� ��� ����
�� �������������
�������
�� � ��������� ������� !��
"#$ $ %��!�� &'���
(d) 300 objects
Fig. 11. Number of objects
�
����
���
����
���
����
���
��� ��� ����
�� �������������
�������
�� � ��������� ������� !��
"#$ $
%��!��
&'���
(a) 0.5 KB
�
�
�
�
�
�
�
��� ��� ����
�� �������������
�������
�� � ��������� ������� !��
"#$ $
%��!��
&'���
(b) 20 KB
Fig. 12. Object size
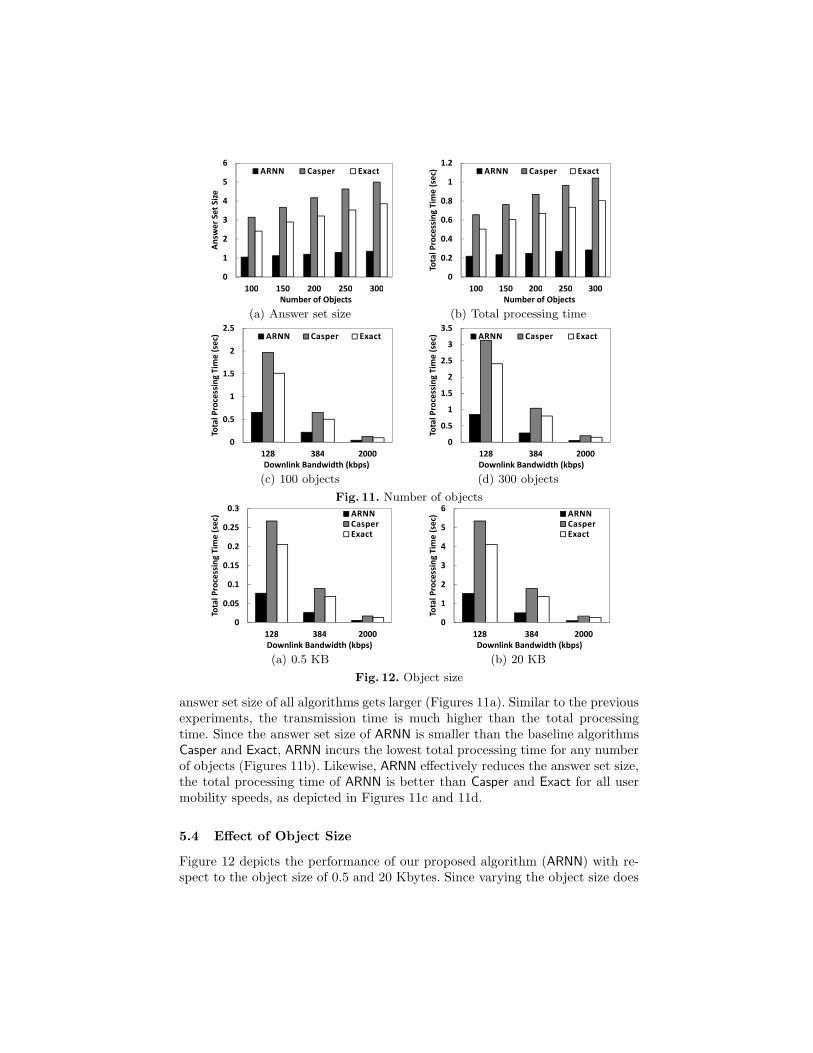
answer set size of all algorithms gets larger (Figures 11a). Similar to the previousexperiments, the transmission time is much higher than the total processingtime. Since the answer set size of ARNN is smaller than the baseline algorithmsCasper and Exact, ARNN incurs the lowest total processing time for any numberof objects (Figures 11b). Likewise, ARNN effectively reduces the answer set size,the total processing time of ARNN is better than Casper and Exact for all usermobility speeds, as depicted in Figures 11c and 11d.
5.4 Effect of Object Size
Figure 12 depicts the performance of our proposed algorithm (ARNN) with re-spect to the object size of 0.5 and 20 Kbytes. Since varying the object size does
�
���
�
���
�
���
�
� � � � ��
�� ���������������
�������
���� ����������
��� � �!�� "# ��
(a) Approximation tolerance
�
�
��
��
��
��
��
��
����� ����� ����� ���� ����� �����
�� ���������������
�������
� �������������� �
!�" "
# �$��
%& ��
(b) Query region size
�
���
�
���
�
���
�
���
��� ��� ��� ��� ���
���� �������������
�������
��� �������� �����
��� � �!�� "#�
(c) Number of objects
�
�
�
�
�
�
�
� � � � � ��
�� �������������
�������
� �������������� ����
!"# #
$��%��
&'���
(d) Object size
Fig. 13. Downlink bandwidth at vehicular speeds (128 kbps)
not affect the answer set size, the answer set size of all algorithms is the sameas the case that k = 4 in Figure 9a. It is interesting to see that the transmissiontime is much higher than the total processing time even if the object size is smalland the answer set is sent to the user through the downlink with the largest pos-sible bandwidth, i.e., 2 Mbps. Therefore, the results indicate that reducing theanswer set size is an effective way to improve query response time. This is themotivation of our proposed algorithm ARNN that aims to minimize the answerset size while guaranteeing that the answer set is satisfied with the user specifiedapproximation tolerance level k.
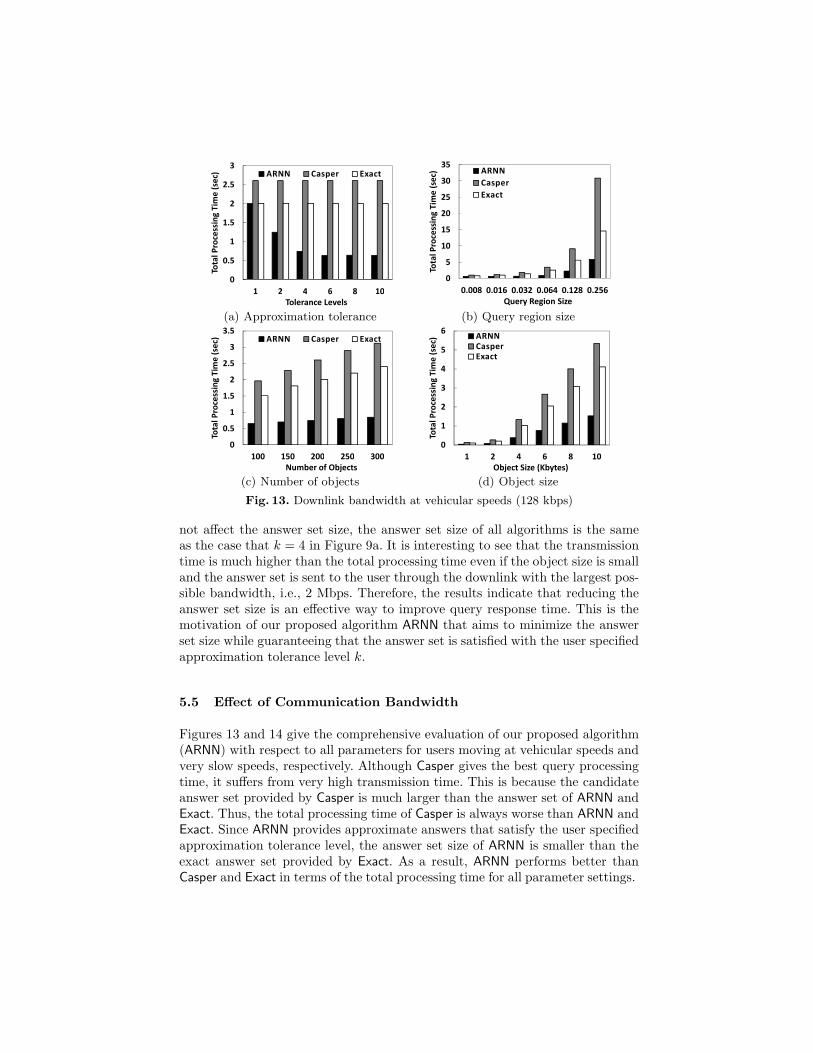
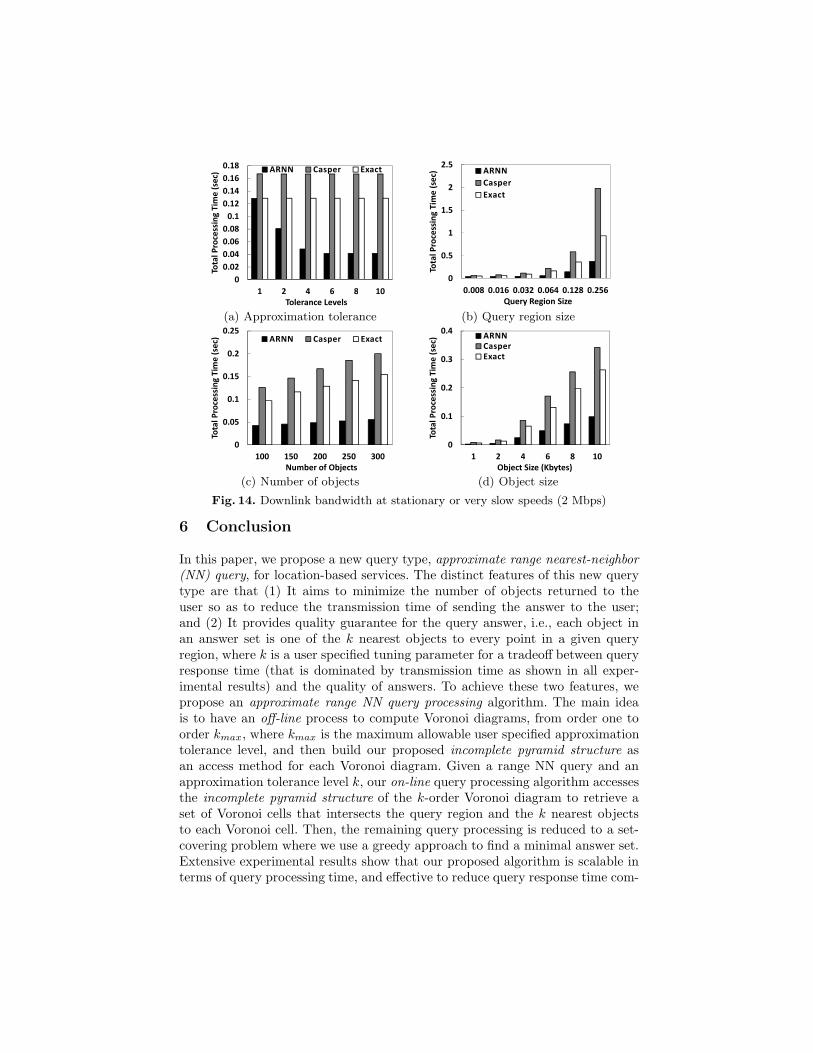
5.5 Effect of Communication Bandwidth
Figures 13 and 14 give the comprehensive evaluation of our proposed algorithm(ARNN) with respect to all parameters for users moving at vehicular speeds andvery slow speeds, respectively. Although Casper gives the best query processingtime, it suffers from very high transmission time. This is because the candidateanswer set provided by Casper is much larger than the answer set of ARNN andExact. Thus, the total processing time of Casper is always worse than ARNN andExact. Since ARNN provides approximate answers that satisfy the user specifiedapproximation tolerance level, the answer set size of ARNN is smaller than theexact answer set provided by Exact. As a result, ARNN performs better thanCasper and Exact in terms of the total processing time for all parameter settings.
�
����
����
����
����
���
����
����
����
����
� � � � � ��
��� ��������� ���
� �����
�������� ������
��� � ������ !��
(a) Approximation tolerance
�
���
�
���
�
���
����� ����� ����� ���� ����� �����
�� ���������������
�������
� �������������� �
!�" "
# �$��
%& ��
(b) Query region size
�
����
���
����
���
����
��� ��� ��� ��� ���
���� �������������
�������
��� �������� �����
��� � �!�� "#�
(c) Number of objects
�
���
���
���
���
� � � � � ��
�� �������������
�������
� �������������� ����
!"# #
$��%��
&'���
(d) Object size
Fig. 14. Downlink bandwidth at stationary or very slow speeds (2 Mbps)
6 Conclusion
In this paper, we propose a new query type, approximate range nearest-neighbor(NN) query, for location-based services. The distinct features of this new querytype are that (1) It aims to minimize the number of objects returned to theuser so as to reduce the transmission time of sending the answer to the user;and (2) It provides quality guarantee for the query answer, i.e., each object inan answer set is one of the k nearest objects to every point in a given queryregion, where k is a user specified tuning parameter for a tradeoff between queryresponse time (that is dominated by transmission time as shown in all exper-imental results) and the quality of answers. To achieve these two features, wepropose an approximate range NN query processing algorithm. The main ideais to have an off-line process to compute Voronoi diagrams, from order one toorder kmax, where kmax is the maximum allowable user specified approximationtolerance level, and then build our proposed incomplete pyramid structure asan access method for each Voronoi diagram. Given a range NN query and anapproximation tolerance level k, our on-line query processing algorithm accessesthe incomplete pyramid structure of the k-order Voronoi diagram to retrieve aset of Voronoi cells that intersects the query region and the k nearest objectsto each Voronoi cell. Then, the remaining query processing is reduced to a set-covering problem where we use a greedy approach to find a minimal answer set.Extensive experimental results show that our proposed algorithm is scalable interms of query processing time, and effective to reduce query response time com-
pared with the state-of-the-art techniques while guaranteeing that the answerset satisfies the user desired approximation tolerance level.
References
[1] Benetis, R., Jensen, C.S., Karciauskas, G., Saltenis, S.: Nearest and reverse nearestneighbor queries for moving objects. VLDB Journal 15(3) (2006) 229–249
[2] Hu, H., Xu, J., Lee, D.L.: A generic framework for monitoring continuous spatialqueries over moving objects. In: SIGMOD. (2005)
[3] Mouratidis, K., Papadias, D., Hadjieleftheriou, M.: Conceptual partitioning: Anefficient method for continuous nearest neighbor monitoring. In: SIGMOD. (2005)
[4] Mokbel, M.F., Xiong, X., Aref, W.G.: Sina: Scalable incremental processing ofcontinuous queries in spatio-temporal databases. In: SIGMOD. (2004)
[5] Zheng, B., Xu, J., Lee, W.C., Lee, D.L.: Grid-partition index: A hybrid methodfor nearest-neighbor queries in wireless location-based services. VLDB Journal15(1) (2006) 21–39
[6] Tao, Y., Papadias, D., Shen, Q.: Continuous nearest neighbor search. In: VLDB.(2002)
[7] Hu, H., Lee, D.L.: Range nearest-neighbor query. IEEE TKDE 18(1) (2006)78–91
[8] Kalnis, P., Ghinita, G., Mouratidis, K., Papadias, D.: Preventing location-basedidentity inference in anonymous spatial queries. IEEE TKDE 19(12) (2007) 1719–1733
[9] Mokbel, M.F., Chow, C.Y., Aref, W.G.: The new casper: Query processing forlocation services without compromising privacy. In: VLDB. (2006)
[10] de Almeida, V.T., Guting, R.H.: Supporting uncertainty in moving objects innetwork databases. In: ACM GIS. (2005)
[11] Cheng, R., Kalashnikov, D.V., Prabhakar, S.: Querying imprecise data in movingobject environments. IEEE TKDE 16(9) (2004) 1112–1127
[12] Pfoser, D., Jensen, C.S.: Capturing the uncertainty of moving-object representa-tions. In: SSD. (1999)
[13] Trajcevski, G., Wolfson, O., Hinrichs, K., Chamberlain, S.: Managing uncertaintyin moving objects databases. ACM TODS 29(3) (2004) 463–507
[14] Yiu, M.L., Mamoulis, N., Dai, X., Tao, Y., Vaitis, M.: Efficient evaluation of prob-abilistic advanced spatial queries on existentially uncertain data. IEEE TKDE21(1) (2009) 108–122
[15] Bamba, B., Liu, L., Pesti, P., Wang, T.: Supporting anonymous location queriesin mobile environments with privacygrid. In: WWW. (2008)
[16] Cheng, R., Zhang, Y., Bertino, E., Prabhakar, S.: Preserving user location privacyin mobile data management infrastructures. In: PET. (2006)
[17] Ghinita1, G., Kalnis, P., Skiadopoulos, S.: Mobihide : A mobile peer-to-peersystem for anonymous location-based queries. In: SSTD. (2007)
[18] Gedik, B., Liu, L.: Protecting location privacy with personalized k-anonymity:Architecture and algorithms. IEEE Trans. on Mobile Computing 7(1) (2008) 1–18
[19] Hu, H., Xu, J.: Non-exposure location anonymity. In: ICDE. (2009)[20] Lee, D.T.: On k-nearest neighbor voronoi diagrams in the plane. IEEE Trans. on
Computers 31(6) (1982) 478–487[21] Cormen, T.H., Leiserson, C.E., Rivest, R.L., Stein, C.: Introduction to Algo-
rithms, 2nd Edition. MIT Press, Cambridge, MA (2001)


![Nearest-Neighbor Searching Under Uncertaintypankaj/publications/papers/enn.pdfwhere p is the actual nearest neighbor. Arya et al. [6] gener-alized space-time trade-o s for approximate](https://img.pdfslide.net/doc/110x75/60c925b6f1b90f3058761a8d/nearest-neighbor-searching-under-uncertainty-pankajpublicationspapersennpdf.jpg)


![Approximate Nearest Neighbor Search for Low Dimensional ... · Approximate Nearest Neighbor Search for Low ... [KR02]. The problem of ANN in spaces of low doubling dimension was studied](https://img.pdfslide.net/doc/110x75/5c76bd1409d3f28c0f8c1247/approximate-nearest-neighbor-search-for-low-dimensional-approximate-nearest.jpg)