Embed Size (px)
Citation preview
1
April 29, 2009
Overview ofStandards of Quality
Funding Process
Presented tothe Standing Committee
of the Standards of Quality
Overview ofStandards of Quality
Funding Process
Presented tothe Standing Committee
of the Standards of Quality
Kent C. DickeyAssistant Superintendent for Finance
2
April 29, 2009
Briefing OutlineBriefing OutlineBriefing OutlineBriefing Outline
SOQ RequirementsSOQ Funding Summary Determining SOQ CostsDetermining State &
Local Shares of CostAppendices
SOQ RequirementsSOQ Funding Summary Determining SOQ CostsDetermining State &
Local Shares of CostAppendices
3
April 29, 2009
SOQ RequirementsSOQ RequirementsSOQ RequirementsSOQ Requirements
The Virginia Constitution requires the Board of Education to formulate Standards of Quality (SOQ) for public schools.
The General Assembly is charged with revising the SOQ, determining SOQ costs, and apportioning the cost between the state and localities.
The decision about how much to appropriate for public schools is left to the General Assembly.
4
April 29, 2009
SOQ RequirementsSOQ RequirementsSOQ RequirementsSOQ Requirements
The SOQ is established in the Virginia Constitution as the minimum educational program school divisions must provide.
The specific requirements of the SOQ are set out in the Code of Virginia and the appropriation act, such as requirements for programs and staffing.
State funding must be matched by the locality. Localities may spend more than the required amounts and offer programs and employ staff beyond what is required.
5
April 29, 2009
SOQ Funding SummarySOQ Funding SummarySOQ Funding SummarySOQ Funding Summary The primary determinant of state funding for
school divisions. (FY10 funding shown in Appendix A.)
$5.3 billion – or 91.3% of state funding for public education – in FY10. Over 80% of SOQ funding is for salaries and benefits.
Required local match in FY10 is $3.4 billion – most localities exceed their required match for the SOQ.
Existing SOQ funding based largely on JLARC methodology developed in the mid/late 1980s.
The primary determinant of state funding for school divisions. (FY10 funding shown in Appendix A.)
$5.3 billion – or 91.3% of state funding for public education – in FY10. Over 80% of SOQ funding is for salaries and benefits.
Required local match in FY10 is $3.4 billion – most localities exceed their required match for the SOQ.
Existing SOQ funding based largely on JLARC methodology developed in the mid/late 1980s.
6
April 29, 2009
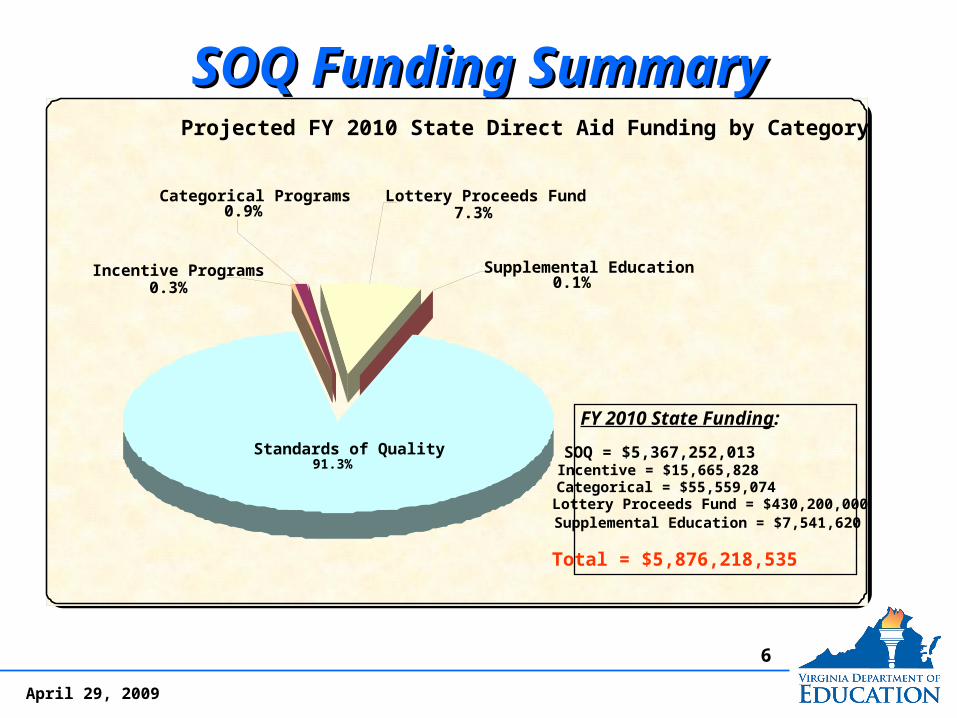
SOQ Funding SummarySOQ Funding SummarySOQ Funding SummarySOQ Funding SummaryProjected FY 2010 State Direct Aid Funding by Category
Standards of Quality91.3%
Categorical Programs0.9%
Incentive Programs0.3%
Supplemental Education0.1%
Lottery Proceeds Fund7.3%
FY 2010 State Funding:
SOQ = $5,367,252,013Incentive = $15,665,828Categorical = $55,559,074Lottery Proceeds Fund = $430,200,000Supplemental Education = $7,541,620
Total = $5,876,218,535
7
April 29, 2009
SOQ Funding SummarySOQ Funding SummarySOQ Funding SummarySOQ Funding Summary Funding for the Standards of Quality is provided
through the following accounts, mostly on a per pupil basis (formulas shown in Appendix B):– Basic Aid– Special Education– Career and Technical Education– Prevention, Intervention, and Remediation– Gifted Education– English as a Second Language– Remedial Summer School– Fringe Benefits for funded instructional positions– Sales Tax (1.125% for public education)– Textbooks
Funding for the Standards of Quality is provided through the following accounts, mostly on a per pupil basis (formulas shown in Appendix B):– Basic Aid– Special Education– Career and Technical Education– Prevention, Intervention, and Remediation– Gifted Education– English as a Second Language– Remedial Summer School– Fringe Benefits for funded instructional positions– Sales Tax (1.125% for public education)– Textbooks
8
April 29, 2009
Determining SOQ CostsDetermining SOQ CostsDetermining SOQ CostsDetermining SOQ Costs Three components of SOQ cost:
1. required number of instructional positions (salary and benefits) – driven by staffing standards in Standard 2, appropriation act, and BOE regulations;
2. recognized support positions (salary and benefits); and,
3. recognized “non-personal” support costs (e.g., supplies, utilities, etc.).
The support cost components (2 & 3) are funded through Basic Aid mostly on a prevailing cost basis.
Each SOQ account is funded by a per pupil cost calculated for each division and distributed on March 31 ADM.
Three components of SOQ cost:1. required number of instructional positions (salary
and benefits) – driven by staffing standards in Standard 2, appropriation act, and BOE regulations;
2. recognized support positions (salary and benefits); and,
3. recognized “non-personal” support costs (e.g., supplies, utilities, etc.).
The support cost components (2 & 3) are funded through Basic Aid mostly on a prevailing cost basis.
Each SOQ account is funded by a per pupil cost calculated for each division and distributed on March 31 ADM.
9
April 29, 2009
Determining SOQ CostsDetermining SOQ CostsDetermining SOQ CostsDetermining SOQ Costs Key input data used to cost out the three
components are updated every two years during rebenchmarking:
1. number of students2. staffing standards for teachers and other
instructional positions3. salaries of teachers and other instructional
positions4. fringe benefit rates5. standard and prevailing support costs6. inflation factors7. federal revenues deducted from support costs8. amount of sales tax revenue and school
division composite indices
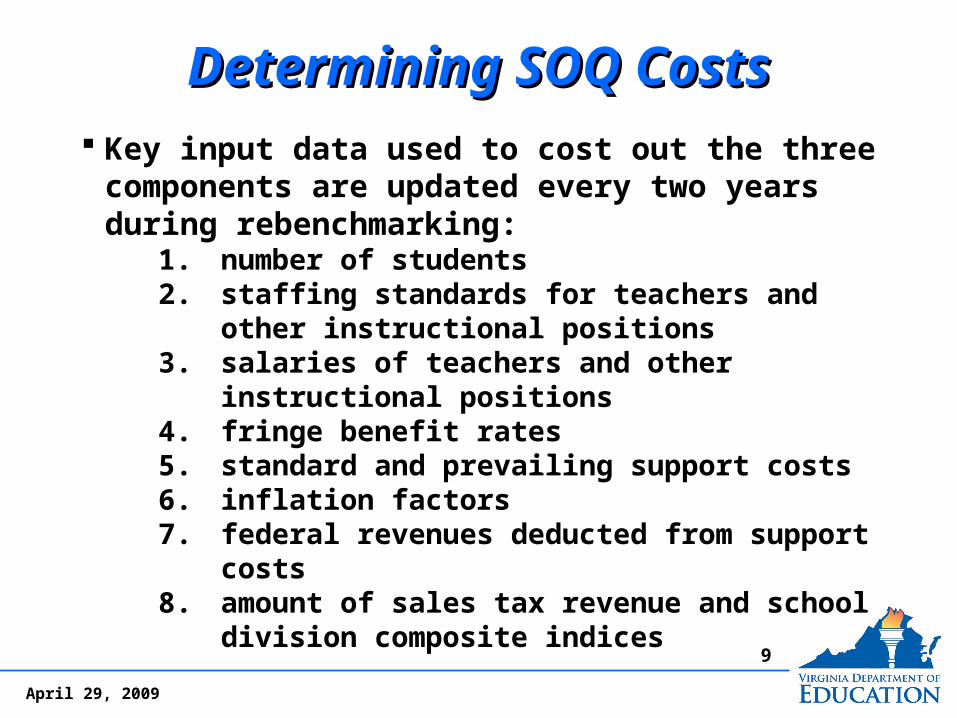
Key input data used to cost out the three components are updated every two years during rebenchmarking:
1. number of students2. staffing standards for teachers and other
instructional positions3. salaries of teachers and other instructional
positions4. fringe benefit rates5. standard and prevailing support costs6. inflation factors7. federal revenues deducted from support costs8. amount of sales tax revenue and school
division composite indices
10
April 29, 2009
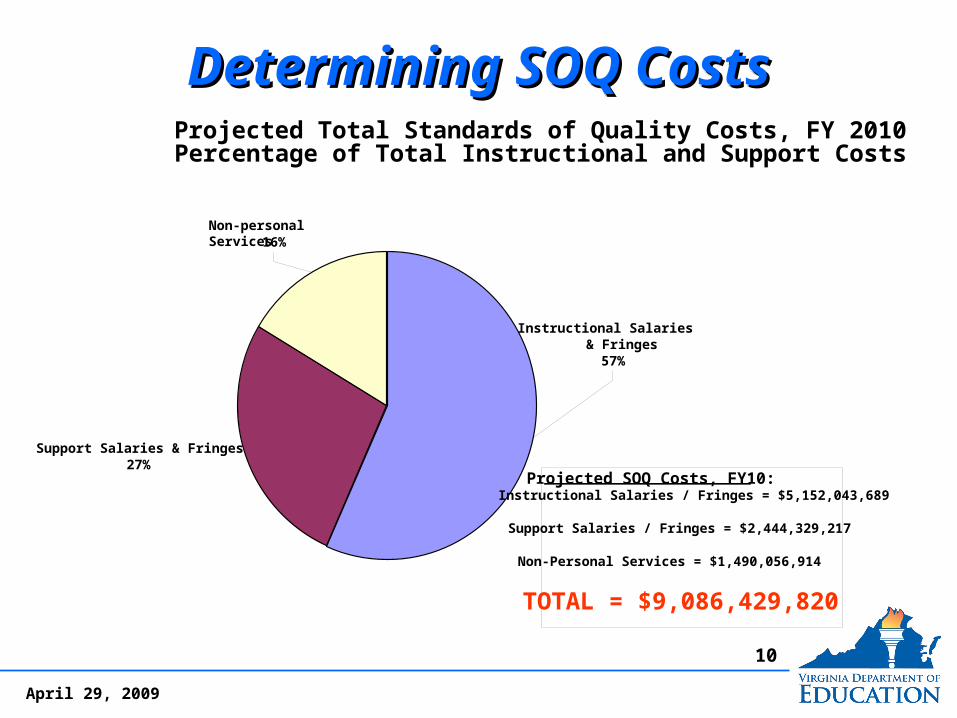
Determining SOQ CostsDetermining SOQ CostsDetermining SOQ CostsDetermining SOQ CostsProjected Total Standards of Quality Costs, FY 2010Percentage of Total Instructional and Support Costs
Instructional Salaries & Fringes
57%
Non-personal Services16%
Support Salaries & Fringes27%
Projected SOQ Costs, FY10:Instructional Salaries / Fringes = $5,152,043,689
Support Salaries / Fringes = $2,444,329,217
Non-Personal Services = $1,490,056,914
TOTAL = $9,086,429,820
11
April 29, 2009
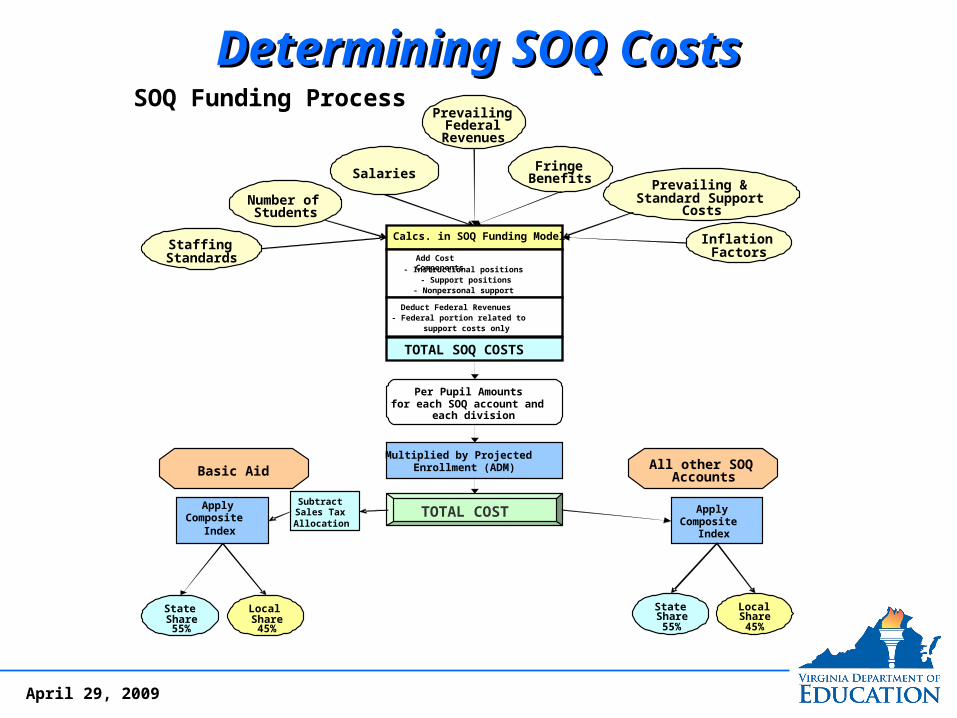
Determining SOQ CostsDetermining SOQ CostsDetermining SOQ CostsDetermining SOQ CostsSOQ Funding Process
Staffing
Standards
Number of Students
SalariesFringe
Benefits Prevailing & Standard Support
Costs
Inflation
Factors
Multiplied by Projected Enrollment (ADM)
TOTAL COST
Basic Aid All other SOQ Accounts
Apply Composite
Index
State
Share55%
Subtract Sales Tax Allocation
Local
Share45%
State
Share55%
Local Share45%
Apply Composite
Index
Prevailing Federal
Revenues
Calcs. in SOQ Funding Model
Add Cost Components
- Instructional positions- Support positions
- Nonpersonal support
Deduct Federal Revenues- Federal portion related to
support costs only
TOTAL SOQ COSTS
Per Pupil Amountsfor each SOQ account and
each division
12
April 29, 2009
Determining SOQ CostsDetermining SOQ CostsDetermining SOQ CostsDetermining SOQ Costs
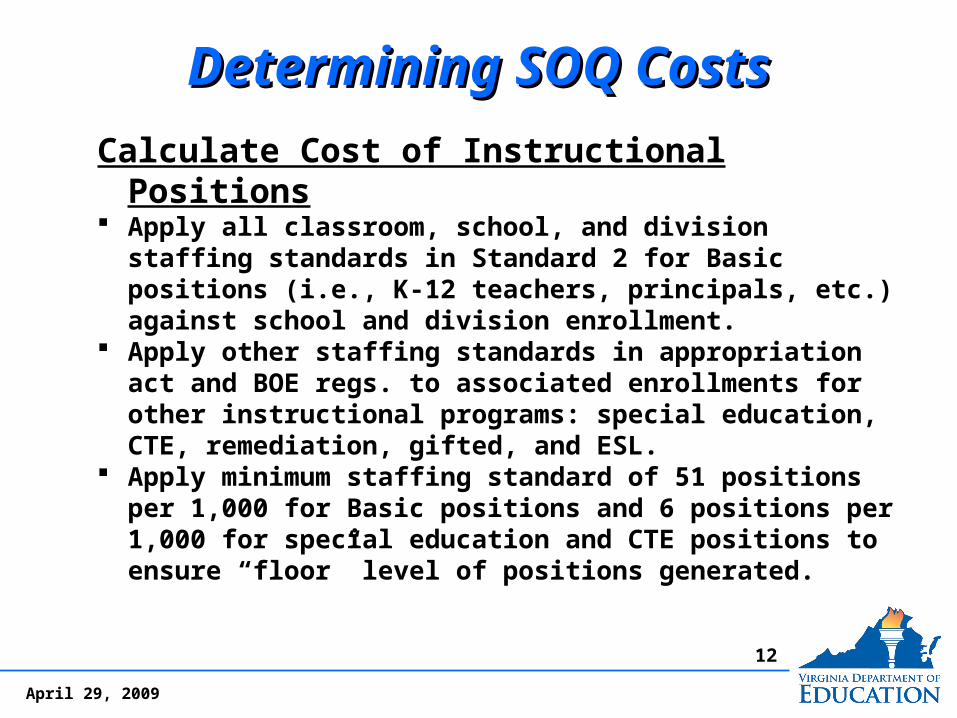
Calculate Cost of Instructional Positions Apply all classroom, school, and division staffing
standards in Standard 2 for Basic positions (i.e., K-12 teachers, principals, etc.) against school and division enrollment.
Apply other staffing standards in appropriation act and BOE regs. to associated enrollments for other instructional programs: special education, CTE, remediation, gifted, and ESL.
Apply minimum staffing standard of 51 positions per 1,000 for Basic positions and 6 positions per 1,000 for special education and CTE positions to ensure “floor” level of positions generated.
13
April 29, 2009
Determining SOQ CostsDetermining SOQ CostsDetermining SOQ CostsDetermining SOQ Costs
Calculate Cost of Instructional Positions The generated instructional positions for each
division are multiplied by the applicable funded salary (and cost of competing factor if applicable).
The instructional salary costs are assigned to the applicable SOQ accounts (i.e., Basic Aid, special education, etc.).
The associated fringe benefit costs for the positions are funded in the separate fringe benefit accounts (VRS retirement, Social Security, and VRS group life). Health care is funded in Basic Aid.
14
April 29, 2009
Determining SOQ CostsDetermining SOQ CostsDetermining SOQ CostsDetermining SOQ Costs
Features of “Prevailing Cost” Recognize operating costs in the SOQ based
on “reasonable” costs, not each school division’s actual spending.
JLARC stated “reasonable cost” should reflect what most school divisions spend, not reimbursement of actual expenditures.
Applied to cost components not quantified in the SOQ:
– instructional and support salary amounts– support staffing per pupil– non-personal support costs per pupil
15
April 29, 2009
Determining SOQ CostsDetermining SOQ CostsDetermining SOQ CostsDetermining SOQ Costs
Features of “Prevailing Cost” Includes the cost of every division but is not
unduly influenced by divisions with unusually high or low costs.
A weighted average (“linear weighted average”) cost whose weights are derived from the proximity of division costs to the middle or median cost in the distribution.
Gives greatest weight to the median cost; least weight to the very highest and lowest costs.
Most school divisions’ actual costs are a little under or a little over the calculated prevailing cost.
16
April 29, 2009
Determining SOQ CostsDetermining SOQ CostsDetermining SOQ CostsDetermining SOQ Costs
Calculation of “Prevailing Cost” Array each division’s actual base-year average
salary, per pupil support cost, or per pupil support staffing from high to low.
Assign a weight of 5 to the middle or median division cost.
Assign corresponding declining weights to costs on either side of the median cost until the highest and lowest costs are reached, which are weighted at 1.
Apply weights to individual data points and calculate the weighted average. Adjust values for inflation.
17
April 29, 2009
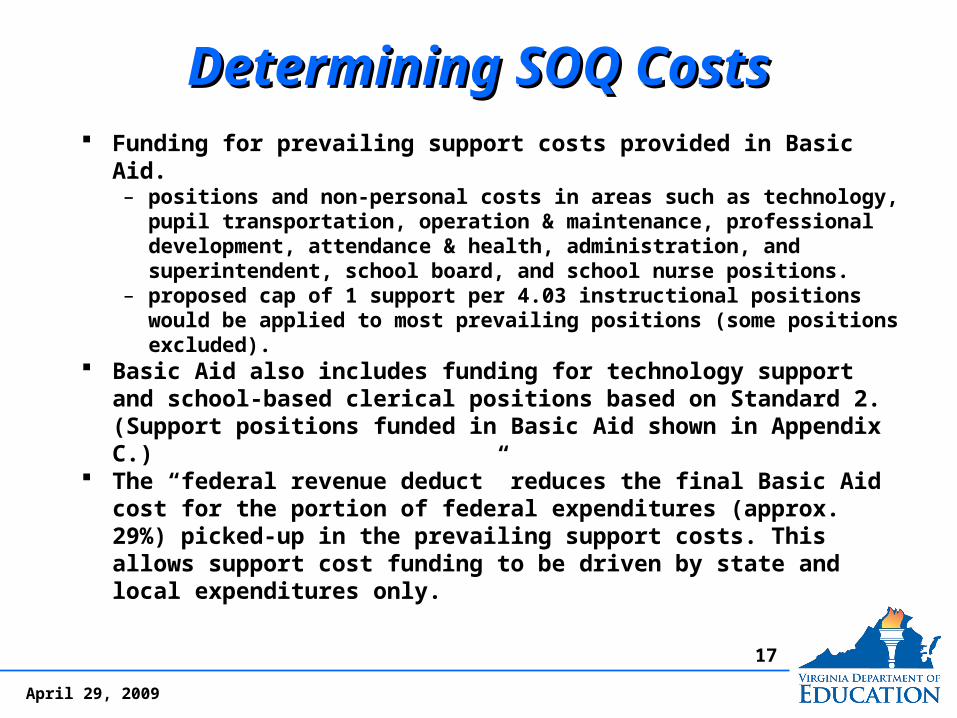
Determining SOQ CostsDetermining SOQ CostsDetermining SOQ CostsDetermining SOQ Costs Funding for prevailing support costs provided in Basic Aid.
– positions and non-personal costs in areas such as technology, pupil transportation, operation & maintenance, professional development, attendance & health, administration, and superintendent, school board, and school nurse positions.
– proposed cap of 1 support per 4.03 instructional positions would be applied to most prevailing positions (some positions excluded).
Basic Aid also includes funding for technology support and school-based clerical positions based on Standard 2. (Support positions funded in Basic Aid shown in Appendix C.)
The “federal revenue deduct” reduces the final Basic Aid cost for the portion of federal expenditures (approx. 29%) picked-up in the prevailing support costs. This allows support cost funding to be driven by state and local expenditures only.
Funding for prevailing support costs provided in Basic Aid.– positions and non-personal costs in areas such as technology,
pupil transportation, operation & maintenance, professional development, attendance & health, administration, and superintendent, school board, and school nurse positions.
– proposed cap of 1 support per 4.03 instructional positions would be applied to most prevailing positions (some positions excluded).
Basic Aid also includes funding for technology support and school-based clerical positions based on Standard 2. (Support positions funded in Basic Aid shown in Appendix C.)
The “federal revenue deduct” reduces the final Basic Aid cost for the portion of federal expenditures (approx. 29%) picked-up in the prevailing support costs. This allows support cost funding to be driven by state and local expenditures only.
18
April 29, 2009
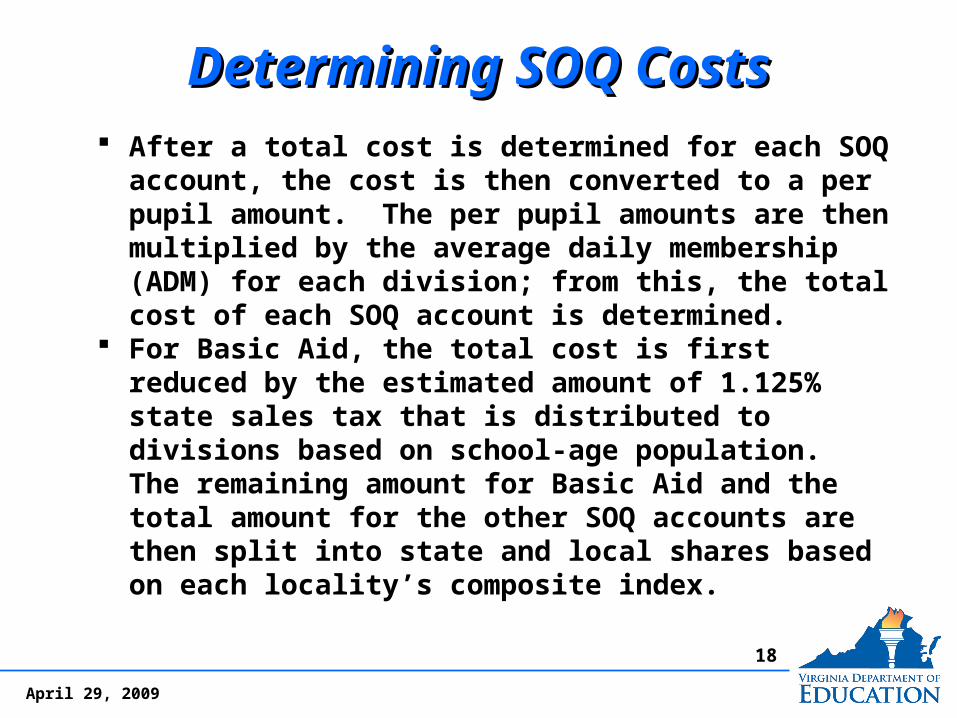
Determining SOQ CostsDetermining SOQ CostsDetermining SOQ CostsDetermining SOQ Costs After a total cost is determined for each SOQ
account, the cost is then converted to a per pupil amount. The per pupil amounts are then multiplied by the average daily membership (ADM) for each division; from this, the total cost of each SOQ account is determined.
For Basic Aid, the total cost is first reduced by the estimated amount of 1.125% state sales tax that is distributed to divisions based on school-age population. The remaining amount for Basic Aid and the total amount for the other SOQ accounts are then split into state and local shares based on each locality’s composite index.
After a total cost is determined for each SOQ account, the cost is then converted to a per pupil amount. The per pupil amounts are then multiplied by the average daily membership (ADM) for each division; from this, the total cost of each SOQ account is determined.
For Basic Aid, the total cost is first reduced by the estimated amount of 1.125% state sales tax that is distributed to divisions based on school-age population. The remaining amount for Basic Aid and the total amount for the other SOQ accounts are then split into state and local shares based on each locality’s composite index.
19
April 29, 2009
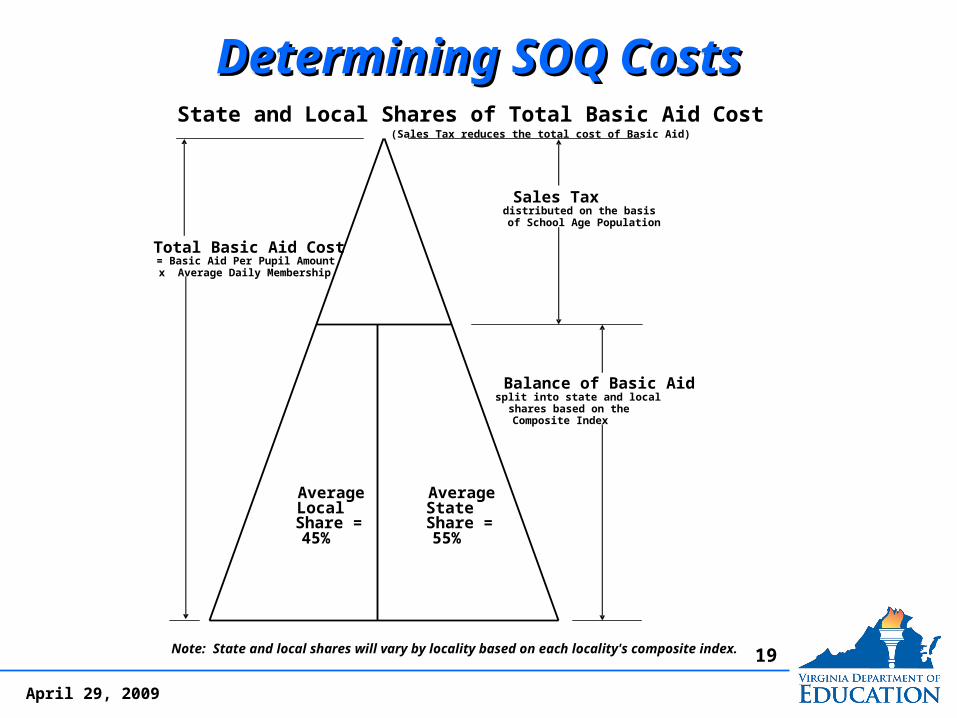
Determining SOQ CostsDetermining SOQ CostsDetermining SOQ CostsDetermining SOQ Costs
Sales Taxdistributed on the basisof School Age Population
Total Basic Aid Cost= Basic Aid Per Pupil Amountx Average Daily Membership
Balance of Basic Aidsplit into state and localshares based on theComposite Index
Average AverageLocal StateShare = Share =45% 55%
Note: State and local shares will vary by locality based on each locality's composite index.
State and Local Shares of Total Basic Aid Cost(Sales Tax reduces the total cost of Basic Aid)
20
April 29, 2009
Determining State & Local SharesDetermining State & Local SharesDetermining State & Local SharesDetermining State & Local Shares
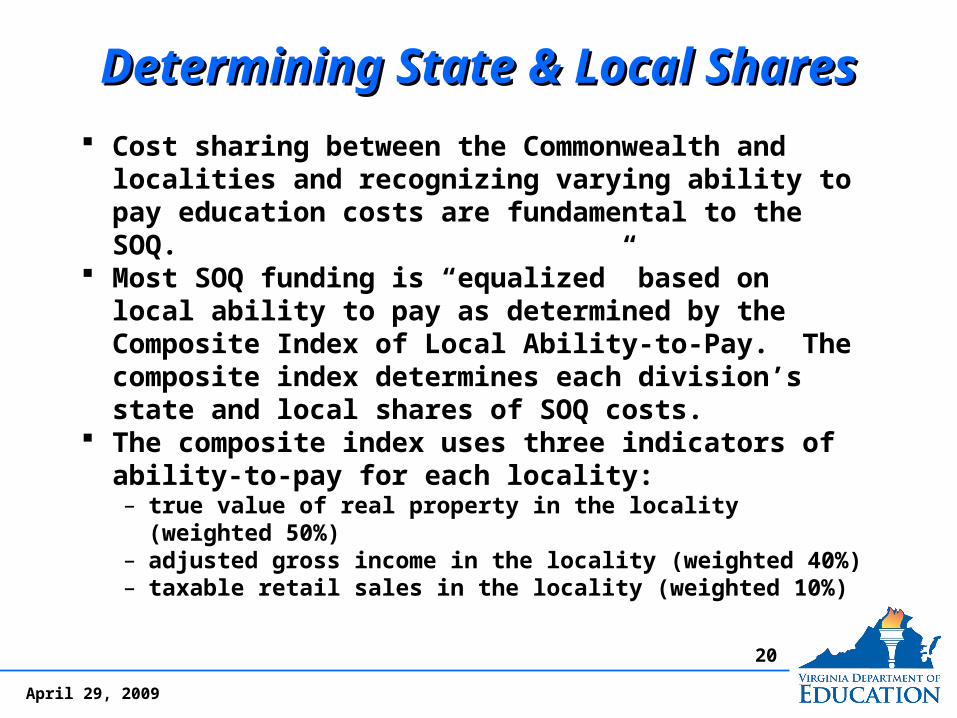
Cost sharing between the Commonwealth and localities and recognizing varying ability to pay education costs are fundamental to the SOQ.
Most SOQ funding is “equalized” based on local ability to pay as determined by the Composite Index of Local Ability-to-Pay. The composite index determines each division’s state and local shares of SOQ costs.
The composite index uses three indicators of ability-to-pay for each locality:– true value of real property in the locality (weighted 50%)– adjusted gross income in the locality (weighted 40%)– taxable retail sales in the locality (weighted 10%)
21
April 29, 2009
Determining State & Local SharesDetermining State & Local SharesDetermining State & Local SharesDetermining State & Local Shares
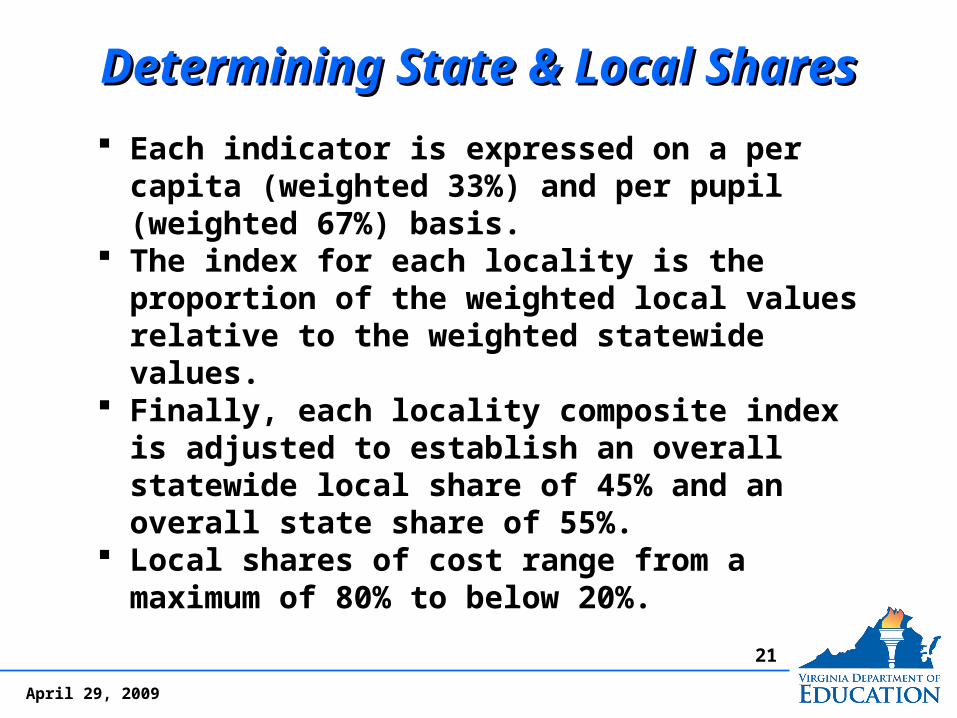
Each indicator is expressed on a per capita (weighted 33%) and per pupil (weighted 67%) basis.
The index for each locality is the proportion of the weighted local values relative to the weighted statewide values.
Finally, each locality composite index is adjusted to establish an overall statewide local share of 45% and an overall state share of 55%.
Local shares of cost range from a maximum of 80% to below 20%.
22
April 29, 2009
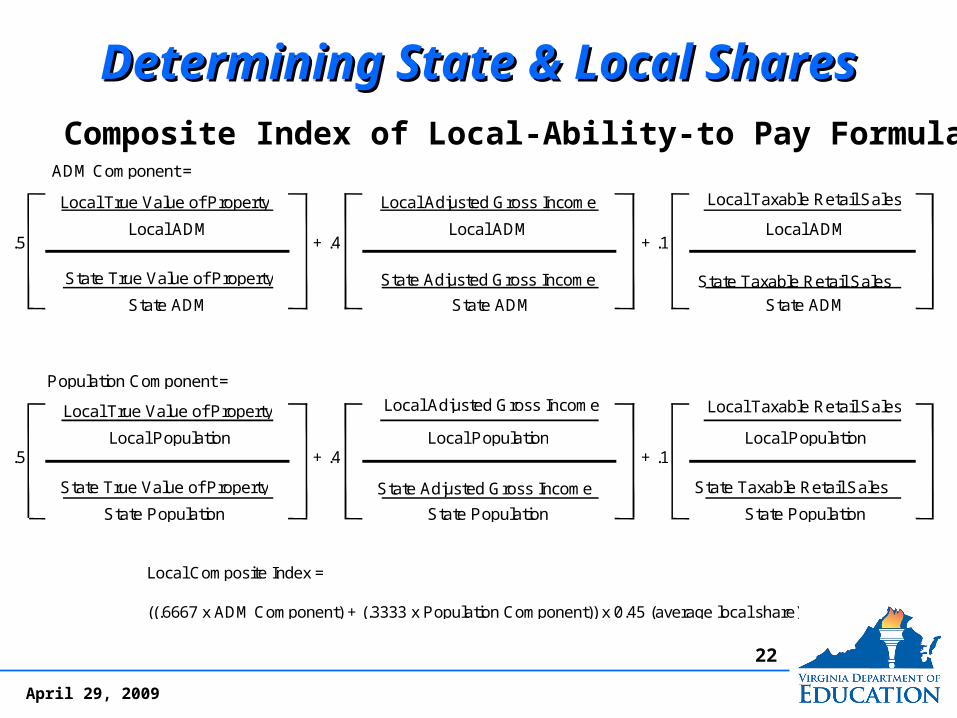
Determining State & Local SharesDetermining State & Local SharesDetermining State & Local SharesDetermining State & Local SharesComposite Index of Local Ability-to-Pay Formula
ADM Component =
Local True Value of Property Local Adjusted Gross Income Local Taxable Retail Sales
Local ADM Local ADM Local ADM.5 + .4 + .1
State True Value of Property State Adjusted Gross Income State Taxable Retail Sales
State ADM State ADM State ADM
Population Component =
Local True Value of Property Local Adjusted Gross Income Local Taxable Retail Sales
Local Population Local Population Local Population.5 + .4 + .1
State True Value of Property State Adjusted Gross Income State Taxable Retail Sales
State Population State Population State Population
Composite Index of Local-Ability-to Pay Formula
Composite Index of Local Ability-to-Pay Formula
Local Composite Index =
((.6667 x ADM Component) + (.3333 x Population Component)) x 0.45 (average local share)
23
April 29, 2009
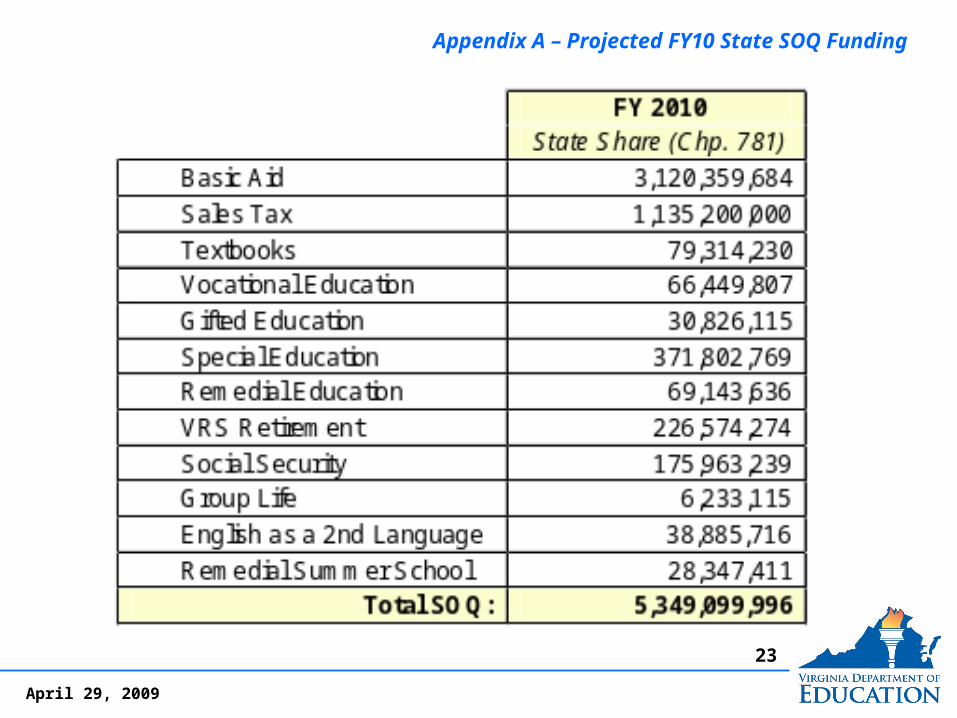
Appendix A – Projected FY10 State SOQ FundingAppendix A – Projected FY10 State SOQ Funding
24
April 29, 2009
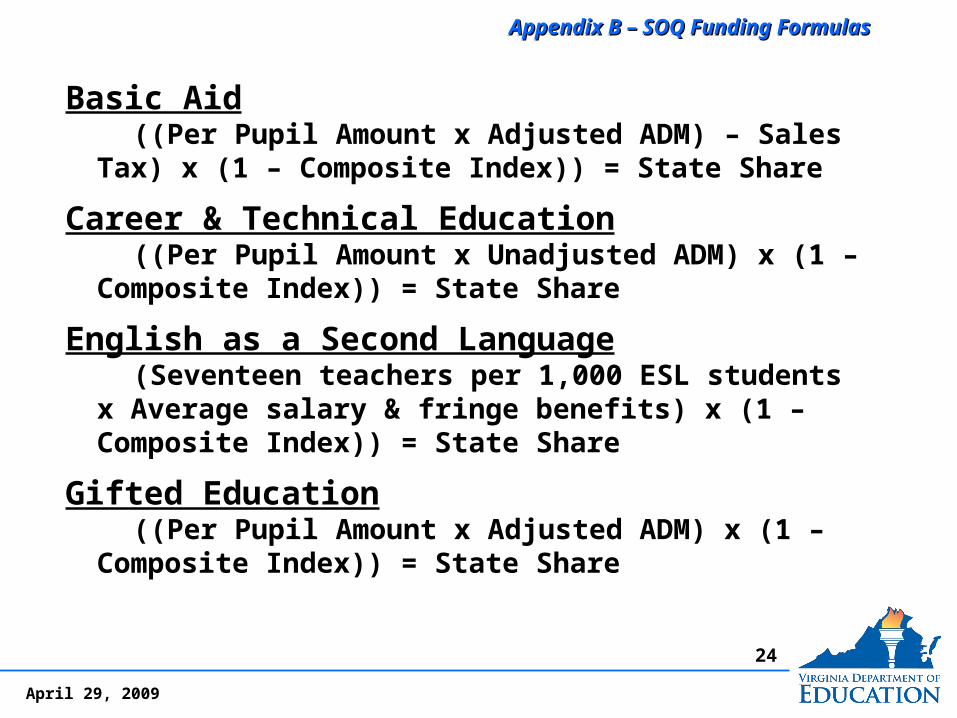
Appendix B – SOQ Funding Formulas Appendix B – SOQ Funding Formulas Appendix B – SOQ Funding Formulas Appendix B – SOQ Funding Formulas
Basic Aid ((Per Pupil Amount x Adjusted ADM) – Sales Tax)
x (1 – Composite Index)) = State Share
Career & Technical Education ((Per Pupil Amount x Unadjusted ADM) x (1 –
Composite Index)) = State Share
English as a Second Language (Seventeen teachers per 1,000 ESL students x
Average salary & fringe benefits) x (1 – Composite Index)) = State Share
Gifted Education ((Per Pupil Amount x Adjusted ADM) x (1 –
Composite Index)) = State Share
25
April 29, 2009
Appendix B – SOQ Funding Formulas Appendix B – SOQ Funding Formulas Appendix B – SOQ Funding Formulas Appendix B – SOQ Funding Formulas
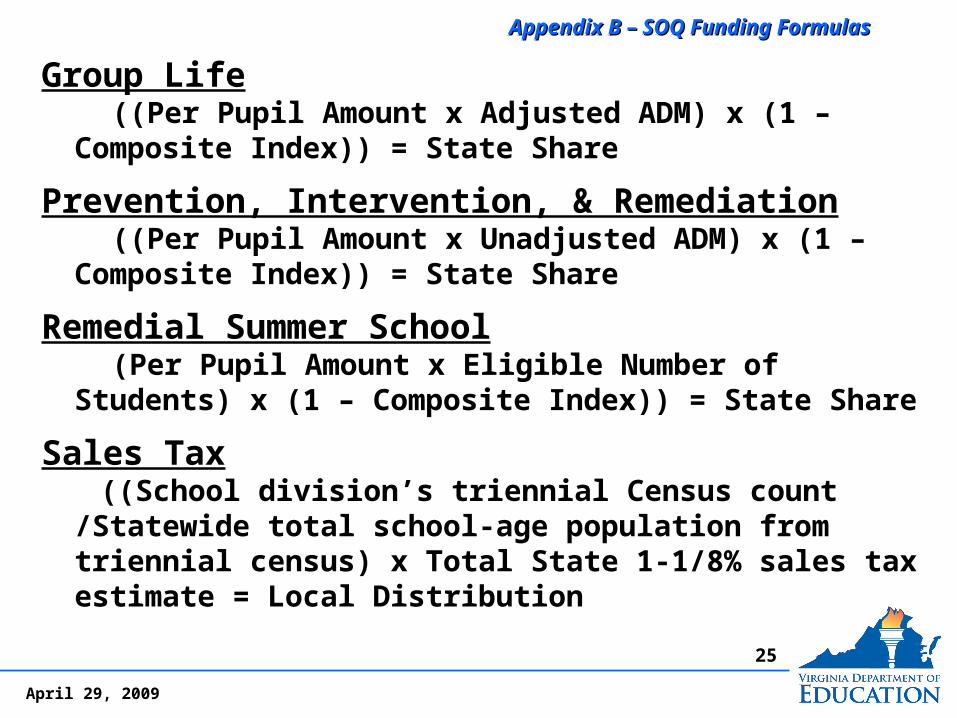
Group Life ((Per Pupil Amount x Adjusted ADM) x (1 – Composite
Index)) = State Share
Prevention, Intervention, & Remediation ((Per Pupil Amount x Unadjusted ADM) x (1 –
Composite Index)) = State Share
Remedial Summer School (Per Pupil Amount x Eligible Number of Students) x (1 –
Composite Index)) = State Share
Sales Tax ((School division’s triennial Census count /Statewide
total school-age population from triennial census) x Total State 1-1/8% sales tax estimate = Local Distribution
26
April 29, 2009
Appendix B – SOQ Funding Formulas Appendix B – SOQ Funding Formulas Appendix B – SOQ Funding Formulas Appendix B – SOQ Funding Formulas
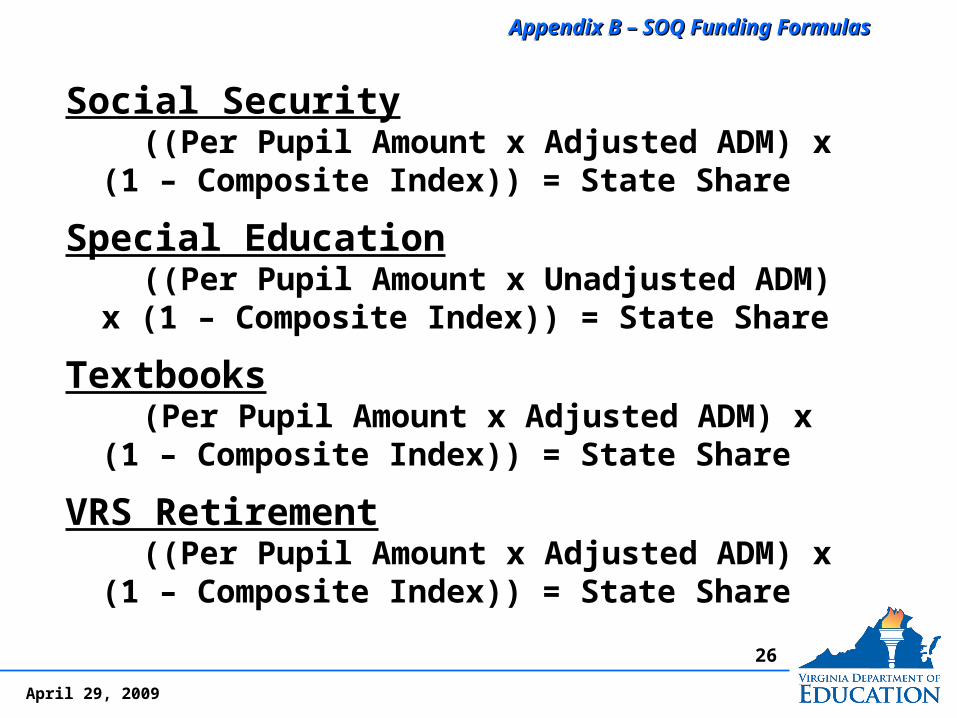
Social Security ((Per Pupil Amount x Adjusted ADM) x (1 –
Composite Index)) = State Share
Special Education ((Per Pupil Amount x Unadjusted ADM) x (1 –
Composite Index)) = State Share
Textbooks (Per Pupil Amount x Adjusted ADM) x (1 –
Composite Index)) = State Share
VRS Retirement ((Per Pupil Amount x Adjusted ADM) x (1 –
Composite Index)) = State Share
27
April 29, 2009
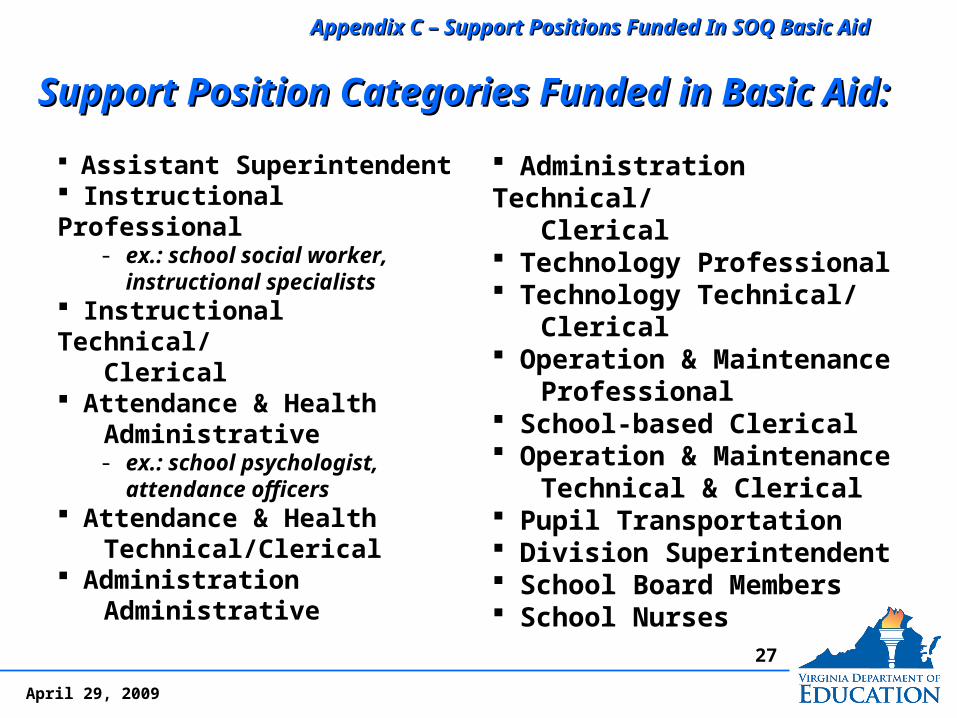
Support Position Categories Funded in Basic Aid:Support Position Categories Funded in Basic Aid: Support Position Categories Funded in Basic Aid:Support Position Categories Funded in Basic Aid:
Assistant Superintendent Instructional Professional
- ex.: school social worker, instructional specialists
Instructional Technical/ Clerical Attendance & Health Administrative
- ex.: school psychologist, attendance officers
Attendance & Health Technical/Clerical Administration Administrative
Assistant Superintendent Instructional Professional
- ex.: school social worker, instructional specialists
Instructional Technical/ Clerical Attendance & Health Administrative
- ex.: school psychologist, attendance officers
Attendance & Health Technical/Clerical Administration Administrative
Administration Technical/ Clerical Technology Professional Technology Technical/ Clerical Operation & Maintenance Professional School-based Clerical Operation & Maintenance Technical & Clerical Pupil Transportation Division Superintendent School Board Members School Nurses
Administration Technical/ Clerical Technology Professional Technology Technical/ Clerical Operation & Maintenance Professional School-based Clerical Operation & Maintenance Technical & Clerical Pupil Transportation Division Superintendent School Board Members School Nurses
Appendix C – Support Positions Funded In SOQ Basic Aid Appendix C – Support Positions Funded In SOQ Basic Aid Appendix C – Support Positions Funded In SOQ Basic Aid Appendix C – Support Positions Funded In SOQ Basic Aid