Embed Size (px)
Citation preview

April 30th, 2014The McKnight Foundation
710 S 2nd St Ste 400, Minneapolis, MN
Shared Prosperity Work Group 2
This year, our region will create a set of shared, objective metrics to track the Greater MSP region’s overall success on critical economic, environmental and social outcomes.
THE PROJECT
The RESULT for our region will be
• More effective regional priority-setting• Greater coordination across regional initiatives• Better visibility & use of existing data assets • Increased economic competitiveness
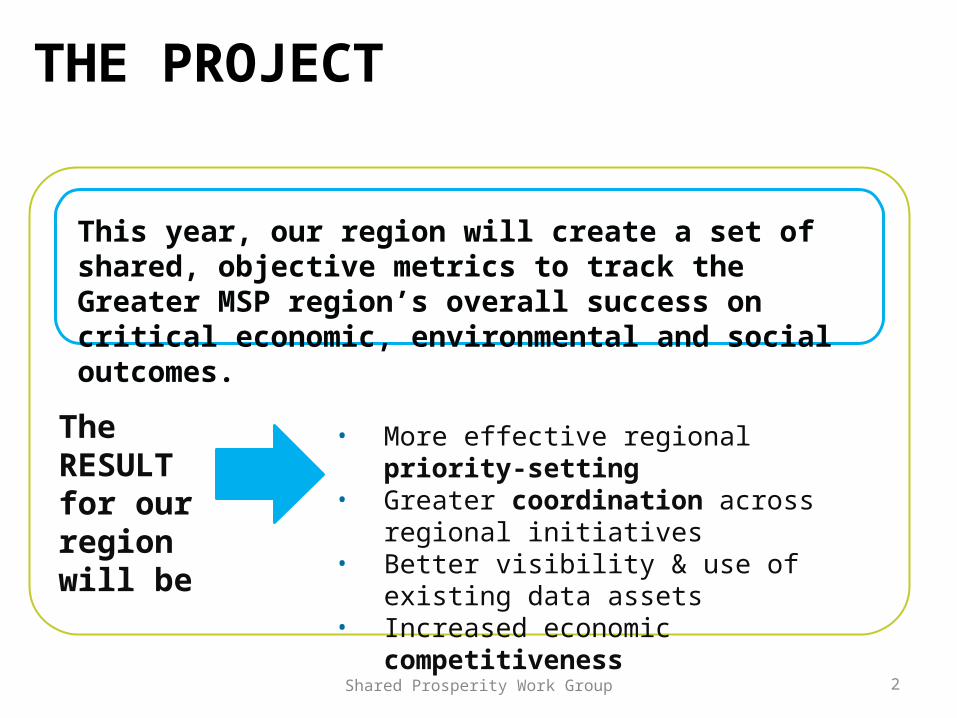
CONTINUOUS REGIONAL IMPROVEMENT TOOL
Marketing focus
Evaluation tool
Emphasis on strengths, assets, positive attributes
Externally-oriented
Used to measure progress against both bolstering strengths and
addressing weaknesses Internally-oriented
Includes both assets and deficits/opportunities
These indicators will be evaluative, not marketing
Shared Prosperity Work Group 4
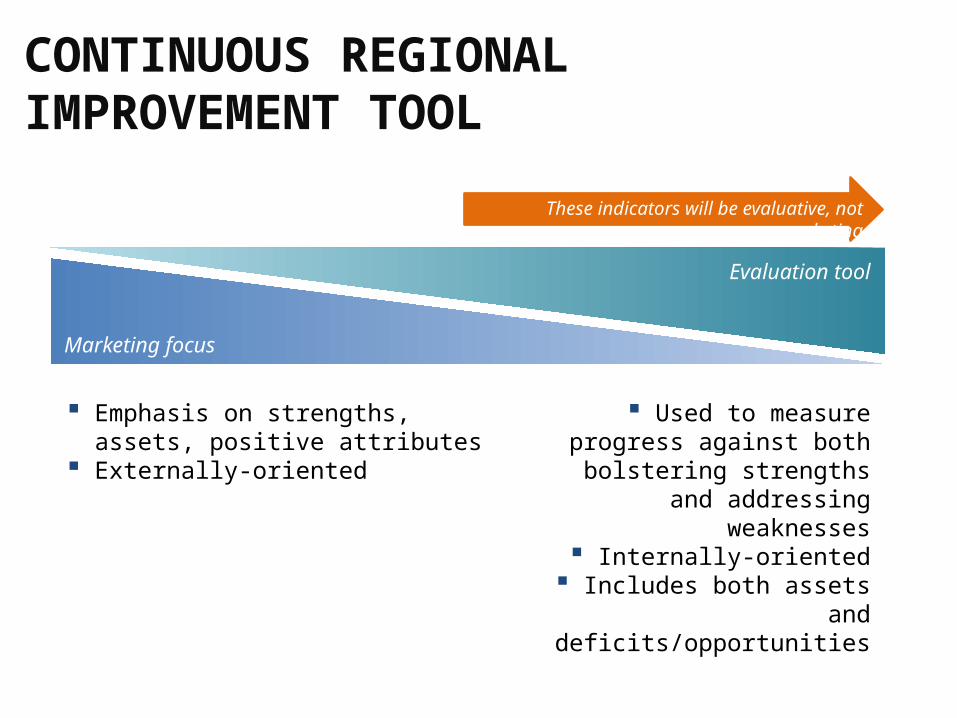
FINISH THE JOB
This capstone effort will draw upon all the related indicators work to create a shared dashboard that is:
• Objective (not relative rankings)• Comprehensive (economic, social, environmental)• Compact (20-25 key measures in 5-6 categories)• Benchmarked against peer regions • Clearly and consistently communicated • Endorsed and used by organizations across the region
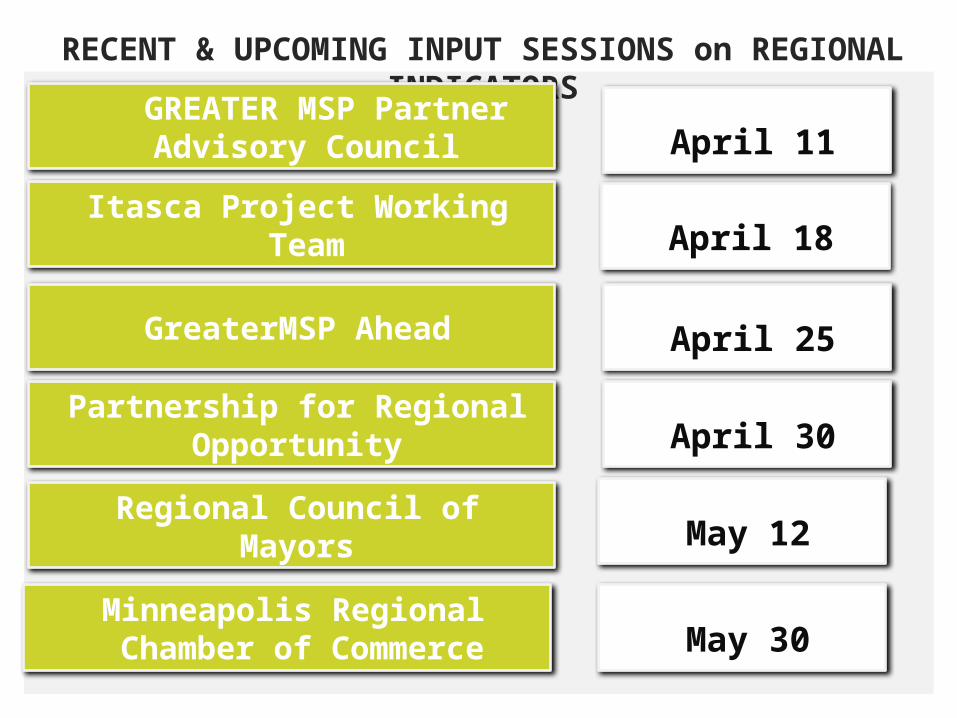
RECENT & UPCOMING INPUT SESSIONS on REGIONAL INDICATORS
April 11 GREATER MSP Partner Advisory
Council
Itasca Project Working Team April 18
GreaterMSP Ahead April 25
Partnership for Regional Opportunity April 30
Regional Council of Mayors
May 30Minneapolis Regional Chamber of
Commerce
May 12
Shared Prosperity Work Group 6
SMALL GROUP EXERCISE
What set of categories best captures our regional success, goals & values?
REGIONAL INDICATORS
Comments
___________
___________
___________
___________
____
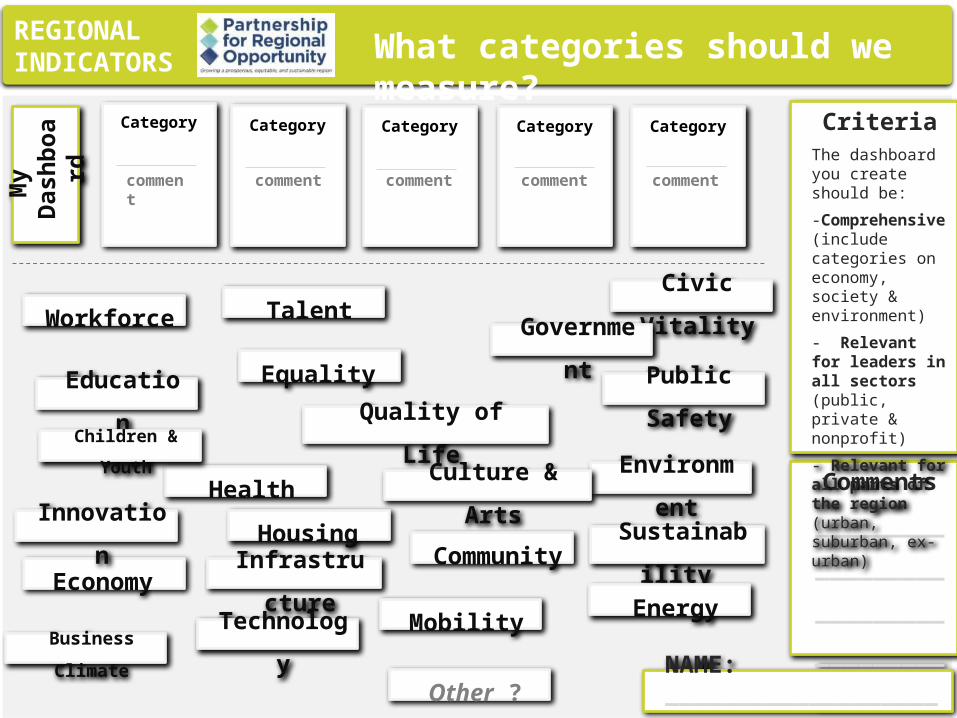
What categories should we measure?M
y
Das
hboa
rd
Health
Community Housing
Quality of LifePublic Safety
Sustainability
Energy
Environment
Mobility
InfrastructureEconomy
Business Climate
Equality
Talent
Education
Workforce
Culture & Arts
Civic Vitality
Government
Children & Youth
Technology
Category
comment
Category Category Category Category
comment comment comment comment
Innovation
CriteriaThe dashboard you create should be:
-Comprehensive (include categories on economy, society & environment)
- Relevant for leaders in all sectors (public, private & nonprofit)
- Relevant for all parts of the region (urban, suburban, ex-urban)
NAME: ___________________Other ?
Shared Prosperity Work Group8
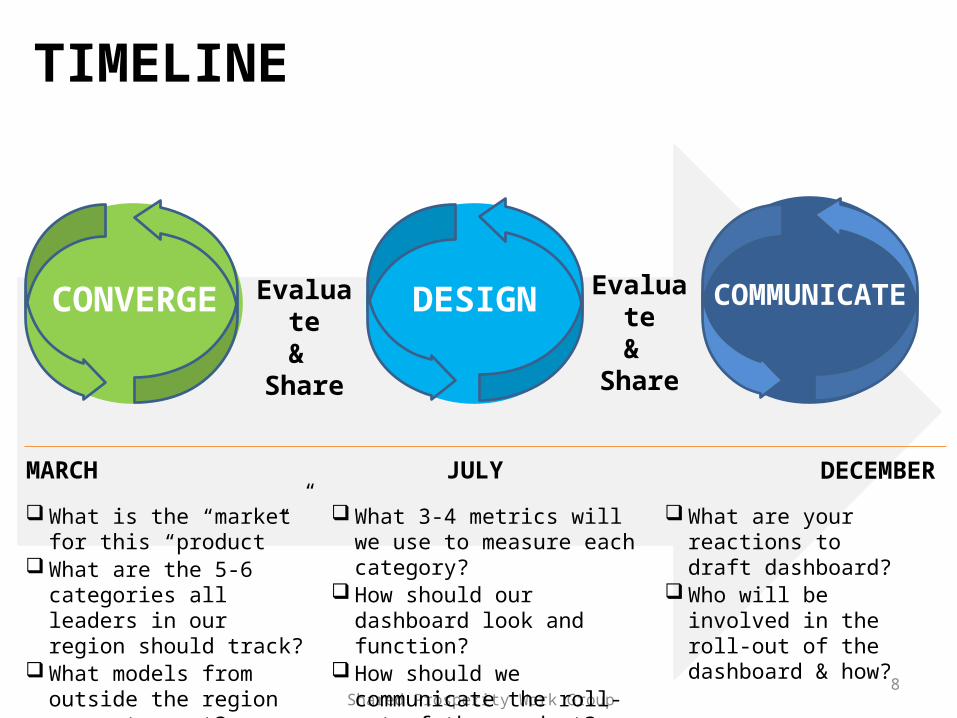
TIMELINE
CONVERGE DESIGN COMMUNICATE
MARCH JULY DECEMBER
Evaluate&
Share
Evaluate&
Share
What is the “market” for this “product”
What are the 5-6 categories all leaders in our region should track?
What models from outside the region resonate most?
What 3-4 metrics will we use to measure each category?
How should our dashboard look and function?
How should we communicate the roll-out of the product?
What are your reactions to draft dashboard?
Who will be involved in the roll-out of the dashboard & how?

April 30th, 2014The McKnight Foundation
710 S 2nd St Ste 400, Minneapolis, MN
WilderResearch
Corridors of Opportunity Evaluation
Ellen Shelton, Wilder Research
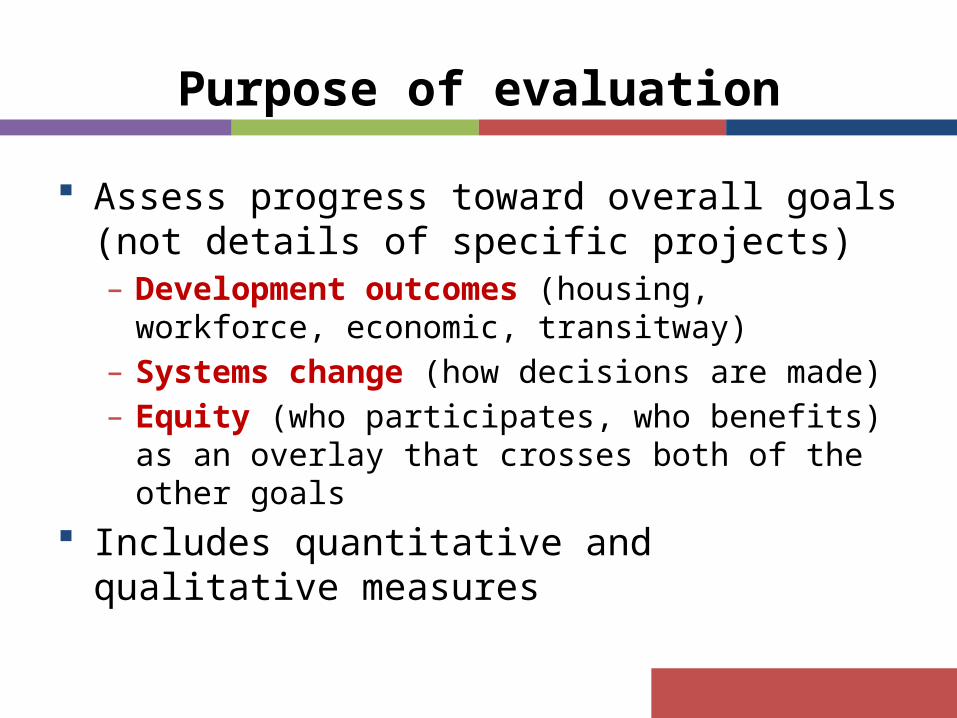
Assess progress toward overall goals (not details of specific projects)– Development outcomes (housing, workforce, economic,
transitway)– Systems change (how decisions are made)– Equity (who participates, who benefits) as an overlay that
crosses both of the other goals Includes quantitative and qualitative measures
Purpose of evaluation
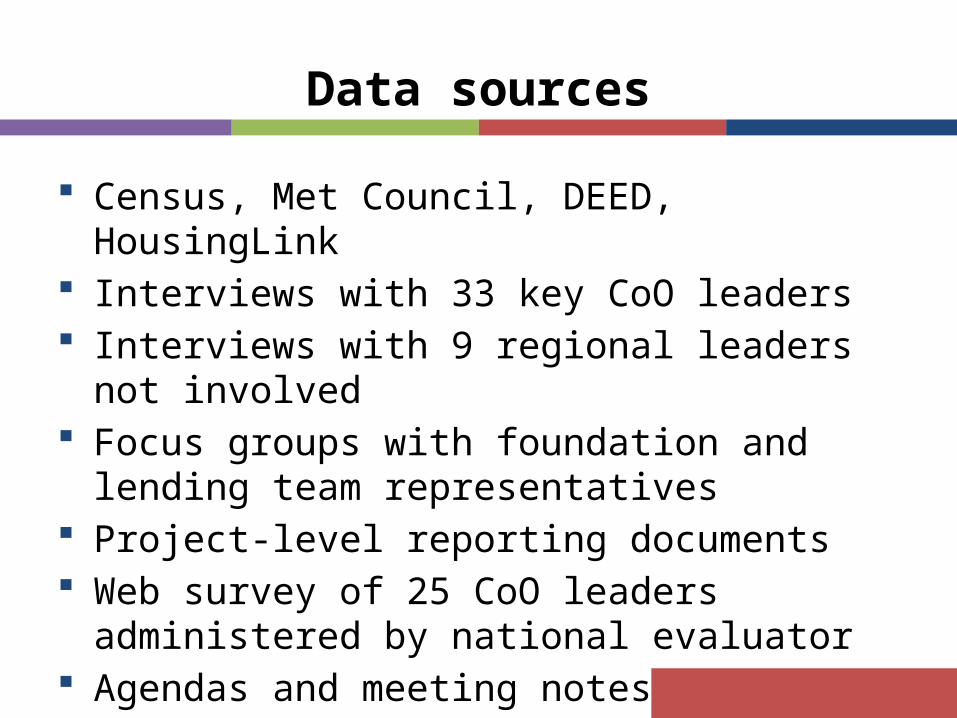
Census, Met Council, DEED, HousingLink Interviews with 33 key CoO leaders Interviews with 9 regional leaders not involved Focus groups with foundation and lending team
representatives Project-level reporting documents Web survey of 25 CoO leaders administered by
national evaluator Agendas and meeting notes
Data sources
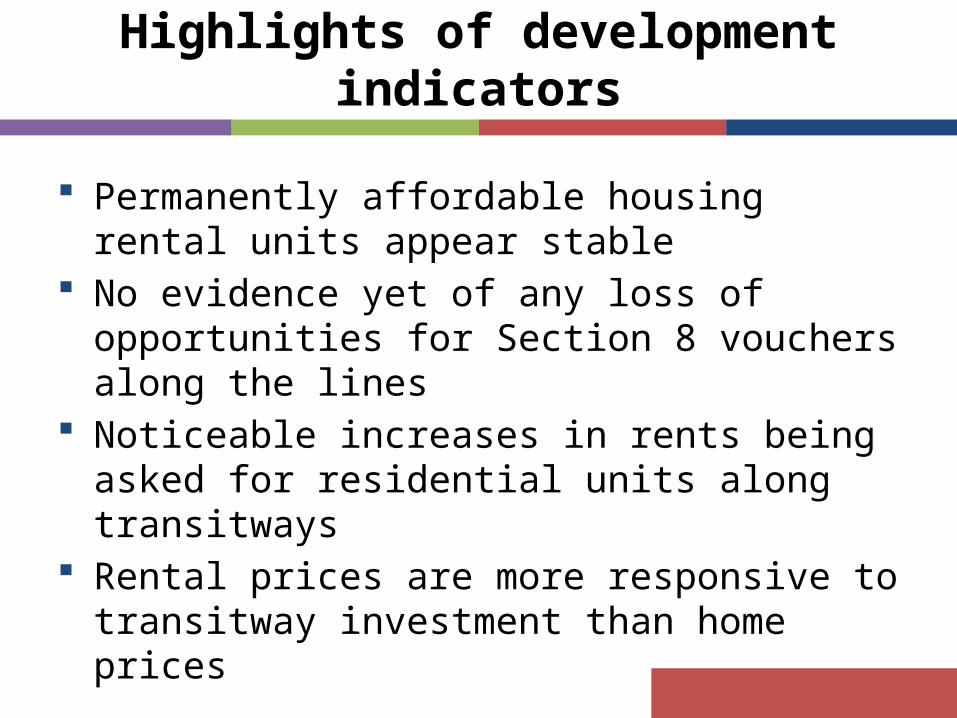
Permanently affordable housing rental units appear stable
No evidence yet of any loss of opportunities for Section 8 vouchers along the lines
Noticeable increases in rents being asked for residential units along transitways
Rental prices are more responsive to transitway investment than home prices
Highlights of development indicators
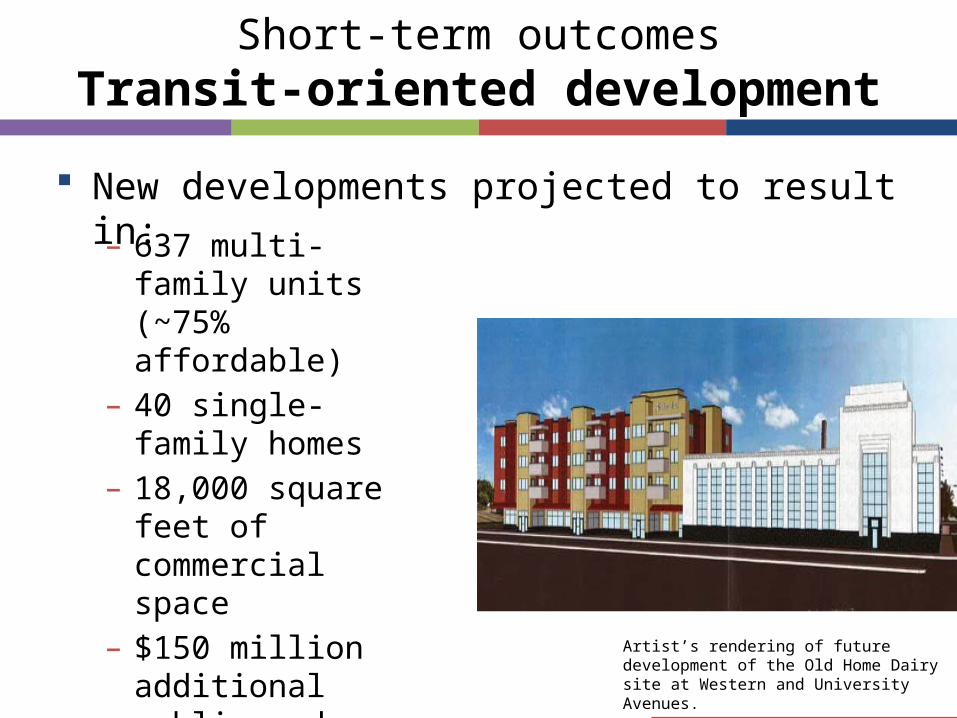
Short-term outcomesTransit-oriented development
New developments projected to result in:– 637 multi-family units
(~75% affordable)– 40 single-family
homes– 18,000 square feet of
commercial space– $150 million
additional public and private investment
Artist’s rendering of future development of the Old Home Dairy site at Western and University Avenues.
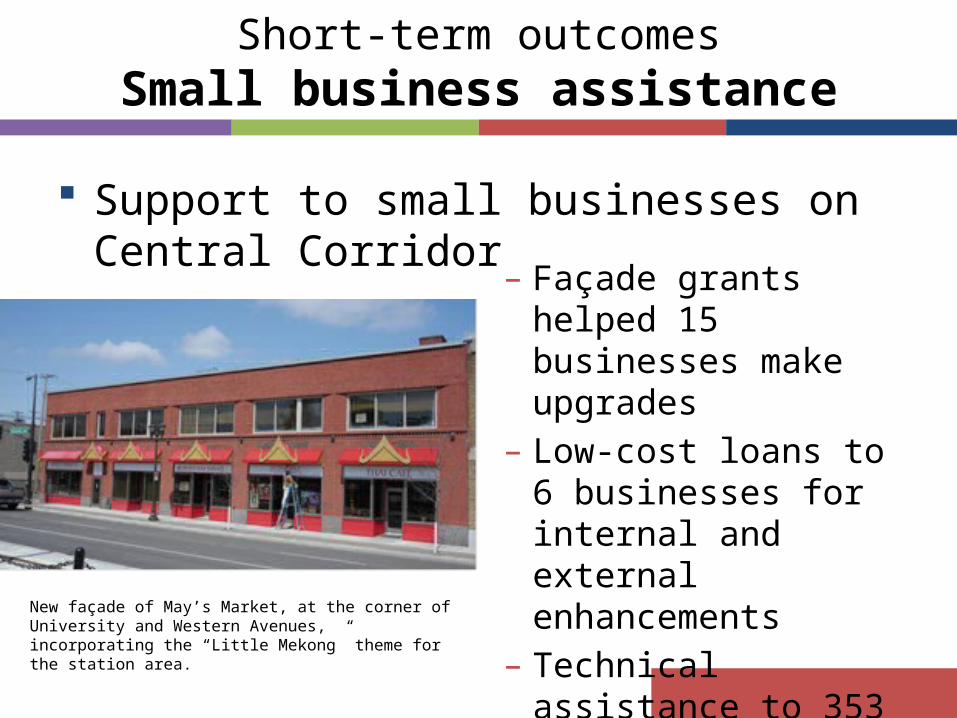
– Façade grants helped 15 businesses make upgrades
– Low-cost loans to 6 businesses for internal and external enhancements
– Technical assistance to 353 owners
Short-term outcomesSmall business assistance
Support to small businesses on Central Corridor
New façade of May’s Market, at the corner of University and Western Avenues, incorporating the “Little Mekong” theme for the station area.
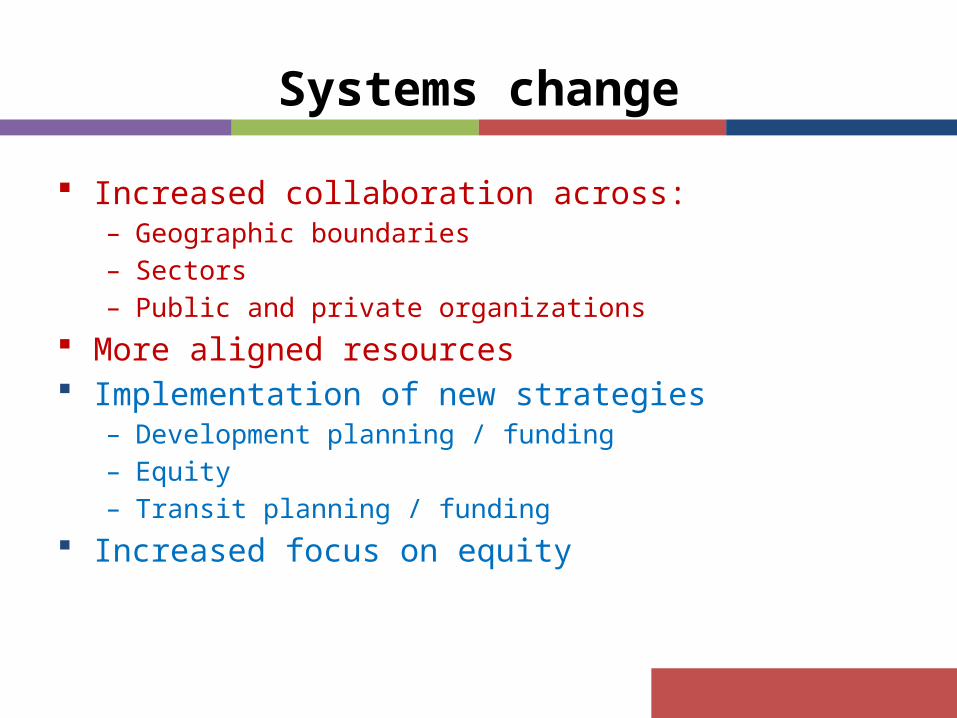
Increased collaboration across:– Geographic boundaries– Sectors– Public and private organizations
More aligned resources Implementation of new strategies
– Development planning / funding– Equity– Transit planning / funding
Increased focus on equity
Systems change
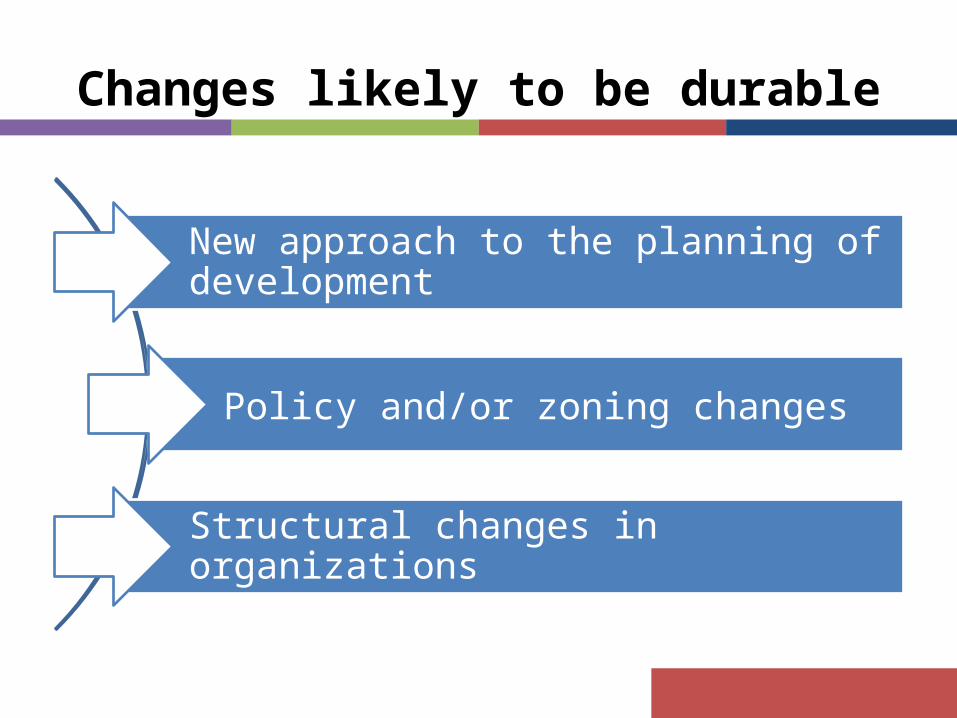
New approach to the planning of development
Policy and/or zoning changes
Structural changes in organizations
Changes likely to be durable
New engagement skills/practices
New conversations about equity
Regional vision for equitable development
Changes likely to be durable
88% of stakeholders think they will What is the reason to think this will happen?
– Equity has been elevated– New pattern of community engagement– More holistic view of development– Increased capacity to create, preserve, and support
affordable housing and small businesses– New relationships among leaders and networks among
organizations
Will low-income people be better off?
Ongoing management of competing values and priorities
Time– To build relationships– To accomplish the work
Small scale of resources compared to scale of change intended
Learnings: Challenges
“One table” approach Community engagement Partnerships and linkages
Learnings: Factors contributing to success
Collaborative structures have been built, and strategies tested, that can support effective joint action
Twin goals of equity and economic development have significant level of commitment from significant number of influential partners
Long-term and wide-scale changes depend on continued spread and alignment with other efforts
Implications for continuing efforts
April 30th, 2014The McKnight Foundation
710 S 2nd St Ste 400, Minneapolis, MN