Embed Size (px)
Citation preview
Temperature Dependence of the Specific Absorption Rate of a Frozen Ferrofluid
Presented by:Nathaniel MosherKettering UniversityFlint, Michigan
Other contributors:R.J. Tackett, R.E. Kumon, C. Rablau, E. Perkins-Harbin,L. Wang, J.S. Thakur, and P.P. Vaishnava
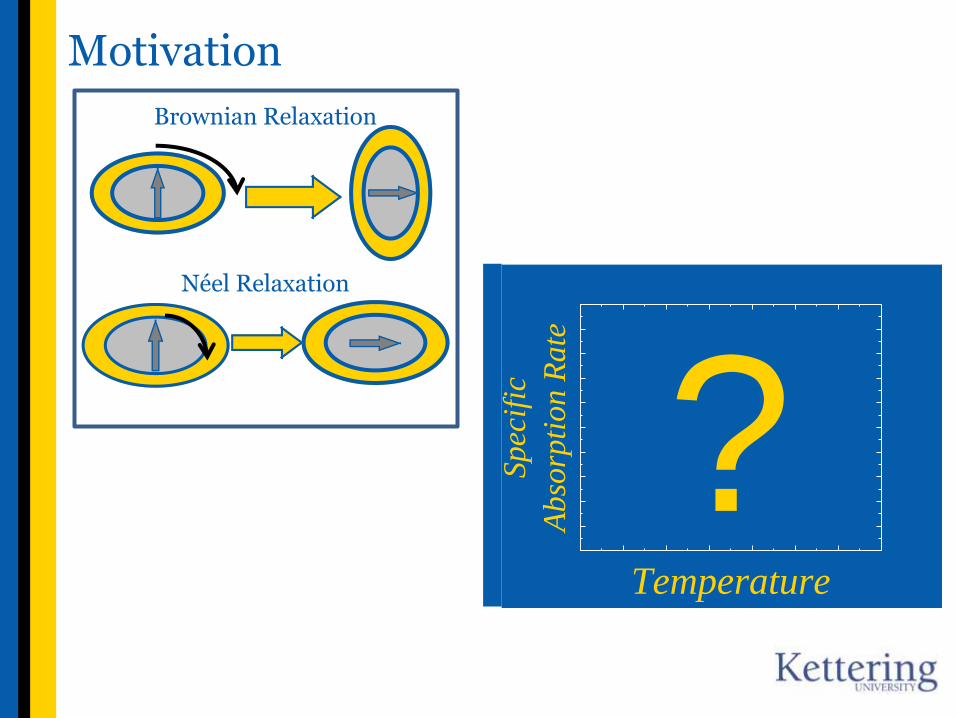
Motivation
Sp
ecif
ic
Ab
sorp
tio
n R
ate
Temperature
?
Brownian Relaxation
Néel Relaxation
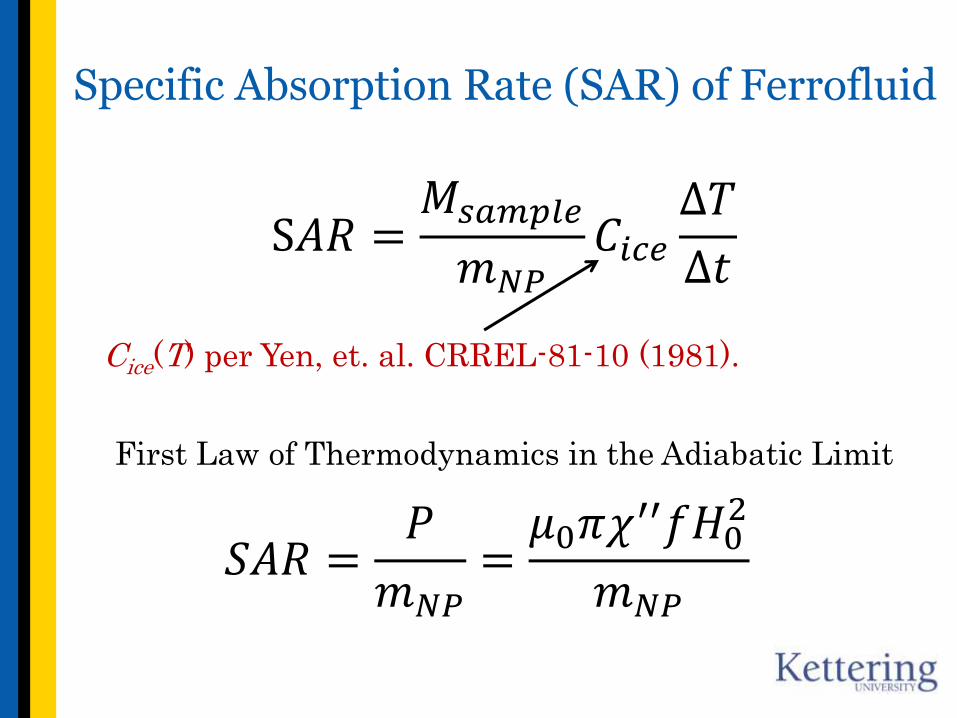
Specific Absorption Rate (SAR) of Ferrofluid
S𝐴𝑅 =𝑀𝑠𝑎𝑚𝑝𝑙𝑒
𝑚𝑁𝑃𝐶𝑖𝑐𝑒
∆𝑇
∆𝑡
𝑆𝐴𝑅 =𝑃
𝑚𝑁𝑃=𝜇0𝜋𝜒
′′𝑓𝐻02
𝑚𝑁𝑃
First Law of Thermodynamics in the Adiabatic Limit
Cice(T) per Yen, et. al. CRREL-81-10 (1981).
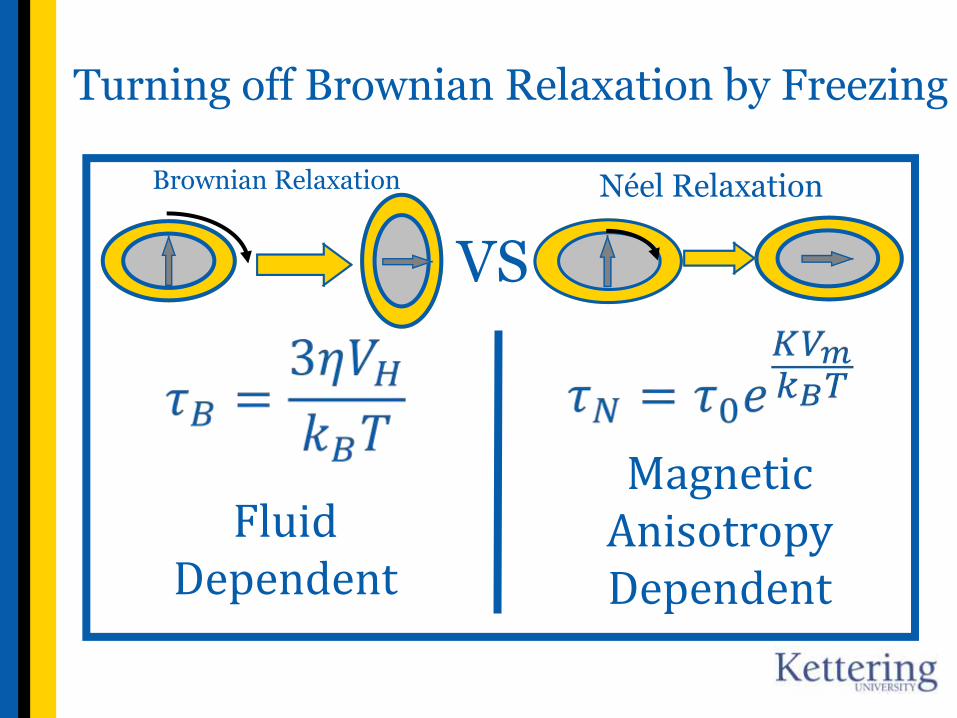
Turning off Brownian Relaxation by Freezing
VS
Fluid Dependent
Magnetic AnisotropyDependent
Brownian Relaxation Néel Relaxation
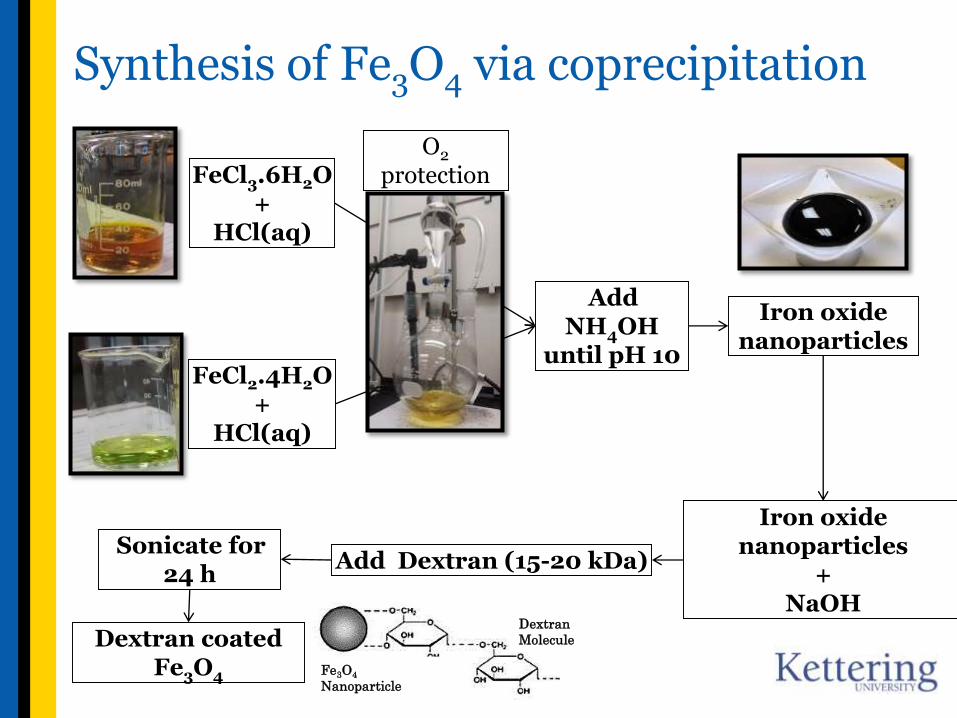
Synthesis of Fe3O4 via coprecipitation
Iron oxidenanoparticles
+NaOH
Add Dextran (15-20 kDa)
Dextran coated Fe3O4
Sonicate for 24 h
FeCl2.4H2O+
HCl(aq)
Add NH4OH
until pH 10
Iron oxide nanoparticles
FeCl3.6H2O+
HCl(aq)
Fe3O4
Nanoparticle
Dextran
Molecule
O2
protection
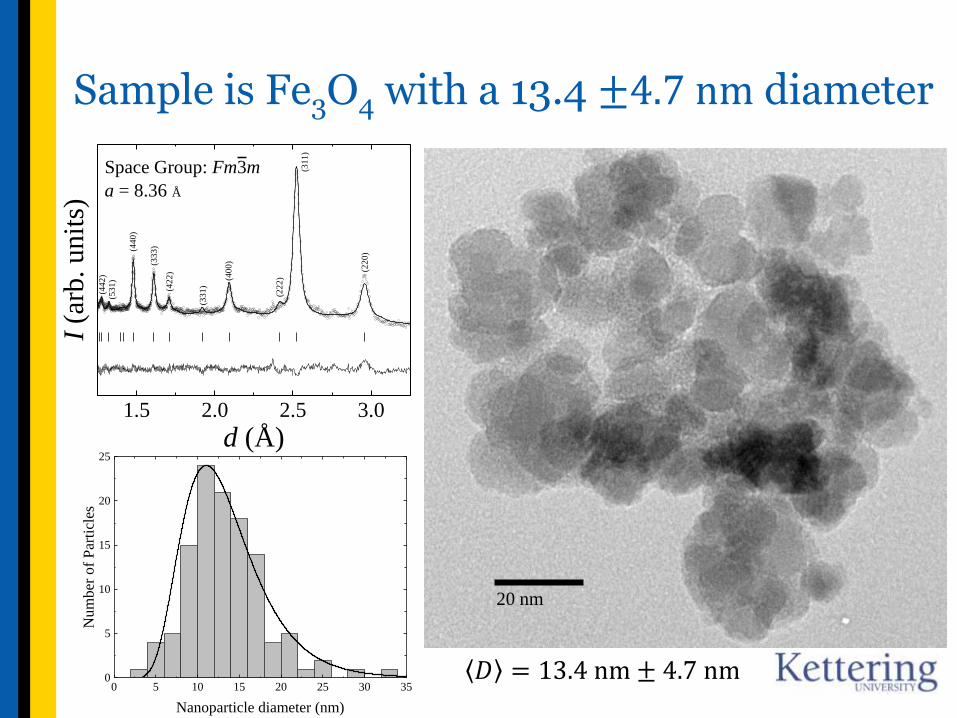
Sample is Fe3O4 with a 13.4 ±4.7 nm diameter
1.5 2.0 2.5 3.0
(44
2)
(53
1)
(44
0)
(33
3)
(42
2)
(33
1)
(40
0)
(22
2)
(31
1)
I (a
rb. unit
s)
d (Å)
(22
0)
Space Group: Fm3m
a = 8.36 Å
20 nm
0 5 10 15 20 25 30 350
5
10
15
20
25
Nu
mb
er o
f P
arti
cles
Nanoparticle diameter (nm)
𝐷 = 13.4 nm ± 4.7 nm
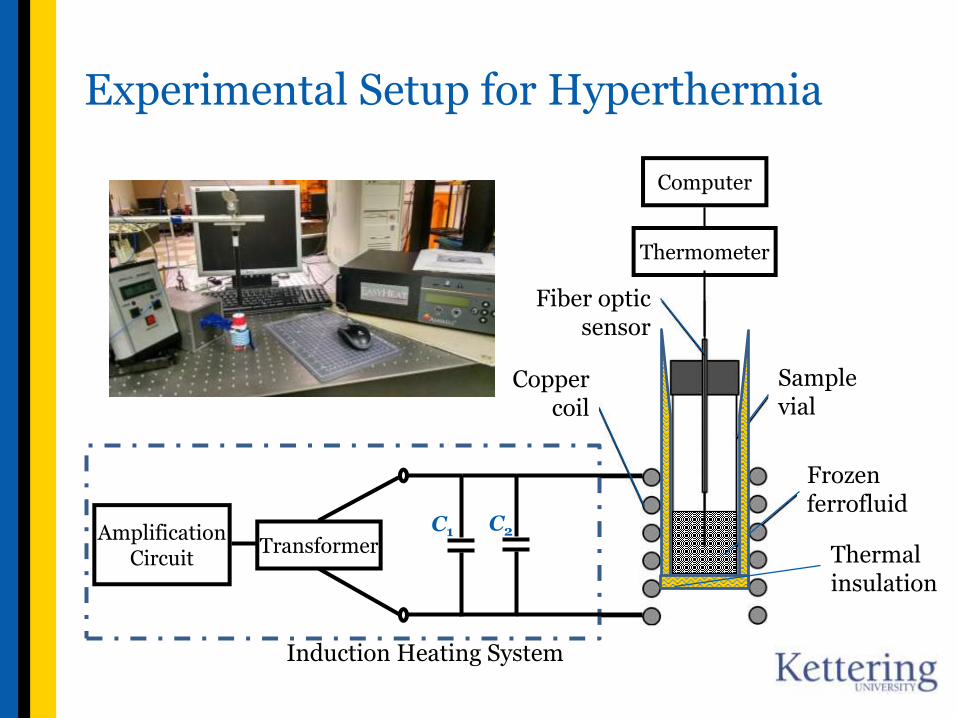
Experimental Setup for Hyperthermia
Copper coil
Amplification Circuit
TransformerC1 C2
Induction Heating System
Sample vial
Frozen ferrofluid
Thermometer
Fiber optic sensor
Computer
Thermal insulation
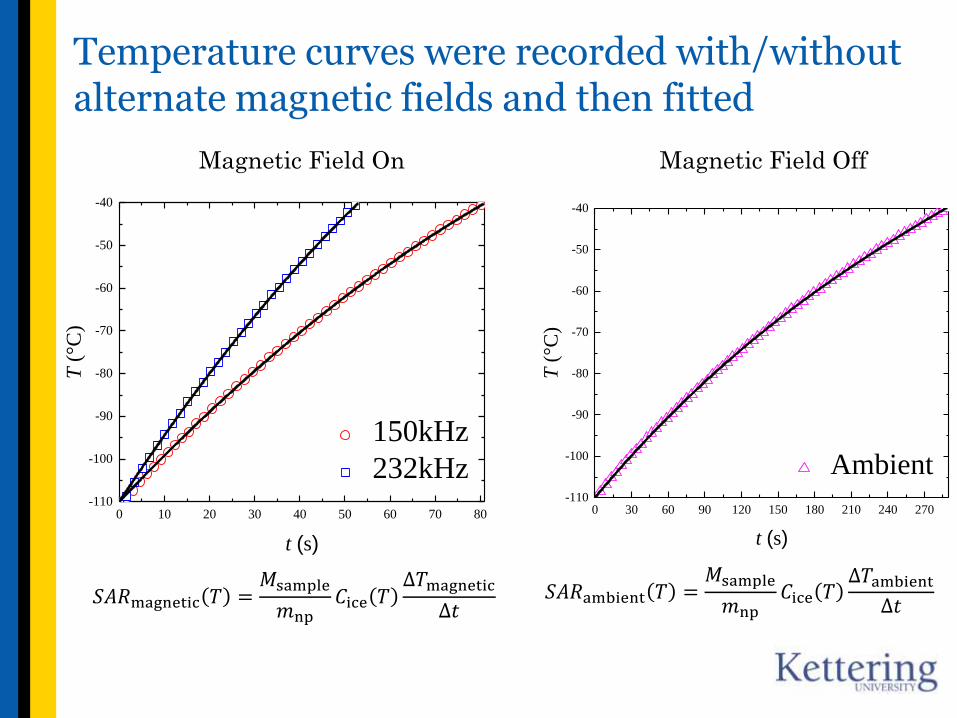
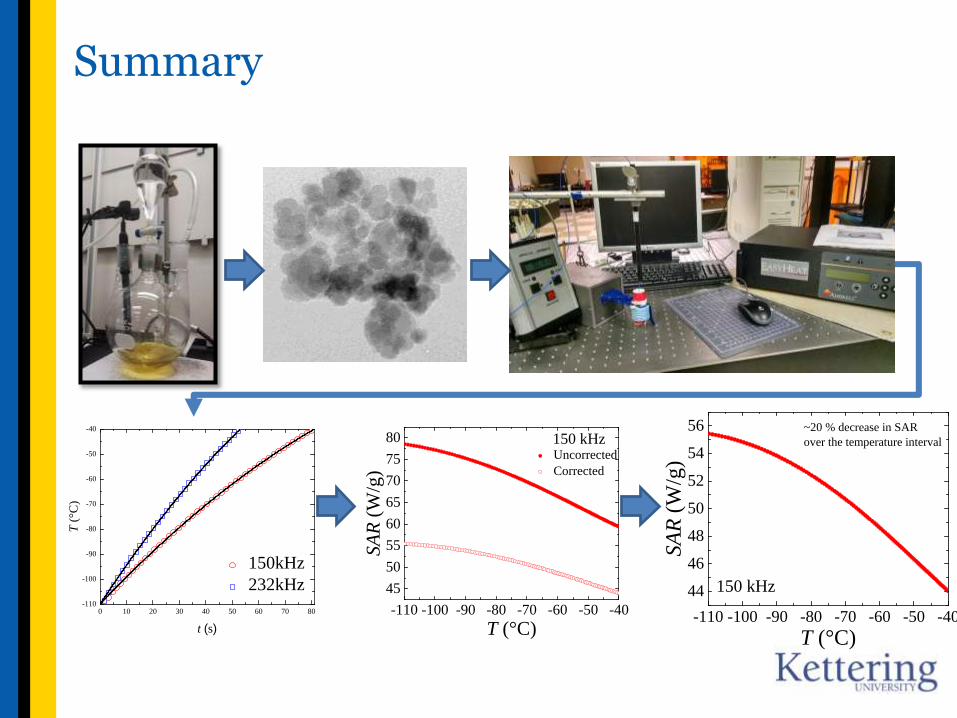
Temperature curves were recorded with/without alternate magnetic fields and then fitted
𝑆𝐴𝑅magnetic 𝑇 =𝑀sample
𝑚np𝐶ice 𝑇
∆𝑇magnetic
∆𝑡𝑆𝐴𝑅ambient 𝑇 =
𝑀sample
𝑚np𝐶ice 𝑇
∆𝑇ambient
∆𝑡
0 30 60 90 120 150 180 210 240 270-110
-100
-90
-80
-70
-60
-50
-40
Ambient
T (
°C)
t (s)
0 10 20 30 40 50 60 70 80-110
-100
-90
-80
-70
-60
-50
-40
150kHz
232kHz
T (
°C)
t (s)
Magnetic Field On Magnetic Field Off
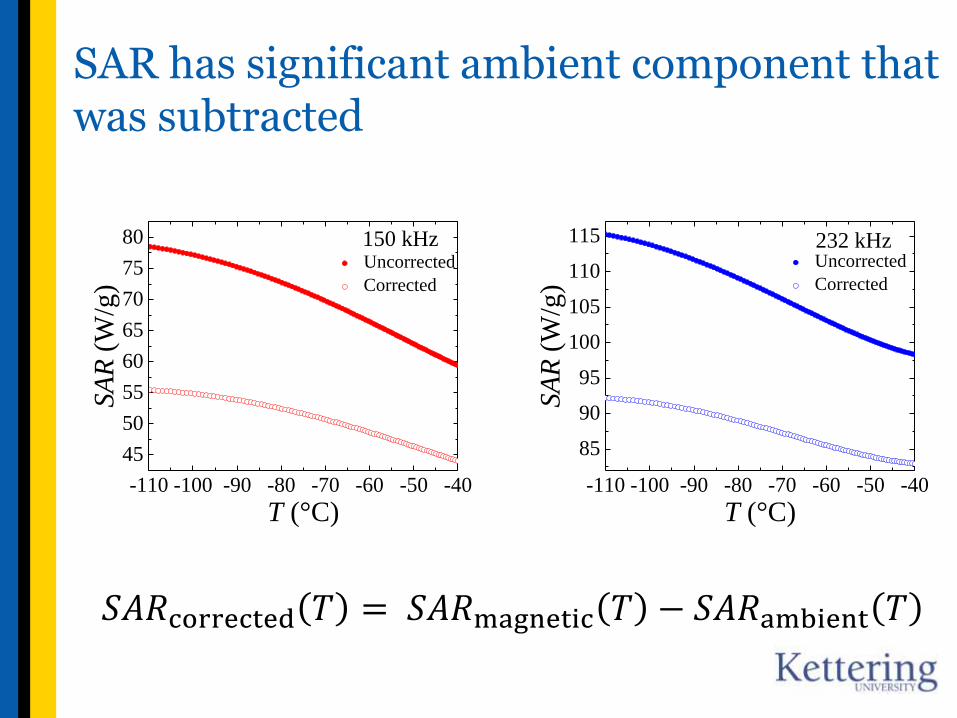
SAR has significant ambient component that was subtracted
𝑆𝐴𝑅corrected 𝑇 = 𝑆𝐴𝑅magnetic 𝑇 − 𝑆𝐴𝑅ambient 𝑇
-110 -100 -90 -80 -70 -60 -50 -40
45
50
55
60
65
70
75
80
Uncorrected
Corrected
SA
R (
W/g
)
T (°C)
150 kHz
-110 -100 -90 -80 -70 -60 -50 -40
85
90
95
100
105
110
115
Uncorrected
Corrected
SA
R (
W/g
)
T (°C)
232 kHz
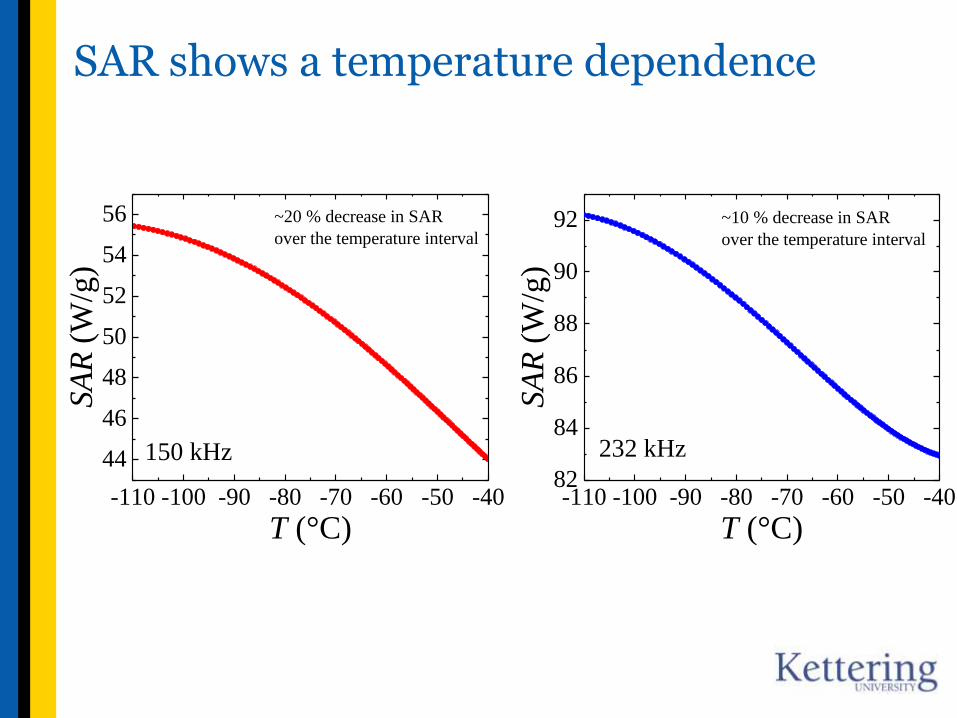
SAR shows a temperature dependence
-110 -100 -90 -80 -70 -60 -50 -4082
84
86
88
90
92
SA
R (
W/g
)T (°C)
232 kHz
~10 % decrease in SAR
over the temperature interval
-110 -100 -90 -80 -70 -60 -50 -40
44
46
48
50
52
54
56
SA
R (
W/g
)
T (°C)
150 kHz
~20 % decrease in SAR
over the temperature interval
0 10 20 30 40 50 60 70 80-110
-100
-90
-80
-70
-60
-50
-40
150kHz
232kHz
T (
°C)
t (s)
-110 -100 -90 -80 -70 -60 -50 -40
45
50
55
60
65
70
75
80
Uncorrected
Corrected
SA
R (
W/g
)
T (°C)
150 kHz
-110 -100 -90 -80 -70 -60 -50 -40
44
46
48
50
52
54
56
SA
R (
W/g
)
T (°C)
150 kHz
~20 % decrease in SAR
over the temperature interval
Summary
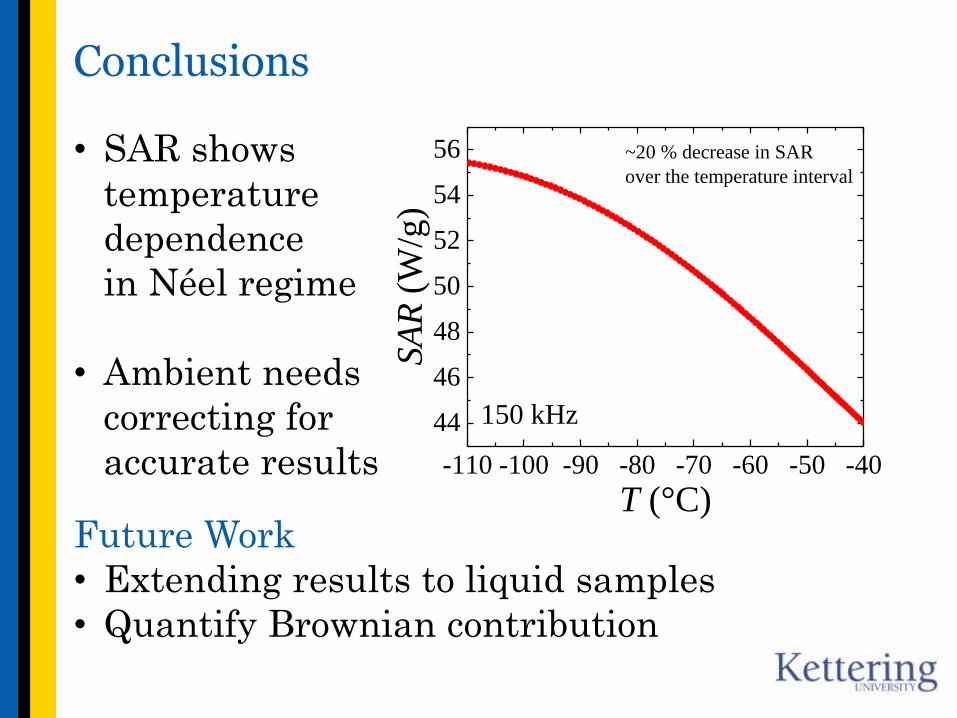
Conclusions
-110 -100 -90 -80 -70 -60 -50 -40
44
46
48
50
52
54
56
SA
R (
W/g
)
T (°C)
150 kHz
~20 % decrease in SAR
over the temperature interval• SAR shows
temperature
dependence
in Néel regime
• Ambient needs
correcting for
accurate results
Future Work
• Extending results to liquid samples
• Quantify Brownian contribution

Acknowledgements
We thank Research Council and the Provost of Kettering university Dr. James Zhang for the award of the Academic Research Fellowship and the travel grant.
Also, we thank the Society of Physics Students for providing a research grant as well as a travel grant
Questions?