Embed Size (px)
Citation preview
WORKING PAPER | January 2013 | 1
Working Paper
CONTENTSExecutive Summary........................................................1
Total water withdrawal....................................................2
Consumptive and non-consumptive use........................ 5
Total blue water (Bt)....................................................... 6
Available blue water (Ba).............................................. ..7
Baseline water stress......................................................8
Inter-annual variability................................................... 9
Seasonal variability......................................................10
Flood occurrence......................................................... 11
Drought severity...........................................................12
Upstream storage.........................................................13
Groundwater stress ......................................................14
Return flow ratio...........................................................15
Upstream protected land.............................................. 16
Media coverage............................................................17
Access to water............................................................18
Threatened amphibians................................................19
Endnotes......................................................................20
AqUEDUCT METADATA DOCUMENT
AqUEDUCT GLOBAL MAPS 2.0Francis Gassert, Matt Landis, Matt Luck, PauL reiG, and tien shiao
Disclaimer: Working Papers contain preliminary research, analysis, findings, and recommendations. They are circulated to stimulate timely discussion and critical feedback and to influence ongoing debate on emerging issues. Most working papers are eventually published in another form and their content may be revised.
Suggested Citation: Gassert, F., M. Landis, M. Luck, P. Reig, and T. Shiao. 2013. “Aqueduct Global Maps 2.0.” Working Paper. Washington, DC: World Resources Institute. Available online at http://www.wri.org/publication/aqueduct-metadata-global.
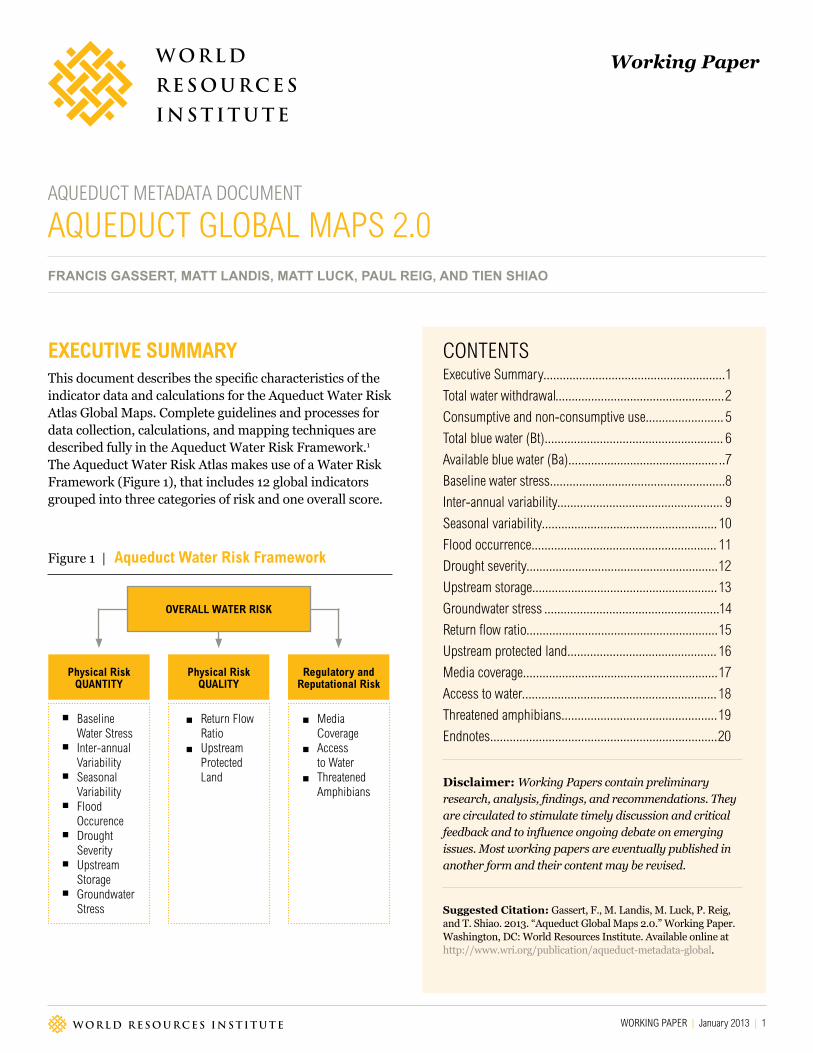
ExEcutivE Summary This document describes the specific characteristics of the indicator data and calculations for the Aqueduct Water Risk Atlas Global Maps. Complete guidelines and processes for data collection, calculations, and mapping techniques are described fully in the Aqueduct Water Risk Framework.1 The Aqueduct Water Risk Atlas makes use of a Water Risk Framework (Figure 1), that includes 12 global indicators grouped into three categories of risk and one overall score.
Baseline Water Stress
Inter-annual Variability
Seasonal Variability
Flood Occurence
Drought Severity
Upstream Storage
Groundwater Stress
Physical riskQuaNtity
Return Flow Ratio
Upstream Protected Land
Physical riskQuaLity
Media Coverage
Access to Water
Threatened Amphibians
regulatory and� reputational risk
OvEraLL WatEr riSk
Figure 1 | aqued�uct Water risk Framework
2 |
The data selection and validation process involves three steps: (1) a literature review, (2) identification of data sources in the public domain, and (3) the compilation and expert review of the selected data sources. Calculation of 6 of the 12 indicators required the creation of original data-sets to estimate water availability and use. The hydrologi-cal catchments were based on the Global Drainage Basin Database developed by Masutomi et al.2 Computation of the original datasets was completed by ISciences, L.L.C.
Two measures of water use are required: water withdrawal, the total amount of water abstracted from freshwater sources for human use; and consumptive use, the portion of water that evaporates or is incorporated into a product, thus no longer available for downstream use. Withdrawals for the global basins are spatially disaggregated by sector based on regressions with spatial datasets to maximize the correlation with the reported withdrawals (i.e. irrigated areas for agriculture, nighttime lights for industrial, and population for domestic withdrawals). Consumptive use is derived from total withdrawals based on ratios of consump-tive use to withdrawals by Shiklomanov and Rodda3 and Flörke et al.4 Both withdrawals and consumptive use are coded at the hydrological catchment scale.
Two metrics of water supply were computed: total blue water and available blue water. Total blue water approxi-mates natural river discharge and does not account for withdrawals or consumptive use. Available blue water is an estimate of surface water availability minus upstream consumptive use. Modeled estimates of water supply are calculated using a catchment-to-catchment flow accu-mulation approach developed by ISciences, L.L.C., which aggregates water by catchment and transports it to the next downstream catchment. Water supply is computed from runoff (R), the water available to flow across the landscape from a particular location, and is calculated as the remainder of precipitation (P) after evapotranspira-tion (ET) and change in soil moisture storage (∆S) are accounted for (i.e., R = P – ET – ∆S). The runoff data is courtesy of NASA Goddard Earth Sciences Data and Infor-mation Services Center’s Global Land Data Assimilation System Version 2 NOAH land surface model for the years 1950 to 2008.5
The remainder of this document contains the definitions, formulas, and data specifications for the Aqueduct Water Risk Atlas global maps.
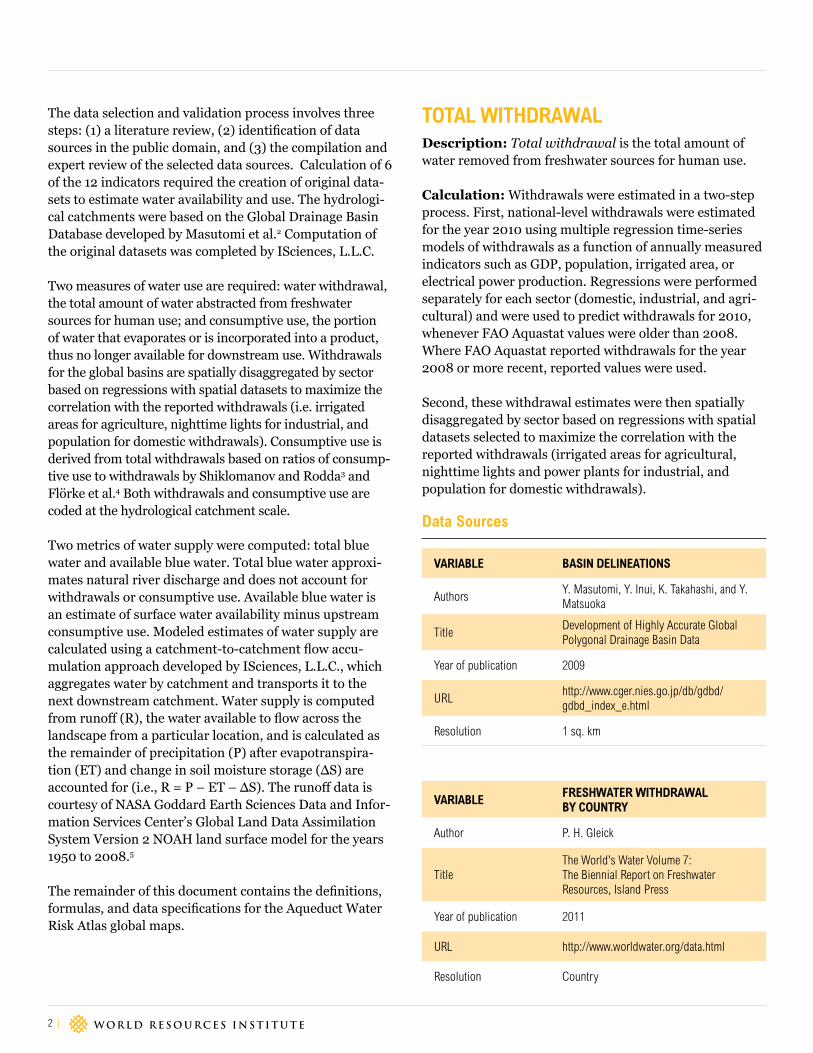
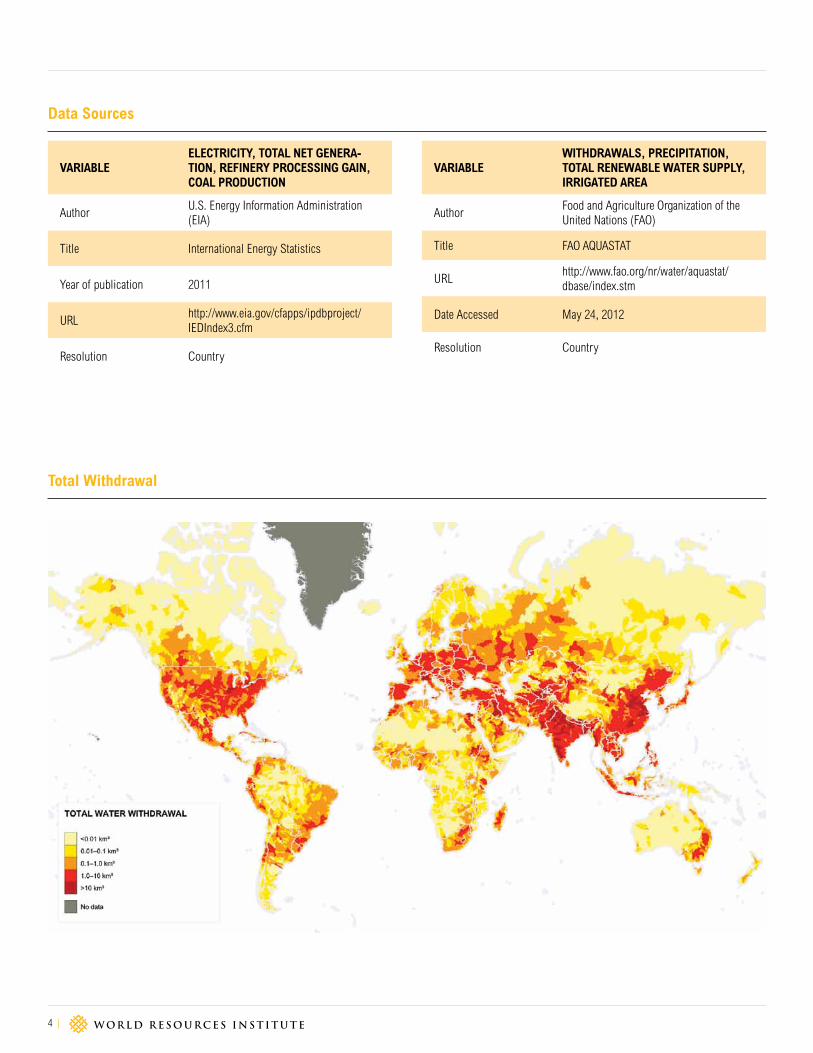
tOtaL WitHDraWaLDescription: Total withdrawal is the total amount of water removed from freshwater sources for human use.
Calculation: Withdrawals were estimated in a two-step process. First, national-level withdrawals were estimated for the year 2010 using multiple regression time-series models of withdrawals as a function of annually measured indicators such as GDP, population, irrigated area, or electrical power production. Regressions were performed separately for each sector (domestic, industrial, and agri-cultural) and were used to predict withdrawals for 2010, whenever FAO Aquastat values were older than 2008. Where FAO Aquastat reported withdrawals for the year 2008 or more recent, reported values were used.
Second, these withdrawal estimates were then spatially disaggregated by sector based on regressions with spatial datasets selected to maximize the correlation with the reported withdrawals (irrigated areas for agricultural, nighttime lights and power plants for industrial, and population for domestic withdrawals).
variabLE baSiN DELiNEatiONS
Authors Y. Masutomi, Y. Inui, K. Takahashi, and Y. Matsuoka
Title Development of Highly Accurate Global Polygonal Drainage Basin Data
Year of publication 2009
URLhttp://www.cger.nies.go.jp/db/gdbd/gdbd_index_e.html
Resolution 1 sq. km
variabLEFrESHWatEr WitHDraWaL by cOuNtry
Author P. H. Gleick
Title The World's Water Volume 7: The Biennial Report on Freshwater Resources, Island Press
Year of publication 2011
URL http://www.worldwater.org/data.html
Resolution Country
Data Sources
Aqueduct Global Maps 2.0
WORKING PAPER | January 2013 | 3
variabLE GriDDED POPuLatiON
Authors
Center for International Earth Science Information Network (CIESIN), Colum-bia University; United Nations Food and Agriculture Organization (FAO); and Centro Internacional de Agricultura Tropical (CIAT)
Title Gridded Population of the World Version 3 (GPWv3): Population Count Grid, Future Estimates
Year of publication 2005
Time covered in analysis 2005
URL http://sedac.ciesin.columbia.edu/gpw
Resolution 2.5 arc minute raster
variabLE NiGHttimE LiGHtS
Author NOAA National Geophysical Data Center (NGDC)
Title Version 4 DMSP-OLS Nighttime Lights Time Series
Year of publication 2010
Time covered in analysis 2000
URLhttp://www.ngdc.noaa.gov/dmsp/down-loadV4composites.html
Resolution 30 arc second raster
variabLE GLObaL irriGatiON arEaS
AuthorsS. Siebert, P. Döll, S. Feick, J. Hoogeveen, and K. Frenken
Title Global Map of Irrigation Areas Version 4.0.1
Year of publication 2007
Time covered in analysis 2000
URLhttp://www.fao.org/nr/water/aquastat/ir-rigationmap/index60.stm
Resolution 5 arc minute raster
variabLE irriGatED aGricuLturaL arEaS
Author Food and Agriculture Organization of the United Nations (FAO)
Title FAOSTAT
Year of publication 2009
Time covered in analysis 2009
URL http://faostat3.fao.org/home/index.html
Resolution Country
variabLE arEa EQuiPPED FOr irriGatiON
Authors K. Freydank and S. Siebert
Title Towards Mapping the Extent of Irriga-tion in the Last Century: Time Series of Irrigated Area per Country
Year of publication 2008
Time covered in analysis 1990– 2003
URLhttp://publikationen.ub.uni-frankfurt.de/frontdoor/index/index/docId/5916
Resolution Country
variabLEGDP, POPuLatiON, aGricuLturaL LaND, urbaN POPuLatiON, cO2 EmiSSiONS
Author World Bank
Title World Development Indicators
Year of publication 2011
URLhttp://data.worldbank.org/data-catalog/world-development-indicators
Resolution Country
Data Sources
4 |
variabLEELEctricity, tOtaL NEt GENEra-tiON, rEFiNEry PrOcESSiNG GaiN, cOaL PrODuctiON
AuthorU.S. Energy Information Administration (EIA)
Title International Energy Statistics
Year of publication 2011
URLhttp://www.eia.gov/cfapps/ipdbproject/IEDIndex3.cfm
Resolution Country
variabLEWitHDraWaLS, PrEciPitatiON, tOtaL rENEWabLE WatEr SuPPLy, irriGatED arEa
Author Food and Agriculture Organization of the United Nations (FAO)
Title FAO AqUASTAT
URLhttp://www.fao.org/nr/water/aquastat/dbase/index.stm
Date Accessed May 24, 2012
Resolution Country
Data Sources
total Withd�rawal
Aqueduct Global Maps 2.0
WORKING PAPER | January 2013 | 5
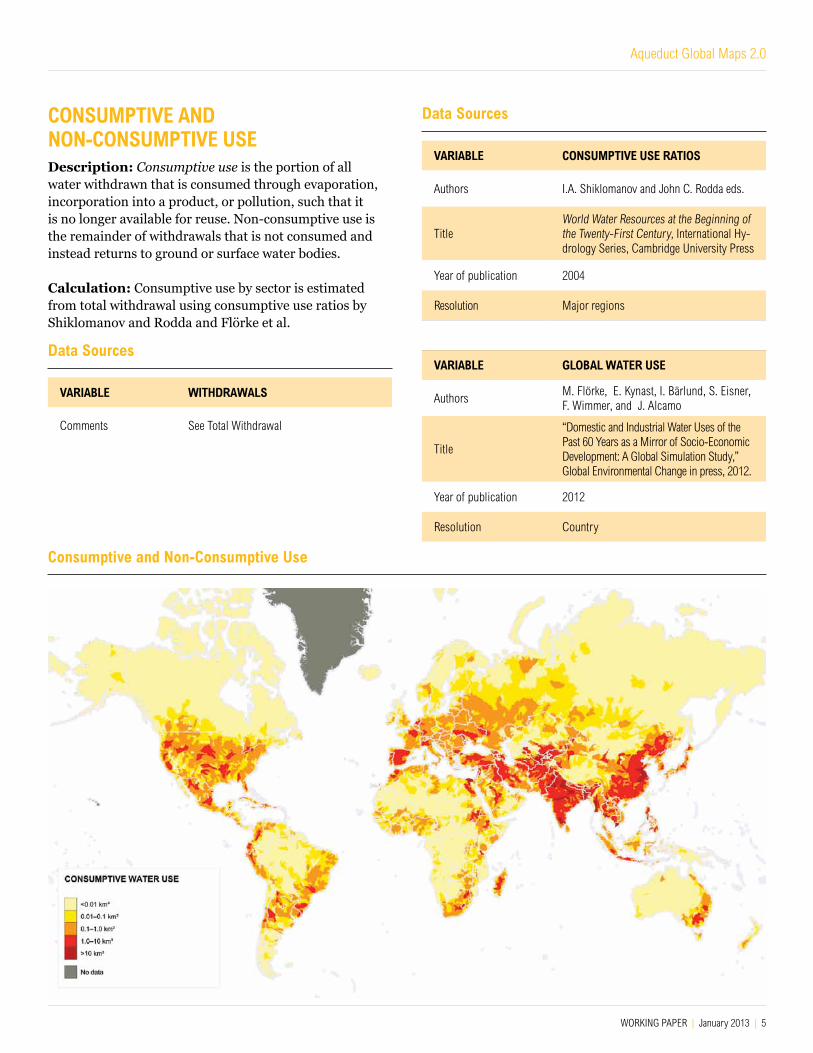
cONSumPtivE aND NON-cONSumPtivE uSE Description: Consumptive use is the portion of all water withdrawn that is consumed through evaporation, incorporation into a product, or pollution, such that it is no longer available for reuse. Non-consumptive use is the remainder of withdrawals that is not consumed and instead returns to ground or surface water bodies.
Calculation: Consumptive use by sector is estimated from total withdrawal using consumptive use ratios by Shiklomanov and Rodda and Flörke et al.
variabLE WitHDraWaLS
Comments See Total Withdrawal
Data Sources
consumptive and� Non-consumptive use
variabLE cONSumPtivE uSE ratiOS
Authors I.A. Shiklomanov and John C. Rodda eds.
Title World Water Resources at the Beginning of the Twenty-First Century, International Hy-drology Series, Cambridge University Press
Year of publication 2004
Resolution Major regions
variabLE GLObaL WatEr uSE
Authors M. Flörke, E. Kynast, I. Bärlund, S. Eisner, F. Wimmer, and J. Alcamo
Title
“Domestic and Industrial Water Uses of the Past 60 Years as a Mirror of Socio-Economic Development: A Global Simulation Study,” Global Environmental Change in press, 2012.
Year of publication 2012
Resolution Country
Data Sources
6 |
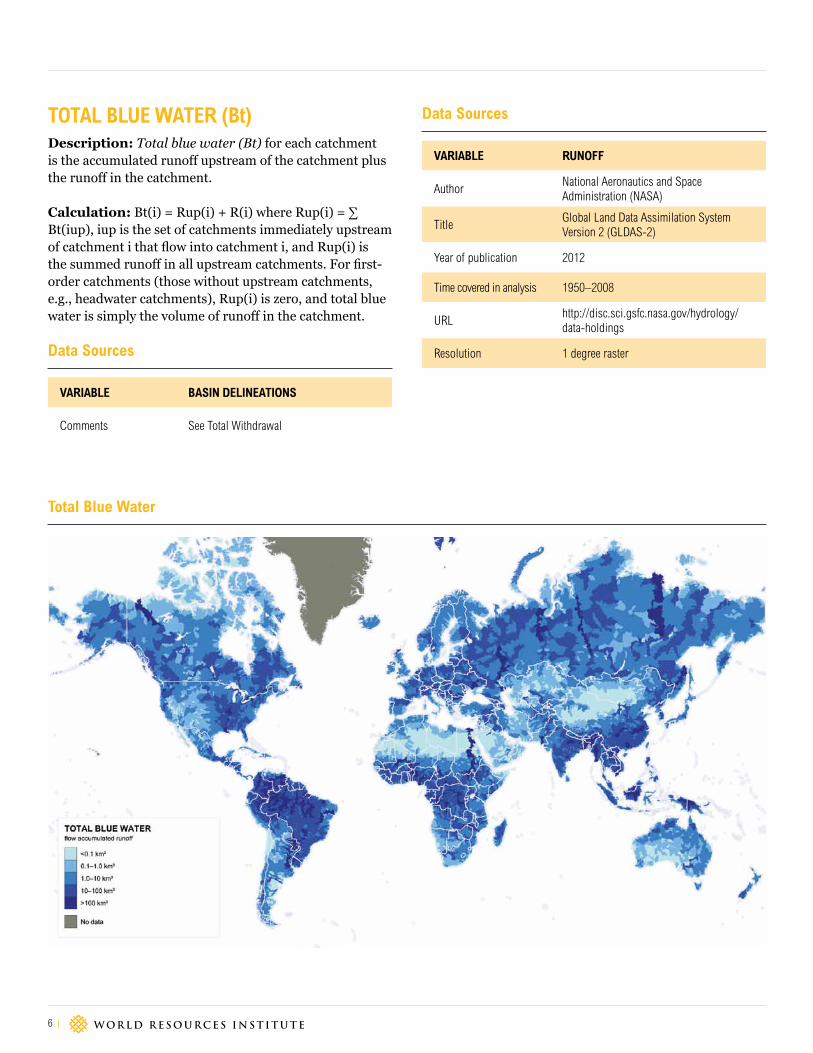
tOtaL bLuE WatEr (bt)Description: Total blue water (Bt) for each catchment is the accumulated runoff upstream of the catchment plus the runoff in the catchment.
Calculation: Bt(i) = Rup(i) + R(i) where Rup(i) = ∑ Bt(iup), iup is the set of catchments immediately upstream of catchment i that flow into catchment i, and Rup(i) is the summed runoff in all upstream catchments. For first-order catchments (those without upstream catchments, e.g., headwater catchments), Rup(i) is zero, and total blue water is simply the volume of runoff in the catchment.
variabLE baSiN DELiNEatiONS
Comments See Total Withdrawal
Data Sources
total blue Water
variabLE ruNOFF
Author National Aeronautics and Space Administration (NASA)
Title Global Land Data Assimilation System Version 2 (GLDAS-2)
Year of publication 2012
Time covered in analysis 1950–2008
URLhttp://disc.sci.gsfc.nasa.gov/hydrology/data-holdings
Resolution 1 degree raster
Data Sources
Aqueduct Global Maps 2.0
WORKING PAPER | January 2013 | 7
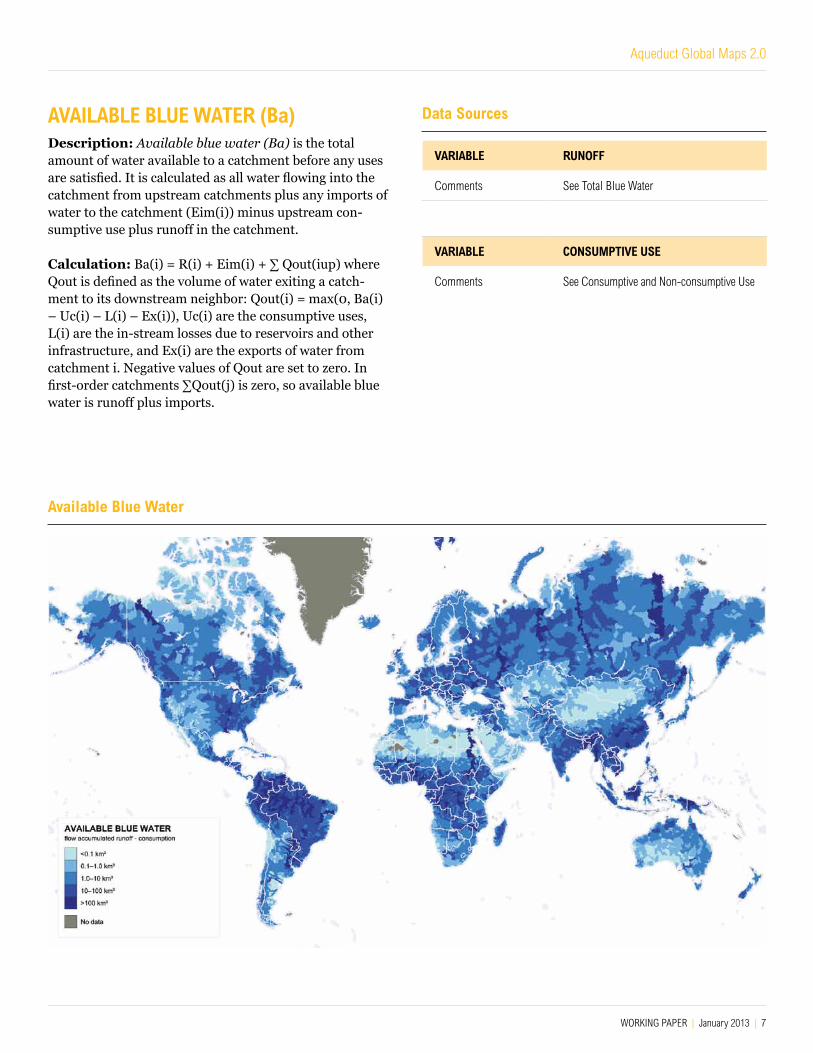
avaiLabLE bLuE WatEr (ba)Description: Available blue water (Ba) is the total amount of water available to a catchment before any uses are satisfied. It is calculated as all water flowing into the catchment from upstream catchments plus any imports of water to the catchment (Eim(i)) minus upstream con-sumptive use plus runoff in the catchment.
Calculation: Ba(i) = R(i) + Eim(i) + ∑ Qout(iup) where Qout is defined as the volume of water exiting a catch-ment to its downstream neighbor: Qout(i) = max(0, Ba(i) – Uc(i) – L(i) – Ex(i)), Uc(i) are the consumptive uses, L(i) are the in-stream losses due to reservoirs and other infrastructure, and Ex(i) are the exports of water from catchment i. Negative values of Qout are set to zero. In first-order catchments ∑Qout(j) is zero, so available blue water is runoff plus imports.
available blue Water
variabLE ruNOFF
Comments See Total Blue Water
variabLE cONSumPtivE uSE
Comments See Consumptive and Non-consumptive Use
Data Sources
8 |
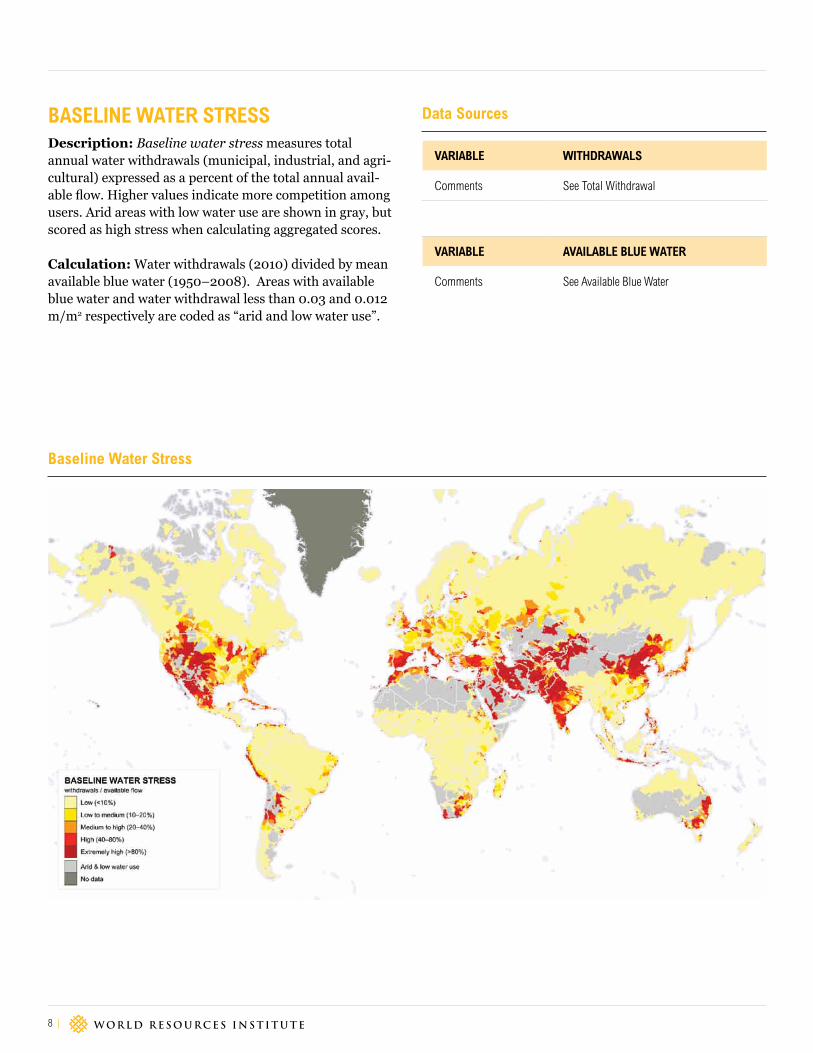
baSELiNE WatEr StrESSDescription: Baseline water stress measures total annual water withdrawals (municipal, industrial, and agri-cultural) expressed as a percent of the total annual avail-able flow. Higher values indicate more competition among users. Arid areas with low water use are shown in gray, but scored as high stress when calculating aggregated scores.
Calculation: Water withdrawals (2010) divided by mean available blue water (1950–2008). Areas with available blue water and water withdrawal less than 0.03 and 0.012 m/m2 respectively are coded as “arid and low water use”.
baseline Water Stress
variabLE WitHDraWaLS
Comments See Total Withdrawal
variabLE avaiLabLE bLuE WatEr
Comments See Available Blue Water
Data Sources
Aqueduct Global Maps 2.0
WORKING PAPER | January 2013 | 9
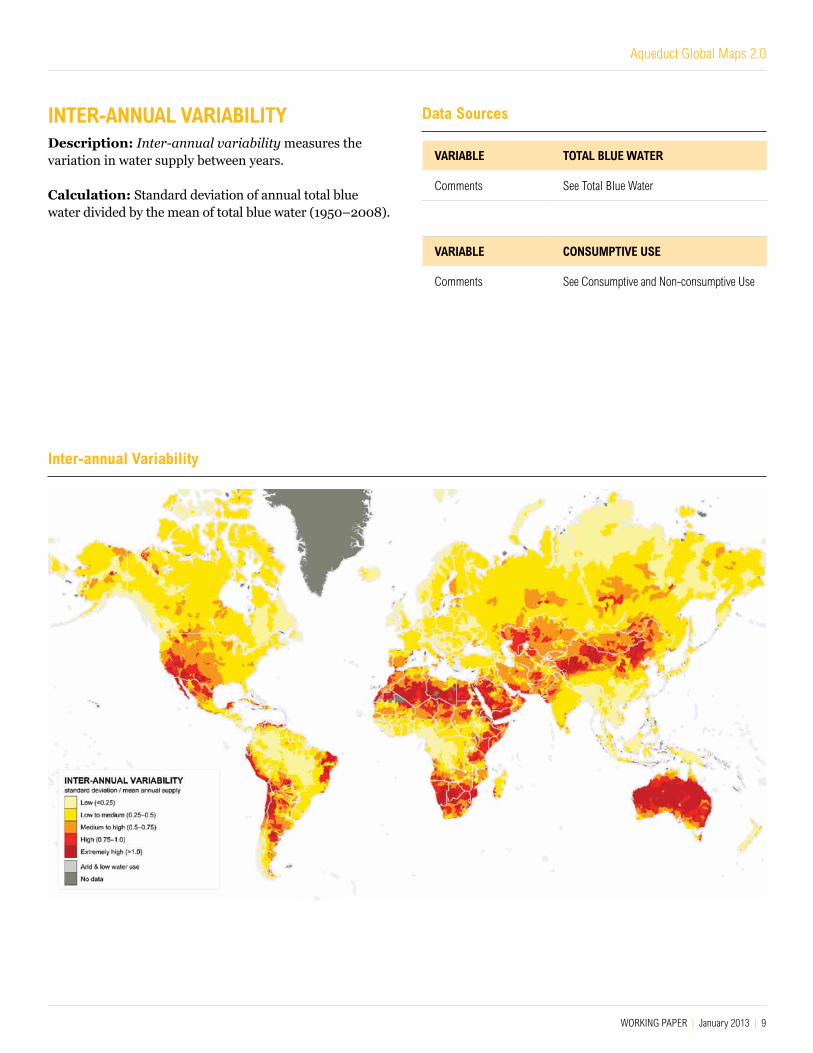
iNtEr-aNNuaL variabiLityDescription: Inter-annual variability measures the variation in water supply between years.
Calculation: Standard deviation of annual total blue water divided by the mean of total blue water (1950–2008).
variabLE tOtaL bLuE WatEr
Comments See Total Blue Water
variabLE cONSumPtivE uSE
Comments See Consumptive and Non-consumptive Use
Data Sources
inter-annual variability
10 |
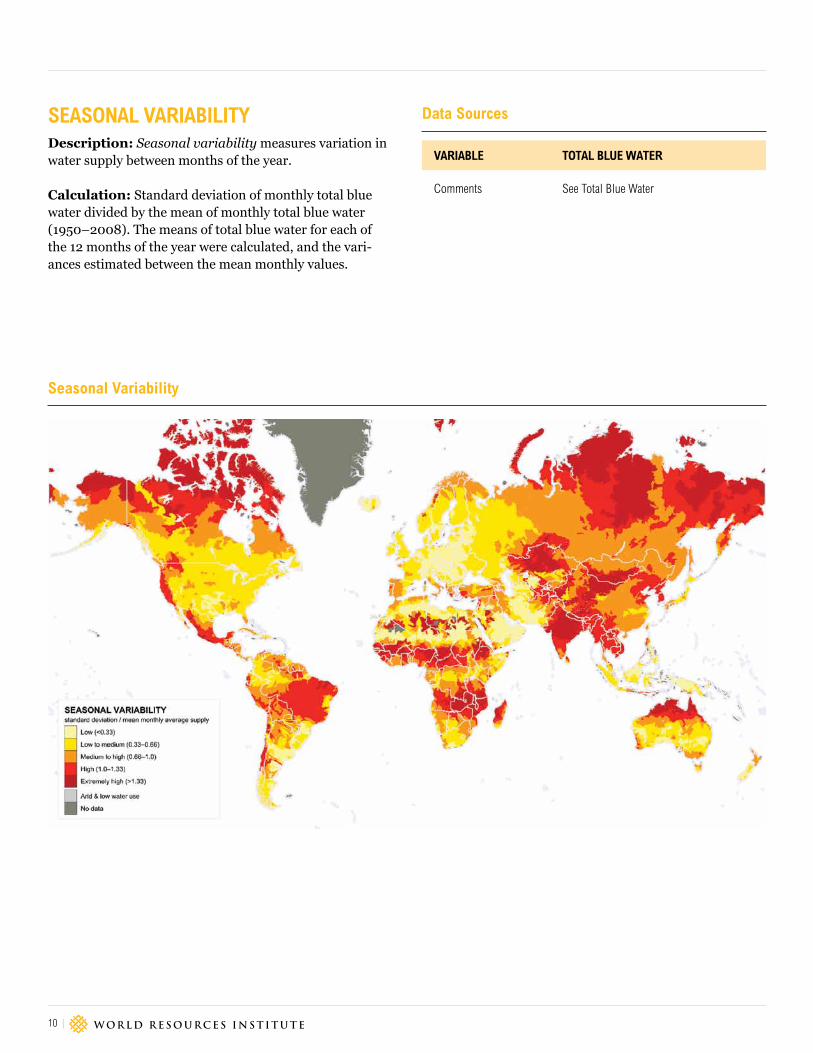
SEaSONaL variabiLityDescription: Seasonal variability measures variation in water supply between months of the year.
Calculation: Standard deviation of monthly total blue water divided by the mean of monthly total blue water (1950–2008). The means of total blue water for each of the 12 months of the year were calculated, and the vari-ances estimated between the mean monthly values.
variabLE tOtaL bLuE WatEr
Comments See Total Blue Water
Data Sources
Seasonal variability
Aqueduct Global Maps 2.0
WORKING PAPER | January 2013 | 11
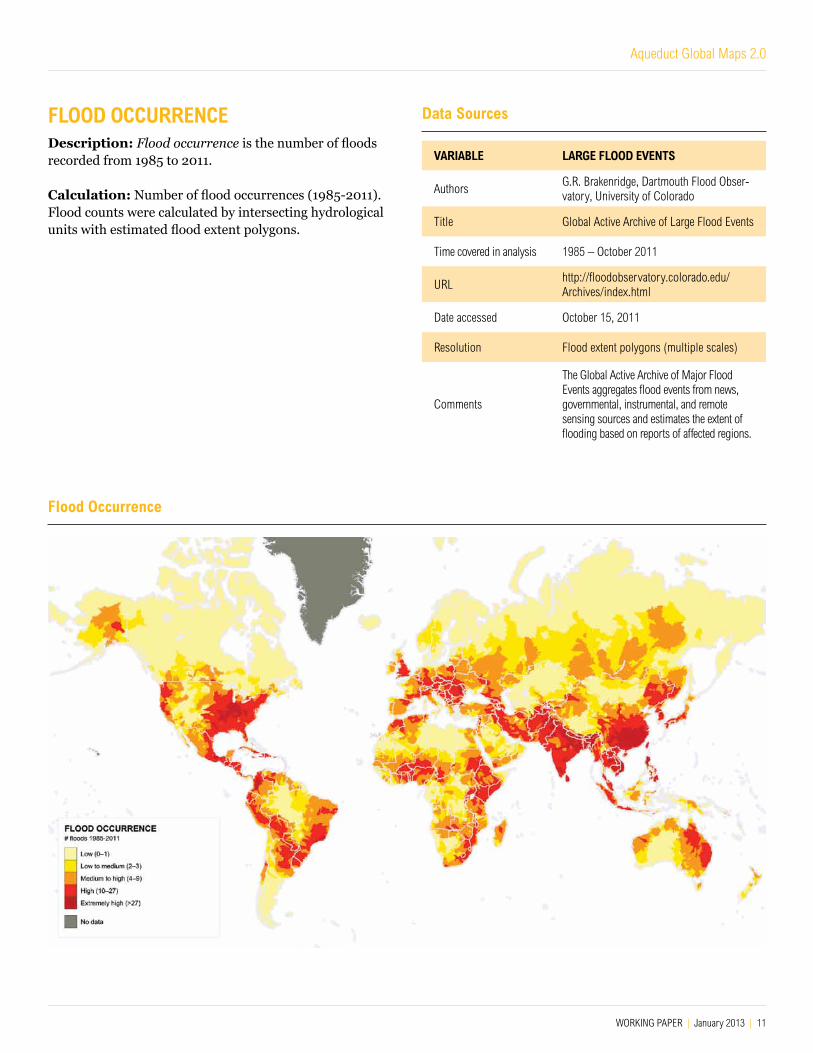
FLOOD OccurrENcEDescription: Flood occurrence is the number of floods recorded from 1985 to 2011.
Calculation: Number of flood occurrences (1985-2011). Flood counts were calculated by intersecting hydrological units with estimated flood extent polygons.
Flood� Occurrence
variabLE LarGE FLOOD EvENtS
Authors G.R. Brakenridge, Dartmouth Flood Obser-vatory, University of Colorado
Title Global Active Archive of Large Flood Events
Time covered in analysis 1985 – October 2011
URLhttp://floodobservatory.colorado.edu/Archives/index.html
Date accessed October 15, 2011
Resolution Flood extent polygons (multiple scales)
Comments
The Global Active Archive of Major Flood Events aggregates flood events from news, governmental, instrumental, and remote sensing sources and estimates the extent of flooding based on reports of affected regions.
Data Sources
12 |
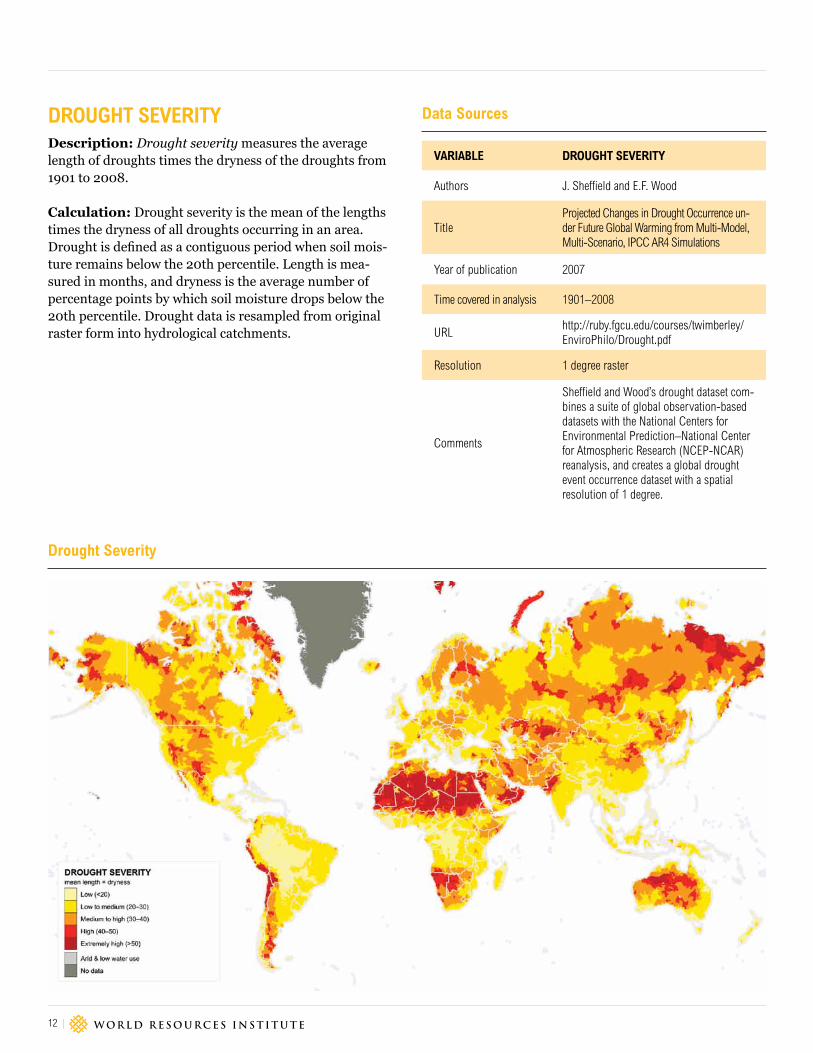
DrOuGHt SEvErityDescription: Drought severity measures the average length of droughts times the dryness of the droughts from 1901 to 2008.
Calculation: Drought severity is the mean of the lengths times the dryness of all droughts occurring in an area. Drought is defined as a contiguous period when soil mois-ture remains below the 20th percentile. Length is mea-sured in months, and dryness is the average number of percentage points by which soil moisture drops below the 20th percentile. Drought data is resampled from original raster form into hydrological catchments.
Drought Severity
variabLE DrOuGHt SEvErity
Authors J. Sheffield and E.F. Wood
Title Projected Changes in Drought Occurrence un-der Future Global Warming from Multi-Model, Multi-Scenario, IPCC AR4 Simulations
Year of publication 2007
Time covered in analysis 1901–2008
URLhttp://ruby.fgcu.edu/courses/twimberley/EnviroPhilo/Drought.pdf
Resolution 1 degree raster
Comments
Sheffield and Wood’s drought dataset com-bines a suite of global observation-based datasets with the National Centers for Environmental Prediction–National Center for Atmospheric Research (NCEP-NCAR) reanalysis, and creates a global drought event occurrence dataset with a spatial resolution of 1 degree.
Data Sources
Aqueduct Global Maps 2.0
WORKING PAPER | January 2013 | 13
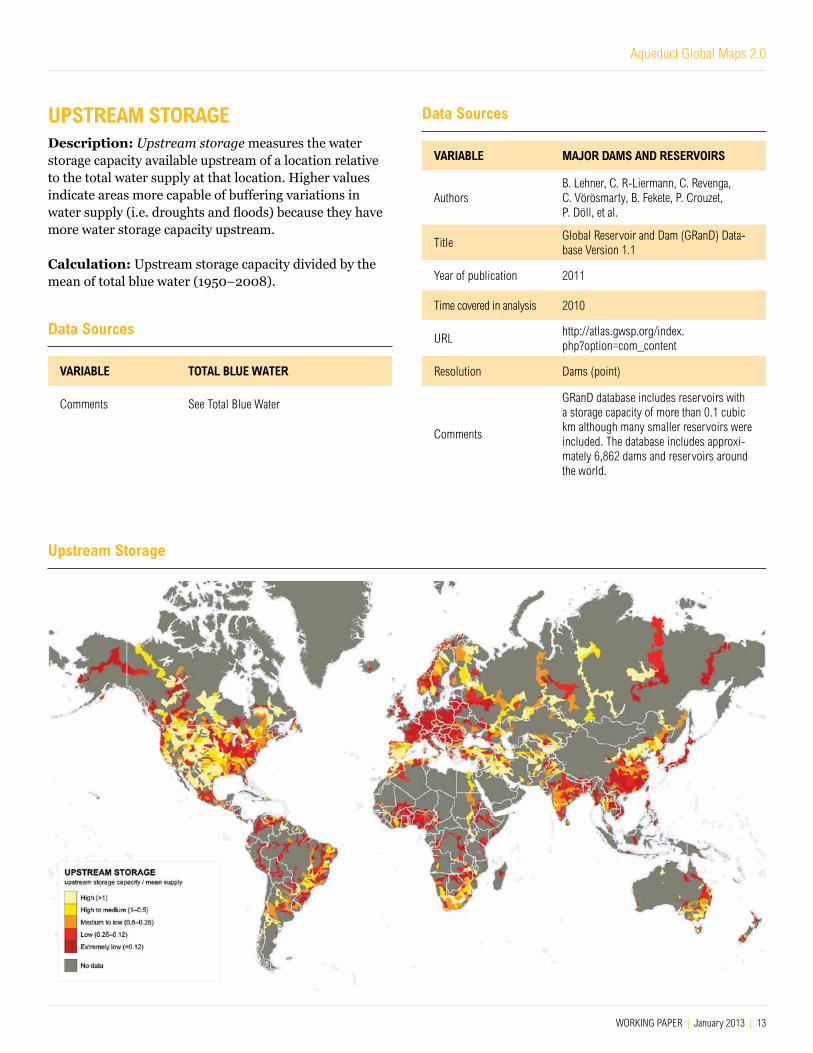
uPStrEam StOraGEDescription: Upstream storage measures the water storage capacity available upstream of a location relative to the total water supply at that location. Higher values indicate areas more capable of buffering variations in water supply (i.e. droughts and floods) because they have more water storage capacity upstream.
Calculation: Upstream storage capacity divided by the mean of total blue water (1950–2008).
variabLE majOr DamS aND rESErvOirS
AuthorsB. Lehner, C. R-Liermann, C. Revenga, C. Vörösmarty, B. Fekete, P. Crouzet, P. Döll, et al.
Title Global Reservoir and Dam (GRanD) Data-base Version 1.1
Year of publication 2011
Time covered in analysis 2010
URLhttp://atlas.gwsp.org/index.php?option=com_content
Resolution Dams (point)
Comments
GRanD database includes reservoirs with a storage capacity of more than 0.1 cubic km although many smaller reservoirs were included. The database includes approxi-mately 6,862 dams and reservoirs around the world.
Data Sources
upstream Storage
variabLE tOtaL bLuE WatEr
Comments See Total Blue Water
Data Sources
14 |
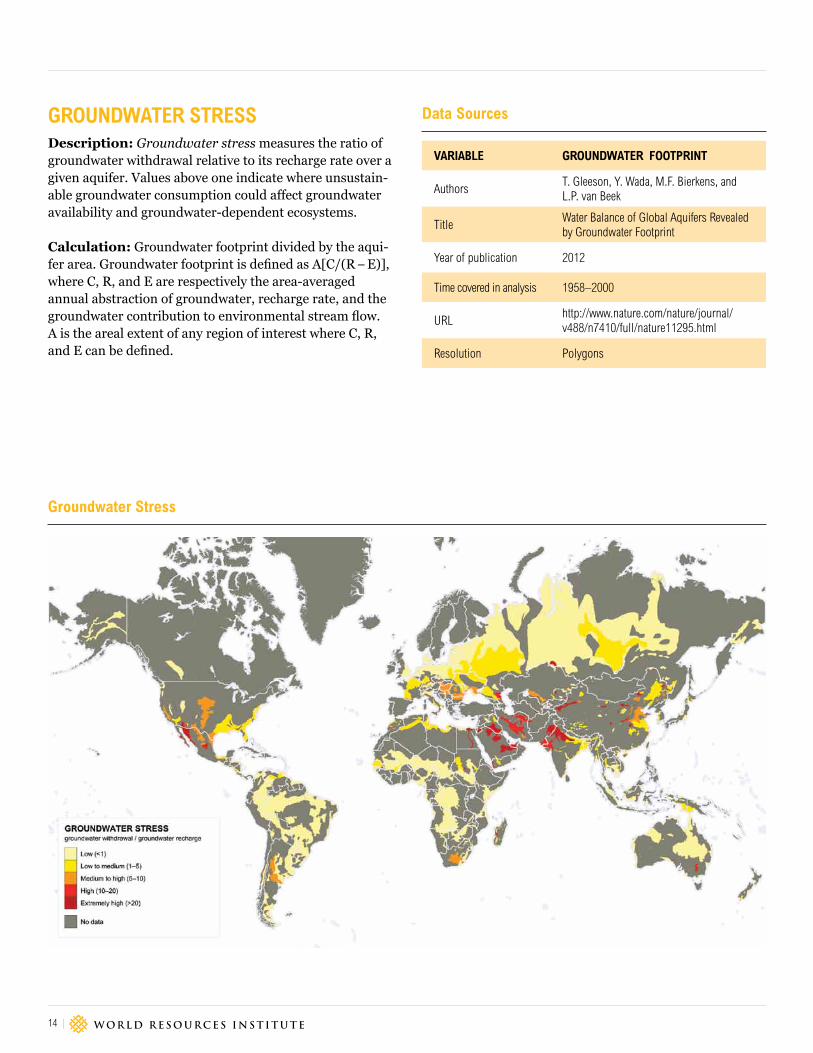
GrOuNDWatEr StrESSDescription: Groundwater stress measures the ratio of groundwater withdrawal relative to its recharge rate over a given aquifer. Values above one indicate where unsustain-able groundwater consumption could affect groundwater availability and groundwater-dependent ecosystems.
Calculation: Groundwater footprint divided by the aqui-fer area. Groundwater footprint is defined as A[C/(R − E)], where C, R, and E are respectively the area-averaged annual abstraction of groundwater, recharge rate, and the groundwater contribution to environmental stream flow. A is the areal extent of any region of interest where C, R, and E can be defined.
Ground�water Stress
variabLE GrOuNDWatEr FOOtPriNt
AuthorsT. Gleeson, Y. Wada, M.F. Bierkens, and L.P. van Beek
Title Water Balance of Global Aquifers Revealed by Groundwater Footprint
Year of publication 2012
Time covered in analysis 1958–2000
URLhttp://www.nature.com/nature/journal/v488/n7410/full/nature11295.html
Resolution Polygons
Data Sources
Aqueduct Global Maps 2.0
WORKING PAPER | January 2013 | 15
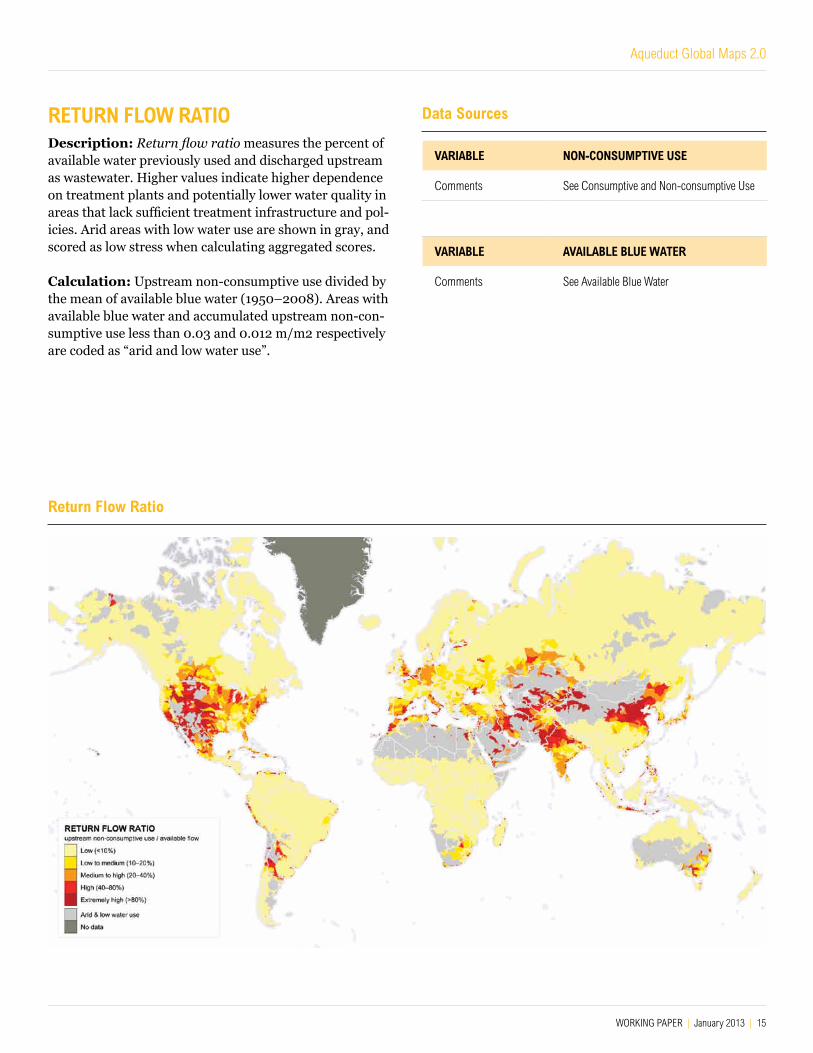
rEturN FLOW ratiODescription: Return flow ratio measures the percent of available water previously used and discharged upstream as wastewater. Higher values indicate higher dependence on treatment plants and potentially lower water quality in areas that lack sufficient treatment infrastructure and pol-icies. Arid areas with low water use are shown in gray, and scored as low stress when calculating aggregated scores.
Calculation: Upstream non-consumptive use divided by the mean of available blue water (1950–2008). Areas with available blue water and accumulated upstream non-con-sumptive use less than 0.03 and 0.012 m/m2 respectively are coded as “arid and low water use”.
return Flow ratio
variabLE NON-cONSumPtivE uSE
Comments See Consumptive and Non-consumptive Use
variabLE avaiLabLE bLuE WatEr
Comments See Available Blue Water
Data Sources
16 |
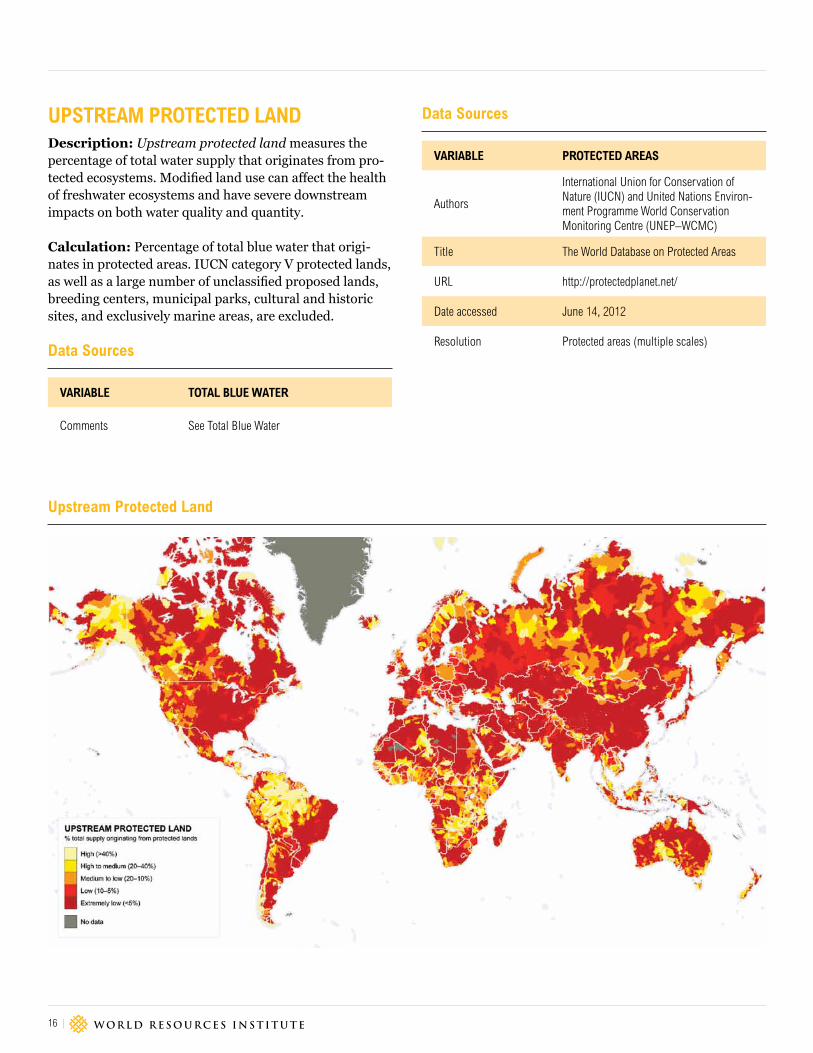
uPStrEam PrOtEctED LaNDDescription: Upstream protected land measures the percentage of total water supply that originates from pro-tected ecosystems. Modified land use can affect the health of freshwater ecosystems and have severe downstream impacts on both water quality and quantity.
Calculation: Percentage of total blue water that origi-nates in protected areas. IUCN category V protected lands, as well as a large number of unclassified proposed lands, breeding centers, municipal parks, cultural and historic sites, and exclusively marine areas, are excluded.
variabLE tOtaL bLuE WatEr
Comments See Total Blue Water
Data Sources
upstream Protected� Land�
variabLE PrOtEctED arEaS
Authors
International Union for Conservation of Nature (IUCN) and United Nations Environ-ment Programme World Conservation Monitoring Centre (UNEP–WCMC)
Title The World Database on Protected Areas
URL http://protectedplanet.net/
Date accessed June 14, 2012
Resolution Protected areas (multiple scales)
Data Sources
Aqueduct Global Maps 2.0
WORKING PAPER | January 2013 | 17
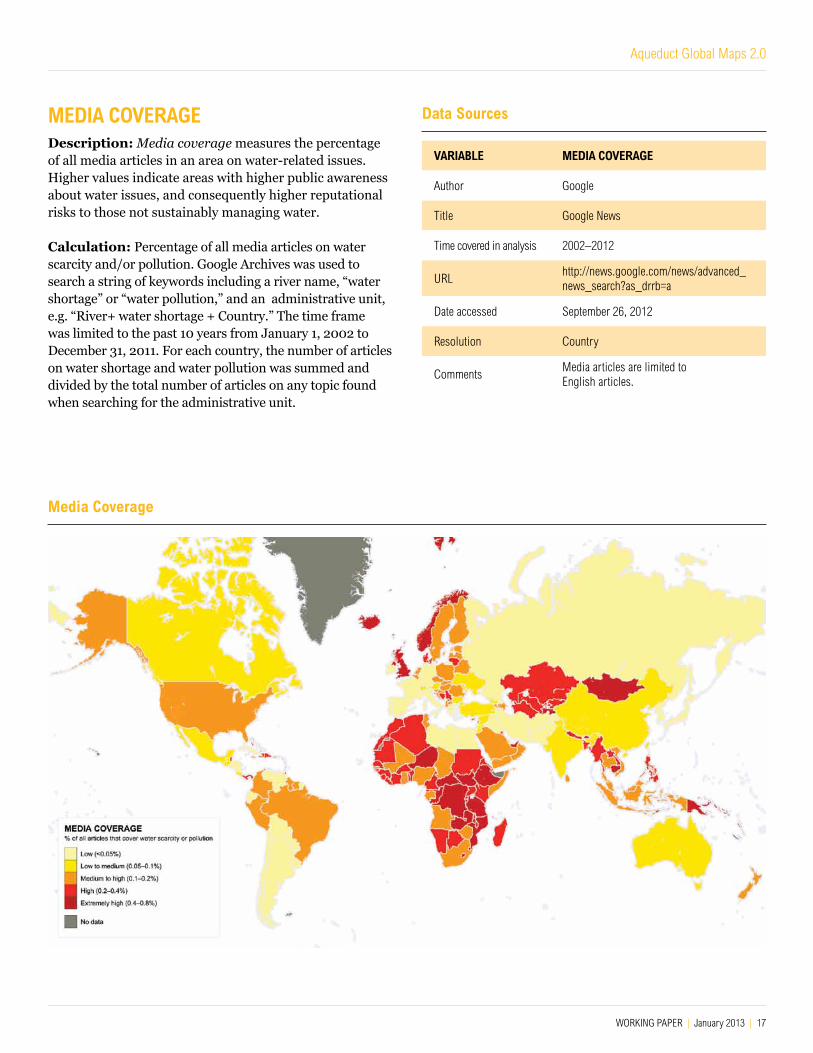
mEDia cOvEraGEDescription: Media coverage measures the percentage of all media articles in an area on water-related issues. Higher values indicate areas with higher public awareness about water issues, and consequently higher reputational risks to those not sustainably managing water.
Calculation: Percentage of all media articles on water scarcity and/or pollution. Google Archives was used to search a string of keywords including a river name, “water shortage” or “water pollution,” and an administrative unit, e.g. “River+ water shortage + Country.” The time frame was limited to the past 10 years from January 1, 2002 to December 31, 2011. For each country, the number of articles on water shortage and water pollution was summed and divided by the total number of articles on any topic found when searching for the administrative unit.
med�ia coverage
variabLE mEDia cOvEraGE
Author Google
Title Google News
Time covered in analysis 2002–2012
URLhttp://news.google.com/news/advanced_news_search?as_drrb=a
Date accessed September 26, 2012
Resolution Country
CommentsMedia articles are limited to English articles.
Data Sources
18 |
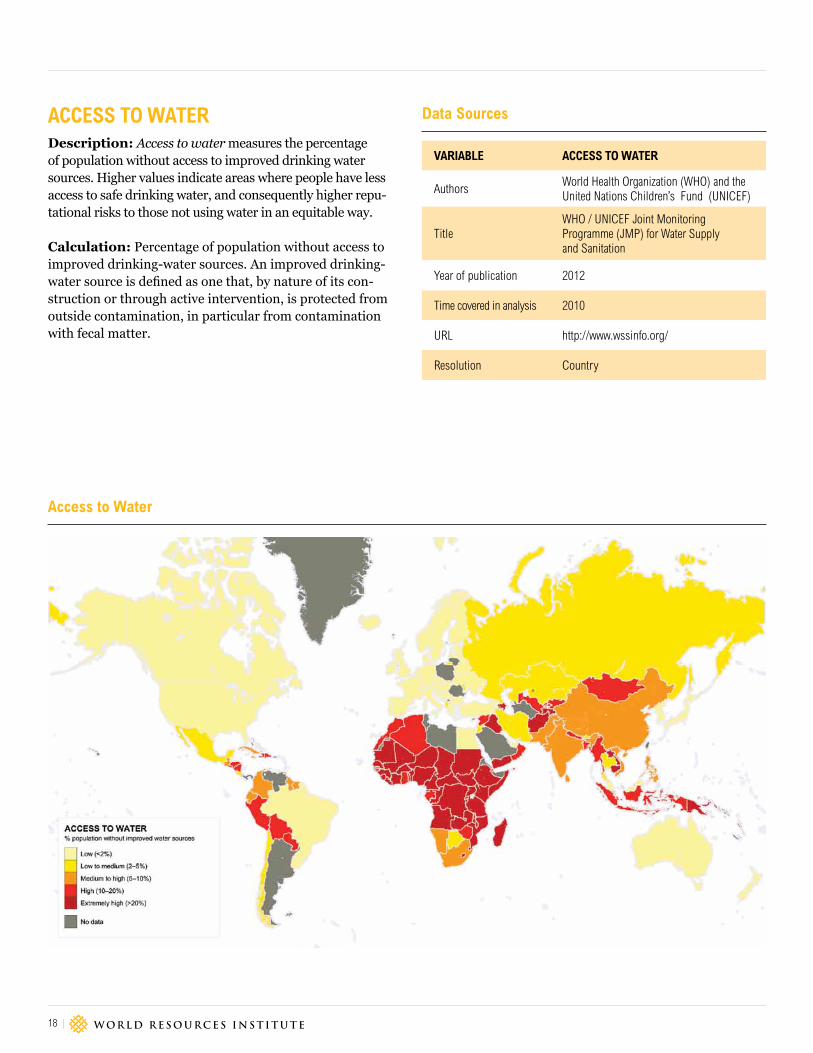
accESS tO WatErDescription: Access to water measures the percentage of population without access to improved drinking water sources. Higher values indicate areas where people have less access to safe drinking water, and consequently higher repu-tational risks to those not using water in an equitable way.
Calculation: Percentage of population without access to improved drinking-water sources. An improved drinking-water source is defined as one that, by nature of its con-struction or through active intervention, is protected from outside contamination, in particular from contamination with fecal matter.
access to Water
variabLE accESS tO WatEr
Authors World Health Organization (WHO) and the United Nations Children’s Fund (UNICEF)
Title WHO / UNICEF Joint Monitoring Programme (JMP) for Water Supply and Sanitation
Year of publication 2012
Time covered in analysis 2010
URL http://www.wssinfo.org/
Resolution Country
Data Sources
Aqueduct Global Maps 2.0
WORKING PAPER | January 2013 | 19
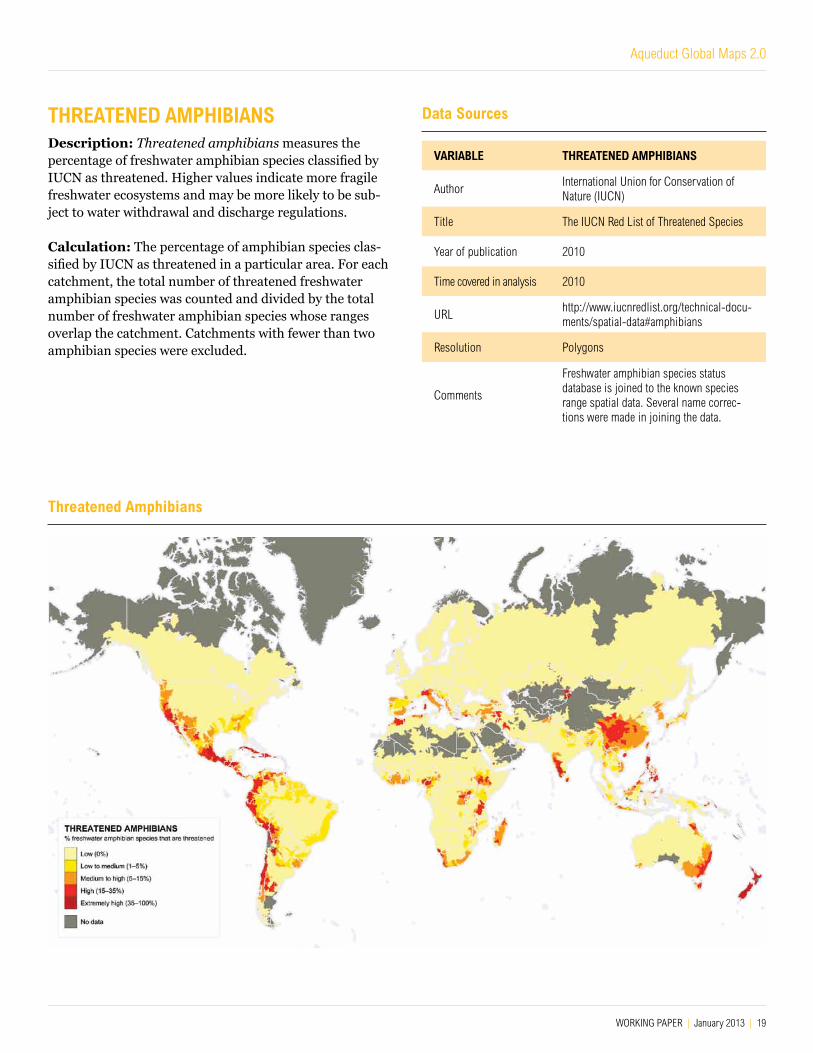
tHrEatENED amPHibiaNSDescription: Threatened amphibians measures the percentage of freshwater amphibian species classified by IUCN as threatened. Higher values indicate more fragile freshwater ecosystems and may be more likely to be sub-ject to water withdrawal and discharge regulations.
Calculation: The percentage of amphibian species clas-sified by IUCN as threatened in a particular area. For each catchment, the total number of threatened freshwater amphibian species was counted and divided by the total number of freshwater amphibian species whose ranges overlap the catchment. Catchments with fewer than two amphibian species were excluded.
threatened� amphibians
variabLE tHrEatENED amPHibiaNS
Author International Union for Conservation of Nature (IUCN)
Title The IUCN Red List of Threatened Species
Year of publication 2010
Time covered in analysis 2010
URLhttp://www.iucnredlist.org/technical-docu-ments/spatial-data#amphibians
Resolution Polygons
Comments
Freshwater amphibian species status database is joined to the known species range spatial data. Several name correc-tions were made in joining the data.
Data Sources
ABOUT WRI WRI focuses on the intersection of the environment and socio-economic development. We go beyond research to put ideas into action, working globally with governments, business, and civil society to build transformative solutions that protect the earth and improve people’s lives.
ABOUT THE AUTHORSFrancis Gassert is a research assistant with the Markets and Enterprise Program at WRI, where he manages the data collection and GIS analysis of the Aqueduct project. Contact: [email protected].
matt Land�is is a research scientist at ISciences, L.L.C., where he develops and applies hydrological algorithms and models.
matt Luck is a research scientist at ISciences, L.L.C., where he develops and applies hydrological algorithms and models.
Paul reig is an associate with the Markets and Enterprise Program at WRI, where he leads the design and development of the Aqueduct project. Contact: [email protected].
tien Shiao is a Senior Associate with the Markets and Enterprise Program at WRI, where she manages the application and road testing of the Aqueduct project for companies and investors.Contact: [email protected].
WITH SUPPORT FROMthe aqued�uct alliance:
Goldman Sachs
General Electric
Skoll Global Threats Fund
Bloomberg
Talisman Energy Inc.
Dow Chemical Company
Royal Dutch Shell
Dutch Government
United Technologies Corporation
DuPont
John Deere
Procter & Gamble Company
ENDNOTES 1. Paul Reig, Tien Shiao, and Francis Gassert. Aqueduct Water Risk Frame-
work, WRI Working Paper, Washington DC: World Resources Institute, forthcoming.
2. Yuji Masutomi, Yusuke Inui, Kiyoshi Takahashi, and Yuzuru Matsuoka. “Development of Highly Accurate Global Polygonal Drainage Basin Data,” Hydrological Processes 23: 572-84, DOI: 10.1002/hyp.7186, 2009.
3. I.A. Shiklomanov and John C. Rodda, eds. World Water Resources at the Beginning of the Twenty-First Century, International Hydrology Series, Cambridge University Press, 2004.
4. M. Flörke, E. Kynast, I. Bärlund, S. Eisner, F. Wimmer, J. Alcamo, “Domestic and Industrial Water Uses of the Past 60 Years as a Mirror of Socio-Economic Development: A Global Simulation Study,” Global Environmental Change, in press, 2012.
5. National Aeronautics and Space Administration (NASA). Global Land Data Assimilation System Version 2 (GLDAS-2), Goddard Earth Sciences Data Information Services Center, 2012.
ACKNOWLEDGMENTS This publication was made possible thanks to the ongoing support of the World Resources Institute Markets and Enterprise Program and the Aqueduct Alliance. The authors would like to thank the following people for providing invaluable insight and assistance: Nicole Grohoski, Thomas Parris, Pragya-jan Rai, Tianyi Luo, Robert Kimball, Betsy Otto, Charles Iceland, and Kirsty Jenkinson as well as Nick Price and Hyacinth Billings for graphic support and final editing. For their extensive technical guidance and feedback during the development of the Aqueduct Water Risk Atlas Global Maps, the authors would also like to thank:
Robin Abell, World Wildlife Fund
David Cooper, World Resources Institute
Martina Flörke, University of Kassel
Tom Gleeson, McGill University
Cy Jones, World Resources Institute
Mindy Selman, World Resources Institute
Justin Sheffield, Princeton University
Richard Vogel, Tufts University
Yoshihide Wada, Utrecht University
Copyright 2013 World Resources Institute. This work is licensed under the Creative Commons Attribution 3.0 License. To view a copy of the license, visit http://creativecommons.org/licenses/by/3.0/
10 G Street, NE | Washington, DC 20002 | www.Wri.org


![Aqueduct el[1]](https://img.pdfslide.net/doc/110x75/557ea115d8b42ac5658b47e0/aqueduct-el1.jpg)

![Aqueduct en[1]](https://img.pdfslide.net/doc/110x75/557e9f8ed8b42a1d048b535e/aqueduct-en1.jpg)