Embed Size (px)
Citation preview
ArcelorMittal reports third quarter 2014 and nine months 2014 results Luxembourg, November 7, 2014 - ArcelorMittal (referred to as “ArcelorMittal” or the “Company”) (MT (New York, Amsterdam, Paris, Luxembourg), MTS (Madrid)), the world’s leading integrated steel and mining company, today announced results1 for the three and nine month periods ended September 30, 2014.
Highlights:
Health and safety performance improved in 3Q 2014 to an LTIF rate2 of 0.78x
EBITDA3 of $1.9 billion in 3Q 2014, an 11.2% improvement as compared to 3Q 2013 with notable improvements in
Europe (+72.6%) and ACIS (+89.5%), offset by the negative impact of iron ore price on the Mining segment (-47.9%)
Steel shipments of 21.5 Mt in 3Q 2014, an increase of 3.9% as compared to 3Q 2013
3Q 2014 own iron ore production of 15.8 Mt, up 6% YoY; 10.0 Mt shipped and reported at market prices4, up 6.3% YoY
Net debt5 of $17.8 billion as of September 30, 2014 as compared to $17.4 billion as of June 30, 2014 due largely to
working capital investment of $0.6 billion and dividends of $0.4 billion, partially offset by forex effects ($0.5 billion)
Key developments:
Continued progress on ACIS turnaround evident through improved Kazakhstan and Ukraine performance
ArcelorMittal Tubarão blast furnace No.3 restarted July 2014
Sale of Gallatin 50/50 joint venture in US to Nucor completed for $770 million6; proceeds received in October 2014
Mining: Liberia phase 1 expected production and shipment of 5Mt in 2014 unaffected by Ebola epidemic. Phase 2
currently progressing at a slower pace due to contractors declaring force majeure
Outlook and guidance framework:
Operating conditions remain generally favorable. The impact of declining iron ore price on Mining segment profitability is
being offset by improvement in the steel business. The Company reiterates its guidance for EBITDA in excess of $7.0
billion in 2014
Net interest expense is now expected to be approximately $1.5 billion for 2014
Capital expenditure is now expected to be approximately $3.8 billion for 2014
The Company maintains its medium term net debt target of $15 billion
Financial highlights (on the basis of IFRS1):
(USDm) unless otherwise shown 3Q 14 2Q 14 3Q 13 9M 14 9M13
Sales 20,067 20,704 19,643 60,559 59,592
EBITDA 1,905 1,763 1,713 5,422 4,978
Operating income 959 832 477 2,465 1,233
Net income / (loss) attributable to equity holders of the parent
22 52 (193) (131) (1,318)
Basic income / (loss) per share (USD) 0.01 0.03 (0.12) (0.08) (0.77)
Own iron ore production (Mt) 15.8 16.6 14.9 47.2 43.0
Iron ore shipped at market price (Mt) 10.0 10.5 9.4 29.9 24.9
Crude steel production (Mt) 23.9 23.1 23.3 70.0 68.2
Steel shipments (Mt) 21.5 21.5 20.7 63.9 62.1
EBITDA/tonne (USD/t)7 89 82 83 85 80
Commenting, Mr. Lakshmi N. Mittal, ArcelorMittal Chairman and CEO, said:
"This quarter’s results show the considerable improvement in our steel business which has more than offset the fall in the iron
ore price. Europe has delivered another strong quarter, reflecting improved market conditions and the benefits of the optimisation efforts, the turnaround in ACIS is evident, and the NAFTA business has recovered after a disappointing first half. Based on today’s market conditions, I do not foresee a deterioration in our performance in the fourth quarter. As a result we are well placed to achieve full year EBITDA in excess of $7.0 billion.
Third quarter 2014 earnings analyst conference call ArcelorMittal management will host a conference call for members of the investment community to discuss the three- and nine-month periods ended September 30, 2014 on:
Date US Eastern time London CET
Friday November 7, 2014
9.30am 2.30pm 3.30pm
The dial in numbers:
Location Toll free dial
in numbers
Local dial in
numbers Participant
UK local: 0800 051 5931 +44 (0)203 364 5807 94562272#
USA local: +1 866 719 2729 +1 240 645 0345 94562272#
France: 0800 9174780 +33 17071 2916 94562272#
Germany: 0800 965 6288 +49 692 7134 0801 94562272#
Spain: 90 099 4930 +34 911 143436 94562272#
Luxembourg: 800 26908 +352 27 86 05 07 94562272#
A replay of the conference call will be available for one week by dialing:
Number Language Access code +49 (0) 1805 2043 089
English 446856#
The conference call will include a brief question and answer session with senior management. The presentation will be available via a live video webcast on www.arcelormittal.com.
Forward-Looking Statements
This document may contain forward-looking information and statements about ArcelorMittal and its subsidiaries. These statements include financial projections and estimates and their underlying assumptions, statements regarding plans, objectives and expectations with respect to future operations, products and services, and statements regarding future performance. Forward-looking statements may be identified by the words “believe,” “expect,” “anticipate,” “target” or similar expressions. Although ArcelorMittal’s management believes that the expectations reflected in such forward-looking statements are reasonable, investors and holders of ArcelorMittal’s securities are cautioned that forward-looking information and statements are subject to numerous risks and uncertainties, many of which are difficult to predict and generally beyond the control of ArcelorMittal, that could cause actual results and developments to differ materially and adversely from those expressed in, or implied or projected by, the forward-looking information and statements. These risks and uncertainties include those discussed or identified in the filings with the Luxembourg Stock Market Authority for the Financial Markets (Commission de Surveillance du Secteur Financier) and the United States Securities and Exchange Commission (the “SEC”) made or to be made by ArcelorMittal, including ArcelorMittal’s Annual Report on Form 20-F for the year ended December 31, 2013 filed with the SEC and with respect to Items 3, 4, 5, 6 and 18 of such Annual Report on Form 20-F, such Items have been retrospectively adjusted to reflect the retrospective application of changes in its segment information, which can be found in the current report on Form 6-K filed with the SEC on August 5, 2014. ArcelorMittal undertakes no obligation to publicly update its forward-looking statements, whether as a result of new information, future events, or otherwise.
About ArcelorMittal
ArcelorMittal is the world's leading steel and mining company, with a presence in more than 60 countries and an industrial footprint in over 20 countries. Guided by a philosophy to produce safe, sustainable steel, we are the leading supplier of quality steel in the major global steel markets including automotive, construction, household appliances and packaging, with world-class research and development and outstanding distribution networks. Through our core values of sustainability, quality and leadership, we operate responsibly with respect to the health, safety and wellbeing of our employees, contractors and the communities in which we operate.
For us, steel is the fabric of life, as it is at the heart of the modern world from railways to cars and washing machines. We are actively researching and producing steel-based technologies and solutions that make many of the products and components we use in our everyday lives more energy-efficient. We are one of the world’s largest producers of iron ore and metallurgical coal and our mining business is an essential part of our growth strategy. With a geographically diversified portfolio of iron ore and coal assets, we are strategically positioned to serve our network of steel plants and the external global market. While our steel operations are important customers, our supply to the external market is increasing as we grow. In full year 2013, ArcelorMittal had revenues of $79.4 billion and crude steel production of 91.2 million tonnes, while own iron ore production reached 58.4 million tonnes. ArcelorMittal is listed on the stock exchanges of New York (MT), Amsterdam (MT), Paris (MT), Luxembourg (MT) and on the Spanish stock exchanges of Barcelona, Bilbao, Madrid and Valencia (MTS). For more information about ArcelorMittal please visit: www.arcelormittal.com.
Enquiries
ArcelorMittal Investor Relations
Europe Tel: +352 4792 2652
Americas Tel: +1 312 899 3985
Retail Tel: +352 4792 3198
SRI Tel: +44 207 543 1128
Bonds/Credit Tel: +33 1 71 92 10 26
ArcelorMittal Corporate Communications E-mail: [email protected]
Tel: +352 4792 5000
Sophie Evans Tel: +44 203 214 2882
Laura Nutt Tel: +44 207 543 1125
France Image 7: Sylvie Dumaine Tel: +33 1 53 70 94 17
United Kingdom Maitland Consultancy: Martin Leeburn Tel: +44 20 7379 5151
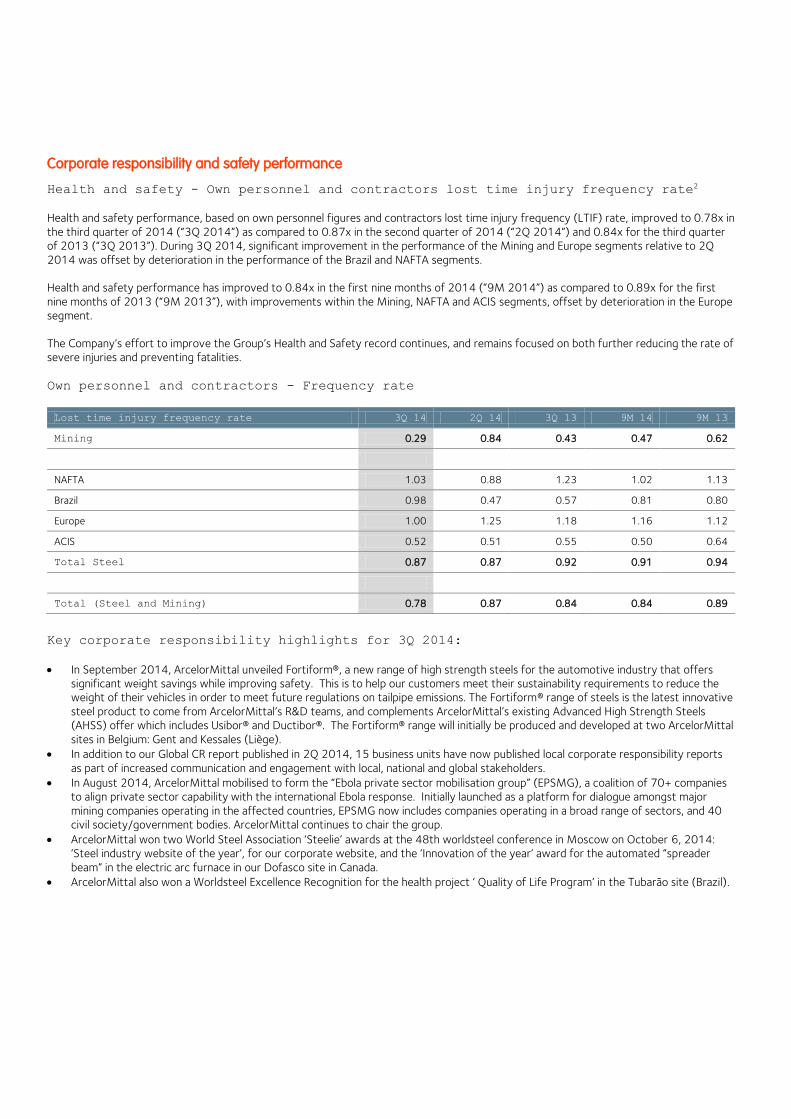
Corporate responsibility and safety performance
Health and safety - Own personnel and contractors lost time injury frequency rate2
Health and safety performance, based on own personnel figures and contractors lost time injury frequency (LTIF) rate, improved to 0.78x in the third quarter of 2014 (“3Q 2014”) as compared to 0.87x in the second quarter of 2014 (“2Q 2014”) and 0.84x for the third quarter of 2013 (“3Q 2013”). During 3Q 2014, significant improvement in the performance of the Mining and Europe segments relative to 2Q 2014 was offset by deterioration in the performance of the Brazil and NAFTA segments. Health and safety performance has improved to 0.84x in the first nine months of 2014 (“9M 2014”) as compared to 0.89x for the first nine months of 2013 (“9M 2013”), with improvements within the Mining, NAFTA and ACIS segments, offset by deterioration in the Europe segment.
The Company’s effort to improve the Group’s Health and Safety record continues, and remains focused on both further reducing the rate of severe injuries and preventing fatalities.
Own personnel and contractors - Frequency rate
Lost time injury frequency rate 3Q 14 2Q 14 3Q 13 9M 14 9M 13
Mining 0.29 0.84 0.43 0.47 0.62
NAFTA 1.03 0.88 1.23 1.02 1.13
Brazil 0.98 0.47 0.57 0.81 0.80
Europe 1.00 1.25 1.18 1.16 1.12
ACIS 0.52 0.51 0.55 0.50 0.64
Total Steel 0.87 0.87 0.92 0.91 0.94
Total (Steel and Mining) 0.78 0.87 0.84 0.84 0.89
Key corporate responsibility highlights for 3Q 2014:
In September 2014, ArcelorMittal unveiled Fortiform®, a new range of high strength steels for the automotive industry that offers significant weight savings while improving safety. This is to help our customers meet their sustainability requirements to reduce the weight of their vehicles in order to meet future regulations on tailpipe emissions. The Fortiform® range of steels is the latest innovative steel product to come from ArcelorMittal’s R&D teams, and complements ArcelorMittal’s existing Advanced High Strength Steels (AHSS) offer which includes Usibor® and Ductibor®. The Fortiform® range will initially be produced and developed at two ArcelorMittal sites in Belgium: Gent and Kessales (Liège).
In addition to our Global CR report published in 2Q 2014, 15 business units have now published local corporate responsibility reports as part of increased communication and engagement with local, national and global stakeholders.
In August 2014, ArcelorMittal mobilised to form the “Ebola private sector mobilisation group” (EPSMG), a coalition of 70+ companies to align private sector capability with the international Ebola response. Initially launched as a platform for dialogue amongst major mining companies operating in the affected countries, EPSMG now includes companies operating in a broad range of sectors, and 40 civil society/government bodies. ArcelorMittal continues to chair the group.
ArcelorMittal won two World Steel Association ‘Steelie’ awards at the 48th worldsteel conference in Moscow on October 6, 2014: ‘Steel industry website of the year’, for our corporate website, and the ‘Innovation of the year’ award for the automated “spreader beam” in the electric arc furnace in our Dofasco site in Canada.
ArcelorMittal also won a Worldsteel Excellence Recognition for the health project ‘ Quality of Life Program’ in the Tubarão site (Brazil).
Analysis of results for the nine months ended September 30, 2014 versus results for the nine months ended September 30, 2013 ArcelorMittal’s net loss for 9M 2014 was $0.1 billion, or $0.08 loss per share, as compared to net loss for 9M 2013 of $1.3 billion, or $0.77 loss per share. Total steel shipments for 9M 2014 were 2.9% higher at 63.9 million metric tonnes as compared with 62.1 million metric tonnes for 9M 2013. Sales for 9M 2014 increased by 1.6% to $60.6 billion as compared with $59.6 billion for 9M 2013, primarily due to higher steel shipments (+2.9%) and marketable iron ore shipments (+20.1%), offset in part by lower average steel selling prices (-1.3%) and lower seaborne iron ore reference prices8 (-23%). In recent years the Company’s maintenance practices have enabled an increase in the useful lives of plant and equipment. As a result of this development, the Company has determined that it is appropriate to extend the useful lives resulting in a lower charge to the income statement. The full detailed review of useful lives of the assets has been largely completed. Accordingly, depreciation of $3.0 billion for 9M 2014 was lower as compared to $3.4 billion for 9M 2013. The Company expects the full year 2014 depreciation charge to be approximately $3.8-$4.0 billion as compared to $4.7 billion in each of 2012 and 2013. Impairment charges for 9M 2014 were nil. Impairment charges for 9M 2013 were $140 million, including $101 million for the costs associated with the discontinued iron ore project in Senegal9 (Mining) and costs related to the closure of the organic coating and tin plate lines in Florange. Restructuring charges for 9M 2014 were nil. Restructuring charges for 9M 2013 were $173 million, including $137 million of costs incurred for the long term idling of the Florange liquid phase (including voluntary separation scheme costs, site rehabilitation/safeguarding costs, and take or pay obligations). Operating income for 9M 2014 was $2.5 billion as compared with operating income of $1.2 billion for 9M 2013. Operating results for 9M 2014 were negatively impacted by a $90 million charge following the settlement of US antitrust litigation10. Operating results for 9M 2013 were positively impacted by a $47 million fair valuation gain relating to the acquisition of an additional ownership interest in DJ Galvanizing in Canada and by $92 million of “Dynamic Delta Hedge” (DDH) income. The DDH income recorded in 1Q 2013 was the final instalment of such income. This gain on the unwinding of a currency hedge related to raw materials purchases was initially recorded in equity in 4Q 2008 and as of 1Q 2013 had been fully recorded in the income statement. Income from investments, associates, joint ventures and other investments in 9M 2014 was $208 million, as compared to income of $11 million in 9M 2013. Income in 9M 2014 includes the annual dividend received from Erdemir, improved performance of Spanish investees as well as the share of profits of Calvert operations11. Income earned during 9M 2013 was lower primarily due to the payment of contingent consideration related to the Gonvarri Brasil acquisition in 2008 and weaker performance of European associates during the year. Net interest expense (including interest expense and interest income) was lower at $1.1 billion for 9M 2014, as compared to $1.4 billion for 9M 2013, following repayment of bonds in 2Q 2013 and 2Q 2014. The Company now expects full year 2014 net interest expense of approximately $1.5 billion rather than the previous guidance of approximately $1.6 billion. Foreign exchange and other net financing costs12 were $1.4 billion for 9M 2014 as compared to costs of $1.0 billion for 9M 2013. Foreign exchange and other net financing costs for 9M 2014 include expenses related to the termination of the Senegal greenfield project, non-cash gains and losses on convertible bonds and hedging instruments that matured during the period as well as charges related to the federal tax amnesty plan in Brazil linked with the Siderbras case13. ArcelorMittal recorded an income tax expense of $196 million for 9M 2014, as compared to an income tax expense of $191 million for 9M 2013.
Non-controlling interests for 9M 2014 were a charge of $97 million, as compared to a charge of $59 million for 9M 2013. Non-controlling interests charges for 9M 2014 primarily relate to minority shareholders’ share of net income recorded in ArcelorMittal Mines Canada.
Analysis of results for 3Q 2014 versus 2Q 2014 and 3Q 2013
ArcelorMittal recorded net income for 3Q 2014 of $22 million, or $0.01 earnings per share, as compared to net income of $52 million, or $0.03 earnings per share for 2Q 2014, and a net loss of $193 million, or $0.12 loss per share for 3Q 2013. Total steel shipments for 3Q 2014 were 21.5 million metric tonnes, comparable to 2Q 2014, despite a seasonal slowdown in Europe and 3.9% higher than 20.7 million metric tonnes for 3Q 2013.
Sales for 3Q 2014 were $20.1 billion as compared to $20.7 billion in 2Q 2014 and $19.6 billion for 3Q 2013. Sales in 3Q 2014 were lower as compared to 2Q 2014, primarily due to lower average steel selling prices (-2.8%), lower market priced iron ore shipments (-4.8%) and iron ore reference prices (-12%). Sales in 3Q 2014 were higher as compared to 3Q 2013 due to improved steel shipments (+3.9%); and higher marketable iron ore shipments (+6.3%), offset in part by lower iron ore reference prices (-32%). Depreciation was higher at $946 million for 3Q 2014 as compared to $931 million for 2Q 2014 and significantly lower than $1,135 million for 3Q 2013, following increases in the useful lives of plant and equipment (as discussed above). Impairment charges for 3Q 2014 and 2Q 2014 were nil. Impairment charges for 3Q 2013 were $101 million related to the costs associated with the discontinued iron ore project in Senegal9. Restructuring charges for 3Q 2014, 2Q 2014 and 3Q 2013 were nil. Operating income for 3Q 2014 was $959 million, as compared to operating income of $832 million for 2Q 2014 and $477 million for 3Q 2013. Operating results for 2Q 2014 included a $90 million charge following the settlement of US antitrust litigation. Income from investments, associates, joint ventures and other investments in 3Q 2014 was $54 million as compared to income in 2Q 2014 of $118 million, and income of $53 million in 3Q 2013. Income from investments, associates, joint ventures and other investments in 2Q 2014 included an annual dividend received from Erdemir. Net interest expense (including interest expense and interest income) in 3Q 2014 was lower at $338 million, as compared to $383 million for 2Q 2014 and $409 million for 3Q 2013. The decrease in 3Q 2014 was primarily due to savings incurred following the repayment of the $800 million convertible bonds upon their maturity in May 2014 as well as higher interest income. Foreign exchange and other net financing costs were $657 million for 3Q 2014 as compared to $327 million for 2Q 2014 and $269 million for 3Q 2013. Foreign exchange and other net financing costs for 3Q 2014 were negatively impacted by $315 million foreign exchange losses as compared to a $2 million loss in 2Q 2014, primarily driven by the net impact of 7.9% USD appreciation on deferred tax assets partially offset by its impact on Euro denominated debt positions. In addition, 3Q 2014 includes $161 million expenses related to a federal tax amnesty plan in Brazil linked with Siderbras case settled during the quarter13. Foreign exchange and other net financing costs for 2Q 2014 included non-cash gains and losses on convertible bonds, and hedging instruments that matured during the quarter. ArcelorMittal recorded an income tax benefit of $21 million for 3Q 2014, as compared to an income tax expense of $156 million and income tax benefit of $5 million for 2Q 2014 and 3Q 2013, respectively. During 3Q 2014, the Company recognized $133 million of deferred tax assets for losses of previous years that were utilized in the payment of the tax amnesty in Brazil14. Non-controlling interests for 3Q 2014 represented a charge of $17 million, as compared to a charge of $32 million for 2Q 2014 and a charge of $50 million for 3Q 2013. Non-controlling interests charges for 3Q 2014 primarily related to minority shareholders’ share of net income recorded in ArcelorMittal Mines Canada and the Bekaert partnerships in Brazil, partially offset by losses generated by ArcelorMittal South Africa.
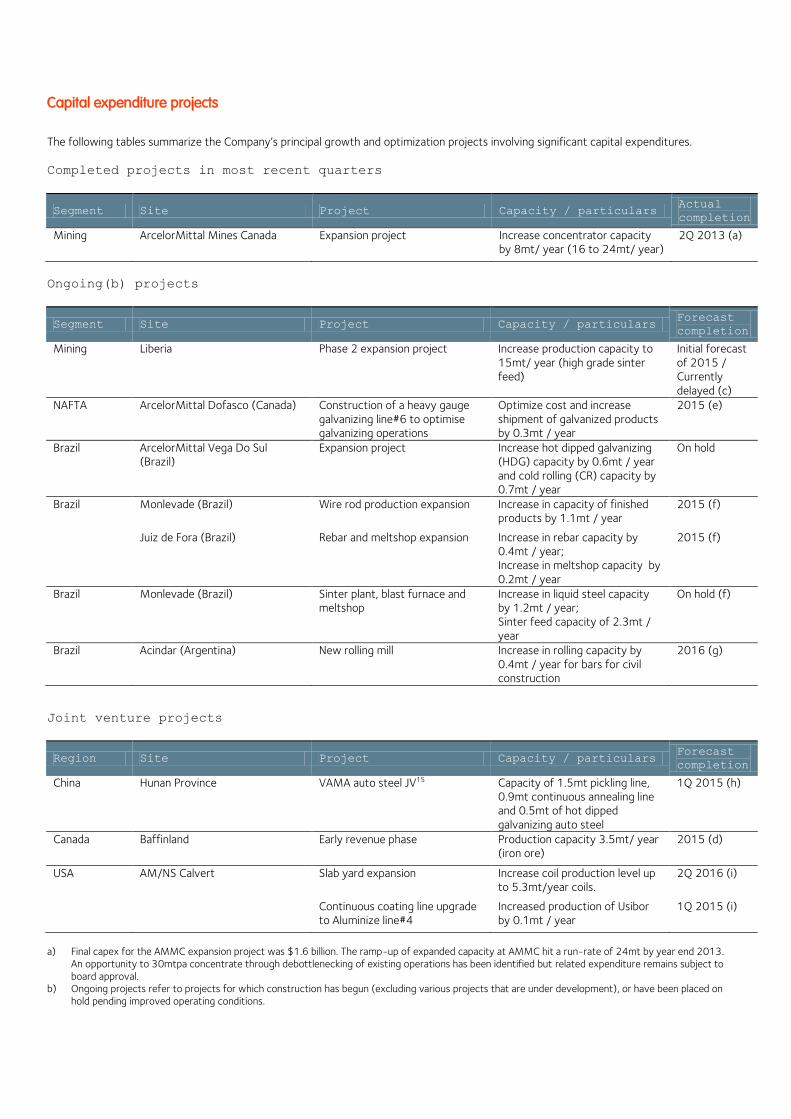
Capital expenditure projects
The following tables summarize the Company’s principal growth and optimization projects involving significant capital expenditures.
Completed projects in most recent quarters
Segment Site Project Capacity / particulars Actual
completion
Mining ArcelorMittal Mines Canada Expansion project Increase concentrator capacity by 8mt/ year (16 to 24mt/ year)
2Q 2013 (a)
Ongoing(b) projects
Segment Site Project Capacity / particulars Forecast
completion
Mining Liberia Phase 2 expansion project Increase production capacity to 15mt/ year (high grade sinter feed)
Initial forecast of 2015 / Currently delayed (c)
NAFTA ArcelorMittal Dofasco (Canada) Construction of a heavy gauge galvanizing line#6 to optimise galvanizing operations
Optimize cost and increase shipment of galvanized products by 0.3mt / year
2015 (e)
Brazil ArcelorMittal Vega Do Sul (Brazil)
Expansion project Increase hot dipped galvanizing (HDG) capacity by 0.6mt / year and cold rolling (CR) capacity by 0.7mt / year
On hold
Brazil Monlevade (Brazil) Wire rod production expansion Increase in capacity of finished products by 1.1mt / year
2015 (f)
Juiz de Fora (Brazil) Rebar and meltshop expansion Increase in rebar capacity by 0.4mt / year; Increase in meltshop capacity by 0.2mt / year
2015 (f)
Brazil Monlevade (Brazil) Sinter plant, blast furnace and meltshop
Increase in liquid steel capacity by 1.2mt / year; Sinter feed capacity of 2.3mt / year
On hold (f)
Brazil Acindar (Argentina) New rolling mill Increase in rolling capacity by 0.4mt / year for bars for civil construction
2016 (g)
Joint venture projects
Region Site Project Capacity / particulars Forecast
completion
China Hunan Province VAMA auto steel JV15 Capacity of 1.5mt pickling line, 0.9mt continuous annealing line and 0.5mt of hot dipped galvanizing auto steel
1Q 2015 (h)
Canada Baffinland Early revenue phase Production capacity 3.5mt/ year (iron ore)
2015 (d)
USA AM/NS Calvert Slab yard expansion Increase coil production level up to 5.3mt/year coils.
2Q 2016 (i)
Continuous coating line upgrade to Aluminize line#4
Increased production of Usibor by 0.1mt / year
1Q 2015 (i)
a) Final capex for the AMMC expansion project was $1.6 billion. The ramp-up of expanded capacity at AMMC hit a run-rate of 24mt by year end 2013.
An opportunity to 30mtpa concentrate through debottlenecking of existing operations has been identified but related expenditure remains subject to board approval.
b) Ongoing projects refer to projects for which construction has begun (excluding various projects that are under development), or have been placed on hold pending improved operating conditions.
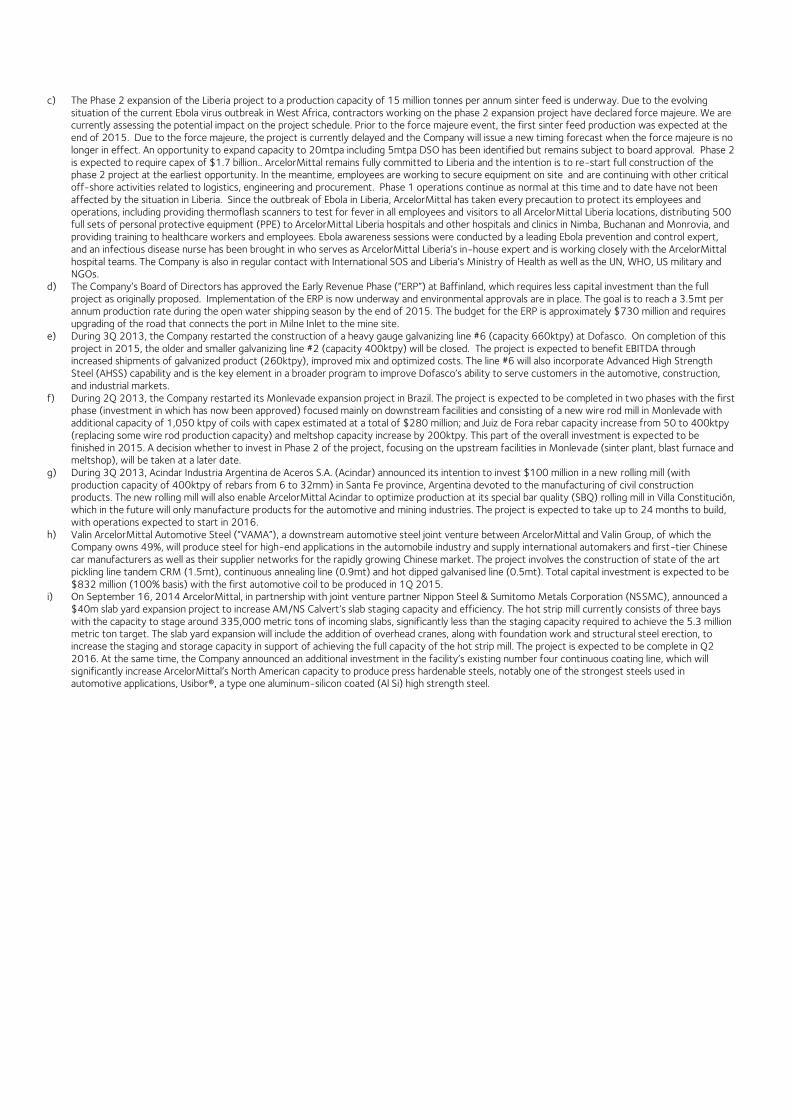
c) The Phase 2 expansion of the Liberia project to a production capacity of 15 million tonnes per annum sinter feed is underway. Due to the evolving situation of the current Ebola virus outbreak in West Africa, contractors working on the phase 2 expansion project have declared force majeure. We are currently assessing the potential impact on the project schedule. Prior to the force majeure event, the first sinter feed production was expected at the end of 2015. Due to the force majeure, the project is currently delayed and the Company will issue a new timing forecast when the force majeure is no longer in effect. An opportunity to expand capacity to 20mtpa including 5mtpa DSO has been identified but remains subject to board approval. Phase 2 is expected to require capex of $1.7 billion.. ArcelorMittal remains fully committed to Liberia and the intention is to re-start full construction of the phase 2 project at the earliest opportunity. In the meantime, employees are working to secure equipment on site and are continuing with other critical off-shore activities related to logistics, engineering and procurement. Phase 1 operations continue as normal at this time and to date have not been affected by the situation in Liberia. Since the outbreak of Ebola in Liberia, ArcelorMittal has taken every precaution to protect its employees and operations, including providing thermoflash scanners to test for fever in all employees and visitors to all ArcelorMittal Liberia locations, distributing 500 full sets of personal protective equipment (PPE) to ArcelorMittal Liberia hospitals and other hospitals and clinics in Nimba, Buchanan and Monrovia, and providing training to healthcare workers and employees. Ebola awareness sessions were conducted by a leading Ebola prevention and control expert, and an infectious disease nurse has been brought in who serves as ArcelorMittal Liberia’s in-house expert and is working closely with the ArcelorMittal hospital teams. The Company is also in regular contact with International SOS and Liberia’s Ministry of Health as well as the UN, WHO, US military and NGOs.
d) The Company’s Board of Directors has approved the Early Revenue Phase (“ERP”) at Baffinland, which requires less capital investment than the full project as originally proposed. Implementation of the ERP is now underway and environmental approvals are in place. The goal is to reach a 3.5mt per annum production rate during the open water shipping season by the end of 2015. The budget for the ERP is approximately $730 million and requires upgrading of the road that connects the port in Milne Inlet to the mine site.
e) During 3Q 2013, the Company restarted the construction of a heavy gauge galvanizing line #6 (capacity 660ktpy) at Dofasco. On completion of this project in 2015, the older and smaller galvanizing line #2 (capacity 400ktpy) will be closed. The project is expected to benefit EBITDA through increased shipments of galvanized product (260ktpy), improved mix and optimized costs. The line #6 will also incorporate Advanced High Strength Steel (AHSS) capability and is the key element in a broader program to improve Dofasco’s ability to serve customers in the automotive, construction, and industrial markets.
f) During 2Q 2013, the Company restarted its Monlevade expansion project in Brazil. The project is expected to be completed in two phases with the first phase (investment in which has now been approved) focused mainly on downstream facilities and consisting of a new wire rod mill in Monlevade with additional capacity of 1,050 ktpy of coils with capex estimated at a total of $280 million; and Juiz de Fora rebar capacity increase from 50 to 400ktpy (replacing some wire rod production capacity) and meltshop capacity increase by 200ktpy. This part of the overall investment is expected to be finished in 2015. A decision whether to invest in Phase 2 of the project, focusing on the upstream facilities in Monlevade (sinter plant, blast furnace and meltshop), will be taken at a later date.
g) During 3Q 2013, Acindar Industria Argentina de Aceros S.A. (Acindar) announced its intention to invest $100 million in a new rolling mill (with production capacity of 400ktpy of rebars from 6 to 32mm) in Santa Fe province, Argentina devoted to the manufacturing of civil construction products. The new rolling mill will also enable ArcelorMittal Acindar to optimize production at its special bar quality (SBQ) rolling mill in Villa Constitución, which in the future will only manufacture products for the automotive and mining industries. The project is expected to take up to 24 months to build, with operations expected to start in 2016.
h) Valin ArcelorMittal Automotive Steel (“VAMA”), a downstream automotive steel joint venture between ArcelorMittal and Valin Group, of which the Company owns 49%, will produce steel for high-end applications in the automobile industry and supply international automakers and first-tier Chinese car manufacturers as well as their supplier networks for the rapidly growing Chinese market. The project involves the construction of state of the art pickling line tandem CRM (1.5mt), continuous annealing line (0.9mt) and hot dipped galvanised line (0.5mt). Total capital investment is expected to be $832 million (100% basis) with the first automotive coil to be produced in 1Q 2015.
i) On September 16, 2014 ArcelorMittal, in partnership with joint venture partner Nippon Steel & Sumitomo Metals Corporation (NSSMC), announced a $40m slab yard expansion project to increase AM/NS Calvert’s slab staging capacity and efficiency. The hot strip mill currently consists of three bays with the capacity to stage around 335,000 metric tons of incoming slabs, significantly less than the staging capacity required to achieve the 5.3 million metric ton target. The slab yard expansion will include the addition of overhead cranes, along with foundation work and structural steel erection, to increase the staging and storage capacity in support of achieving the full capacity of the hot strip mill. The project is expected to be complete in Q2 2016. At the same time, the Company announced an additional investment in the facility’s existing number four continuous coating line, which will significantly increase ArcelorMittal’s North American capacity to produce press hardenable steels, notably one of the strongest steels used in automotive applications, Usibor®, a type one aluminum-silicon coated (Al Si) high strength steel.
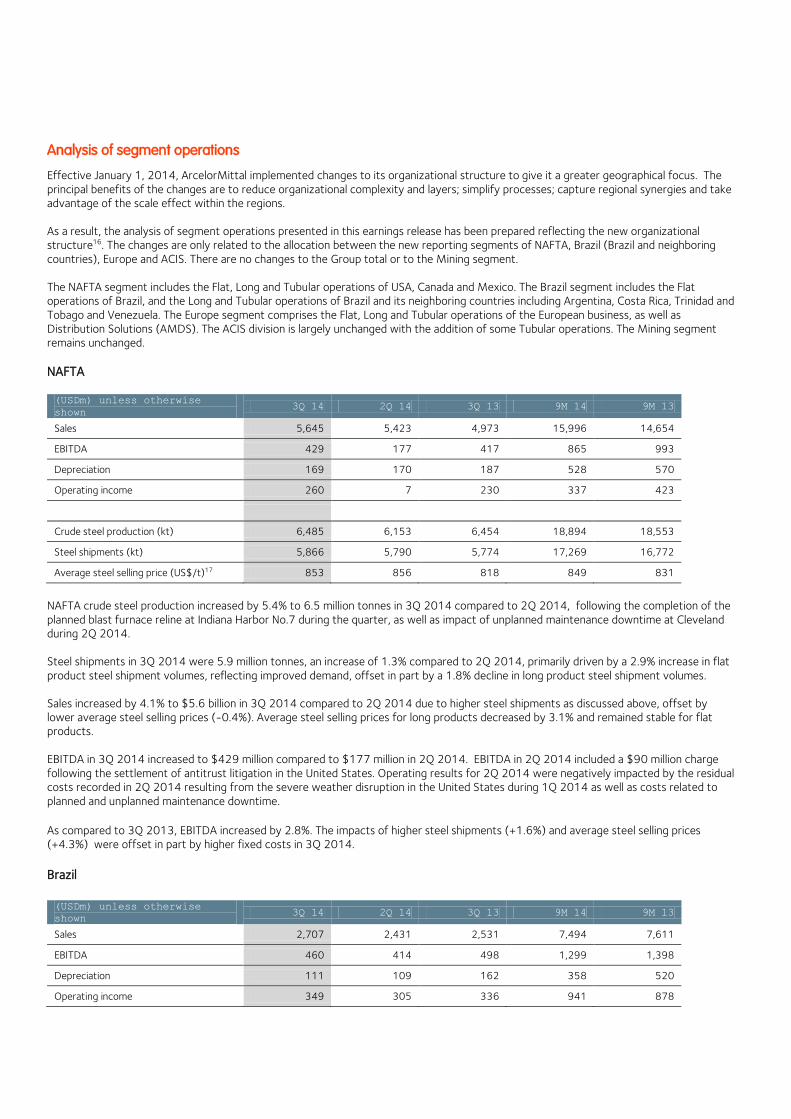
Analysis of segment operations
Effective January 1, 2014, ArcelorMittal implemented changes to its organizational structure to give it a greater geographical focus. The principal benefits of the changes are to reduce organizational complexity and layers; simplify processes; capture regional synergies and take advantage of the scale effect within the regions. As a result, the analysis of segment operations presented in this earnings release has been prepared reflecting the new organizational structure16. The changes are only related to the allocation between the new reporting segments of NAFTA, Brazil (Brazil and neighboring countries), Europe and ACIS. There are no changes to the Group total or to the Mining segment. The NAFTA segment includes the Flat, Long and Tubular operations of USA, Canada and Mexico. The Brazil segment includes the Flat operations of Brazil, and the Long and Tubular operations of Brazil and its neighboring countries including Argentina, Costa Rica, Trinidad and Tobago and Venezuela. The Europe segment comprises the Flat, Long and Tubular operations of the European business, as well as Distribution Solutions (AMDS). The ACIS division is largely unchanged with the addition of some Tubular operations. The Mining segment remains unchanged.
NAFTA (USDm) unless otherwise
shown 3Q 14 2Q 14 3Q 13 9M 14 9M 13
Sales 5,645 5,423 4,973 15,996 14,654
EBITDA 429 177 417 865 993
Depreciation 169 170 187 528 570
Operating income 260 7 230 337 423
Crude steel production (kt) 6,485 6,153 6,454 18,894 18,553
Steel shipments (kt) 5,866 5,790 5,774 17,269 16,772
Average steel selling price (US$/t)17 853 856 818 849 831
NAFTA crude steel production increased by 5.4% to 6.5 million tonnes in 3Q 2014 compared to 2Q 2014, following the completion of the planned blast furnace reline at Indiana Harbor No.7 during the quarter, as well as impact of unplanned maintenance downtime at Cleveland during 2Q 2014. Steel shipments in 3Q 2014 were 5.9 million tonnes, an increase of 1.3% compared to 2Q 2014, primarily driven by a 2.9% increase in flat product steel shipment volumes, reflecting improved demand, offset in part by a 1.8% decline in long product steel shipment volumes. Sales increased by 4.1% to $5.6 billion in 3Q 2014 compared to 2Q 2014 due to higher steel shipments as discussed above, offset by lower average steel selling prices (-0.4%). Average steel selling prices for long products decreased by 3.1% and remained stable for flat products. EBITDA in 3Q 2014 increased to $429 million compared to $177 million in 2Q 2014. EBITDA in 2Q 2014 included a $90 million charge following the settlement of antitrust litigation in the United States. Operating results for 2Q 2014 were negatively impacted by the residual costs recorded in 2Q 2014 resulting from the severe weather disruption in the United States during 1Q 2014 as well as costs related to planned and unplanned maintenance downtime.
As compared to 3Q 2013, EBITDA increased by 2.8%. The impacts of higher steel shipments (+1.6%) and average steel selling prices (+4.3%) were offset in part by higher fixed costs in 3Q 2014.
Brazil
(USDm) unless otherwise
shown 3Q 14 2Q 14 3Q 13 9M 14 9M 13
Sales 2,707 2,431 2,531 7,494 7,611
EBITDA 460 414 498 1,299 1,398
Depreciation 111 109 162 358 520
Operating income 349 305 336 941 878
Crude steel production (kt) 2,971 2,382 2,576 7,766 7,537
Steel shipments (kt) 2,844 2,312 2,559 7,481 7,453
Average steel selling price (US$/t) 866 934 893 896 925
Brazil segment crude steel production increased by 24.7% to 3.0 million tonnes in 3Q 2014 as compared to 2Q 2014, following the restart of ArcelorMittal Tubarão blast furnace No.3 on July 6, 2014. Steel shipments in 3Q 2014 increased by 23% to 2.8 million tonnes compared to 2Q 2014 primarily on account of higher slab shipments from Brazil post restart of blast furnace No.3 at Tubarão as mentioned above. Sales increased by 11.3% to $2.7 billion in 3Q 2014 compared to 2Q 2014. Sales were higher primarily on account of higher steel shipments, offset in part by lower average steel selling prices (-7.3%). Average steel selling price for flat products declined 1.9% excluding the mix impact, while prices for long products were lower by 1.2%.
EBITDA in 3Q 2014 increased 11.1% to $460 million as compared to $414 million in 2Q 2014 primarily on account of higher volumes. EBITDA in 3Q 2014 was lower as compared to 3Q 2013 by 7.5%. EBITDA gain from the additional slab volumes was offset by lower long product shipments and higher fixed costs.
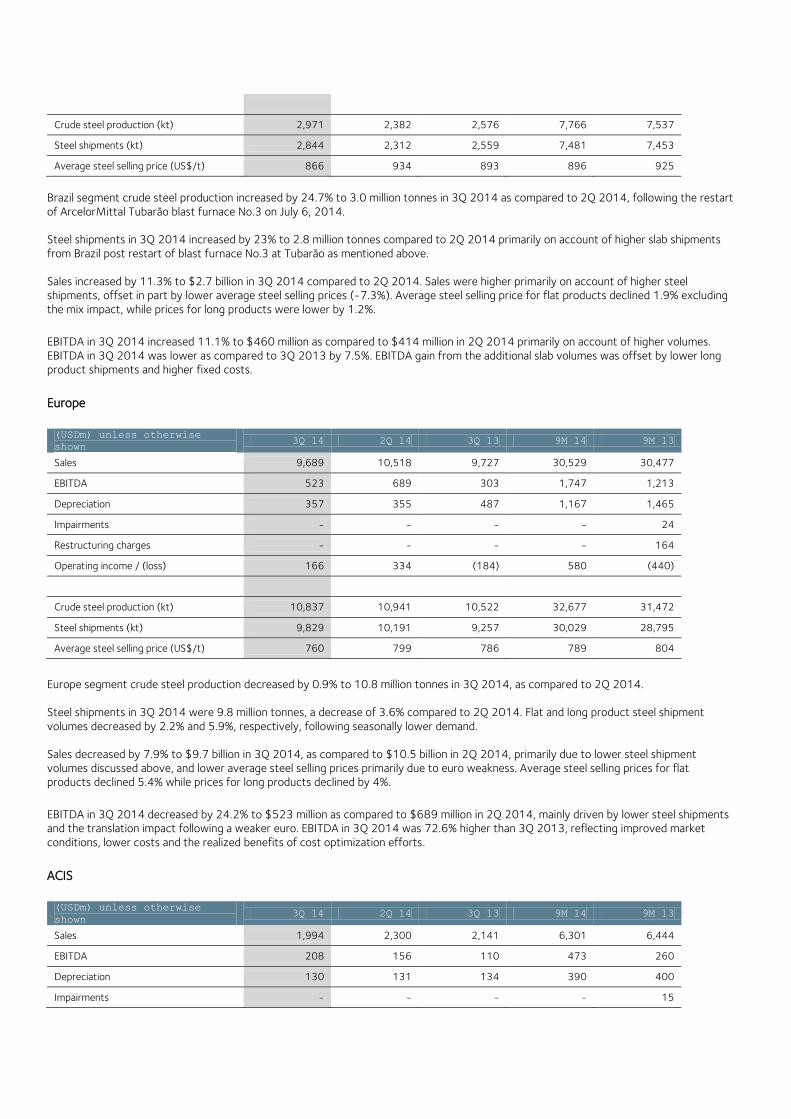
Europe (USDm) unless otherwise
shown 3Q 14 2Q 14 3Q 13 9M 14 9M 13
Sales 9,689 10,518 9,727 30,529 30,477
EBITDA 523 689 303 1,747 1,213
Depreciation 357 355 487 1,167 1,465
Impairments - - - - 24
Restructuring charges - - - - 164
Operating income / (loss) 166 334 (184) 580 (440)
Crude steel production (kt) 10,837 10,941 10,522 32,677 31,472
Steel shipments (kt) 9,829 10,191 9,257 30,029 28,795
Average steel selling price (US$/t) 760 799 786 789 804
Europe segment crude steel production decreased by 0.9% to 10.8 million tonnes in 3Q 2014, as compared to 2Q 2014. Steel shipments in 3Q 2014 were 9.8 million tonnes, a decrease of 3.6% compared to 2Q 2014. Flat and long product steel shipment volumes decreased by 2.2% and 5.9%, respectively, following seasonally lower demand. Sales decreased by 7.9% to $9.7 billion in 3Q 2014, as compared to $10.5 billion in 2Q 2014, primarily due to lower steel shipment volumes discussed above, and lower average steel selling prices primarily due to euro weakness. Average steel selling prices for flat products declined 5.4% while prices for long products declined by 4%.
EBITDA in 3Q 2014 decreased by 24.2% to $523 million as compared to $689 million in 2Q 2014, mainly driven by lower steel shipments and the translation impact following a weaker euro. EBITDA in 3Q 2014 was 72.6% higher than 3Q 2013, reflecting improved market conditions, lower costs and the realized benefits of cost optimization efforts.
ACIS
(USDm) unless otherwise
shown 3Q 14 2Q 14 3Q 13 9M 14 9M 13
Sales 1,994 2,300 2,141 6,301 6,444
EBITDA 208 156 110 473 260
Depreciation 130 131 134 390 400
Impairments - - - - 15
Restructuring charges - - - - 9
Operating income / (loss) 78 25 (24) 83 (164)
Crude steel production (kt) 3,616 3,600 3,710 10,629 10,636
Steel shipments (kt) 3,229 3,306 3,208 9,722 9,413
Average steel selling price (US$/t) 594 592 607 584 619
ACIS segment crude steel production in 3Q 2014 was stable at 3.6 million tonnes as compared to 2Q 2014. Production was higher in Kazakhstan and Ukraine, offset in part by lower production in South Africa following the on-going reline of the Newcastle blast furnace, which commenced during 2Q 2014. Steel shipments in 3Q 2014 were 3.2 million tonnes, a decrease of 2.3% compared to 2Q 2014, primarily driven by lower exports. Sales decreased by 13.3% to $2.0 billion in 3Q 2014, compared to $2.3 billion in 2Q 2014, primarily due to lower sales of non-steel products and lower steel shipment volumes discussed above. EBITDA in 3Q 2014 increased by 33.7% to $208 million, compared to $156 million in 2Q 2014, due to improved performance (prices and costs) in the CIS countries. EBITDA in 3Q 2014 increased by 89.5% to $208 million, compared to $110 million in 3Q 2013, due to higher steel shipments (+0.7%), improved operations and lower costs primarily in the CIS.
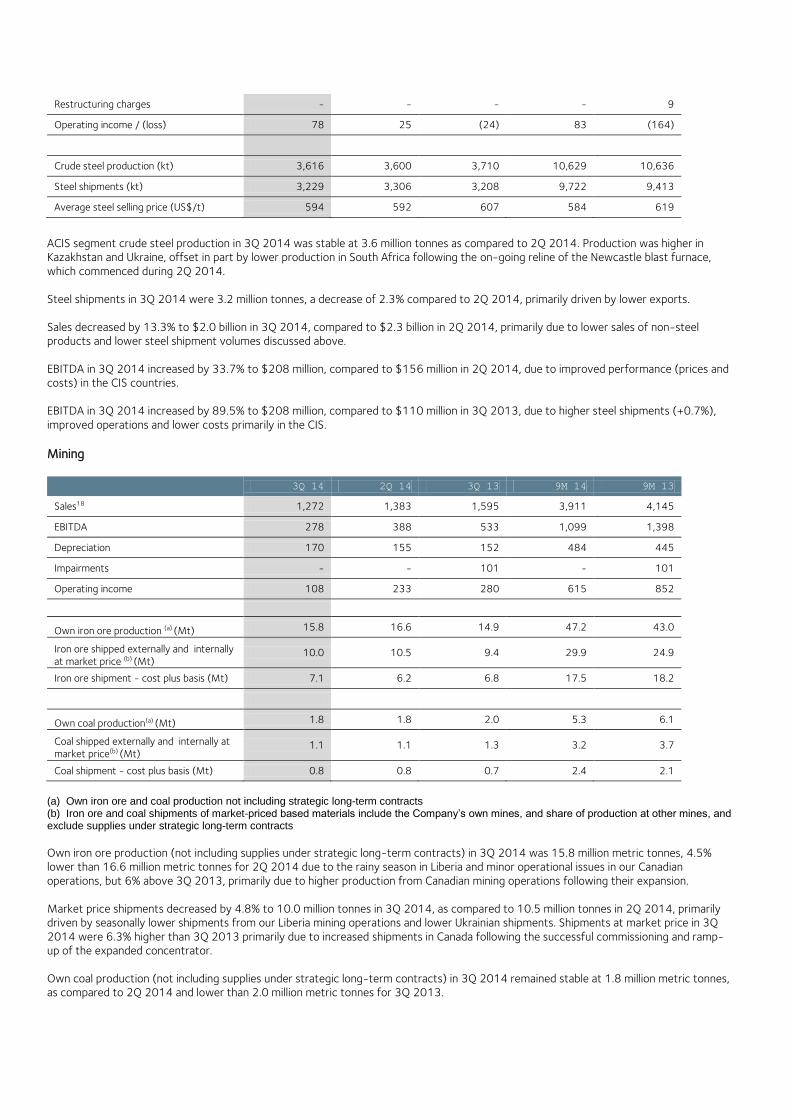
Mining
3Q 14 2Q 14 3Q 13 9M 14 9M 13
Sales18 1,272 1,383 1,595 3,911 4,145
EBITDA 278 388 533 1,099 1,398
Depreciation 170 155 152 484 445
Impairments - - 101 - 101
Operating income 108 233 280 615 852
Own iron ore production (a) (Mt) 15.8 16.6 14.9 47.2 43.0
Iron ore shipped externally and internally at market price (b) (Mt)
10.0 10.5 9.4 29.9 24.9
Iron ore shipment - cost plus basis (Mt) 7.1 6.2 6.8 17.5 18.2
Own coal production(a) (Mt) 1.8 1.8 2.0 5.3 6.1
Coal shipped externally and internally at market price(b) (Mt)
1.1 1.1 1.3 3.2 3.7
Coal shipment - cost plus basis (Mt) 0.8 0.8 0.7 2.4 2.1
(a) Own iron ore and coal production not including strategic long-term contracts (b) Iron ore and coal shipments of market-priced based materials include the Company’s own mines, and share of production at other mines, and exclude supplies under strategic long-term contracts
Own iron ore production (not including supplies under strategic long-term contracts) in 3Q 2014 was 15.8 million metric tonnes, 4.5% lower than 16.6 million metric tonnes for 2Q 2014 due to the rainy season in Liberia and minor operational issues in our Canadian operations, but 6% above 3Q 2013, primarily due to higher production from Canadian mining operations following their expansion. Market price shipments decreased by 4.8% to 10.0 million tonnes in 3Q 2014, as compared to 10.5 million tonnes in 2Q 2014, primarily driven by seasonally lower shipments from our Liberia mining operations and lower Ukrainian shipments. Shipments at market price in 3Q 2014 were 6.3% higher than 3Q 2013 primarily due to increased shipments in Canada following the successful commissioning and ramp-up of the expanded concentrator. Own coal production (not including supplies under strategic long-term contracts) in 3Q 2014 remained stable at 1.8 million metric tonnes, as compared to 2Q 2014 and lower than 2.0 million metric tonnes for 3Q 2013.
EBITDA for 3Q 2014 was $278 million, 28.4% lower as compared to $388 million in 2Q 2014, primarily due to lower seaborne iron ore market prices, offset in part by lower costs. EBITDA for 3Q 2014 was lower as compared to $533 million in 3Q 2013, primarily due to lower seaborne iron ore market prices, partially offset by higher market priced shipments and lower costs.
Liquidity and Capital Resources
For 3Q 2014, net cash provided by operating activities was $501 million, as compared to net cash provided by operating activities of $1,548 million in 2Q 2014. Cash used by operating activities in 3Q 2014 included a $576 million investment of operating working capital as compared to a $856 million release of operating working capital in 2Q 2014. Rotation days19 during 3Q 2014 were stable at 54 days as compared to 2Q 2014 primarily on account of foreign exchange. Net cash provided by other operating activities in 3Q 2014 was $251 million (including reversals of non cash items related to the Siderbras tax amnesty settlement), as compared to net cash used by other operating activities in 2Q 2014 of $384 million (including amongst others the Senegal settlement payment, changes in other payables, such as employee benefits and the adjustments of non-cash items such as income from associates and forex gains partially offset by non-cash gains and losses on convertible bonds and hedging instruments that matured during the quarter). Net cash used in investing activities during 3Q 2014 was $888 million, as compared to $607 million in 2Q 2014. Capital expenditure increased to $949 million in 3Q 2014 as compared to $774 million in 2Q 2014. The Company now expects full year 2014 capital expenditure to be approximately $3.8 billion. Cash flow from other investing activities in 3Q 2014 of $61 million primarily included cash inflow from the divesture of Circuit Foil20. Other investing activities in 2Q 2014 of $167 million primarily included cash inflow from the divestures of the ATIC21 group and the steel cord business22. Net cash provided by financing activities for 3Q 2014 was $294 million as compared to net cash used in financing activities of $1.7 billion in 2Q 2014. Net cash provided by financing activities for 3Q 2014 primarily included inflow related to issuance of $805 million (€600 million) 2.875 per cent Notes due July 6, 2020 under the €3 billion wholesale Euro Medium Term Notes Programme offset by $136 million (€100 million) bond repayment. Net cash used in financing activities for 2Q 2014 primarily included debt repayment of $2.7 billion (primarily €1.25 billion for the 7.25% convertible bonds due April 1, 2014 and $800 million for the 5.00% convertible bonds due May 15, 2014), offset in part by a new bank loan of $1.0 billion. Net cash used in financing activities for 3Q 2013 included an early debt repayment of $0.8 billion following the completion of a cash tender offer to purchase any and all of the 6.5% U.S. dollar denominated Notes due in April 2014 (“the $ 2014 Notes”) and the 4.625% EURO denominated Notes due in November 2014 (“the € 2014 Notes”), as well as to prepay €125 million of 6.2% Fixed Rate Notes maturing in 2016 and $120 million of 6.38% privately placed Notes maturing in 2015. The Group purchased $311.5 million principal amount of the $ 2014 Notes for a total aggregate purchase price (including accrued interest) of $327.8 million and €139.5 million of the € 2014 Notes for a total aggregate purchase price (including accrued interest) of €150.1 million. During 3Q 2014, the Company paid dividends amounting to $381 million as compared to $5 million for 2Q 2014 and $364 million in 3Q 2013. Dividends for 3Q 2014 include $328 million paid to ArcelorMittal shareholders and $53 million paid to minority shareholders. At September 30, 2014, the Company’s cash and cash equivalents (including restricted cash) and short-term investments amounted to $4.2 billion as compared to $4.4 billion at June 30, 2014. Gross debt of $21.9 billion at September 30, 2014, increased slightly from $21.8 billion at June 30, 2014. As of September 30, 2014, net debt was $17.8 billion as compared with $17.4 billion at June 30, 2014, primarily driven by decreased cash flow from operations (in particular due to the investment in working capital of $0.6 billion) and payment of annual dividends ($0.4 billion), offset in part by forex effects ($0.5 billion).
The Company had liquidity23 of $10.2 billion at September 30, 2014, consisting of cash and cash equivalents (including restricted cash and short-term investments) of $4.2 billion and $6.0 billion of available credit lines. On September 30, 2014, the average debt maturity was 6.1 years.
On October 30, 2014, the Company redeemed its 9.0% Notes due February 15, 2015 and its 3.750% Notes due February 25, 2015 prior to their scheduled maturity. For purposes of the Company’s debt maturity profile table, these two issuances will be considered excluded from 2015 debt repayments and included in 2014 debt repayments.
Key recent developments
• On October 28, 2014, ArcelorMittal announced that Sudhir Maheshwari, member of the Group Management Board, with responsibility for corporate finance; mergers, acquisitions and divestments; risk management; and India and China, is leaving the company to pursue other opportunities effective March 31, 2015.
• Further, the Company announced important organizational moves to enhance performance in North America, where operations represent one quarter of the company’s steel shipments and profits. The efforts are focused on improving operational performance in North America and accelerating the successful integration of AM/NS Calvert. This strategy involves the establishment of a North American flat-rolled business to provide operational leadership and coordination to ArcelorMittal’s North America operations, particularly flat operations in the USA, AM/NS Calvert, and ArcelorMittal Dofasco.
On October 8, 2014, ArcelorMittal and Gerdau jointly announced completion of the sale of their respective 50% interests in Gallatin Steel Company ("Gallatin") to Nucor Corporation. The sale was completed for a total cash consideration of $770 million. Gallatin is a flat rolled mini-mill located in Gallatin County, Kentucky, USA that melts scrap, pig iron and hot briquetted iron from various sources, and processes the material to produce flat rolled steel. Gallatin’s high quality assets produce a wide range of steels from low to high carbon grades with an annual capacity of around 1.8 million tons.
On September 16, 2014 ArcelorMittal, in partnership with joint venture partner Nippon Steel & Sumitomo Metals Corporation (NSSMC), announced a US$40m slab yard expansion project to increase AM/NS Calvert’s slab staging capacity and efficiency. The hot strip mill currently consists of three bays with the capacity to stage around 335,000 metric tons of incoming slabs, significantly less than the staging capacity required to achieve the 5.3 million metric ton target. The slab yard expansion will include the addition of overhead cranes, along with foundation work and structural steel erection, to increase the staging and storage capacity in support of achieving the full capacity of the hot strip mill. The project is expected to be complete in Q2 2016. At the same time, the Company announced an additional investment in the facility’s existing continuous coating line #4, which will increase ArcelorMittal’s North American capacity to produce press hardenable steels, notably one of the strongest steels used in automotive applications, Usibor®, a type one aluminum-silicon coated (Al Si) high strength steel.
On September 2, 2014, ArcelorMittal unveiled a new range of steels for the automotive industry that offers significant weight savings while improving safety. Following an ambitious investment programme in Europe and the Americas, the Fortiform® range – which was developed by the Company’s research and development teams in Maizières-lès-Metz, France and East Chicago, USA - will initially be produced and developed at two ArcelorMittal sites in Belgium: Gent and Kessales (Liège). This is the first step in a more ambitious investment programme which will expand development to include production in NAFTA and further investments in all regions to follow customer demand. In the meantime, the product will be exported from Europe.
Outlook and guidance
Operating conditions remain generally favorable. The impact of declining iron ore prices on Mining segment profitability is being offset by improvement in the steel business. As a result, the Company reiterates its guidance for EBITDA in excess of $7.0 billion in 2014. Based on the current economic outlook, ArcelorMittal continues to expect global apparent steel consumption (“ASC”) to increase by approximately 2.25-2.75% in 2014. Steel demand in the US has been strong and US ASC growth in 2014 has been upgraded to a forecast range of 8.25-8.75%. Demand conditions in Europe have also remained robust during the seasonally weak summer period, and we maintain ASC growth expectations in 2014 of 3-3.5%. In China, we see signs of stabilization due to the government’s targeted stimulus, and expect steel demand in the range of 1.5-2.0%. While risks remain to steel demand in the CIS and other emerging markets including Brazil, the stronger fundamentals in our key developed world markets continue to support our expectation that steel shipments should increase by approximately 3% in 2014 as compared to 2013. Following the successful ramp up of expanded capacity at ArcelorMittal Mines Canada, year-on-year increases in market-priced iron ore shipments are expected. This should underpin a 15% expansion of marketable iron ore volumes for the Company in 2014 as compared to 2013. Due to improved industry utilization rates, and the further contribution of the Company’s Asset Optimization and Management Gains cost optimization programs, steel margins are expected to improve in 2014.
Furthermore, the Company now expects net interest expense to be approximately $1.5 billion in 2014 as compared to $1.8 billion in 2013, due primarily to lower average debt. Capital expenditure is expected to be approximately $3.8 billion for 2014. As previously communicated, the Company does not intend to consider a ramp-up in any major steel growth capex or an increase in dividends until the medium term $15 billion net debt target has been achieved and market conditions improve.
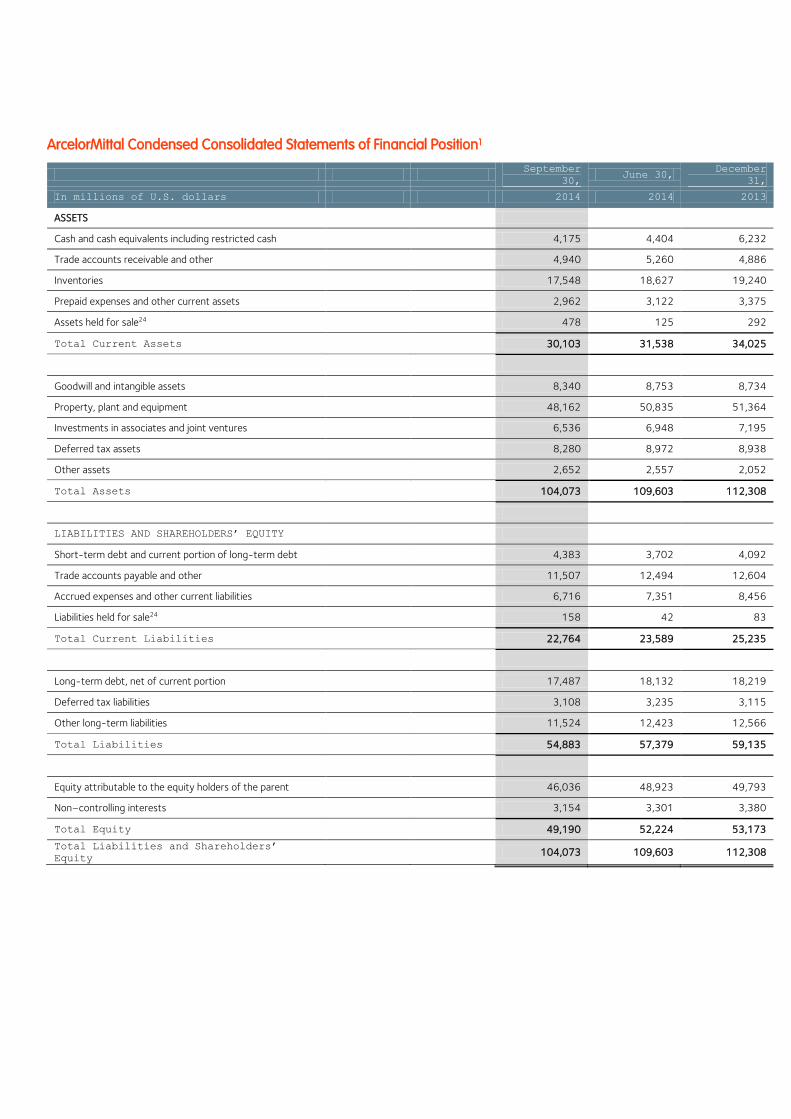
ArcelorMittal Condensed Consolidated Statements of Financial Position1
September
30, June 30,
December
31,
In millions of U.S. dollars 2014 2014 2013
ASSETS
Cash and cash equivalents including restricted cash 4,175 4,404 6,232
Trade accounts receivable and other 4,940 5,260 4,886
Inventories 17,548 18,627 19,240
Prepaid expenses and other current assets 2,962 3,122 3,375
Assets held for sale24 478 125 292
Total Current Assets 30,103 31,538 34,025
Goodwill and intangible assets 8,340 8,753 8,734
Property, plant and equipment 48,162 50,835 51,364
Investments in associates and joint ventures 6,536 6,948 7,195
Deferred tax assets 8,280 8,972 8,938
Other assets 2,652 2,557 2,052
Total Assets 104,073 109,603 112,308
LIABILITIES AND SHAREHOLDERS’ EQUITY
Short-term debt and current portion of long-term debt 4,383 3,702 4,092
Trade accounts payable and other 11,507 12,494 12,604
Accrued expenses and other current liabilities 6,716 7,351 8,456
Liabilities held for sale24 158 42 83
Total Current Liabilities 22,764 23,589 25,235
Long-term debt, net of current portion 17,487 18,132 18,219
Deferred tax liabilities 3,108 3,235 3,115
Other long-term liabilities 11,524 12,423 12,566
Total Liabilities 54,883 57,379 59,135
Equity attributable to the equity holders of the parent 46,036 48,923 49,793
Non–controlling interests 3,154 3,301 3,380
Total Equity 49,190 52,224 53,173
Total Liabilities and Shareholders’
Equity 104,073 109,603 112,308
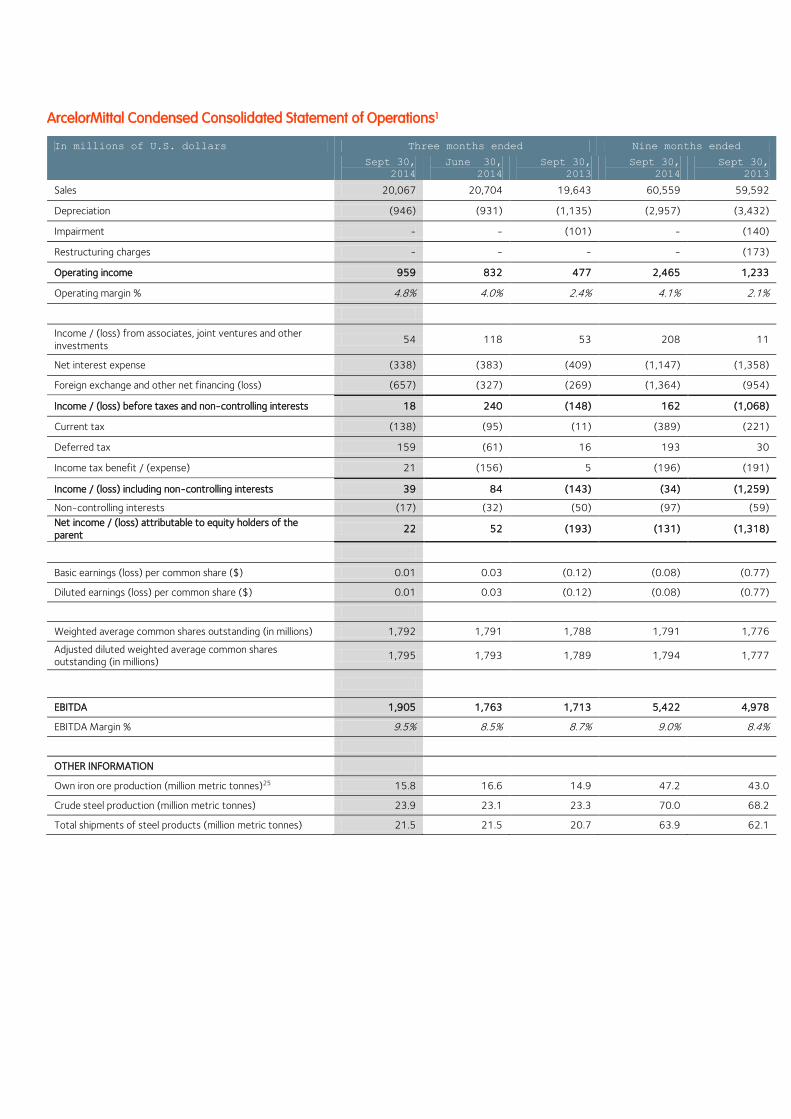
ArcelorMittal Condensed Consolidated Statement of Operations1
In millions of U.S. dollars Three months ended Nine months ended
Sept 30,
2014
June 30,
2014
Sept 30,
2013
Sept 30,
2014
Sept 30,
2013
Sales 20,067 20,704 19,643 60,559 59,592
Depreciation (946) (931) (1,135) (2,957) (3,432)
Impairment - - (101) - (140)
Restructuring charges - - - - (173)
Operating income 959 832 477 2,465 1,233
Operating margin % 4.8% 4.0% 2.4% 4.1% 2.1%
Income / (loss) from associates, joint ventures and other investments
54 118 53 208 11
Net interest expense (338) (383) (409) (1,147) (1,358)
Foreign exchange and other net financing (loss) (657) (327) (269) (1,364) (954)
Income / (loss) before taxes and non-controlling interests 18 240 (148) 162 (1,068)
Current tax (138) (95) (11) (389) (221)
Deferred tax 159 (61) 16 193 30
Income tax benefit / (expense) 21 (156) 5 (196) (191)
Income / (loss) including non-controlling interests 39 84 (143) (34) (1,259)
Non-controlling interests (17) (32) (50) (97) (59)
Net income / (loss) attributable to equity holders of the parent
22 52 (193) (131) (1,318)
Basic earnings (loss) per common share ($) 0.01 0.03 (0.12) (0.08) (0.77)
Diluted earnings (loss) per common share ($) 0.01 0.03 (0.12) (0.08) (0.77)
Weighted average common shares outstanding (in millions) 1,792 1,791 1,788 1,791 1,776
Adjusted diluted weighted average common shares outstanding (in millions)
1,795 1,793 1,789 1,794 1,777
EBITDA 1,905 1,763 1,713 5,422 4,978
EBITDA Margin % 9.5% 8.5% 8.7% 9.0% 8.4%
OTHER INFORMATION
Own iron ore production (million metric tonnes)25 15.8 16.6 14.9 47.2 43.0
Crude steel production (million metric tonnes) 23.9 23.1 23.3 70.0 68.2
Total shipments of steel products (million metric tonnes) 21.5 21.5 20.7 63.9 62.1
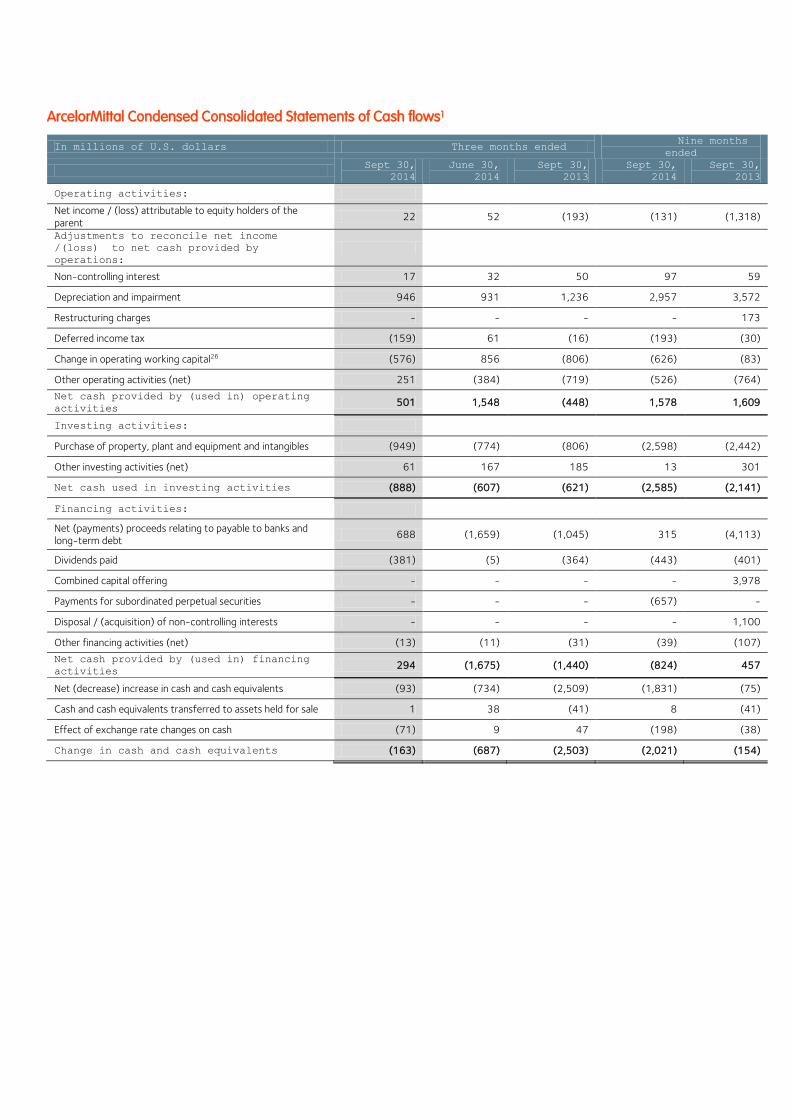
ArcelorMittal Condensed Consolidated Statements of Cash flows1
In millions of U.S. dollars Three months ended Nine months
ended
Sept 30,
2014
June 30,
2014
Sept 30,
2013
Sept 30,
2014
Sept 30,
2013
Operating activities:
Net income / (loss) attributable to equity holders of the parent
22 52 (193) (131) (1,318)
Adjustments to reconcile net income
/(loss) to net cash provided by
operations:
Non-controlling interest 17 32 50 97 59
Depreciation and impairment 946 931 1,236 2,957 3,572
Restructuring charges - - - - 173
Deferred income tax (159) 61 (16) (193) (30)
Change in operating working capital26 (576) 856 (806) (626) (83)
Other operating activities (net) 251 (384) (719) (526) (764)
Net cash provided by (used in) operating
activities 501 1,548 (448) 1,578 1,609
Investing activities:
Purchase of property, plant and equipment and intangibles (949) (774) (806) (2,598) (2,442)
Other investing activities (net) 61 167 185 13 301
Net cash used in investing activities (888) (607) (621) (2,585) (2,141)
Financing activities:
Net (payments) proceeds relating to payable to banks and long-term debt
688 (1,659) (1,045) 315 (4,113)
Dividends paid (381) (5) (364) (443) (401)
Combined capital offering - - - - 3,978
Payments for subordinated perpetual securities - - - (657) -
Disposal / (acquisition) of non-controlling interests - - - - 1,100
Other financing activities (net) (13) (11) (31) (39) (107)
Net cash provided by (used in) financing
activities 294 (1,675) (1,440) (824) 457
Net (decrease) increase in cash and cash equivalents (93) (734) (2,509) (1,831) (75)
Cash and cash equivalents transferred to assets held for sale 1 38 (41) 8 (41)
Effect of exchange rate changes on cash (71) 9 47 (198) (38)
Change in cash and cash equivalents (163) (687) (2,503) (2,021) (154)
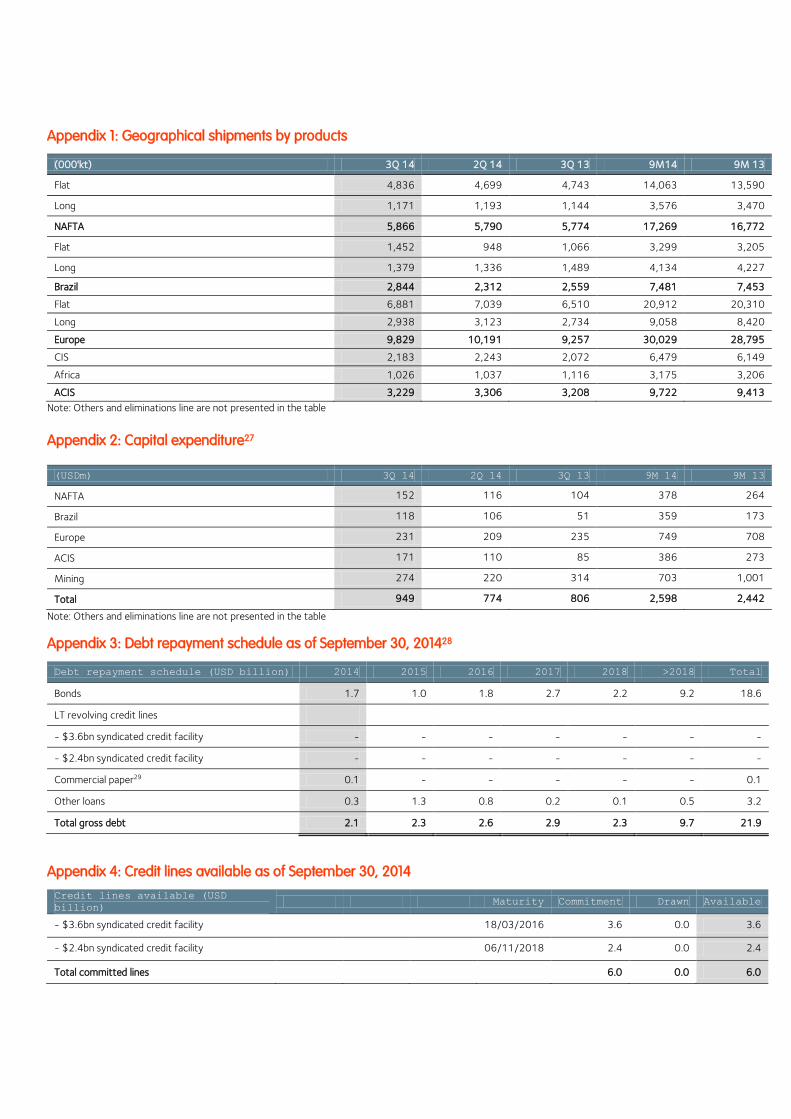
Appendix 1: Geographical shipments by products
(000'kt) 3Q 14 2Q 14 3Q 13 9M14 9M 13
Flat 4,836 4,699 4,743 14,063 13,590
Long 1,171 1,193 1,144 3,576 3,470
NAFTA 5,866 5,790 5,774 17,269 16,772
Flat 1,452 948 1,066 3,299 3,205
Long 1,379 1,336 1,489 4,134 4,227
Brazil 2,844 2,312 2,559 7,481 7,453
Flat 6,881 7,039 6,510 20,912 20,310
Long 2,938 3,123 2,734 9,058 8,420
Europe 9,829 10,191 9,257 30,029 28,795
CIS 2,183 2,243 2,072 6,479 6,149
Africa 1,026 1,037 1,116 3,175 3,206
ACIS 3,229 3,306 3,208 9,722 9,413
Note: Others and eliminations line are not presented in the table
Appendix 2: Capital expenditure27
(USDm) 3Q 14 2Q 14 3Q 13 9M 14 9M 13
NAFTA 152 116 104 378 264
Brazil 118 106 51 359 173
Europe 231 209 235 749 708
ACIS 171 110 85 386 273
Mining 274 220 314 703 1,001
Total 949 774 806 2,598 2,442
Note: Others and eliminations line are not presented in the table
Appendix 3: Debt repayment schedule as of September 30, 201428
Debt repayment schedule (USD billion) 2014 2015 2016 2017 2018 >2018 Total
Bonds 1.7 1.0 1.8 2.7 2.2 9.2 18.6
LT revolving credit lines
- $3.6bn syndicated credit facility - - - - - - -
- $2.4bn syndicated credit facility - - - - - - -
Commercial paper29 0.1 - - - - - 0.1
Other loans 0.3 1.3 0.8 0.2 0.1 0.5 3.2
Total gross debt 2.1 2.3 2.6 2.9 2.3 9.7 21.9
Appendix 4: Credit lines available as of September 30, 2014
Credit lines available (USD
billion) Maturity Commitment Drawn Available
- $3.6bn syndicated credit facility 18/03/2016 3.6 0.0 3.6
- $2.4bn syndicated credit facility 06/11/2018 2.4 0.0 2.4
Total committed lines 6.0 0.0 6.0
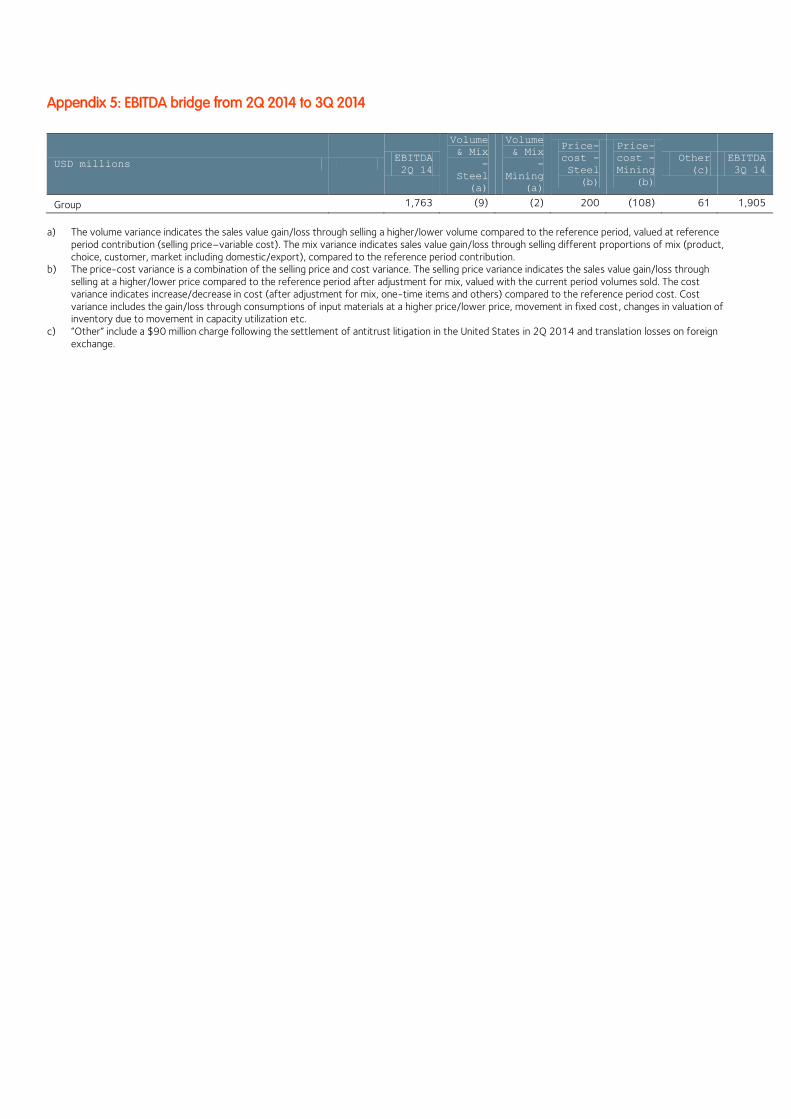
Appendix 5: EBITDA bridge from 2Q 2014 to 3Q 2014
USD millions EBITDA
2Q 14
Volume
& Mix
-
Steel
(a)
Volume
& Mix
-
Mining
(a)
Price-
cost -
Steel
(b)
Price-
cost -
Mining
(b)
Other
(c)
EBITDA
3Q 14
Group 1,763 (9) (2) 200 (108) 61 1,905
a) The volume variance indicates the sales value gain/loss through selling a higher/lower volume compared to the reference period, valued at reference
period contribution (selling price–variable cost). The mix variance indicates sales value gain/loss through selling different proportions of mix (product, choice, customer, market including domestic/export), compared to the reference period contribution.
b) The price-cost variance is a combination of the selling price and cost variance. The selling price variance indicates the sales value gain/loss through selling at a higher/lower price compared to the reference period after adjustment for mix, valued with the current period volumes sold. The cost variance indicates increase/decrease in cost (after adjustment for mix, one-time items and others) compared to the reference period cost. Cost variance includes the gain/loss through consumptions of input materials at a higher price/lower price, movement in fixed cost, changes in valuation of inventory due to movement in capacity utilization etc.
c) “Other” include a $90 million charge following the settlement of antitrust litigation in the United States in 2Q 2014 and translation losses on foreign exchange.
1 The financial information in this press release has been prepared consistently with International Financial Reporting Standards (“IFRS”) as issued by the
International Accounting Standards Board (“IASB”). While the interim financial information included in this announcement has been prepared in accordance with IFRS applicable to interim periods, this announcement does not contain sufficient information to constitute an interim financial report as defined in International Accounting Standards 34, “Interim Financial Reporting”. The numbers in this press release have not been audited. The financial information and certain other information presented in a number of tables in this press release have been rounded to the nearest whole number or the nearest decimal. Therefore, the sum of the numbers in a column may not conform exactly to the total figure given for that column. In addition, certain percentages presented in the tables in this press release reflect calculations based upon the underlying information prior to rounding and, accordingly, may not conform exactly to the percentages that would be derived if the relevant calculations were based upon the rounded numbers. This press release also includes certain non-GAAP financial measures.
2 Lost time injury frequency rate equals lost time injuries per 1,000,000 worked hours, based on own personnel and contractors. 3 EBITDA is defined as operating income plus depreciation, impairment expenses and restructuring charges / exceptional items. 4 Market priced tonnes represent amounts of iron ore and coal from ArcelorMittal mines that could be sold to third parties on the open market. Market
priced tonnes that are not sold to third parties are transferred from the Mining segment to the Company’s steel producing segments and reported at the prevailing market price. Shipments of raw materials that do not constitute market-priced tonnes are transferred internally and reported on a cost-plus basis.
5 Net debt refers to long-term debt, plus short term debt, less cash and cash equivalents, restricted cash and short-term investments (including those held as part of asset/liabilities held for sale). As at September 30, 2014 net debt included $0.1 billion relating to distribution centers in Europe held for sale.
6 On October 8, 2014, ArcelorMittal and Gerdau jointly announced completion of the sale of their respective 50% interests in Gallatin Steel Company ("Gallatin") to Nucor Corporation. The sale was completed for a total cash consideration of $770 million (of which $385 million cash due to ArcelorMittal and paid in 4Q 2014) and a gain on disposal of approximately $0.2 billion is expected to be recorded in income from associates, joint ventures and other investments in 4Q 2014. Gallatin is a flat rolled mini-mill located in Gallatin County, Kentucky, USA that melts scrap, pig iron and hot briquetted iron from various sources, and processes the material to produce flat rolled steel. Gallatin’s high quality assets produce a wide range of steels from low to high carbon grades with an annual capacity of around 1.8 million tons.
7 EBITDA/t is calculated as total Group EBITDA divided by total steel shipments. 8 Iron ore prices for 62% Fe CFR China 9 In 2007, ArcelorMittal Holdings AG entered into an agreement with the State of Senegal relating to an integrated iron ore mining and related
infrastructure project. The Company announced at the time that implementation of the project would entail an aggregate investment of $2.2 billion. Project implementation did not follow the originally anticipated schedule after initial phase studies and related investments. The Company engaged in discussions with the State of Senegal about the project over a long period. In early 2011, the parties engaged in a conciliation procedure, as provided for under their agreement, in an attempt to reach a mutually acceptable outcome. Following the unsuccessful completion of this procedure, in May 2011, the State of Senegal commenced an arbitration before the Court of Arbitration of the International Chamber of Commerce, claiming breach of contract and provisionally estimating damages of $750 million. In September 2013, the arbitral Tribunal issued its first award and decided that Senegal was entitled to terminate the 2007 agreements. The Tribunal also indicated that a new arbitration phase would be held to decide upon the liability of ArcelorMittal as well as the amount of any damages which could be awarded to Senegal. As a result, ArcelorMittal impaired the entire amount of the investment made up to September 30, 2013. A settlement was subsequently reached with the State of Senegal in respect of this arbitration and paid in 2Q 2014.
10 On October 21, 2014, the U.S. District Court for the Northern District of Illinois issued its final approval of a settlement in relation to the direct purchaser claims that had been consolidated with the Standard Iron Works lawsuit filed against the Company. The two putative class actions that had been filed against the Company on behalf of indirect purchasers are not covered by the settlement, nor are any future claims filed by direct purchasers that chose to opt-out of the settlement.
11 On February 26, 2014, ArcelorMittal, together with Nippon Steel & Sumitomo Metal Corporation (“NSSMC”), announced that it has completed the acquisition of ThyssenKrupp Steel USA (“TK Steel USA”), a steel processing plant in Calvert, Alabama, having received all necessary regulatory approvals. The transaction – a 50/50 joint venture with NSSMC – was completed for an agreed price of $1,550 million plus working capital and net debt adjustment. ArcelorMittal paid $258 million cash for the acquisition in 1Q 2014. The Calvert plant has a total capacity of 5.3 million tons including hot rolling, cold rolling, coating and finishing lines.
12 Foreign exchange and other net financing costs include foreign currency swaps, bank fees, interest on pensions, impairments of financial instruments and revaluation of derivative instruments, and other charges that cannot be directly linked to operating results.
13 ArcelorMittal Brasil S/A (as a successor of Companhia Siderurgica Tubarao) was party to a legal dispute against Siderbras (an extinguished holding company held by the Government of Brazil) related to financial debt issued in 1992. In July 2014, the judge in charge requested to replace the guarantee, which was securing the litigation, with cash so that an appeal of the case could proceed. ArcelorMittal Brasil S/A entered into a federal amnesty program with the Brazilian tax authorities to settle the debt with Siderbras (application made in August 2014). The payment under the program is $161 million (original debt $259 million including interest and penalties) and recorded as a financial expense. Of this amount, $82 million will be by way of set-off of tax losses and the remaining balance paid in cash ($79 million). The cash payment will be settled in 30 monthly instalments. This tax amnesty program entered into by the Company with the Brazilian tax authorities is only in relation to the Siderbras matter and does not have any effect or otherwise impact the Company’s other outstanding disputes with the Brazilian tax authorities, which have been previously disclosed.
14 The Company recorded a total of $133 million of deferred tax assets for losses of previous years in the framework of Federal Amnesty programmes in Brazil (including $82 million from the Siderbras case and $51 million in relation to the existing amnesty debts signed during 4Q 2013 which are now allowed to be partially offset with tax losses).
15 The Company’s interest in the associate Hunan Valin Steel Tube and Wire Co. Ltd. (“Hunan Valin”) decreased from 30% to 20% following the sale of a 10% stake to Hunan Valin Iron & Steel Group Co, Ltd. (“Valin Group”) as a result of the exercise of the first and second put options on February 6, 2013 and August 6, 2013, respectively. The total consideration received for the sale for the first and second option was $194 million, of which $169 million was reinvested into a capital increase and the acquisition of an additional 16% interest in Valin ArcelorMittal Automotive Steel (“VAMA”), a downstream automotive steel joint venture between ArcelorMittal and Valin Group in which the Company increased accordingly its stake from 33% to 49%. The Company’s interest in Hunan Valin decreased from 20% to 15% following the sale of a 5% stake to Valin Group as a result of the exercise of the third put option on February 8, 2014. The Company exercised the fourth and final instalment on August 6, 2014. Completion of the transaction is subject to regulatory approval. The Company expects cash from the third installment of $107 million due in fourth quarter of 2014 and fourth installment of $107 million in 1H 2015.
16 Shipments information at the Group level was previously based on a simple aggregation, eliminating intra-segment shipments and excluding shipments
of the Distribution Solutions segment. The new presentation of shipments information eliminates both inter- and intra–segment shipments which are primarily between Flat/Long plants and Tubular plants and continues to exclude the shipments of Distribution Solutions.
17 Average steel selling prices are calculated as steel sales divided by steel shipments. 18 There are three categories of sales: 1) “External sales”: mined product sold to third parties at market price; 2) “Market-priced tonnes”: internal sales of
mined product to ArcelorMittal facilities and reported at prevailing market prices; 3) “Cost-plus tonnes” - internal sales of mined product to ArcelorMittal facilities on a cost-plus basis. The determinant of whether internal sales are reported at market price or cost-plus is whether the raw material could practically be sold to third parties (i.e. there is a potential market for the product and logistics exist to access that market).
19 Rotation days are defined as days of accounts receivable plus days of inventory minus days of accounts payable. Days of accounts payable and inventory are a function of cost of goods sold of the quarter on an annualized basis. Days of accounts receivable are a function of sales of the quarter on an annualized basis.
20 Pursuant to a sale and purchase agreement entered into on July 10, 2014 with Doosan (a South Korean conglomerate), ArcelorMittal sold all of the shares of Circuit Foil Luxembourg Sarl (CFL), together with some of its subsidiaries, for cash consideration of $49 million.
21 On April 30, 2014, ArcelorMittal and H.E.S. Beheer N.V. signed a sale and purchase agreement for the sale of ArcelorMittal’s 78% stake in European port handling and logistics company ATIC Services S.A. (“ATIC”) to HES Beheer for €155 million ($212 million). The net proceeds received are $144 million being $212 million cash proceeds minus cash held by ATIC. Additionally, $17 million debt held by ATIC has been transferred. The transaction is consistent with ArcelorMittal’s stated strategy of selective divestment of non-core assets. The transaction was completed on June 30, 2014.
22 On December 9, 2013, ArcelorMittal signed an agreement with Kiswire Ltd. for the sale of its 50% stake in the joint venture Kiswire ArcelorMittal Ltd in South Korea and certain other entities of its steel cord business in the US, Europe and Asia for a total consideration of $169 million. The net proceeds received in 2Q 2014 are $39 million being $55 million received in cash during the quarter minus cash held by steel cord business. Additionally, $28 million of gross debt held by the steel cord business has been transferred. The remaining $102 million from the sale proceeds is expected to be received by 2Q 2015. The transaction is subject to final working capital adjustments.
23 Includes back-up lines for the commercial paper program. 24 As at September, 30, 2014, Gallatin’s carrying amount was classified as held for sale. The third quarter of 2014 also includes assets and liabilities held
for sale related to distribution centers in Europe. 25 Total of all finished production of fines, concentrate, pellets and lumps (excludes share of production and strategic long-term contracts). 26 Operating working capital is defined as trade accounts receivable plus inventories less trade accounts payable. 27 Capex includes the acquisition of intangible assets (such as concessions for mining and IT support) and includes payments to fixed asset suppliers. 28 On October 30, 2014, the Company redeemed its 9.0% Notes due February 15, 2015 and its 3.750% Notes due February 25, 2015 prior to their
scheduled maturity. For purposes of the Company’s debt maturity profile table, these two issuances have been excluded from 2015 debt repayments and included in 2014 debt repayments.
29 Commercial paper is expected to continue to be rolled over in the normal course of business.