Embed Size (px)
Citation preview
ArcGIS Online
Launch for
Utilities
Case Study
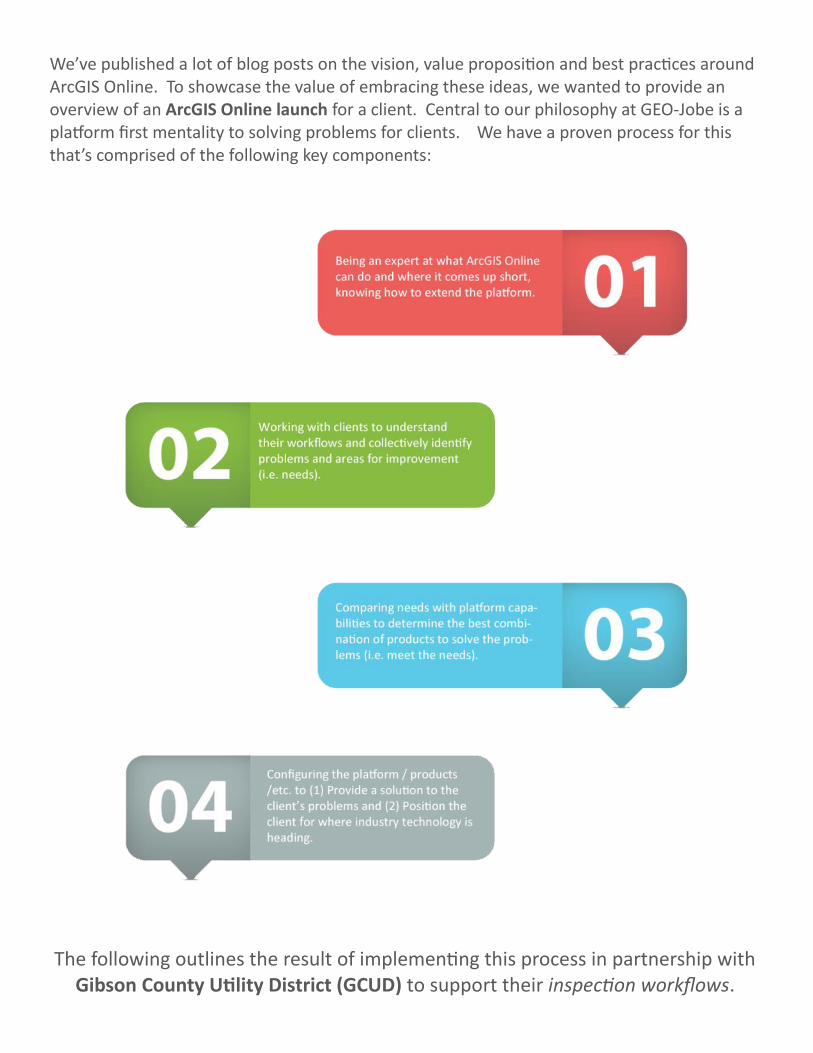
We’ve published a lot of blog posts on the vision, value proposition and best practices around ArcGIS Online. To showcase the value of embracing these ideas, we wanted to provide an overview of an ArcGIS Online launch for a client. Central to our philosophy at GEO-Jobe is a platform first mentality to solving problems for clients. We have a proven process for this that’s comprised of the following key components:
The following outlines the result of implementing this process in partnership with Gibson County Utility District (GCUD) to support their inspection workflows.
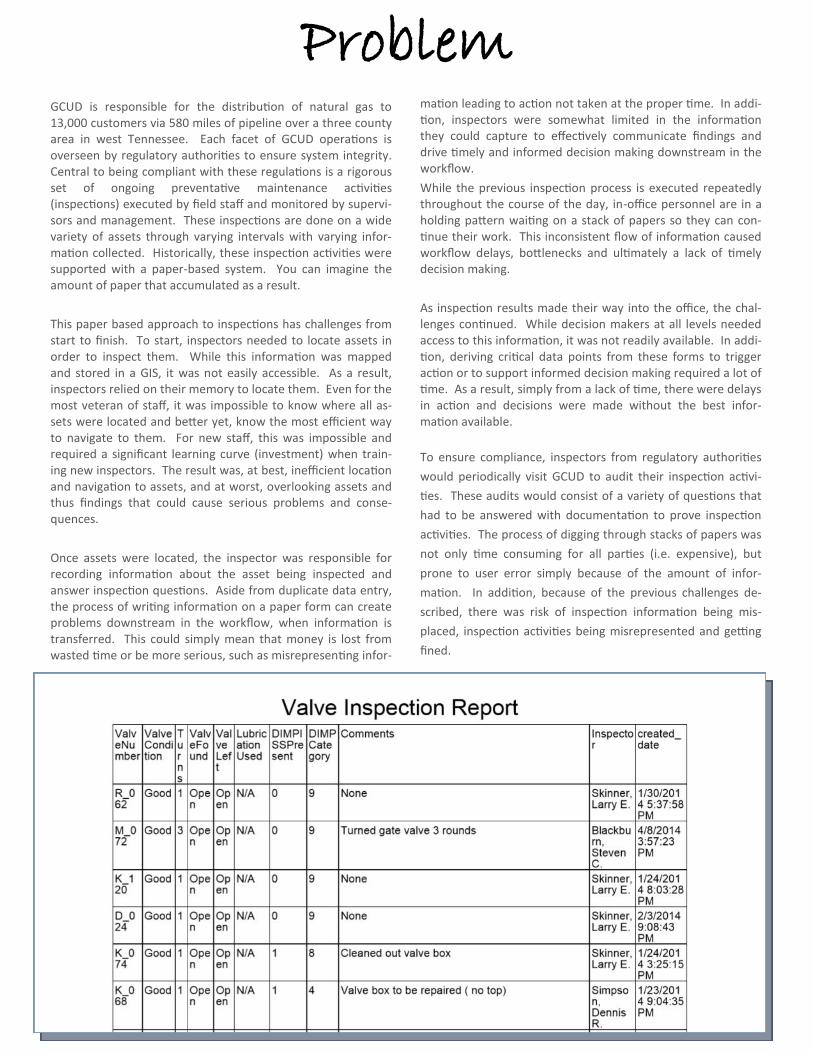
GCUD is responsible for the distribution of natural gas to 13,000 customers via 580 miles of pipeline over a three county area in west Tennessee. Each facet of GCUD operations is overseen by regulatory authorities to ensure system integrity. Central to being compliant with these regulations is a rigorous set of ongoing preventative maintenance activities (inspections) executed by field staff and monitored by supervi-sors and management. These inspections are done on a wide variety of assets through varying intervals with varying infor-mation collected. Historically, these inspection activities were supported with a paper-based system. You can imagine the amount of paper that accumulated as a result.
This paper based approach to inspections has challenges from start to finish. To start, inspectors needed to locate assets in order to inspect them. While this information was mapped and stored in a GIS, it was not easily accessible. As a result, inspectors relied on their memory to locate them. Even for the most veteran of staff, it was impossible to know where all as-sets were located and better yet, know the most efficient way to navigate to them. For new staff, this was impossible and required a significant learning curve (investment) when train-ing new inspectors. The result was, at best, inefficient location and navigation to assets, and at worst, overlooking assets and thus findings that could cause serious problems and conse-quences.
Once assets were located, the inspector was responsible for recording information about the asset being inspected and answer inspection questions. Aside from duplicate data entry, the process of writing information on a paper form can create problems downstream in the workflow, when information is transferred. This could simply mean that money is lost from wasted time or be more serious, such as misrepresenting infor-
mation leading to action not taken at the proper time. In addi-tion, inspectors were somewhat limited in the information they could capture to effectively communicate findings and drive timely and informed decision making downstream in the workflow.
While the previous inspection process is executed repeatedly throughout the course of the day, in-office personnel are in a holding pattern waiting on a stack of papers so they can con-tinue their work. This inconsistent flow of information caused workflow delays, bottlenecks and ultimately a lack of timely decision making.
As inspection results made their way into the office, the chal-lenges continued. While decision makers at all levels needed access to this information, it was not readily available. In addi-tion, deriving critical data points from these forms to trigger action or to support informed decision making required a lot of time. As a result, simply from a lack of time, there were delays in action and decisions were made without the best infor-mation available.
To ensure compliance, inspectors from regulatory authorities
would periodically visit GCUD to audit their inspection activi-
ties. These audits would consist of a variety of questions that
had to be answered with documentation to prove inspection
activities. The process of digging through stacks of papers was
not only time consuming for all parties (i.e. expensive), but
prone to user error simply because of the amount of infor-
mation. In addition, because of the previous challenges de-
scribed, there was risk of inspection information being mis-
placed, inspection activities being misrepresented and getting
fined.
Problem
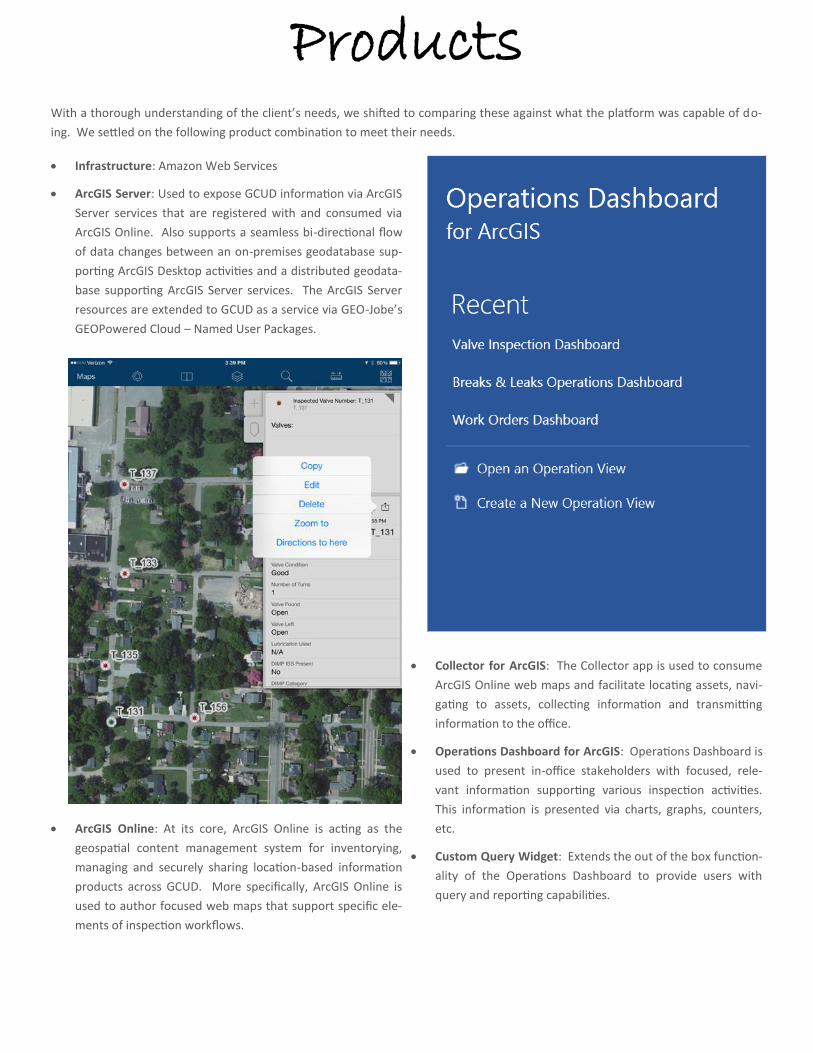
Infrastructure: Amazon Web Services
ArcGIS Server: Used to expose GCUD information via ArcGIS
Server services that are registered with and consumed via
ArcGIS Online. Also supports a seamless bi-directional flow
of data changes between an on-premises geodatabase sup-
porting ArcGIS Desktop activities and a distributed geodata-
base supporting ArcGIS Server services. The ArcGIS Server
resources are extended to GCUD as a service via GEO-Jobe’s
GEOPowered Cloud – Named User Packages.
ArcGIS Online: At its core, ArcGIS Online is acting as the
geospatial content management system for inventorying,
managing and securely sharing location-based information
products across GCUD. More specifically, ArcGIS Online is
used to author focused web maps that support specific ele-
ments of inspection workflows.
Collector for ArcGIS: The Collector app is used to consume
ArcGIS Online web maps and facilitate locating assets, navi-
gating to assets, collecting information and transmitting
information to the office.
Operations Dashboard for ArcGIS: Operations Dashboard is
used to present in-office stakeholders with focused, rele-
vant information supporting various inspection activities.
This information is presented via charts, graphs, counters,
etc.
Custom Query Widget: Extends the out of the box function-
ality of the Operations Dashboard to provide users with
query and reporting capabilities.
Products With a thorough understanding of the client’s needs, we shifted to comparing these against what the platform was capable of do-
ing. We settled on the following product combination to meet their needs.
With the technology stack mentioned above, GCUD inspection
workflows have been transformed.
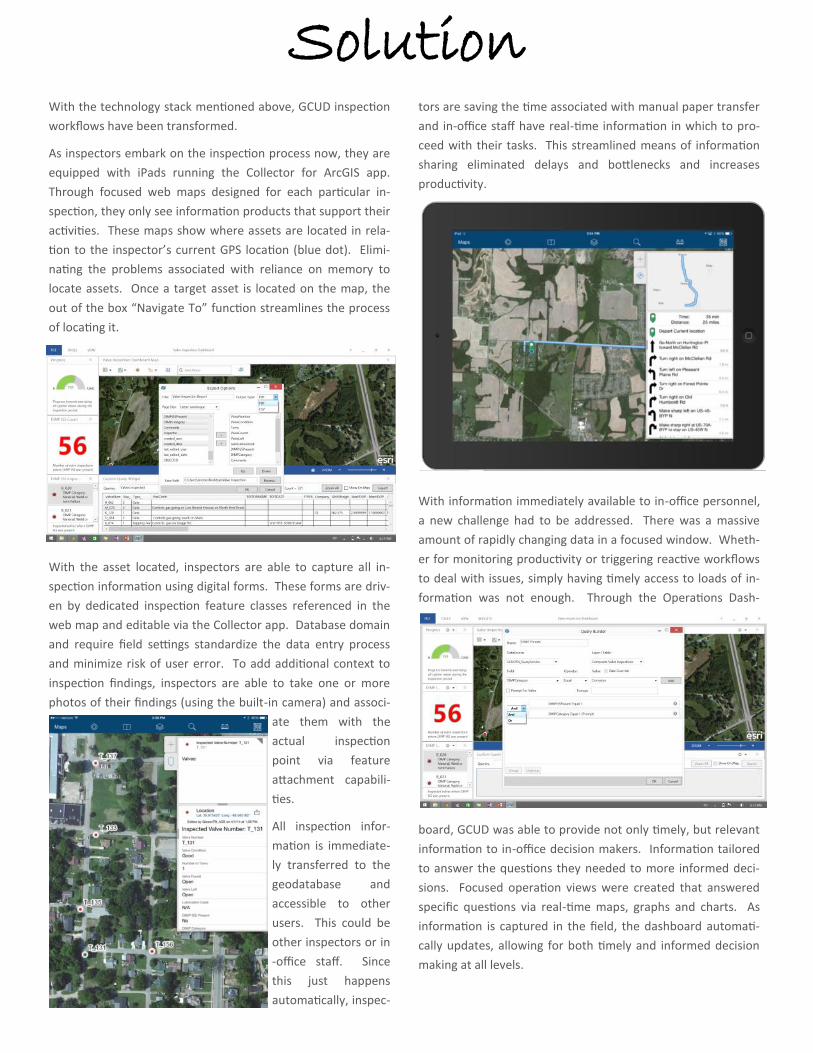
As inspectors embark on the inspection process now, they are
equipped with iPads running the Collector for ArcGIS app.
Through focused web maps designed for each particular in-
spection, they only see information products that support their
activities. These maps show where assets are located in rela-
tion to the inspector’s current GPS location (blue dot). Elimi-
nating the problems associated with reliance on memory to
locate assets. Once a target asset is located on the map, the
out of the box “Navigate To” function streamlines the process
of locating it.
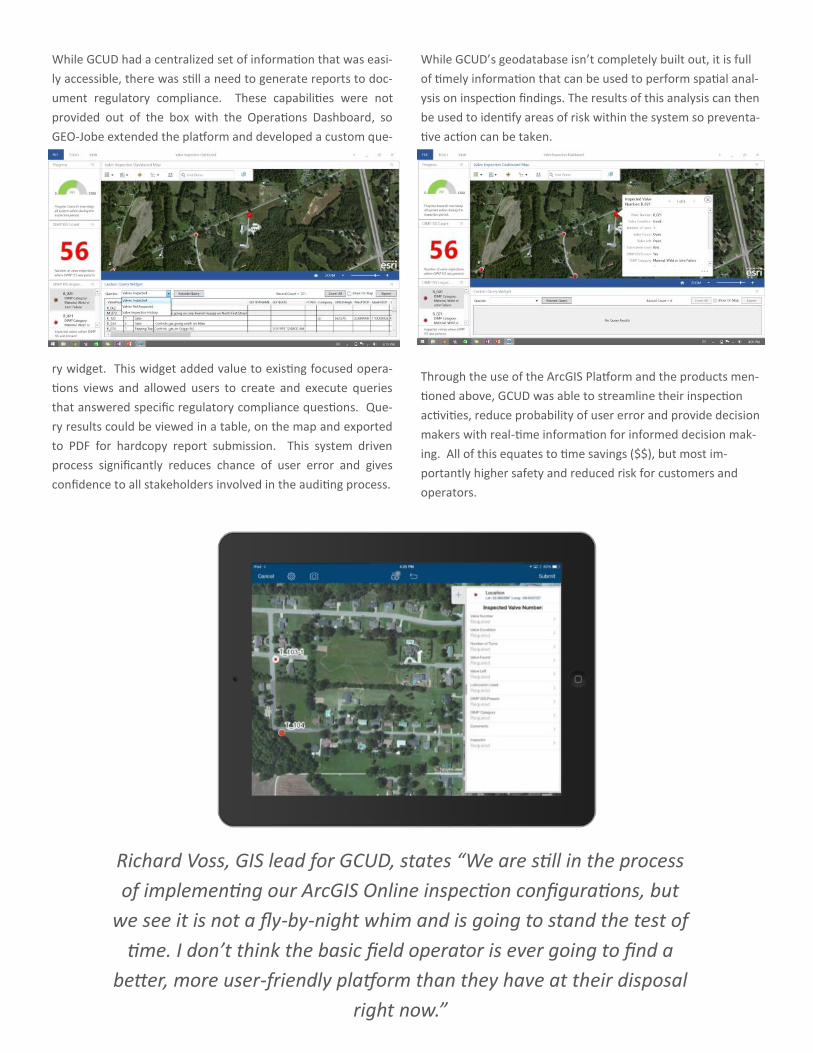
With the asset located, inspectors are able to capture all in-
spection information using digital forms. These forms are driv-
en by dedicated inspection feature classes referenced in the
web map and editable via the Collector app. Database domain
and require field settings standardize the data entry process
and minimize risk of user error. To add additional context to
inspection findings, inspectors are able to take one or more
photos of their findings (using the built-in camera) and associ-
ate them with the
actual inspection
point via feature
attachment capabili-
ties.
All inspection infor-
mation is immediate-
ly transferred to the
geodatabase and
accessible to other
users. This could be
other inspectors or in
-office staff. Since
this just happens
automatically, inspec-
tors are saving the time associated with manual paper transfer
and in-office staff have real-time information in which to pro-
ceed with their tasks. This streamlined means of information
sharing eliminated delays and bottlenecks and increases
productivity.
With information immediately available to in-office personnel,
a new challenge had to be addressed. There was a massive
amount of rapidly changing data in a focused window. Wheth-
er for monitoring productivity or triggering reactive workflows
to deal with issues, simply having timely access to loads of in-
formation was not enough. Through the Operations Dash-
board, GCUD was able to provide not only timely, but relevant
information to in-office decision makers. Information tailored
to answer the questions they needed to more informed deci-
sions. Focused operation views were created that answered
specific questions via real-time maps, graphs and charts. As
information is captured in the field, the dashboard automati-
cally updates, allowing for both timely and informed decision
making at all levels.
Solution
While GCUD had a centralized set of information that was easi-
ly accessible, there was still a need to generate reports to doc-
ument regulatory compliance. These capabilities were not
provided out of the box with the Operations Dashboard, so
GEO-Jobe extended the platform and developed a custom que-
ry widget. This widget added value to existing focused opera-
tions views and allowed users to create and execute queries
that answered specific regulatory compliance questions. Que-
ry results could be viewed in a table, on the map and exported
to PDF for hardcopy report submission. This system driven
process significantly reduces chance of user error and gives
confidence to all stakeholders involved in the auditing process.
While GCUD’s geodatabase isn’t completely built out, it is full
of timely information that can be used to perform spatial anal-
ysis on inspection findings. The results of this analysis can then
be used to identify areas of risk within the system so preventa-
tive action can be taken.
Through the use of the ArcGIS Platform and the products men-
tioned above, GCUD was able to streamline their inspection
activities, reduce probability of user error and provide decision
makers with real-time information for informed decision mak-
ing. All of this equates to time savings ($$), but most im-
portantly higher safety and reduced risk for customers and
operators.
Richard Voss, GIS lead for GCUD, states “We are still in the process
of implementing our ArcGIS Online inspection configurations, but
we see it is not a fly-by-night whim and is going to stand the test of
time. I don’t think the basic field operator is ever going to find a
better, more user-friendly platform than they have at their disposal
right now.”

Created By:
www.geo-jobe.com
Jeremy Weber, Vice President
Twitter: @jeremyhweber
Phone: (615) 883-0085

![Python and ArcGIS Enterprise - static.packt-cdn.com€¦ · Python and ArcGIS Enterprise [ 2 ] ArcGIS enterprise Starting with ArcGIS 10.5, ArcGIS Server is now called ArcGIS Enterprise](https://img.pdfslide.net/doc/110x75/5ecf20757db43a10014313b7/python-and-arcgis-enterprise-python-and-arcgis-enterprise-2-arcgis-enterprise.jpg)