Embed Size (px)
Citation preview
1
Are Catholic Primary Schools More Effective Than Public Primary Schools?
Todd Elder* Christopher Jepsen
Michigan State University University College Dublin
110 Marshall-Adams Hall D212 Newman Building
East Lansing, MI 48824-1038 Belfield, Dublin 4, Ireland
September 2013
Abstract
This paper assesses the causal effects of Catholic primary schooling on student outcomes
such as test scores, grade retention, and behavior. Catholic school students have substantially
better average outcomes than do public school students throughout the primary years, but we
present evidence that selection bias is entirely responsible for these advantages. Estimates based
on several empirical strategies, including an approach developed by Altonji et al. (2005a) to use
selection on observables to assess the bias arising from selection on unobservables, imply that
Catholic schools do not appreciably boost test scores. All of the empirical strategies point to
sizeable negative effects of Catholic schooling on mathematics achievement. Similarly, we find
very little evidence that Catholic schooling improves behavioral and other non-cognitive
outcomes once we account for selection on unobservables.
Keywords: Catholic schools, achievement, selection bias
JEL Codes: I21, J24
* This research is supported by a grant from the American Educational Research Association which receives funds
for its “AERA Grants Program” from the National Science Foundation under NSF Grant #DRL-0941014. We thank
Maria Ferreyra, Scott Hankins, Randall Reback, and seminar participants at Nagoya University and the 2011 annual
conference of the Association of Education Finance and Policy for useful comments. Opinions reflect those of the
authors and do not necessarily reflect those of the granting agencies. E-mail: [email protected] and

2
I. Introduction
Critics of the nation’s public education system have long suggested that public schools
would benefit from being operated more like private schools. Advocates of vouchers take this
reasoning a step further, arguing for the use of public funds to help students defray the costs of
attending private schools. These arguments are based largely on research suggesting that private
schools boost educational attainment and achievement. In particular, a long line of research has
compared outcomes of students in Catholic versus public high schools, finding compelling
evidence that attending Catholic high schools positively influences educational attainment.
However, much less is known about the efficacy of Catholic primary schooling.
Using data from the Early Childhood Longitudinal Survey: Kindergarten Class of 1998-
99 (ECLS-K), we study the effects of Catholic schooling on cognitive and non-cognitive
outcomes measured between kindergarten and eighth grade. Average achievement test scores
among Catholic school students are substantially higher than among public school students
throughout this grade range, but these advantages may be driven by systematic differences in
students across school sector rather than by the effectiveness of Catholic schools. In order to
distinguish between the competing explanations for Catholic schooling advantages, we pursue
several approaches for controlling for selection bias. Our preferred approach involves using
propensity score matching to control for observable differences between Catholic and public
school students. We also adopt the methods of Altonji et al. (2005a) to use selection on observed
variables to quantify the importance of selection on unobserved variables, a novel approach in
the context of the Catholic primary schooling literature.
Our analysis produces five central findings. First, we document that Catholic school
attendees have large advantages in both mathematics and reading achievement before entering
3
into formal schooling. Roughly half of the mathematics score gap disappears between
kindergarten and eighth grade, while the reading score gap is roughly stable over time. Second,
all of the approaches we pursue suggest that Catholic primary schooling decreases mathematics
achievement, with estimated effects ranging from two to four percentile-point reductions in test
scores. Third, estimates based on the Altonji et al. (2005a) approach suggest that selection bias
drives the small positive OLS and propensity-score estimates of Catholic primary schooling on
reading scores. Specifically, selection bias could account for the entire positive OLS estimate if
the association between Catholic schooling and unobservable determinants of test scores is only
5 percent as strong as the association between Catholic schooling and the observable
determinants of test scores. Fourth, we find little evidence of a positive Catholic primary
schooling effect on a set of non-cognitive outcomes available in ECLS-K once we assume even
modest amounts of selection on unobserved determinants of these outcomes. Fifth, we illustrate
the importance of controls for achievement prior to school entry in analyzing the effects of
Catholic primary schooling by comparing estimates based on ECLS-K and NELS data. Overall,
the results suggest that the Catholic school advantages present in eighth grade are largely due to
differences in the skills (and other attributes) of public and Catholic school students that existed
prior to kindergarten.
II. Relationship to the Current Literature
The vast majority of the literature on Catholic schooling has been devoted to the effect of
Catholic high school attendance on test scores and educational attainment. Early work finds
large positive effects of attending a Catholic high school (e.g., Coleman et al., 1982; Evans and
Schwab, 1995; and Neal, 1997), but Altonji et al. (2005b) argue that these estimates could be
driven solely by selection bias. Altonji et al. (2005a) develop techniques to quantify the degree
4
of bias in single-equation models, based on the idea that the relationship between Catholic
schooling and observable determinants of outcomes can be informative about the relationship
between Catholic schooling and unobservables. They find that Catholic high school attendance
increases the likelihood of graduating from high school and enrolling in college, but that the
positive effects on test scores implied by OLS models are likely driven by selection bias.
Morgan (2001) instead uses propensity score models to nonparametrically control for observable
differences between Catholic and public school students, finding positive effects of Catholic high
school attendance on test scores.
In contrast to the large literature on Catholic high schools, only a handful of studies have
addressed the effects of Catholic primary schooling. Lee and Stewart (1989), Jones (1997), and
Lubienski and Lubienski (2006) study differences in National Assessment of Educational
Progress (NAEP) test scores between Catholic and public primary schools. Lee and Stewart
(1989) and Jones (1997) find higher test scores for Catholic school students, whereas Lubienski
and Lubienski (2006) find slightly lower (insignificantly so) test scores for Catholic school
students. However, it is difficult to draw causal inferences from NAEP data because they are
cross-sectional and contain no controls for student ability.
Carbonaro (2006) uses the ECLS-K to estimate the Catholic schooling effect on test score
gains from the fall to spring of kindergarten. He finds negative and often insignificant Catholic
school effects in his preferred propensity score model. Lubienski, Crane, and Lubienski (2008)
also find a negative, statistically insignificant Catholic school effect on fifth-grade mathematics
test scores in the ECLS-K data, based on models that include controls for kindergarten test
scores. Similarly, Reardon, Cheadle, and Robinson (2009) estimate negative and insignificant
Catholic schooling effects on test scores for each wave of ECLS-K data from kindergarten
5
through fifth grade. They use propensity score matching models, OLS models, and area-level
fixed effects models to control for selection on observable variables.
Jepsen (2003) studies the effects of Catholic schooling for two cohorts of primary school
students in the Prospects data on Title I programs. Using OLS models, he finds small,
statistically-insignificant effects of Catholic schooling on test scores and some suggestive
evidence that Catholic schools may positively affect attendance. Finally, Sander (1996) finds
positive effects of Catholic primary school attendance on tenth-grade test scores using High
School and Beyond data, but because this study does not directly control for Catholic high school
attendance, the estimates may instead capture positive effects of Catholic high schools.
III. Data
We use data from the Early Childhood Longitudinal Study: Kindergarten Class of 1998-
99 (ECLS-K), a longitudinal study of kindergarteners beginning in the 1998-1999 academic year.
Follow-up surveys were administered in the spring of kindergarten (1999), the fall of first grade
(1999), the spring of first grade (2000), the spring of third grade (2002), the spring of fifth grade
(2004), and the spring of eighth grade (2007).
We focus on the set of students who participated in the fall kindergarten sample because
the extensive set of control variables provides valuable information about children’s experiences
and aptitudes prior to kindergarten. We limit our estimation samples to students who attended
Catholic or public primary schools. Although substantial numbers of students attend other
private schools in the ECLS-K, the non-Catholic private schools are sufficiently diverse that
measuring a mean effect for these schools is of little value, so we exclude students who attend
non-Catholic private schools at any grade level. After excluding these cases, the eighth-grade
sample contains approximately 7,000 students, and the fifth-grade sample contains
6
approximately 9,000 students. Exact sample sizes vary across specifications and estimation
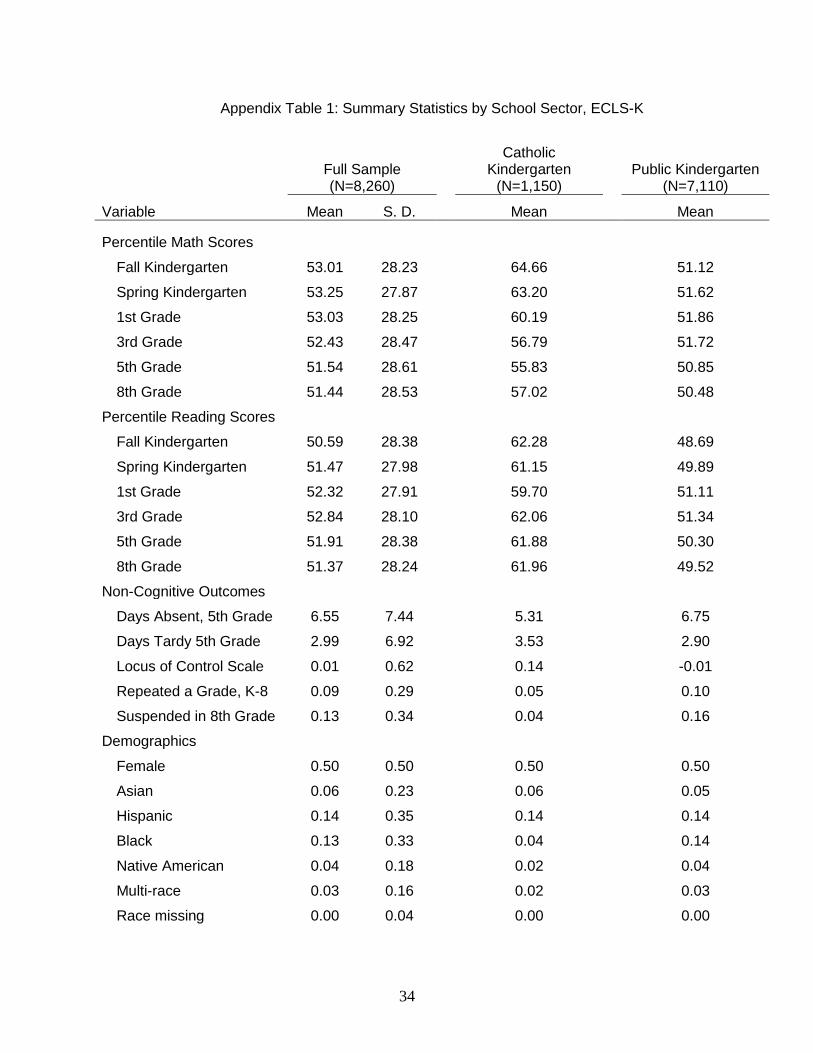
techniques; Appendix Table 1 contains descriptive statistics for students in either the fifth- or
eighth-grade sample.
As our measure of Catholic schooling, we define an indicator equal to one if a child
initially enrolled in a Catholic kindergarten, and zero otherwise.1 We also measure other
demographic variables based on kindergarten-year survey responses. Our measures of cognitive
skills are fifth- and eighth-grade mathematics and reading test scores in the ECLS-K.
Psychometric evaluations have shown that these assessments provide reliable measures of
children’s mathematics and reading skills (see Reardon, Cheadle, and Robinson, 2009, for a
discussion). As measures of non-cognitive skills, we use school-reported measures of number of
days absent and the number of days tardy in the fifth-grade wave. From the eighth-grade wave,
we use a binary measure of whether a parent reported that the student had ever been suspended, a
binary measure of whether a student has fallen behind their cohort’s grade advancement, equal to
one if a student has not reached the eighth grade at the time of the eighth grade survey, and a
student-reported “locus of control” scale, which measures student ratings of agreement to
questions such as “I don’t have enough control over the direction my life is taking” and “In my
life, good luck is more important than hard work for success.”
A particularly attractive feature of the ECLS-K lies in its breadth of included information
about students, parents, teachers, and schools. We include extensive sets of control variables
along each of these dimensions in order to minimize the role of unobserved characteristics in
estimates of the effects of Catholic primary schooling. Student characteristics include sex,
race/ethnicity, age, birth weight, and fall kindergarten test scores. Family background
1 In all cases, our primary empirical results are robust to measuring Catholic schooling based on grade levels other
than kindergarten.
7
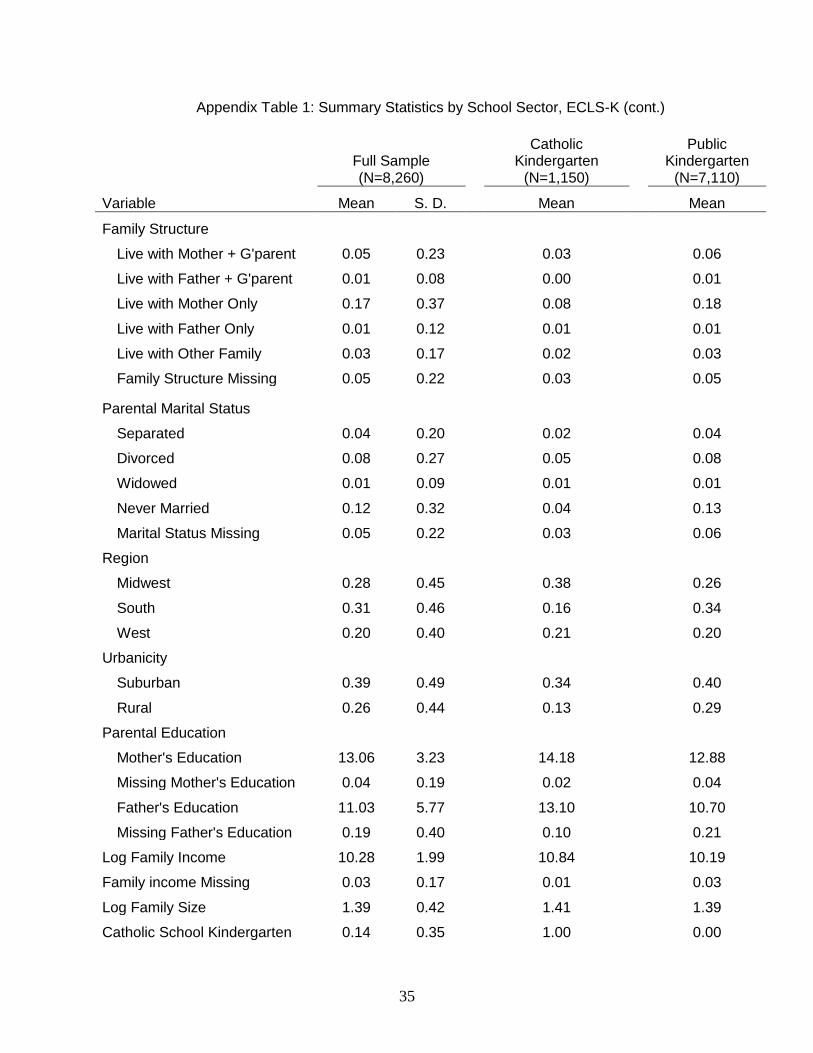
characteristics include the marital status of the child’s primary caregiver, log family income,
parental education, and family structure. Appendix Table 1 lists descriptive statistics for all of
these variables.
The ECLS-K is designed to be nationally representative in each survey wave through the
inclusion of sample weights for each wave (such as spring 2003) as well as for a panel (such as
the set of students who participated in all follow-up surveys). We conduct all empirical analyses
both with and without the appropriate sample weights to assess the sensitivity of our results, but
we report weighted estimates below. Because of the sample restrictions listed above, our
analysis sample is a subset of the full ECLS-K dataset, so our use of ECLS-K weights may or
may not produce representative samples.2
IV. Methodology
Because Catholic schools charge tuition and often require parental involvement, students
who attend Catholic primary schools likely differ from public school students along many
dimensions. Of particular concern is the likely correlation between unobservable determinants
of school sector and outcomes of interest such as student achievement. We study multiple
techniques to evaluate the extent of selection bias as well as to control for it.
The starting point of our analysis is OLS estimation of a linear model,
(1) ,
where denotes the outcome of interest (e.g., eighth-grade mathematics test scores),
denotes an indicator variable equal to one for students in Catholic primary school and zero
2 The timing of the ECLS-K panel overlaps with the sex abuse scandal involving Catholic priests starting in 2002,
when ECLS-K students would have been in second grade. If the scandal led to non-random attrition from Catholic
schools, then the ECLS-K follow-ups may be non-representative of samples that would have been collected either
long before the scandal or afterward. Dee and Jacob (2009) document a sizable decrease in enrollment in Catholic
elementary schools starting in 2002 using NAEP data, compared to essentially flat enrollment in public elementary
schools.
8
otherwise, denotes the student characteristics and family background measures listed in
Appendix Table 1, and denotes unobserved determinants of .
As noted above, the ECLS-K data include extensive controls for family background,
student characteristics, and school characteristics. Most importantly, the data include test scores
in mathematics and reading from the fall of 1998, taken shortly after students entered
kindergarten. The test score variables from the fall of kindergarten are particularly valuable –
because these tests are administered early in the school year, they primarily measure a student’s
ability and human capital accumulation prior to enrolling in school, rather than the child’s
kindergarten experience.3 The inclusion of such extensive controls reduces, but likely does not
eliminate, the influence of confounding factors on the outcomes of interest.
Propensity Score Matching
As in regression-based analyses, propensity score matching relies on the assumption of
“selection on observables”: conditional on observable characteristics, students in Catholic and
public schools do not systematically differ along unobservable dimensions. The primary
advantage of the propensity score approach is that it is robust to misspecification of the outcome
model given by (1); this approach does not rely on linearity of the outcome model in order to
generate consistent estimates of treatment effects.
For comparability with earlier studies of Catholic primary schooling, we follow the
propensity score approaches of Reardon, Cheadle, and Robinson (2009) and Morgan (2001). We
specify the propensity score as follows:
(2) ) )
3 All wave 1 surveys were collected between September and early December in the kindergarten year, with roughly
90 percent collected by the end of November. The ECLS-K website includes comprehensive information about the
wave 1 sampling design: http://nces.ed.gov/ecls/Kindergarten.asp.
9
where ∙) denotes the indicator function that takes on the value 1 if its argument is true and
zero otherwise, ) denotes a flexible function of all of the elements of , and denotes
unobserved determinants of Catholic primary school attendance.
In the main analyses below, we estimate the propensity scores based on probit models,
but we assess the sensitivity of the estimates to the assumed distribution of by also using logit
models. Although propensity scores are widely used in the matching literature, no single method
has dominated (see, for example, Frolich, 2004), so we employ three commonly-used matching
methods: kernel density, nearest neighbor, and caliper. The kernel density estimator compares
each student in the treatment group (in this case, students enrolled in Catholic primary schools)
to a weighted average of all comparison group observations, with the weight for each
observation in the comparison group inversely proportional to the difference between that
observation’s estimated propensity score and the propensity score of the treatment student.4 In
the nearest-neighbor approach, each treatment student is matched with the four students in public
schooling who have the most similar propensity scores.5 Finally, in the caliper method, we
match each treatment student with all students in public schools who have propensity scores
within a predetermined distance (or “radius”). Below we choose a radius of 0.0005, although
results based on radii ranging from 0.0001 to 0.0010 produce qualitatively similar results. As we
show below, our central conclusions are insensitive to not only the smoothing parameters we
4 We use the Stata routine psmatch2 (see Leuven and Sianesi, 2003) to calculate the propensity score estimators.
For a recent review of matching estimators with an application to job training programs, see Mueser, Troske, and
Gorislavsky (2007) and the references cited there. We use the default options in psmatch2: an Epanechnikov kernel
(as recommended by Silverman, 1986) with a bandwidth of 0.08. 5 We include four nearest neighbors because the simulations in Abadie and Imbens (2006) imply that the use of four
neighbors minimizes mean-squared error in our sample sizes, although our results are largely insensitive to
including between one and five nearest neighbors. We match with replacement, and we include ties, i.e., students
with identical propensity scores, even if including them raises the number of closest neighbors above four. The
results below are not sensitive to either of these choices.
10
choose for a given method, but to the method itself – estimates based on the kernel density,
caliper, and nearest neighbor methods are similar in all cases.
In all of these propensity score methods, the selection on observables assumption boils
down to assuming that, conditional on the propensity score, the choice of treatment is unrelated
to potential outcomes, i.e., outcomes that would hold if Catholic or public schooling were
chosen If so, the effect of Catholic schooling can be consistently estimated by examining
differences in mean outcomes between the Catholic schooling sample and the propensity-score-
matched public school sample.
Selection on Observables and Unobservables
In order to evaluate whether selection bias drives the OLS and propensity-score estimates
that dominate the literature on Catholic primary schooling, we adopt a technique developed in
Altonji et al. (2005a). This approach is based on measuring the ratio of selection on
unobservables to selection on observables needed to attribute the entire effect of Catholic school
attendance to selection bias. For example, Altonji et al. (2005a) find that selection on
unobservables would need to be 3.55 times stronger than selection on observables in order to
“explain away” their large estimated effect of Catholic high school attendance on the likelihood
of enrolling in college. We will use these methods to analyze the role of selection bias on
estimates of the effects of Catholic primary schooling on student achievement.
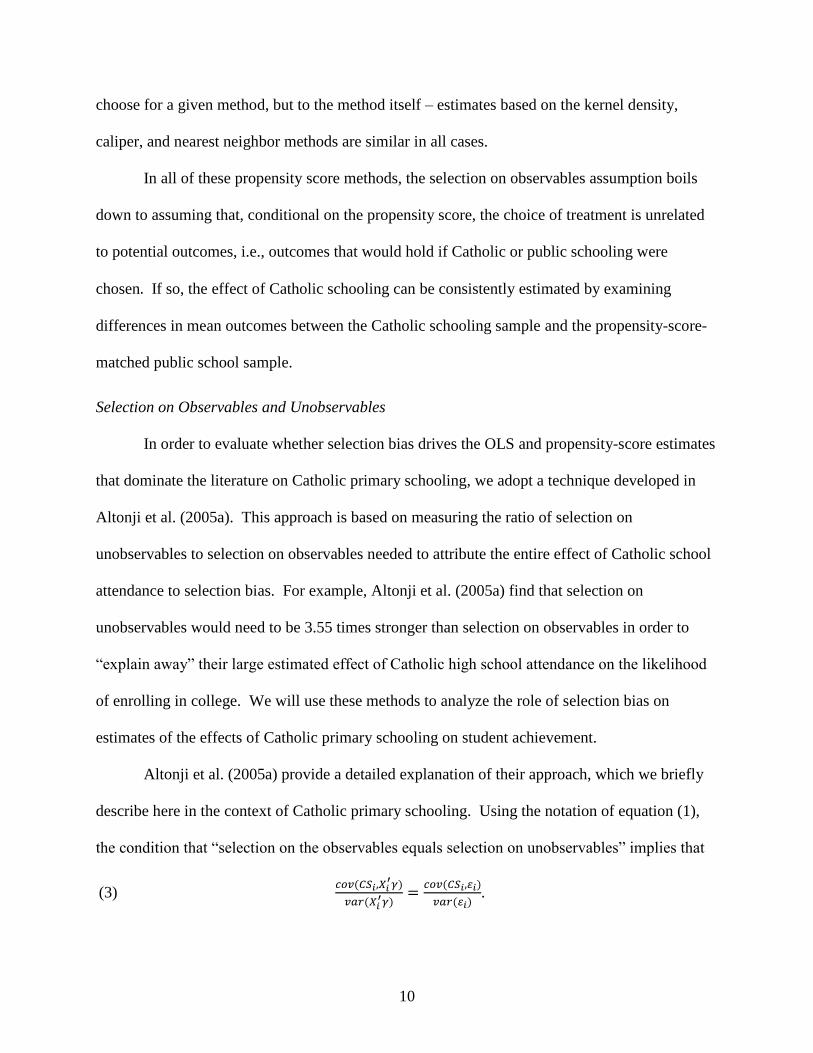
Altonji et al. (2005a) provide a detailed explanation of their approach, which we briefly
describe here in the context of Catholic primary schooling. Using the notation of equation (1),
the condition that “selection on the observables equals selection on unobservables” implies that
(3)
)
)
)
).
11
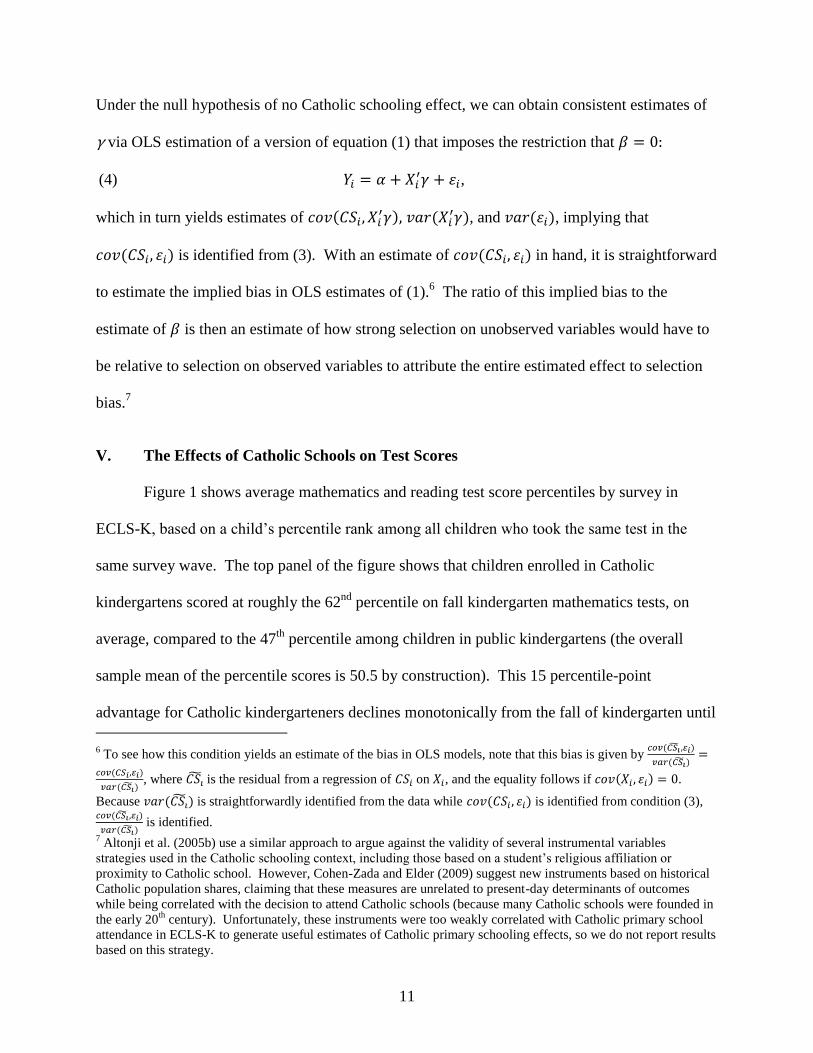
Under the null hypothesis of no Catholic schooling effect, we can obtain consistent estimates of
γ via OLS estimation of a version of equation (1) that imposes the restriction that
(4) ,
which in turn yields estimates of )
), and ), implying that
) is identified from (3). With an estimate of ) in hand, it is straightforward
to estimate the implied bias in OLS estimates of (1).6 The ratio of this implied bias to the
estimate of is then an estimate of how strong selection on unobserved variables would have to
be relative to selection on observed variables to attribute the entire estimated effect to selection
bias.7
V. The Effects of Catholic Schools on Test Scores
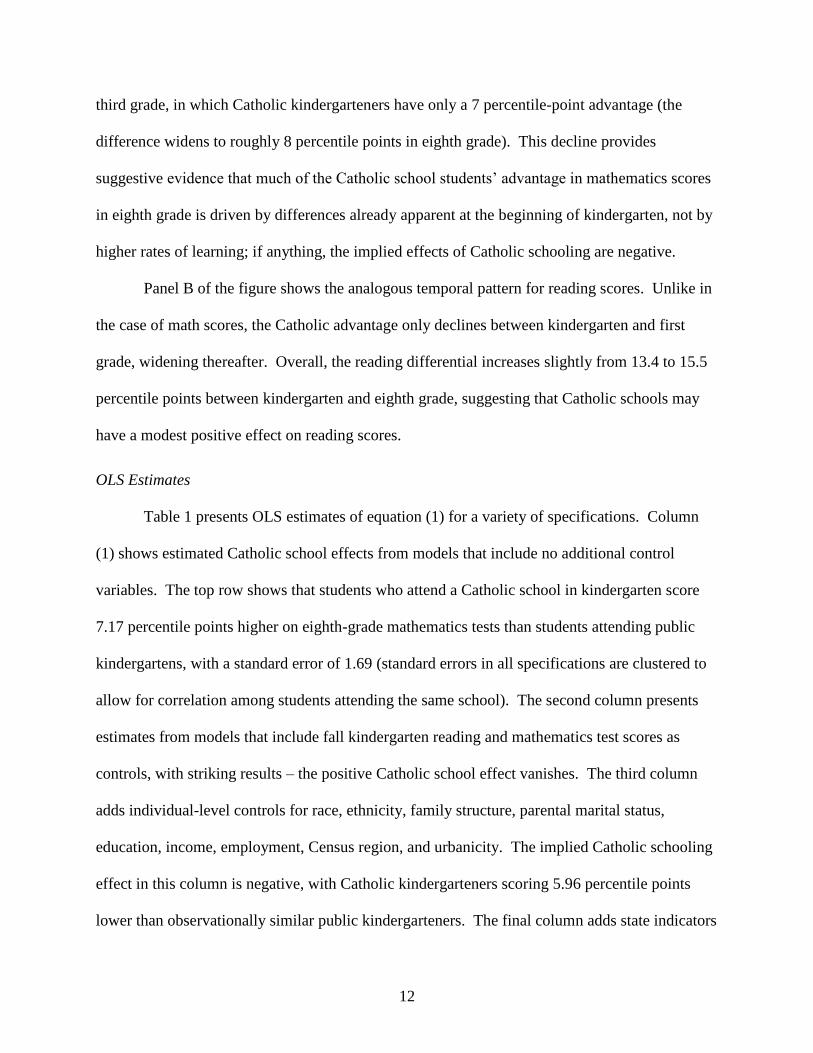
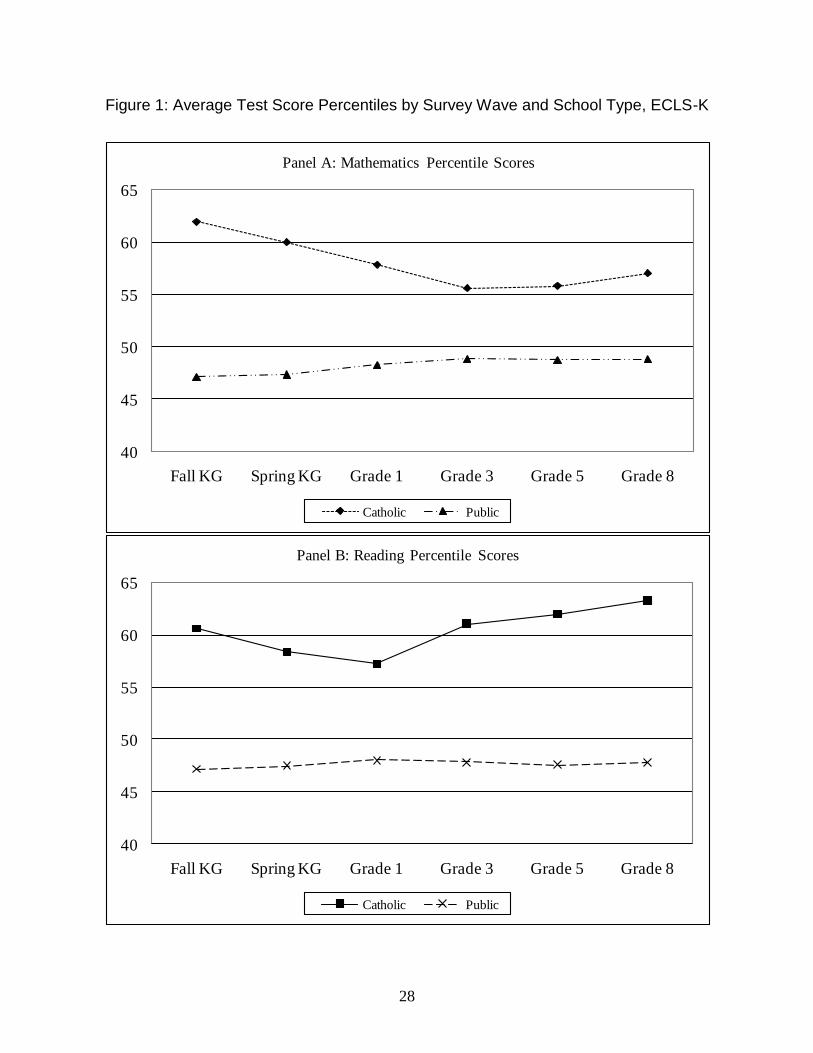
Figure 1 shows average mathematics and reading test score percentiles by survey in
ECLS-K, based on a child’s percentile rank among all children who took the same test in the
same survey wave. The top panel of the figure shows that children enrolled in Catholic
kindergartens scored at roughly the 62nd
percentile on fall kindergarten mathematics tests, on
average, compared to the 47th
percentile among children in public kindergartens (the overall
sample mean of the percentile scores is 50.5 by construction). This 15 percentile-point
advantage for Catholic kindergarteners declines monotonically from the fall of kindergarten until
6 To see how this condition yields an estimate of the bias in OLS models, note that this bias is given by
)
)
)
), where is the residual from a regression of on , and the equality follows if ) .
Because ) is straightforwardly identified from the data while ) is identified from condition (3), )
) is identified.
7 Altonji et al. (2005b) use a similar approach to argue against the validity of several instrumental variables
strategies used in the Catholic schooling context, including those based on a student’s religious affiliation or
proximity to Catholic school. However, Cohen-Zada and Elder (2009) suggest new instruments based on historical
Catholic population shares, claiming that these measures are unrelated to present-day determinants of outcomes
while being correlated with the decision to attend Catholic schools (because many Catholic schools were founded in
the early 20th
century). Unfortunately, these instruments were too weakly correlated with Catholic primary school
attendance in ECLS-K to generate useful estimates of Catholic primary schooling effects, so we do not report results
based on this strategy.
12
third grade, in which Catholic kindergarteners have only a 7 percentile-point advantage (the
difference widens to roughly 8 percentile points in eighth grade). This decline provides
suggestive evidence that much of the Catholic school students’ advantage in mathematics scores
in eighth grade is driven by differences already apparent at the beginning of kindergarten, not by
higher rates of learning; if anything, the implied effects of Catholic schooling are negative.
Panel B of the figure shows the analogous temporal pattern for reading scores. Unlike in
the case of math scores, the Catholic advantage only declines between kindergarten and first
grade, widening thereafter. Overall, the reading differential increases slightly from 13.4 to 15.5
percentile points between kindergarten and eighth grade, suggesting that Catholic schools may
have a modest positive effect on reading scores.
OLS Estimates
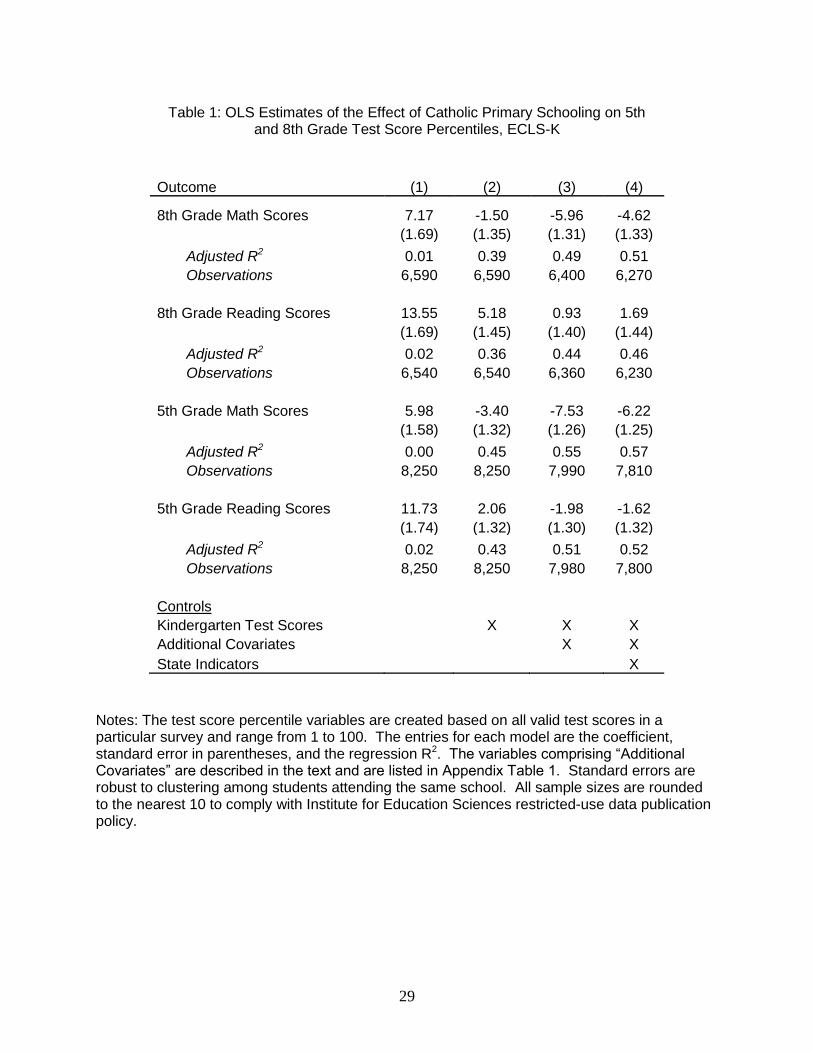
Table 1 presents OLS estimates of equation (1) for a variety of specifications. Column
(1) shows estimated Catholic school effects from models that include no additional control
variables. The top row shows that students who attend a Catholic school in kindergarten score
7.17 percentile points higher on eighth-grade mathematics tests than students attending public
kindergartens, with a standard error of 1.69 (standard errors in all specifications are clustered to
allow for correlation among students attending the same school). The second column presents
estimates from models that include fall kindergarten reading and mathematics test scores as
controls, with striking results – the positive Catholic school effect vanishes. The third column
adds individual-level controls for race, ethnicity, family structure, parental marital status,
education, income, employment, Census region, and urbanicity. The implied Catholic schooling
effect in this column is negative, with Catholic kindergarteners scoring 5.96 percentile points
lower than observationally similar public kindergarteners. The final column adds state indicators
13
to control for correlations between Catholic school enrollment rates and underlying state-level
student achievement, which does not substantially alter the results. The results shown in Table 1
are weighted using the relevant cross-sectional weight provided by NCES, e.g., the fifth-grade
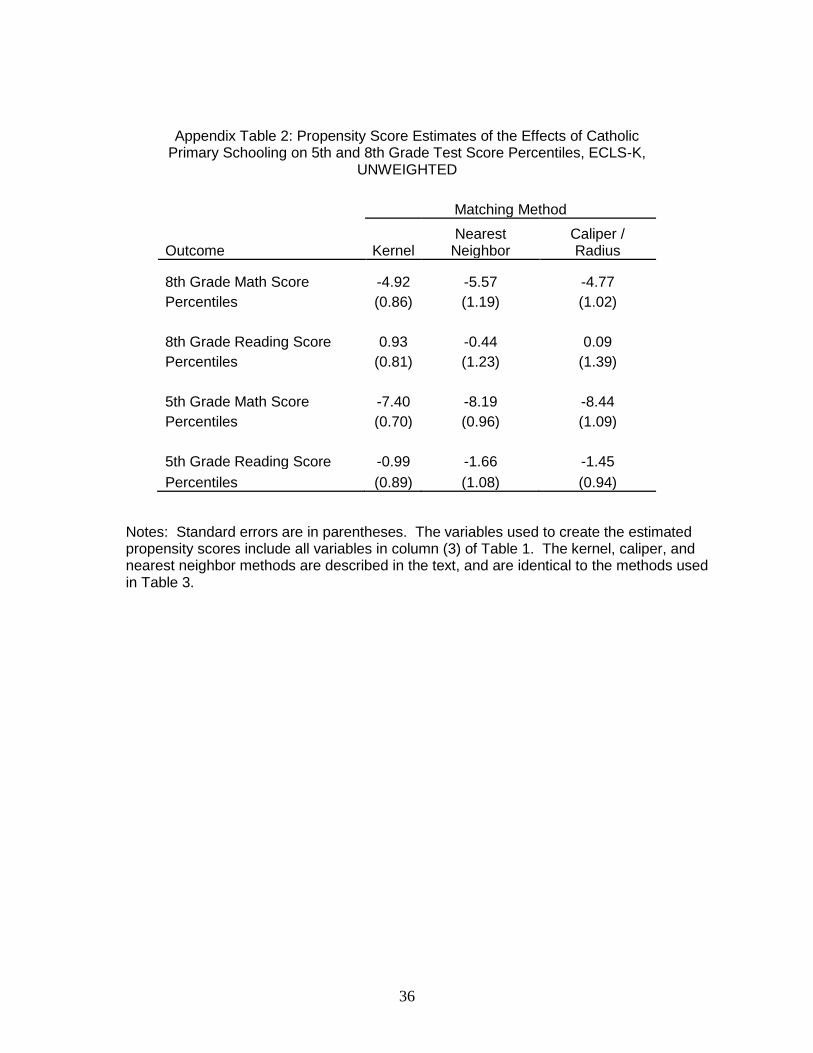
cross-sectional weight for fifth-grade test scores. For comparison, Appendix Table 2 contains
results from unweighted regressions. In all cases, the estimates based on the weighted
regressions are quite similar to those based on unweighted regressions.
The remaining rows of the table show results for eighth-grade reading scores, fifth-grade
mathematics scores, and fifth grade reading scores. For all four outcomes, much of the large
Catholic student advantage vanishes after conditioning on initial kindergarten achievement. The
individual-level controls included in column (3) further reduce the magnitude of the estimates.
Kindergarten test scores and the individual-level controls explain much of the between-student
variation in fifth- and eighth-grade achievement, with the regression r2 values ranging from 0.44
to 0.55 in column (3). Overall, the estimates suggest that Catholic primary schooling
significantly lowers mathematics achievement in both fifth and eighth grades. Although there is
no evidence for a negative Catholic primary school effect on reading scores, there is little
evidence for a positive effect, either: the estimate of 0.93 (1.40) in eighth grade is modest and
statistically indistinguishable from zero. Again, the results suggest that Catholic primary schools
do not markedly increase student achievement, but this null result may be an artifact of the
linearity imposed in (1). We turn next to relaxing this assumption by considering our preferred
specifications based on propensity score matching.8
8 As a complement to the OLS results, we also estimate student fixed effects models of math and reading scores,
based on the roughly five percent of students in the ECLS-K who switch school sectors. Of the 460 students who
switch, roughly 83 percent (= 380 / 460) start in Catholic school and later move to public schools; the remainder
starts in public school and moves to Catholic school. These estimates are generally consistent with the OLS
estimates, in that Catholic schooling is associated with large mathematics score reductions (2.25 percentile points,
with a standard error of 1.01) and somewhat smaller and insignificant reading score reductions (1.41 percentile
points, with a standard error of 1.05).

14
Propensity Score Matching
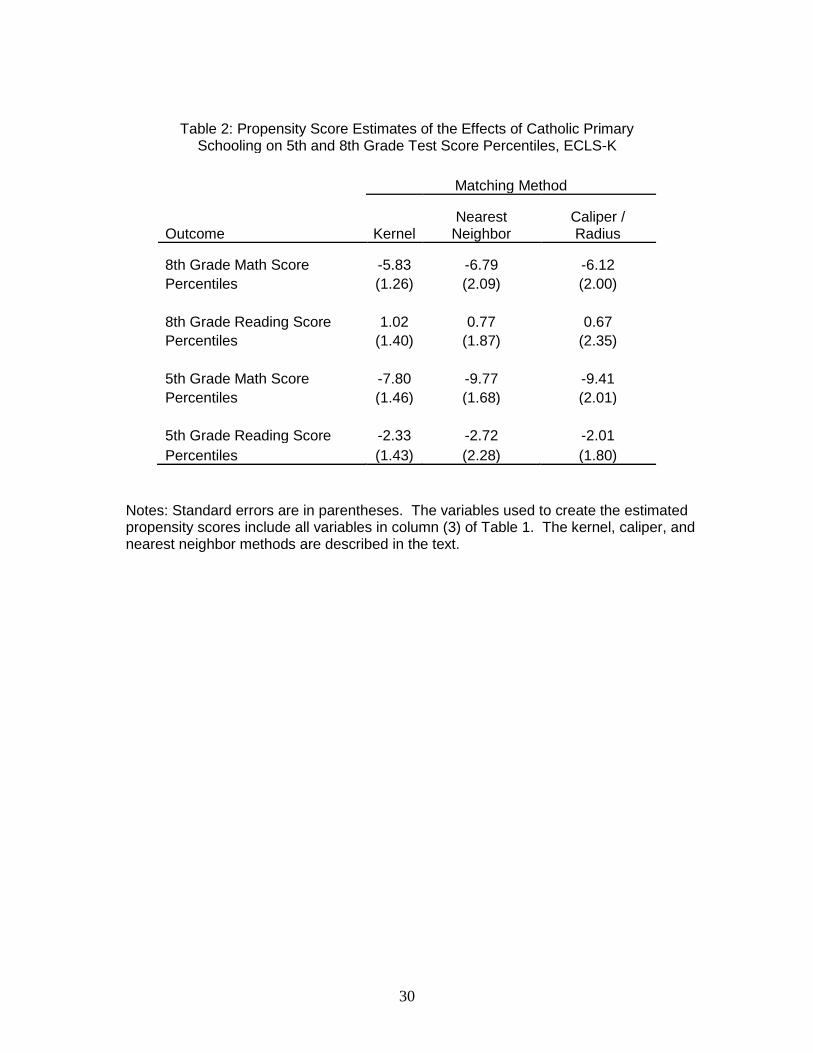
Table 2 contains the results from the propensity score analyses, based on the kernel
matching, caliper matching, and nearest neighbor matching approaches described above. The
reported results are the differences in means between the set of students who were enrolled in
Catholic schools and the matched set of public school students. The propensity score is
estimated using a probit model on the full set of kindergarten controls, which correspond to the
same set of covariates used in column (3) of Table 1. Regression-adjusted estimates are similar
to the simple averages and are therefore not reported.9
The point estimates in Table 2 are generally similar to the OLS estimates in columns (3)
and (4) of Table 1. In all specifications, Catholic primary schooling is associated with
significantly lower mathematics scores. The estimates indicate that Catholic primary schooling
has an insignificant effect on eighth-grade reading scores, with point estimates of 0.67 to 1.02
percentile points. The estimates are negative for fifth-grade reading scores but are statistically
insignificant in all three specifications. In all cases, standard errors are calculated from 200
bootstrapped samples drawn with replacement within school clusters, which allows for
correlations among students attending the same school and accounts for estimation error in the
propensity scores. However, Abadie and Imbens (2008) argue that the bootstrap is inappropriate
for nearest-neighbor matching and possibly for caliper matching, so we focus hereafter on the
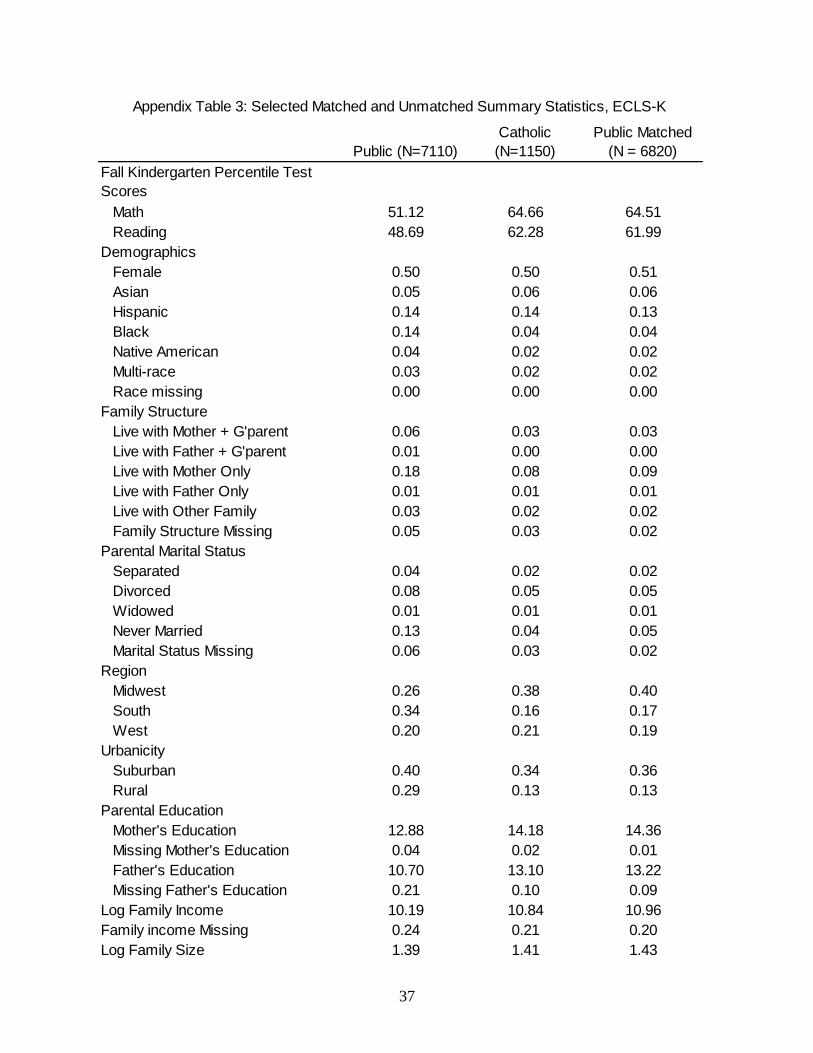
kernel density matching estimates. Appendix Table 3 illustrates the effectiveness of the kernel
density matching procedure by presenting summary statistics for the treatment, control, and
9 The primary advantage of such “doubly robust” estimators is that they potentially control for misspecification of
the propensity score. As Bang and Robins (2005) describe, as long as either the propensity score or the model of
outcomes is specified correctly, the resulting estimates of will be consistent. The similarity of the doubly robust
estimates and the simple mean differences suggests that misspecification of the propensity score is not an important
factor in the estimates in Table 2. We report the simple mean differences for simplicity and to be consistent with the
previous literature on Catholic schooling.
15
matched control samples. As the table shows, the large differences between public and Catholic
school students in the covariates are almost entirely eliminated by reweighting the sample of
public school students.10
The fact that the estimated effects of Catholic schools are insensitive to controlling for
observable characteristics via OLS or by using them to create propensity score-matched samples
suggests that both methods would capture the causal effects of Catholic schooling if the
“selection on observables” assumption holds. However, there is reason to doubt that this
assumption holds, given the large observable differences between Catholic and public primary
students implied by Tables 1 and 2. We turn next to assessing the sensitivity of the estimates to
possible systematic unobservable differences between Catholic and public students.
Selection on Observables and Unobservables
Table 3 presents results from models based on the techniques developed in Altonji et al.
(2005a). As discussed above, these techniques are based on asking how strong the relationship
between Catholic primary schooling and unobservable determinants of outcomes would have to
be, relative to the strength of the relationship between Catholic primary schooling and observable
determinants of outcomes, in order to attribute the entire estimated effects of Catholic school
attendance to selection bias. This approach relaxes the “selection on observables” assumption
but, unlike the matching estimators, imposes linearity, so we view the two sets of estimates as
complementary.
10
Using pairwise t tests, we reject the hypothesis of no mean differences at the 5 percent level between the matched
public and Catholic samples for 2 of the 42 included covariates, Midwest and West region. This is consistent with
the notion that the samples represent balanced populations, as one would expect to reject mean equality in roughly 5
percent of cases (the rejection rate under a true null). We also ran a single F-test for joint significance of the
difference in the covariate means between the treatment and matched control samples, obtaining an F-statistic of
0.61 (p = 0.94). This again suggests that the matched samples represent balanced populations.
16
Column (1) of the table replicates the OLS estimates from column (3) of Table 1, which
are based on models that include the full set of controls but no state indicators. In column (2),
we present the estimates of bias in these estimates, i.e., )
), based on the condition that
“selection on the observables equals selection on unobservables” In the top row, which refers to
eighth grade mathematics scores, this estimated bias is 14.01, with a standard error of 1.30.11
In
other words, the strong positive correlation between Catholic primary schooling and observable
determinants of outcomes (represented by the index ) implies that Catholic schooling is also
strongly positively related to , resulting in positive bias in the OLS estimates of .
Column (3) of the table, labeled “Implied Ratio”, shows the ratio of the OLS estimate to
the estimated bias in column (2). This ratio is an estimate of how strong selection on unobserved
variables would have to be relative to selection on observed variables to produce the OLS
estimate if the true Catholic schooling effect were zero. In the top row, this implied ratio is
negative, meaning that selection on observables and unobservables would have to be of opposite
signs to be consistent with a true effect of zero. Although the “selection on the observables
equals selection on unobservables” condition is unlikely to hold exactly, it is likely that selection
on observables and unobservables at least be of the same sign. Based on this logic, the negative
OLS point estimate in column (1) can be viewed as an upper bound – Catholic primary schooling
likely lowers math test scores by at least 5.96 percentile points.
In the second row, which presents results for eighth-grade reading scores, the OLS
estimate implies a small, positive effect of Catholic schooling on reading achievement.
However, the estimated bias is 16.91, implying that the OLS estimate would be solely driven by
selection bias if selection on unobservables were only 5 percent as strong as selection on
11
Standard errors in columns (2) and (3) are obtained via 200 bootstrapped samples drawn with replacement within
school clusters.

17
observables. If selection on unobservables were instead equal to selection on observables, the
implied treatment effect is negative 15.98 (= 0.93 – 16.91) percentile points.
The remaining rows of the table show estimates for fifth-grade mathematics and reading
test scores. These results imply that the negative OLS and matching estimates may actually
understate the negative effects of Catholic schooling, casting substantial doubt on the existence
of a positive effect of Catholic primary schooling on achievement. In both fifth and eighth
grades, the estimates are consistent with a large negative effect of Catholic primary schooling on
mathematics skills.
VI. Non-cognitive Outcomes
Although the estimates presented thus far imply that Catholic primary schools do not
boost test scores, they may affect other outcomes valued by both parents and students. This
scenario is especially plausible given the findings of Altonji et al. (2005a), who provide
compelling evidence that Catholic high schools influence outcomes such as high school
completion and college attendance while having no discernible effects on test scores. Recent
authors such as Heckman, Stixrud, and Urzua (2006) and Heckman, Pinto, and Savelyev (2012)
have argued that noncognitive skills, such as those captured by measures of suspension from
school and absences, are often more powerful predictors of adult outcomes (such as wages) than
are test scores. In light of the potential importance of non-cognitive skills and the previous
evidence that Catholic schooling influences non-cognitive skills, we turn next to analyses of
these outcomes.
Our measures of non-cognitive skills include three measures taken from the fifth grade
survey: the number of days absent and the number of days tardy as reported in school records,
and the “locus of control” scale reported by students. We also analyze two measures taken from
18
the eighth grade survey: an indicator for whether the student had repeated a grade at any time up
to that point, and an indicator for whether the student was suspended (either in- or out-of-school)
in the past school year. Coleman and DeLeire (2003) argue that locus of control is a determinant
of eventual educational attainment, whereas Cebi (2007) finds that locus of control is positively
associated with wages conditional on test scores.12
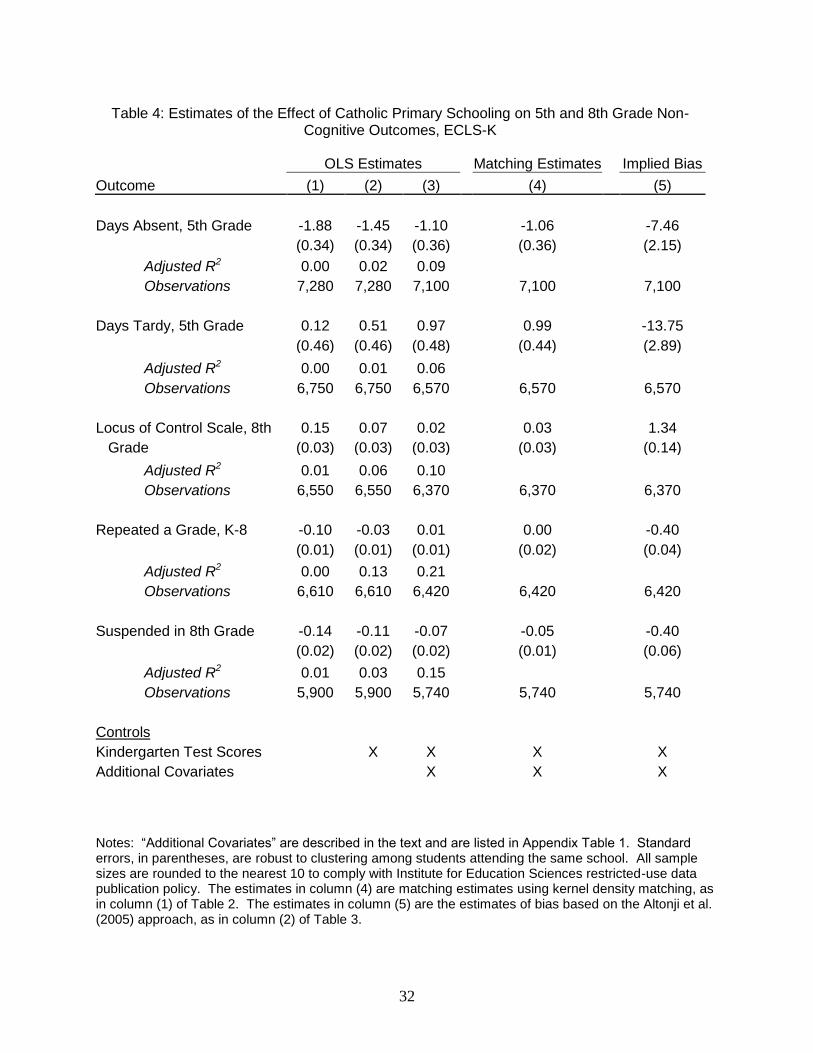
Table 4 contains the estimated effects of Catholic primary schooling on all of these
outcomes. The first three columns present OLS results analogous to the specifications in Table
1, column (4) present estimates based on kernel density matching using the full set of controls,
and column (5) shows estimates of implied bias based on the Altonji et al. (2005a) assumptions.
The first set of results in the table show that Catholic schooling is associated with a reduction in
absences of approximately 1.1 days in columns (3) and (4). These estimates are nearly identical
to those found by Jepsen (2003) based on Prospects data. Conversely, Catholic schooling is
associated with an increase in tardiness of roughly 1 day (the OLS results in column (3) and
matching results in column (4) are strikingly similar across all five outcomes in the table).
However, both absenteeism and tardiness are strongly associated with observable covariates that
are in turn associated with Catholic schooling. As a result, the estimates in column (5) imply
that if selection on observables and unobservables were identical, the OLS and matching
estimates are strongly negatively biased. Using the OLS estimate, the implied treatment effect
on days absent is 6.36 (= -1.10 + 7.46), which corresponds to a large harmful effect of Catholic
schooling. Thus, despite evidence that Catholic schooling might reduce absences (and increase
12
Locus of control is measured as the sum of the following 4-point scale variables (with each variable given a
numerical value of 1 for a response of “strongly disagree”, 2 for “disagree”, 3 for “agree”, and 4 for “strongly
agree”): “I don’t have enough control over the direction my life is taking”; “In my life, good luck is more important
than hard work for success”; “Every time I try to get ahead, something or somebody stops me”; “My plans hardly
ever work out, so planning only makes me unhappy”; and “Chance and luck are very important for what happens in
my life”. The sum of these scales is then standardized to be mean zero, ranging from -3 to 1.5.
19
tardiness), we are hesitant to draw firm conclusions because there is so much potential for bias
even in the richest OLS and matching models.
The results are similar for the other outcomes shown in the table. For both the locus of
control and grade repetition measures, the raw differences shown in column (1) imply large
beneficial effects of Catholic schools that disappear one detailed controls are included in
columns (3) and (4). On the other hand, we find a negative relationship between Catholic
schooling and the likelihood of parent-reported suspension using both OLS and matching
specifications. In our preferred specification in column (4), Catholic schooling is associated with
a five percentage-point reduction in suspension. However, the “selection on observables equals
selection on unobservables” condition implies large harmful effects of Catholic schools for all
outcomes. We again stress that, although we are wary to interpret the Altonji et al. (2005a)
condition as being literally true, the bias calculations in column (5) are so large that they
illustrate a substantial potential for bias in all of these cases.
Overall, the matching and OLS results show no consistent effect of Catholic schooling on
non-cognitive outcomes other than a notable reduction in the likelihood of suspension in eighth
grade. In all cases, estimates based on the Altonji et al. (2005a) approach imply that any modest
beneficial effects on non-cognitive outcomes would be fully accounted for by selection bias if
the strength of selection on unobservables is only a small fraction of the strength of selection on
unobservables.
VII. Relation to Previous Work: A Comparison of ECLS-K and NELS:88
The results presented above paint a pessimistic picture of the efficacy of Catholic
schooling relative to the previous literature. Several empirical studies, including Evans and
Schwab (1995), Sander (1996), Neal (1997), Grogger et al. (2000), Jepsen (2003), and Altonji et
20
al. (2005a), find evidence of positive effects of Catholic schooling on student outcomes.
Sander’s (1996) and Jepsen’s (2003) results are most relevant to those found here, as both of
these authors analyze primary schooling and achievement; both find small positive effects of
Catholic primary schooling on test scores, although statistically insignificant in the case of
Jepsen (2003). Even though Altonji et al. (2005a) do not focus on primary schooling, they note
that Catholic eighth graders have substantial test score advantages even conditional on a rich set
of controls available in the National Educational Longitudinal Survey of 1988 (NELS:88).
Rather than attempting to reconcile all of the potential sources of variation in the findings
of these studies, we opt to focus on an illustrative example that highlights the importance of
controlling for achievement differences that exist prior to school entry. None of the previous
studies had access to test scores early in kindergarten, as these measures are unique to ECLS-K.
It is thus potentially informative to assess what the estimates in ECLS-K would be if these data
did not include early-kindergarten test scores, but instead only included those covariates found in
education datasets such as NELS:88 or High School and Beyond.
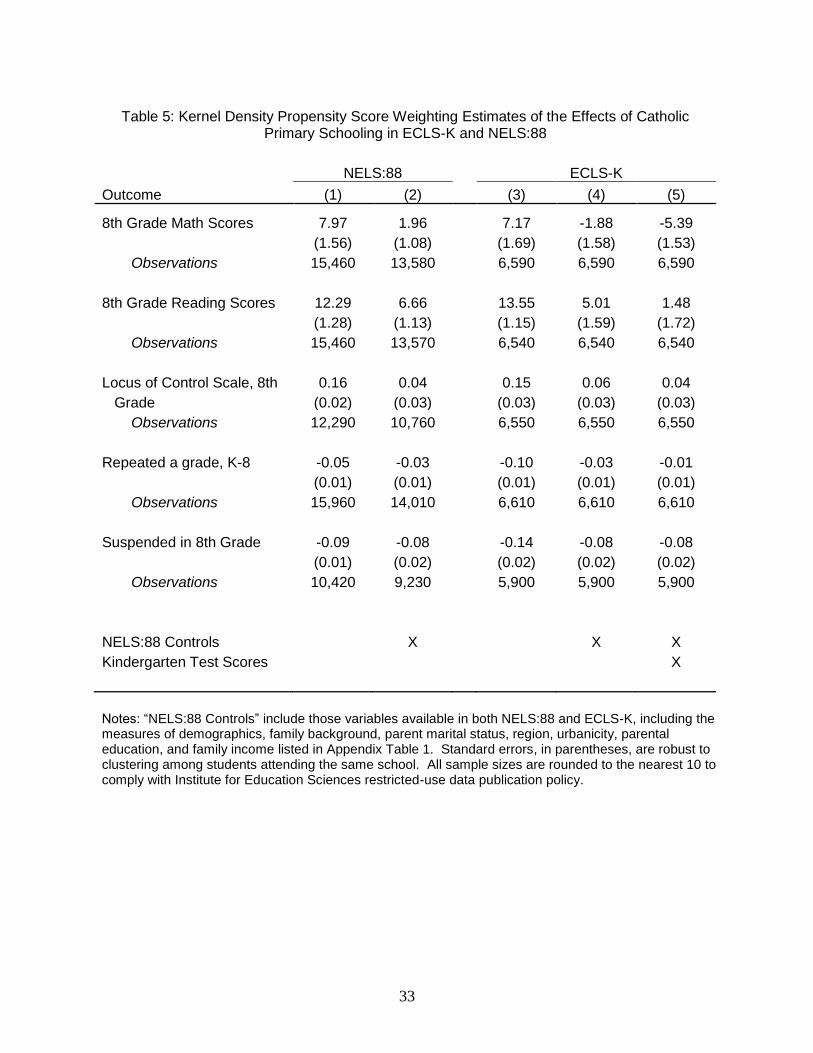
In Table 5, we use various control sets to present estimates from NELS:88 and ECLS-K
of the effects of Catholic schooling on the five outcomes common to both data sets: eighth grade
math and reading scores, the locus of control scale, an indicator for whether a student repeated a
grade at any time up to eighth grade, and an indicator for whether the student was suspended in
the past school year. Columns (1) and (3) present raw differences. In columns (2) and (4), we
report estimates from kernel density matching models, where the propensity score is a function
of control variables that are common to both data sets, including student characteristics (sex and
race/ethnicity), family background (log family income, maternal and paternal education), parent
marital status, family structure (including indicators for whether both parents live in the child’s
21
household), region, and urbanicity. All of these variables, which correspond to the control set
used in Altonji et al.’s (2005a) analysis of NELS:88, are listed in Appendix Table 1. Column (5)
includes kindergarten test scores in the estimation of the propensity score.
The similarity between the estimates in columns (1) and (3) is striking: the bivariate
relationships between Catholic schooling and all five outcomes are remarkably similar in the two
data sets. For the non-cognitive outcomes, the estimates in columns (2) and (4) are also similar,
implying that the controls are similarly predictive of Catholic schooling and these outcomes in
both datasets. For test scores, the estimates in column (4) are slightly smaller than those in
column (2), implying that selection on these observables is slightly stronger in ECLS-K than in
NELS:88 for these outcomes.
Finally, a comparison of columns (2), (4), and (5) highlights the central role of
kindergarten test scores. The mean differences imply large positive effects of Catholic primary
schooling on eighth grade reading scores and small positive (in NELS:88) or small, insignificant
negative (in ECLS-K) effects on math scores. Based on either column (2) or (4), a researcher
might conclude that Catholic primary schooling boosts test scores, while column (5) supports the
opposite conclusion. Clearly, the kindergarten test scores have a larger practical effect on the
estimates than any other difference between the two data sets. This comparison emphasizes the
importance of controls for achievement prior to school entry in analyzing the effects of Catholic
primary schooling, or potentially in analyzing the effects of any primary school intervention on
achievement.
VIII. Conclusions
A substantial body of research has investigated the effects of Catholic schooling on
student outcomes. Much of the literature has focused on Catholic high schools, typically finding

22
that Catholic schooling boosts educational attainment as well as student achievement. In this
paper, we instead assess the effects of Catholic primary schooling. An advantage of this focus
lies in our ability to carefully control for the achievement levels of students near the beginning of
the kindergarten year, before much formal schooling has taken place. Catholic school students
have large advantages in both mathematics and reading test scores at the start of kindergarten,
and the mathematics gap declines substantially between kindergarten and eighth grade. The
reading gap neither diminishes nor grows over time. These temporal patterns suggest that much
of the test score advantage of eighth graders in Catholic schools reflects selection bias, in the
form of differences in skills that existed prior to kindergarten.
In order to further assess the role of selection bias, we pursue an empirical approach
based on simple OLS estimates, propensity score matching estimators, and the techniques
developed by Altonji, Elder, and Taber (2005a) to use selection on observed variables to quantify
the importance of selection on unobserved variables. Although the identifying assumptions
differ across these methods, several patterns in the results do not. Catholic primary schooling is
consistently associated with lower mathematics achievement, with estimated effects ranging
from two to ten percentile-point reductions in test scores. Catholic schooling also does not
appear to substantively increase reading scores in fifth and eighth grades. The estimates based
on the Altonji, Elder, and Taber (2005a) approach suggest that the small positive matching and
OLS estimates are driven by selection bias – for example, if the association between
unobservable determinants of eighth-grade reading scores and Catholic schooling is only 5
percent as strong as the corresponding association between the observable determinants and
Catholic schooling, selection bias is solely responsible for the OLS estimate.
23
When we consider non-cognitive outcomes such as measures of attendance, locus of
control, grade repetition, and suspension, we again find little evidence of a positive Catholic
primary schooling effect. Matching estimates of Catholic schooling effects imply small
beneficial effects on absences and suspension, a modest harmful effect on tardiness, and small,
statistically insignificant effects on locus of control and grade repetition.
Taken together, the estimates presented in this paper do not point to any discernible
beneficial effects of Catholic primary schooling, at least in terms of the outcomes available in
ECLS-K. In fact, the only unambiguous finding that emerges is that Catholic primary schooling
reduces math scores. Uncovering the mechanisms underlying this negative effect is an important
area for future research, especially considering that it exists in spite of arguably better peer group
quality at Catholic schools in comparison to public schools. One possible explanation is lower
teacher quality in Catholic schools relative to public schools. In 2007-2008, private elementary
school teachers had an average salary of $35,730, compared to an average of $51,660 in public
schools (Snyder and Dillow, 2012). This pay gap exists both unconditionally and conditional on
a variety of teacher characteristics, such as education and experience. Given this gap, it is quite
conceivable that Catholic schools face difficulties in attracting high-quality teachers (Brekke
(2013) documents programs intended to attract teachers to low-wage Catholic schooling
positions in several cities). Other potential explanations for lower Catholic school achievement
include superior curriculum design in public schools.
Another potential goal of future research is to shed more light on the effects of Catholic
primary schooling on non-cognitive outcomes, including how these effects vary across
demographic subgroups. The estimates presented here do not provide strong evidence for
beneficial Catholic primary schooling effects on non-cognitive outcomes, but they do not

24
conclusively rule out small beneficial effects either. Given the recent proliferation of research
suggesting that non-cognitive skills may be more important than test scores for predicting adult
outcomes, future work on the influence of Catholic schooling on non-cognitive skills will be
essential to assess the overall effectiveness of Catholic primary schools.
25
VIII. References
Abadie, Alberto, and Guido W. Imbens. 2006. Large Sample Properties of Matching Estimators
for Average Treatment Effects. Econometrica 74(1): 235-268.
Abadie, A., & Imbens, G. W. 2008. On the Failure of the Bootstrap for Matching Estimators.
Econometrica 76(6): 1537-1557.
Altonji, Joseph, Todd Elder, and Christopher Taber. 2005a. Selection on Observed and
Unobserved Variables: Assessing the Effectiveness of Catholic Schools. Journal of
Political Economy 113(1): 151-184.
Altonji, Joseph, Todd Elder, and Christopher Taber. 2005b. An Evaluation of Instrumental
Variable Strategies for Estimating the Effects of Catholic Schools. Journal of Human
Resources 40(4): 791-821.
Bang, Heejun, and James M. Robins. 2005. Doubly Robust Estimation in Missing Data and
Causal Inference Models. Biometrics 61(4): 962-972.
Brekke, Gregg. 2013. Innovative Program Helps Retain Catholic Teachers. Religion News
Service. January 4, 2013. Accessed September 2013 from
http://www.religionnews.com/2013/01/02/innovative-program-helps-retain-catholic-
teachers/
Carbonaro, William. 2006. Public-Private Differences in Achievement among Kindergarten
Students: Differences in Learning Opportunities and Student Outcomes. American
Journal of Education 113(1): 31-66.
Cebi, Merve. 2007. Locus of Control and Human Capital Investment Revisited. Journal of
Human Resources 42(4): 919-932.
Cohen-Zada, Danny, and Todd Elder. 2009. Historical Religious Concentrations and the Effects
of Catholic Schooling. Journal of Urban Economics 66(1): 65-74.
Coleman, Margo, and Thomas DeLeire. 2003. An Economic Model of Locus of Control and the
Human Capital Investment Decision. Journal of Human Resources 38(3): 701-721.
Coleman, James S., Thomas Hoffer, and Sally Kilgore. 1982. High School Achievement:
Public, Catholic, and Private Schools Compared. New York: Basic Books.
Dee, Thomas, and Brian Jacob. 2009. The Impact of No Child Left Behind on Student
Achievement. National Bureau of Economic Research Working Paper No. 15531.
Frolich, Markus. 2004. Finite-Sample Properties of Propensity-Score Matching and Weighting
Estimators. The Review of Economics and Statistics 86(1): 77-90.
26
Heckman, J. J., Stixrud, J., & Urzua, S. (2006). The Effects of Cognitive and Noncognitive
Abilities on Labor Market Outcomes and Social Behavior. Journal of Labor Economics
24(3): 411-82.
Heckman, J., Pinto, R., & Savelyev, P. (2012). Understanding the Mechanisms Through Which
an Influential Early Childhood Program Boosted Adult Outcomes. American Economic
Review.
Jepsen, Christopher. 2003. The Effectiveness of Catholic Primary Schooling. Journal of
Human Resources 38(4): 928-941.
Jones, Ann M. 1998. Differential Effectiveness: Catholic and Public Fourth Graders’
Performance on the 1992 NAEP Mathematics Assessment. Ph.D. Dissertation. Boston,
MA: Boston College.
Lee, Valerie E., and Carolee Stewart. 1989. National Assessment of Educational Progress
Proficiency in Mathematics and Science: 1985-1986, Catholic and Public Schools
Compared. Washington, DC: National Catholic Education Association.
Leuven, Edwin, and Barbara Sianesi. 2003. Psmatch2: Stata Module to Perform Full
Mahalanobis and Propensity Score Matching, Common Support Graphing, and Covariate
Imbalance Testing. Available http://ideas.repec.org/c/boc/bocode/s432001.html.
Accessed 14 October 2005.
Lubienski, Christopher, Corinna Crane, and Sarah Thule Lubienski. 2008. What Do We Know
about School Effectiveness? Academic Gains in Public and Private Schools. Phi Delta
Kappan 89(9): 689-695.
Lubienski, Sarah Thule, and Christopher Lubienski. 2006. School Sector and Academic
Achievement: A Multilevel Analysis of NAEP Mathematics Data. American
Educational Research Journal 43(4): 651-698.
Marsh, Herbert W. 1992. Self-Description Questionnaire – I. Campbelltown, New South
Wales, Australia: University of Western Sydney, Macarthur.
Morgan, Stephen L. 2001. Counterfactuals, Causal Effect Heterogeneity, and the Catholic
School Effect on Learning. Sociology of Education 74(4): 341-374.
Mueser, Peter R., Kenneth R. Troske, and Alexey Goriaslavsky. 2007. Using State
Administrative Data to Measure Program Performance. Review of Economics and
Statistics 89(4): 761-783.
Reardon, Sean F., Jacob F. Cheadle, and Joseph P. Robinson. 2009. The Effects of Catholic
Schooling on Math and Reading Development in Kindergarten through Fifth Grade.
Journal of Research on Educational Effectiveness 2(1): 45-87.
Sander, William. 1996. Catholic Grade Schools and Academic Achievement. Journal of
Human Resources 31(3): 540-548.
27
Silverman, Bernard W. 1986. Density Estimation for Statistics and Data Analysis. New York.
Chapman and Hall.
Snyder, Thomas D., and Sally A. Dillow. Digest of Education Statistics 2011. (NCES 2012-
001). Washington, DC: National Center for Education Statistics.
Tourangeau, Karen, Christine Nord, Thanh Lê, Judith M. Pollack, and Sally Atkins-Burnett.
2006. ECLS-K: Combined User’s Manual for the ECLS-K Fifth-Grade Data Files and
Electronic Codebooks. (NCES 2006-032). Washington, DC: National Center for
Education Statistics.
28
Figure 1: Average Test Score Percentiles by Survey Wave and School Type, ECLS-K
40
45
50
55
60
65
Fall KG Spring KG Grade 1 Grade 3 Grade 5 Grade 8
Panel A: Mathematics Percentile Scores
Catholic Public
40
45
50
55
60
65
Fall KG Spring KG Grade 1 Grade 3 Grade 5 Grade 8
Panel B: Reading Percentile Scores
Catholic Public
29
Table 1: OLS Estimates of the Effect of Catholic Primary Schooling on 5th and 8th Grade Test Score Percentiles, ECLS-K
Outcome (1) (2) (3) (4)
8th Grade Math Scores 7.17 -1.50 -5.96 -4.62
(1.69) (1.35) (1.31) (1.33)
Adjusted R2 0.01 0.39 0.49 0.51
Observations 6,590 6,590 6,400 6,270
8th Grade Reading Scores 13.55 5.18 0.93 1.69
(1.69) (1.45) (1.40) (1.44)
Adjusted R2 0.02 0.36 0.44 0.46
Observations 6,540 6,540 6,360 6,230
5th Grade Math Scores 5.98 -3.40 -7.53 -6.22
(1.58) (1.32) (1.26) (1.25)
Adjusted R2 0.00 0.45 0.55 0.57
Observations 8,250 8,250 7,990 7,810
5th Grade Reading Scores 11.73 2.06 -1.98 -1.62
(1.74) (1.32) (1.30) (1.32)
Adjusted R2 0.02 0.43 0.51 0.52
Observations 8,250 8,250 7,980 7,800
Controls Kindergarten Test Scores
X X X
Additional Covariates
X X
State Indicators X
Notes: The test score percentile variables are created based on all valid test scores in a particular survey and range from 1 to 100. The entries for each model are the coefficient, standard error in parentheses, and the regression R2. The variables comprising “Additional Covariates” are described in the text and are listed in Appendix Table 1. Standard errors are robust to clustering among students attending the same school. All sample sizes are rounded to the nearest 10 to comply with Institute for Education Sciences restricted-use data publication policy.
30
Table 2: Propensity Score Estimates of the Effects of Catholic Primary Schooling on 5th and 8th Grade Test Score Percentiles, ECLS-K
Matching Method
Outcome Kernel Nearest
Neighbor Caliper / Radius
8th Grade Math Score -5.83 -6.79 -6.12
Percentiles (1.26) (2.09) (2.00)
8th Grade Reading Score 1.02 0.77 0.67
Percentiles (1.40) (1.87) (2.35)
5th Grade Math Score -7.80 -9.77 -9.41
Percentiles (1.46) (1.68) (2.01)
5th Grade Reading Score -2.33 -2.72 -2.01
Percentiles (1.43) (2.28) (1.80)
Notes: Standard errors are in parentheses. The variables used to create the estimated propensity scores include all variables in column (3) of Table 1. The kernel, caliper, and nearest neighbor methods are described in the text.

31
Table 3: Estimates of Bias in OLS Estimates of the Effects of Catholic Primary Schooling Based on Altonji et al. Methodology
Outcome (1) (2) (3)
OLS Estimate Estimated Bias
Implied Ratio
8th Grade Math Scores -5.96 14.01 -0.43
(1.31) (1.30) (0.11)
8th Grade Reading Scores 0.93 16.91 0.05
(1.40) (1.48) (0.09)
5th Grade Math Scores -7.53 11.26 -0.67
(1.26) (1.24) (0.15)
5th Grade Reading Scores -1.98 13.71 -0.14
(1.30) (1.33) (0.10)
Notes: The estimates in column (1) are identical to those shown in column (3) of Table 1. The estimates in column (2) are the estimates of bias based on the condition
)
)
)
), where estimates of are obtained from models that impose that
Catholic schools do not affect outcomes. The estimates in column (3) are the OLS estimates in column (1) divided by the estimated bias in column (2), representing the ratio of selection on unobservables to selection on observables that would be consistent with a zero effect of Catholic primary schooling on the specific test score. Standard errors are in parentheses. Standard errors in columns (2) and (3) are obtained via 200 bootstrapped samples drawn with replacement within school clusters to allow for correlations among students attending the same school.
32
Table 4: Estimates of the Effect of Catholic Primary Schooling on 5th and 8th Grade Non-Cognitive Outcomes, ECLS-K
OLS Estimates
Matching Estimates
Implied Bias
Outcome (1) (2) (3) (4) (5)
Days Absent, 5th Grade -1.88 -1.45 -1.10
-1.06
-7.46
(0.34) (0.34) (0.36)
(0.36)
(2.15)
Adjusted R2 0.00 0.02 0.09 Observations 7,280 7,280 7,100
7,100
7,100
Days Tardy, 5th Grade 0.12 0.51 0.97
0.99
-13.75
(0.46) (0.46) (0.48)
(0.44)
(2.89)
Adjusted R2 0.00 0.01 0.06 Observations 6,750 6,750 6,570
6,570
6,570
Locus of Control Scale, 8th 0.15 0.07 0.02
0.03
1.34
Grade (0.03) (0.03) (0.03)
(0.03)
(0.14)
Adjusted R2 0.01 0.06 0.10 Observations 6,550 6,550 6,370
6,370
6,370
Repeated a Grade, K-8 -0.10 -0.03 0.01
0.00
-0.40
(0.01) (0.01) (0.01)
(0.02)
(0.04)
Adjusted R2 0.00 0.13 0.21 Observations 6,610 6,610 6,420
6,420
6,420
Suspended in 8th Grade -0.14 -0.11 -0.07
-0.05
-0.40
(0.02) (0.02) (0.02)
(0.01)
(0.06)
Adjusted R2 0.01 0.03 0.15 Observations 5,900 5,900 5,740
5,740
5,740
Controls Kindergarten Test Scores
X X
X
X
Additional Covariates
X
X
X
Notes: “Additional Covariates” are described in the text and are listed in Appendix Table 1. Standard errors, in parentheses, are robust to clustering among students attending the same school. All sample sizes are rounded to the nearest 10 to comply with Institute for Education Sciences restricted-use data publication policy. The estimates in column (4) are matching estimates using kernel density matching, as in column (1) of Table 2. The estimates in column (5) are the estimates of bias based on the Altonji et al. (2005) approach, as in column (2) of Table 3.
33
Table 5: Kernel Density Propensity Score Weighting Estimates of the Effects of Catholic Primary Schooling in ECLS-K and NELS:88
NELS:88
ECLS-K
Outcome (1) (2) (3) (4) (5)
8th Grade Math Scores 7.97 1.96
7.17 -1.88 -5.39
(1.56) (1.08)
(1.69) (1.58) (1.53)
Observations 15,460 13,580
6,590 6,590 6,590
8th Grade Reading Scores 12.29 6.66
13.55 5.01 1.48
(1.28) (1.13)
(1.15) (1.59) (1.72)
Observations 15,460 13,570
6,540 6,540 6,540
Locus of Control Scale, 8th 0.16 0.04
0.15 0.06 0.04
Grade (0.02) (0.03)
(0.03) (0.03) (0.03)
Observations 12,290 10,760
6,550 6,550 6,550
Repeated a grade, K-8 -0.05 -0.03
-0.10 -0.03 -0.01
(0.01) (0.01)
(0.01) (0.01) (0.01)
Observations 15,960 14,010
6,610 6,610 6,610
Suspended in 8th Grade -0.09 -0.08
-0.14 -0.08 -0.08
(0.01) (0.02)
(0.02) (0.02) (0.02)
Observations 10,420 9,230
5,900 5,900 5,900
NELS:88 Controls
X
X X
Kindergarten Test Scores
X
Notes: “NELS:88 Controls” include those variables available in both NELS:88 and ECLS-K, including the measures of demographics, family background, parent marital status, region, urbanicity, parental education, and family income listed in Appendix Table 1. Standard errors, in parentheses, are robust to clustering among students attending the same school. All sample sizes are rounded to the nearest 10 to comply with Institute for Education Sciences restricted-use data publication policy.
34
Appendix Table 1: Summary Statistics by School Sector, ECLS-K
Full Sample (N=8,260)
Catholic Kindergarten
(N=1,150)
Public Kindergarten (N=7,110)
Variable Mean S. D. Mean Mean
Percentile Math Scores
Fall Kindergarten 53.01 28.23
64.66
51.12
Spring Kindergarten 53.25 27.87
63.20
51.62
1st Grade 53.03 28.25
60.19
51.86
3rd Grade 52.43 28.47
56.79
51.72
5th Grade 51.54 28.61
55.83
50.85
8th Grade 51.44 28.53
57.02
50.48
Percentile Reading Scores
Fall Kindergarten 50.59 28.38
62.28
48.69
Spring Kindergarten 51.47 27.98
61.15
49.89
1st Grade 52.32 27.91
59.70
51.11
3rd Grade 52.84 28.10
62.06
51.34
5th Grade 51.91 28.38
61.88
50.30
8th Grade 51.37 28.24
61.96
49.52
Non-Cognitive Outcomes
Days Absent, 5th Grade 6.55 7.44
5.31
6.75
Days Tardy 5th Grade 2.99 6.92
3.53
2.90
Locus of Control Scale 0.01 0.62
0.14
-0.01
Repeated a Grade, K-8 0.09 0.29
0.05
0.10
Suspended in 8th Grade 0.13 0.34
0.04
0.16
Demographics
Female 0.50 0.50
0.50
0.50
Asian 0.06 0.23
0.06
0.05
Hispanic 0.14 0.35
0.14
0.14
Black 0.13 0.33
0.04
0.14
Native American 0.04 0.18
0.02
0.04
Multi-race 0.03 0.16
0.02
0.03
Race missing 0.00 0.04
0.00
0.00
35
Appendix Table 1: Summary Statistics by School Sector, ECLS-K (cont.)
Full Sample (N=8,260)
Catholic Kindergarten
(N=1,150)
Public Kindergarten
(N=7,110)
Variable Mean S. D. Mean Mean
Family Structure
Live with Mother + G'parent 0.05 0.23
0.03
0.06
Live with Father + G'parent 0.01 0.08
0.00
0.01
Live with Mother Only 0.17 0.37
0.08
0.18
Live with Father Only 0.01 0.12
0.01
0.01
Live with Other Family 0.03 0.17
0.02
0.03
Family Structure Missing 0.05 0.22
0.03
0.05
Parental Marital Status
Separated 0.04 0.20
0.02
0.04
Divorced 0.08 0.27
0.05
0.08
Widowed 0.01 0.09
0.01
0.01
Never Married 0.12 0.32
0.04
0.13
Marital Status Missing 0.05 0.22
0.03
0.06
Region
Midwest 0.28 0.45
0.38
0.26
South 0.31 0.46
0.16
0.34
West 0.20 0.40
0.21
0.20
Urbanicity
Suburban 0.39 0.49
0.34
0.40
Rural 0.26 0.44
0.13
0.29
Parental Education
Mother's Education 13.06 3.23
14.18
12.88
Missing Mother's Education 0.04 0.19
0.02
0.04
Father's Education 11.03 5.77
13.10
10.70
Missing Father's Education 0.19 0.40
0.10
0.21
Log Family Income 10.28 1.99
10.84
10.19
Family income Missing 0.03 0.17
0.01
0.03
Log Family Size 1.39 0.42
1.41
1.39
Catholic School Kindergarten 0.14 0.35
1.00
0.00
36
Appendix Table 2: Propensity Score Estimates of the Effects of Catholic Primary Schooling on 5th and 8th Grade Test Score Percentiles, ECLS-K,
UNWEIGHTED
Matching Method
Outcome Kernel Nearest
Neighbor Caliper / Radius
8th Grade Math Score -4.92 -5.57 -4.77
Percentiles (0.86) (1.19) (1.02)
8th Grade Reading Score 0.93 -0.44 0.09
Percentiles (0.81) (1.23) (1.39)
5th Grade Math Score -7.40 -8.19 -8.44
Percentiles (0.70) (0.96) (1.09)
5th Grade Reading Score -0.99 -1.66 -1.45
Percentiles (0.89) (1.08) (0.94)
Notes: Standard errors are in parentheses. The variables used to create the estimated propensity scores include all variables in column (3) of Table 1. The kernel, caliper, and nearest neighbor methods are described in the text, and are identical to the methods used in Table 3.
37
Public (N=7110)
Catholic
(N=1150)
Public Matched
(N = 6820)
Fall Kindergarten Percentile Test
Scores
Math 51.12 64.66 64.51
Reading 48.69 62.28 61.99
Demographics
Female 0.50 0.50 0.51
Asian 0.05 0.06 0.06
Hispanic 0.14 0.14 0.13
Black 0.14 0.04 0.04
Native American 0.04 0.02 0.02
Multi-race 0.03 0.02 0.02
Race missing 0.00 0.00 0.00
Family Structure
Live with Mother + G'parent 0.06 0.03 0.03
Live with Father + G'parent 0.01 0.00 0.00
Live with Mother Only 0.18 0.08 0.09
Live with Father Only 0.01 0.01 0.01
Live with Other Family 0.03 0.02 0.02
Family Structure Missing 0.05 0.03 0.02
Parental Marital Status
Separated 0.04 0.02 0.02
Divorced 0.08 0.05 0.05
Widowed 0.01 0.01 0.01
Never Married 0.13 0.04 0.05
Marital Status Missing 0.06 0.03 0.02
Region
Midwest 0.26 0.38 0.40
South 0.34 0.16 0.17
West 0.20 0.21 0.19
Urbanicity
Suburban 0.40 0.34 0.36
Rural 0.29 0.13 0.13
Parental Education
Mother's Education 12.88 14.18 14.36
Missing Mother's Education 0.04 0.02 0.01
Father's Education 10.70 13.10 13.22
Missing Father's Education 0.21 0.10 0.09
Log Family Income 10.19 10.84 10.96
Family income Missing 0.24 0.21 0.20
Log Family Size 1.39 1.41 1.43
Appendix Table 3: Selected Matched and Unmatched Summary Statistics, ECLS-K