Embed Size (px)
Citation preview
2014-15 School Accountability Report Card for Arlington Heights Elementary School Page 1 of 13
Arlington Heights Elementary School
School Accountability Report Card
Reported Using Data from the 2014-15 School Year
Published During 2015-16
By February 1 of each year, every school in California is required by state law to publish a School Accountability Report Card (SARC). The SARC contains information about the condition and performance of each California public school. Under the Local Control Funding Formula (LCFF) all local educational agencies (LEAs) are required to prepare a Local Control Accountability Plan (LCAP), which describes how they intend to meet annual school-specific goals for all pupils, with specific activities to address state and local priorities. Additionally, data reported in an LCAP is to be consistent with data reported in the SARC. • For more information about SARC requirements, see the California Department of Education (CDE) SARC Web page at
http://www.cde.ca.gov/ta/ac/sa/. • For more information about the LCFF or LCAP, see the CDE LCFF Web page at http://www.cde.ca.gov/fg/aa/lc/. • For additional information about the school, parents/guardians and community members should contact the school principal or
the district office. DataQuest DataQuest is an online data tool located on the CDE DataQuest Web page at http://dq.cde.ca.gov/dataquest/ that contains additional information about this school and comparisons of the school to the district, the county, and the state. Specifically, DataQuest is a dynamic system that provides reports for accountability (e.g., test data, enrollment, high school graduates, dropouts, course enrollments, staffing, and data regarding English learners. Internet Access Internet access is available at public libraries and other locations that are publicly accessible (e.g., the California State Library). Access to the Internet at libraries and public locations is generally provided on a first-come, first-served basis. Other use restrictions may include the hours of operation, the length of time that a workstation may be used (depending on availability), the types of software programs available on a workstation, and the ability to print documents.
About This School Contact Information (Most Recent Year)
School Contact Information
School Name------- Arlington Heights Elementary School
Street------- 6401 Trenton Way
City, State, Zip------- Citrus Heights CA, 95621
Phone Number------- (916) 971-5234
Principal------- Rafael Martinez
E-mail Address------- [email protected]
Web Site------- http://www.sanjuan.edu/arlington
Grades Served K-5
CDS Code 34-67447-6034367
2014-15 School Accountability Report Card for Arlington Heights Elementary School Page 2 of 13
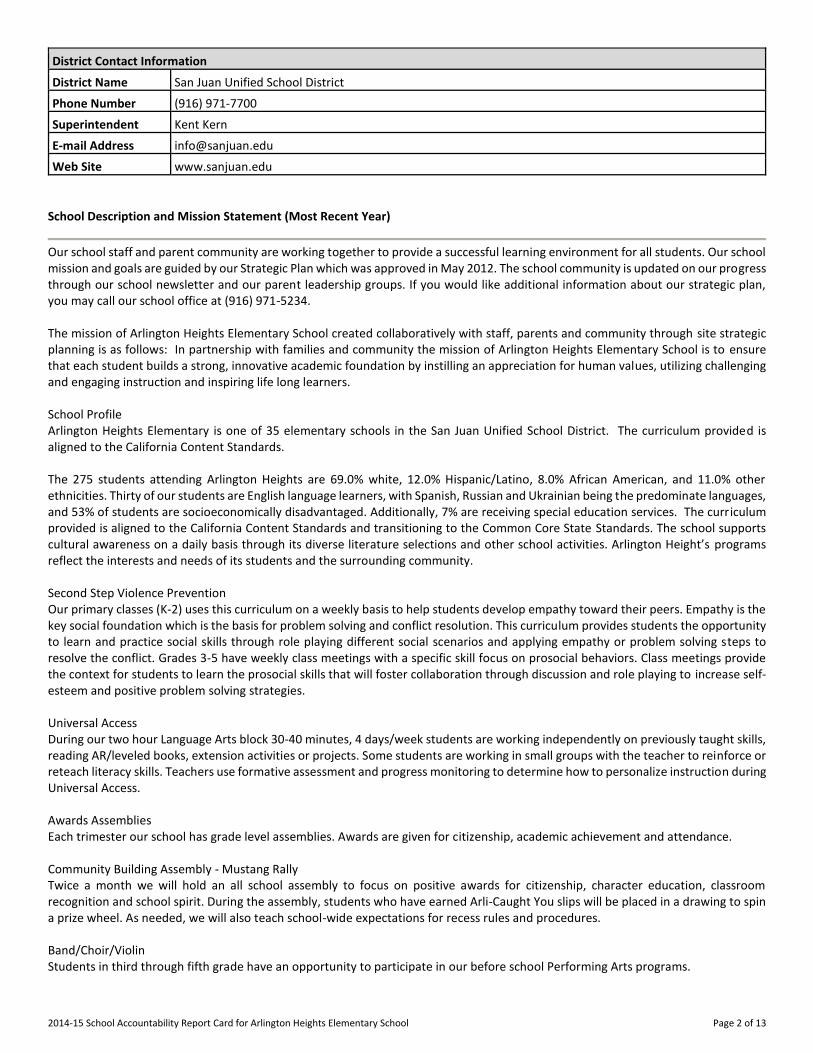
District Contact Information
District Name------- San Juan Unified School District
Phone Number------- (916) 971-7700
Superintendent-------
Kent Kern
E-mail Address------- [email protected]
Web Site------- www.sanjuan.edu
School Description and Mission Statement (Most Recent Year)
Our school staff and parent community are working together to provide a successful learning environment for all students. Our school mission and goals are guided by our Strategic Plan which was approved in May 2012. The school community is updated on our progress through our school newsletter and our parent leadership groups. If you would like additional information about our strategic plan, you may call our school office at (916) 971-5234. The mission of Arlington Heights Elementary School created collaboratively with staff, parents and community through site strategic planning is as follows: In partnership with families and community the mission of Arlington Heights Elementary School is to ensure that each student builds a strong, innovative academic foundation by instilling an appreciation for human values, utilizing challenging and engaging instruction and inspiring life long learners. School Profile Arlington Heights Elementary is one of 35 elementary schools in the San Juan Unified School District. The curriculum provided is aligned to the California Content Standards. The 275 students attending Arlington Heights are 69.0% white, 12.0% Hispanic/Latino, 8.0% African American, and 11.0% other ethnicities. Thirty of our students are English language learners, with Spanish, Russian and Ukrainian being the predominate languages, and 53% of students are socioeconomically disadvantaged. Additionally, 7% are receiving special education services. The curriculum provided is aligned to the California Content Standards and transitioning to the Common Core State Standards. The school supports cultural awareness on a daily basis through its diverse literature selections and other school activities. Arlington Height’s programs reflect the interests and needs of its students and the surrounding community. Second Step Violence Prevention Our primary classes (K-2) uses this curriculum on a weekly basis to help students develop empathy toward their peers. Empathy is the key social foundation which is the basis for problem solving and conflict resolution. This curriculum provides students the opportunity to learn and practice social skills through role playing different social scenarios and applying empathy or problem solving steps to resolve the conflict. Grades 3-5 have weekly class meetings with a specific skill focus on prosocial behaviors. Class meetings provide the context for students to learn the prosocial skills that will foster collaboration through discussion and role playing to increase self-esteem and positive problem solving strategies. Universal Access During our two hour Language Arts block 30-40 minutes, 4 days/week students are working independently on previously taught skills, reading AR/leveled books, extension activities or projects. Some students are working in small groups with the teacher to reinforce or reteach literacy skills. Teachers use formative assessment and progress monitoring to determine how to personalize instruction during Universal Access. Awards Assemblies Each trimester our school has grade level assemblies. Awards are given for citizenship, academic achievement and attendance. Community Building Assembly - Mustang Rally Twice a month we will hold an all school assembly to focus on positive awards for citizenship, character education, classroom recognition and school spirit. During the assembly, students who have earned Arli-Caught You slips will be placed in a drawing to spin a prize wheel. As needed, we will also teach school-wide expectations for recess rules and procedures. Band/Choir/Violin Students in third through fifth grade have an opportunity to participate in our before school Performing Arts programs.
2014-15 School Accountability Report Card for Arlington Heights Elementary School Page 3 of 13
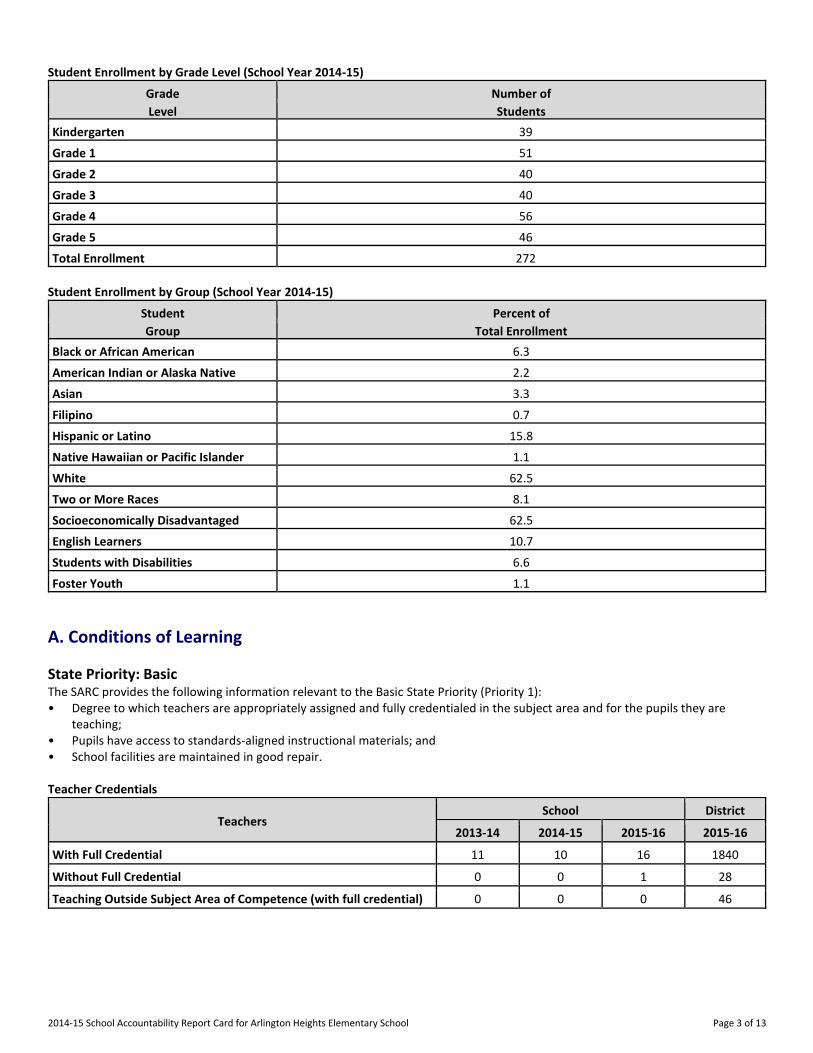
Student Enrollment by Grade Level (School Year 2014-15)
Grade Number of
Level Students
Kindergarten 39
Grade 1 51
Grade 2 40
Grade 3 40
Grade 4 56
Grade 5 46
Total Enrollment 272
Student Enrollment by Group (School Year 2014-15)
Student Percent of
Group Total Enrollment
Black or African American 6.3
American Indian or Alaska Native 2.2
Asian 3.3
Filipino 0.7
Hispanic or Latino 15.8
Native Hawaiian or Pacific Islander 1.1
White 62.5
Two or More Races 8.1
Socioeconomically Disadvantaged 62.5
English Learners 10.7
Students with Disabilities 6.6
Foster Youth 1.1
A. Conditions of Learning
State Priority: Basic The SARC provides the following information relevant to the Basic State Priority (Priority 1): • Degree to which teachers are appropriately assigned and fully credentialed in the subject area and for the pupils they are
teaching; • Pupils have access to standards-aligned instructional materials; and • School facilities are maintained in good repair. Teacher Credentials
Teachers School District
2013-14 2014-15 2015-16 2015-16
With Full Credential 11 10 16 1840
Without Full Credential 0 0 1 28
Teaching Outside Subject Area of Competence (with full credential) 0 0 0 46
2014-15 School Accountability Report Card for Arlington Heights Elementary School Page 4 of 13
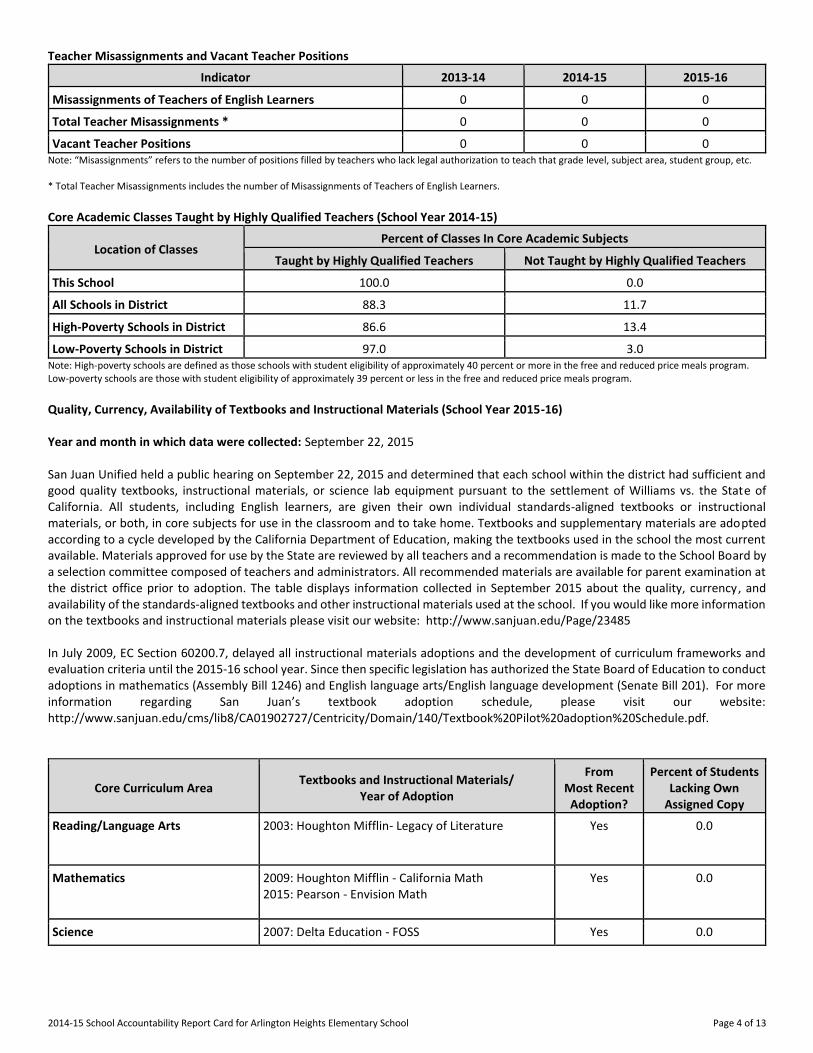
Teacher Misassignments and Vacant Teacher Positions
Indicator 2013-14 2014-15 2015-16
Misassignments of Teachers of English Learners 0 0 0
Total Teacher Misassignments * 0 0 0
Vacant Teacher Positions 0 0 0 Note: “Misassignments” refers to the number of positions filled by teachers who lack legal authorization to teach that grade level, subject area, student group, etc. * Total Teacher Misassignments includes the number of Misassignments of Teachers of English Learners. Core Academic Classes Taught by Highly Qualified Teachers (School Year 2014-15)
Location of Classes Percent of Classes In Core Academic Subjects
Taught by Highly Qualified Teachers Not Taught by Highly Qualified Teachers
This School 100.0 0.0
All Schools in District 88.3 11.7
High-Poverty Schools in District 86.6 13.4
Low-Poverty Schools in District 97.0 3.0 Note: High-poverty schools are defined as those schools with student eligibility of approximately 40 percent or more in the free and reduced price meals program. Low-poverty schools are those with student eligibility of approximately 39 percent or less in the free and reduced price meals program. Quality, Currency, Availability of Textbooks and Instructional Materials (School Year 2015-16) Year and month in which data were collected: September 22, 2015 San Juan Unified held a public hearing on September 22, 2015 and determined that each school within the district had sufficient and good quality textbooks, instructional materials, or science lab equipment pursuant to the settlement of Williams vs. the State of California. All students, including English learners, are given their own individual standards-aligned textbooks or instructional materials, or both, in core subjects for use in the classroom and to take home. Textbooks and supplementary materials are adopted according to a cycle developed by the California Department of Education, making the textbooks used in the school the most current available. Materials approved for use by the State are reviewed by all teachers and a recommendation is made to the School Board by a selection committee composed of teachers and administrators. All recommended materials are available for parent examination at the district office prior to adoption. The table displays information collected in September 2015 about the quality, currency, and availability of the standards-aligned textbooks and other instructional materials used at the school. If you would like more information on the textbooks and instructional materials please visit our website: http://www.sanjuan.edu/Page/23485 In July 2009, EC Section 60200.7, delayed all instructional materials adoptions and the development of curriculum frameworks and evaluation criteria until the 2015-16 school year. Since then specific legislation has authorized the State Board of Education to conduct adoptions in mathematics (Assembly Bill 1246) and English language arts/English language development (Senate Bill 201). For more information regarding San Juan’s textbook adoption schedule, please visit our website: http://www.sanjuan.edu/cms/lib8/CA01902727/Centricity/Domain/140/Textbook%20Pilot%20adoption%20Schedule.pdf.
Core Curriculum Area Textbooks and Instructional Materials/
Year of Adoption
From Most Recent
Adoption?
Percent of Students Lacking Own
Assigned Copy
Reading/Language Arts 2003: Houghton Mifflin- Legacy of Literature
Yes 0.0
Mathematics 2009: Houghton Mifflin - California Math
2015: Pearson - Envision Math
Yes 0.0
Science 2007: Delta Education - FOSS Yes 0.0
2014-15 School Accountability Report Card for Arlington Heights Elementary School Page 5 of 13
Core Curriculum Area Textbooks and Instructional Materials/
Year of Adoption
From Most Recent
Adoption?
Percent of Students Lacking Own
Assigned Copy
History-Social Science 2005: Teacher's Curriculum Institute (TCI) - History Alive
2006: Scott Foresman/Pearson - History - Social Science for California
Yes 0.0
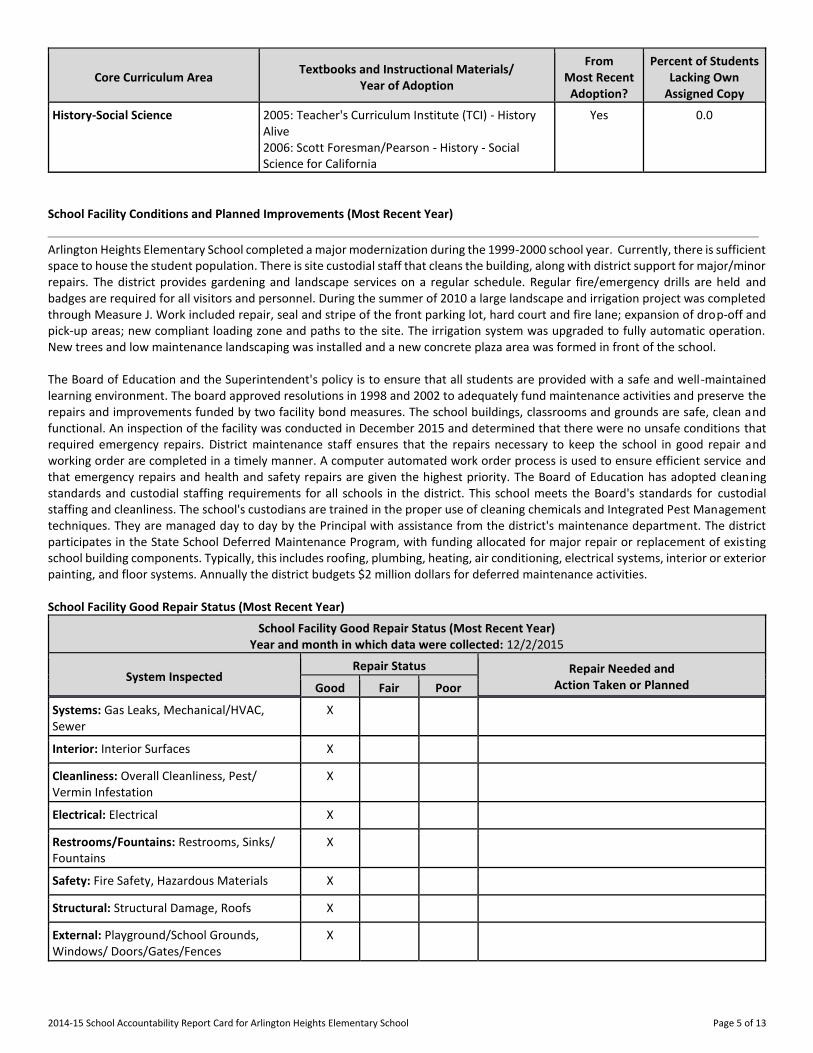
School Facility Conditions and Planned Improvements (Most Recent Year)
Arlington Heights Elementary School completed a major modernization during the 1999-2000 school year. Currently, there is sufficient space to house the student population. There is site custodial staff that cleans the building, along with district support for major/minor repairs. The district provides gardening and landscape services on a regular schedule. Regular fire/emergency drills are held and badges are required for all visitors and personnel. During the summer of 2010 a large landscape and irrigation project was completed through Measure J. Work included repair, seal and stripe of the front parking lot, hard court and fire lane; expansion of drop-off and pick-up areas; new compliant loading zone and paths to the site. The irrigation system was upgraded to fully automatic operation. New trees and low maintenance landscaping was installed and a new concrete plaza area was formed in front of the school. The Board of Education and the Superintendent's policy is to ensure that all students are provided with a safe and well-maintained learning environment. The board approved resolutions in 1998 and 2002 to adequately fund maintenance activities and preserve the repairs and improvements funded by two facility bond measures. The school buildings, classrooms and grounds are safe, clean and functional. An inspection of the facility was conducted in December 2015 and determined that there were no unsafe conditions that required emergency repairs. District maintenance staff ensures that the repairs necessary to keep the school in good repair and working order are completed in a timely manner. A computer automated work order process is used to ensure efficient service and that emergency repairs and health and safety repairs are given the highest priority. The Board of Education has adopted cleaning standards and custodial staffing requirements for all schools in the district. This school meets the Board's standards for custodial staffing and cleanliness. The school's custodians are trained in the proper use of cleaning chemicals and Integrated Pest Management techniques. They are managed day to day by the Principal with assistance from the district's maintenance department. The district participates in the State School Deferred Maintenance Program, with funding allocated for major repair or replacement of existing school building components. Typically, this includes roofing, plumbing, heating, air conditioning, electrical systems, interior or exterior painting, and floor systems. Annually the district budgets $2 million dollars for deferred maintenance activities. School Facility Good Repair Status (Most Recent Year)
School Facility Good Repair Status (Most Recent Year) Year and month in which data were collected: 12/2/2015
System Inspected Repair Status Repair Needed and
Action Taken or Planned Good Fair Poor
Systems: Gas Leaks, Mechanical/HVAC, Sewer
X
Interior: Interior Surfaces X
Cleanliness: Overall Cleanliness, Pest/ Vermin Infestation
X
Electrical: Electrical X
Restrooms/Fountains: Restrooms, Sinks/ Fountains
X
Safety: Fire Safety, Hazardous Materials X
Structural: Structural Damage, Roofs X
External: Playground/School Grounds, Windows/ Doors/Gates/Fences
X
2014-15 School Accountability Report Card for Arlington Heights Elementary School Page 6 of 13
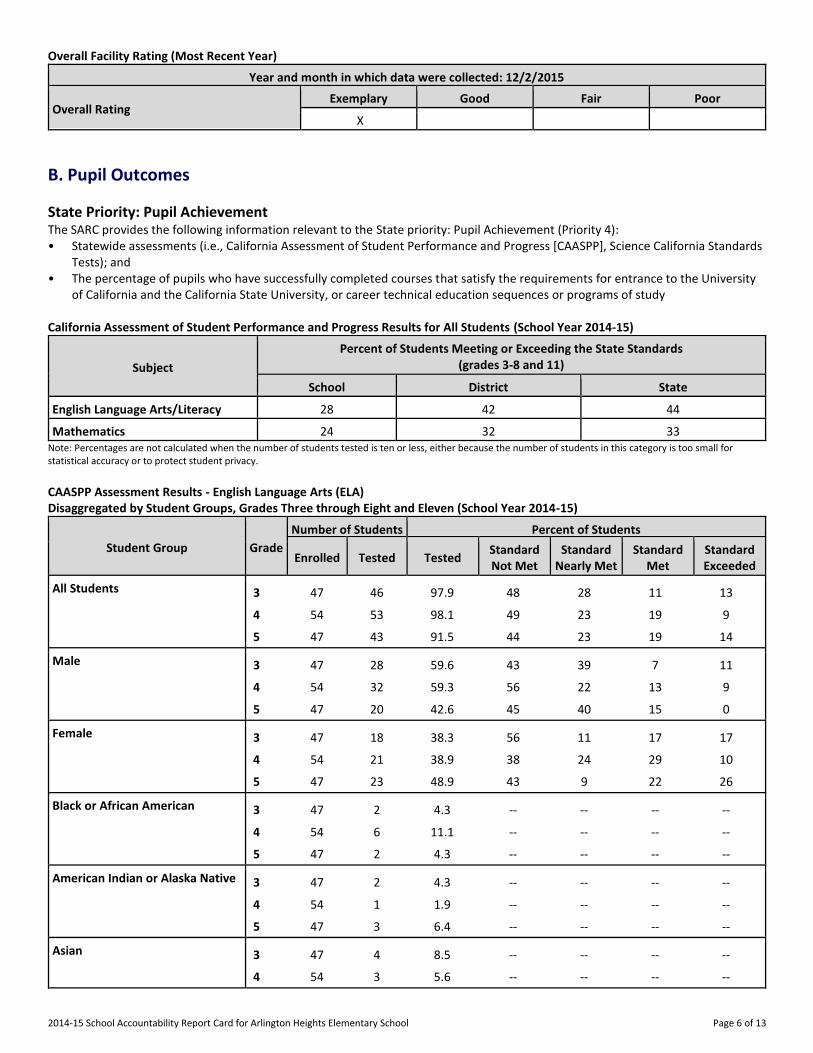
Overall Facility Rating (Most Recent Year)
Year and month in which data were collected: 12/2/2015
Overall Rating Exemplary Good Fair Poor
X
B. Pupil Outcomes
State Priority: Pupil Achievement The SARC provides the following information relevant to the State priority: Pupil Achievement (Priority 4): • Statewide assessments (i.e., California Assessment of Student Performance and Progress [CAASPP], Science California Standards
Tests); and • The percentage of pupils who have successfully completed courses that satisfy the requirements for entrance to the University
of California and the California State University, or career technical education sequences or programs of study California Assessment of Student Performance and Progress Results for All Students (School Year 2014-15)
Subject
Percent of Students Meeting or Exceeding the State Standards (grades 3-8 and 11)
School District State
English Language Arts/Literacy 28 42 44
Mathematics 24 32 33 Note: Percentages are not calculated when the number of students tested is ten or less, either because the number of students in this category is too small for statistical accuracy or to protect student privacy.
CAASPP Assessment Results - English Language Arts (ELA) Disaggregated by Student Groups, Grades Three through Eight and Eleven (School Year 2014-15)
Student Group Grade
Number of Students Percent of Students
Enrolled Tested Tested Standard Not Met
Standard Nearly Met
Standard Met
Standard Exceeded
All Students 3 47 46 97.9 48 28 11 13
4 54 53 98.1 49 23 19 9
5 47 43 91.5 44 23 19 14
Male 3 47 28 59.6 43 39 7 11
4 54 32 59.3 56 22 13 9
5 47 20 42.6 45 40 15 0
Female 3 47 18 38.3 56 11 17 17
4 54 21 38.9 38 24 29 10
5 47 23 48.9 43 9 22 26
Black or African American 3 47 2 4.3 -- -- -- --
4 54 6 11.1 -- -- -- --
5 47 2 4.3 -- -- -- --
American Indian or Alaska Native 3 47 2 4.3 -- -- -- --
4 54 1 1.9 -- -- -- --
5 47 3 6.4 -- -- -- --
Asian 3 47 4 8.5 -- -- -- --
4 54 3 5.6 -- -- -- --
2014-15 School Accountability Report Card for Arlington Heights Elementary School Page 7 of 13
Student Group Grade
Number of Students Percent of Students
Enrolled Tested Tested Standard Not Met
Standard Nearly Met
Standard Met
Standard Exceeded
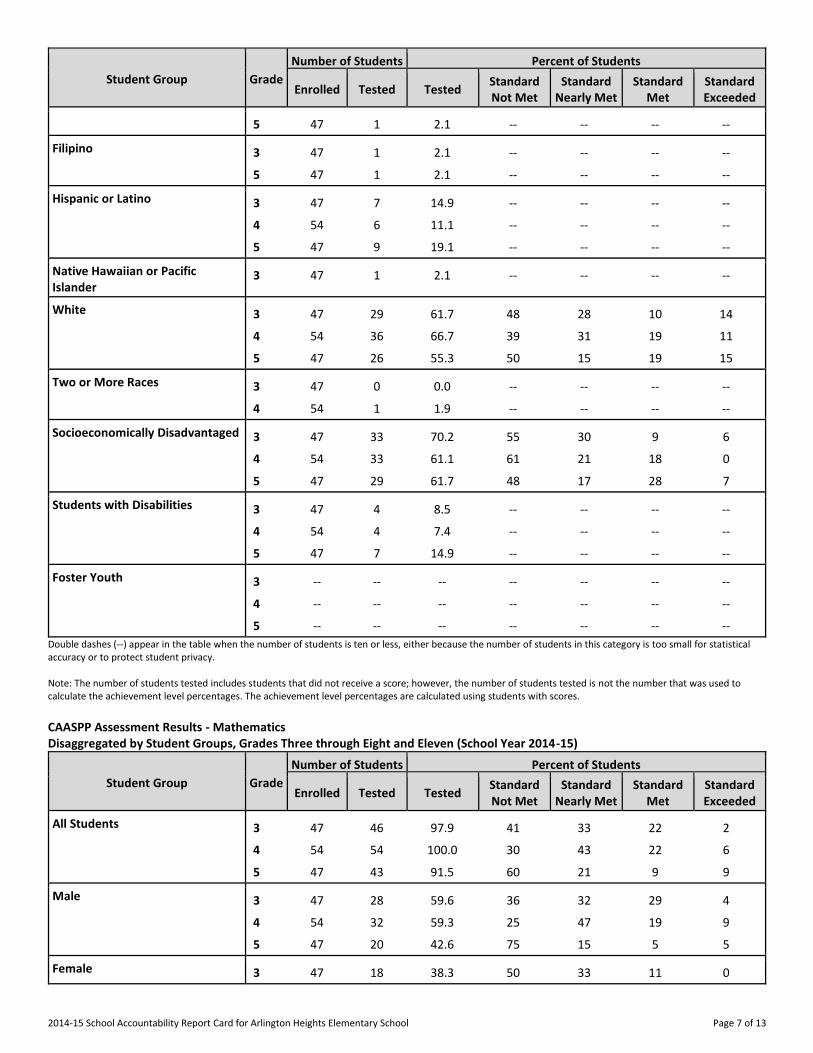
5 47 1 2.1 -- -- -- --
Filipino 3 47 1 2.1 -- -- -- --
5 47 1 2.1 -- -- -- --
Hispanic or Latino 3 47 7 14.9 -- -- -- --
4 54 6 11.1 -- -- -- --
5 47 9 19.1 -- -- -- --
Native Hawaiian or Pacific Islander
3 47 1 2.1 -- -- -- --
White 3 47 29 61.7 48 28 10 14
4 54 36 66.7 39 31 19 11
5 47 26 55.3 50 15 19 15
Two or More Races 3 47 0 0.0 -- -- -- --
4 54 1 1.9 -- -- -- --
Socioeconomically Disadvantaged 3 47 33 70.2 55 30 9 6
4 54 33 61.1 61 21 18 0
5 47 29 61.7 48 17 28 7
Students with Disabilities 3 47 4 8.5 -- -- -- --
4 54 4 7.4 -- -- -- --
5 47 7 14.9 -- -- -- --
Foster Youth 3 -- -- -- -- -- -- --
4 -- -- -- -- -- -- --
5 -- -- -- -- -- -- --
Double dashes (--) appear in the table when the number of students is ten or less, either because the number of students in this category is too small for statistical accuracy or to protect student privacy. Note: The number of students tested includes students that did not receive a score; however, the number of students tested is not the number that was used to calculate the achievement level percentages. The achievement level percentages are calculated using students with scores.
CAASPP Assessment Results - Mathematics Disaggregated by Student Groups, Grades Three through Eight and Eleven (School Year 2014-15)
Student Group Grade
Number of Students Percent of Students
Enrolled Tested Tested Standard Not Met
Standard Nearly Met
Standard Met
Standard Exceeded
All Students 3 47 46 97.9 41 33 22 2
4 54 54 100.0 30 43 22 6
5 47 43 91.5 60 21 9 9
Male 3 47 28 59.6 36 32 29 4
4 54 32 59.3 25 47 19 9
5 47 20 42.6 75 15 5 5
Female 3 47 18 38.3 50 33 11 0
2014-15 School Accountability Report Card for Arlington Heights Elementary School Page 8 of 13
Student Group Grade
Number of Students Percent of Students
Enrolled Tested Tested Standard Not Met
Standard Nearly Met
Standard Met
Standard Exceeded
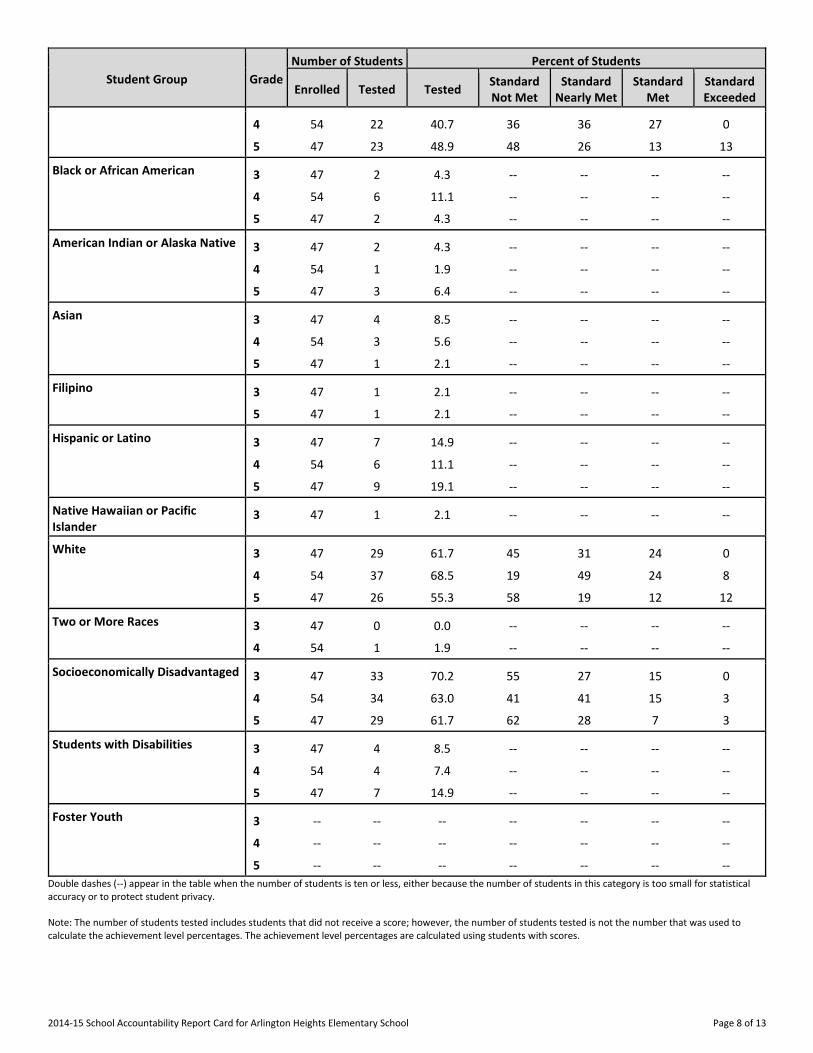
4 54 22 40.7 36 36 27 0
5 47 23 48.9 48 26 13 13
Black or African American 3 47 2 4.3 -- -- -- --
4 54 6 11.1 -- -- -- --
5 47 2 4.3 -- -- -- --
American Indian or Alaska Native 3 47 2 4.3 -- -- -- --
4 54 1 1.9 -- -- -- --
5 47 3 6.4 -- -- -- --
Asian 3 47 4 8.5 -- -- -- --
4 54 3 5.6 -- -- -- --
5 47 1 2.1 -- -- -- --
Filipino 3 47 1 2.1 -- -- -- --
5 47 1 2.1 -- -- -- --
Hispanic or Latino 3 47 7 14.9 -- -- -- --
4 54 6 11.1 -- -- -- --
5 47 9 19.1 -- -- -- --
Native Hawaiian or Pacific Islander
3 47 1 2.1 -- -- -- --
White 3 47 29 61.7 45 31 24 0
4 54 37 68.5 19 49 24 8
5 47 26 55.3 58 19 12 12
Two or More Races 3 47 0 0.0 -- -- -- --
4 54 1 1.9 -- -- -- --
Socioeconomically Disadvantaged 3 47 33 70.2 55 27 15 0
4 54 34 63.0 41 41 15 3
5 47 29 61.7 62 28 7 3
Students with Disabilities 3 47 4 8.5 -- -- -- --
4 54 4 7.4 -- -- -- --
5 47 7 14.9 -- -- -- --
Foster Youth 3 -- -- -- -- -- -- --
4 -- -- -- -- -- -- --
5 -- -- -- -- -- -- --
Double dashes (--) appear in the table when the number of students is ten or less, either because the number of students in this category is too small for statistical accuracy or to protect student privacy. Note: The number of students tested includes students that did not receive a score; however, the number of students tested is not the number that was used to calculate the achievement level percentages. The achievement level percentages are calculated using students with scores.
2014-15 School Accountability Report Card for Arlington Heights Elementary School Page 9 of 13
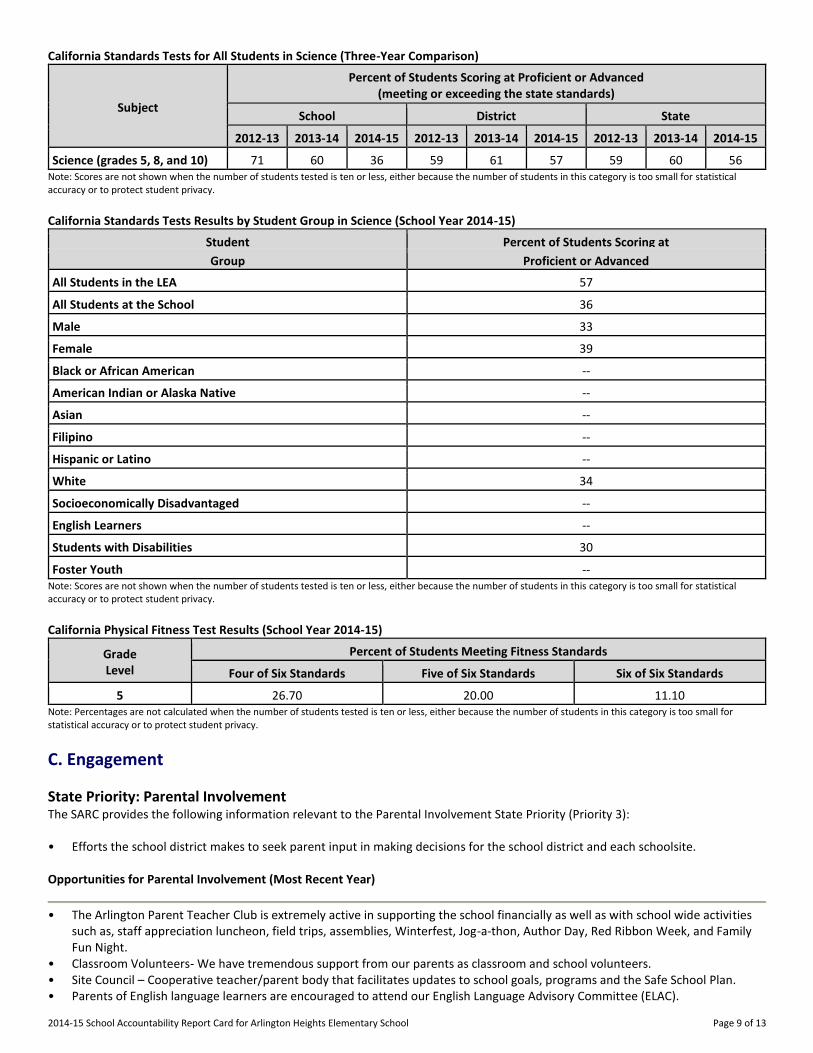
California Standards Tests for All Students in Science (Three-Year Comparison)
Subject
Percent of Students Scoring at Proficient or Advanced (meeting or exceeding the state standards)
School District State
2012-13 2013-14 2014-15 2012-13 2013-14 2014-15 2012-13 2013-14 2014-15
Science (grades 5, 8, and 10) 71 60 36 59 61 57 59 60 56 Note: Scores are not shown when the number of students tested is ten or less, either because the number of students in this category is too small for statistical accuracy or to protect student privacy.
California Standards Tests Results by Student Group in Science (School Year 2014-15)
Student Percent of Students Scoring at
Group Proficient or Advanced
All Students in the LEA 57
All Students at the School 36
Male 33
Female 39
Black or African American --
American Indian or Alaska Native --
Asian --
Filipino --
Hispanic or Latino --
White 34
Socioeconomically Disadvantaged --
English Learners --
Students with Disabilities 30
Foster Youth -- Note: Scores are not shown when the number of students tested is ten or less, either because the number of students in this category is too small for statistical accuracy or to protect student privacy.
California Physical Fitness Test Results (School Year 2014-15)
Grade Level
Percent of Students Meeting Fitness Standards
Four of Six Standards Five of Six Standards Six of Six Standards
---5--- 26.70 20.00 11.10 Note: Percentages are not calculated when the number of students tested is ten or less, either because the number of students in this category is too small for statistical accuracy or to protect student privacy.
C. Engagement
State Priority: Parental Involvement The SARC provides the following information relevant to the Parental Involvement State Priority (Priority 3): • Efforts the school district makes to seek parent input in making decisions for the school district and each schoolsite. Opportunities for Parental Involvement (Most Recent Year)
• The Arlington Parent Teacher Club is extremely active in supporting the school financially as well as with school wide activities
such as, staff appreciation luncheon, field trips, assemblies, Winterfest, Jog-a-thon, Author Day, Red Ribbon Week, and Family Fun Night.
• Classroom Volunteers- We have tremendous support from our parents as classroom and school volunteers. • Site Council – Cooperative teacher/parent body that facilitates updates to school goals, programs and the Safe School Plan. • Parents of English language learners are encouraged to attend our English Language Advisory Committee (ELAC).
2014-15 School Accountability Report Card for Arlington Heights Elementary School Page 10 of 13
• A parent represents the school by attending the Superintendent's Parent Advisory Committee (SPAC). Contact Information Parents or community members who wish to participate in leadership teams, school committees, school activities, or become a volunteer may email Rebecca Koons at [email protected] or contact the Arlington Heights Elementary school office at 971-5234. In addition, the school has a Family Resource Liaison who is our primary contact for district and community resources. Please, contact Michele Casaucau at [email protected] or through the Arlington Heights Elementary school office at 971-5234.
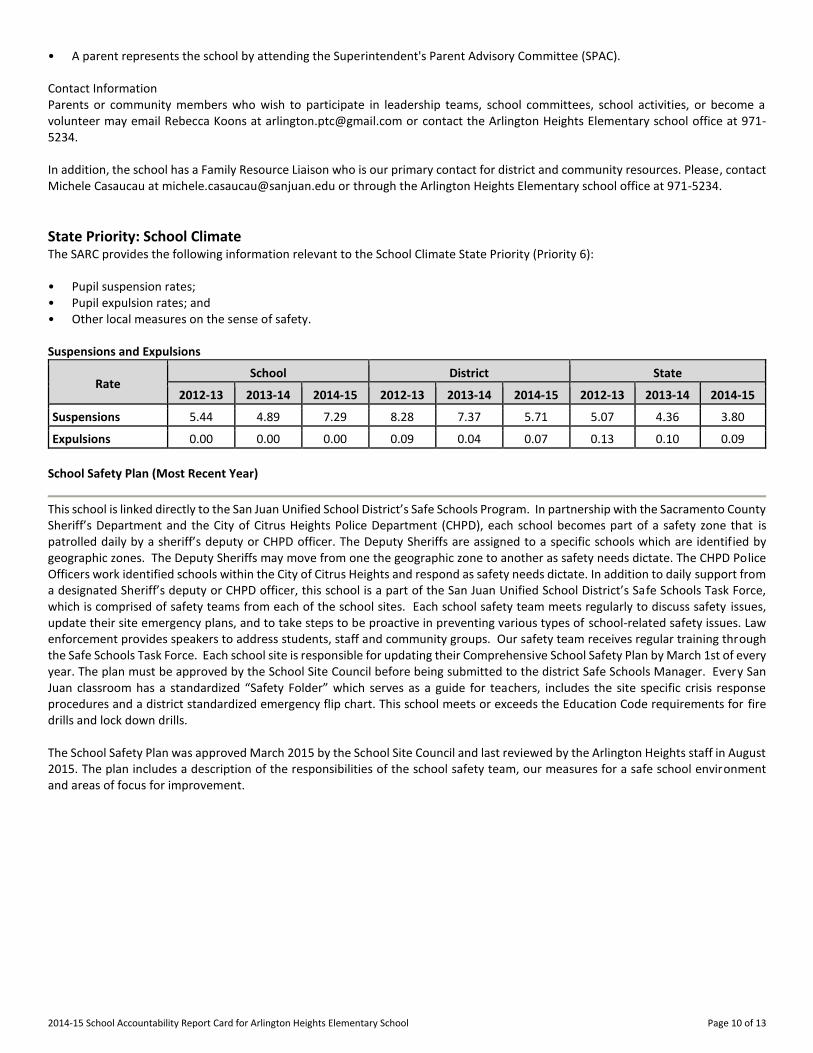
State Priority: School Climate The SARC provides the following information relevant to the School Climate State Priority (Priority 6): • Pupil suspension rates; • Pupil expulsion rates; and • Other local measures on the sense of safety. Suspensions and Expulsions
Rate School District State
2012-13 2013-14 2014-15 2012-13 2013-14 2014-15 2012-13 2013-14 2014-15
Suspensions------- 5.44 4.89 7.29 8.28 7.37 5.71 5.07 4.36 3.80
Expulsions------- 0.00 0.00 0.00 0.09 0.04 0.07 0.13 0.10 0.09
School Safety Plan (Most Recent Year)
This school is linked directly to the San Juan Unified School District’s Safe Schools Program. In partnership with the Sacramento County Sheriff’s Department and the City of Citrus Heights Police Department (CHPD), each school becomes part of a safety zone that is patrolled daily by a sheriff’s deputy or CHPD officer. The Deputy Sheriffs are assigned to a specific schools which are identified by geographic zones. The Deputy Sheriffs may move from one the geographic zone to another as safety needs dictate. The CHPD Police Officers work identified schools within the City of Citrus Heights and respond as safety needs dictate. In addition to daily support from a designated Sheriff’s deputy or CHPD officer, this school is a part of the San Juan Unified School District’s Safe Schools Task Force, which is comprised of safety teams from each of the school sites. Each school safety team meets regularly to discuss safety issues, update their site emergency plans, and to take steps to be proactive in preventing various types of school-related safety issues. Law enforcement provides speakers to address students, staff and community groups. Our safety team receives regular training through the Safe Schools Task Force. Each school site is responsible for updating their Comprehensive School Safety Plan by March 1st of every year. The plan must be approved by the School Site Council before being submitted to the district Safe Schools Manager. Every San Juan classroom has a standardized “Safety Folder” which serves as a guide for teachers, includes the site specific crisis response procedures and a district standardized emergency flip chart. This school meets or exceeds the Education Code requirements for fire drills and lock down drills. The School Safety Plan was approved March 2015 by the School Site Council and last reviewed by the Arlington Heights staff in August 2015. The plan includes a description of the responsibilities of the school safety team, our measures for a safe school environment and areas of focus for improvement.
2014-15 School Accountability Report Card for Arlington Heights Elementary School Page 11 of 13
D. Other SARC Information
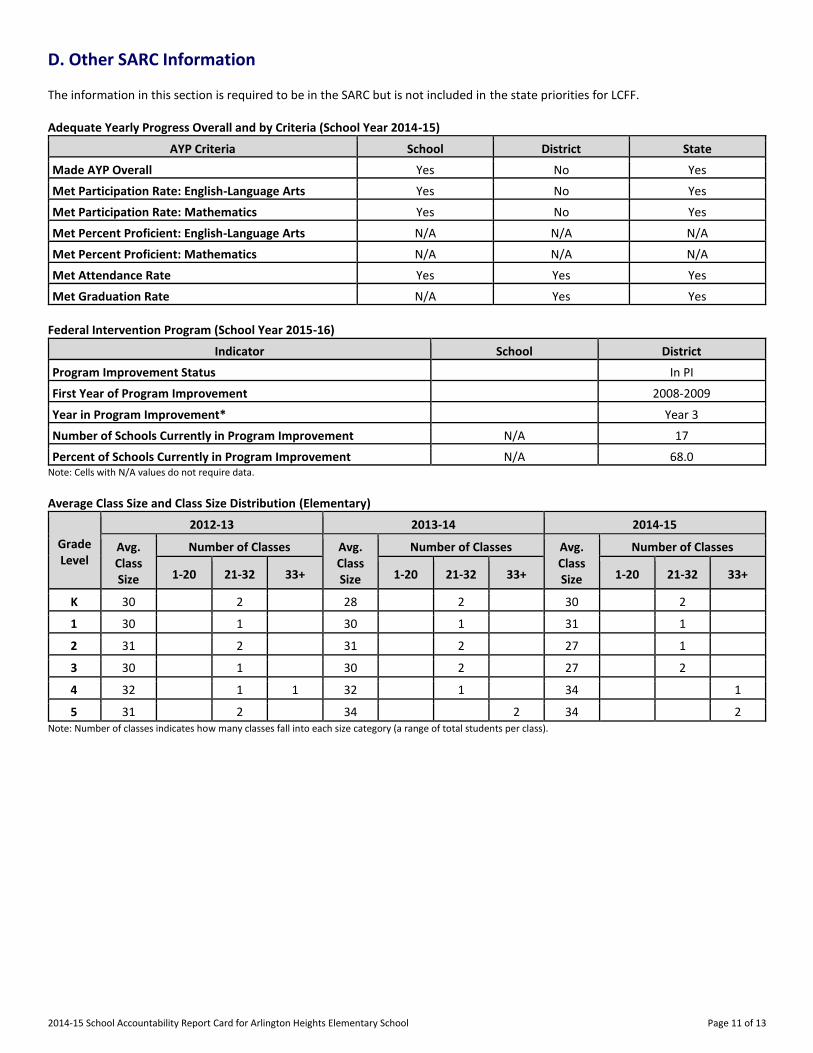
The information in this section is required to be in the SARC but is not included in the state priorities for LCFF. Adequate Yearly Progress Overall and by Criteria (School Year 2014-15)
AYP Criteria School District State
Made AYP Overall Yes No Yes
Met Participation Rate: English-Language Arts Yes No Yes
Met Participation Rate: Mathematics Yes No Yes
Met Percent Proficient: English-Language Arts N/A N/A N/A
Met Percent Proficient: Mathematics N/A N/A N/A
Met Attendance Rate Yes Yes Yes
Met Graduation Rate N/A Yes Yes
Federal Intervention Program (School Year 2015-16)
Indicator School District
Program Improvement Status In PI
First Year of Program Improvement 2008-2009
Year in Program Improvement* Year 3
Number of Schools Currently in Program Improvement N/A 17
Percent of Schools Currently in Program Improvement N/A 68.0 Note: Cells with N/A values do not require data.
Average Class Size and Class Size Distribution (Elementary)
Grade Level
2012-13 2013-14 2014-15
Avg. Class Size
Number of Classes Avg. Class Size
Number of Classes Avg. Class Size
Number of Classes
1-20 21-32 33+ 1-20 21-32 33+ 1-20 21-32 33+
K
30 2 28 2 30 2
1
30 1 30 1 31 1
2
31 2 31 2 27 1
3
30 1 30 2 27 2
4
32 1 1 32 1 34 1
5
31 2 34 2 34 2 Note: Number of classes indicates how many classes fall into each size category (a range of total students per class).
2014-15 School Accountability Report Card for Arlington Heights Elementary School Page 12 of 13
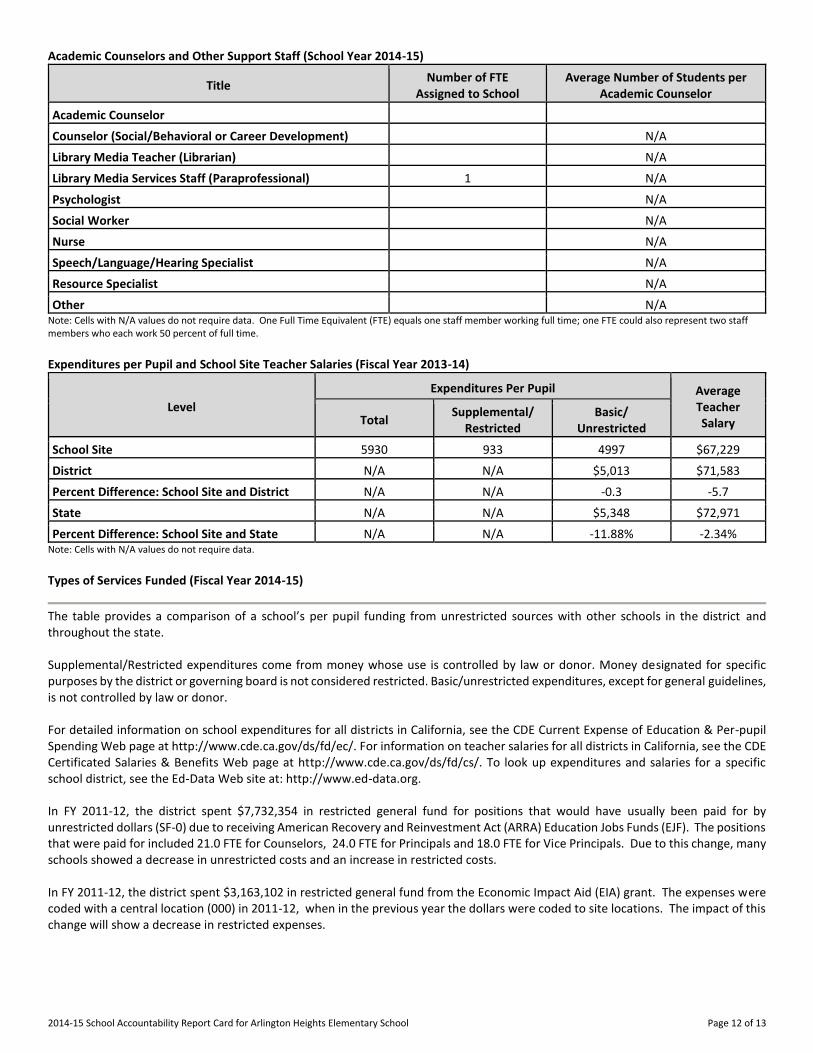
Academic Counselors and Other Support Staff (School Year 2014-15)
Title Number of FTE
Assigned to School Average Number of Students per
Academic Counselor
Academic Counselor-------
Counselor (Social/Behavioral or Career Development) N/A
Library Media Teacher (Librarian) N/A
Library Media Services Staff (Paraprofessional) 1 N/A
Psychologist------- N/A
Social Worker------- N/A
Nurse------- N/A
Speech/Language/Hearing Specialist N/A
Resource Specialist------- N/A
Other------- N/A Note: Cells with N/A values do not require data. One Full Time Equivalent (FTE) equals one staff member working full time; one FTE could also represent two staff members who each work 50 percent of full time.
Expenditures per Pupil and School Site Teacher Salaries (Fiscal Year 2013-14)
Level
Expenditures Per Pupil Average Teacher Salary Total
Supplemental/ Restricted
Basic/ Unrestricted
School Site------- 5930 933 4997 $67,229
District------- N/A N/A $5,013 $71,583
Percent Difference: School Site and District N/A N/A -0.3 -5.7
State------- N/A N/A $5,348 $72,971
Percent Difference: School Site and State N/A N/A -11.88% -2.34% Note: Cells with N/A values do not require data.
Types of Services Funded (Fiscal Year 2014-15)
The table provides a comparison of a school’s per pupil funding from unrestricted sources with other schools in the district and throughout the state. Supplemental/Restricted expenditures come from money whose use is controlled by law or donor. Money designated for specific purposes by the district or governing board is not considered restricted. Basic/unrestricted expenditures, except for general guidelines, is not controlled by law or donor. For detailed information on school expenditures for all districts in California, see the CDE Current Expense of Education & Per-pupil Spending Web page at http://www.cde.ca.gov/ds/fd/ec/. For information on teacher salaries for all districts in California, see the CDE Certificated Salaries & Benefits Web page at http://www.cde.ca.gov/ds/fd/cs/. To look up expenditures and salaries for a specific school district, see the Ed-Data Web site at: http://www.ed-data.org. In FY 2011-12, the district spent $7,732,354 in restricted general fund for positions that would have usually been paid for by unrestricted dollars (SF-0) due to receiving American Recovery and Reinvestment Act (ARRA) Education Jobs Funds (EJF). The positions that were paid for included 21.0 FTE for Counselors, 24.0 FTE for Principals and 18.0 FTE for Vice Principals. Due to this change, many schools showed a decrease in unrestricted costs and an increase in restricted costs. In FY 2011-12, the district spent $3,163,102 in restricted general fund from the Economic Impact Aid (EIA) grant. The expenses were coded with a central location (000) in 2011-12, when in the previous year the dollars were coded to site locations. The impact of this change will show a decrease in restricted expenses.
2014-15 School Accountability Report Card for Arlington Heights Elementary School Page 13 of 13
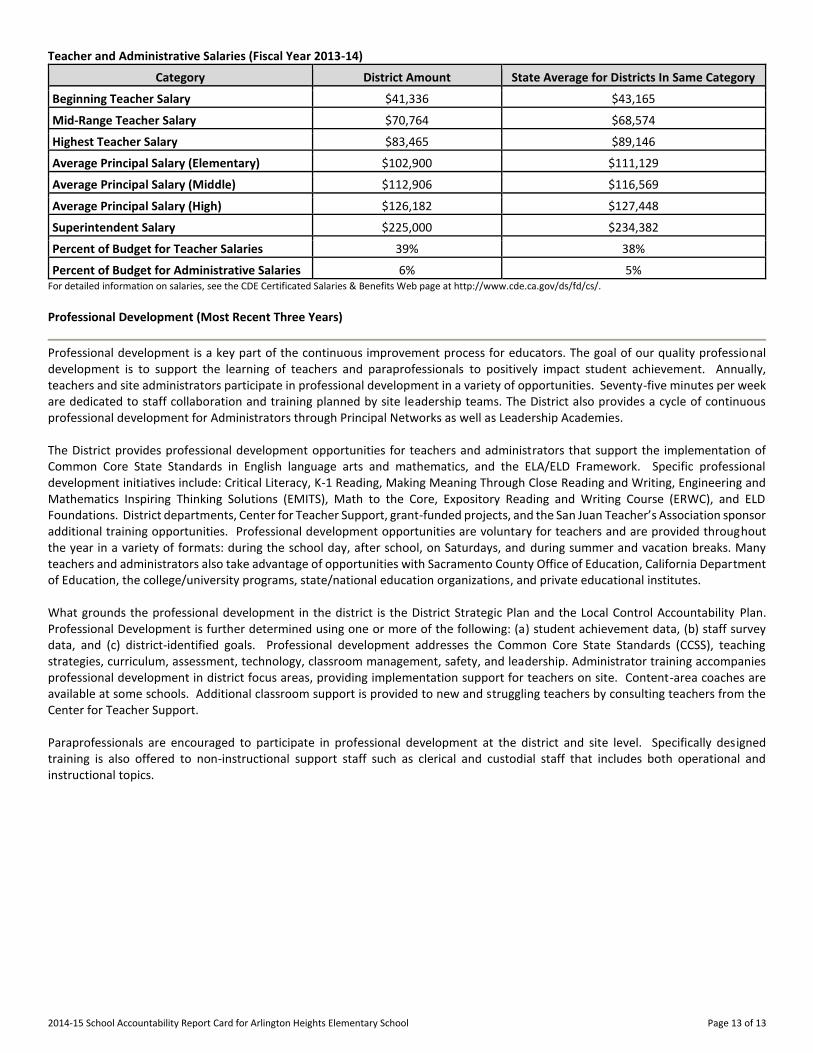
Teacher and Administrative Salaries (Fiscal Year 2013-14)
Category District Amount State Average for Districts In Same Category
Beginning Teacher Salary $41,336 $43,165
Mid-Range Teacher Salary $70,764 $68,574
Highest Teacher Salary $83,465 $89,146
Average Principal Salary (Elementary) $102,900 $111,129
Average Principal Salary (Middle) $112,906 $116,569
Average Principal Salary (High) $126,182 $127,448
Superintendent Salary $225,000 $234,382
Percent of Budget for Teacher Salaries 39% 38%
Percent of Budget for Administrative Salaries 6% 5% For detailed information on salaries, see the CDE Certificated Salaries & Benefits Web page at http://www.cde.ca.gov/ds/fd/cs/. Professional Development (Most Recent Three Years)
Professional development is a key part of the continuous improvement process for educators. The goal of our quality professional development is to support the learning of teachers and paraprofessionals to positively impact student achievement. Annually, teachers and site administrators participate in professional development in a variety of opportunities. Seventy-five minutes per week are dedicated to staff collaboration and training planned by site leadership teams. The District also provides a cycle of continuous professional development for Administrators through Principal Networks as well as Leadership Academies. The District provides professional development opportunities for teachers and administrators that support the implementation of Common Core State Standards in English language arts and mathematics, and the ELA/ELD Framework. Specific professional development initiatives include: Critical Literacy, K-1 Reading, Making Meaning Through Close Reading and Writing, Engineering and Mathematics Inspiring Thinking Solutions (EMITS), Math to the Core, Expository Reading and Writing Course (ERWC), and ELD Foundations. District departments, Center for Teacher Support, grant-funded projects, and the San Juan Teacher’s Association sponsor additional training opportunities. Professional development opportunities are voluntary for teachers and are provided throughout the year in a variety of formats: during the school day, after school, on Saturdays, and during summer and vacation breaks. Many teachers and administrators also take advantage of opportunities with Sacramento County Office of Education, California Department of Education, the college/university programs, state/national education organizations, and private educational institutes. What grounds the professional development in the district is the District Strategic Plan and the Local Control Accountability Plan. Professional Development is further determined using one or more of the following: (a) student achievement data, (b) staff survey data, and (c) district-identified goals. Professional development addresses the Common Core State Standards (CCSS), teaching strategies, curriculum, assessment, technology, classroom management, safety, and leadership. Administrator training accompanies professional development in district focus areas, providing implementation support for teachers on site. Content-area coaches are available at some schools. Additional classroom support is provided to new and struggling teachers by consulting teachers from the Center for Teacher Support. Paraprofessionals are encouraged to participate in professional development at the district and site level. Specifically designed training is also offered to non-instructional support staff such as clerical and custodial staff that includes both operational and instructional topics.