Embed Size (px)
Citation preview
ARMY RESEARCH LABORATORY
Generation of Polymer Nanofibers Through Electrospinning
Joseph Deitzel Nora C. Beck Tan
James D. Kleinmeyer Joseph Rehrmann
David Tevault Darrell Reneker
Ibrahim Sendijarevic Anthony McHugh
ARL-TR-1989 JUNE 1999
19990722 074 ■"•«•»«»„
Approved for public release; distribution is unlimited.
Kevlar® is a registered trademark of E.I. DuPont de Nemours & Co., Inc.
The findings in this report are not to be construed as an official Department of the Army position unless so designated by other authorized documents.
Citation of manufacturer's or trade names does not constitute an official endorsement or approval of the use thereof.
Destroy this report when it is no longer needed. Do not return it to the originator.
Army Research Laboratory Aberdeen Proving Ground, MD 21005-5066
ARL-TR-1989 June 1999
Generation of Polymer Nanofibers Through Electrospinning
Joseph M. Deitzel Nora C. Beck Tan James D. Kleinmeyer Weapons & Materials Research Directorate, ARL
Joseph Rehrmann David Tevault Edgewood Chemical-Biological Center
Darrell Reneker University of Akron
Ibrahim Sendijarevic Anthony McHugh University of Illinois
Approved for public release; distribution is unlimited.
Abstract
Non-woven fabrics composed of nanofibers have a large specific surface area and small pore size compared to commercial textiles. These properties make such non-woven fabrics excellent candidates for filter and membrane applications, particularly in the areas of chemical and biological agent defense. Nanofibers may be produced by electrospinning, which uses an electric field to produce continuous fibers with diameters in the tens of nanometers range. Although the technique has been known for some time, very little information concerning the effect of processing variables such as solution concentration, viscosity, surface tension, flow rate and acceleration voltage on final fiber properties exists in the literature. In this work, nanofibers of polyethylene oxide have been electrospun from a range a solution concentrations and for a range of voltages. Wide angle X-ray diffraction and differential scanning calorimetery indicate that crystal structure is poorly developed in the electrospun fibers, when compared to results obtained from polyethylene oxide) powder. Fiber diameter increases with increasing concentration by the 0.53 power. We find that for concentrations of 8% (wt) and greater, a bimodal fiber diameter distribution has been observed, which is analogous to results reported for electrospray experiments. The density of node defects has been shown to increase with increasing voltage for a constant solution feed rate.
TABLE OF CONTENTS
Page
LIST OF FIGURES v
1. MOTIVATION FORRESEARCH 1
1.1 Technical Background 2
2. EXPERIMENTAL 6
3. RESULTS AND DISCUSSION 8
3.1 Nanofiber Morphology: Voltage Dependence 8 3.2 Nanofiber Morphology: Concentration Dependence 14 3.3 General Characteristics of Electrospun Fibers and Fiber Mats 19
4. CONCLUSIONS 24
REFERENCES 27
DISTRIBUTION LIST 29
REPORT DOCUMENTATION PAGE 33
in
INTENTIONALLY LEFT BLANK
IV
LIST OF FIGURES
Figure Eäge
1. Electrospinning/Electrospray Process 3 2. Electrospinning Current as a Function of Voltage 9 3. Initiating Cone and Corresponding Fiber Mat for a 7% PEO-Water Solution
Spun at 5.5 kV 10 4. Initiating Cone and Corresponding Fiber Mat for a 7% PEO-Water Solution
Spun at 7.0 kV 11 5. Initiating Cone and Corresponding Fiber Mat for a 7% PEO-Water Solution
Spun at 9.0 kV 12 6. Node Density as a Function of Electrospinning Voltage 13 7. Concentration Dependence of Solution Surface Tension and Solution Viscosity
for PEO-Water Solutions 15 8. Electron Micrographs of Fiber Mats Electrospun From 4%, 7%, and 10% PEO-
Water Solutions 16 9. Average Fiber Diameter as a Function of PEO Concentration 16
10. Bimodal Distribution of Fiber Diameters Electrospun From 7% and 10% PEO- Water Solution 17
11. Percentage of Secondary Distribution as a Function of Concentration 18 12. High Speed Photo-micrographs of the Electrospinning Process for 4% and 10%
Solution Concentrations 18 13. Specific Surface Area as a Function of Concentration 19 14. WAXD Patterns for PEO Powder and PEO Fiber Mat Electrospun From 10%
PEO-Water Solution 20 15. Fiber Mats Electrospun From 10% Solution of PEO in Water Collected Onto
an Aluminum Screen 21 16. 7% Solution of 100,000 Mol. Wt. PEO in Water Electrosprayed Onto an
Aluminum Grid 22 17. Photomicrograph of 2% PEO-Water Electrospun Onto an Aluminum Grid 23 18. Three-dimensional Structure in Non-woven Fiber Mat Electrospun From a
7% Solution of 400,000 Mol. Wt. PEO and Water Electrospun at 11 kV Onto a Cloth Substrate 23
19. High Magnification Images of Figure 18 at Different Working Distances 24
INTENTIONALLY LEFT BLANK
VI
GENERATION OF POLYMER NANOFIBERS THROUGH ELECTRO SPINNING
1. MOTIVATION FOR RESEARCH
Polymer fibers are used in a wide variety of military and civilian applications, including textiles and composite reinforcement. Traditional methods of obtaining polymer fibers include melt spinning [1], spinning from solution, and spinning from the gel state.[2] Typical fiber diameters obtained from these methods range from 5 to 500 microns in size. The lower limit of fiber diameter that is consistently achievable by these methods is on the order of magnitude of a
micron. Recently [3], there has been increased interest in another method of fiber production, electrospinning, which can consistently produce fibers that are sub-micron in diameter. Textiles
produced from these fibers are showing promise for exploitation in filtration applications.
In military applications, current filter technology employs either activated carbon or zeolite particles that achieve ultra high surface area through porosity. Because of their granular nature, these materials restrict the design of filters used in chemical and biological warfare agent defense for both personal and vehicular applications. In order to be effective, the particles that comprise
these materials must remain in a densely packed configuration. This is achieved by using a polymer binder and applying a constant pressure on the filter material. However, the need to apply a constant pressure restricts the design of the filter shape, and the use of polymer binder reduces effective surface area and often reduces gas throughput. A further problem associated with these porous filter materials is that it is often difficult to chemically modify all the available
surface area with sites designed to neutralize warfare agents.
These problems could be addressed by the use of filters composed of non-woven polymer fiber mats, but the total specific surface area associated with commercial filters of this type is considerably less than that of activated carbon or zeolite filters. However, non-woven fiber mats composed of electrospun fibers process will have a much higher specific surface area than current commercial, non-woven fiber mat filters because of the small diameter of the fibers. In addition, it should be possible to electrospin fibers from polymers with specific functional groups that can be made to segregate on the fiber surface with a minimum of effort. In this manner, all the available surface area can be chemically modified to neutralize chemical/biological agents. These factors make electrospun non-woven fiber mats perfect candidates for military filter applications.
The advantages of electrospun non-woven fiber mats that have been discussed for filter applications also make these materials excellent candidates for soldier's protective clothing.[3] A major problem with current protective clothing is that barrier materials designed to keep warfare
agents out also prevent the evaporation of perspiration. One method to address this problem is
to use nanoporous fluoro-polymer membranes, which wick perspiration away from the
body. However, these membranes are expensive. By using electrospinning technology, which
provides non-woven fabrics with a large specific surface area and small pore size, it should be
possible to produce fabrics with properties similar to these fluoro-polymer membranes at a much
cheaper cost.
1.1 Technical Background
It has been understood for most of this century that it is possible to use electrostatic fields
to form and accelerate liquid jets from the tip of a capillary. [4,5,6] A hemispherical meniscus of
liquid suspended in equilibrium at the end of a capillary will be distorted into a conical shape in
the presence of an electric field. A balancing of the repulsive force resulting from the induced
charge distribution on the surface of the meniscus with the surface tension of the liquid causes
this distortion. In 1964, Taylor [5] showed that for a critical voltage, the equilibrium shape of a
suspended meniscus was a cone with a semi-vertical angle of 49.3°. When this critical voltage is
exceeded, a stable jet of liquid is ejected from the cone tip. In the case of low viscosity liquids,
the jet disintegrates into droplets as a result of surface tension. For high viscosity liquids, the jet
does not disintegrate; it simply hits the grounded target.[6] The first case is known as
electrospraying and it is used in many industries to obtain aerosols with narrow distributions of
sub-micron drops. When applied to polymer solutions and melts, the second case is known as
electrospinning and it generates polymer fibers that are sub-micron in diameter. For the
discussion of the results presented in this report, it will be necessary to explore each of these
cases in more detail.
In the case of electrospray, when the jet is accelerated away from the cone apex, it *
decreases in diameter and disintegrates into droplets. As these drops continue to accelerate away
from the cone tip, their diameter decreases as a result of evaporation. When the drop diameter
decreases, the surface charge density increases until it exceeds a maximum value. At that point,
the drop undergoes Coulombic fission, producing numerous smaller drops. This process is
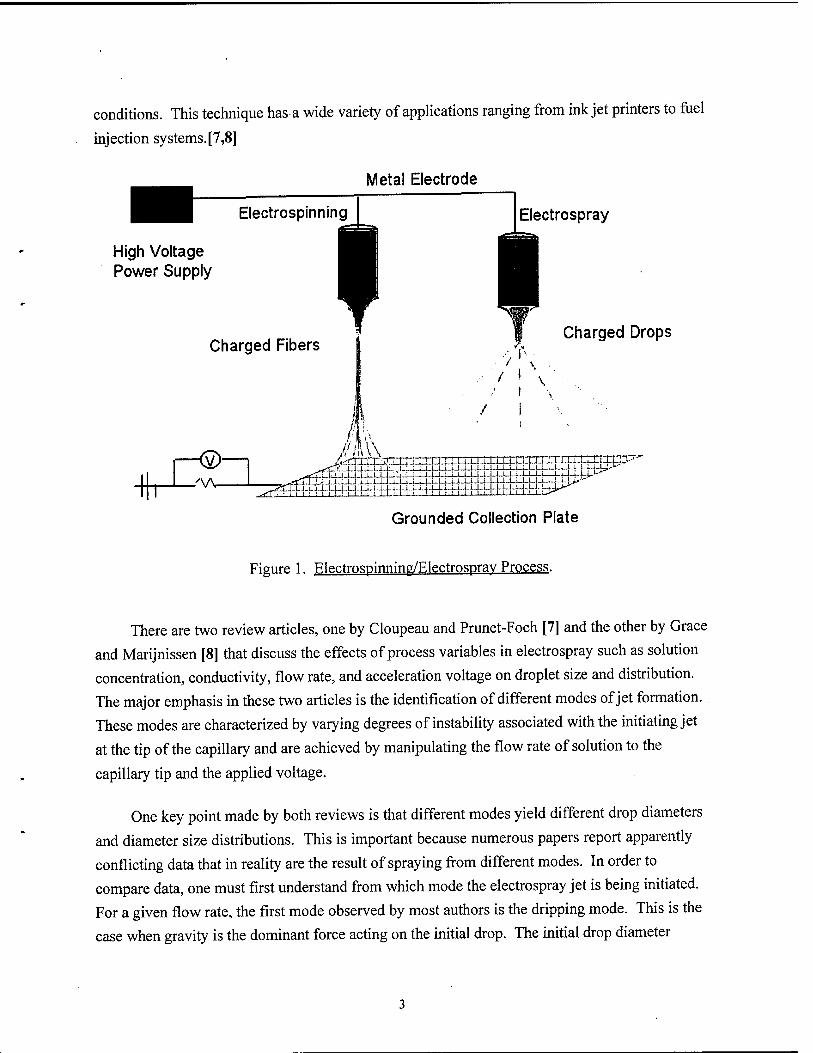
continued repeatedly until the grounded target is reached (see Figure 1). When the liquid that is
used is a low viscosity solution of something such as pigment, it is possible to get a narrow
distribution of sub-micron particles using this process. In the last 10 years, there has been
significant interest in the electrospray technique which allows the production of monodispersed
droplets that range in size from tens of microns to tens of nanometers, depending on initial
conditions. This technique has-a wide variety of applications ranging from ink jet printers to fuel
injection systems.[7,8]
Metal Electrode
Electrospinning
High Voltage Power Supply
Charged Fibers
Electrospray
Charged Drops
~~XüÄp-^J-xX-L-U-f-U-LL"
Grounded Collection Plate
Figure 1. Electrospinning/Electrosprav Process.
There are two review articles, one by Cloupeau and Prunet-Foch [7] and the other by Grace
and Marijnissen [8] that discuss the effects of process variables in electrospray such as solution
concentration, conductivity, flow rate, and acceleration voltage on droplet size and distribution.
The major emphasis in these two articles is the identification of different modes of jet formation.
These modes are characterized by varying degrees of instability associated with the initiating jet
at the tip of the capillary and are achieved by manipulating the flow rate of solution to the
capillary tip and the applied voltage.
One key point made by both reviews is that different modes yield different drop diameters
and diameter size distributions. This is important because numerous papers report apparently
conflicting data that in reality are the result of spraying from different modes. In order to
compare data, one must first understand from which mode the electrospray jet is being initiated.
For a given flow rate, the first mode observed by most authors is the dripping mode. This is the
case when gravity is the dominant force acting on the initial drop. The initial drop diameter
before it detaches from the capillary tip is characteristically larger than the diameter of the
capillary. As voltage is applied and increased, the frequency of the drops increases while the
diameter of the individual drops decreases. This is because the electrostatic force on the drop
decreases the "apparent" surface tension of the liquid in the drop. It has also been observed that
for a given flow rate in this mode, reduction of the capillary diameter results in an increase in
drop frequency and a decrease in drop size. Chen and Prui [9] have observed that the current
carried to ground by the drops also increases with increasing voltage in this electrospray mode.
At some point as the voltage is increased, a transition mode is encountered that is
designated the "pulsating mode." In this mode, the initiating jet at the end of the capillary
alternates from a hemispherical shape to a conical shape. This mode results in a broad droplet
size distribution, and the measured current carried to ground is essentially constant. This mode is
stable for a large voltage range in comparison to other modes that are observed. Further increases
in the voltage will result in the mode described in detail by Taylor, and is known as the Taylor
cone [6], or cone-jet mode.[9] It is discussed in more detail in the next paragraph. Multiple jets
can form when the voltage is further increased, and finally the jet will disappear and material will
spatter as the maximum practical voltage is reached. This is generally accompanied by consistent
dielectric disintegration of the ambient atmosphere.
The cone-jet mode is the mode of greatest interest to the electrospray community. It is
characterized by a cone-shaped drop of liquid suspended at the capillary tip, with a jet of
solution emitted from the apex of the cone. The length of this jet is directly proportional to
voltage. The jet of solution decreases in diameter as it travels away from the tip of the capillary.
At some point, the diameter becomes small enough that it disintegrates into droplets as a result of
varicose instabilities. As shown by Gomez and Tang [10], the disintegration of the jet results in
a bimodal distribution of large, primary droplets and small satellite drops. Because of their small
size, these satellite drops are driven to the periphery of the spray cone by the local electric fields
of the larger droplets. The result is a core-shell structure of the spray cone, with small satellite
droplets on the outside and larger primary drops on the inside. Monodispersed particle sizes can
be obtained by collecting only the primary core droplets and excluding the smaller satellite drops.
In an earlier study, Gomez and Tang [11] demonstrated that these primary droplets underwent
fission, producing smaller, equal-sized daughter droplets. It is this process that generates drop
sizes in the submicron region.
For the specific case of the cone-jet mode, the average droplet size decreases while the
droplet frequency increases if the flow rate is decreased or the solution conductivity increases.
The current that is carried to the ground increases as the transition from the pulsed mode to the
cone-jet mode is made. Specifically, Chen, Pui, and Kaufman [9] demonstrated that the drop
size, Dd, scaled as (Q/K)1/3, in which Q is the flow rate and K is the conductivity of the solution.
This confirmed the work of Fernandez de la Mora and Loscertales [12] as well as Ganan-Calvo
[13], who also developed empirical scaling laws to the 1/3 power. Other investigators showed
that the electrospray current scaled with (QK)1/2 during some circumstances. Both sets of
observations were made with sugar solutions whose viscosity, relative permittivity, and surface
tension were kept constant.
A final experiment looked at the effect on concentration with respect to drop size. It was
observed that the drop size increased by a power of 1/3 with increasing concentration. It was
also seen that as the concentration increased, the drop size distribution became bimodal in nature.
As a possible explanation for the existence of a bimodal distribution, it was suggested that the
distribution peak corresponding to the smaller diameter represented satellite drops formed during
the initial disintegration of the solution jet. However, further investigation is needed to confirm
this theory.
If the electrospray process is applied to a polymer solution of sufficient concentration, the
initial jet will not disintegrate into drops as a result of varicose instabilities. Instead, the solvent
will evaporate as the jet proceeds to the target, leaving polymer fiber. This is known as the
electrospinning process. Not as much attention has been given to characterization of the
electrospinning process as to the electrospray process. This is most likely because of the
perceived lack of possible applications. However, interest in the electrospinning process has
increased in recent years [14,15,16]. In 1971, Baumgarten [17] studied the effects of various
processing variables on the production of acrylic resin fibers electrospun from
Dimethylformamide (DMF). He looked at a range of concentrations from 7.5% to 20%, whose
viscosities ranged from 1.7 to 215.0 poise. It was observed that increasing viscosity resulted in
an increase in the fiber diameter. The diameter increased by a power of-0.5 over the range of
viscosities. Fiber diameters associated with different viscosities were obtained by averaging 25
measurements taken from electron micrographs. It was also observed that the initiating jet at the
capillary tip changed from a hemispherical shape to a conical shape as the viscosity increased.
The jet length before the onset of instability was also observed to increase with viscosity.
Note that it was determined, based on microflash photographs of the spinning process, that
for this system a single fiber was being produced in a normal atmosphere. Subsequent data
analysis and interpretation were based on the idea that a single polymer filament was being
produced. However, when spinning was performed in a Freon-12 atmosphere, small fiber
"offshoots" from the main fiber were observed. It was noted that these offshoots occurred at
sharp bends in the main fiber. More recently, Reneker [14,15,16] reported this offshoot, or
splaying, phenomenon in ambient conditions; he also reported observing a single filament jet. It
is not clear at this time whether the small diameters of electrospun fibers are achieved as a result
of a single filament undergoing a high degree of draw or through a splaying process similar to the
Rayleigh disintegration described for electrospray.
Very little has been reported about the crystalline properties of electrospun fibers. This is
of interest because polymer fibers used in high performance applications, such as Kevlar® and
ultra-high molecular weight polyethylene, possess a high degree of crystallinity and crystal
orientation. In 1981, Manley and Larrondo [18,19,20] electrospun a solution of polyethylene in
paraffin at elevated temperatures. Based on reports by Baumgarten [17] of spinning velocities
approaching the speed of sound, it was thought that the electrospinning process would have a
high enough shear rate to produce polyethylene fibers with a highly oriented crystal structure.
However, wide angle X-ray diffraction (WAXD) experiments revealed that the degree of
orientation observed for the electrospun fibers was comparable to that of undrawn polyethylene
fibers obtained from more conventional methods. More recent work by Srinivasen and Reneker
[15] has shown that a reasonably high degree of crystal orientation can be obtained by
electrospinning Kevlar® from sulfuric acid.
It is clear from the background literature for both the electrospray and electrospinning
processes that the structure and morphology of the final product (be it particles or fibers) are
determined by the effects of solution viscosity, surface tension, concentration, dielectric
properties, the feed rate of the solution to the tip, and the acceleration voltage. For the specific
case of electrospinning, most of the literature has explored the types of polymer solvent systems
from which fibers can be produced. There has not been much work that addresses the effect of the
variables previously mentioned on the submicron fiber structure and morphology. This is
especially true for systems that undergo the splaying phenomena. The current work looks at the
effect of solution concentration and accelerating voltage on the structure and morphology of
submicron polyethylene oxide) (PEO) fibers obtained by electrospinning. It shows that profound
changes in fiber diameter and morphology accompany changes in these variables. Analogies are
drawn with similar experiments in electrospray literature to help analyze these results.
2. EXPERIMENTAL
The solutions used in the electrospinning experiments were prepared with 400,000 mol. wt.
PEO purchased from Scientific Polymer Products. This material was dissolved in high pressure
liquid chromatography (HPLC) grade water. The mixture of PEO and water was heated to 60° C and agitated with a stir bar for approximately 24 hours. Concentrations ranged from 4% to 10%. Solution surface tensions for each solution were determined by the Wilhelmy Balance method using microscope cover glass slides that were cleaned with a butane torch. Solution viscosities were measured with a Thermal Analysis Instruments AR 1000-N constant stress rheometer in a cone and plate geometry. Each experiment was performed at 20° C with a 4-cm and 2° cone. Solutions were spun from a 50-ml gas chromatography syringe with a 23-gauge (diameter = 0.35
mm) needle. A Gamma High Voltage Research ES30P power supply was used to produce voltages ranging from 5.5 to 15.0 kV. Various electrically grounded materials, such as aluminum
screen, were used as targets.
Electrospun fiber mats were analyzed using a Bruker D5005 diffractometer for WAXD
experiments. Transmission WAXD experiments were performed with a Rigaku 18-kW rotating anode generator and Bruker Hi-Star 2D area detector. Melting temperatures and heats of fusion for the electrospun fiber mats were determined with a TA instruments differential scanning calorimeter (DSC). Morphological observations were made with a Phillips Electroscan environmental scanning electron microscopy (ESEM). The samples were held at a temperature of 4° C using a Peltier stage during the experiment to prevent beam damage to the sample.
The experimental setup for the study of the effect of concentration on electrospun fiber
morphology was as follows. A 20- to 30-ml quantity of a PEO-water solution was placed in a 50-ml syringe. The syringe was then clamped in place to a ring stand that was 6.5 inches above a
grounded target (metal screen). The power supply was connected to the metal syringe tip. Constant pressure in the form of a weight was applied to the syringe so that a small drop of solution was suspended in equilibrium above the target. The weight applied to syringe plunger was increased with increasing concentration in an attempt to achieve similar initial conditions. Once this equilibrium condition was achieved, a voltage of 7.0 kV was applied to the syringe tip
to initiate the jet. Typical time to collect the mat was about 24 hours.
The physical setup for the study of the effect of voltage on nanofiber morphology was the same as that for the concentration study. A 20- to 30-ml quantity of 7% PEO-water solution
was placed in the syringe, and the electrospinning process was performed for a number of voltages. The weight applied to the syringe plunger was kept constant for the entire experiment. Optical micrographs were taken with a Photometries cooled charge coupled device (CCD) camera with 3,000 by 2,000 resolution. The camera was attached to a Questar Schmidt-Cassegrain
telescope in order to achieve high magnification from a distance.
3. RESULTS AND DISCUSSION
3.1 Nanofiber Morphology: Voltage Dependence
As discussed in the introduction, the initiating jet for the electrospray process occurs in a
variety of modes. These modes occur at different voltages and have a significant effect on the
droplet size distribution and current transport. Although distinct modes might be difficult to
isolate and observe because of the high, nonlinear viscosity associated with most polymer
solutions, instablity of the initiating drop is expected to produce observable changes in the
electrospun fiber morphology. For the case of electrospinning, it has been observed that the
shape of the initiating drop changes with various spinning conditions (voltage, viscosity, feed
rate) [17], but until recently [21], no relation between the initiating drop shape and fiber
morphology was discussed.
In electrospray and electrospinning experiments, an electric current is associated with the
process, which can be measured with a sensitive amperage meter. In effect, the droplets or fibers
bridge the gap between the charged needle and the electrically grounded target, closing the circuit.
In the case of electrospray, it has been shown that a change in the mode of spray initiation is
accompanied by a corresponding change in the measured electrospray current. [9] In the case of
electrospinning, the electric current attributable to the conduction of charge in the polymer
solution can be assumed to be negligible. [17] The only mechanism of charge transport is the flow
of polymer from the tip to the target. Therefore, an increase in the electrospinning current
reflects an increase in the mass flow rate away from the tip when all other variables
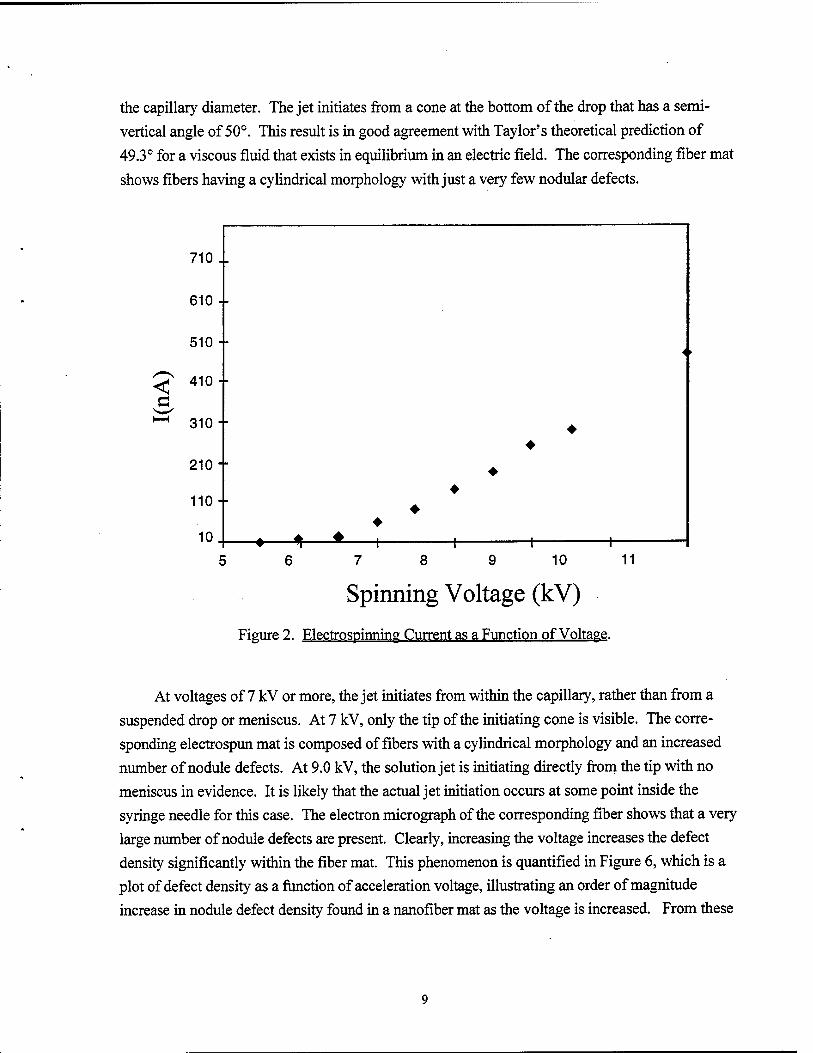
(conductivity, dielectric constant, and flow rate of solution to the tip) are held constant. Figure 2
is a plot of the spinning current as a function of voltage obtained during the experiment just
described. It can be seen in this figure that the electrospinning current gradually increases with
voltage in the 5- to 7-kV range. For voltages greater than 7 kV, a sharp increase is slope is
observed, indicating that the electrospinning current increases more rapidly. The change in the
slope of this plot that occurs at 7 kV coincides with the change in shape of the initiating drop
seen in the optical micrographs (Figures 3 through 5) and also with the change in fiber
morphology observed in the electron micrographs.
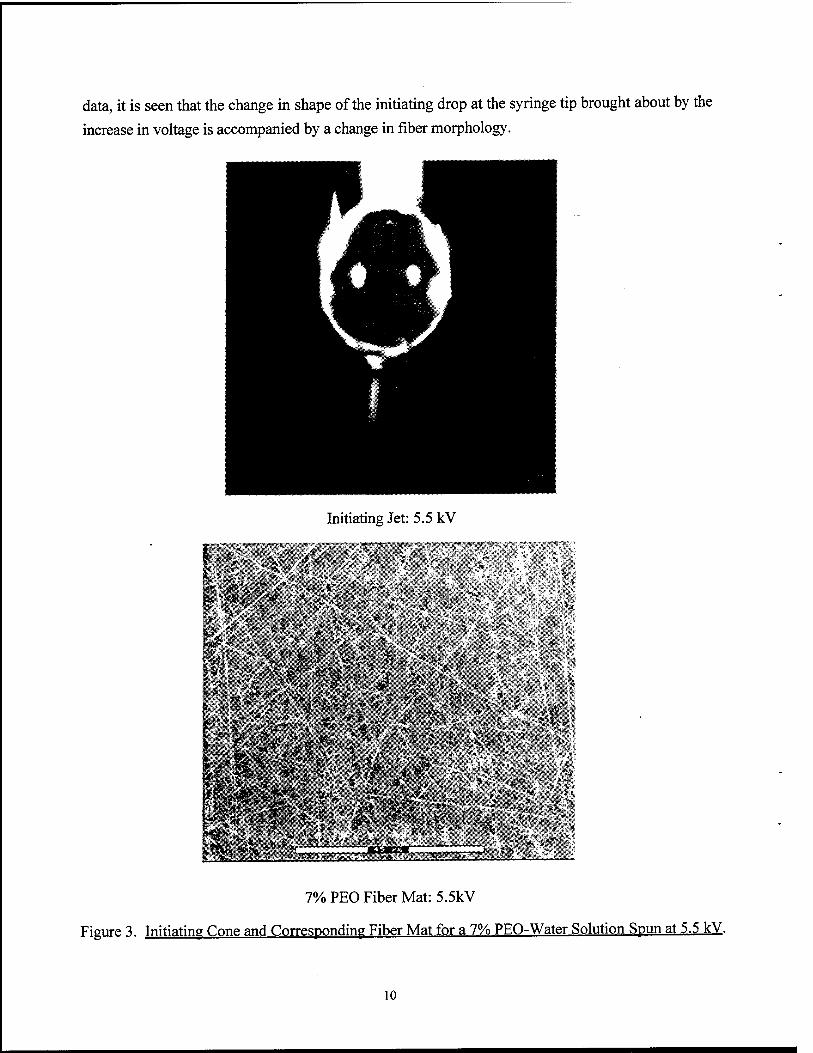
Figures 3 through 5 show electron micrographs of nanofiber mats and optical photos of the
corresponding initiating jet for accelerating voltages 5.5,7.0, and 9.0 kV. In Figure 3, the optical
photograph shows a jet initiating from a solution drop suspended at the end of the syringe needle.
This mode of jet initiation is similar in appearance to microdripping jet initiation mode reported in
the electrospray literature [9], in which initiation occurs from a drop whose diameter is larger than
the capillary diameter. The jet initiates from a cone at the bottom of the drop that has a semi- vertical angle of 50°. This result is in good agreement with Taylor's theoretical prediction of 49.3° for a viscous fluid that exists in equilibrium in an electric field. The corresponding fiber mat
shows fibers having a cylindrical morphology with just a very few nodular defects.
710.
610-
510 - i
< Ö
1—H
410 ■
310-
210-
110 -
10. ♦— -+- ♦ ♦
—r—
♦ ♦
—I—
♦
♦
—I—
♦
1 10 11
Spinning Voltage (kV)
Figure 2. Electrospinning Current as a Function of Voltage.
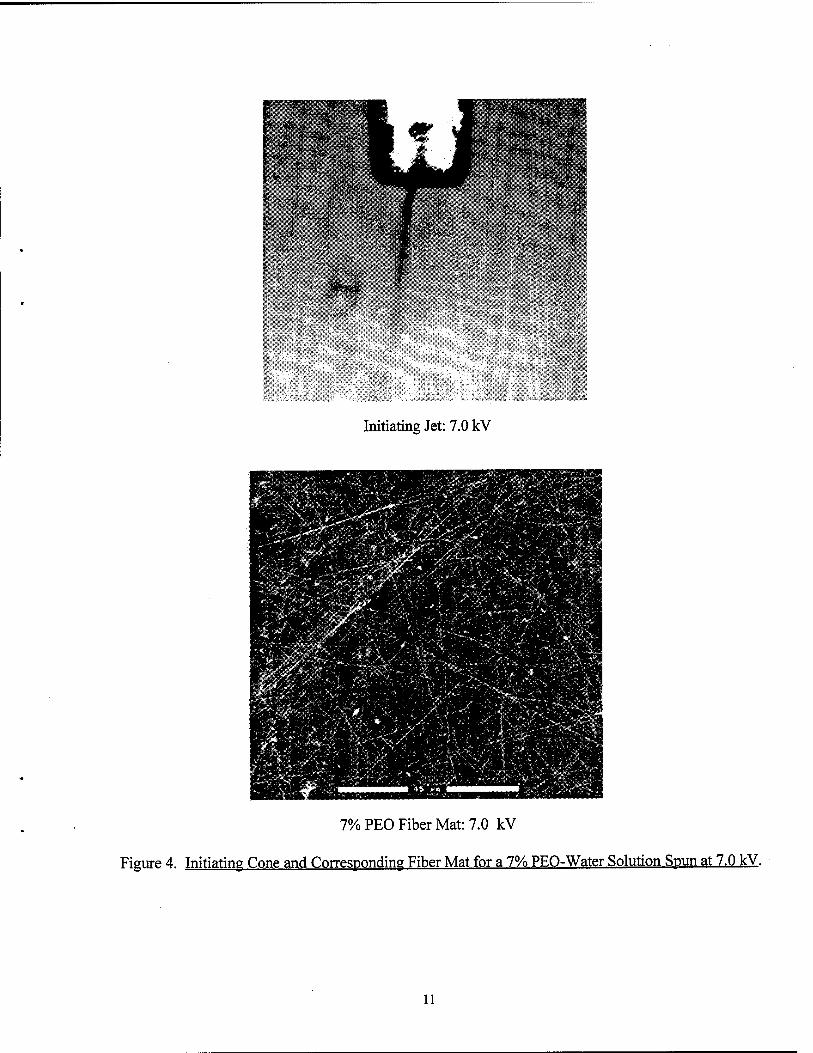
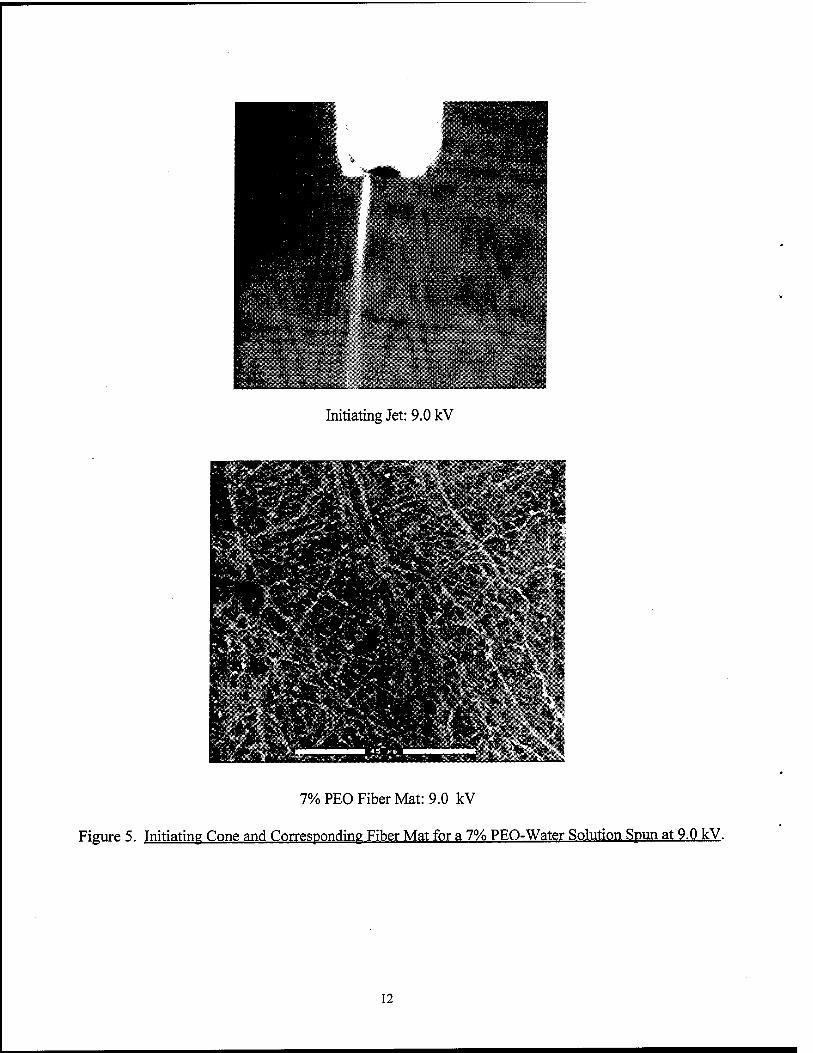
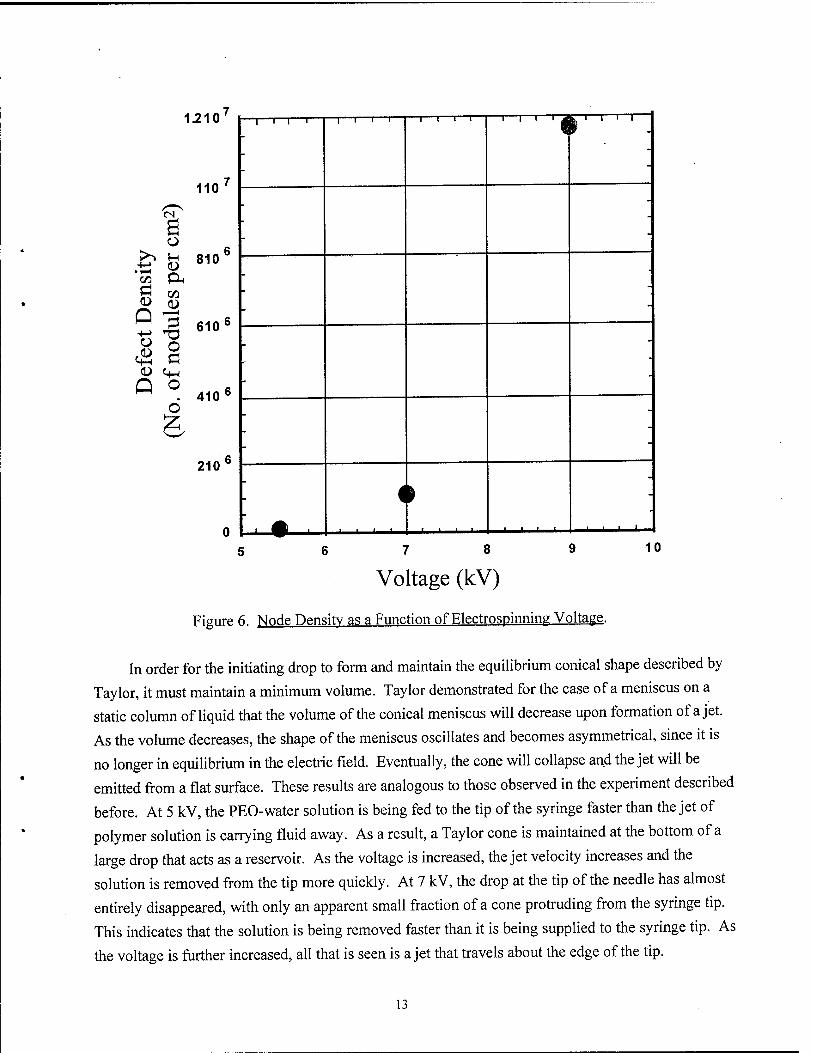
At voltages of 7 kV or more, the jet initiates from within the capillary, rather than from a suspended drop or meniscus. At 7 kV, only the tip of the initiating cone is visible. The corre- sponding electrospun mat is composed of fibers with a cylindrical morphology and an increased number of nodule defects. At 9.0 kV, the solution jet is initiating directly from the tip with no meniscus in evidence. It is likely that the actual jet initiation occurs at some point inside the syringe needle for this case. The electron micrograph of the corresponding fiber shows that a very large number of nodule defects are present. Clearly, increasing the voltage increases the defect density significantly within the fiber mat. This phenomenon is quantified in Figure 6, which is a plot of defect density as a function of acceleration voltage, illustrating an order of magnitude increase in nodule defect density found in a nanofiber mat as the voltage is increased. From these
data, it is seen that the change in shape of the initiating drop at the syringe tip brought about by the
increase in voltage is accompanied by a change in fiber morphology.
Initiating Jet: 5.5 kV
fc» "&-Si
IT* ,• i*i
'"•^>'i;vW:^'./,;:v1
p »■•■ ■■; ? ■ ■ ■ .;■ 5* ■ ■■.-' ~-
7% PEO Fiber Mat: 5.5kV
Figure 3. Initiating Cone and Corresponding Fiber Mat for a 7% PEO-Water Solution Spun at 5.5 kV.
10
1 f'. •*•*■ .^ .-■■ -.'-1
*'•.*• .;,.-■ ,;;,v..
S
Initiating Jet: 7.0 kV
7% PEO Fiber Mat: 7.0 kV
Figure 4. Initiating Cone and Corresponding Fiber Mat for a 7% PEO-Water Solution Spun at 7.0 kV.
11
Initiating Jet: 9.0 kV
7% PEO Fiber Mat: 9.0 kV
Figure 5. Initiating Cone and Corresponding Fiber Mat for a 7% PEO-Water Solution Spun at 9.0 kV.
12
1210
110
es
>> S-H «10
'c/3 PL,
S 3 610 6
° O 0> CM
M . 4106
o
210
"i—i—r 1—i—i—i—I—i—i—i—r T—r -[—r—r
5 6 7 8 9 10
Voltage (kV)
Figure 6. Node Density as a Function of Electrospinning Voltage.
In order for the initiating drop to form and maintain the equilibrium conical shape described by
Taylor, it must maintain a minimum volume. Taylor demonstrated for the case of a meniscus on a
static column of liquid that the volume of the conical meniscus will decrease upon formation of a jet.
As the volume decreases, the shape of the meniscus oscillates and becomes asymmetrical, since it is
no longer in equilibrium in the electric field. Eventually, the cone will collapse and the jet will be
emitted from a flat surface. These results are analogous to those observed in the experiment described
before. At 5 kV, the PEO-water solution is being fed to the tip of the syringe faster than the jet of
polymer solution is carrying fluid away. As a result, a Taylor cone is maintained at the bottom of a
large drop that acts as a reservoir. As the voltage is increased, the jet velocity increases and the
solution is removed from the tip more quickly. At 7 kV, the drop at the tip of the needle has almost
entirely disappeared, with only an apparent small fraction of a cone protruding from the syringe tip.
This indicates that the solution is being removed faster than it is being supplied to the syringe tip. As
the voltage is further increased, all that is seen is a jet that travels about the edge of the tip.
13
Observation of the shape of the initiating drop at higher voltages indicates that the initiating
jet is unstable. This could result in large variations of the jet diameter, which in turn result in
variations of final fiber diameter. In addition, the collapse of the initiating drop means that the
polymer solution is being removed from the tip faster than it can be replaced. This means that at
high voltages, the electrospinning jet undergoes a greater degree of strain than at lower voltages.
Note that the mass flow rate away from the syringe tip is increased at higher voltages. This
could mean that the electrospinning jet proceeds to the collection target more rapidly. In this
case, it is likely that the collected fibers still retain solvent. Once collected on the target, the
fibers are no longer under strain and under the influence of viscoelastic forces and surface tension;
they relax, forming nodular defects connected by thin fibers.
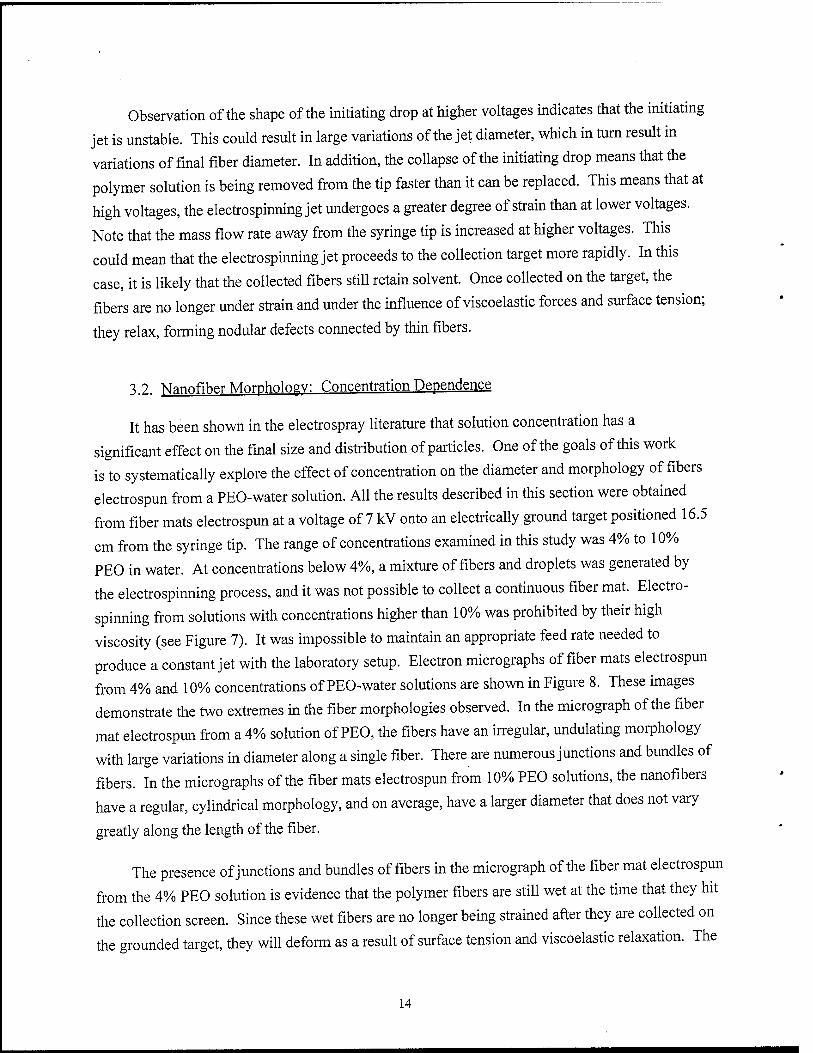
3.2. Nanofiber Morphology: Concentration Dependence
It has been shown in the electrospray literature that solution concentration has a
significant effect on the final size and distribution of particles. One of the goals of this work
is to systematically explore the effect of concentration on the diameter and morphology of fibers
electrospun from a PEO-water solution. All the results described in this section were obtained
from fiber mats electrospun at a voltage of 7 kV onto an electrically ground target positioned 16.5
cm from the syringe tip. The range of concentrations examined in this study was 4% to 10%
PEO in water. At concentrations below 4%, a mixture of fibers and droplets was generated by
the electrospinning process, and it was not possible to collect a continuous fiber mat. Electro-
spinning from solutions with concentrations higher than 10% was prohibited by their high
viscosity (see Figure 7). It was impossible to maintain an appropriate feed rate needed to
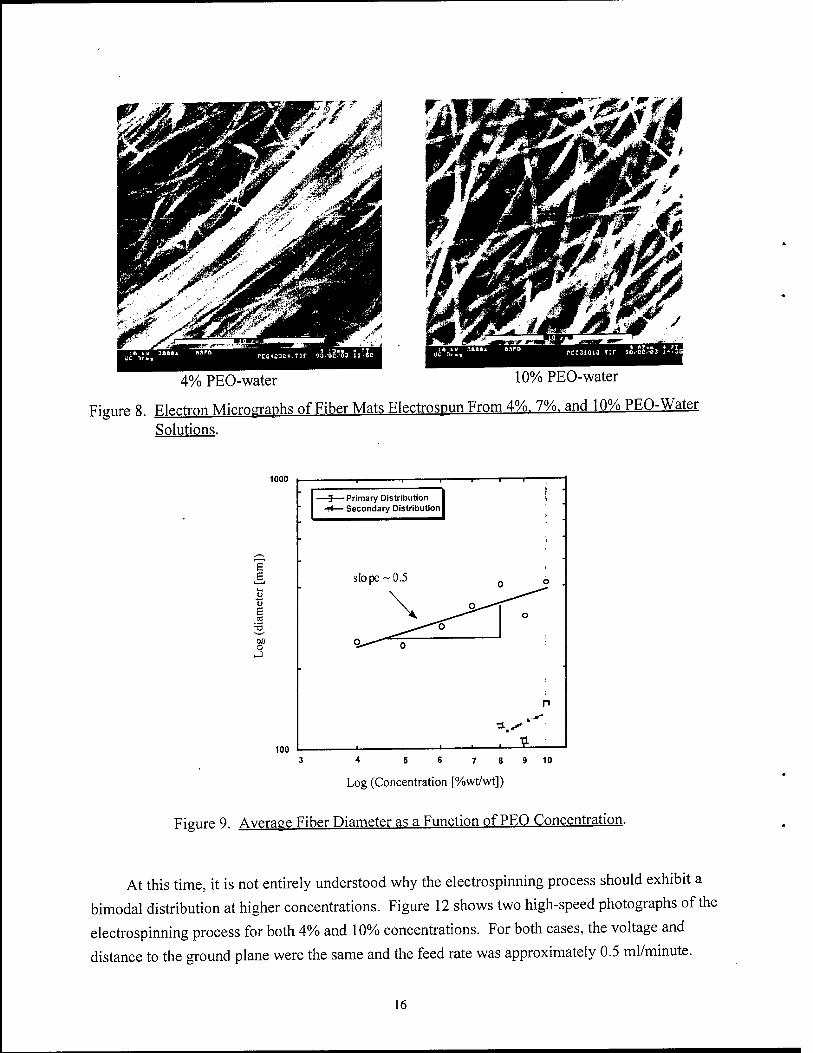
produce a constant jet with the laboratory setup. Electron micrographs of fiber mats electrospun
from 4% and 10% concentrations of PEO-water solutions are shown in Figure 8. These images
demonstrate the two extremes in the fiber morphologies observed. In the micrograph of the fiber
mat electrospun from a 4% solution of PEO, the fibers have an irregular, undulating morphology
with large variations in diameter along a single fiber. There are numerous junctions and bundles of
fibers. In the micrographs of the fiber mats electrospun from 10% PEO solutions, the nanofibers
have a regular, cylindrical morphology, and on average, have a larger diameter that does not vary
greatly along the length of the fiber.
The presence of junctions and bundles of fibers in the micrograph of the fiber mat electrospun
from the 4% PEO solution is evidence that the polymer fibers are still wet at the time that they hit
the collection screen. Since these wet fibers are no longer being strained after they are collected on
the grounded target, they will deform as a result of surface tension and viscoelastic relaxation. The
14
result of this deformation is the undulating morphology seen in the micrograph of the 4% PEO
solution fiber mat. At higher concentrations, the solution surface tension is greatly reduced and the
fibers are mostly dry by the time they are collected on the target. These conditions result in the
normal cylindrical fiber morphology and relatively few junctions seen in the micrograph of the fiber
mat obtained from the 10% PEO solution.
+ Surface Tension
♦ Viscosity
VI <D C >^ a a o
• I-H
c a H
J 1/3
60
55
50
45
40 -
35
Irregular Morphology
Cylindical Morphology
*
0*
O o
5 7 9
Concentration(%w/w)
11
Figure 7. Concentration Dependence of Solution Surface Tension and Solution Viscosity for PEO-Water Solutions.
The effect of concentration on the average diameter of electrospun nanofibers is seen in the plot
of the average fiber diameter as a function of PEO concentration shown in Figure 9. At solution
concentrations >8%, the electrospun fiber mats exhibit a bimodal distribution (see Figure 10). This
behavior is reminiscent of the bimodal droplet distribution that has been reported in electrospray
literature and is the first time it has been reported for the electro spinning process. From Figure 9, it
can be seen that the average diameter of the electrospun fibers corresponding to the primary
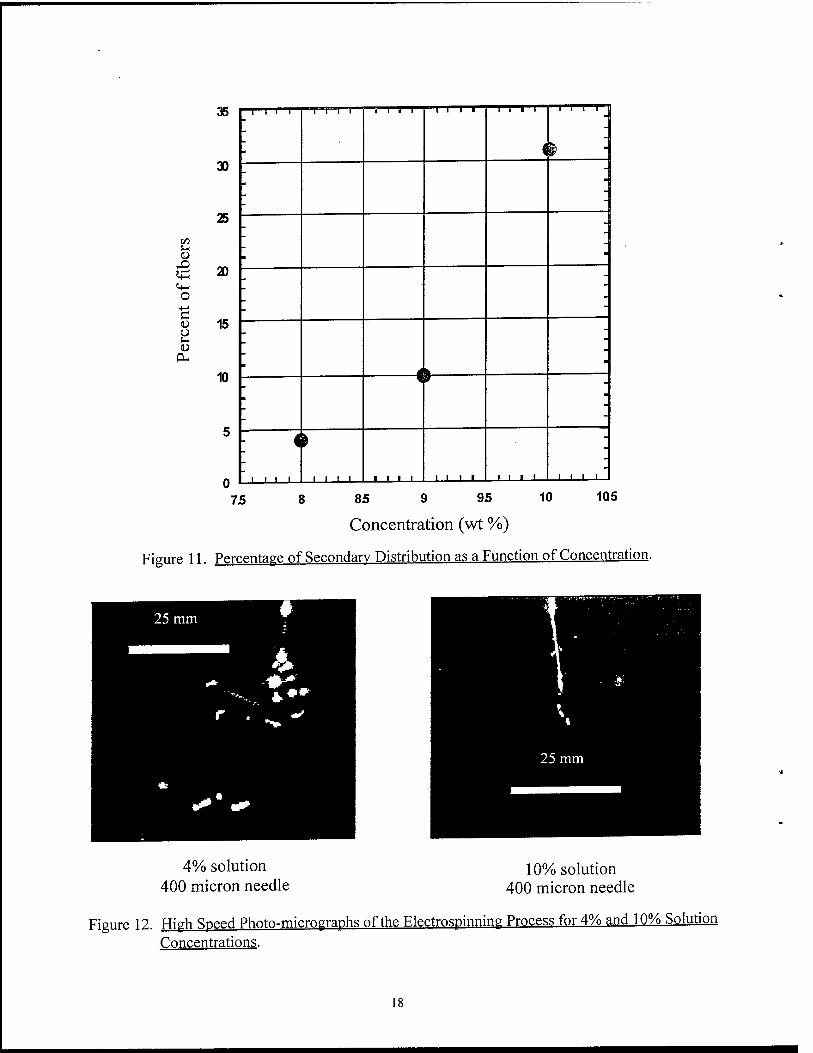
distribution increases by the power of 0.53. Figure 11 is a plot of the percentage of fibers in the
secondary distribution as a function of concentration. From this plot, it is seen that the fibers
composing the secondary distribution become more significant in number at higher concentrations.
15
4% PEO-water 10% PEO-water
Figure 8. Electron Micmpraphs of Fiber Mats Electrospun From 4%. 7%. and 10% PEO-Water Solutions.
1000
00 o
100
-i 1 r-
-3—Primary Distribution -f<— Secondary Distribution
slope -0.5
* ^
4 5 6 7 3 9 10
Log (Concentration [%wt/wt])
Figure 9. Average Fiber Diameter as a Function of PEO Concentration.
At this time, it is not entirely understood why the electrospinning process should exhibit a
bimodal distribution at higher concentrations. Figure 12 shows two high-speed photographs of the
electrospinning process for both 4% and 10% concentrations. For both cases, the voltage and
distance to the ground plane were the same and the feed rate was approximately 0.5 ml/minute.
16
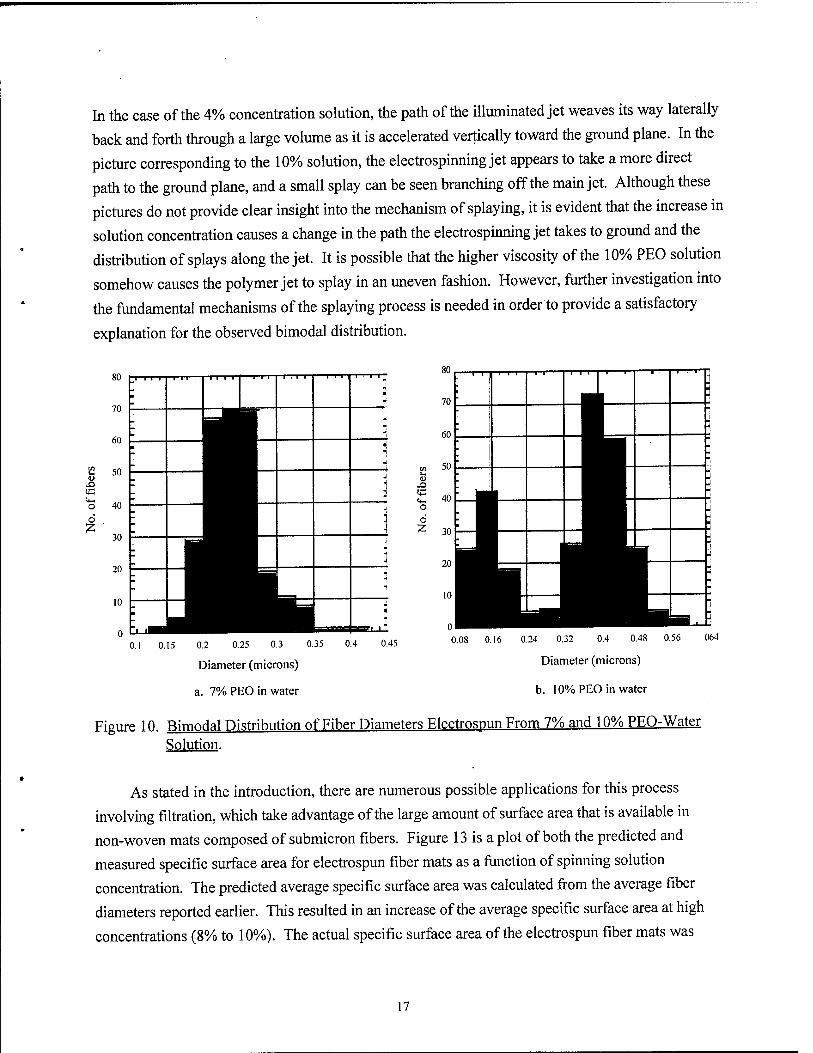
In the case of the 4% concentration solution, the path of the illuminated jet weaves its way laterally
back and forth through a large volume as it is accelerated vertically toward the ground plane. In the
picture corresponding to the 10% solution, the electrospinning jet appears to take a more direct
path to the ground plane, and a small splay can be seen branching off the main jet. Although these
pictures do not provide clear insight into the mechanism of splaying, it is evident that the increase in
solution concentration causes a change in the path the electrospinning jet takes to ground and the
distribution of splays along the jet. It is possible that the higher viscosity of the 10% PEO solution
somehow causes the polymer jet to splay in an uneven fashion. However, further investigation into
the fundamental mechanisms of the splaying process is needed in order to provide a satisfactory
explanation for the observed bimodal distribution.
70
60
S£ 50 £>
o 40 o Z
30
20
10
0
i 11
1 1 1 1 ■ I ^
- 1
4
. ■1 ■ 1
J
■ J
4
- J _ J
j _ ^ - -1 - 2
" 1
J
■ m
J_IHH H^^M ■yjll*
70
60
« 50 <D
£ 40 o d Z 30
■■■'■■ 1 1 ■ ■ - '
h—IE i pan «■! i ■■■ BE
urn ■■; : =Bl
0.1 0.15 0.2 0.25 0.3 0.35 0.4 0.45
Diameter (microns)
a. 7% PEO in water
o 0.08 0.16 0.24 0.32 0.4 0.48 0.56 064
Diameter (microns)
b. 10% PEO in water
Figure 10. Bimodal Distribution of Fiber Diameters Rlectrospun From 7% and 10% PEO-Water Solution.
As stated in the introduction, there are numerous possible applications for this process
involving filtration, which take advantage of the large amount of surface area that is available in
non-woven mats composed of submicron fibers. Figure 13 is a plot of both the predicted and
measured specific surface area for electrospun fiber mats as a function of spinning solution
concentration. The predicted average specific surface area was calculated from the average fiber
diameters reported earlier. This resulted in an increase of the average specific surface area at high
concentrations (8% to 10%). The actual specific surface area of the electrospun fiber mats was
17
35 ■
X # -
- - -
25 —
20 ■
tö -
o .
'S 15
10
■
a S-H
B
if . - ~
5 ~
1 r -
-
n ■ ' i i 1111 ■ i ■ i ■ i 11 ■ i ■ i 11 i i
9 95 10 1Q5
Concentration (wt %)
Figure 11. Percentage of Secondary Distribution as a Function of Concentration.
4% solution 400 micron needle
10% solution 400 micron needle
Figure 12. High Sneed Photo-micrographs of the Electrospinning Process for 4% and 10% Solution Concentrations.
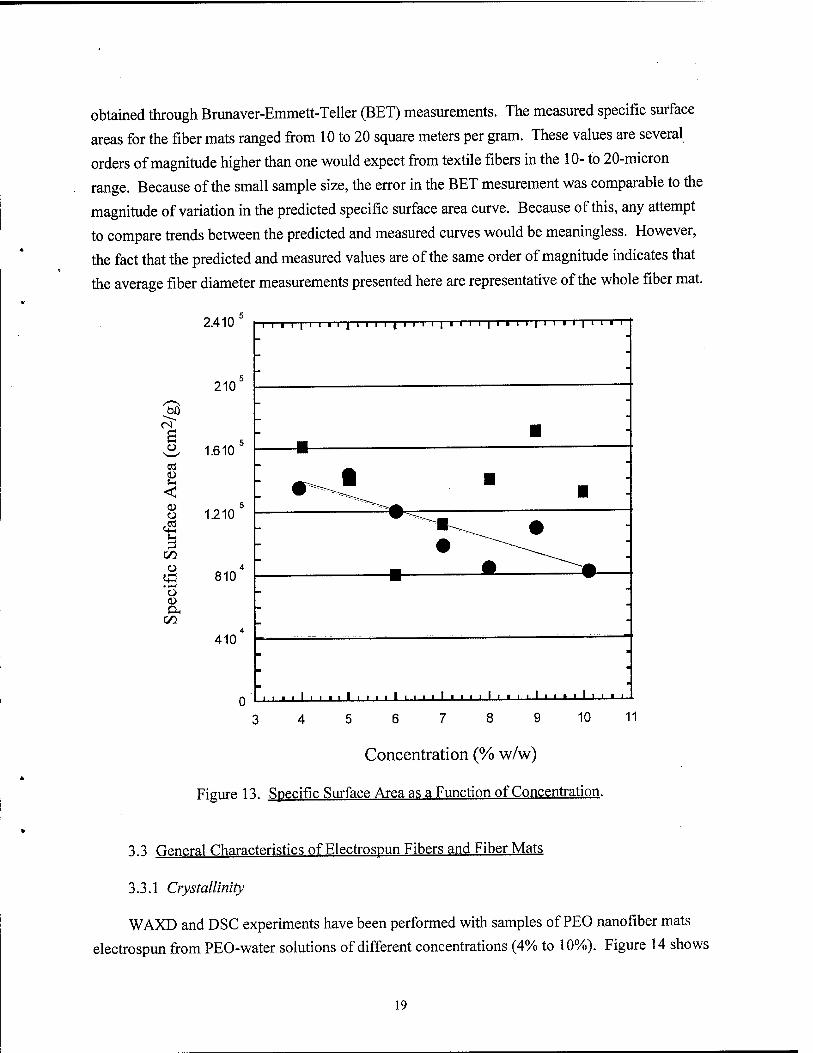
obtained through Brunaver-Emmett-Teller (BET) measurements. The measured specific surface
areas for the fiber mats ranged from 10 to 20 square meters per gram. These values are several
orders of magnitude higher than one would expect from textile fibers in the 10- to 20-micron
range. Because of the small sample size, the error in the BET mesurement was comparable to the
magnitude of variation in the predicted specific surface area curve. Because of this, any attempt
to compare trends between the predicted and measured curves would be meaningless. However,
the fact that the predicted and measured values are of the same order of magnitude indicates that
the average fiber diameter measurements presented here are representative of the whole fiber mat.
2.410
-5? £ o a CD
0) o
ü
o <D a,
210
1.610
1.210
810
410 -
Concentration (% w/w)
Figure 13. Specific Surface Area as a Function of Concentration.
3.3 General Characteristics of Electrospun Fibers and Fiber Mats
3.3.1 Oystallinity
WAXD and DSC experiments have been performed with samples of PEO nanofiber mats
electrospun from PEO-water solutions of different concentrations (4% to 10%). Figure 14 shows
19
WAXD patterns for both a PEO nanofiber mat spun from a 10% concentration PEO-water
solution and the neat PEO powder from which the solution was made. From the figure, it is
immediately evident that the diffraction peaks associated with the PEO powder are sharp and
clearly defined, while the peaks in the pattern of the fiber mat are significantly broader and smeared together. From the Scherrer Equation, t=k?i/(ßcos9), we know that the apparent crystallite size, t,
is inversely proportional to the full width at half maximum (FWHM) of the diffraction peak.
Therefore, the broader diffraction peaks associated with the PEO nanofiber mat indicate smaller,
less perfect crystals than those in the neat PEO powder.
• PEO powder
PEO 10%
10 15 20 25 30 35
26
Figure 14. WAXD Patterns for PEO Powder and PEO Fiber Mat Electrospiin From 10% PEQ- Water Solution.
The PEO fiber mat had a melting temperature, Tm, and heat of fusion, AHf, (66° C and 200
J/g) that were much lower than the Tm and AHf for the neat powder (71° C and 250 J/g). The
lower heat of fusion and melting mean that the PEO fiber mat contains smaller, less perfect
crystals than those in the neat PEO powder. This is consistent with the results from the WAXD
experiments, indicating the crystallinity is not enhanced by the electrospinning process for the
PEO-water solution.
20
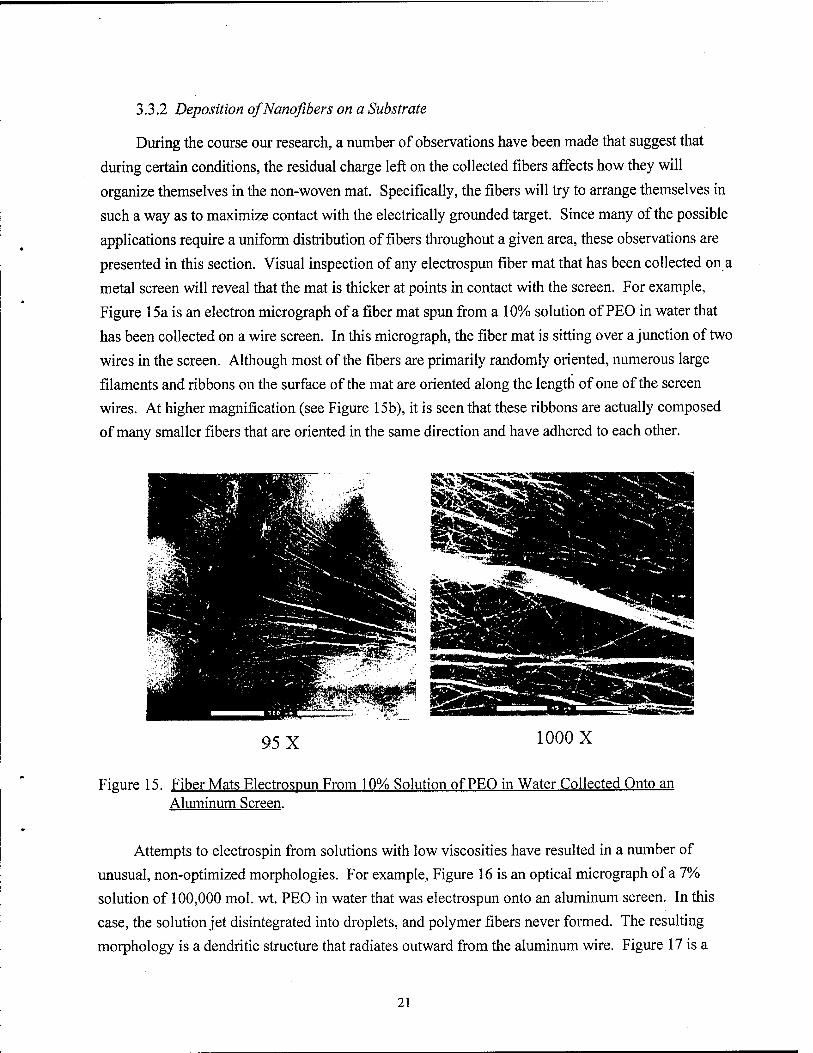
3.3.2 Deposition ofNanofibers on a Substrate
During the course our research, a number of observations have been made that suggest that
during certain conditions, the residual charge left on the collected fibers affects how they will
organize themselves in the non-woven mat. Specifically, the fibers will try to arrange themselves in
such a way as to maximize contact with the electrically grounded target. Since many of the possible
applications require a uniform distribution of fibers throughout a given area, these observations are
presented in this section. Visual inspection of any electrospun fiber mat that has been collected on a
metal screen will reveal that the mat is thicker at points in contact with the screen. For example,
Figure 15a is an electron micrograph of a fiber mat spun from a 10% solution of PEO in water that
has been collected on a wire screen. In this micrograph, the fiber mat is sitting over a junction of two
wires in the screen. Although most of the fibers are primarily randomly oriented, numerous large
filaments and ribbons on the surface of the mat are oriented along the length of one of the screen
wires. At higher magnification (see Figure 15b), it is seen that these ribbons are actually composed
of many smaller fibers that are oriented in the same direction and have adhered to each other.
95 X 1000 X
Figure 15. Fiber Mats Electrospun From 10% Solution of PEO in Water Collected Onto an Aluminum Screen.
Attempts to electrospin from solutions with low viscosities have resulted in a number of
unusual, non-optimized morphologies. For example, Figure 16 is an optical micrograph of a 7%
solution of 100,000 mol. wt. PEO in water that was electrospun onto an aluminum screen. In this
case, the solution jet disintegrated into droplets, and polymer fibers never formed. The resulting
morphology is a dendritic structure that radiates outward from the aluminum wire. Figure 17 is a
21
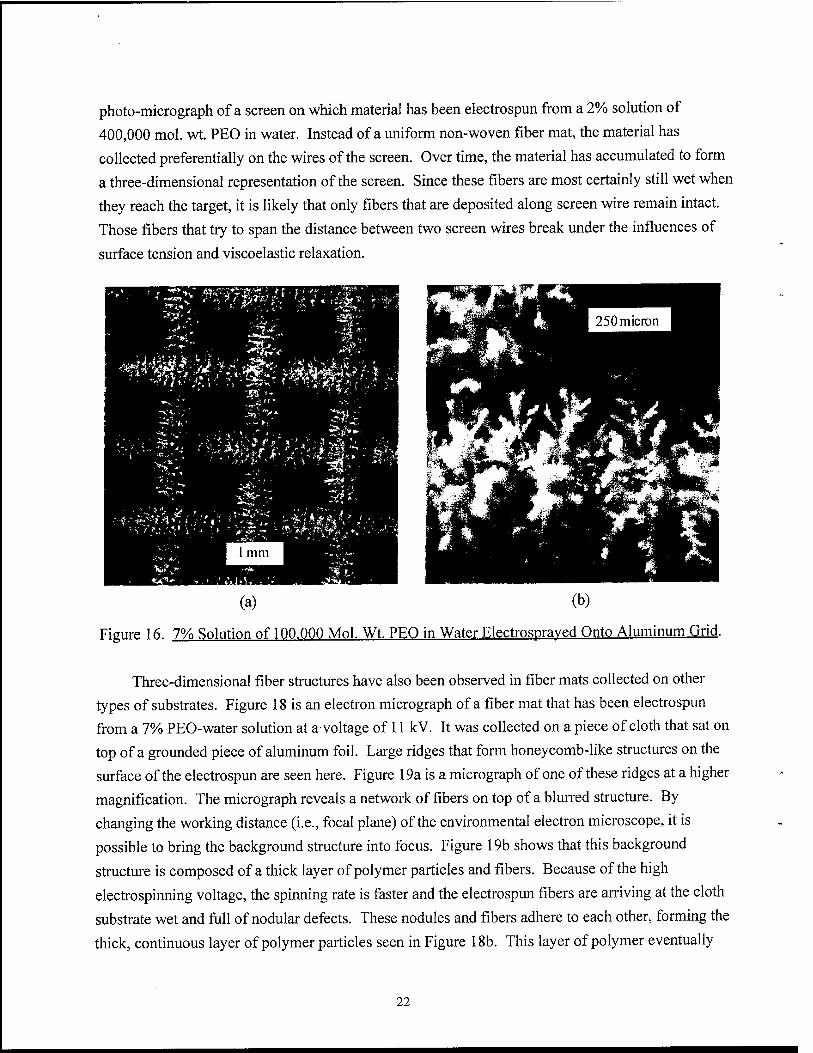
photo-micrograph of a screen on which material has been electrospun from a 2% solution of
400,000 mol. wt. PEO in water. Instead of a uniform non-woven fiber mat, the material has
collected preferentially on the wires of the screen. Over time, the material has accumulated to form
a three-dimensional representation of the screen. Since these fibers are most certainly still wet when
they reach the target, it is likely that only fibers that are deposited along screen wire remain intact.
Those fibers that try to span the distance between two screen wires break under the influences of
surface tension and viscoelastic relaxation.
(a) (b)
Figure 16. 7% Solution of 100.000 Mol. Wt. PEO in Water Electrospraved Onto Aluminum Grid.
Three-dimensional fiber structures have also been observed in fiber mats collected on other
types of substrates. Figure 18 is an electron micrograph of a fiber mat that has been electrospun
from a 7% PEO-water solution at a voltage of 11 kV. It was collected on a piece of cloth that sat on
top of a grounded piece of aluminum foil. Large ridges that form honeycomb-like structures on the
surface of the electrospun are seen here. Figure 19a is a micrograph of one of these ridges at a higher
magnification. The micrograph reveals a network of fibers on top of a blurred structure. By
changing the working distance (i.e., focal plane) of the environmental electron microscope, it is
possible to bring the background structure into focus. Figure 19b shows that this background
structure is composed of a thick layer of polymer particles and fibers. Because of the high
electrospinning voltage, the spinning rate is faster and the electrospun fibers are arriving at the cloth
substrate wet and full of nodular defects. These nodules and fibers adhere to each other, forming the
thick, continuous layer of polymer particles seen in Figure 18b. This layer of polymer eventually
22
accumulates enough of an electrostatic charge to prevent new electrospun fibers from lying directly
on the mat. Instead, they are suspended slightly above the surface, where they have time to dry.
The result is ridged honeycomb-like structure seen in Figure 18.
Figure 17. Photomicrograph of 2% PEO-Water Solution Electrospun Onto an Aluminum Grid.
Figure 18. Three-dimensional Structure in Non-woven Fiber Mat Electrospun From a 7% Solution of 400.000 Mol. Wt. PEO and Water Electrospun at 11 kV Onto a Cloth Substrate.
23
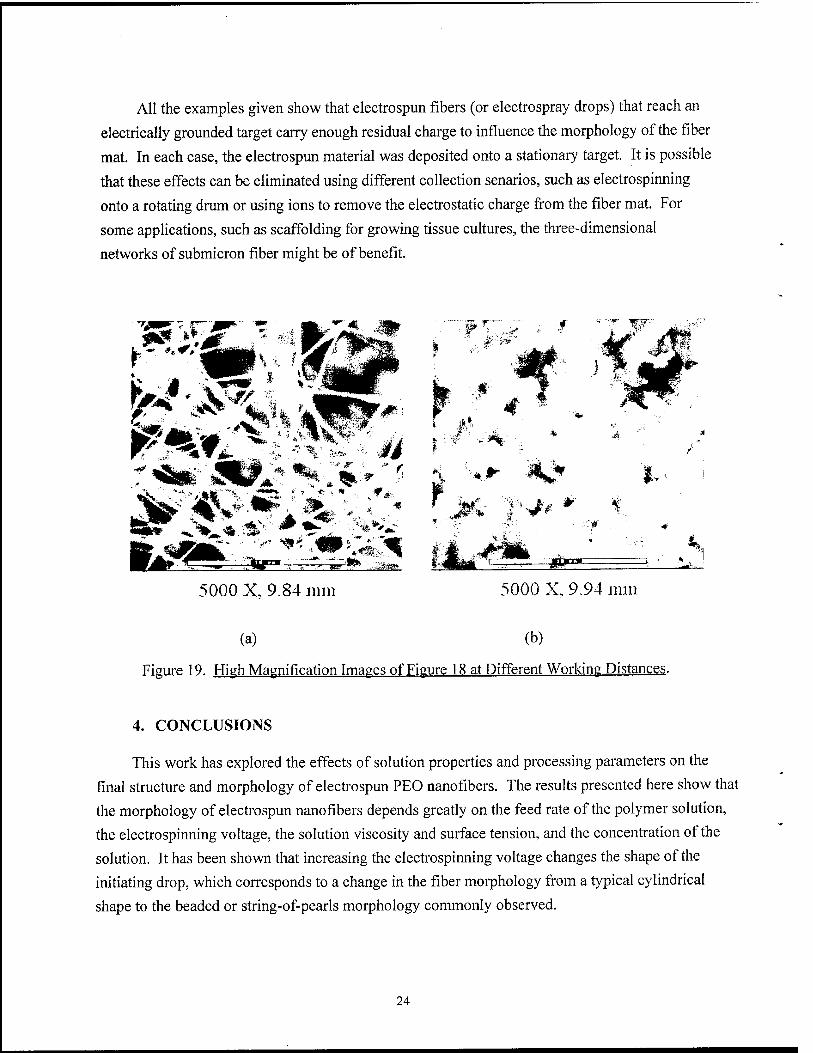
All the examples given show that electrospun fibers (or electrospray drops) that reach an
electrically grounded target carry enough residual charge to influence the morphology of the fiber
mat. In each case, the electrospun material was deposited onto a stationary target. It is possible
that these effects can be eliminated using different collection senarios, such as electrospinning
onto a rotating drum or using ions to remove the electrostatic charge from the fiber mat. For
some applications, such as scaffolding for growing tissue cultures, the three-dimensional
networks of submicron fiber might be of benefit.
K^ **&■
,***>^
5000 X, 9.84 nun
fi
^jpp
5000 X, 9.94 nun
(a) (b)
Figure 19. High Magnification Images of Figure 18 at Different Working Distances.
4. CONCLUSIONS
This work has explored the effects of solution properties and processing parameters on the
final structure and morphology of electrospun PEO nanofibers. The results presented here show that
the morphology of electrospun nanofibers depends greatly on the feed rate of the polymer solution,
the electrospinning voltage, the solution viscosity and surface tension, and the concentration of the
solution. It has been shown that increasing the electrospinning voltage changes the shape of the
initiating drop, which corresponds to a change in the fiber morphology from a typical cylindrical
shape to the beaded or string-of-pearls morphology commonly observed.
24
Fibers electrospun from low concentration solutions (4%) have an irregular, undulating
morphology, while fibers electrospun from higher concentration solutions (7% to 10%) have a regular, cylindrical morphology. The undulating morphology seen at low concentrations is the result of a combination of surface tension and viscoelastic relaxation of the wet fibers. At higher
concentrations, the solution surface tension is decreased significantly and the fibers collected on the target are dry, so the morphology is cylindrical. It has been shown that the fiber diameter of the electrospun PEO increases as the 0.53 power with concentration. Further, at concentrations of 8% or higher, the fiber diameter exhibits a bimodal distribution. Although this behavior is similar to results reported for electrospray experiments, it is the first time it has been seen for
electrospun polymer fibers.
Based on WAXD and DSC experiments, it has been shown that the electrospinning process
does not significantly enhance the crystallinity or crystal structure of nanofibers spun from PEO- water solutions. It has been shown that electrospun fibers collected on a grounded target retain enough residual charge to influence the organization of the nanofibers in the non-woven mat. It has also been shown that in extreme cases, the surface of the non-woven mat will maintain a net static charge that will cause newly deposited fibers to organize and grow three-dimensional
networks.
25
INTENTIONALLY LEFT BLANK
26
REFERENCES
1. Dees, J.R., and J.E. Spruiell, Journal of Applied Polymer Science, 18,1053-1078,1974.
2. Barham, P.J., and A. Keller, Journal of Materials Science, 20,2281-2302,1985.
3. Gibson, P.W., H.L. Shreuder-Gibson, and D. Riven, AlChE Journal, 45,190-195,1999.
4. Zeleny, J., Physical Review, 3, 69-91,1913.
5. Taylor, G. I., Proceedings of the Royal Society of London, Series A, 280,383-397,1964.
6. Taylor, G. I., Proceedings of the Royal Society of London, Series A, 313,453-475,1969.
7. Cloupeau, M., and B.J. Prunet-Foch, Journal of Electrostatics, 25, 165-184, 1990.
8. Grace, J.M., and J.C. M. Marijnissen, Journal of Aerosol Science, 25,1005-1019,1994.
9. Chen, D.R, D.Y.E. Pui, and S.L. Kaufman, Journal of Aerosol Science, 26,963-977,1995.
10. Gomez, A., and K. Tang, Physics of Fluids, 6,404-414,1994.
10. Gomez, A., and K. Tang, Physics of Fluids, 6,2317-2325,1994.
12. Fernandez de La Mora, J., and I.G Loscertales, Journal of Fluid Mechanics, 260,155-184, 1994.
13. Ganan-Calvo, A.M., Journal of Aerosol Science, 25,309-310,1994.
14. Reneker, D.H., and I. Chun, Nanotechnology, 7, 216-223,
15. Srinivasen, G., and D.H. Reneker, Polymer International, 36,195-201,1995.
16. Doshi, J., and D.H. Reneker, Journal of Electrostatics, 35, 151-160, 1995.
17. Baumgarten, P.K., Journal of Colloid and Interface Science, 36, 71,1971.
18. Larrondo, L., and St. John Manley, Journal of Polymer Science: Polymer Physics Edition, 19,909-920,1981.
19. Larrondo, L., and St.John Manley, Journal of Polymer Science: Polymer Physics Edition, 19,921-932,1981.
20. Larrondo, L., and St.John Manley, Journal of Polymer Science: Polymer Physics Edition, 19,933-940,1981.
21. Fong, H., I. Chun, and D.H. Reneker, Submitted to Polymer, September 1998.
27
INTENTIONALLY LEFT BLANK
28
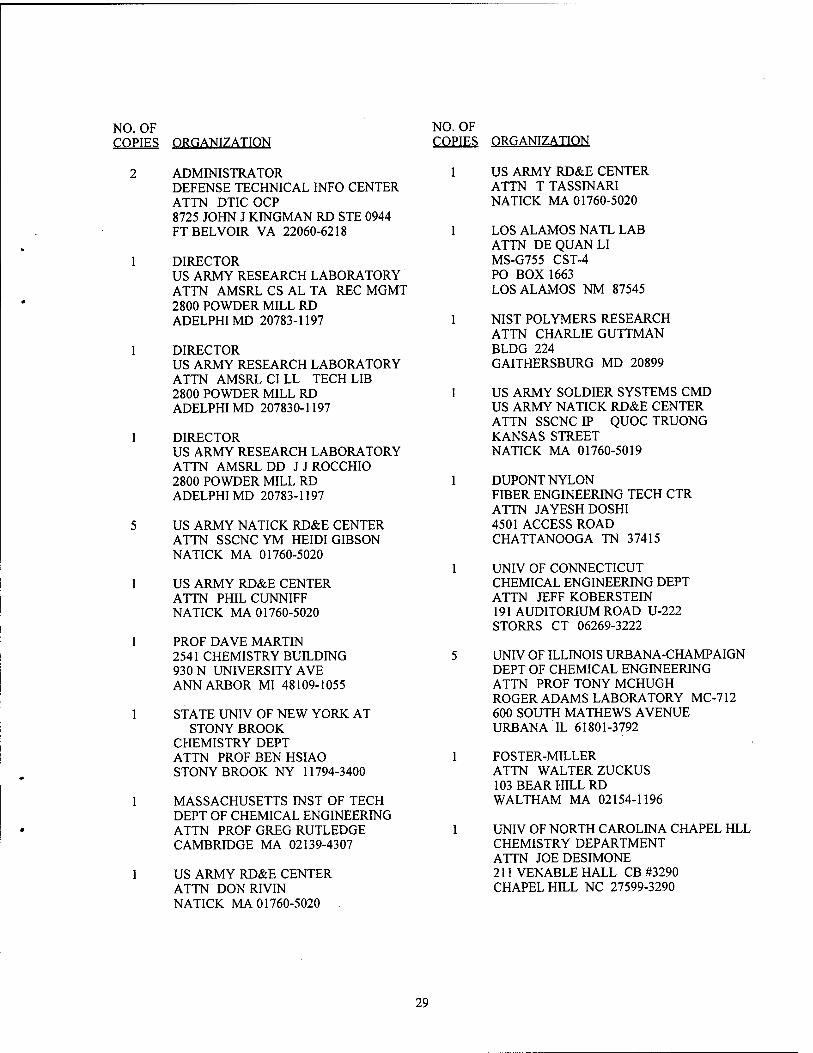
NO. OF COPIES ORGANIZATION
ADMINISTRATOR DEFENSE TECHNICAL INFO CENTER ATTN DTIC OCP 8725 JOHN J KINGMAN RD STE 0944 FTBELVOIR VA 22060-6218
DIRECTOR US ARMY RESEARCH LABORATORY ATTN AMSRLCSALTA REC MGMT 2800 POWDER MILL RD ADELPHIMD 20783-1197
DIRECTOR US ARMY RESEARCH LABORATORY ATTN AMSRLCILL TECH LIB 2800 POWDER MILL RD ADELPHI MD 207830-1197
DIRECTOR US ARMY RESEARCH LABORATORY ATTN AMSRLDD J J ROCCHIO 2800 POWDER MILL RD ADELPHIMD 20783-1197
US ARMY NATICK RD&E CENTER ATTN SSCNCYM HEIDI GIBSON NATICK MA 01760-5020
US ARMY RD&E CENTER ATTN PHILCUNNIFF NATICK MA 01760-5020
PROF DAVE MARTIN 2541 CHEMISTRY BUILDING 930 N UNIVERSITY AVE ANN ARBOR MI 48109-1055
STATE UNIV OF NEW YORK AT STONY BROOK
CHEMISTRY DEPT ATTN PROF BEN HSIAO STONY BROOK NY 11794-3400
MASSACHUSETTS INST OF TECH DEPT OF CHEMICAL ENGINEERING ATTN PROF GREG RUTLEDGE CAMBRIDGE MA 02139-4307
US ARMY RD&E CENTER ATTN DONRIVIN NATICK MA 01760-5020
NO. OF COPIES
1
ORGANIZATION
US ARMY RD&E CENTER ATTN TTASSINARI NATICK MA 01760-5020
LOS ALAMOS NATL LAB ATTN DE QUAN LI MS-G755 CST-4 PO BOX 1663 LOS ALAMOS NM 87545
NIST POLYMERS RESEARCH ATTN CHARLIE GUTTMAN BLDG 224 GAITHERSBURG MD 20899
US ARMY SOLDIER SYSTEMS CMD US ARMY NATICK RD&E CENTER ATTN SSCNCIP QUOC TRUONG KANSAS STREET NATICK MA 01760-5019
DUPONT NYLON FIBER ENGINEERING TECH CTR ATTN JAYESHDOSHI 4501 ACCESS ROAD CHATTANOOGA TN 37415
UNIV OF CONNECTICUT CHEMICAL ENGINEERING DEPT ATTN JEFF KOBERSTEIN 191 AUDITORIUM ROAD U-222 STORRS CT 06269-3222
UNIV OF ILLINOIS URBANA-CHAMPAIGN DEPT OF CHEMICAL ENGINEERING ATTN PROF TONY MCHUGH ROGER ADAMS LABORATORY MC-712 600 SOUTH MATHEWS AVENUE URBANA IL 61801-3792
FOSTER-MILLER ATTN WALTER ZUCKUS 103 BEAR HILL RD WALTHAM MA 02154-1196
UNIV OF NORTH CAROLINA CHAPEL HLL CHEMISTRY DEPARTMENT ATTN JOE DESIMONE 211 VENABLE HALL CB #3290 CHAPEL HILL NC 27599-3290
29
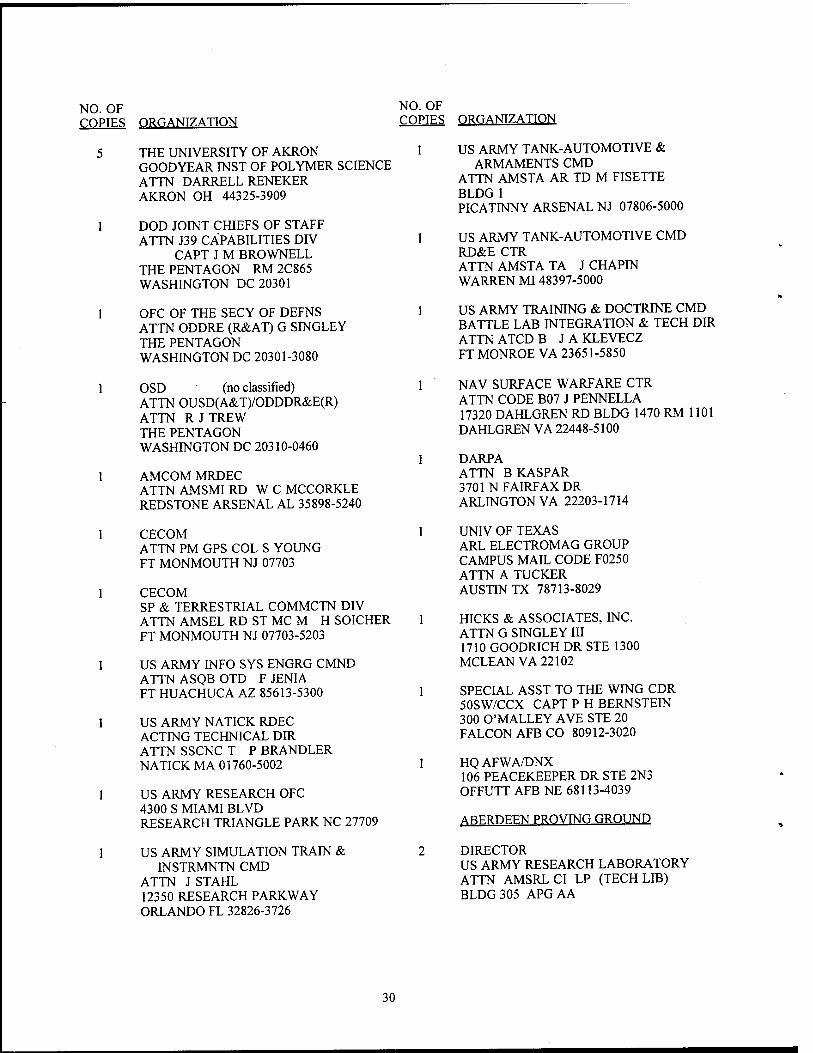
NO. OF COPIES ORGANIZATION
THE UNIVERSITY OF AKRON GOODYEAR INST OF POLYMER SCIENCE ATTN DARRELL RENEKER AKRON OH 44325-3909
DOD JOINT CHIEFS OF STAFF ATTN J39 CAPABILITIES DIV
CAPT J M BROWNELL THE PENTAGON RM 2C865 WASHINGTON DC 20301
OFC OF THE SECY OF DEFNS ATTN ODDRE (R&AT) G SINGLEY THE PENTAGON WASHINGTON DC 20301-3080
OSD (no classified) ATTN OUSD(A&T)/ODDDR&E(R) ATTN R J TREW THE PENTAGON WASHINGTON DC 20310-0460
AMCOM MRDEC ATTN AMSMI RD W C MCCORKLE REDSTONE ARSENAL AL 35898-5240
CECOM ATTN PM GPS COL S YOUNG FT MONMOUTH NJ 07703
CECOM SP & TERRESTRIAL COMMCTN DIV ATTN AMSEL RD ST MC M H SOICHER FT MONMOUTH NJ 07703-5203
US ARMY INFO SYS ENGRG CMND ATTN ASQB OTD F JENIA FT HUACHUCA AZ 85613-5300
US ARMY NATICK RDEC ACTING TECHNICAL DIR ATTN SSCNC T P BRANDLER NATICK MA 01760-5002
US ARMY RESEARCH OFC 4300 S MIAMI BLVD RESEARCH TRIANGLE PARK NC 27709
US ARMY SIMULATION TRAIN & INSTRMNTN CMD
ATTN J STAHL 12350 RESEARCH PARKWAY ORLANDO FL 32826-3726
NO. OF COPIES
1
ORGANIZATION
US ARMY TANK-AUTOMOTIVE & ARMAMENTS CMD
ATTN AMSTA AR TD M FISETTE BLDG1 PICATINNY ARSENAL NJ 07806-5000
US ARMY TANK-AUTOMOTIVE CMD RD&E CTR ATTN AMSTA TA J CHAPIN WARREN MI 48397-5000
US ARMY TRAINING & DOCTRINE CMD BATTLE LAB INTEGRATION & TECH DIR ATTNATCDB J A KLEVECZ FT MONROE VA 23651-5850
NAV SURFACE WARFARE CTR ATTN CODE B07 J PENNELLA 17320 DAHLGREN RD BLDG 1470 RM 1101 DAHLGREN VA 22448-5100
DARPA ATTN B KASPAR 3701 N FAIRFAX DR ARLINGTON VA 22203-1714
UNIV OF TEXAS ARL ELECTROMAG GROUP CAMPUS MAIL CODE F0250 ATTN A TUCKER AUSTIN TX 78713-8029
HICKS & ASSOCIATES, INC. ATTN G SINGLEY III 1710 GOODRICH DR STE 1300 MCLEAN VA 22102
SPECIAL ASST TO THE WING CDR 50SW/CCX CAPT P H BERNSTEIN 300 O'MALLEY AVE STE 20 FALCON AFB CO 80912-3020
HQ AFWA/DNX 106 PEACEKEEPER DR STE 2N3 OFFUTT AFB NE 68113-4039
ABERDEEN PROVING GROUND
DIRECTOR US ARMY RESEARCH LABORATORY ATTN AMSRLCI LP (TECH LIB) BLDG 305 APGAA
30
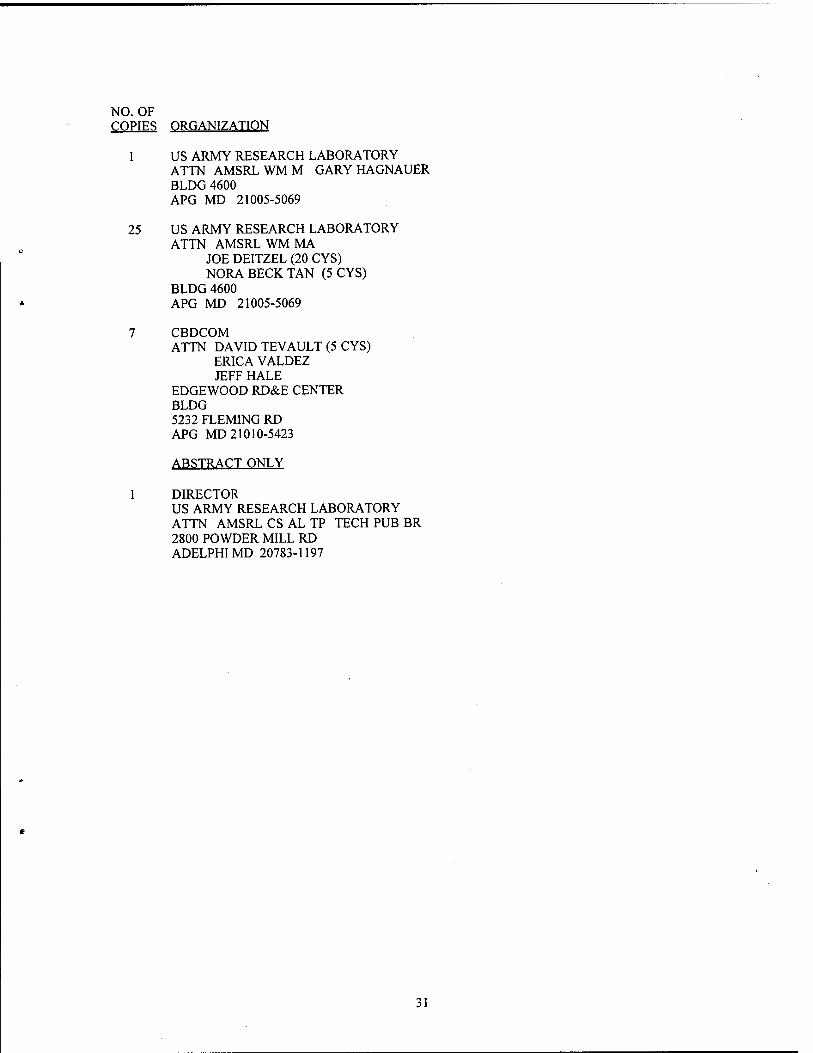
NO. OF COPIES ORGANIZATION
1 US ARMY RESEARCH LABORATORY ATTN AMSRLWMM GARY HAGNAUER BLDG 4600 APG MD 21005-5069
25 US ARMY RESEARCH LABORATORY ATTN AMSRL WM MA
JOE DEITZEL (20 CYS) NORA BECK TAN (5 CYS)
BLDG 4600 APG MD 21005-5069
7 CBDCOM ATTN DAVID TEVAULT (5 CYS)
ERICA VALDEZ JEFF HALE
EDGEWOOD RD&E CENTER BLDG 5232 FLEMING RD APG MD 21010-5423
ABSTRACT ONLY
1 DIRECTOR US ARMY RESEARCH LABORATORY ATTN AMSRL CS AL TP TECH PUB BR 2800 POWDER MILL RD ADELPHIMD 20783-1197
31
INTENTIONALLY LEFT BLANK
32
REPORT DOCUMENTATION PAGE Form Approved OMB No. 0704-0188
Public reporting burden for this collection of information is estimated to average 1 hour per response, including the time for reviewing instructions, searching existing data sources, gathering and maintaining the data needed, and completing and reviewing the collection of information. Send comments regarding this burden estimate or any other aspect of this collection of information, including suggestions for reducing this burden, to Washington Headquarters Services, Directorate for Information Operations and Reports, 1215 Jefferson Davis Highway, Suite 1204, Arlington, VA 22202-4302, and to the Office of Management and Budget, Paperwork Reduction Project (0704-0188), Washington, DC 20503.
1. AGENCY USE ONLY (Leave blank) 2. REPORT DATE
June 1999 3. REPORT TYPE AND DATES COVERED
Final
4. TITLE AND SUBTITLE
Generation of Polymer Nanofibers Through Electrospinning
6. AUTHOR(S)
Deitzel, J.M.; Beck Tan, N.C.; Kleinmeyer, J.D. (all of ARL); Rehrmann, J.; Tevault, D. (both of ECBC); Reneker, D. (Univ of Akron); Sendijarevic, I.; McHugh, A. (both of Univ of Illinois)
7. PERFORMING ORGANIZATION NAME(S) AND ADDRESS(ES)
U.S. Army Research Laboratory Weapons & Materials Research Directorate Aberdeen Proving Ground, MD 21010-5066
9. SPONSORING/MONITORING AGENCY NAME(S) AND ADDRESS(ES)
U.S. Army Research Laboratory Weapons & Materials Research Directorate Aberdeen Proving Ground, MD 21010-5066
5. FUNDING NUMBERS
PR: 611102AH42
8. PERFORMING ORGANIZATION REPORT NUMBER
10. SPONSORING/MONITORING AGENCY REPORT NUMBER
ARL-TR-1989
11. SUPPLEMENTARY NOTES
12a. DISTRIBUTION/AVAILABILITY STATEMENT
Approved for public release; distribution is unlimited.
12b. DISTRIBUTION CODE
13. ABSTRACT (Maximum 200 words)
Non-woven fabrics composed of nanofibers have a large specific surface area and small pore size compared to commercial textiles. These properties make such non-woven fabrics excellent candidates for filter and membrane applications, particularly in the areas of chemical and biological agent defense. Nanofibers may be produced by electrospinning, which uses an electric field to produce continuous fibers with diameters in the tens of nanometers range. Although the technique has been known for some time, very little information concerning the effect of processing variables such as solution concentration, viscosity, surface tension, flow rate and acceleration voltage on final fiber properties exists in the literature. In this work, nanofibers of polyethylene oxide have been electrospun from a range a solution concentrations and for a range of voltages. Wide angle X-ray diffraction and differential scanning calorimetery indicate that crystal structure is poorly developed in the electrospun fibers, when compared to results obtained from polyethylene oxide) powder. Fiber diameter increases with increasing concentration by the 0.53 power. We find that for concentrations of 8% (wt) and greater, a bimodal fiber diameter distribution has been observed, which is analogous to results reported for electrospray experiments. The density of node defects has been shown to increase with increasing voltage for a constant solution feed rate.
14. SUBJECT TERMS
electrospinning nanofibers
PEO
15. NUMBER OF PAGES
40 16. PRICE CODE
17. SECURITY CLASSIFICATION OF REPORT
Unclassified
18. SECURITY CLASSIFICATION OF THIS PAGE
Unclassified
19. SECURITY CLASSIFICATION OF ABSTRACT
Unclassified
20. LIMITATION OF ABSTRACT
NSN 7540-01-280-5500 33 Standard Form 298 (Rev. 2-89) Prescribed by ANSI Std. Z39-18 298-102