Embed Size (px)
Citation preview
Supplementary Materials
Catalyst-assisted chemical looping auto-thermal dry reforming:
Spatial structuring effects on process efficiency
Jiawei Hua, Vladimir V. Galvitaa*, Hilde Poelmana, Christophe Detavernierb, Guy B. Marina
aLaboratory for Chemical Technology, Ghent University, Technologiepark 914, B-9052 Ghent, BelgiumbDepartment of Solid State Sciences, Ghent University, Krijgslaan 281, S1, B-9000 Ghent, Belgium*Corresponding author: V. V. Galvita: [email protected];
tel: +32-468-10-6004; fax: +32-9331-1759
List:
Fig. S1. EDX line-scan analysis for core-shell structured Ni/Zr@Zr catalyst and Fe/Zr@Zr
OSM.
Fig. S2. STEM micrograph and EDX element mapping of Fe, Zr, Si and Ni as well as these
elements combined for the as-prepared Fe/Zr@Zr-Si@Ni sample.
Fig. S3. 2D in-situ XRD pattern recorded during H2-TPR for the Fe/Zr@Zr-Ni@Zr bifunctional
catalyst as well as the diffraction peaks from 42.5° to 46.0° at the selected temperature.
Fig. S4. The XRD peaks from 42.5° to 46.5° at different time positions during the first
isothermal redox cycle over physical mixture of Ni/Zr@Zr and Fe/Zr@Zr, as well as
Fe/Zr@Zr-Ni@Zr bifunctional catalyst.
Fig. S5. XPS wide scans for the as-prepared, reduced and spent samples of Fe/Zr@Zr-Ni@Zr
bifunctional catalyst.
Fig. S6. Equilibrium lines of (CO+H2)/(CO2+H2O) ratio, CH4 and CO2 conversion, as well as the
iron/iron oxide system at different temperature during catalytic auto-thermal dry reforming
of methane.
Fig. S7. Reactivity of the Fe/Zr@Zr-Ni@Zr bifunctional catalyst during the CCAR process: the
space-time yields of the products vs. time on stream during the reduction and re-oxidation
half-cycle.
1
Fig. S8. CO2 space-time yield (STY) during O2-TPO over the spent catalysts after 25 cycles of
CCAR from different reactor bed configurations.
Fig. S9. XRD patterns of the spent samples of Ni/Zr@Zr catalyst, Fe/Zr@Zr OSM and
Fe/Zr@Zr-Ni@Zr bifunctional catalyst after 25 cycles of CCAR in different reactor beds.
Fig. S10. BET specific surface area of fresh and spent samples after 25 CCAR cycles of a
physical mixture of Ni/Zr@Zr and Fe/Zr@Zr, as well as for the Fe/Zr@Zr-Ni@Zr bifunctional
catalyst.
2
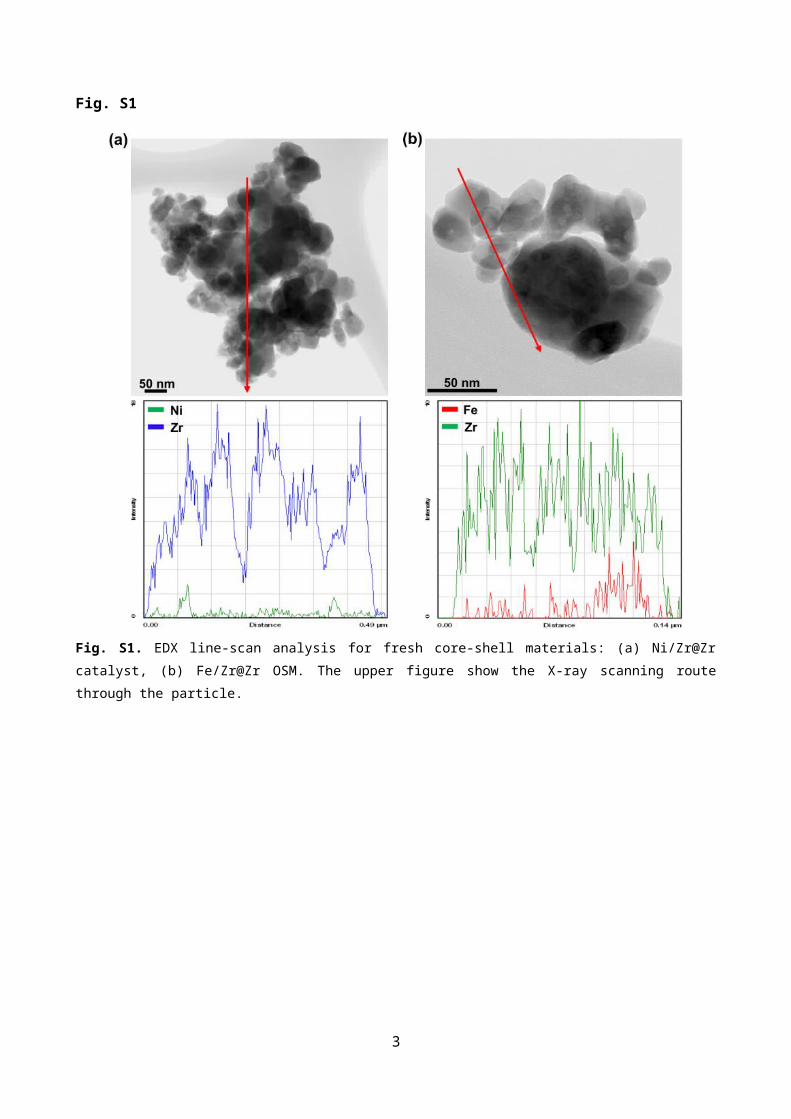
Fig. S1
Fig. S1. EDX line-scan analysis for fresh core-shell materials: (a) Ni/Zr@Zr catalyst, (b) Fe/Zr@Zr OSM. The
upper figure show the X-ray scanning route through the particle.
3
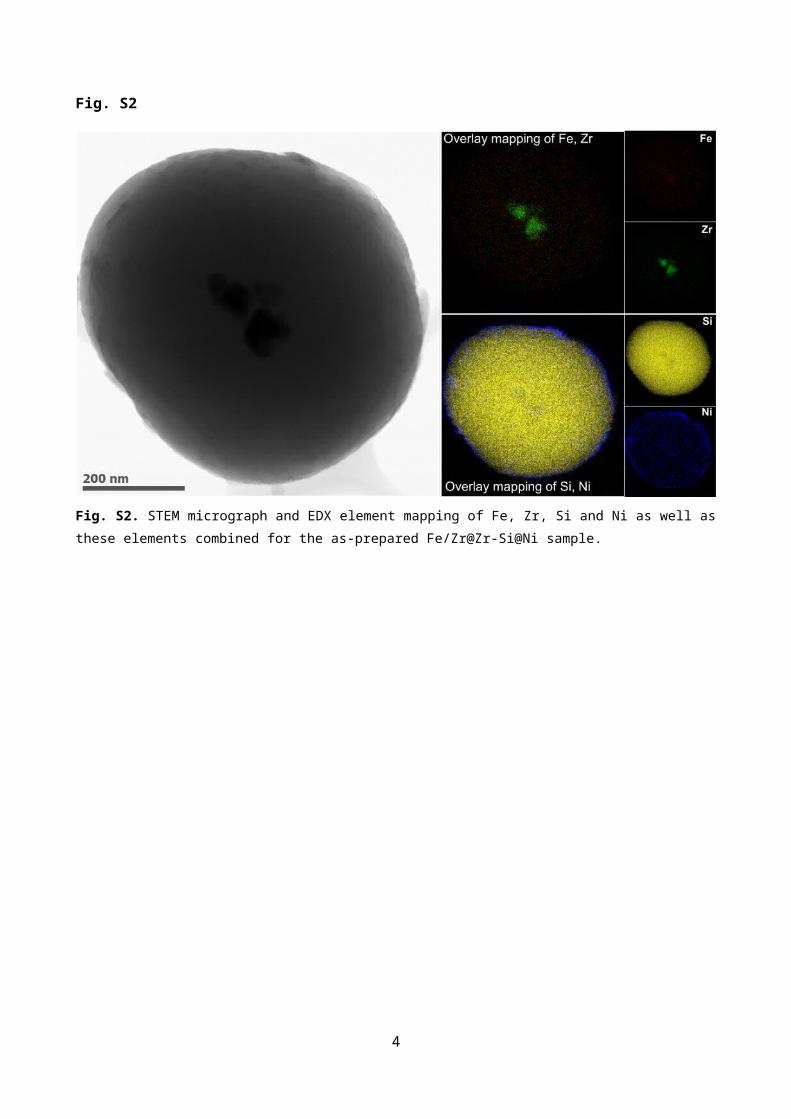
Fig. S2
Fig. S2. STEM micrograph and EDX element mapping of Fe, Zr, Si and Ni as well as these elements combined for
the as-prepared Fe/Zr@Zr-Si@Ni sample.
4
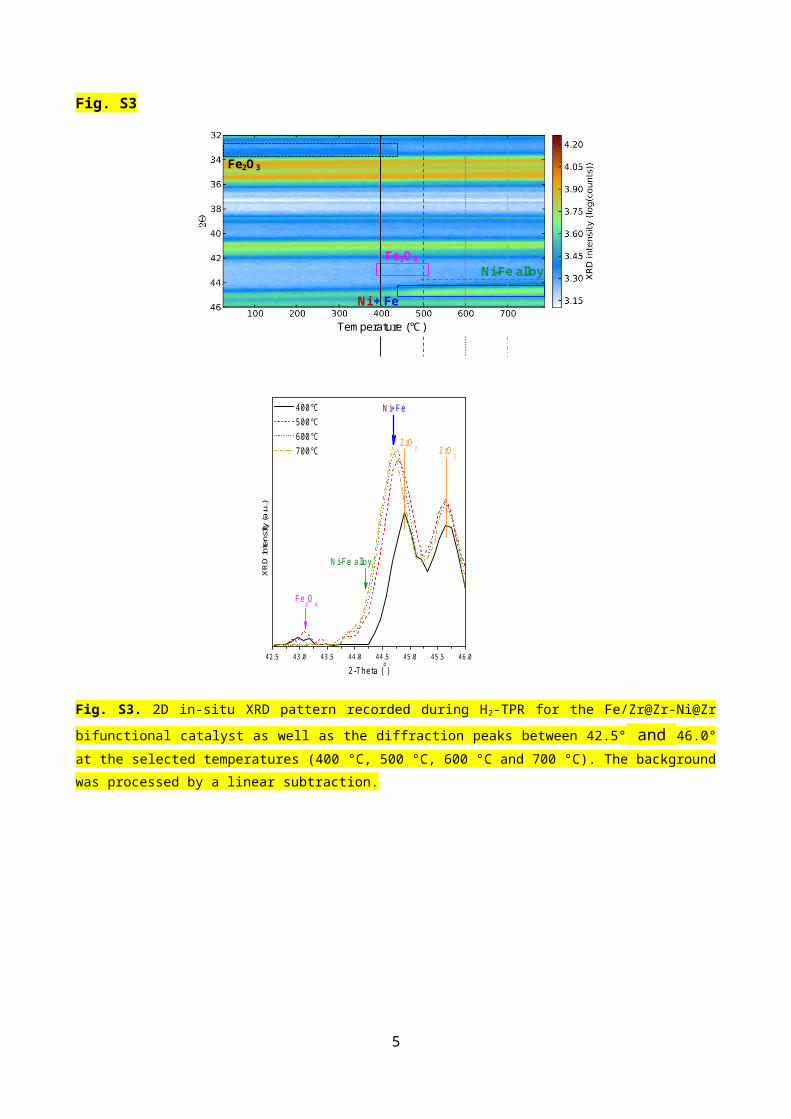
Fig. S3
Temperature (°C)
Fe3O4
Ni + Fe
Ni-Fe alloy
Fe2O3
42.5 43.0 43.5 44.0 44.5 45.0 45.5 46.0
ZrO2
ZrO2
XRD in
tens
ity (a
.u.)
2-Theta ()
400°C 500°C 600°C 700°C
Ni-Fe alloy
Fe3O
4
Ni+Fe
Fig. S3. 2D in-situ XRD pattern recorded during H2-TPR for the Fe/Zr@Zr-Ni@Zr bifunctional catalyst as well as
the diffraction peaks between 42.5° and 46.0° at the selected temperatures (400 °C, 500 °C, 600 °C and 700 °C).
The background was processed by a linear subtraction.
5
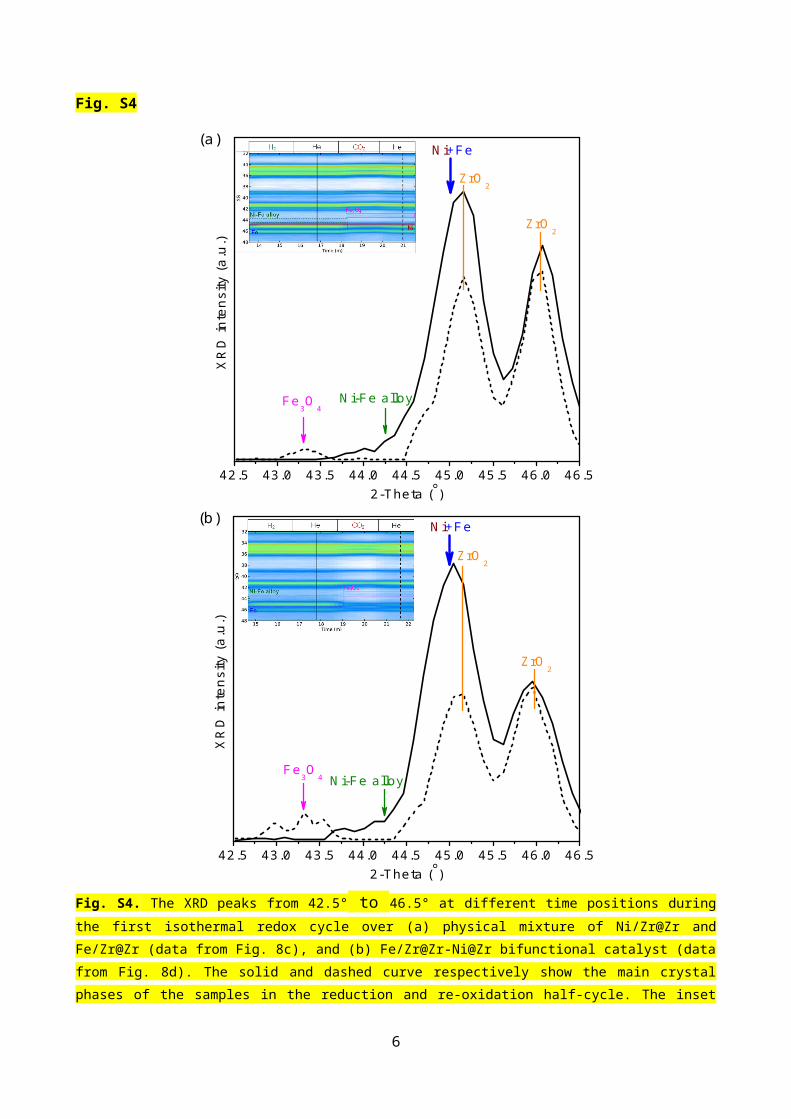
Fig. S4
42.5 43.0 43.5 44.0 44.5 45.0 45.5 46.0 46.5
XR
D in
tens
ity (a
.u.)
2-Theta ()
Fe3O
4Ni-Fe alloy
Ni+Fe(a)
ZrO2
ZrO2
42.5 43.0 43.5 44.0 44.5 45.0 45.5 46.0 46.5
Ni+Fe
ZrO2
ZrO2
(b)
XR
D in
tens
ity (a
.u.)
2-Theta ()
Fe3O
4 Ni-Fe alloy
Fig. S4. The XRD peaks from 42.5° to 46.5° at different time positions during the first isothermal redox cycle
over (a) physical mixture of Ni/Zr@Zr and Fe/Zr@Zr (data from Fig. 8c), and (b) Fe/Zr@Zr-Ni@Zr bifunctional
catalyst (data from Fig. 8d). The solid and dashed curve respectively show the main crystal phases of the samples
in the reduction and re-oxidation half-cycle. The inset figures show the selected time position, indicated by solid
or dashed line, which is located in the corresponding He purging period after each half-cycle to ensure a same
background intensity. The background was processed by a linear subtraction.
6
Fig. S5
0100200300400500600700800900
XPS
inte
nsity
(a.u
.)
binding energy (eV)
O1s
Ni2p
Fe2p+ Ni Auger
C1s
Zr3p
Zr3d
Si2s Si2p
OKLL
Zr3s
Fig. S5. XPS wide scans for the as-prepared (blue line), reduced (green line) and spent (red line) samples of
Fe/Zr@Zr-Ni@Zr bifunctional catalyst. The spent sample was collected after 25 CCAR cycles.
7
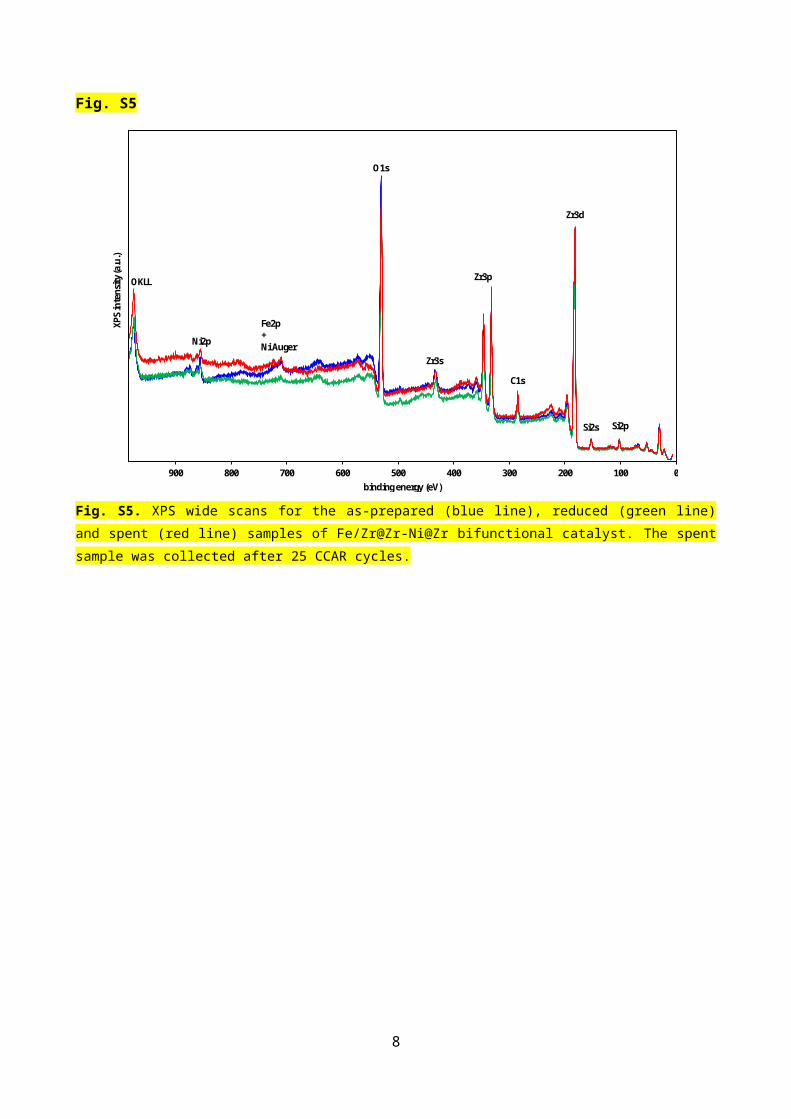
Fig. S6
200 300 400 500 600 700 800 9000
1
2
3
4
5
6
7
8
9
Conversion (%
)
FeO / Ni
Fe / Ni
(CO
+H2)
(CO
2+H2O
) (m
ol/m
ol)
Temperature (C)
Fe3O
4 / Ni
-20
0
20
40
60
80
100
Fig. S6. The ratio between reducing (CO+H2) and oxidizing gases (CO2+H2O) as a function of temperature during
catalytic auto-thermal dry reforming of methane. Solid lines: Equilibrium lines of the iron/iron oxide system at
different temperatures and reduction capacities in the presence of (CO+H 2)/(CO2+H2O). Dashed lines:
Equilibrium value of the (CO+H2)/(CO2+H2O) ratio (blue curve), CH4 (red curve) and CO2 (green curve)
conversion at different reaction temperatures during reforming of a feed mixture with molar ratio CH4:CO2:O2 =
1:1:0.2. The thermodynamic calculations were executed by minimization of the Gibbs free energy of the system
at given conditions, such as pressure, temperature and initial reactants composition, performed with the
EkviCalc software [72].
8
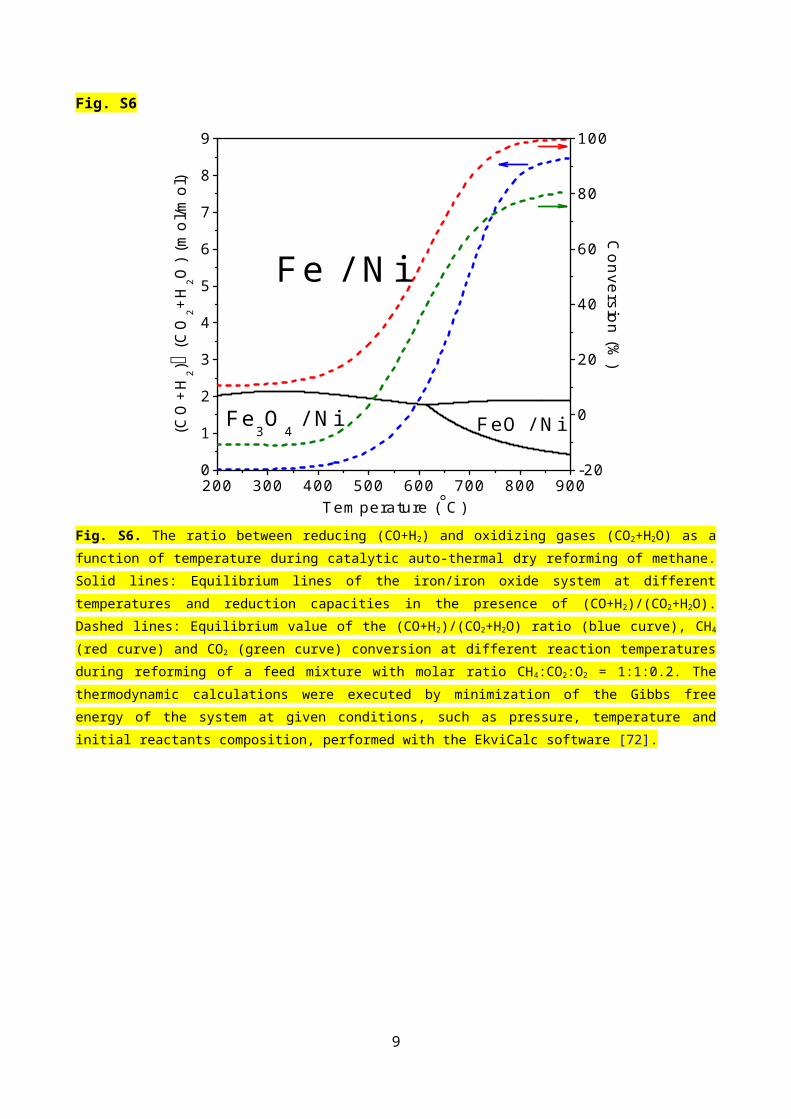
Fig. S7
0 40 80 1200.0
0.5
1.0
1.5
2.0
CO
2 STY
(mol
s-1
kg-1Fe2O
3 )C
O S
TY (m
olC
O
s-1
kg-1 Fe
2O3)
TOS (s)
0
5
10
15
20
25
30
STY
(mol
s-1
kg-1 N
i)
Reduction half-cycle
Re-oxidation half-cycle
COH2
CO2
CH4 H2O O2
0
5
10
15
20
Fig. S7. Reactivity of the Fe/Zr@Zr-Ni@Zr bifunctional catalyst during the CCAR process at 750 °C. Reduction half-cycle (upper figure): space-time yields of CH4, CO2, O2, CO, H2 and H2O as products vs. time on stream during catalytic auto-thermal dry reforming of CH4 and the reduction of the Fe/Zr@Zr OSM core (reactant: mixture of CH4:CO2:O2 = 1:1:0.2, 150 mL min⋅ -1); Re-oxidation half-cycle (lower figure): space-time yield of CO and CO2
during re-oxidation of Fe to Fe3O4 (reactant: 90% CO2/Ar, 150 mL min⋅ -1).
9
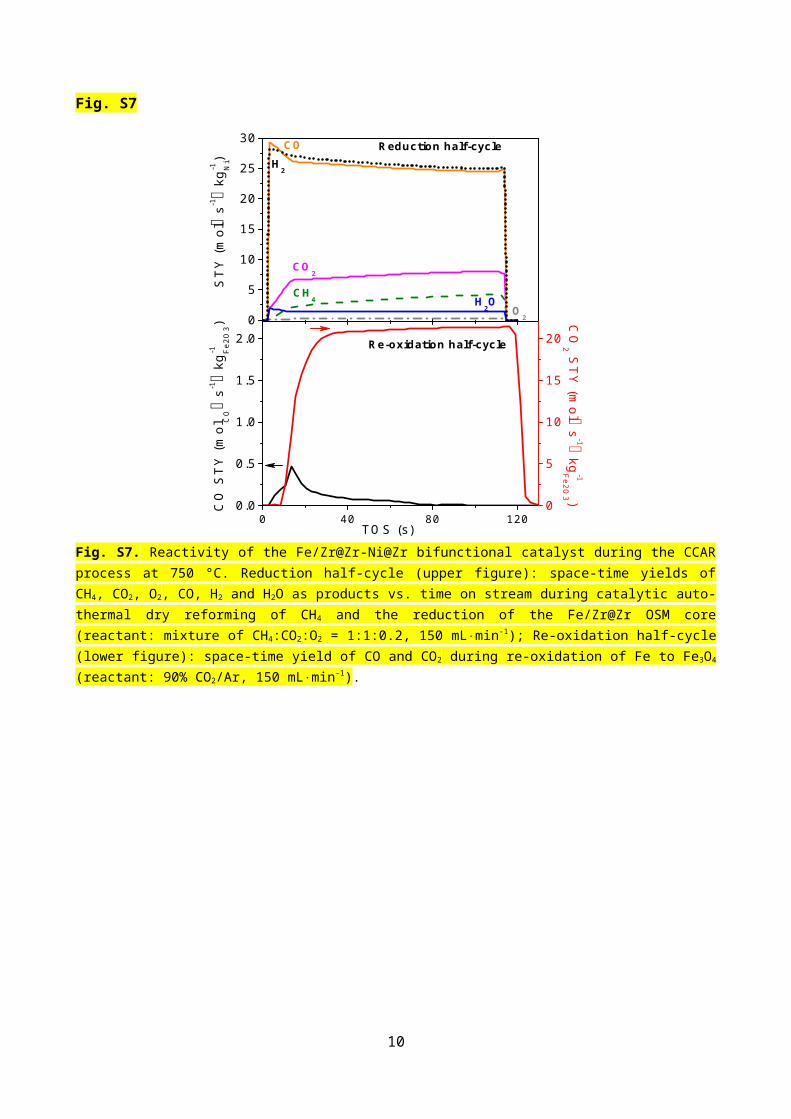
Fig. S8
100 200 300 400 500 600 700 800 9000
20
40
60
80
100
CO
2 STY
(mols
-1k
g-1 Ni)
Temperature ( C)
NiFe_D1 NiFe_S2 BCFe_D3
Fig. S8. CO2 space-time yield (STY) during O2-TPO over the spent catalysts after 25 cycles of CCAR from different
reactor bed configurations. The samples were heated from room temperature to 900 °C with a ramp rate of 10
°C∙min-1. Gas flow: 60 mL∙min-1 of 10% O2/He.
10
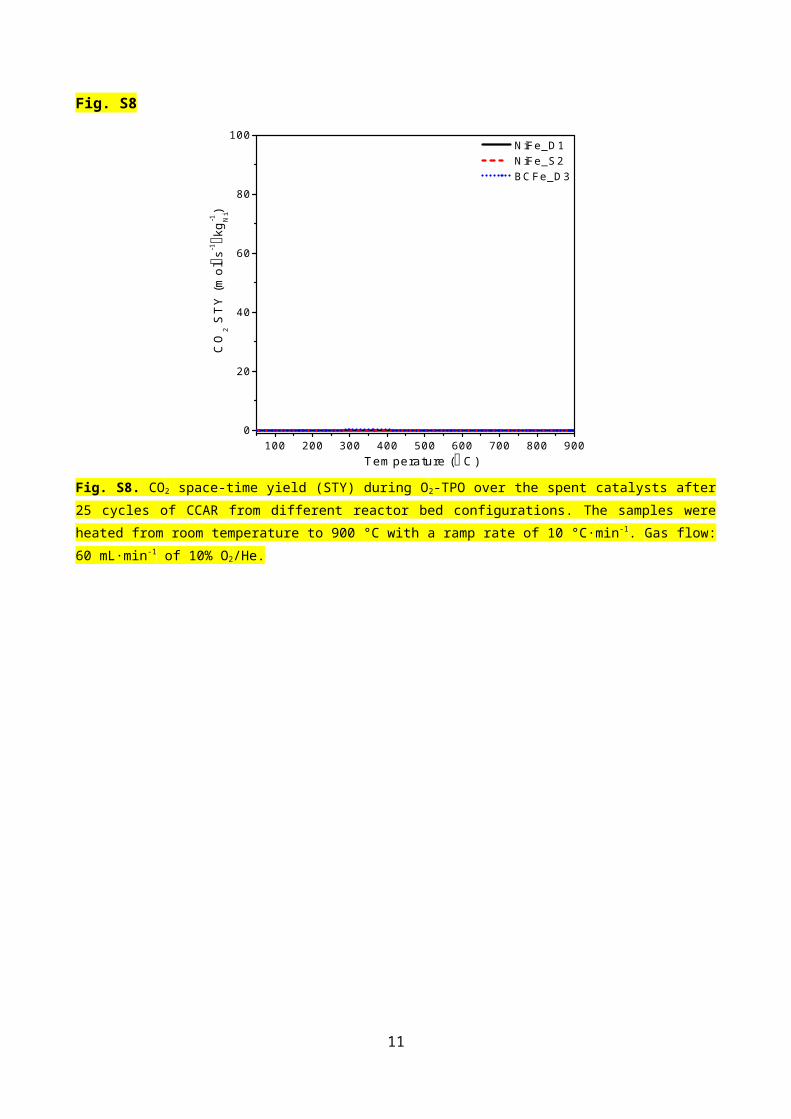
Fig. S9
20 25 30 35 40 45 50 55 60
Fe
Ni
Inte
nsity
(a.u
.)
2-Theta()
(a)
20 25 30 35 40 45 50 55 60
Ni+Fe
Inte
nsity
(a.u
.)
2-Theta()
(b)
20 25 30 35 40 45 50 55 60
Fe
BC
Inte
nsity
(a.u
.)
2-Theta()
(c)
Fig. S9. XRD patterns of the spent samples of Ni/Zr@Zr catalyst (labeled as Ni), Fe/Zr@Zr OSM (Fe) and Fe/Zr@Zr-Ni@Zr bifunctional catalyst (BC) after 25 cycles of CCAR in different reactor beds: NiFe_D1 (a), NiFe_S2 (b) and BCFe_D3 (c). The symbols represent: (∆) -Alα 2O3, (●) m-ZrO2, ( ) t-ZrO◊ 2, ( ) Fe∨ 3O4 and ( ) Ni.∗ The residual -Alα 2O3 originates from the inert diluent in the reactor bed which cannot be removed completely from the spent samples.
11
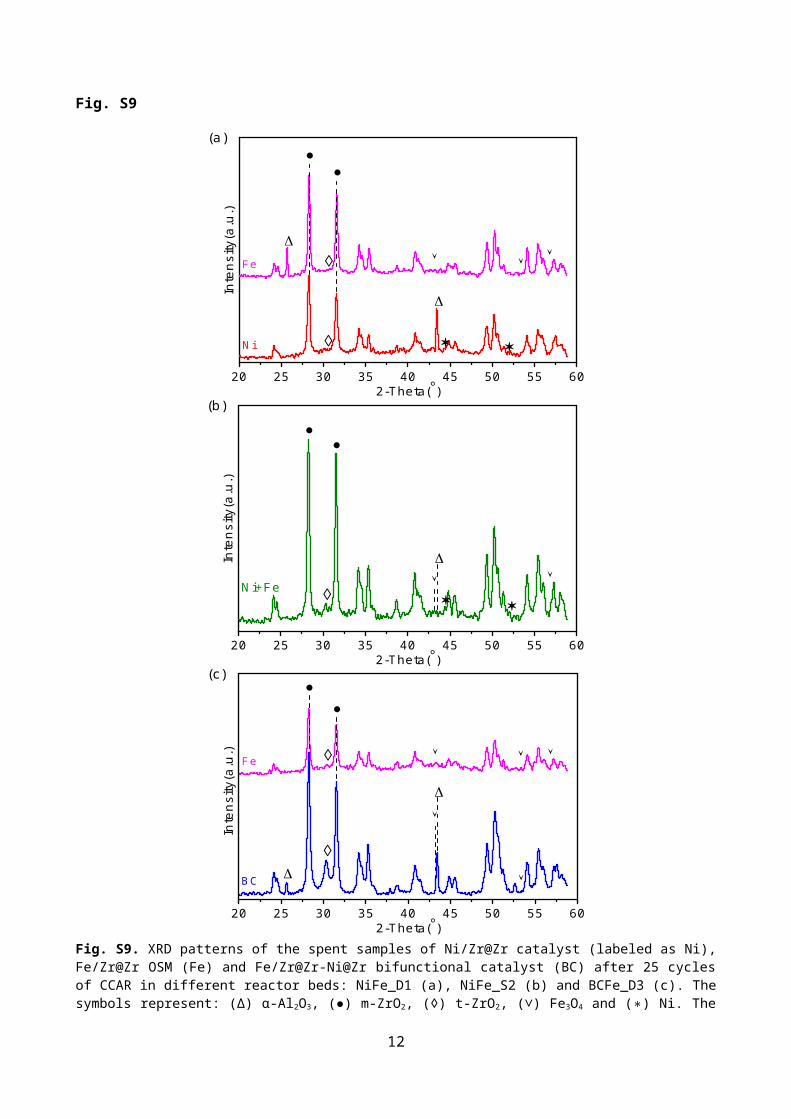
Fig. S10
0
5
10
15
20
25
30
35
After CCAR
BE
T-S
SA
(m2
g-1)
Fresh Fresh After CCARFig. S10. BET specific surface area of fresh and spent samples after 25 CCAR cycles of a physical mixture of
Ni/Zr@Zr and Fe/Zr@Zr (black column), as well as for the Fe/Zr@Zr-Ni@Zr bifunctional catalyst (red column).
The error bars represent the standard deviation based on three repeat tests.
12