Embed Size (px)
Citation preview
Asian Immigrants and Financial Literacy
October 3, 2011University of Maryland
Jinhee Kim
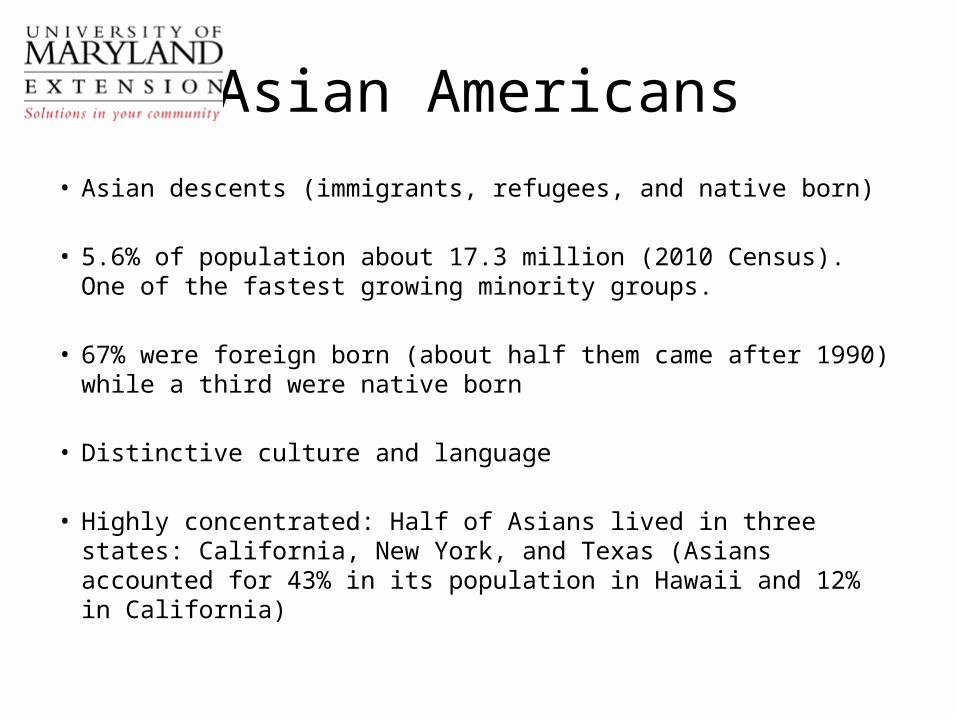
Asian Americans• Asian descents (immigrants, refugees, and native born)
• 5.6% of population about 17.3 million (2010 Census). One of the fastest growing minority groups.
• 67% were foreign born (about half them came after 1990) while a third were native born
• Distinctive culture and language
• Highly concentrated: Half of Asians lived in three states: California, New York, and Texas (Asians accounted for 43% in its population in Hawaii and 12% in California)
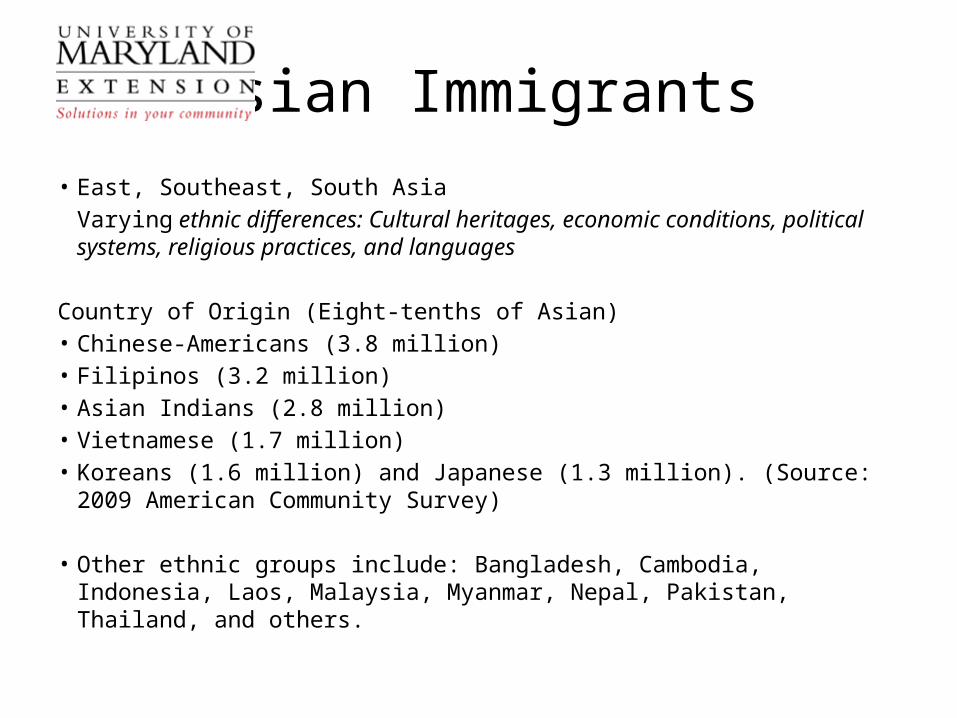
Asian Immigrants• East, Southeast, South Asia Varying ethnic differences: Cultural heritages, economic conditions, political
systems, religious practices, and languages
Country of Origin (Eight-tenths of Asian)• Chinese-Americans (3.8 million)• Filipinos (3.2 million)• Asian Indians (2.8 million)• Vietnamese (1.7 million)• Koreans (1.6 million) and Japanese (1.3 million). (Source: 2009 American
Community Survey)
• Other ethnic groups include: Bangladesh, Cambodia, Indonesia, Laos, Malaysia, Myanmar, Nepal, Pakistan, Thailand, and others.
Asian Immigrants
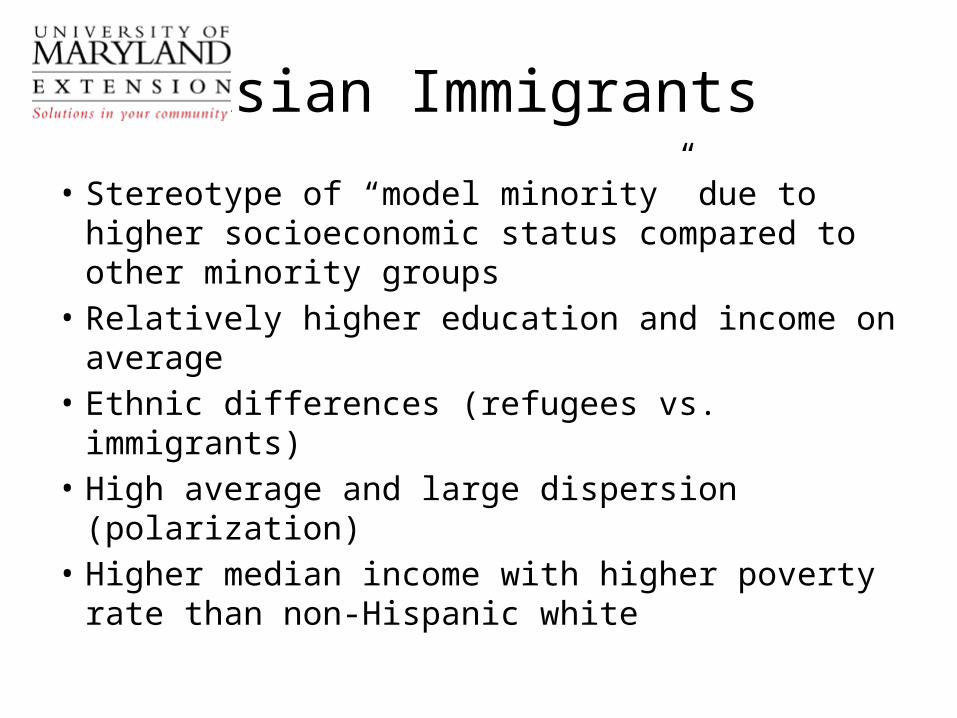
• Stereotype of “model minority” due to higher socioeconomic status compared to other minority groups
• Relatively higher education and income on average
• Ethnic differences (refugees vs. immigrants)• High average and large dispersion (polarization)• Higher median income with higher poverty rate
than non-Hispanic white
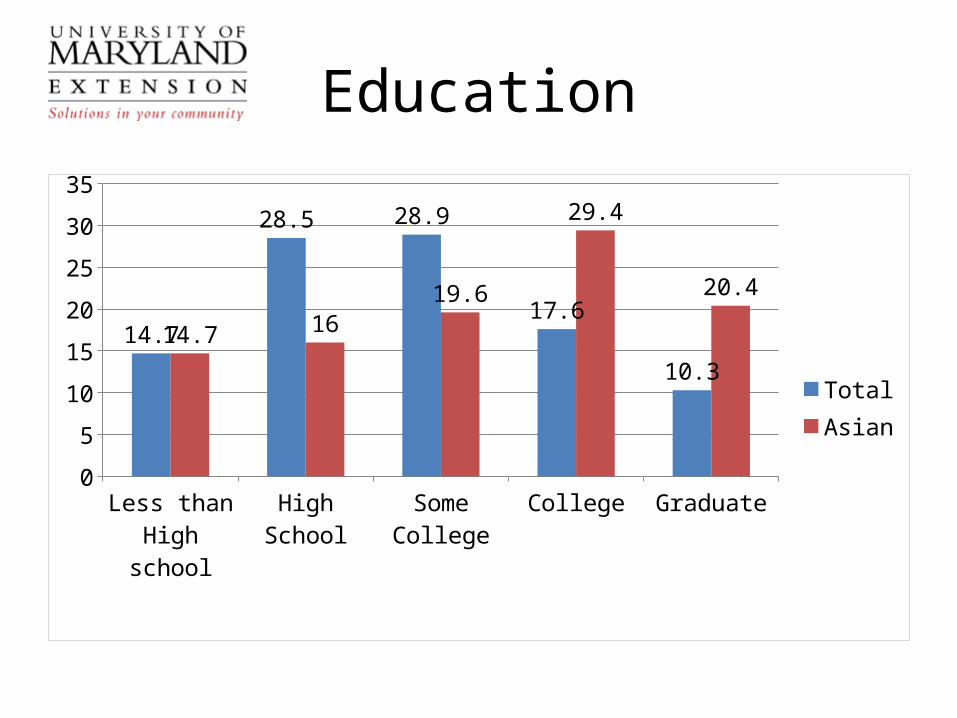
Education
Less
than
High sc
hool
High Sc
hool
Some Colle
ge
College
Graduate
0
5
10
15
20
25
30
35
14.7
28.5 28.9
17.6
10.314.7 16
19.6
29.4
20.4
TotalAsian
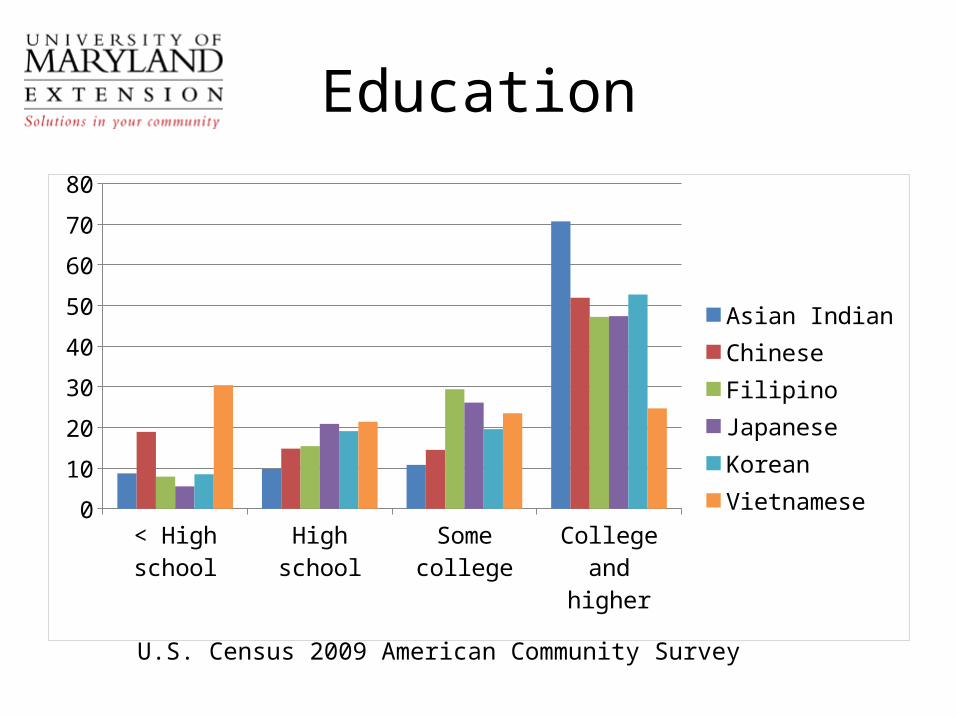
Education
< High school High school Some college College and higher
0
10
20
30
40
50
60
70
80
Asian IndianChinese FilipinoJapaneseKoreanVietnamese
U.S. Census 2009 American Community Survey
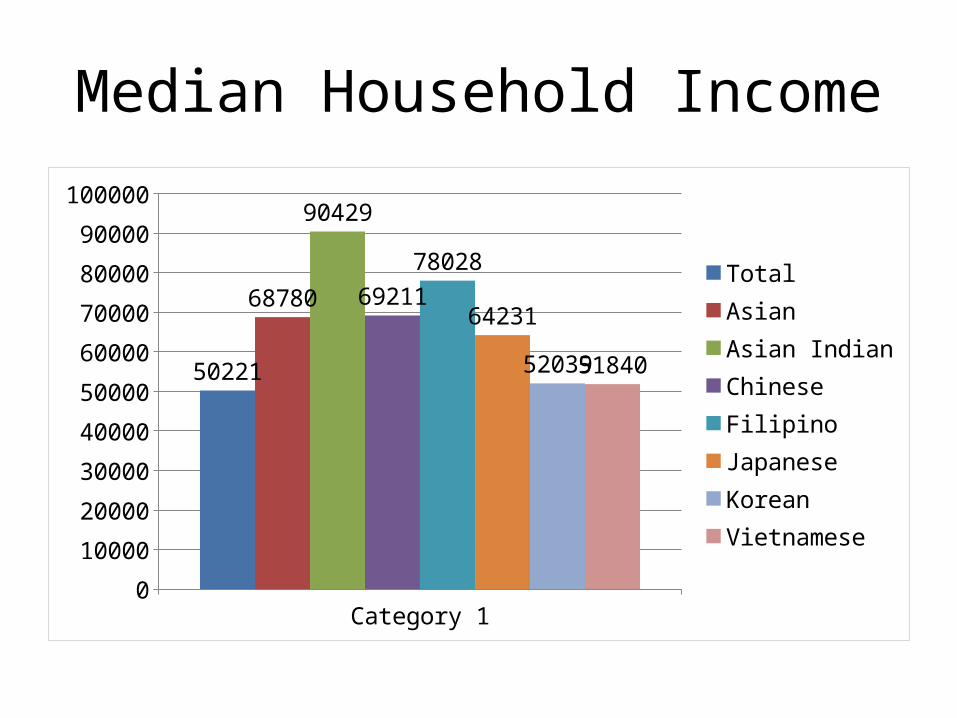
Median Household Income
Category 10
10000
20000
30000
40000
50000
60000
70000
80000
90000
100000
50221
68780
90429
6921178028
64231
5203951840
TotalAsianAsian IndianChinese FilipinoJapaneseKoreanVietnamese
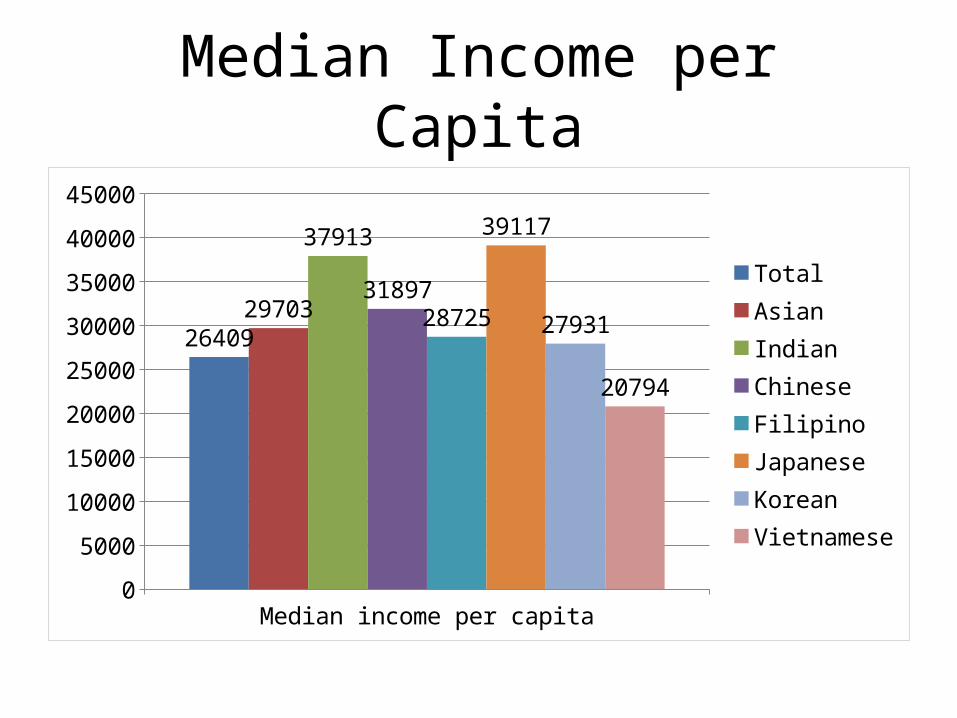
Median Income per Capita
Median income per capita0
5000
10000
15000
20000
25000
30000
35000
40000
45000
2640929703
37913
3189728725
39117
27931
20794
TotalAsianIndianChineseFilipinoJapaneseKoreanVietnamese
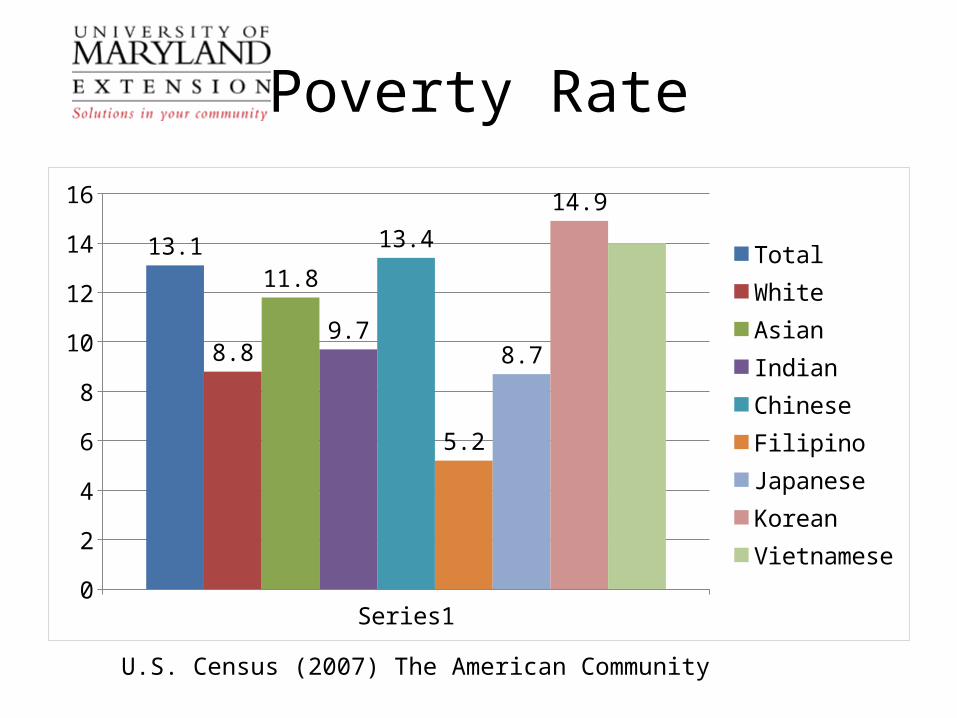
Poverty Rate
Series10
2
4
6
8
10
12
14
16
13.1
8.8
11.8
9.7
13.4
5.2
8.7
14.9
TotalWhiteAsianIndianChineseFilipinoJapaneseKoreanVietnamese
U.S. Census (2007) The American Community
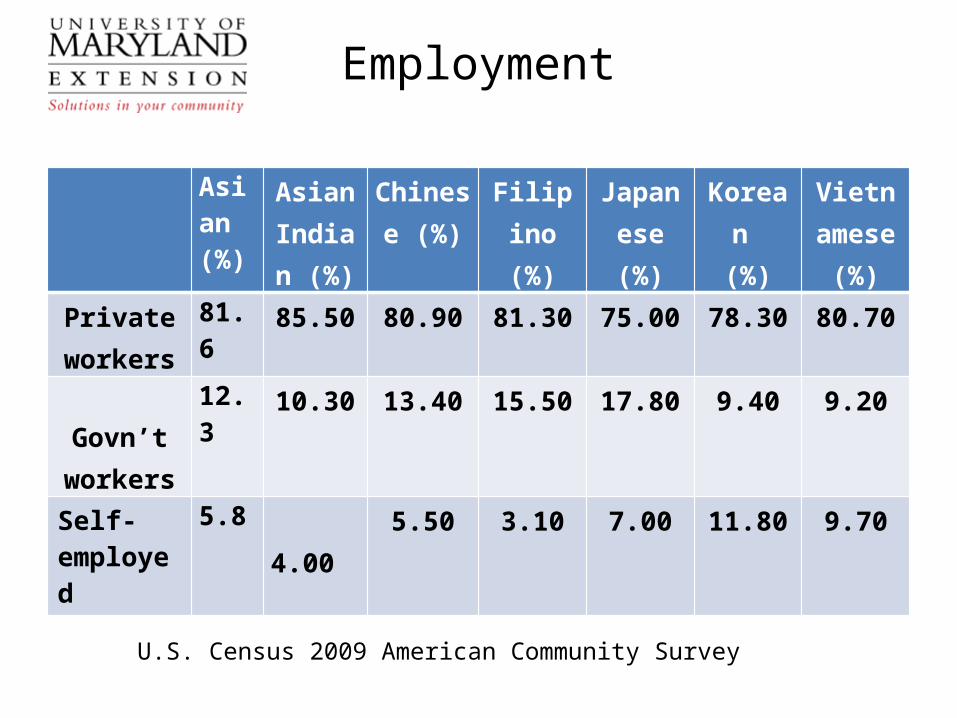
Employment
Asian(%)
AsianIndian
(%)
Chinese (%)
Filipino (%)
Japanese (%)
Korean (%)
Vietnamese (%)
Private workers
81.6 85.50 80.90 81.30 75.00 78.30 80.70
Govn’t workers
12.3 10.30 13.40 15.50 17.80 9.40 9.20
Self-employed
5.8 4.00 5.50 3.10 7.00 11.80 9.70
U.S. Census 2009 American Community Survey
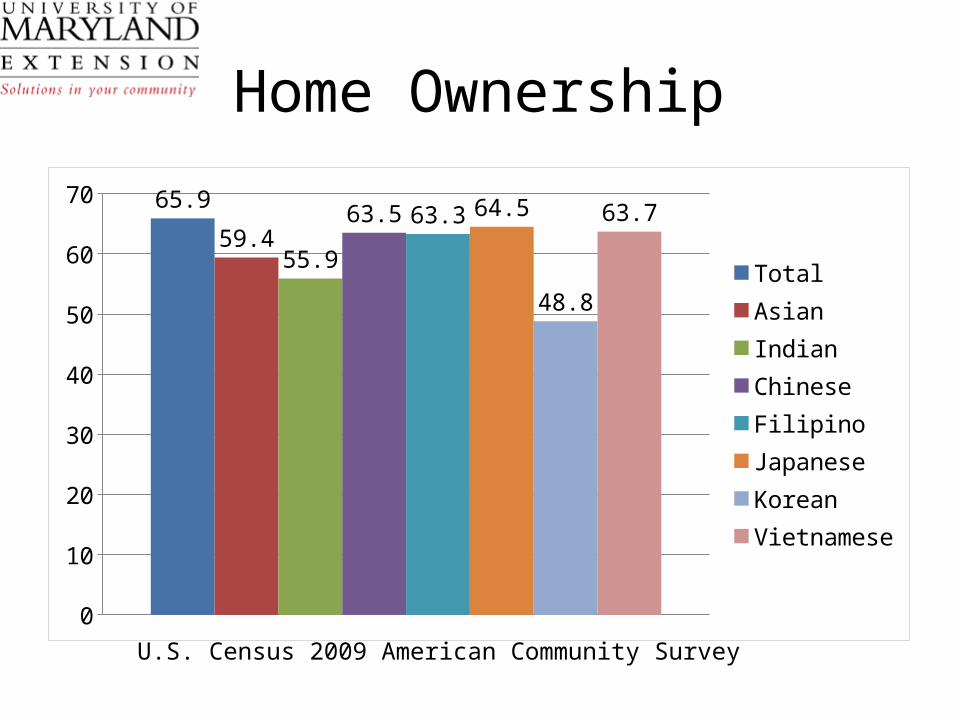
Home Ownership
0
10
20
30
40
50
60
70 65.9
59.455.9
63.5 63.3 64.5
48.8
63.7
TotalAsianIndianChineseFilipinoJapaneseKoreanVietnamese
U.S. Census 2009 American Community Survey
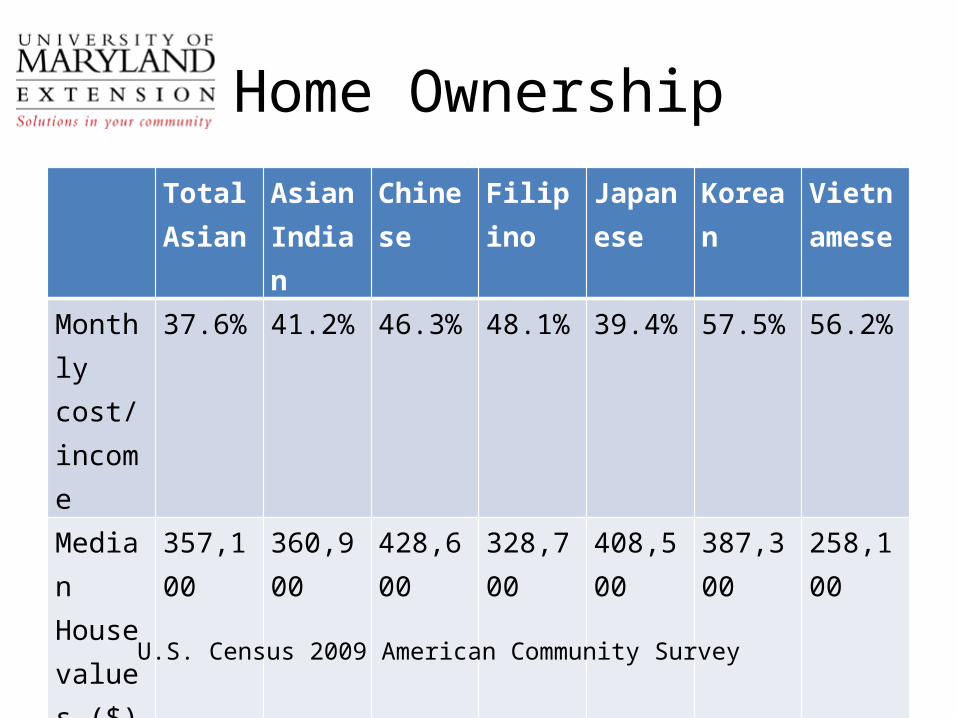
Home OwnershipTotal Asian
Asian Indian
Chinese Filipino Japanese
Korean Vietnamese
Monthly cost/income
37.6% 41.2% 46.3% 48.1% 39.4% 57.5% 56.2%
Median House values ($)
357,100 360,900 428,600 328,700 408,500 387,300 258,100
U.S. Census 2009 American Community Survey
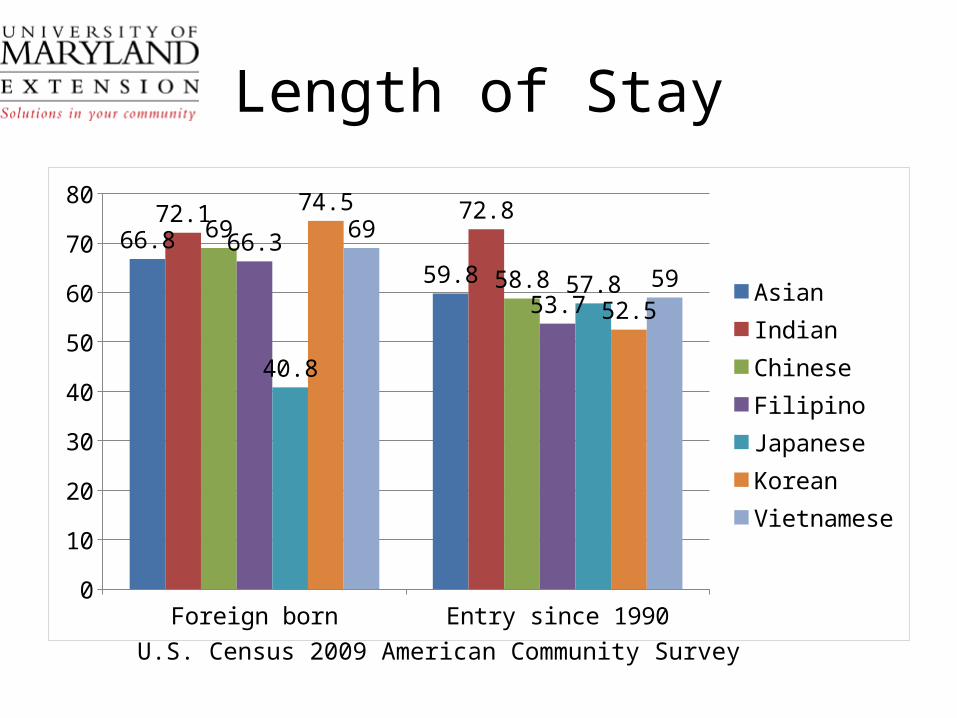
Length of Stay
Foreign born Entry since 19900
10
20
30
40
50
60
70
80
66.859.8
72.1 72.869
58.8
66.3
53.7
40.8
57.8
74.5
52.5
69
59
AsianIndianChineseFilipinoJapaneseKoreanVietnamese
U.S. Census 2009 American Community Survey
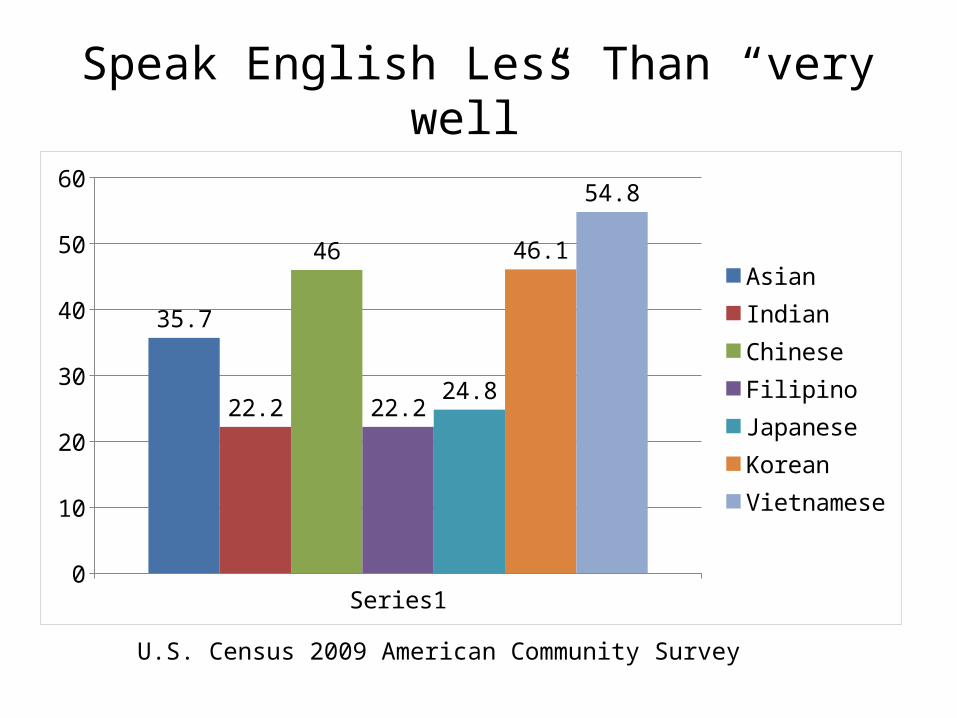
Speak English Less Than “very well”
Series10
10
20
30
40
50
60
35.7
22.2
46
22.224.8
46.1
54.8
AsianIndianChineseFilipinoJapaneseKoreanVietnamese
U.S. Census 2009 American Community Survey
Bank Account Ownership
• Rhine and Greene (2006) used Survey of Income and Program Participation
• Bank account ownership of U.S. immigrants• Income, net worth, education, family size,
length of stay for Asian’s bank account ownership
• Overall, Asians seem to integrate into the financial market in terms of bank account ownership
Credit
• Avery, Brevoort, and Canner (2009) Federal Reserve Board
• Recent immigrants had somewhat lower credit scores than would be implied by their performance.
• The loan performance of Asians better than the performance predicted by their credit scores. Asians paid interest rates that, on average, were typically lower than, or about the same as, those paid by non-Hispanic whites across all loan.
Asset Ownership
• Kim, Chatterjee, & Cho (2011) studied home, business, financial asset ownerships with New Immigrant Survey
• Differences in asset ownership by ethnic groups
• Significantly different by– Socioeconomic variables: Income and education– Acculturation: Length of stay and English fluency– Country of origin: Asian Indian, Korean, Chinese, Vietnamese,
and Philippines– Demographics: Age, marital status, family size
Financial Literacy Education Resources for Asians
• FDIC Money Smart:
• The Money Smart for Adults instructor-led curriculum consists of eleven training modules that cover basic financial topics.
• The instructor-led version is available in Chinese, Hmong, Korean, and Vietnamese
CreditSmart Asian
• CreditSmart Asian is a three-part series of multilingual guidebooks focused on helping Asian Americans become more informed consumers. Available in Chinese, Korean, Vietnamese and English, the guidebooks provide valuable and culturally relevant information on establishing and maintaining good credit, the steps to homeownership, and the benefits and responsibilities of owning a home.
• CreditSmart Freddie Mac • http://www.freddiemac.com/creditsmart/creditsmar
t_asian.html
Visa Asia Pacific MyMoneySkills
• www.MyMoneySkills.com
• Introduced in 2002, this online program offers six modular topics that cover the most relevant information needed to meet the daily financial needs of people of all ages. This online resource is available in English, Korean, Thai, Japanese, Bahasa Indonesia, Malay, Hindi, and Chinese.
Planning for Prosperity: A Financial Guide for New Asian Americans
• The National Coalition of Asian Pacific American Community Development (National CAPACD) and NEFE
• http://nationalcapacd.org/old/NEFE/index.html• To help Asian immigrants learn how to benefit from
the financial institutions and services in the United States.
• Its featured information is available in Cambodian, Chinese, English, Filipino, Hindi, Hmong, Korean, Samoan, Thai, Urdu and Vietnamese.
Summary• Asians are not the same. Many different ethnic groups.• “Model community?” Higher socioeconomic status on average with
high dispersion. • Over two thirds are foreign born while half came since 1990. • New immigrants face challenges in integration into U.S. financial
market.• Very limited data and research on financial literacy and financial
management of Asian immigrants.• Some financial literacy education programs translated into Asian
languages are available while a few local communities provide financial counseling and education programs for Asians.
• Overall, limited resources for financial literacy education. High average may mask the needs for financial education of many Asians.
References• Chatterjee, S. & Kim, J. (2011). Asset ownership of recent immigrants: An
examination of nativity and socioeconomic factors. Migration Letters, 8(2), 141-152.• Rhine, S. L. W. & Greene, W. H. (2006). The determinants of being unbanked for U.S.
immigrants. Journal of Consumer Affairs, 40(1), 21-40.• U.S. Census Bureau (2007). The American Community-Asians: 2004. American
Community Survey Reports. • U.S. Department of Commerce, Economics and Statistics Administration, U.S.
Census Bureau (2010). 2009 American Community Survey 1-year estimates [Data summary file]. Retrieved from http://www2.census.gov/acs2009_1yr/prod/SelectPopulationProfile/United_States
• U.S. Department of Commerce, Economics and Statistics Administration, U.S. Census Bureau (2011). 2007 Survey of Business Owners. Retrieved from http://factfinder.census.gov/servlet/IBQTable?_bm=y&-filter=SEX;in;001|RACE_GROUP;in;60,61,62,63,64,65,66,67&-geo_id=D&-ds_name=SB0700CSA01&-_lang=en&-fds_name=EC0700A1