Embed Size (px)
Citation preview
Illuminating the ultrafast excited state
dynamics of protein-bound
carotenoids in plants
by
Asmita Singh
Submitted in partial fulfilment of the requirements
for the degree
Magister Scientiae (Physics)
in the
Faculty of Natural and Agricultural Sciences
Department of Physics
at the
University of Pretoria
August 2017
Supervisor: Dr. Tjaart PJ Krüger

i
Abstract
Illuminating the ultrafast excited state dynamics of
protein-bound carotenoids in plants
by
Asmita Singh
Department of Physics,
University of Pretoria,
Pretoria, 0002, South Africa
Supervisor: Dr. Tjaart PJ Krüger
Degree: Magister Scientiae
Keywords: Photosynthetic Light-Harvesting, LHCII trimers, Carotenoids, Transient
Absorption Spectroscopy, Pump-Probe Spectroscopy
Global energy demands have escalated over the past few decades, creating a necessity for
alternative energy sources. Solar technologies inspired by the primary solar energy storing
process known on earth, photosynthesis, have subsequently gained popularity. The natural
photosynthetic apparatus comprises a network of membrane-bound pigment-protein
complexes, with the main plant light-harvesting complex (LHCII) consisting of chlorophyll
(Chl) and carotenoid (Car) pigments. Electronic excitation energy transfer (ET) of the
harvested energy takes place amongst these pigments on ultrafast timescales. This energy
is funnelled towards a photosynthetic reaction centre where charge separation is achieved,
creating a Biobattery, which powers the subsequent manufacture of energy-rich chemical
compounds for photosynthetic activity. Transient absorption pump-probe spectroscopy has
proven to be a useful technique for monitoring the evolution of the excited state dynamics,
such as electronic transitions and excitation ET amongst Car and Chl pigments of LHCII
trimers isolated from spinach leaves. This method was utilized to probe samples excited
under four different conditions: at pump excitation wavelengths (𝜆𝑒𝑥) of 489 nm (preferentially
exciting Cars Lutein1 and Neoxanthin) and 506 nm (targeting Cars Lutein2 and
ii
Violaxanthin), each with an intensity of either 800 nJ/pulse (relatively high) or 500 nJ/pulse
(comparatively low). A global analysis was applied to each dataset using the robust, open-
source Glotaran software, from which three kinetic decay lifetimes for the various processes
were extracted. General spectral observations encompassed a negative pump ground state
bleach (GSB) at each 𝜆𝑒𝑥; negative Chl b and Chl a GSBs, superimposed with negative
stimulated emission (SE) signals; and a positive excited state absorption (ESA) band. The
first lifetime of a few picoseconds corresponded mainly to Car-S2 depopulation, resulting
either from energy relaxation towards Car-S1, or ET to Chls. Small, but distinct Chl b signals
of less than 3 mOD were also detected on this timescale. The second lifetime, which is
between 10 and 12 ps, was characteristic to the Lutein Car-S1 lifetime, mainly depicting Car-
S1 ET to Chl a. The third lifetime, which extended from ~200 ps to the nanosecond timescale,
was attributed to Chl a fluorescence. The 𝜆𝑒𝑥 of 489 nm directly excites the Chl Soret region,
whilst excitation at 506 nm shows a pump intensity-dependence. Laser pulse photon density
values were ~1014 photons·cm-2·pulse-1 for these datasets. Singlet-singlet annihilation
calculations performed on the samples excited at 506 nm provided low annihilation
probabilities of 9.0% and 11.5% for a low and high pump intensity, respectively, limiting the
possibility of sample photobleaching. Optimization and redevelopment of the experimental
setup significantly improved both the data quality and various recorded parameters,
concluding that pump-probe spectroscopy was successful on the prepared LHCII trimers.
Results acquired and calculations performed correlated with literature, where minimal
changes were noticed in the timescales and ET pathways. The robustness of plant systems
was confirmed through both excitation-wavelength and intensity dependence. This work
paves the way for advanced studies on the role Cars play in non-photochemical quenching
(NPQ), a self-protection mechanism of plants against over-illumination; and for the tailoring
of artificial light-harvesting antennas based on research conducted on their natural
counterparts.
iii
Uittreksel
‘n Ondersoek na die ultravinnige opgewektetoestanddinamika van
proteïengebonde karotenoïde in plante
deur
Asmita Singh
Departement Fisika,
Universiteit van Pretoria,
Pretoria, 0002, Suid-Afrika
Studieleier: Dr. Tjaart PJ Krüger
Graad: Magister Scientiae
Trefwoorde: Fotosintetiese ligversameling, LHCII-trimere, Karotenoïede,
Tydopgeloste absorpsiespektroskopie, pomp-tasting-
spektroskopie
Globale energievereistes het oor die afgelope paar dekades toegeneem, wat die
ontwikkeling van alternatiewe energiebronne noodsaaklik maak. Sontegnologieë,
geïnspireer deur die primêre sonenergiebergingsproses op aarde, fotosintese, het daarom
gewild geword. Die natuurlike fotosintetiese apparaat bestaan uit 'n netwerk van
membraangebonde pigment-proteïenkomplekse, met die hoof ligversamelingskompleks in
plante (LHCII) wat bestaan uit chlorofil- (Chl) en karotenoïed- (Car) pigmente. Die energie
wat deur die pigmente geabsorbeer word, word tussen elektroniese opgewekte toestande op
verskillende pigmente op ultravinnige tydskale oorgedra. Hierdie energie word na ʼn
fotosintetiese reaksiesentrum gekanaliseer, waar 'n ladingskeiding geïnduseer word en 'n
Biobattery sodoende geskep word. Die energie wat in dié battery gestoor is, word gebruik
om energieryke chemiese verbindings te vervaardig — wat as brandstof vir die plant dien om
sy lewensfunksies te verrig. Tydopgeloste-absorpsie-pomp-tasting-spektroskopie is 'n
nuttige tegniek om die dinamika tussen opgewekte toestande te volg. ‘n Voorbeeld van sulke
dinamika is die elektroniese opwekking en energie-oordrag tussen die Car- en Chl-pigmente
van geïsoleerde LHCII-trimere in spinasieblare. Hierdie metode is gebruik om monsters
iv
onder vier verskillende toestande te ondersoek by pompgolflengtes (𝜆𝑒𝑥) van 489 nm (waar
hoofsaaklik die Cars Luteïne1 en Neoksantine opgewek word) en 506 nm (vir Cars Luteïne2
en Violaksantine), en pompenergieë van ‘n relatief hoë 800 nJ/puls, of 500 nJ/puls vir elke
golflengte. ‘n Globale analise van die eksperimentele data is met behulp van die robuuste,
oop-bron-Glotaran-sagteware gemaak. Uit hierdie analise is drie kinetiese vervalleeftye vir
die verskillende prosesse verkry. Algemene spektrale waarnemings sluit 'n negatiewe pomp-
grondtoestandverbleiking (GSB) by elke 𝜆𝑒𝑥, ‘n negatiewe Chl b en Chl a GSBs,
gesuperponeer met negatiewe gestimuleerde-emissie-(SE)seine, en 'n positiewe
opgewektetoestandabsorpsie-(ESA)band in. Die eerste leeftyd van ‘n paar pikosekondes
stem ooreen met die Car-S2 se ontvolking, wat plaasvind indien energie verminder om Car-
S1 te vorm, of as energie oorgedra word na Chl-pigmente. Klein, maar duidelike Chl b-seine
van kleiner as 3 mOD word op hierdie tydskaal waargeneem. Die tweede leeftyd van tussen
10 en 12 ps is kenmerkend van die Luteïne Car-S1-leeftyd en kan hoofsaaklik toegeskryf
word aan die Car-S1 se energie-oordrag na Chl a. Die derde leeftyd, wat wissel van ~200 ps
tot ‘n paar nanosekondes word toegeskryf aan fluoressensie van Chl a. Die 𝜆𝑒𝑥 van 489 nm
wek die Chl-Soret-gebied direk op, en die opwekking by 506 nm toon 'n
pompintensiteitafhanklikheid. Die fotondigtheid was ~1014 fotone·cm-2·puls-1 vir al die
opwekkingspulse. Singlet-singlet-uitwissingswaarskynlikhede vir opwekking by 506 nm is as
9.0% en 11.5% vir 'n lae en hoë pompintensiteit, onderskeidelik, bereken. Optimalisering en
die herontwikkeling van die eksperimentele opstelling het die datakwaliteit, sowel as
belangrike parameters, se waardes verbeter. Pomp-tasting-spektroskopie kan dus gebruik
word om LHCII-trimere te bestudeer. Hierdie werk baan die weg vir gevorderde studies oor
die rol wat Cars speel in die nie-fotochemiese dowingsproses (NPQ), ‘n
beskermingsmeganisme van plante teen oorbeligting; en vir die moontlikheid om kunsmatige
ligversamelingsantennas te ontwerp met ontwerpbeginsels gebaseer op hul natuurlike
eweknieë.

v
Declaration of originality
I, Asmita Singh, declare that the dissertation, which I hereby submit for the degree Magister Scientiae
in Physics at the University of Pretoria, is my own work and has not previously been submitted by me
for a degree at this or any other tertiary institution.
Signature: ………………………
Asmita Singh
Student number: 29152811
Date: ……………………………
Copyright © 2017 University of Pretoria
All rights reserved.

vi
Dedications
“मेरे जीवन का सहारा, मेरे पालनहारे”

vii
Acknowledgements
I wish to extend my sincerest gratitude to the following individuals, institutions and groups for their
contribution to this research script (dissertation), regardless of how big or small:
Firstly, to my Supervisor, Dr. Tjaart PJ Krüger, for sparking my interest in the field and bringing
Biophysics to UP; for his continuous support, encouragement, advice, patience and tireless
explanations. Thank you for giving me the opportunity to travel, to participate in conferences,
schools, and workshops. Thanks for being determined and positive, even when times were
gloomy, and there was almost no hope.
Prof Johan B Malherbe for his guidance, advice, encouragement, and financial support during
the first year
My fellow Biophysicists with whom I boarded this new research ship with:
Mr. Alexander Paradzah, for all the time in the lab, encouraging me and assisting me with
the data analysis, as well as for the moral support
Mr. Huzifa Elnour, for all the lab assistance, theoretical explanations, and moral support
Mr. Joshua Botha, for making the initial stages of the project a bit easier and all your
assistance throughout, especially the data which you graciously shared
Mr. Herman Stoltz and Mr. Towan Nöthling, my colleagues from undergraduate, who
understood me, assisted and cheered me throughout until the completion of this project
Thank you to all the new students in addition to the initial Biophysics group of 2014
Dr. Saturnin Ombinda-Lemboumba, for imparting his knowledge of the NLC pump-probe setup to
me, and for showing me all the weird and wonderful tricks; as well as for being there to rectify my
mistakes and teach me how to work with the setup and equipment at the beginning
Dr. Hermann Uys, for always being the friendly face in the lab, running to my rescue whenever I
had a problem with the laser, and for always helping me out and explaining basic principles
Dr. Attie Hendriks, thank you for assisting in finally getting the system up-and-running, so that I
could finally start with experiments. Thanks for all the fun and not-so-fun hours in the lab, and for
being the technical magician!
All the staff and student researchers at the NLC-CSIR, thanks for being accommodating,
encouraging and supportive; it was an honour to be amongst such a reputed national center
The NLC and rental pool program, for allowing us to make use of the equipment and facilities,
especially Mr. Johan Steyn and Mr. Thomas Du Plooy for their assistance with the laser system
The head of the Physics Department at the University of Pretoria, Prof Chris Theron, thank you
for the continuous motivation, support, and for opportunities and privileges within the department
To the friendly staff and students from the Department of Chemistry (especially Dr. Shankara
Radha-Krishnan) and the Department of Plant Sciences for allowing me to use the facilities to
prepare my samples, and assisting me where possible
To all my colleagues and friends at the University of Pretoria, I am grateful for your ever-lasting
support, encouragement, mentorship, advice and assistance throughout the years! Thanks for

viii
making a place I can call my second home. A special vote of gratitude to my undergraduate
mentor, Mr. Louwrens van Schalkwyk for his unwavering guidance and mentorship into research.
To the University of Stellenbosch, particularly the Laser Research Institute (LRI), Prof. Heinrich
Schwöerer and his team, for accommodating me during a pleasant research visit in 2014, and for
the opportunity of getting acquainted with your research facilities to refine my understanding. To
the organizers, speakers and staff from the ALC femtosecond workshop for three excellent
workshops (2014, 2015 and 2016) that transformed my view and understanding of lasers, optics
and photonics.
The Siegman School on lasers, sponsored in collaboration with the Optical Society of America
(OSA), for awarding me an opportunity to attend this prestigious school at ICFO, in Barcelona,
Spain in July 2016. Thanks for the life-changing experience of my first-ever international visit, as
well as the interaction with famous and distinguished senior researchers, and students from
around the world in the optics and photonics community!
My parents, Meena and Mothie, without you both, I would never be, nor would I have reached
this summit!
My brother Avinash, and Doggie sister Princess, for finding the little mistakes and being good
listeners
My family and friends, for having faith in my abilities, and the continuous, constructive criticism.
To my best friend for going through this turning point in life with me, motivating me to never give
up, and for always seeing things in a positive light!
This voyage was no easy feat, and I’m sure my colleagues can vouch for that – especially having
to tolerate a rather “moody” femtosecond laser with a peculiar personality, and a pump-probe
system that would work only on some occasions. I am grateful for all that I have gained and lost
during this MSc, especially the various life lessons. It was stimulating to have had many
opportunities to travel and network with other scientists; bringing the exciting world of Biophysics
to light amongst Physicists, and making sure that everyone could easily understand it all at the
same time. However, I trust that from here on, the successors working with the system will have
minimal setbacks, and continue to harvest great science from light and nature!
Last, but not least, to The One Who gave me the strength, patience, sanity, the ability to endure,
and guidance throughout – Dhanyavad Meri Bhagwanji! I Love You Immensely
Financial Assistance
Financial assistance provided by the National Research Foundation (NRF)1 in respect of the costs of
the study, is hereby acknowledged. Opinions or conclusions that have been expressed in this study
are those of the writer and must not be seen to represent the views, opinions, or conclusions of the
NRF.
1 Disclaimer: Any opinions, findings and conclusions or recommendations in this material are those of the author(s) and therefore the NRF do not accept any liability in regard thereto.
ix
List of Abbreviations and Acronyms
PSI Photosystem I
PSII Photosystem II
LHCII Main plant Light-Harvesting Complex of PSII
LH1 Bacterial Light-Harvesting Complex 1
LH2 Bacterial Light-Harvesting Complex 2
RC Reaction Center
NPQ Non-Photochemical Quenching
(B)Chl (Bacterio)Chlorophyll
Chl a Chlorophyll a
Chl b Chlorophyll b
Car(s) Carotenoid(s)
Lut Lutein
Neo Neoxanthin
Vio Violaxanthin
Zea Zeaxanthin
ET Energy Transfer
FRET Förster Resonant Energy Transfer
IC Internal Conversion
ISC Intersystem Crossing
GSB Ground State Bleach
SE Stimulated Emission
ESA Excited State Absorption
OD Optical Density
FWHM Full Width at Half Maximum
Glotaran Global and Target Analysis
EADS Evolution Associated Difference Spectra
SADS Species Associated Difference Spectra
DAS Decay Associated Spectra
CPA Chirped Pulse Amplification
NOPA Non-collinear Optical Parametric Amplifier
BBO Beta-Barium Borate
SHG Second Harmonic Generation
GVD Group Velocity Dispersion
I
Table of Contents Chapter 1 ................................................................................................................................................. 1
1.1. Rationale – Why plants? ......................................................................................................... 1
Chapter 2 ................................................................................................................................................. 2
2.1. Basic principles of Photosynthesis .......................................................................................... 2
2.2. History ..................................................................................................................................... 2
2.3. The plant cell ........................................................................................................................... 3
2.3.1. Chloroplasts .................................................................................................................... 3
2.3.2. The four phases of energy storage in photosynthesis .................................................... 4
2.3.3. The light-dependent reactions of photosynthesis .......................................................... 5
2.4. Photosystems .......................................................................................................................... 6
2.4.1. Photosystem II (PSII) ....................................................................................................... 7
2.4.2. LHCII from Spinach .......................................................................................................... 7
2.4.3. Light-harvesting pigments............................................................................................... 8
2.4.3.1. Carotenoid–chlorophyll excitation energy transfer ................................................ 8
2.4.3.2. Chlorophylls ............................................................................................................ 9
2.4.3.3. Carotenoids ........................................................................................................... 11
The S* state ........................................................................................................................... 13
2.5. Non-Photochemical Quenching (NPQ) ................................................................................. 14
2.5.1. The Xanthophyll cycle ................................................................................................... 15
2.5.2. LHCII aggregates ............................................................................................................ 15
Chapter 3 ............................................................................................................................................... 17
3.1. Light-matter Interaction ....................................................................................................... 17
3.2. Photophysics, photochemistry, and molecular spectroscopy .............................................. 17
3.2.1. Einstein coefficients ...................................................................................................... 18
i. Singlet and triplet states ....................................................................................................... 18
ii. Radiative and non-radiative decay ....................................................................................... 18
3.3. The exciton concept .............................................................................................................. 20
i. The Förster-Redfield theory .................................................................................................. 20
Chapter 4 ............................................................................................................................................... 21
4. Femtosecond (fs) laser spectroscopy ....................................................................................... 21
4.1. Singlet-singlet annihilation ................................................................................................... 21
4.2. Bandwidth versus femtosecond pulse width ........................................................................ 21
4.3. Transient Absorption (TA) spectroscopy............................................................................... 22
4.3.1. The Beer-Lambert law ................................................................................................... 22
4.3.2. Typical TA spectral features for LHCII ........................................................................... 23
II
Chapter 5 ............................................................................................................................................... 25
5. Data analysis: Glotaran for Global and Target analysis ............................................................ 25
5.1. Data analysis for biophysics experiments ............................................................................. 25
5.2. What is Glotaran? ................................................................................................................. 25
5.3. Global analysis ...................................................................................................................... 27
5.4. Target analysis ...................................................................................................................... 28
Chapter 6 ............................................................................................................................................... 30
6. Literature review ....................................................................................................................... 30
6.1. Related published work ........................................................................................................ 30
Chapter 7 ............................................................................................................................................... 34
7. Materials and Methods ............................................................................................................. 34
7.1. Experimental conditions ....................................................................................................... 34
7.2. Sample preparation .............................................................................................................. 34
7.3. Experimental: Laser setup used for Transient Absorption Pump-Probe Spectroscopy at the
National Laser Centre (NLC) at CSIR .................................................................................................. 37
7.3.1. Clark – MXR, Inc. CPA 2110i femtosecond laser ........................................................... 37
7.3.2. Pump beam: Generation via a Non-collinear Optical Parametric Amplifier (NOPA) .... 38
7.3.3. Prism compression for Group Velocity Dispersion (GVD) ............................................. 42
7.3.4. The Probe pulse ............................................................................................................ 43
7.4. Data acquisition: the ExciPro ................................................................................................ 46
7.5. Experimental Overview ......................................................................................................... 47
Chapter 8 ............................................................................................................................................... 48
8. Results and Discussion .............................................................................................................. 48
8.1. Absorption measurements ................................................................................................... 48
8.2. Transient Absorption (TA) measurements ............................................................................ 49
8.2.1. Establishing temporal overlap ...................................................................................... 50
8.2.2. LHCII: Raw data and data analysis ................................................................................ 52
8.3. LHCII: Evolution Associated Difference Spectra (EADS) ........................................................ 54
8.3.1. Wavelength-dependence study for a low pump pulse energy ..................................... 55
8.3.2. Wavelength-dependence study for a high pump pulse energy .................................... 56
8.4. LHCII: Intensity-dependence studies .................................................................................... 58
8.4.1. Typical decay transient kinetics for LHCII ..................................................................... 58
8.4.2. GSB decay transient kinetics ......................................................................................... 59
8.4.3. ESA decay transient kinetics ......................................................................................... 60
8.4.4. Chl a GSB decay transient kinetics ................................................................................ 60
8.5. Intensity-dependence: calculations, effects and annihilation .............................................. 62
III
8.5.1. Laser pulse photon density ........................................................................................... 62
8.5.2. Singlet-singlet annihilation probability ......................................................................... 63
8.5.2.1. The average number of excited Chl a molecules per trimer per pulse................. 63
8.5.2.2. Poisson distribution for the annihilation probabilities ......................................... 64
8.5.3. Singlet-singlet annihilation kinetics .............................................................................. 64
8.5.4. Annihilation summary ................................................................................................... 65
Chapter 9 ............................................................................................................................................... 66
9. Conclusion ................................................................................................................................. 66
Chapter 10 ............................................................................................................................................. 68
10. Future Work .......................................................................................................................... 68
References ............................................................................................................................................ 69
Chapter 1 Rationale – Why plants?
Page 1 of 74
Chapter 1
1.1. Rationale – Why plants?
A steep incline in population and economic growth over the past few decades projects an increase in
the global energy demand for the future [1]. Fossil fuel energy resources are currently being over-
exploited and are posing a threat to the environment due to unstable carbon dioxide (CO2) emissions.
Thus, it is essential to devise an appropriate renewable energy resource, which will prove to be both
sustainable and environmentally friendly.
In light of the current energy crisis that South Africa is facing with our major electricity
supplier, Eskom, struggling to generate and supply our country with enough power to meet the needs
of the citizens, other avenues of alternative energy production need to be made available. A
promising possibility is solar technology inspired by photosynthesis, which is the major solar energy
storing process on earth.
It has been estimated that approximately 1.8 x 10¹⁷ W of solar power in the form of
electromagnetic radiation across the entire solar spectrum (which includes mainly the visible and
near-infrared regions) is incident on the upper atmosphere of the earth [2, 3]. In a 2016 study by
Meftah, et al. using solar data during the period of 2010 – 2014, it was reported that there has been
an annual amplitude increase in the order of ±0.1% for the total solar irradiance at the top of the
Earth’s atmosphere, at a distance of 1 AU from the sun, which corresponds to an annual increase of
about 2.7 W·m-2 [4]. Extrapolating this conclusion linearly, we could expect an annual global solar
irradiation on Earth’s upper atmosphere of approximately 1.37 ± 0.2 kW·m-2 for 2017, based on
recorded values [4].
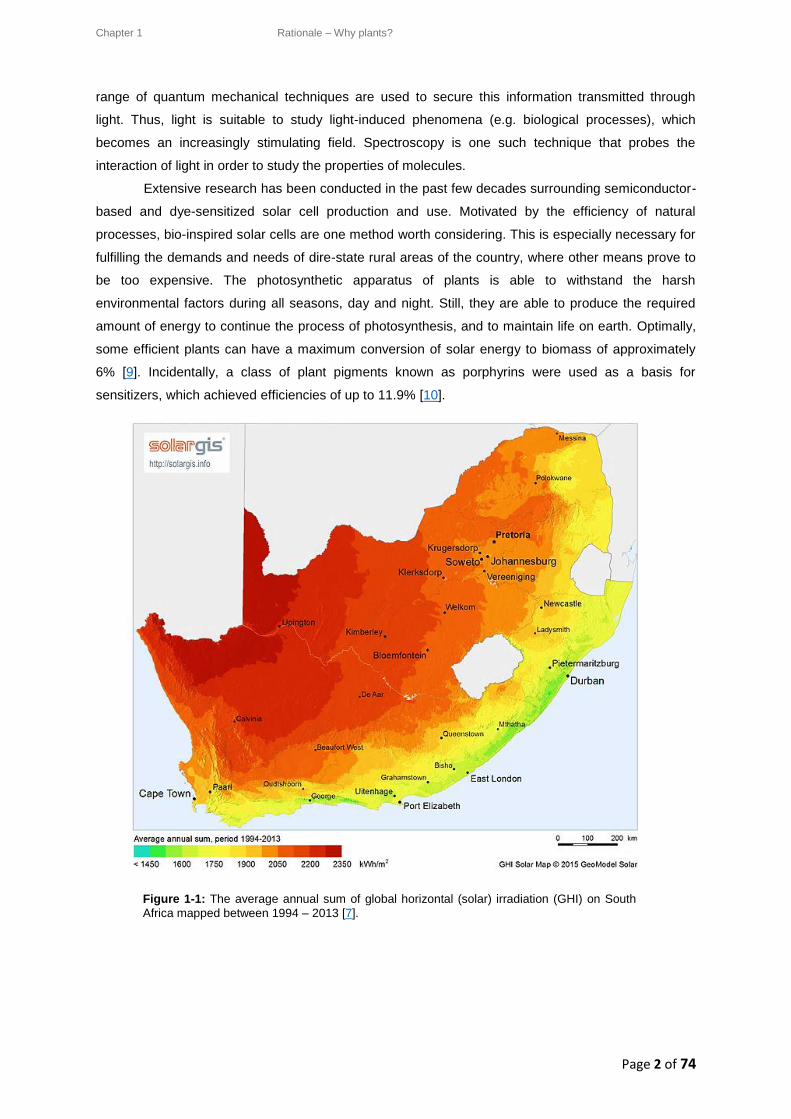
According to the International Energy Agency, the average world energy consumption to
power all human activity was only about 12.3 TW in 2013 [5]. On average, the annual 24-hour global
solar radiation on South Africa is approximately 220 W·m-2, making South Africa one of the highest
solar energy receivers in the world [6, 7]. Figure 1-1 shows the average annual sum of Global
Horizontal (solar) Irradiation (GHI), mapped for South Africa between the years 1994 – 2013 [7].
Taking these values into consideration, solar energy is undoubtedly both an attractive and clean
source of energy to consider, guaranteeing minimal wastage.
Despite the extensive scientific research into solar cells, the process of converting solar
energy into electrical energy is insufficient, with the highest efficiency of a photovoltaic cell only
around 40% in 2005 [8]. Capacitors and energy storage devices further have their own shortcomings.
These challenges can be curbed by searching within nature for solutions in the form of natural
photosynthesis. Understanding the processes of photosynthesis is imperative in harvesting as well as
storing solar energy for societal use.
An accentuating factor for light-based research is the promotion of optics and photonics
through the celebration of the 2015 International Year of Light, and Light Based Technologies. This
makes research into the light-based aspects even more exciting to unearth, promoting more
developments in this field. Light is used to transmit information through technological and scientific
advancement where information is condensed, transmitted, and easily unpacked upon receipt. A
Chapter 1 Rationale – Why plants?
Page 2 of 74
range of quantum mechanical techniques are used to secure this information transmitted through
light. Thus, light is suitable to study light-induced phenomena (e.g. biological processes), which
becomes an increasingly stimulating field. Spectroscopy is one such technique that probes the
interaction of light in order to study the properties of molecules.
Extensive research has been conducted in the past few decades surrounding semiconductor-
based and dye-sensitized solar cell production and use. Motivated by the efficiency of natural
processes, bio-inspired solar cells are one method worth considering. This is especially necessary for
fulfilling the demands and needs of dire-state rural areas of the country, where other means prove to
be too expensive. The photosynthetic apparatus of plants is able to withstand the harsh
environmental factors during all seasons, day and night. Still, they are able to produce the required
amount of energy to continue the process of photosynthesis, and to maintain life on earth. Optimally,
some efficient plants can have a maximum conversion of solar energy to biomass of approximately
6% [9]. Incidentally, a class of plant pigments known as porphyrins were used as a basis for
sensitizers, which achieved efficiencies of up to 11.9% [10].
Figure 1-1: The average annual sum of global horizontal (solar) irradiation (GHI) on South
Africa mapped between 1994 – 2013 [7].
Chapter 1 Rationale – Why plants?
Page 1 of 74
In natural photosynthesis, photosynthetic organisms use solar energy to carry out chemical
reactions in the plants. The solar energy harvested by plants is stored in the form of chemical bonds,
the densest form of energy storage, and is therefore an inspiration for solar energy storage
technologies (i.e., bio-inspired solar fuels). Extraordinarily high solar conversion efficiencies can be
gained, as well as the generation of fuels (such as hydrogen and CO2) from photosynthesis. These
opportunities, if realized could have a revolutionary impact on the present energy system and global
environment. Once artificial photosynthesis is accomplished, it could prove to be much more efficient
than biofuel production processes. This would mean that arable land, agricultural feedstock, and
considerable amounts of energy and water contributions would not be necessary, unlike in the case of
biofuel production.
A number of limiting factors still pose as hurdles in understanding natural photosynthesis.
These factors affect the design and optimization of artificial photosynthetic devices, making them
highly inefficient and unsustainable. Thus, pursuing these devices with the current limited knowledge,
makes them economically unfeasible. One crucial facet is the ability of the photosynthetic light-
harvesting (LH) apparatus to rapidly switch between an efficient LH function and an efficient
photoprotective state (i.e., the ability of a plant and other oxygenic photosynthetic organisms to
protect themselves against over-illumination). This natural phenomenon is further investigated and
explained in the chapters that follow.
One of the main aims of this dissertation was to prepare an existing pump-probe
spectroscopic setup for biological experiments. In particular, an investigation was launched to better
understand the excited state dynamics of some specific photosynthetic pigments, viz. carotenoids, of
the main plant light-harvesting complex (LHCII) of higher order plants. This was done through
intensity-dependence and wavelength-dependence experiments, which focussed on the spectral
signatures, energy transfer dynamics, and interpretations of these phenomena. A brief study on the
annihilation effects of the excitations was also considered. LHCII of spinach leaves was chosen for
this study because of its availability and its high pigment concentrations. Thus, this dissertation should
provide the reader with an overview of the excitation energy transfer mechanisms and pathways
between the electronic states of carotenoids and chlorophyll pigments, in order to comprehend with a
small part of the process of photosynthesis.
Chapter 2 Basic principles of Photosynthesis
Page 2 of 74
Chapter 2
In this chapter, we will go through some basics of the natural photosynthetic process. The aim is to
briefly introduce the principles and structure of the light-harvesting complexes, and their pigment-
proteins, as well as concepts that surround energy transfer in photosynthesis.
2.1. Basic principles of Photosynthesis
Natural photosynthesis is a vital source for food production in nature, and is the fundamental solar
energy storing process known on earth. During photosynthesis, sunlight aids in converting carbon
dioxide (CO2) and water into chemical energy in the form of chemical bonds, which is used by
biological systems. CO2 is reduced to carbohydrates such as starches and sugars (e.g. glucose
(C6H12O6)), through a series of reactions. This in turn is converted to produce biomass as a product,
most of which is consumed by the organisms themselves for respiration and other cellular processes.
The overall chemical equation for photosynthesis is:
𝟔𝑪𝑶𝟐 + 𝟔𝑯𝟐𝑶
𝒍𝒊𝒈𝒉𝒕→ 𝑪𝟔𝑯𝟏𝟐𝑶𝟔 + 𝟔𝑶𝟐 (2-1)
where the reaction between CO2 and water is prompted by light in the form of photons, in order to
produce the carbohydrates and by-product oxygen which is essential for survival in all respiratory
organisms. Photosynthesis occurs in various organisms, including the green leaves of terrestrial
autotrophic plants and some specific bacteria; but predominantly in the ocean. The most studied
cases are those found in eukaryotic higher plants2 and algae, as well as in prokaryotic cyanobacteria3.
2.2. History
As early as 1932, two scientists – Robert Emerson and his student William Arnold who were based at
the California Institute of Technology – began to study photosynthesis by probing green algae with
short flashes of light [13]. From their initial set of experiments, they concurred that photosynthesis is a
two-staged process, viz. light state and dark state (see section 2.3.3). In their second run of
experiments, they varied the light intensity of the flashes, and managed to isolate the photochemical
reaction and study this without further intrusion [13].
This marked a turning point in science and from the early 1930s to the 1950s, a series of
experiments and publications became available on the mechanism of photosynthesis and its various
aspects. Many inquisitive minds were prompted to investigate this wealth of information and to
understand the processes of photosynthesis, aiming to bring this to life artificially. Of late, bio-inspired
solar cell research has come into the limelight for its viability [10]. Understanding the molecular
mechanisms that underlie the efficient storage of solar energy from the process of photosynthesis in
the system is crucial for future energy storage devices.
2 Higher plants: plants with complex or advanced characteristics. In particular, vascular plants (plants containing conducting tissue), and flowering plants [11]. Higher Plants, Oxford Dictionaries, Oxford University Press, 2015. 3 Cyanobacteria: A group of microorganisms that are related to bacteria, and are capable of photosynthesis. The name "cyanobacteria" comes from the blue-green colour of the organism [12]. Cyanobacteria, Oxford Dictionaries, 2015 Oxford University Press, 2015.
Chapter 2 Basic principles of Photosynthesis
Page 3 of 74
2.3. The plant cell
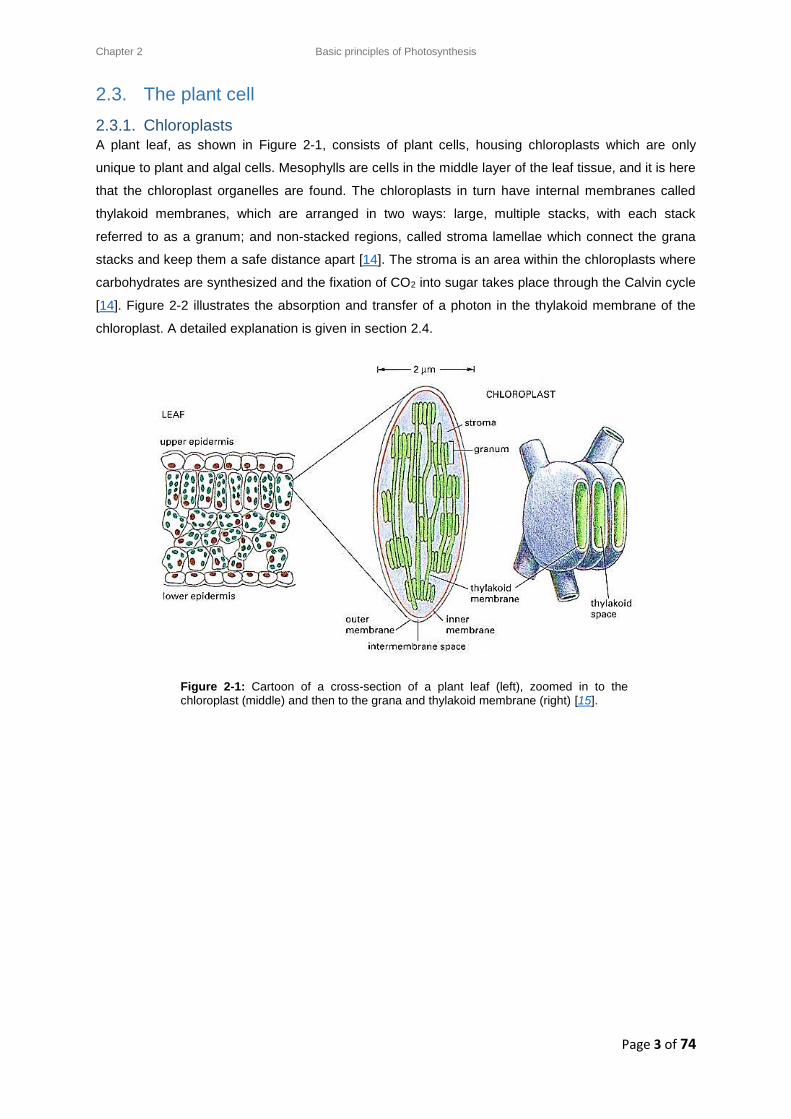
2.3.1. Chloroplasts A plant leaf, as shown in Figure 2-1, consists of plant cells, housing chloroplasts which are only
unique to plant and algal cells. Mesophylls are cells in the middle layer of the leaf tissue, and it is here
that the chloroplast organelles are found. The chloroplasts in turn have internal membranes called
thylakoid membranes, which are arranged in two ways: large, multiple stacks, with each stack
referred to as a granum; and non-stacked regions, called stroma lamellae which connect the grana
stacks and keep them a safe distance apart [14]. The stroma is an area within the chloroplasts where
carbohydrates are synthesized and the fixation of CO2 into sugar takes place through the Calvin cycle
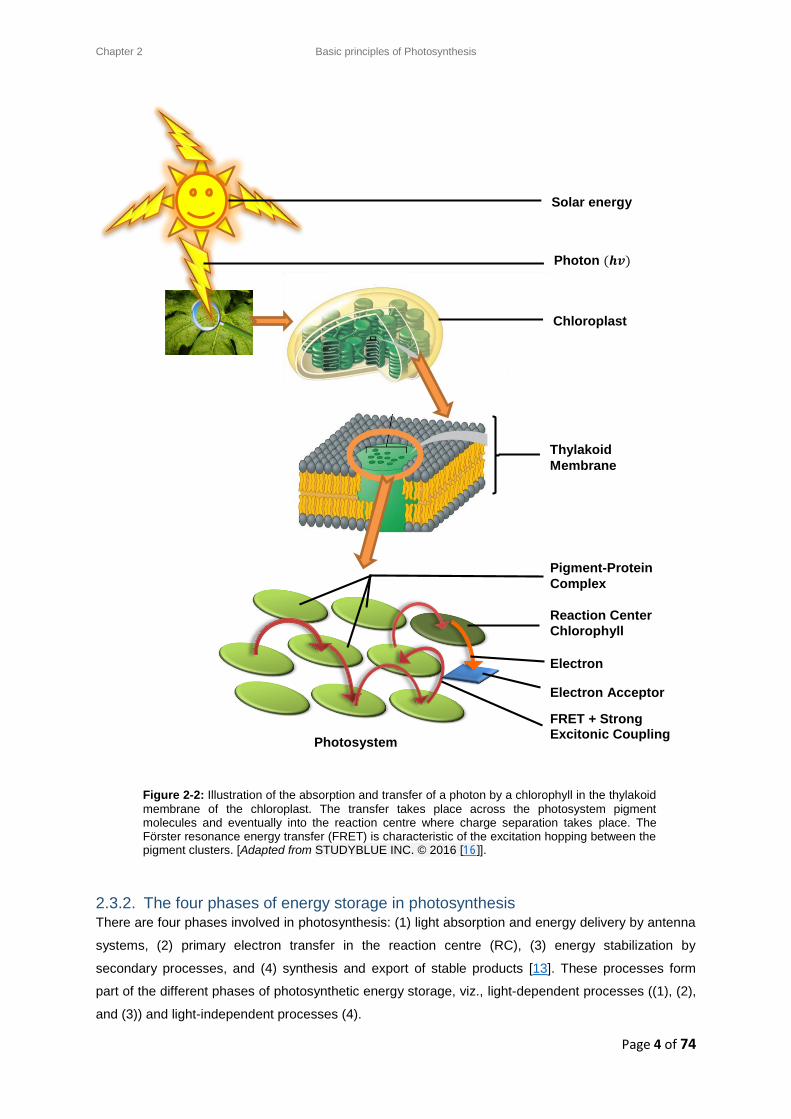
[14]. Figure 2-2 illustrates the absorption and transfer of a photon in the thylakoid membrane of the
chloroplast. A detailed explanation is given in section 2.4.
Figure 2-1: Cartoon of a cross-section of a plant leaf (left), zoomed in to the chloroplast (middle) and then to the grana and thylakoid membrane (right) [15].
Chapter 2 Basic principles of Photosynthesis
Page 4 of 74
2.3.2. The four phases of energy storage in photosynthesis There are four phases involved in photosynthesis: (1) light absorption and energy delivery by antenna
systems, (2) primary electron transfer in the reaction centre (RC), (3) energy stabilization by
secondary processes, and (4) synthesis and export of stable products [13]. These processes form
part of the different phases of photosynthetic energy storage, viz., light-dependent processes ((1), (2),
and (3)) and light-independent processes (4).
Figure 2-2: Illustration of the absorption and transfer of a photon by a chlorophyll in the thylakoid
membrane of the chloroplast. The transfer takes place across the photosystem pigment molecules and eventually into the reaction centre where charge separation takes place. The Förster resonance energy transfer (FRET) is characteristic of the excitation hopping between the pigment clusters. [Adapted from STUDYBLUE INC. © 2016 [16]].
Photosystem
Solar energy
Photon (𝒉𝒗)
Reaction Center
Chlorophyll
Pigment-Protein
Complex
FRET + Strong Excitonic Coupling
Electron
transfer Electron Acceptor
Thylakoid
Membrane
Chloroplast
Chapter 2 Basic principles of Photosynthesis
Page 5 of 74
The natural photosynthetic apparatus for higher plants consists of a complex system of
membrane-bound pigment-proteins, which act as a Biobattery. Chloroplasts mainly contain two types
of light-harvesting (LH) pigments (see 2.4.3), viz. chlorophylls (the main LH pigment), and carotenoids
(which display both a LH and photoprotective role). Pheophytins are special pigments found in the
RC, which form when chlorophyll pigments degrade and lose their central magnesium ion.
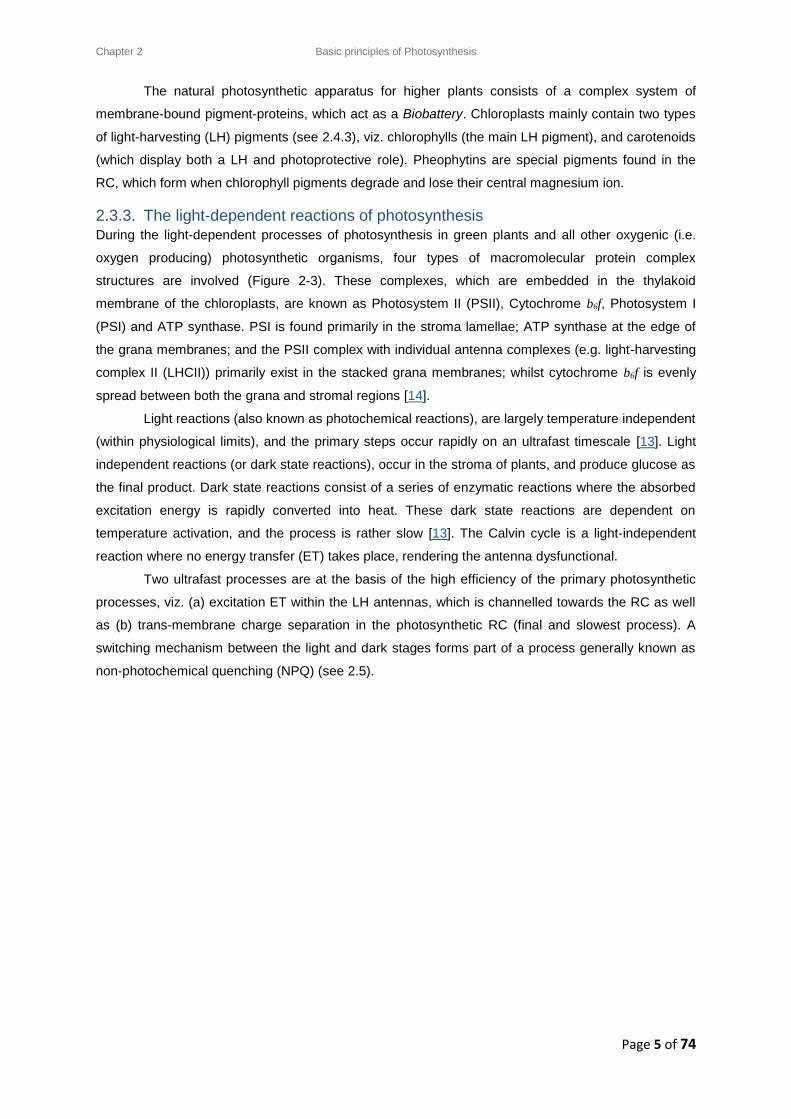
2.3.3. The light-dependent reactions of photosynthesis During the light-dependent processes of photosynthesis in green plants and all other oxygenic (i.e.
oxygen producing) photosynthetic organisms, four types of macromolecular protein complex
structures are involved (Figure 2-3). These complexes, which are embedded in the thylakoid
membrane of the chloroplasts, are known as Photosystem II (PSII), Cytochrome b6f, Photosystem I
(PSI) and ATP synthase. PSI is found primarily in the stroma lamellae; ATP synthase at the edge of
the grana membranes; and the PSII complex with individual antenna complexes (e.g. light-harvesting
complex II (LHCII)) primarily exist in the stacked grana membranes; whilst cytochrome b6f is evenly
spread between both the grana and stromal regions [14].
Light reactions (also known as photochemical reactions), are largely temperature independent
(within physiological limits), and the primary steps occur rapidly on an ultrafast timescale [13]. Light
independent reactions (or dark state reactions), occur in the stroma of plants, and produce glucose as
the final product. Dark state reactions consist of a series of enzymatic reactions where the absorbed
excitation energy is rapidly converted into heat. These dark state reactions are dependent on
temperature activation, and the process is rather slow [13]. The Calvin cycle is a light-independent
reaction where no energy transfer (ET) takes place, rendering the antenna dysfunctional.
Two ultrafast processes are at the basis of the high efficiency of the primary photosynthetic
processes, viz. (a) excitation ET within the LH antennas, which is channelled towards the RC as well
as (b) trans-membrane charge separation in the photosynthetic RC (final and slowest process). A
switching mechanism between the light and dark stages forms part of a process generally known as
non-photochemical quenching (NPQ) (see 2.5).
Chapter 2 Basic principles of Photosynthesis
Page 6 of 74
Figure 2-3: Cartoon of the thylakoid membrane, with the four macromolecular structures
involved in the light-dependent processes of oxygenic photosynthesis in plants [17].
2.4. Photosystems
A photosystem can be envisaged as a miniature solar cell, which collects sunlight and temporarily
stores the energy for later use. Conceptually, the photosystems operate much like a satellite dish,
where the antenna absorbs light with a certain absorption efficiency, and subsequently directs the
excitation energy to an energy-receiving RC within the photosystem (excitation ET occurs on an
ultrafast timescale (femtosecond to picoseconds)). This process is illustrated in Figure 2-2. In the
photosynthetic RC, the energy is converted into a transmembrane electrochemical potential difference
(charge separation) [18]. During electron transport in green plants, the emitted electrons pass through
a chain of electron acceptors, such as pheophytin, quinone, plastiquone, cytochrome b6f, and
ferredoxin, which then leads to the reduction of nicotinamide adenine dinucleotide phosphate
(NADP+) into NADPH. The protons released from water oxidation and those transferred from the
stroma to the lumen by the plastoquinone pool, are stored as energy during the formation of
adenosine tri-phosphate (ATP). In order for the reactions to continue, the utilised electrons must be
replenished. Thus, the RCs of PSI and PSII convert the absorbed photon energy into electrical
potentials with efficiencies of 80 ± 15% and 45 ± 10% respectively [9, 19].
Membrane-bound proteins can be classified into two types of antenna complexes, namely
integral and peripheral protein complexes. Peripheral proteins occasionally detach from the
membrane and generally do not span the membrane, while integral proteins are permanently bound
to the membrane and most often cross it. However, there are particular antennae (like phycobilisome,
FMO, and chlorosome) that occur outside the membranes. PSI is composed of a monomeric core
complex and different LH proteins [14, 20]. PSII contains multiple trimeric LHCII complexes, as well
as some minor subunits (see 2.4.1) [14]. The protein-bound pigments (chlorophylls (Chls) and
carotenoids (Cars)) absorb the solar photons at different wavelengths. There are ~200 – 300
ATP synthase PSII (dimer) PSI (monomer) Cyt b6f (dimer)
ADP + Pi → ATP + H2O
Chapter 2 Basic principles of Photosynthesis
Page 7 of 74
pigments and ~50 proteins that surround the individual RC complexes [21, 22]. Proteins are a
uniquely folded sequence of amino acids.
2.4.1. Photosystem II (PSII) Structurally, PSII is a dimer comprised of many pigment-protein complexes inside the membrane.
Each monomer has a core antenna unit which consists of more than 25 polypeptides, and peripheral
antenna complexes consisting of the minor antennae CP24, CP26, and CP29, as well as LHCII. The
primary function of a PSII complex is to split water into oxygen, protons and electrons. Oxygen
evolution takes place when molecular oxygen is synthesized from water, during oxygenic
photosynthesis.
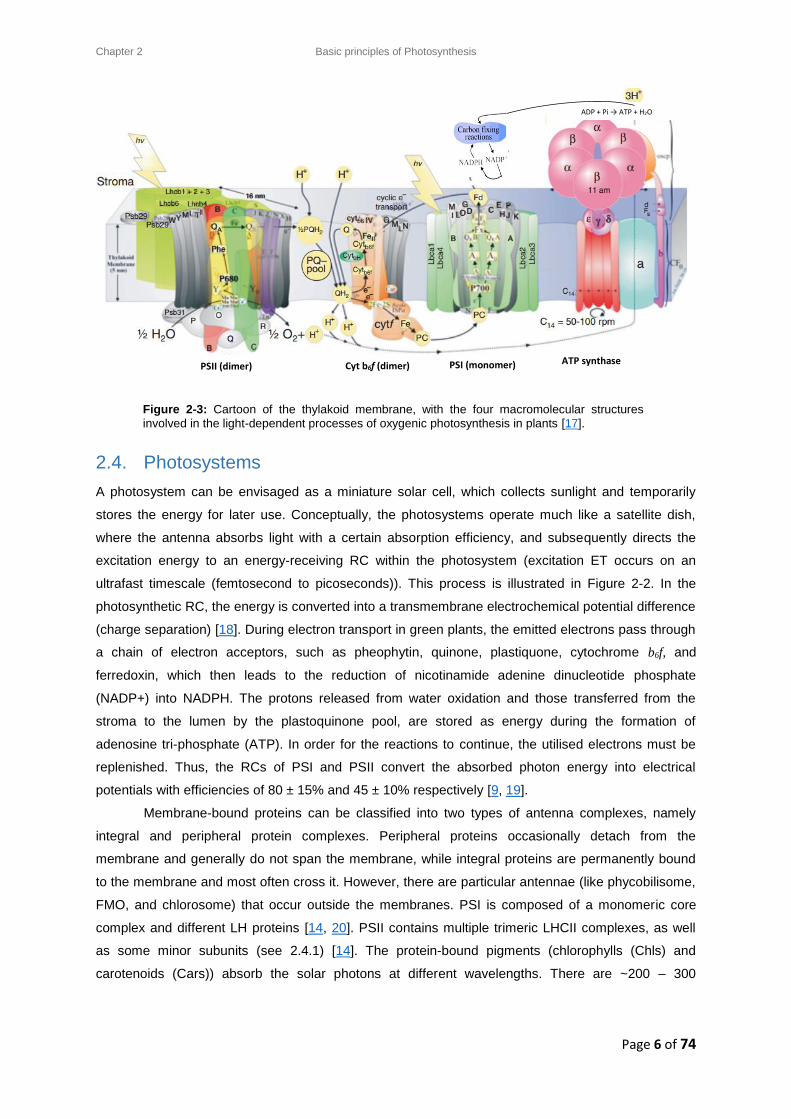
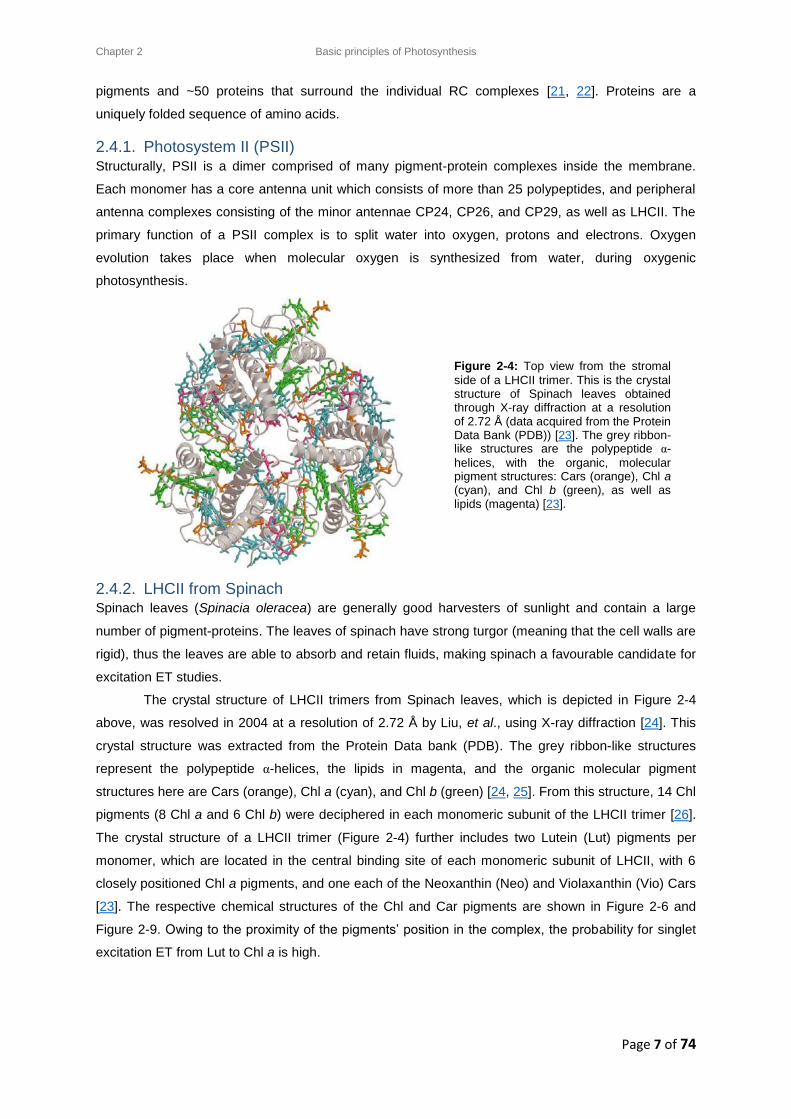
Figure 2-4: Top view from the stromal
side of a LHCII trimer. This is the crystal structure of Spinach leaves obtained through X-ray diffraction at a resolution of 2.72 Å (data acquired from the Protein Data Bank (PDB)) [23]. The grey ribbon-like structures are the polypeptide α-
helices, with the organic, molecular pigment structures: Cars (orange), Chl a (cyan), and Chl b (green), as well as lipids (magenta) [23].
2.4.2. LHCII from Spinach Spinach leaves (Spinacia oleracea) are generally good harvesters of sunlight and contain a large
number of pigment-proteins. The leaves of spinach have strong turgor (meaning that the cell walls are
rigid), thus the leaves are able to absorb and retain fluids, making spinach a favourable candidate for
excitation ET studies.
The crystal structure of LHCII trimers from Spinach leaves, which is depicted in Figure 2-4
above, was resolved in 2004 at a resolution of 2.72 Å by Liu, et al., using X-ray diffraction [24]. This
crystal structure was extracted from the Protein Data bank (PDB). The grey ribbon-like structures
represent the polypeptide α-helices, the lipids in magenta, and the organic molecular pigment
structures here are Cars (orange), Chl a (cyan), and Chl b (green) [24, 25]. From this structure, 14 Chl
pigments (8 Chl a and 6 Chl b) were deciphered in each monomeric subunit of the LHCII trimer [26].
The crystal structure of a LHCII trimer (Figure 2-4) further includes two Lutein (Lut) pigments per
monomer, which are located in the central binding site of each monomeric subunit of LHCII, with 6
closely positioned Chl a pigments, and one each of the Neoxanthin (Neo) and Violaxanthin (Vio) Cars
[23]. The respective chemical structures of the Chl and Car pigments are shown in Figure 2-6 and
Figure 2-9. Owing to the proximity of the pigments’ position in the complex, the probability for singlet
excitation ET from Lut to Chl a is high.
Chapter 2 Basic principles of Photosynthesis
Page 8 of 74
2.4.3. Light-harvesting pigments Plants have two main types of LH pigments, viz. Chls, and Cars, which are responsible for capturing
the solar energy necessary for photosynthesis. Each pigment absorbs light of different colours, based
on their chemical composition. Thus, a combination of pigments may cover most of the visible
spectrum of light, enhancing and increasing the efficiency of solar energy capture.
2.4.3.1. Carotenoid–chlorophyll excitation energy transfer
The antenna proteins of plants bind a collection of pigments: Chl a, Chl b, and Xanthophylls
(oxygenated Cars). The excitation ET between pigment clusters in the LHCII occurs in the form of
resonance (non-radiative) ET. The blue-green absorbing pigment-proteins (Cars) are the receivers,
which channel the energy to the red absorbing pigment-proteins (Chls) that are closer to the RC [27].
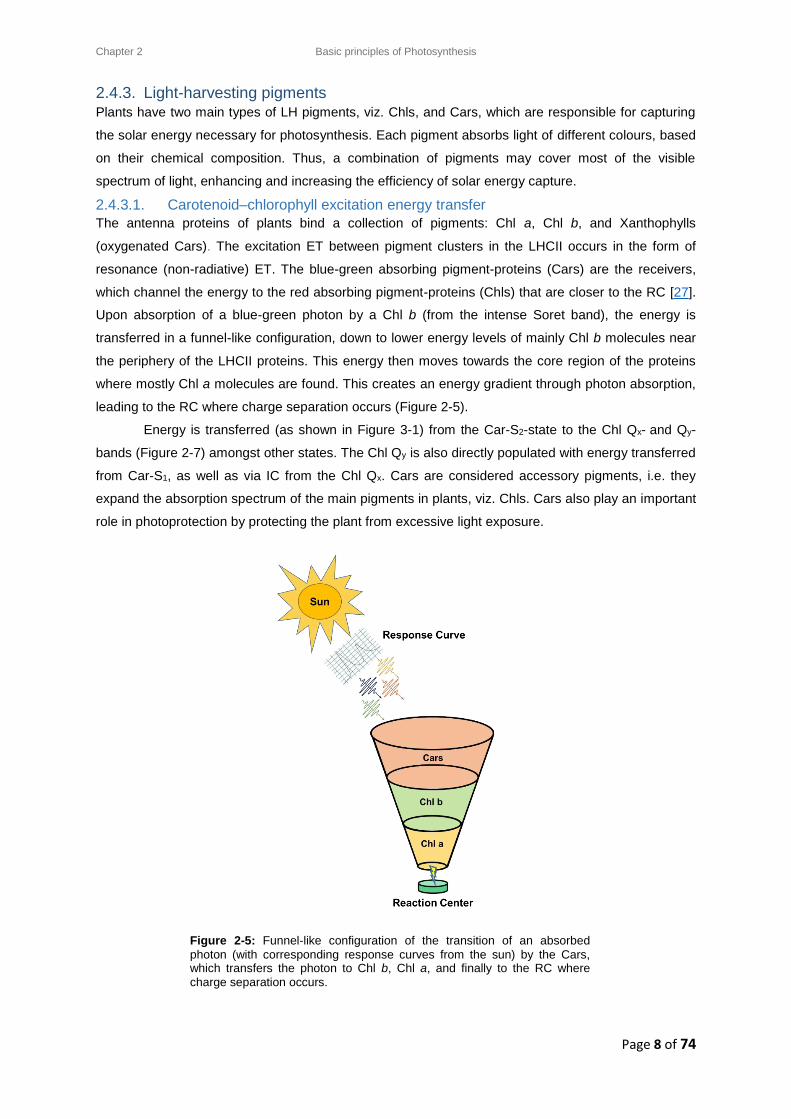
Upon absorption of a blue-green photon by a Chl b (from the intense Soret band), the energy is
transferred in a funnel-like configuration, down to lower energy levels of mainly Chl b molecules near
the periphery of the LHCII proteins. This energy then moves towards the core region of the proteins
where mostly Chl a molecules are found. This creates an energy gradient through photon absorption,
leading to the RC where charge separation occurs (Figure 2-5).
Energy is transferred (as shown in Figure 3-1) from the Car-S2-state to the Chl Qx- and Qy-
bands (Figure 2-7) amongst other states. The Chl Qy is also directly populated with energy transferred
from Car-S1, as well as via IC from the Chl Qx. Cars are considered accessory pigments, i.e. they
expand the absorption spectrum of the main pigments in plants, viz. Chls. Cars also play an important
role in photoprotection by protecting the plant from excessive light exposure.
Figure 2-5: Funnel-like configuration of the transition of an absorbed
photon (with corresponding response curves from the sun) by the Cars, which transfers the photon to Chl b, Chl a, and finally to the RC where
charge separation occurs.
Chapter 2 Basic principles of Photosynthesis
Page 9 of 74
2.4.3.2. Chlorophylls
Chls are the main pigments in plant photosynthesis and are involved with light absorption, excitation
ET in the LH antenna, and charge separation in the RC. Chls are stable ring-shaped molecules,
containing a Magnesium centre, which is held in place by four Nitrogen bonds, as shown in Figure
2-6. The large, inner heterocyclic aromatic ring structure is called Chlorin.
When electrons are excited with light the process is called photoexcitation. This
photoexcitation is achievable in the laboratory with different light sources, for example a controlled
laser beam source. Naturally, the antenna complexes concentrate and direct the excitation energy to
the RC. Chls exhibit two major absorption bands: one in the blue and near-UV region – the Soret
band – and the other in the red region. These absorption bands are presented as an absorption
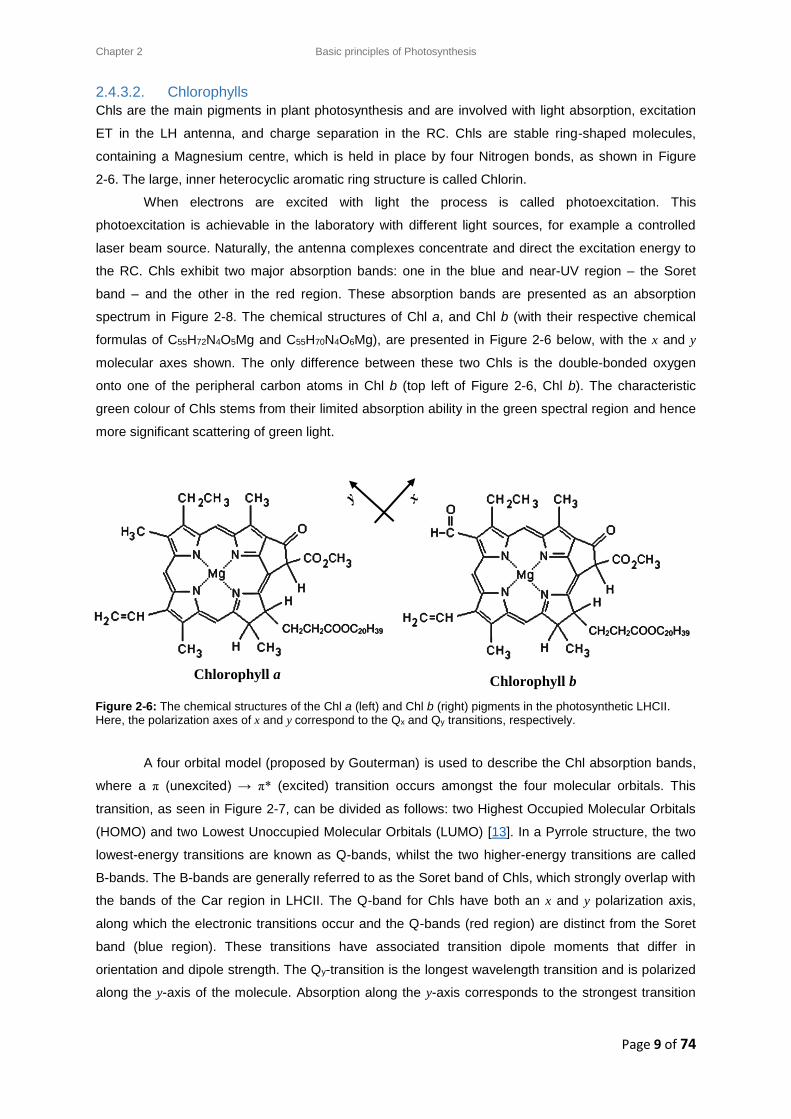
spectrum in Figure 2-8. The chemical structures of Chl a, and Chl b (with their respective chemical
formulas of C55H72N4O5Mg and C55H70N4O6Mg), are presented in Figure 2-6 below, with the x and y
molecular axes shown. The only difference between these two Chls is the double-bonded oxygen
onto one of the peripheral carbon atoms in Chl b (top left of Figure 2-6, Chl b). The characteristic
green colour of Chls stems from their limited absorption ability in the green spectral region and hence
more significant scattering of green light.
Figure 2-6: The chemical structures of the Chl a (left) and Chl b (right) pigments in the photosynthetic LHCII. Here, the polarization axes of x and y correspond to the Qx and Qy transitions, respectively.
A four orbital model (proposed by Gouterman) is used to describe the Chl absorption bands,
where a π (unexcited) → π* (excited) transition occurs amongst the four molecular orbitals. This
transition, as seen in Figure 2-7, can be divided as follows: two Highest Occupied Molecular Orbitals
(HOMO) and two Lowest Unoccupied Molecular Orbitals (LUMO) [13]. In a Pyrrole structure, the two
lowest-energy transitions are known as Q-bands, whilst the two higher-energy transitions are called
B-bands. The B-bands are generally referred to as the Soret band of Chls, which strongly overlap with
the bands of the Car region in LHCII. The Q-band for Chls have both an x and y polarization axis,
along which the electronic transitions occur and the Q-bands (red region) are distinct from the Soret
band (blue region). These transitions have associated transition dipole moments that differ in
orientation and dipole strength. The Qy-transition is the longest wavelength transition and is polarized
along the y-axis of the molecule. Absorption along the y-axis corresponds to the strongest transition
Chlorophyll b Chlorophyll a
Chapter 2 Basic principles of Photosynthesis
Page 10 of 74
dipole moment [13]. The Qx-band corresponds to a small transition dipole moment; hence, the band is
not as pronounced as the strong Qy-band in the absorption spectrum, where the excitation is from the
HOMO band to the LUMO band.
Figure 2-7: The Chl Soret, Qx-
and Qy-band energy transitions signifying the highest occupied molecular orbital (HOMO), and the lowest unoccupied molecular orbital (LUMO).
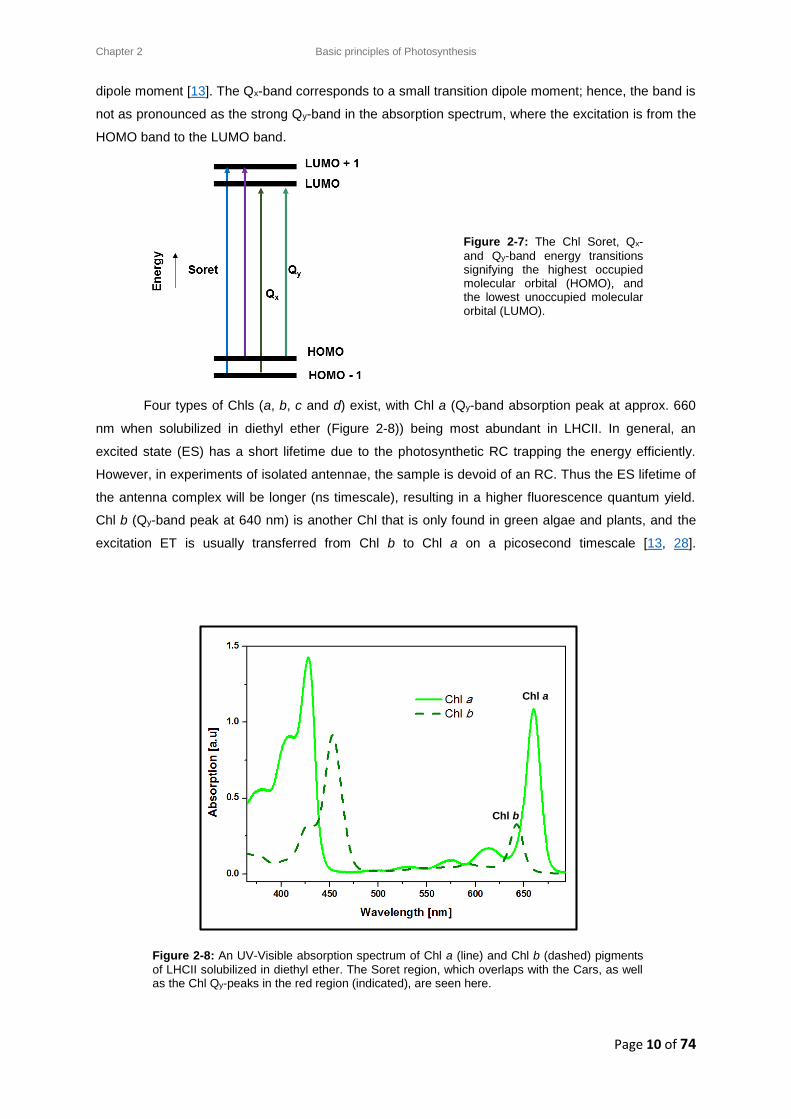
Four types of Chls (a, b, c and d) exist, with Chl a (Qy-band absorption peak at approx. 660
nm when solubilized in diethyl ether (Figure 2-8)) being most abundant in LHCII. In general, an
excited state (ES) has a short lifetime due to the photosynthetic RC trapping the energy efficiently.
However, in experiments of isolated antennae, the sample is devoid of an RC. Thus the ES lifetime of
the antenna complex will be longer (ns timescale), resulting in a higher fluorescence quantum yield.
Chl b (Qy-band peak at 640 nm) is another Chl that is only found in green algae and plants, and the
excitation ET is usually transferred from Chl b to Chl a on a picosecond timescale [13, 28].
Figure 2-8: An UV-Visible absorption spectrum of Chl a (line) and Chl b (dashed) pigments
of LHCII solubilized in diethyl ether. The Soret region, which overlaps with the Cars, as well as the Chl Qy-peaks in the red region (indicated), are seen here.
Chl a
Chl b
Chapter 2 Basic principles of Photosynthesis
Page 11 of 74
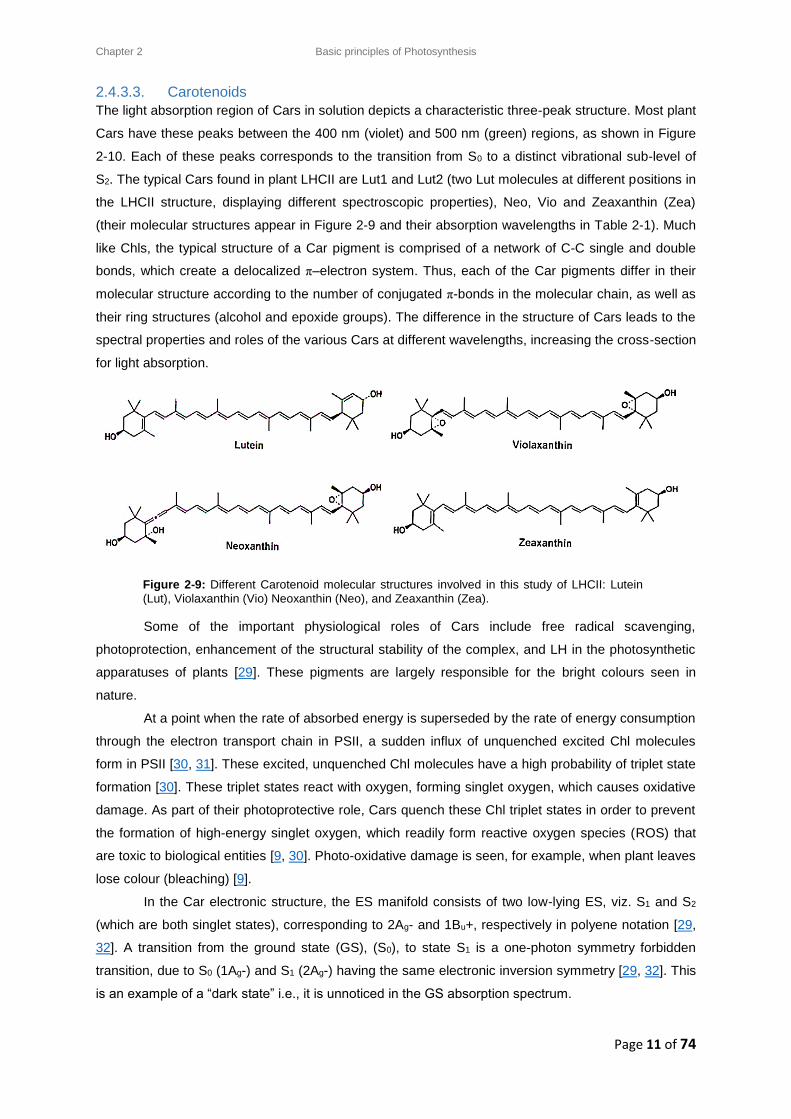
2.4.3.3. Carotenoids
The light absorption region of Cars in solution depicts a characteristic three-peak structure. Most plant
Cars have these peaks between the 400 nm (violet) and 500 nm (green) regions, as shown in Figure
2-10. Each of these peaks corresponds to the transition from S0 to a distinct vibrational sub-level of
S2. The typical Cars found in plant LHCII are Lut1 and Lut2 (two Lut molecules at different positions in
the LHCII structure, displaying different spectroscopic properties), Neo, Vio and Zeaxanthin (Zea)
(their molecular structures appear in Figure 2-9 and their absorption wavelengths in Table 2-1). Much
like Chls, the typical structure of a Car pigment is comprised of a network of C-C single and double
bonds, which create a delocalized π–electron system. Thus, each of the Car pigments differ in their
molecular structure according to the number of conjugated π-bonds in the molecular chain, as well as
their ring structures (alcohol and epoxide groups). The difference in the structure of Cars leads to the
spectral properties and roles of the various Cars at different wavelengths, increasing the cross-section
for light absorption.
Figure 2-9: Different Carotenoid molecular structures involved in this study of LHCII: Lutein
(Lut), Violaxanthin (Vio) Neoxanthin (Neo), and Zeaxanthin (Zea).
Some of the important physiological roles of Cars include free radical scavenging,
photoprotection, enhancement of the structural stability of the complex, and LH in the photosynthetic
apparatuses of plants [29]. These pigments are largely responsible for the bright colours seen in
nature.
At a point when the rate of absorbed energy is superseded by the rate of energy consumption
through the electron transport chain in PSII, a sudden influx of unquenched excited Chl molecules
form in PSII [30, 31]. These excited, unquenched Chl molecules have a high probability of triplet state
formation [30]. These triplet states react with oxygen, forming singlet oxygen, which causes oxidative
damage. As part of their photoprotective role, Cars quench these Chl triplet states in order to prevent
the formation of high-energy singlet oxygen, which readily form reactive oxygen species (ROS) that
are toxic to biological entities [9, 30]. Photo-oxidative damage is seen, for example, when plant leaves
lose colour (bleaching) [9].
In the Car electronic structure, the ES manifold consists of two low-lying ES, viz. S1 and S2
(which are both singlet states), corresponding to 2Ag and 1Bu+, respectively in polyene notation [29,
32]. A transition from the ground state (GS), (S0), to state S1 is a one-photon symmetry forbidden
transition, due to S0 (1Ag-) and S1 (2Ag-) having the same electronic inversion symmetry [29, 32]. This
is an example of a “dark state” i.e., it is unnoticed in the GS absorption spectrum.
Chapter 2 Basic principles of Photosynthesis
Page 12 of 74
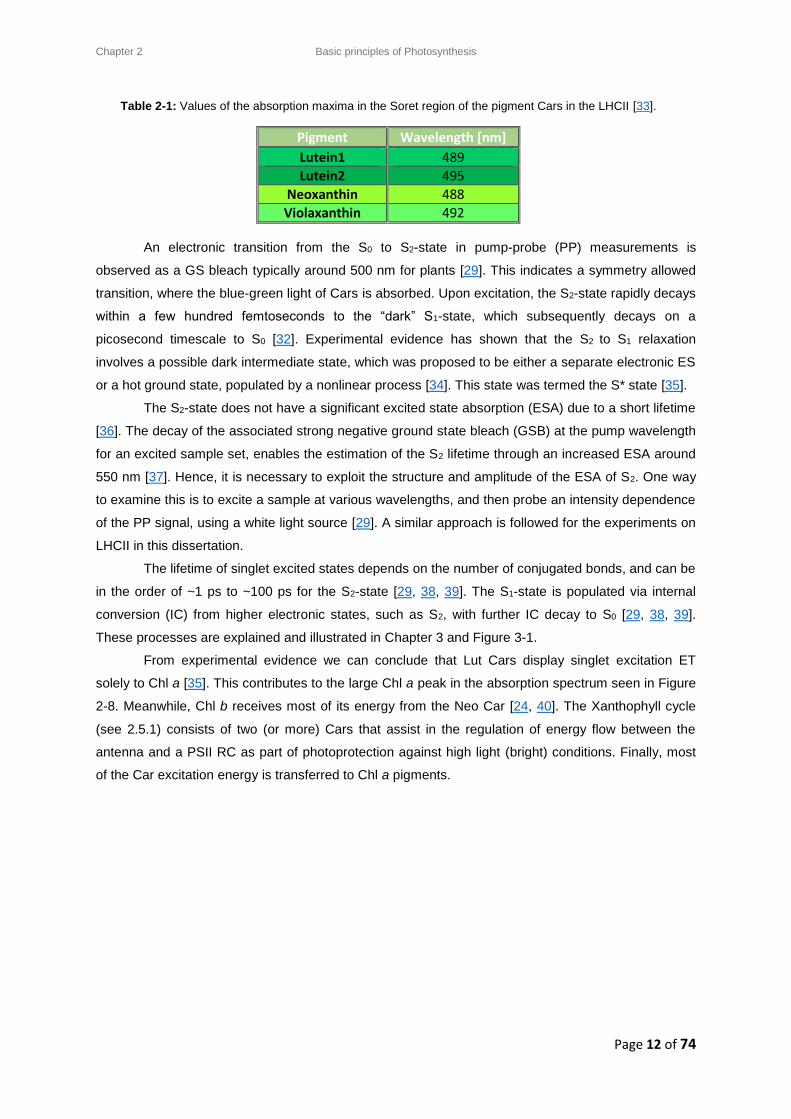
Table 2-1: Values of the absorption maxima in the Soret region of the pigment Cars in the LHCII [33].
Pigment Wavelength [nm]
Lutein1 489
Lutein2 495
Neoxanthin 488
Violaxanthin 492
An electronic transition from the S0 to S2-state in pump-probe (PP) measurements is
observed as a GS bleach typically around 500 nm for plants [29]. This indicates a symmetry allowed
transition, where the blue-green light of Cars is absorbed. Upon excitation, the S2-state rapidly decays
within a few hundred femtoseconds to the “dark” S1-state, which subsequently decays on a
picosecond timescale to S0 [32]. Experimental evidence has shown that the S2 to S1 relaxation
involves a possible dark intermediate state, which was proposed to be either a separate electronic ES
or a hot ground state, populated by a nonlinear process [34]. This state was termed the S* state [35].
The S2-state does not have a significant excited state absorption (ESA) due to a short lifetime
[36]. The decay of the associated strong negative ground state bleach (GSB) at the pump wavelength
for an excited sample set, enables the estimation of the S2 lifetime through an increased ESA around
550 nm [37]. Hence, it is necessary to exploit the structure and amplitude of the ESA of S2. One way
to examine this is to excite a sample at various wavelengths, and then probe an intensity dependence
of the PP signal, using a white light source [29]. A similar approach is followed for the experiments on
LHCII in this dissertation.
The lifetime of singlet excited states depends on the number of conjugated bonds, and can be
in the order of ~1 ps to ~100 ps for the S2-state [29, 38, 39]. The S1-state is populated via internal
conversion (IC) from higher electronic states, such as S2, with further IC decay to S0 [29, 38, 39].
These processes are explained and illustrated in Chapter 3 and Figure 3-1.
From experimental evidence we can conclude that Lut Cars display singlet excitation ET
solely to Chl a [35]. This contributes to the large Chl a peak in the absorption spectrum seen in Figure
2-8. Meanwhile, Chl b receives most of its energy from the Neo Car [24, 40]. The Xanthophyll cycle
(see 2.5.1) consists of two (or more) Cars that assist in the regulation of energy flow between the
antenna and a PSII RC as part of photoprotection against high light (bright) conditions. Finally, most
of the Car excitation energy is transferred to Chl a pigments.
Chapter 2 Basic principles of Photosynthesis
Page 13 of 74
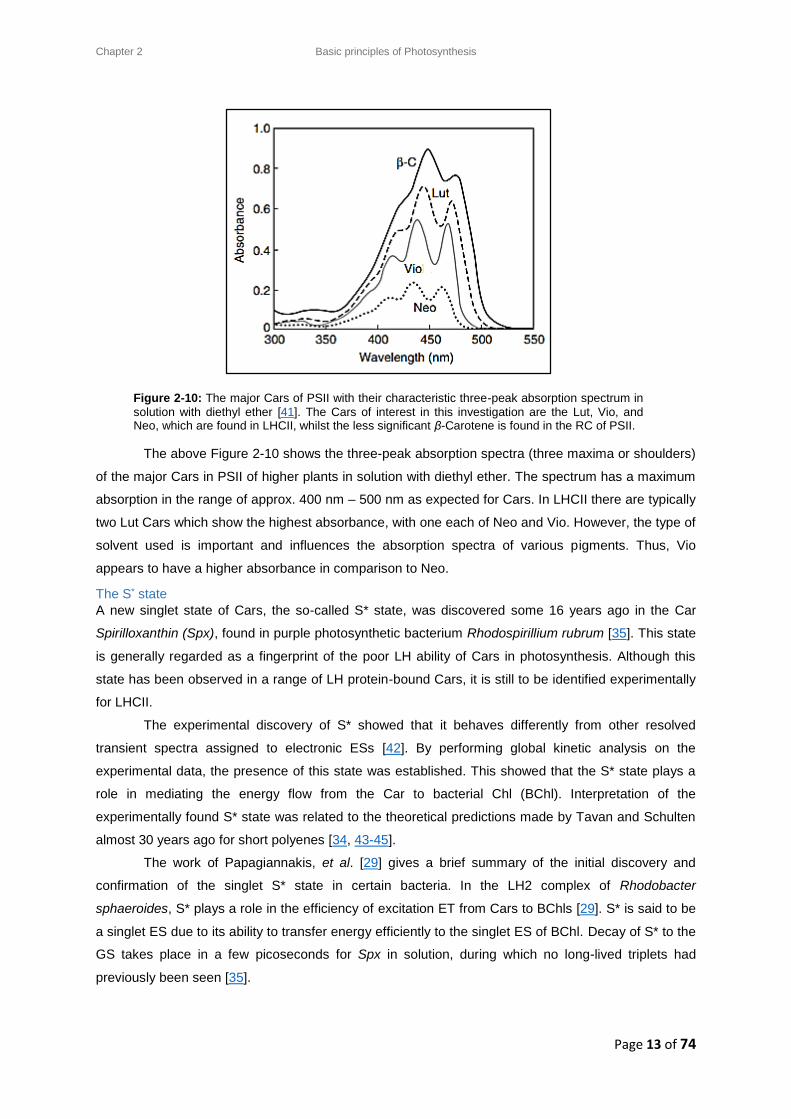
The above Figure 2-10 shows the three-peak absorption spectra (three maxima or shoulders)
of the major Cars in PSII of higher plants in solution with diethyl ether. The spectrum has a maximum
absorption in the range of approx. 400 nm – 500 nm as expected for Cars. In LHCII there are typically
two Lut Cars which show the highest absorbance, with one each of Neo and Vio. However, the type of
solvent used is important and influences the absorption spectra of various pigments. Thus, Vio
appears to have a higher absorbance in comparison to Neo.
The S* state
A new singlet state of Cars, the so-called S* state, was discovered some 16 years ago in the Car
Spirilloxanthin (Spx), found in purple photosynthetic bacterium Rhodospirillium rubrum [35]. This state
is generally regarded as a fingerprint of the poor LH ability of Cars in photosynthesis. Although this
state has been observed in a range of LH protein-bound Cars, it is still to be identified experimentally
for LHCII.
The experimental discovery of S* showed that it behaves differently from other resolved
transient spectra assigned to electronic ESs [42]. By performing global kinetic analysis on the
experimental data, the presence of this state was established. This showed that the S* state plays a
role in mediating the energy flow from the Car to bacterial Chl (BChl). Interpretation of the
experimentally found S* state was related to the theoretical predictions made by Tavan and Schulten
almost 30 years ago for short polyenes [34, 43-45].
The work of Papagiannakis, et al. [29] gives a brief summary of the initial discovery and
confirmation of the singlet S* state in certain bacteria. In the LH2 complex of Rhodobacter
sphaeroides, S* plays a role in the efficiency of excitation ET from Cars to BChls [29]. S* is said to be
a singlet ES due to its ability to transfer energy efficiently to the singlet ES of BChl. Decay of S* to the
GS takes place in a few picoseconds for Spx in solution, during which no long-lived triplets had
previously been seen [35].
Figure 2-10: The major Cars of PSII with their characteristic three-peak absorption spectrum in
solution with diethyl ether [41]. The Cars of interest in this investigation are the Lut, Vio, and Neo, which are found in LHCII, whilst the less significant β-Carotene is found in the RC of PSII.
Chapter 2 Basic principles of Photosynthesis
Page 14 of 74
From dispersed PP measurements, the work reported by Gradinaru, et al. [35], exhibited
distinct spectral and temporal characteristics of S1. This enabled the discovery and identification of the
S* state as a singlet ES of Spx in hexane, in the LH1 complex of Rhodospirillium rubrum [29].
Following this, Papagiannakis, et al. [46] found the presence of S* in spheroidene, which was bound
within the LH2 complex of Rhodobacter sphaeroides [29]. In 2003, Wohlleben, et al. [47] reportedly
observed the S* state in the LH2 complex of Rhodopseudomonas acidophila [29].
The three investigations above modelled the S* state as being a direct result of the S2
relaxation, populating in parallel with the S1-state [29]. It was assumed that S* was an originator in
generating Car triplet ES, possibly via an intramolecular singlet-fission process [29] [43, 44, 48]. Apart
from PP spectroscopic experiments, other methods exist to study the S* state. Of late, Kloz, et al. [49]
made use of an improved version of the Femtosecond Stimulated Raman Spectroscopy (FSRS)
technique to resolve the nature of S* in Spx [49].
2.5. Non-Photochemical Quenching (NPQ) Photosynthetic organisms are designed to function optimally under conditions of low solar radiation. In
the event of the incident irradiation being too high and if the amount of absorbed and utilized energy is
not efficiently regulated, it can lead to the fatality of the plant. A substantially inefficient thermal energy
dissipation leads to a large loss of energy, which becomes unusable by photosynthetic organisms,
accounting for the drop in quantum efficiency of energy conversion into biomass. The process of Non-
Photochemical Quenching (NPQ) enables photosynthetic organisms to protect themselves from high-
light stress by dissipating excess absorbed energy as heat [50]. NPQ is a combination of three
stages, viz. qE, qT, and qI, which represent energy-dependent quenching (within sub-seconds to tens
of seconds), state transitions (within tens of minutes), and photoinhibition quenching (a few hours to
days), respectively.
The qE process of NPQ is activated when energy reaches the RC at a faster rate than the
rate at which it is depleted by the electron-transfer chain that connects PSII and PSI for reducing
NADP+ [51]. As a result, the pH of the lumen decreases, and the transmembrane pH gradient across
the thylakoid membrane activates the Zea-dependent qE component of NPQ [31, 51]. This leads to
the rapid, reversible switching between Cars, and their respective functions, triggered by an enzyme
as part of the Xanthophyll cycle (see 2.5.1) [31].
The S1 and S* populations of the Cars in LHCII aggregates (which are known to be strongly
quenched) can be expected to provide information for the identification and characterization of
another potential energy pathway with relation to NPQ [52]. To induce quenching, LHCII trimers can
be incubated with bio-beads – resins that gradually absorb detergent molecules. This leads to a
controlled aggregation of LHCII. This process is slow and can be monitored by continuous
fluorescence yield measurements (which requires a fluorimeter). Another explored avenue is to
induce aggregation by varying the detergent concentration. At low detergent concentrations,
spontaneous aggregation occurs, yielding manageable levels of protein aggregation [53]. This is
below the critical micelle concentration (CMC), preventing the formation of large, and highly scattered
lamellae of LHCII (i.e. one reason is averting the formation of monomers).
Chapter 2 Basic principles of Photosynthesis
Page 15 of 74
Identification and characterization of the NPQ quencher(s) in the PSII antenna are still of high
priority in the contemporary multidisciplinary research of photosynthetic LH [54]. In particular, the role
of Cars is still inconclusive [50, 54]. Under ideal conditions such as low light, these primary processes
occur with a quantum efficiency of approximately one [55]. An important mechanism is the quenching
of harmful Chl triplets by Cars; a second mechanism switches the LH antenna between a “light” and a
“dark” stage.
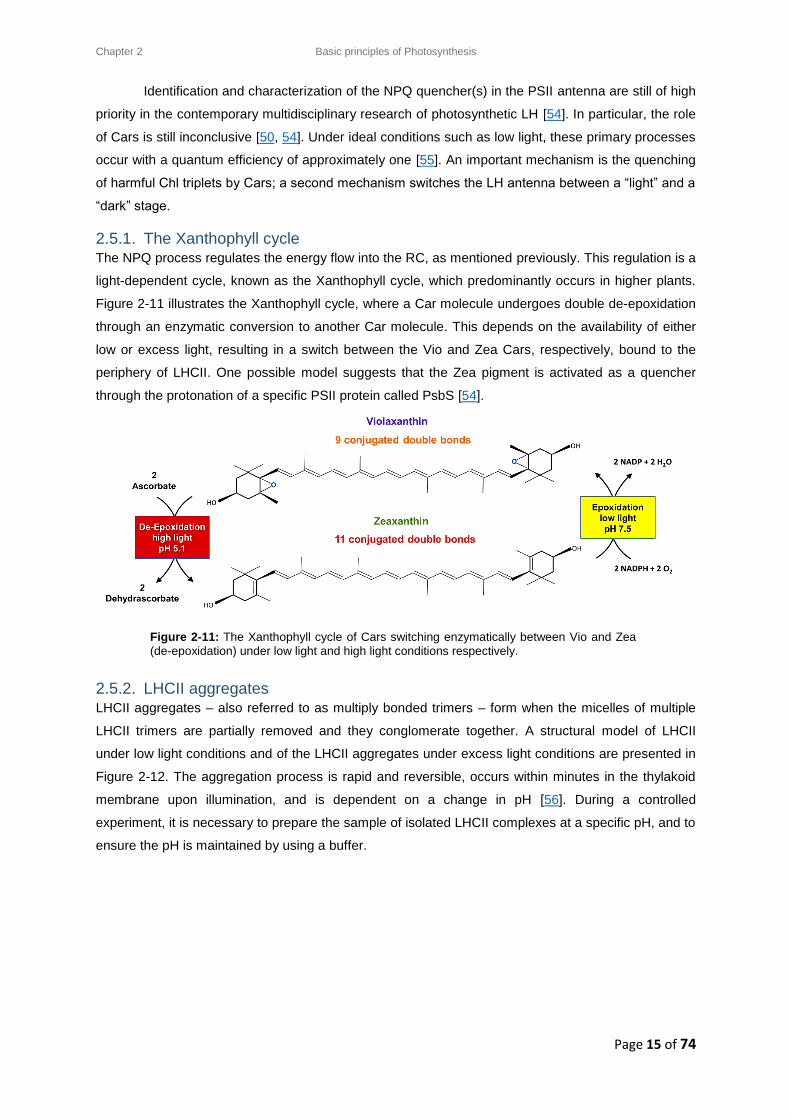
2.5.1. The Xanthophyll cycle The NPQ process regulates the energy flow into the RC, as mentioned previously. This regulation is a
light-dependent cycle, known as the Xanthophyll cycle, which predominantly occurs in higher plants.
Figure 2-11 illustrates the Xanthophyll cycle, where a Car molecule undergoes double de-epoxidation
through an enzymatic conversion to another Car molecule. This depends on the availability of either
low or excess light, resulting in a switch between the Vio and Zea Cars, respectively, bound to the
periphery of LHCII. One possible model suggests that the Zea pigment is activated as a quencher
through the protonation of a specific PSII protein called PsbS [54].
Figure 2-11: The Xanthophyll cycle of Cars switching enzymatically between Vio and Zea
(de-epoxidation) under low light and high light conditions respectively.
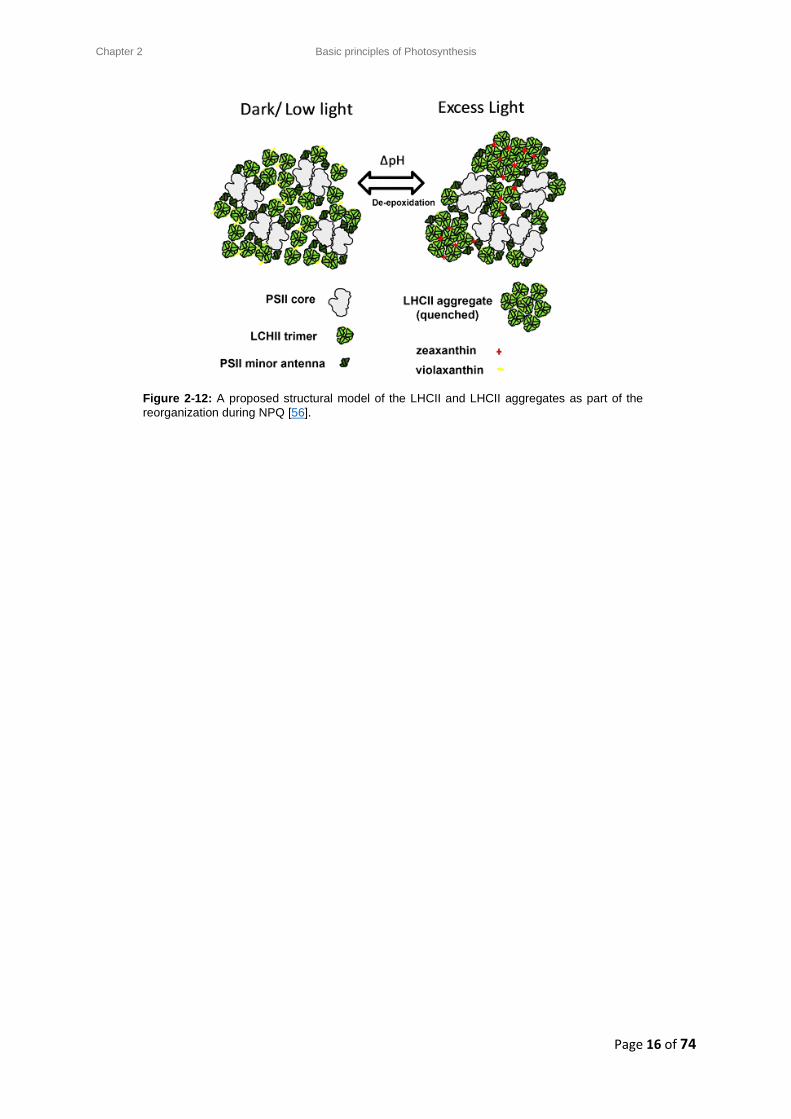
2.5.2. LHCII aggregates LHCII aggregates – also referred to as multiply bonded trimers – form when the micelles of multiple
LHCII trimers are partially removed and they conglomerate together. A structural model of LHCII
under low light conditions and of the LHCII aggregates under excess light conditions are presented in
Figure 2-12. The aggregation process is rapid and reversible, occurs within minutes in the thylakoid
membrane upon illumination, and is dependent on a change in pH [56]. During a controlled
experiment, it is necessary to prepare the sample of isolated LHCII complexes at a specific pH, and to
ensure the pH is maintained by using a buffer.
Chapter 2 Basic principles of Photosynthesis
Page 16 of 74
Figure 2-12: A proposed structural model of the LHCII and LHCII aggregates as part of the
reorganization during NPQ [56].
Chapter 3 Light-matter Interaction
Page 17 of 74
Chapter 3
3.1. Light-matter Interaction
Light is described as having both a wave and particle nature (this feature of light is known as its wave-
particle duality). A wave-description of light is largely sufficient to describe its propagation as an
electromagnetic (EM) wave through space – reflecting and refracting in the same manner as classical
waves. According to quantum theory, however, on an atomic level light and matter are both
composed of small particles (photons and other particles like electrons, protons, and neutrons,
respectively). This particle nature of light results in energy being radiated or absorbed in discrete
‘packages’ or quanta (called photons), where each quantum of light has a specific amount of energy
E. Both the wave and particle nature of light has to be taken into account when calculating E, since
the energy of a photon is directly proportional to the frequency, v, of the radiation that is absorbed or
irradiated. In turn, the frequency is inversely proportional to the wavelength, 𝜆, with proportionality
constants for the speed of light (c = 3 x 10⁸ m·s-1) and Planck’s constant (h = 4.14 x 10⁻¹⁵ eV·s), hence
hc = 1240 eV·nm:
𝐸 = ℎ𝑣 =ℎ𝑐
𝜆 (3-1)
The quantization of EM energy was postulated by Einstein when interpreting the photoelectric
effect back in 1905. Shortly thereafter, Bohr introduced the atomic model to the world in 1913, which
described the containment of electrons to discrete energy levels. In accordance with the principle of
the Bohr model, modern quantum chemistry considers a typical excitation event as the promotion of
an electron, from the GS to an ES (a discrete molecular orbital of higher energy) upon absorption of a
photon with energy ℎ𝑣.
Equation (3-1) is vital for understanding the basis of the light-induced photosynthetic process.
It relates the wavelength of absorbed solar photons to the energy differences between ground states
and excited states of the pigments’ electrons in the plant, and can be seen through spectral
signatures in a PP measurement.
3.2. Photophysics, photochemistry, and molecular spectroscopy
There are a number of photophysical and photochemical processes involved with the photoexcitation
of the LH apparatus in plants through EM radiation. Photophysics revolves around the absorption,
transfer, and emission of light, via various ET pathways and decay channels, and is devoid of
chemical reactions. Photochemistry refers to the chemical effects of the absorbed solar light in
changing the structure and properties of the pigment molecule
These photophysical processes are summarized by a Jablonski diagram, which illustrates the
transitions between electronic and vibrational states within a molecule. Figure 3-1 shows the
photophysical processes and ET pathways of Cars and Chls, where apart from the ET arrows, the
diagram can be viewed as two Jablonski diagrams, one for each of the LHCII pigments.
The ET pathways and photophysical processes are identified and monitored through
molecular spectroscopy, as the energy of a pigment molecule changes. An electronic state consists of
Chapter 3 Light-matter Interaction
Page 18 of 74
multiple vibrational states, each having various degrees of freedom. The concurrent change in
electronic and vibrational energy of a molecule is termed a vibronic transition.
3.2.1. Einstein coefficients The Einstein coefficients quantify the probability that a particle (an atom, molecule, or ion) will absorb
or emit a photon when interacting with EM radiation, from a source such as the sun, or a laser. There
are three basic radiative processes at defined rates that take place. These are spontaneous emission,
(stimulated) absorption, and stimulated emission (SE) [57, 58]. In photosynthetic systems, there is a
relationship between absorptivity and the ES lifetimes of photosynthetic pigments, the latter of which
is the reciprocal of the ES decay rate.
i. Singlet and triplet states Singlet states have been alluded to extensively thus far in the previous chapters. A singlet state is an
electronic state of a molecule where every electronic spin is paired and the molecule consequently
does not have a net spin angular momentum. Triplet states are electronic states which are formed by
two unpaired electrons with a total spin of 1. There are three distinct quantum states that have this
property; hence the triplet energy level has a degeneracy of three. Triplet states are particularly
important when we speak about ET between Chls and Cars. For example, a Chl triplet state transfers
energy to a Car triplet state, because the latter is always lower in energy than the former. Intersystem
crossing (ISC) is the process during which a singlet state is converted into a triplet state (TChl and TCar
in Figure 3-1), with a corresponding inversion of spin for the excited electron.
ii. Radiative and non-radiative decay When excited Chl molecules relax back to their GS, they are subject to either radiative decay or non-
radiative decay [15]. In the latter case, the excitation energy is dissipated as heat while the molecule
relaxes to a lower electronic energy state. This type of decay is termed internal conversion (IC)
between different electronic excitation states. In this process, which typically takes place on sub-
picosecond to nanosecond timescales, the molecular spin state remains unchanged and the molecule
relaxes down to the lowest ES [57]. Vibrational relaxation describes the relaxation of an electron
within an electronic state from a high vibrational energy level to a lower one, and is also a non-
radiative process, which is usually denoted by curved arrows in a Jablonski diagram [57, 58].
During the process of radiative decay, an excited singlet or triplet state decays spontaneously
to a lower electronic level with the same spin multiplicity, emitting a photon through fluorescence (Fl).
Fl of a pigment takes place from a singlet ES on the picosecond to nanosecond timescale, whilst
phosphorescence (Phos) follows from the triplet ES and is slower than Fl. Excited state absorption
(ESA) explains the further excitation from lower electronic excited states (e.g. S1 ) of a molecule, to
higher states (SN, for N = 2, 4, 5,…).
Chapter 3 Light-matter Interaction
Page 19 of 74
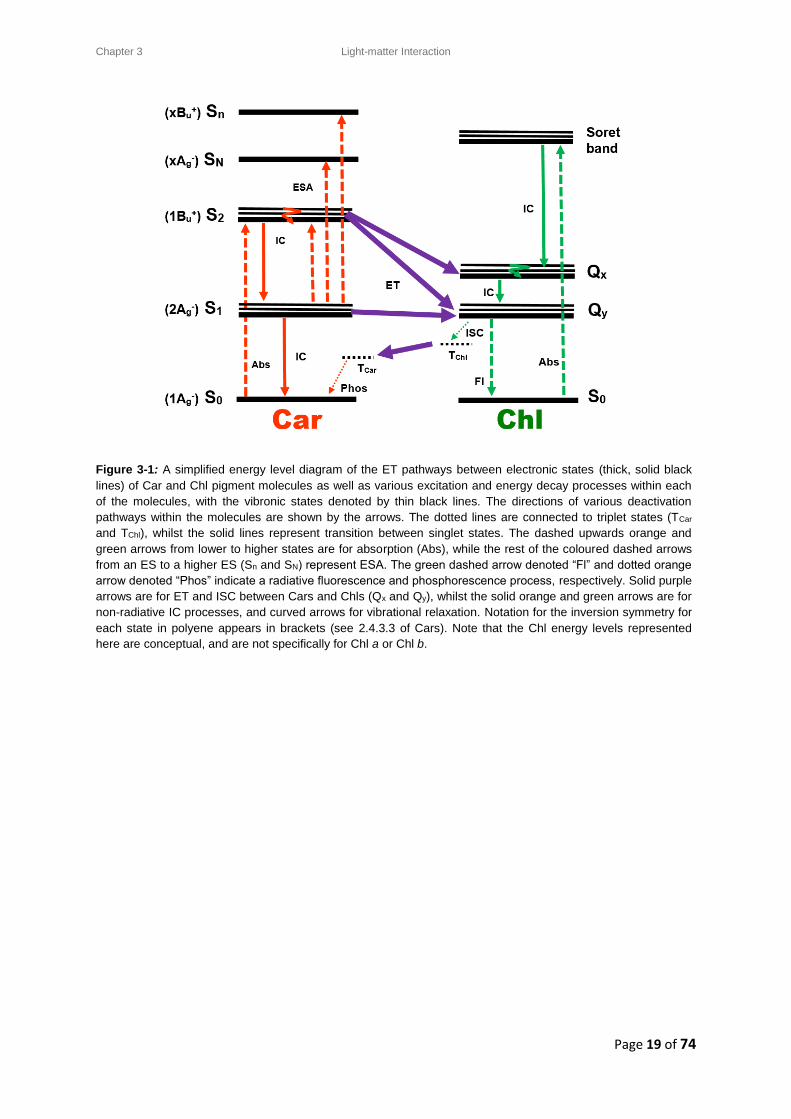
Figure 3-1: A simplified energy level diagram of the ET pathways between electronic states (thick, solid black
lines) of Car and Chl pigment molecules as well as various excitation and energy decay processes within each
of the molecules, with the vibronic states denoted by thin black lines. The directions of various deactivation
pathways within the molecules are shown by the arrows. The dotted lines are connected to triplet states (TCar
and TChl), whilst the solid lines represent transition between singlet states. The dashed upwards orange and
green arrows from lower to higher states are for absorption (Abs), while the rest of the coloured dashed arrows
from an ES to a higher ES (Sn and SN) represent ESA. The green dashed arrow denoted “Fl” and dotted orange
arrow denoted “Phos” indicate a radiative fluorescence and phosphorescence process, respectively. Solid purple
arrows are for ET and ISC between Cars and Chls (Qx and Qy), whilst the solid orange and green arrows are for
non-radiative IC processes, and curved arrows for vibrational relaxation. Notation for the inversion symmetry for
each state in polyene appears in brackets (see 2.4.3.3 of Cars). Note that the Chl energy levels represented
here are conceptual, and are not specifically for Chl a or Chl b.
Chapter 3 Light-matter Interaction
Page 20 of 74
3.3. The exciton concept
i. The Förster-Redfield theory The Förster theory and Redfield theory are often used to describe the ET that occurs amongst
pigments, and are distinguished by the type of coupling (weak and strong, respectively) between the
pigments. Förster theory underlies the Förster resonant energy transfer (FRET) mechanism which is a
nonradiative resonance transfer process between individual pigments, as illustrated in Figure 2-2. The
Förster theory describes the case of pigments being weakly coupled to each other with their own
localized ES wave function, and strong coupling to the phonon bath. Excitation energy dissipates as
heat caused by a collection of vibrations known as the phonon bath. In the Förster framework, energy
is transferred in a hopping-like manner among pigments, because of the weak coupling between
them. In the case of strongly coupled pigments, excitation energy is coherently shared among the
coupled pigments. Such a coherent, or delocalized, excitation of pigments is termed an exciton. The
delocalized ES of an exciton can be described as a linear combination of the ES’s of individual
pigments. Redfield theory explains the wavelike transfer of excitation among exciton states. In
photosynthetic LH complexes, couplings between pigment-protein molecules are comparable to
coupling with the bath. This means that both Redfield theory and Förster theory fail. ET can be
explained more realistically by the generalized Förster theory, which explains ET between delocalized
Redfield-like ES’s as Förster-like hopping [13].
Chapter 4 Femtosecond (fs) laser spectroscopy and Transient Absorption (TA) spectroscopy
Page 21 of 74
Chapter 4
4. Femtosecond (fs) laser spectroscopy
Molecules can be studied on exceptionally short timescales (i.e., femtoseconds to picoseconds), by
making use of ultrafast laser spectroscopic techniques. Ultrafast laser spectroscopy is typically used
to investigate the details of ET dynamics of LHCII light-absorbing molecules (pigments). This chapter
provides a brief introduction to ultrafast transient absorption (TA) spectroscopy.
4.1. Singlet-singlet annihilation
An intense femtosecond laser pulse may simultaneously excite several pigments in a photosynthetic
complex [59, 60]. These excitations can be annihilated through two possible processes: singlet-singlet
annihilation, or singlet-triplet annihilation. Singlet-singlet annihilation leads to the disappearance of
either one or both excited states, as demonstrated through equation (4-1) [59]
In the annihilation process of LHCII, only the Chl a excitation is considered significant, due to a lower
probability of two excitations meeting before both are transferred to Chl Qy. Furthermore, the energy is
transferred from the Xanthophylls to Chl a, and Chl b to Chl a [59]. The excitation ET process is both
fast and unidirectional, making it difficult to monitor multiple pigments.
The laser pulse photon density influences the pigment excitation rate and hence the
probability of singlet-singlet annihilation during a TA experiment. An average number of excited Chl a
molecules per LHCII trimer per pulse can be calculated from the ratio of optical density and excited
pigment transient [61]. Subsequently, the annihilation probability can be calculated for the complex.
These calculations will be explained in section 8.5. It should be noted that these calculated values
may not be precise, due to limitation of the direction of the incident light, relative focal beam spot
sizes, beam quality and intensity, as well as other sample and experimental parameters [61].
4.2. Bandwidth versus femtosecond pulse width
Ultrashort pulses (picosecond timescale and below) have a large bandwidth, which is inversely
related to the pulse duration. These pulses can be described by Gaussian functions, where the pulse
duration is the Full-Width at Half-Maximum (FWHM) (𝜏) of a typical spectral band. This optical
bandwidth is defined in terms of frequency (v), or wavelength (λ), originating from the relationship:
∆𝑣 = 𝑐
𝜆2∆𝜆 (4-2)
The Heisenberg uncertainty principle proposes that canonical variables, like E and t, have an
uncertainty in their product, which is an infimum to which smaller values cannot be determined, and is
related to Planck’s constant by
∆𝐸∆𝑡 ≈ ħ (4-3)
𝑆1 + 𝑆1𝛾→ 𝑆1 + 𝑆0
(4-1)
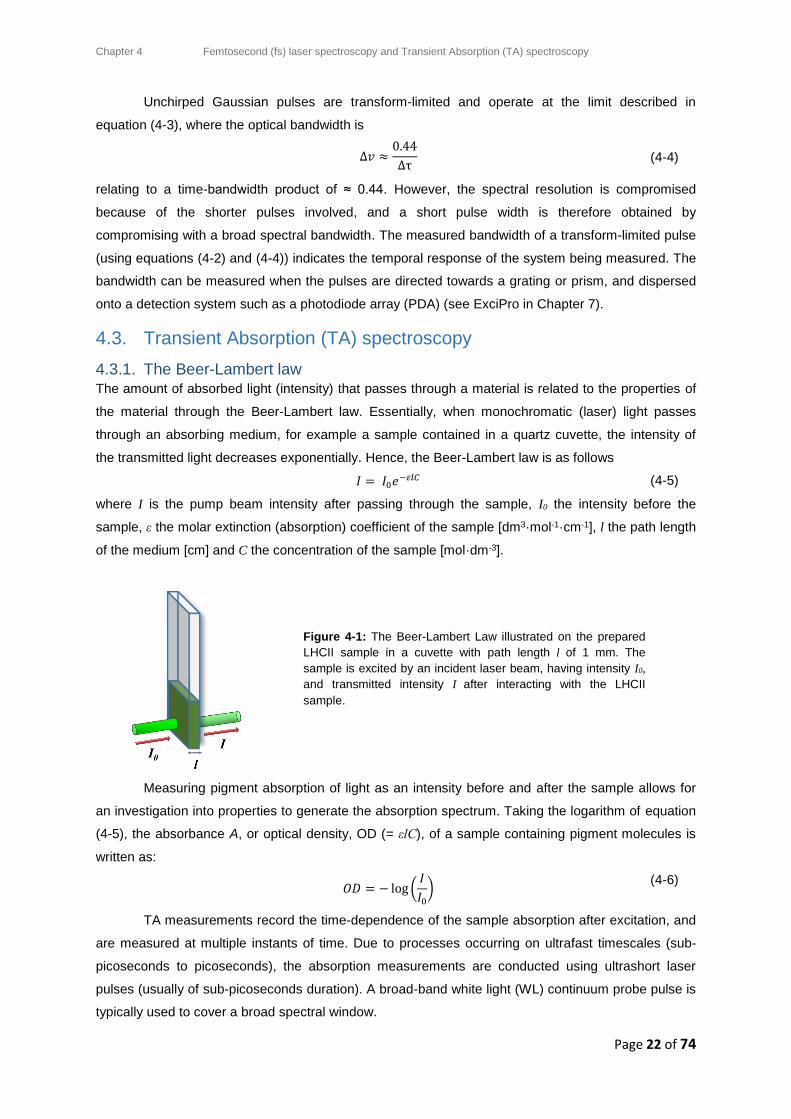
Chapter 4 Femtosecond (fs) laser spectroscopy and Transient Absorption (TA) spectroscopy
Page 22 of 74
Unchirped Gaussian pulses are transform-limited and operate at the limit described in
equation (4-3), where the optical bandwidth is
∆𝑣 ≈
0.44
∆τ (4-4)
relating to a time-bandwidth product of ≈ 0.44. However, the spectral resolution is compromised
because of the shorter pulses involved, and a short pulse width is therefore obtained by
compromising with a broad spectral bandwidth. The measured bandwidth of a transform-limited pulse
(using equations (4-2) and (4-4)) indicates the temporal response of the system being measured. The
bandwidth can be measured when the pulses are directed towards a grating or prism, and dispersed
onto a detection system such as a photodiode array (PDA) (see ExciPro in Chapter 7).
4.3. Transient Absorption (TA) spectroscopy
4.3.1. The Beer-Lambert law The amount of absorbed light (intensity) that passes through a material is related to the properties of
the material through the Beer-Lambert law. Essentially, when monochromatic (laser) light passes
through an absorbing medium, for example a sample contained in a quartz cuvette, the intensity of
the transmitted light decreases exponentially. Hence, the Beer-Lambert law is as follows
𝐼 = 𝐼0𝑒−𝜀𝑙𝐶 (4-5)
where I is the pump beam intensity after passing through the sample, I0 the intensity before the
sample, ε the molar extinction (absorption) coefficient of the sample [dm3·mol-1·cm-1], l the path length
of the medium [cm] and C the concentration of the sample [mol·dm-3].
Figure 4-1: The Beer-Lambert Law illustrated on the prepared
LHCII sample in a cuvette with path length l of 1 mm. The
sample is excited by an incident laser beam, having intensity I0,
and transmitted intensity I after interacting with the LHCII
sample.
Measuring pigment absorption of light as an intensity before and after the sample allows for
an investigation into properties to generate the absorption spectrum. Taking the logarithm of equation
(4-5), the absorbance A, or optical density, OD (= εlC), of a sample containing pigment molecules is
written as:
𝑂𝐷 = − log (
𝐼
𝐼0)
(4-6)
TA measurements record the time-dependence of the sample absorption after excitation, and
are measured at multiple instants of time. Due to processes occurring on ultrafast timescales (sub-
picoseconds to picoseconds), the absorption measurements are conducted using ultrashort laser
pulses (usually of sub-picoseconds duration). A broad-band white light (WL) continuum probe pulse is
typically used to cover a broad spectral window.
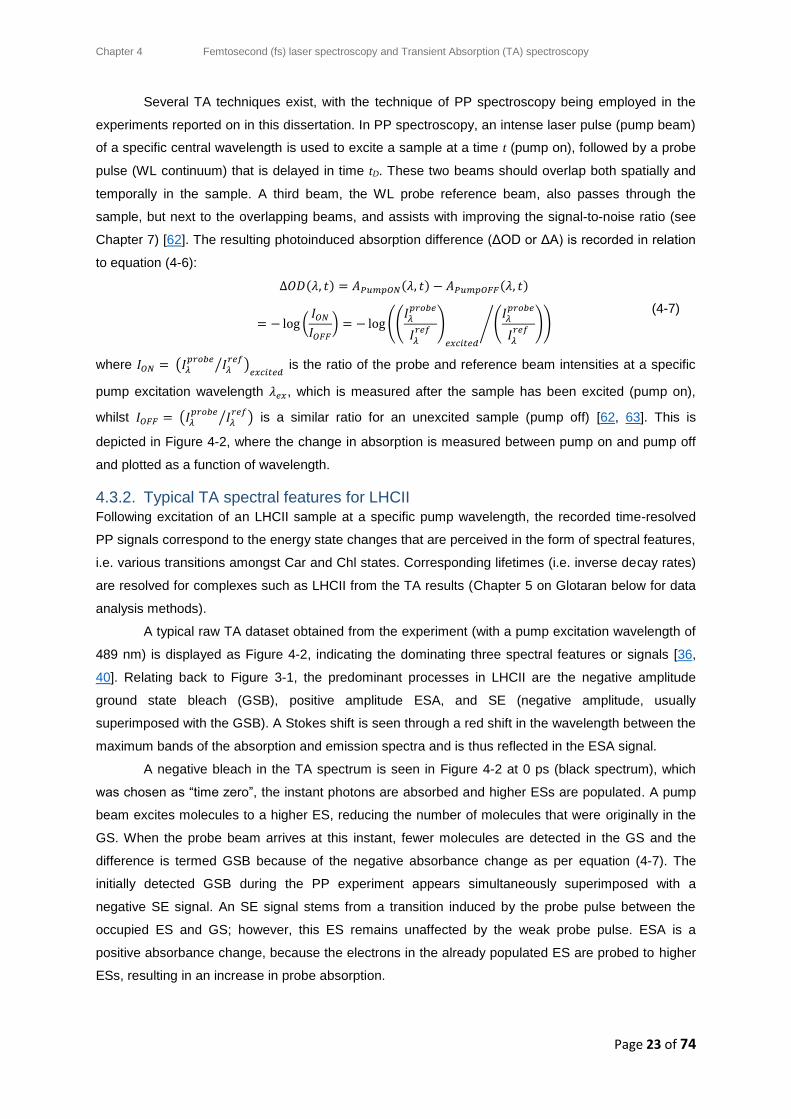
Chapter 4 Femtosecond (fs) laser spectroscopy and Transient Absorption (TA) spectroscopy
Page 23 of 74
Several TA techniques exist, with the technique of PP spectroscopy being employed in the
experiments reported on in this dissertation. In PP spectroscopy, an intense laser pulse (pump beam)
of a specific central wavelength is used to excite a sample at a time t (pump on), followed by a probe
pulse (WL continuum) that is delayed in time tD. These two beams should overlap both spatially and
temporally in the sample. A third beam, the WL probe reference beam, also passes through the
sample, but next to the overlapping beams, and assists with improving the signal-to-noise ratio (see
Chapter 7) [62]. The resulting photoinduced absorption difference (ΔOD or ΔA) is recorded in relation
to equation (4-6):
∆𝑂𝐷(𝜆, 𝑡) = 𝐴𝑃𝑢𝑚𝑝𝑂𝑁(𝜆, 𝑡) − 𝐴𝑃𝑢𝑚𝑝𝑂𝐹𝐹(𝜆, 𝑡)
= − log (𝐼𝑂𝑁𝐼𝑂𝐹𝐹
) = − log ((𝐼𝜆𝑝𝑟𝑜𝑏𝑒
𝐼𝜆𝑟𝑒𝑓
)
𝑒𝑥𝑐𝑖𝑡𝑒𝑑
(𝐼𝜆𝑝𝑟𝑜𝑏𝑒
𝐼𝜆𝑟𝑒𝑓
)⁄ )
(4-7)
where 𝐼𝑂𝑁 = (𝐼𝜆𝑝𝑟𝑜𝑏𝑒
𝐼𝜆𝑟𝑒𝑓
⁄ )𝑒𝑥𝑐𝑖𝑡𝑒𝑑
is the ratio of the probe and reference beam intensities at a specific
pump excitation wavelength 𝜆𝑒𝑥, which is measured after the sample has been excited (pump on),
whilst 𝐼𝑂𝐹𝐹 = (𝐼𝜆𝑝𝑟𝑜𝑏𝑒
𝐼𝜆𝑟𝑒𝑓
⁄ ) is a similar ratio for an unexcited sample (pump off) [62, 63]. This is
depicted in Figure 4-2, where the change in absorption is measured between pump on and pump off
and plotted as a function of wavelength.
4.3.2. Typical TA spectral features for LHCII Following excitation of an LHCII sample at a specific pump wavelength, the recorded time-resolved
PP signals correspond to the energy state changes that are perceived in the form of spectral features,
i.e. various transitions amongst Car and Chl states. Corresponding lifetimes (i.e. inverse decay rates)
are resolved for complexes such as LHCII from the TA results (Chapter 5 on Glotaran below for data
analysis methods).
A typical raw TA dataset obtained from the experiment (with a pump excitation wavelength of
489 nm) is displayed as Figure 4-2, indicating the dominating three spectral features or signals [36,
40]. Relating back to Figure 3-1, the predominant processes in LHCII are the negative amplitude
ground state bleach (GSB), positive amplitude ESA, and SE (negative amplitude, usually
superimposed with the GSB). A Stokes shift is seen through a red shift in the wavelength between the
maximum bands of the absorption and emission spectra and is thus reflected in the ESA signal.
A negative bleach in the TA spectrum is seen in Figure 4-2 at 0 ps (black spectrum), which
was chosen as “time zero”, the instant photons are absorbed and higher ESs are populated. A pump
beam excites molecules to a higher ES, reducing the number of molecules that were originally in the
GS. When the probe beam arrives at this instant, fewer molecules are detected in the GS and the
difference is termed GSB because of the negative absorbance change as per equation (4-7). The
initially detected GSB during the PP experiment appears simultaneously superimposed with a
negative SE signal. An SE signal stems from a transition induced by the probe pulse between the
occupied ES and GS; however, this ES remains unaffected by the weak probe pulse. ESA is a
positive absorbance change, because the electrons in the already populated ES are probed to higher
ESs, resulting in an increase in probe absorption.
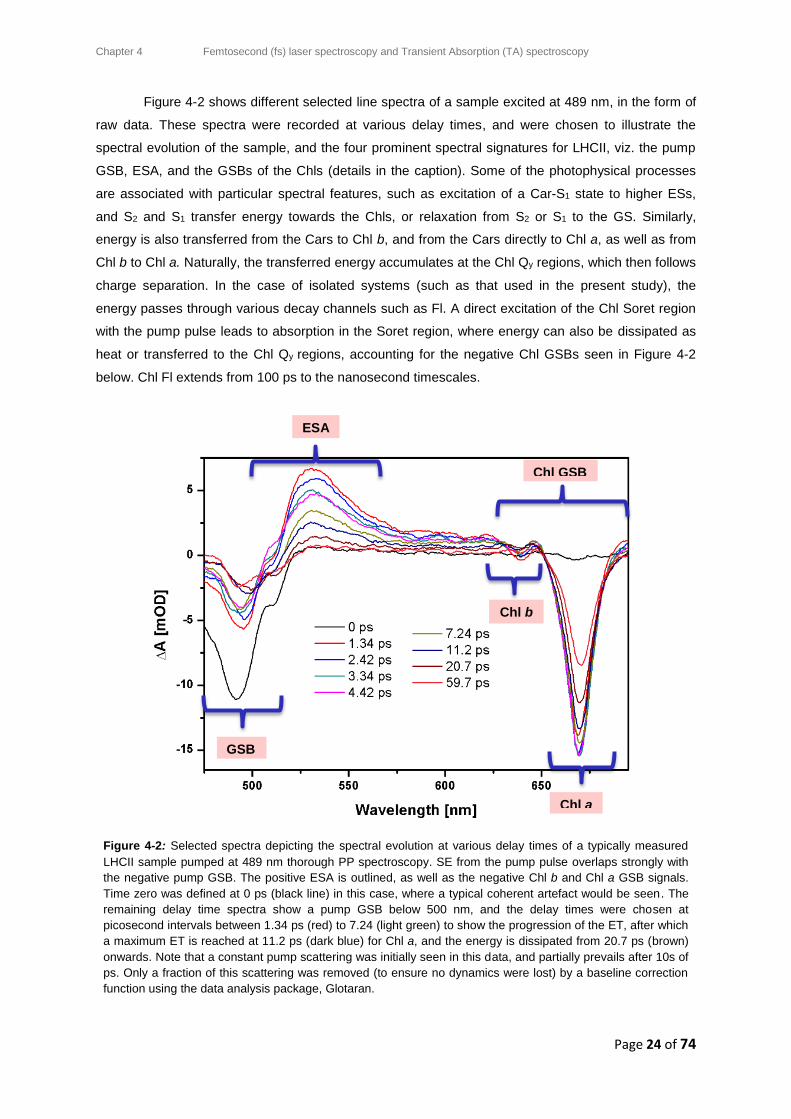
Chapter 4 Femtosecond (fs) laser spectroscopy and Transient Absorption (TA) spectroscopy
Page 24 of 74
Figure 4-2 shows different selected line spectra of a sample excited at 489 nm, in the form of
raw data. These spectra were recorded at various delay times, and were chosen to illustrate the
spectral evolution of the sample, and the four prominent spectral signatures for LHCII, viz. the pump
GSB, ESA, and the GSBs of the Chls (details in the caption). Some of the photophysical processes
are associated with particular spectral features, such as excitation of a Car-S1 state to higher ESs,
and S2 and S1 transfer energy towards the Chls, or relaxation from S2 or S1 to the GS. Similarly,
energy is also transferred from the Cars to Chl b, and from the Cars directly to Chl a, as well as from
Chl b to Chl a. Naturally, the transferred energy accumulates at the Chl Qy regions, which then follows
charge separation. In the case of isolated systems (such as that used in the present study), the
energy passes through various decay channels such as Fl. A direct excitation of the Chl Soret region
with the pump pulse leads to absorption in the Soret region, where energy can also be dissipated as
heat or transferred to the Chl Qy regions, accounting for the negative Chl GSBs seen in Figure 4-2
below. Chl Fl extends from 100 ps to the nanosecond timescales.
Figure 4-2: Selected spectra depicting the spectral evolution at various delay times of a typically measured
LHCII sample pumped at 489 nm thorough PP spectroscopy. SE from the pump pulse overlaps strongly with
the negative pump GSB. The positive ESA is outlined, as well as the negative Chl b and Chl a GSB signals.
Time zero was defined at 0 ps (black line) in this case, where a typical coherent artefact would be seen. The
remaining delay time spectra show a pump GSB below 500 nm, and the delay times were chosen at
picosecond intervals between 1.34 ps (red) to 7.24 (light green) to show the progression of the ET, after which
a maximum ET is reached at 11.2 ps (dark blue) for Chl a, and the energy is dissipated from 20.7 ps (brown)
onwards. Note that a constant pump scattering was initially seen in this data, and partially prevails after 10s of
ps. Only a fraction of this scattering was removed (to ensure no dynamics were lost) by a baseline correction
function using the data analysis package, Glotaran.
GSB
ESA
Chl GSB
Chl b
Chl a
Chapter 5 Data analysis: Glotaran for Global and Target analysis
Page 25 of 74
Chapter 5
5. Data analysis: Glotaran for Global and Target analysis
5.1. Data analysis for biophysics experiments
The vast field of Biophysics incorporates the disciplines of physics, biology, and chemistry, as well as
mathematical and computational modelling. A combination of these fields are simultaneously applied
in order to obtain a detailed understanding of the biological system in question. Investigations into
biological systems give insight into the fundamental structure, dynamics, interaction, and functioning
of these systems and their surroundings.
Many experimental techniques exist to study the internal (molecular) and external
(environmental) interactions of biological structures. Spectroscopic measurement techniques are
particularly useful to decipher the complex mechanisms that underlie the behaviour of bio-molecular
systems. These spectroscopic measurements can be classified as steady-state (e.g., time-averaged
absorption, fluorescence, etc.) and time-resolved (e.g., ultrafast spectroscopy). Time-resolved
spectroscopic data typically consists of a three-dimensional dataset: absorption difference intensity as
a function of the wavelength 𝜆, and delay time t.
Due to the complexity of ultrafast time-resolved data, custom data analysis procedures are
needed to process the raw data, and interpret the various photophysical and photochemical dynamics
involved. From a typical ultrafast TA PP experiment, a large number (i.e., thousands on average) of
individual data points are collected per recorded spectrum. Various data analysis methods exist for
this type of large data, ranging from simple to complex approaches for deconvolution of the time
dependent spectral signatures, based on the nature of the sample being investigated. One
sophisticated data analysis method which involves coupled rate equations, is the global analysis
technique (section 5.3), whilst target analysis (explained in section 5.4) is another dedicated
technique for detailed system studies. Global analysis is supposedly the best analysis technique for
complex time-resolved experiments of this nature, because it accommodates for a broad spectrum of
possibilities and does not require any prior knowledge of the sample [64]. It caters for both analysis of
an entire dataset, as well as the simultaneous analysis of multiple datasets (e.g., when
measurements appear in two separate spectral windows – i.e. red and blue spectral regions when
there are spectral window limitations), to obtain a general understanding of a system in question, such
as LHCII trimers [65]. Glotaran is one such advanced, open-source software for data analysis.
5.2. What is Glotaran?
Glotaran is an acronym for “Global and Target Analysis”, which is an open-source software routine,
containing a Java-based GUI4 that runs on the problem-solving environment of TIMP5 [37, 45]. Time-
resolved spectra can be modelled and analysed through this data analysis software routine [37, 45].
The Glotaran package makes use of superposition models to fit multi-dimensional data, where some
of these experimental variables include the sample pH, temperature, excitation wavelength and
4 GUI: A Graphical User Interface enables the user to interact with an electronic device through graphical representations 5 TIMP is an R-package that fits superposition models in the “R” statistical programming language
Chapter 5 Data analysis: Glotaran for Global and Target analysis
Page 26 of 74
quencher concentration [37]. The modelling is based on the assumption that the data is
homogeneous, meaning that the data can be described by a single, discrete set of separable
parameters, and that the data can be associated with the superposition of the spectroscopic
properties of the individual components. This superposition principle is modelled as follows:
𝛹(𝜆, 𝑡) = ∑ 𝜑𝑙(𝜆)𝑐𝑙(𝑡) + 𝑣(𝜆)
𝑛𝑐𝑜𝑚𝑝
𝑙=1
(5-1)
where the measured spectral data, 𝛹(𝜆, 𝑡), is a function of 𝜆 [nm] (horizontal axis), and t [ps] (vertical
axis), arising from an overlap of the spectral properties 𝜑𝑙(𝜆) of the components in the system for the
l-th unknown component, weighted by their concentration 𝑐𝑙(𝑡), (the latter of which includes a
convolution with the Instrument Response Function (IRF)), and the additive normal Gaussian
distributed noise in the system 𝑣(𝜆) [66].
The Instrument Response Function (IRF) describes the instrument’s response to (detection
of) the intricate, convoluted shape of a short laser pulse with a specific energy [64]. In PP
spectroscopy, the convoluted Gaussian probe pulse at FWHM of a particular wavelength should
ideally be shorter than the minimal timescale of the measurements [66, 67]. Hence, the fastest
noticeable response of a system under investigation is limited either by the IRF, or by the probe pulse
duration for a specific wavelength, depending on which is shorter [64]. The WL beam is chirped, and
is hence broader in time. For this reason, it is necessary to know the temporal resolution of the WL,
which can be done by considering the pulse duration separately for each wavelength. The IRF of the
setup includes the WL pulse duration, and is determined through the global data analysis process of
Glotaran, without requiring any user involvement.
Glotaran differs from multi-exponential decay analysis methods, with the advantages of being
more robust and powerful; its interactive GUI (see below) and integration of multiple modules (by
allowing analysis of multiple datasets); as well as being able to couple rate equations and
visualization of data. Bi-exponential decay analysis methods and other global analysis techniques
incorporating a problem-solving environment for fitting separable nonlinear models to measurements,
were mainly used for analysing the process lifetimes in the past. Glotaran provides a diversified and
advanced platform for multiple analysis methods to extract various forms of information from a
system.
Both the coherent artefact and IRF values are incorporated into Glotaran through built-in
functions and do not require any user input [37]. Furthermore, the WL chirp of the dataset is corrected
automatically during the analysis process. Glotaran, unlike most other analysis routines, caters for
pre-processing options to be performed on a single (or multiple) dataset(s). These interactive
modelling options include resampling, averaging, baseline correction (to subtract the spectra or time
trace as background, or a constant background such as the pump scattering), singular value
decomposition (SVD) analysis, etc.
The anisotropic behaviour of a sample under investigation will depend on the external
conditions it is exposed to. It is thus difficult to focus on an isotropic property of a sample, which will
Chapter 5 Data analysis: Glotaran for Global and Target analysis
Page 27 of 74
behave as a uniformly pure species6. This requires advanced techniques such as target analysis
(section 5.4), which deals with the deciphering of isotropic characteristics beyond the global (general)
features observed. Pure species can hence be resolved through target analysis methods, as an
addition for studying the complex kinetic schemes.
5.3. Global analysis
Global analysis is based on the superposition principle which is modelled by equation (5-1) above.
Kinetic models are used as part of global analysis to fit the experimental data with a number of mono-
exponential decays, as well as corresponding amplitudes for each component (linear combination of
states that describe the spectrum as a whole) which is described by equation (5-1) [67]. A kinetic
model (as shown in Figure 5-1) is denoted either by independently decaying components (parallel), or
by an unbranched, unidirectional scheme of compartments, or a combination of the two. In Glotaran,
one of the key assumptions of the sequential model is that each compartment of a particular model
has a longer lifetime than the preceding one. The global analysis technique uses a variable projection
to fix a least-squares fit to these models. A rate constant (inverse lifetime) is obtained for each decay
path, and the corresponding Decay Associated Difference Spectra (DADS) and Evolution Associated
Difference Spectra (EADS) are obtained. DADS describe the amplitudes related to the exponential
decays for difference absorption spectroscopy, and is the simplest kinetic scheme where each
component decays independently, i.e. for a parallel decay scheme [67]. EADS is based on a
sequential decay scheme and estimates the average state of the system as it advances in time, giving
a representation of the absolute, temporal spectral evolution of a mixed or general molecular state
that is physically indistinguishable by the system behaviour [67].
The singular value decomposition (SVD) of a dataset is the primary parameter to take into
account for data modelling, and is a significant mathematical tool used in global analysis [37, 67]. An
SVD is used to decompose a large data matrix, in order to represent the data in the form of n
components. The results of an SVD assist in determining the smallest number of components, as
linearly independent vectors required for adequate fitting of the experimental data. SVD has two parts:
the left singular value (LSV), which represents the temporal residuals (time traces), and the right
singular value (RSV) for describing the spectral residuals of the fitted data of a specific model. The
amplitudes of the LSV decomposition indicate starting values for the EADS kinetic parameter model in
accordance with timescales of the processes being investigated. LSV decomposition assists in
eliminating the number of linearly independent components in a data set, for easy detection of noisy
regions and potential outliers in the data. This can further be used to assess the preciseness and
quality of a fit after analysis by checking for residual structure, and as a guide to determine the need
for additional modelling of components (see Chapter 8, Figure 8-7 for a typical SVD graph).
A number of compartments, which are all interconnected via linear rate kinetics k, are used to
describe the data, where each compartment has an explicit spectral property. Coherent interaction of
femtosecond laser pulses in PP spectroscopy gives rise to a phenomenon known as coherent artefact
and affects the time domain of the results, especially within the first 100’s of femtoseconds. An
6 Pure species here does not refer to the taxonomy of plant species, but rather the nature of the sample components from analysis – i.e., investigating single isotropic features and not general behaviour of the sample or system.
Chapter 5 Data analysis: Glotaran for Global and Target analysis
Page 28 of 74
intense pump beam not only affects the photobleaching of a sample, but can also induce a time-
dependent change in the refractive index of the sample cuvette, causing a temporal change in the
spectrum and phase of the probe pulse [68]. A coherent artefact is characterized as the initial optical
response of a sample to the exciting laser radiation, and is observed as multiple obscure pulses that
are dissimilar to the expected spectral response (features) of a sample. These coherent artefact
signals are thus a result of cross-phase modulation between both the pump and probe pulses in a
liquid during TA spectroscopy [68].
After excitation, at the instant of time zero (i.e. when the first negative bleach is observed after
absorption), the excitation for a sequential model (Figure 5-1) is on compartment 1 (C1), which then
decays with rate constant k1 to compartment 2 (C2). When C2 is populated with the rate constant k1, it
is simultaneously depopulated with rate constant k2, etc. These decay constants and components,
along with the excitation pulse intensity (population of the first compartment) I(t) in equation (5-2), and
the evolution of the population of various compartments are shown in equation (5-3) as follows:
𝑑𝐶1(𝑡)
𝑑𝑡= 𝐼(𝑡) − 𝐶1(𝑡)𝑘1
(5-2)
𝑑𝐶𝑖(𝑡)
𝑑𝑡= 𝑘𝑖−1𝐶𝑖−1(𝑡) − 𝑘𝑖𝐶𝑖(𝑡) i ≠ 1 (5-3)
More compartments are used until an optimum point is reached, where additional
compartments no longer improve the quality of the fit. The analysed spectral data from this is known
as EADS, and has a sequential decay scheme, where each species (𝜏) decays into the subsequent
one. Hence, for a three-compartmental model (1, 2, 3), we consider the sequence of the scheme to
be 𝜏1 → 𝜏2 → 𝜏3.
5.4. Target analysis
Target analysis can be viewed as a narrowed, in-depth global analysis of the processes which identify
the spectral properties of the system, i.e., the explicit photophysical or photochemical characteristics,
as well as their associated lifetimes. Thus, much like global analysis, target analysis also gives an
interpretation to the estimated spectra, with the exception that this is specifically for individual or pure
species. In target analysis, an explicit target model that is based on an educated hypothesis and
behaviour is tested. The associated spectra here are known as Species Associated Difference
Spectra (SADS). This gives the true concentrations of the compartments that are modelled in time,
from which a physical interpretation of the estimated parameters can be deduced. A branching model
(Figure 5-1 (b)) normally depicts the fundamental photophysics and photochemistry of the system
under study. However, some exceptions exist when the real scheme is sequential, because the EADS
can become the SADS.
In the event that more complicated data analysis need be conducted on a data set, such as in
the case of searching for the processes indicating possible dark (non-radiative) states, a combination
of both parallel and sequential models make the target model, which is used for branching, back-
reactions or multi-compartment excitation.
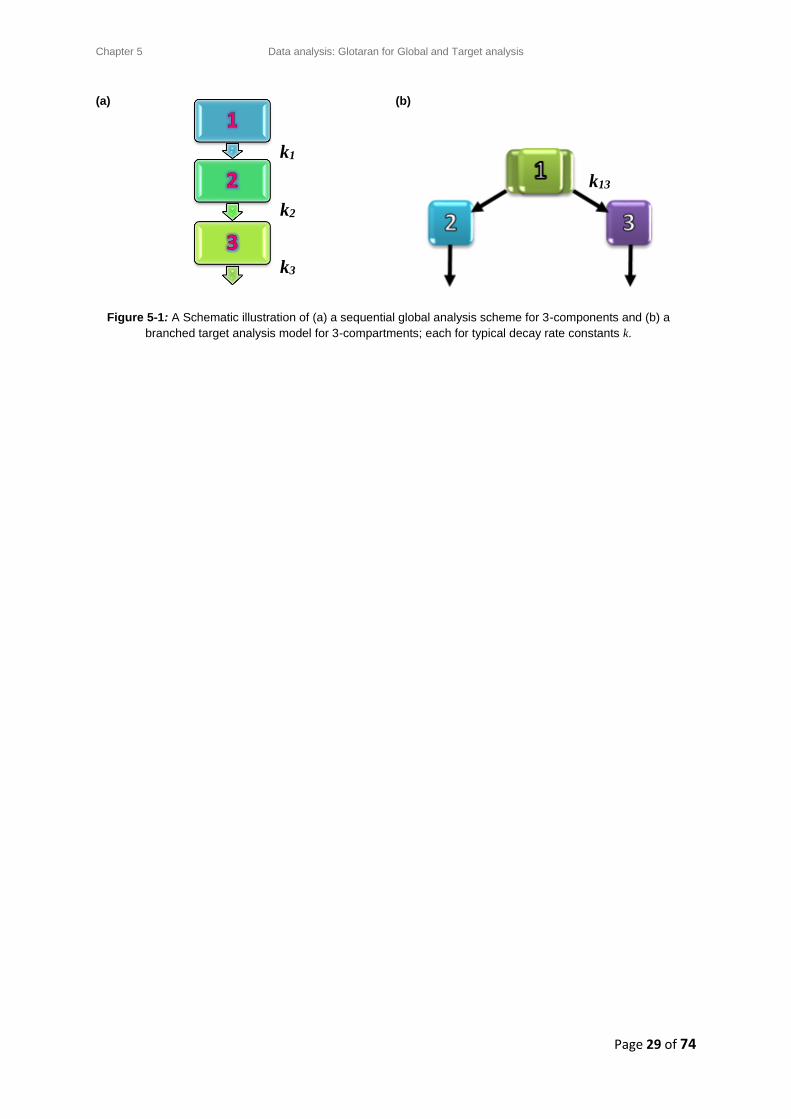
Chapter 5 Data analysis: Glotaran for Global and Target analysis
Page 29 of 74
k12
k2 k3
(a) (b)
Figure 5-1: A Schematic illustration of (a) a sequential global analysis scheme for 3-components and (b) a
branched target analysis model for 3-compartments; each for typical decay rate constants k.
k2
k1
k3
k13
Chapter 6 Literature review
Page 30 of 74
Chapter 6
A brief literature overview of the ET dynamics of LHCII trimers is presented in this chapter to motivate
the study.
6. Literature review
The ES dynamics of Cars and the spectral characterization of LHCII trimers are the primary
experimental aspects of this dissertation. These factors have been extensively investigated and
reported on in the past. For example, excitation-intensity-dependent PP measurements have enabled
the elucidation of the relationship between the S1-state and possible intermediate states in some
bacterial LH2 complexes [29].
We aimed to conduct an investigation on higher plants, specifically in spinach leaves, to
monitor the evolution of the electronic transitions and excitation ET kinetics of the LHCII pigments.
Femtosecond TA PP spectroscopy has proven to be a useful technique for monitoring the behaviour
of specific LHCII pigments when excited at various pump wavelengths and pump excitation energies.
Below is a brief summary of literature investigations on LHCII using femtosecond TA PP
spectroscopy.
6.1. Related published work
A global analysis is usually applied to TA PP results in order to obtain the EADS which give the
excited state (ES) lifetimes of various processes. In some cases when the data quality is high (high
signal-to-noise ratio), it is possible to apply target analysis to the results for determining the nature
and lifetimes of the individual pure species through SADS. Most literature investigations were based
on pump wavelength-dependent studies, targeting specific pigments (usually Cars), and pump
intensity-dependent studies to monitor annihilation rates.
Three possible relaxation pathways exist for initially excited S2-Cars in solution, namely direct
S2→0 relaxation, S2→0 via an intermediate state (e.g. S*), and S2→1, or combinations thereof [38].
Typical literature lifetimes of the Car-S1-states in LHCII are 14 ps for Lut, 24 ps for Vio, and 35 ps for
Neo [38].
TA PP spectroscopy was used by Ombinda, et al. [69] to study the ET dynamics of spinach
LHCII trimers at various pump wavelengths in the range of 600 nm – 680 nm with a white light (WL)
probe. These experiments were carried out at the femtosecond laser facilities of the National laser
Centre (NLC) at the Council for Scientific and Industrial Research (CSIR) in Pretoria, South Africa.
The aim of using the well-developed PP technique was to characterize the LH and ET mechanisms of
some artificial systems, like specific phthalocyanines and Malachite green, and compare it to natural
systems. It is a relatively novel technique in South Africa, particularly for studying LH systems.
The absorption spectrum of their extracted LHCII showed an exceptionally small signal from
Chl b, which featured as a small shoulder (at around 650 nm) of the dominant Chl a band around 675
nm. However, the strong Chl b Soret band in the 450 nm – 500 nm regions as well as the absorption
bands of the Cars, which are supposed to be visible as a shoulder near 490 nm were absent,
suggesting loss of most of the Chl b and Car pigments during the sample isolation and preparation
Chapter 6 Literature review
Page 31 of 74
process. PP measurements were carried out on this deficient LHCII sample, which was inserted into a
rotating glass cell where rotation ensured sufficient mixing of the sample for every laser pulse. More
information on this system is discussed in the Materials and Methods Chapter 7.
An excitation pump wavelength-dependent study was conducted on LHCII at 610 nm, 630
nm, 650 nm, and 680 nm. At 610 nm, a complete investigation was carried out using a pulse energy
of 2 µJ and focal beam spot size of 300 µm to excite the LHCII complexes. This pump wavelength
gave high pulse energies with stable pulse-to-pulse outputs, motivating the choice of 610 nm.
However, a visible constant pump scattering at 610 nm was evident in the TA results. Time constants
for the decay of the different signals were calculated by applying a second-order (bi-)exponential fit to
the decay trace of each TA data peak. For the Chl a GSB at 678 nm, time constants of 1.3 ps and 25
ps were obtained. These time constants were attributed to singlet-singlet annihilation within the LHCII
monomer and LHCII trimer, respectively. Data was shown up to delay times of 13 ps, which may
explain why information on spontaneous emission on the nanosecond timescale was not reported.
An excessively broadband ESA from 500 nm – 640 nm peaking at a red-shifted 542 nm,
overshadowed the small Qy-band of Chl b at 650 nm. The ESA signal was proposed to result from the
population of lower energy Chl states to higher vibrational energy levels by the probe pulse, after
which the excited molecules undergoes a vibrational relaxation towards other pigments. This
interpretation is contrary to other related literature studies, which show that the Chl ESA signals are
much narrower and energetically closer to the Chl Qy GSB bands, while Car ESA generally feature as
broad bands between 500 nm and 600 nm. Due to the absence of a typical Car signal in the steady-
state absorption spectra it is not clear what the origin is of the broad positive band in the study of
Ombinda et al [69].
For the wavelength-dependent study between 610 nm – 680 nm, an increase in absorbance
amplitude was seen as the pump wavelengths extended towards the red, with each Chl a absorption
peak position being slightly red-shift with higher excitation wavelengths. A large absorption amplitude
for excitation at 680 nm was expected, as this overlaps with the characteristic Chl a Qy-band. Time
constants were extracted from the decay trace of each probe wavelength that showed a spectral
feature for these pump wavelengths. The time constants were compared to literature. It was
suggested that the delay line range should be extended to recover the ultrafast ET components below
200 fs, which were not resolved due to temporal limitations.
In the work of Croce, et al. [40], the Car concentration was varied in the samples from
reconstituted monomeric LHCII complexes. These were studied using two different Car excitation
wavelengths, viz. 490 nm and 500 nm [40]. From the analysis, it was concluded that the initially
excited Car-S2-state had the dominant contribution in ET from Cars. A qualitative model was thus
developed to justify the Car-to-Chl ET processes, where the Car-to-Chl transfer commenced from the
densely populated Car-S2 with lifetimes below 100 fs, and a prevalent, direct Car-to-Chl transfer from
the Car-S2. Chl b-to-Chl a transfer was distinct from Car-to-Chl b transfer with times as fast as 150 fs
for the former. Almost half of the initial energy was transferred from Chl b to Chl a, where three
different Chl b molecules were identified. In this article, the two Lut Cars were reported to be
Chapter 6 Literature review
Page 32 of 74
spectrally distinct in both their kinetics and ET. Each of these processes, along with some other
detailed observations, were discussed in further depth in the article [40].
A comparative study was conducted by Gradinaru and co-workers in 2000 [36], on the
spectral and kinetic dynamics pertaining to Car-to-Chl transfer for spinach LHCII and CP 29. In the
study, Cars Lut1 and Neo were selectively excited at 489 nm and Cars Lut2 and Vio at 506 nm, which
were the exact pump wavelengths chosen for this dissertation. The pump intensities ranged from 20
nJ to 30 nJ with excitation densities on the order of 1014 photons per pulse per cm2 with each
measurement conducted in both a blue and red spectral window [36].
Simultaneous data analysis on both spectral probing windows encompassed a sequential,
irreversible model for the time-gated spectra by a global fitting program [36]. EADS with the
corresponding species lifetimes were obtained from the analysis of each dataset. However, a
branching model was associated with the excitation ET pathways from Car-S2. The Car-S2 transitions
were identified at 486 nm, 494 nm, and 510 nm, representative of Neo, Lut, and Vio in LHCII.
Excitation at 506 nm directly targets Cars yielding a smaller Chl b bleach than for 489 nm
excitation, with a maximum GSB around 500 nm from ES contributions as a SE signal. A 5 nm shift
towards the red was seen in this pump GSB compared to when complexes were excited at 489 nm.
Lut and Vio Cars excited at 506 nm did not exhibit ultrafast rise times, nor kinetics in 100 fs – 150 fs,
and were thus said to have transferred their S2 energy exclusively to Chl a. A strong overlap between
the Cars and Chl Soret bands were seen at 437 nm for Chl a and 473 nm for Chl b. It was concluded
that the initially excited LHCII showed a fairly fast Car-S2 decay, as a combination of Car-to-Chl
excitation ET, and Chl b-to-Chl a ET.
A small fraction of the energy of the initially excited Cars is transferred to Chl a from the Car-
S1-state, with a lifetime of ~1 ps. Car-S2 is closely linked to the Chl Qx and Chl Qy states through a
dipole-dipole interaction. LHCII studies showed that the initial energy acceptors were the Lut and Vio
Cars, whilst Neo transferred most of its energy to Chl b when pumped at 489 nm.
In 2001, Gradinaru and co-authors [35] concluded that bacterial Spx in solution did not show
the normal bi-exponential Car dynamics, which is a relaxation from the S2-state to the S1-state in 100
fs – 200 fs, followed by a relaxation of S1 on a picoseconds timescale to the GS [70, 71]. Instead, this
species showed the existence of another possible state, the S*, which has an extended lifetime in
comparison to S1 and is spectrally distinct. Some of the characteristic features found in these results
include ESA bands at 542 nm and 564 nm occurring during the lifetime of S1 (i.e. in the second SADS
(see Chapter 5)). Target analysis was performed on the data in order to resolve the difference spectra
of each of the three pure states, viz. S1, S2 and S* [45]. It was concluded that S* is formed
immediately from S2, and in parallel to the formation of S1. The authors of this study reported on
possibly the “first ever direct observation of a singlet-to-triplet conversion process on an ultrafast
timescale in a photosynthetic antenna” [35].
In the work done by Papagiannakis and co-authors [29], dispersed TA measurements were
conducted at variable excitation intensities. This enabled an investigation into the underlying
connection amongst the electronic ESs of the Car rhodopsin glucoside found in LH2 complexes of
Rhodopseudomonas acidophila. Both theoretical and experimental evidence of the existence of the
Chapter 6 Literature review
Page 33 of 74
Car S* state in these systems has been made available through intensity-dependence investigations
[34, 35, 72].
Considering the abovementioned conclusions and studies on LHCII of plants using PP
spectroscopy, it is clear that this is a resourceful technique that needs to be further utilized for
understanding parts of natural photosynthesis. Wavelength-dependence and intensity-dependence
studies are two excellent starting points to investigate, as well as the characterization of a
femtosecond TA PP setup. These aspects have been studied, and are reported on in the chapters
that follow. In particular, preparation of an existing TA PP setup for experiments on the LHCII of
plants, which is presented in Chapter 7, was a matter of priority. The results of the wavelength-
dependence and intensity-dependence studies on spinach LHCII are discussed in Chapter 8. In the
results chapter, a comparison between datasets of the experiments conducted before the PP setup
was optimized will be made to the datasets after the improvements were made. Annihilation
probabilities were also calculated to study the effects of the intensity-dependence. These results will
then be compared to literature works to ensure conformity to international standards.
Chapter 7 Experimental
Page 34 of 74
Chapter 7
7. Materials and Methods
Further to the biological aspects being investigated, it is crucial to have a working experimental setup
that is sensitive enough to detect the signals needed for pump-probe (PP) experiments and optimal
data analysis. Thus, the project was mainly centred on restructuring and improving the existing
femtosecond PP setup at the NLC; and fine-tuning it for the necessary specialized biological
experiments. More details of the experimental aspects of the project will be discussed below.
7.1. Experimental conditions
All measurements were conducted in a controlled environment, at a constant laboratory temperature
of 20°C, with low humidity (~40%), and under low light conditions. The low light strongly limits the
possibility of photobleaching the LHCII pigments and reduces excitation from any external source
other than the laser beam.
7.2. Sample preparation
Isolated LHCII trimers prepared from PSII-enriched thylakoid membranes of spinach leaves, were
obtained from the Vrije Universiteit in Amsterdam, and prepared as described previously in literature
[73, 74].
These samples needed to be concentrated, i.e. spun-down using Amicon® Ultra 50K
Centrifugal falcon tubes (from Sigma), in a centrifuge. The falcon tubes are comprised of three parts –
a plastic test tube, a smaller compartment called the filter device, and a screw-on cap. These tubes
assisted in some further purification of the sample by separating the larger LHCII complexes from
smaller minor antenna complexes (by pore size), such as CP26 and CP29. The isolated LHCII liquid
samples were evenly measured, and pipetted into the top compartment (filter device) of separate
centrifugal falcon tubes. The tubes were balanced by mass in an electric, chemical balance scale
before being inserted into a centrifuge chamber. Ultracentrifugation was conducted at a temperature
of 4C for 20 minutes, at a revolution of 5000 x g. Figure 7-1 shows a falcon tube, where the bottom of
the tube contains the filtered out minor complexes (which were discarded), and the filter device
retained the concentrated LHCII which was instantly frozen with liquid nitrogen and stored at -80C in
separate micro tubes for later use. At this temperature of -80C, the complexes are preserved, and
degradation of the pigments and the protein structure is limited, as the protein conformational freedom
is reduced. Multiple freeze-thaw cycles largely affect the quality of the complexes and strength of the
pigment bonds in the complex. Once a fully prepared sample is defrosted, it can survive on ice for a
maximum of about two days, without degrading too much (i.e. by slight denaturation of the peripheral
parts of the protein, which may lead to uncoupling of some peripheral pigments).
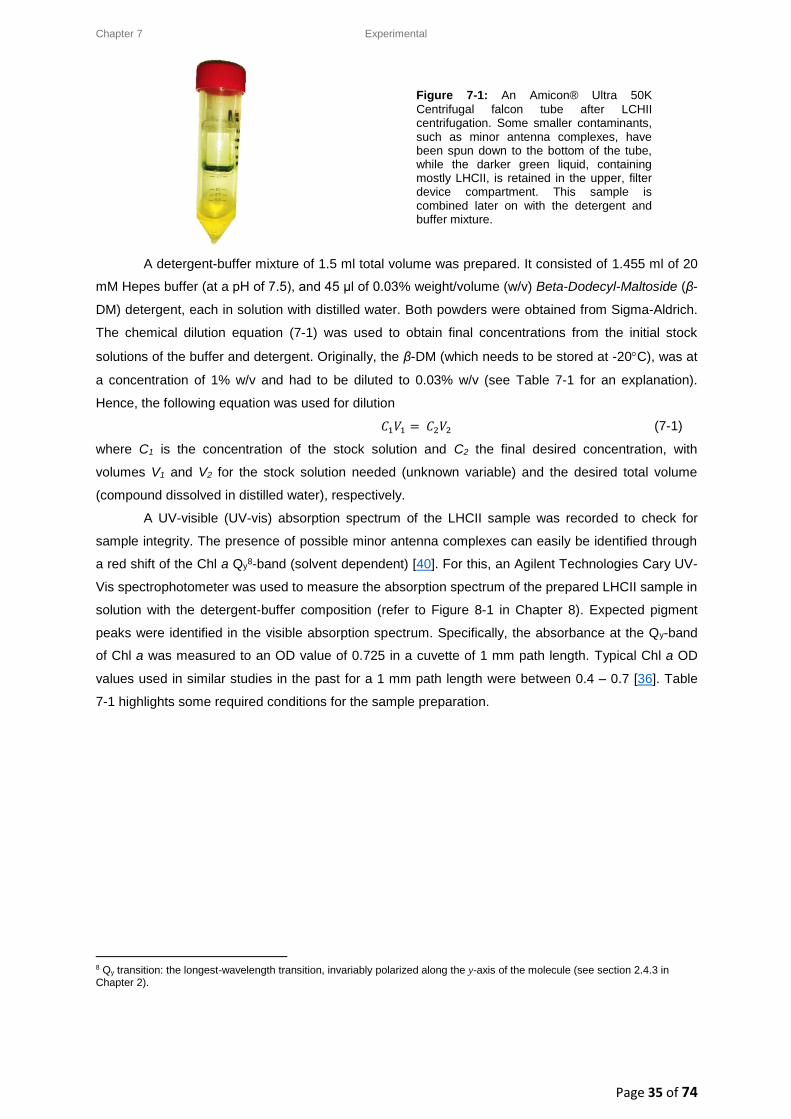
Chapter 7 Experimental
Page 35 of 74
Figure 7-1: An Amicon® Ultra 50K
Centrifugal falcon tube after LCHII centrifugation. Some smaller contaminants, such as minor antenna complexes, have been spun down to the bottom of the tube, while the darker green liquid, containing mostly LHCII, is retained in the upper, filter device compartment. This sample is combined later on with the detergent and buffer mixture.
A detergent-buffer mixture of 1.5 ml total volume was prepared. It consisted of 1.455 ml of 20
mM Hepes buffer (at a pH of 7.5), and 45 μl of 0.03% weight/volume (w/v) Beta-Dodecyl-Maltoside (β-
DM) detergent, each in solution with distilled water. Both powders were obtained from Sigma-Aldrich.
The chemical dilution equation (7-1) was used to obtain final concentrations from the initial stock
solutions of the buffer and detergent. Originally, the β-DM (which needs to be stored at -20C), was at
a concentration of 1% w/v and had to be diluted to 0.03% w/v (see Table 7-1 for an explanation).
Hence, the following equation was used for dilution
𝐶1𝑉1 = 𝐶2𝑉2 (7-1)
where C1 is the concentration of the stock solution and C2 the final desired concentration, with
volumes V1 and V2 for the stock solution needed (unknown variable) and the desired total volume
(compound dissolved in distilled water), respectively.
A UV-visible (UV-vis) absorption spectrum of the LHCII sample was recorded to check for
sample integrity. The presence of possible minor antenna complexes can easily be identified through
a red shift of the Chl a Qy8-band (solvent dependent) [40]. For this, an Agilent Technologies Cary UV-
Vis spectrophotometer was used to measure the absorption spectrum of the prepared LHCII sample in
solution with the detergent-buffer composition (refer to Figure 8-1 in Chapter 8). Expected pigment
peaks were identified in the visible absorption spectrum. Specifically, the absorbance at the Qy-band
of Chl a was measured to an OD value of 0.725 in a cuvette of 1 mm path length. Typical Chl a OD
values used in similar studies in the past for a 1 mm path length were between 0.4 – 0.7 [36]. Table
7-1 highlights some required conditions for the sample preparation.
8 Qy transition: the longest-wavelength transition, invariably polarized along the y-axis of the molecule (see section 2.4.3 in Chapter 2).
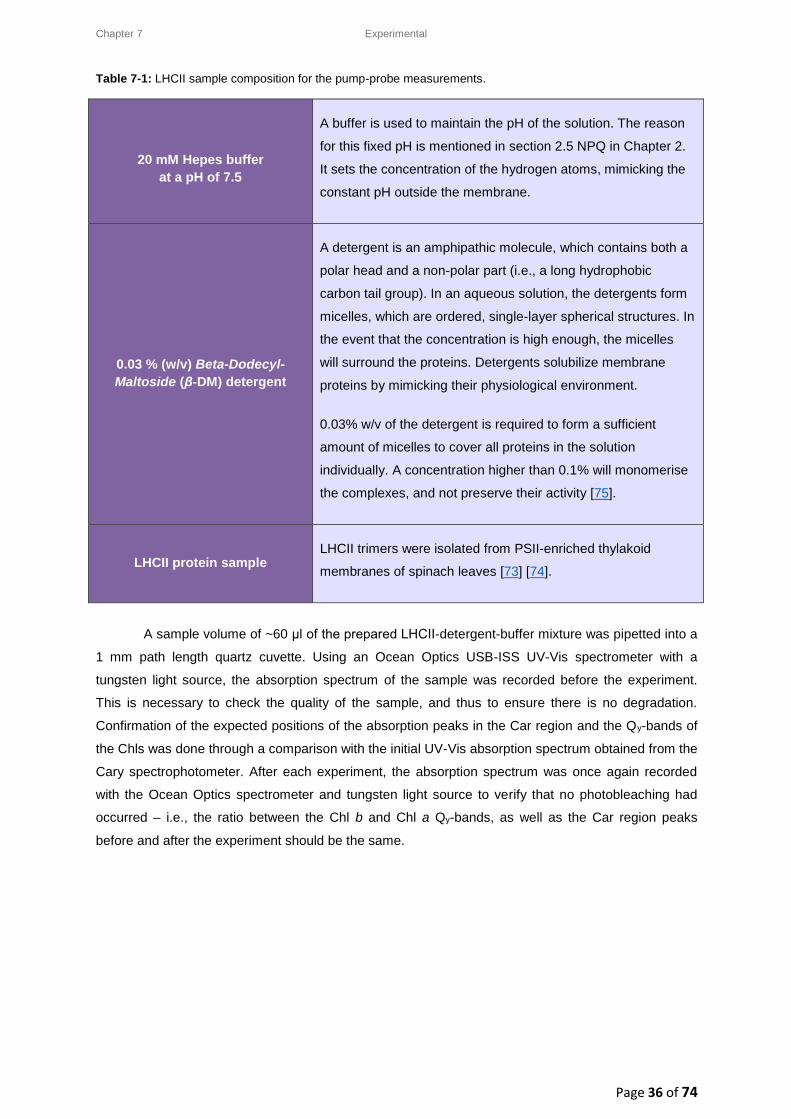
Chapter 7 Experimental
Page 36 of 74
Table 7-1: LHCII sample composition for the pump-probe measurements.
20 mM Hepes buffer
at a pH of 7.5
A buffer is used to maintain the pH of the solution. The reason
for this fixed pH is mentioned in section 2.5 NPQ in Chapter 2.
It sets the concentration of the hydrogen atoms, mimicking the
constant pH outside the membrane.
0.03 % (w/v) Beta-Dodecyl-
Maltoside (β-DM) detergent
A detergent is an amphipathic molecule, which contains both a
polar head and a non-polar part (i.e., a long hydrophobic
carbon tail group). In an aqueous solution, the detergents form
micelles, which are ordered, single-layer spherical structures. In
the event that the concentration is high enough, the micelles
will surround the proteins. Detergents solubilize membrane
proteins by mimicking their physiological environment.
0.03% w/v of the detergent is required to form a sufficient
amount of micelles to cover all proteins in the solution
individually. A concentration higher than 0.1% will monomerise
the complexes, and not preserve their activity [75].
LHCII protein sample LHCII trimers were isolated from PSII-enriched thylakoid
membranes of spinach leaves [73] [74].
A sample volume of ~60 μl of the prepared LHCII-detergent-buffer mixture was pipetted into a
1 mm path length quartz cuvette. Using an Ocean Optics USB-ISS UV-Vis spectrometer with a
tungsten light source, the absorption spectrum of the sample was recorded before the experiment.
This is necessary to check the quality of the sample, and thus to ensure there is no degradation.
Confirmation of the expected positions of the absorption peaks in the Car region and the Qy-bands of
the Chls was done through a comparison with the initial UV-Vis absorption spectrum obtained from the
Cary spectrophotometer. After each experiment, the absorption spectrum was once again recorded
with the Ocean Optics spectrometer and tungsten light source to verify that no photobleaching had
occurred – i.e., the ratio between the Chl b and Chl a Qy-bands, as well as the Car region peaks
before and after the experiment should be the same.
Chapter 7 Experimental
Page 37 of 74
7.3. Experimental: Laser setup used for Transient Absorption Pump-
Probe Spectroscopy at the National Laser Centre (NLC) at CSIR
The experimental technique of ultrafast transient absorption (TA) PP spectroscopy was employed.
The femtosecond laser facility of the National Laser Centre (NLC) at the Council for Scientific and
Industrial Research (CSIR) in Pretoria, South Africa was utilized to conduct the experiments. This
setup was similar to that used by Ombinda, et al. in 2009, also for studying the ET dynamics of
spinach LHCII, with the exception of the type of femtosecond laser used [69].
7.3.1. Clark – MXR, Inc. CPA 2110i femtosecond laser
A bi-level Clark – MXR, Inc. CPA 2110i laser [76] with an upper and lower compartment enclosed in
the laser box, was used as a femtosecond laser source. The seed beam is produced in the lower part
through a mode-locked fibre laser oscillator, which is pumped by a diode laser. This beam goes
through a pulse stretcher, and is then directed into the upper cavity. The upper compartment houses a
regenerative, 1 kHz (repetition rate), Ti:Sapphire (Ti:Al2O3) amplifier (a cavity which uses a sapphire
crystal, doped with Ti ions). This is pumped by a laser pulse, originating from a frequency-doubled,
steady pump source of 7 W from a Nd:YAG rod, which is necessary to maintain a continuous wave
operation for amplification. Ti:Al2O3-based lasers have the broadest gain bandwidth amongst all
lasers, with the oscillator producing fixed mode-locked femtosecond pulses [58].
Chirped pulse amplification (CPA) is the method used to produce a high peak power, through
the amplification of the ultrashort laser pulses. The amplified beam undergoes pulse compression
before being directed out of the Clark laser at an optimal power of 1 W. The pulse duration was 150 fs
(corresponding to a transform-limited bandwidth of ~6 nm), with a central output peak wavelength of
775 nm [76]. A full calibration of the real, displayed (on an interface) and set values of the lasing
output power and laser lamp current was conducted before the experiments were initiated. This
fundamental CPA laser beam was split into a ratio of 30 (pump pulse) to 70 (probe pulse) with a beam
splitter.
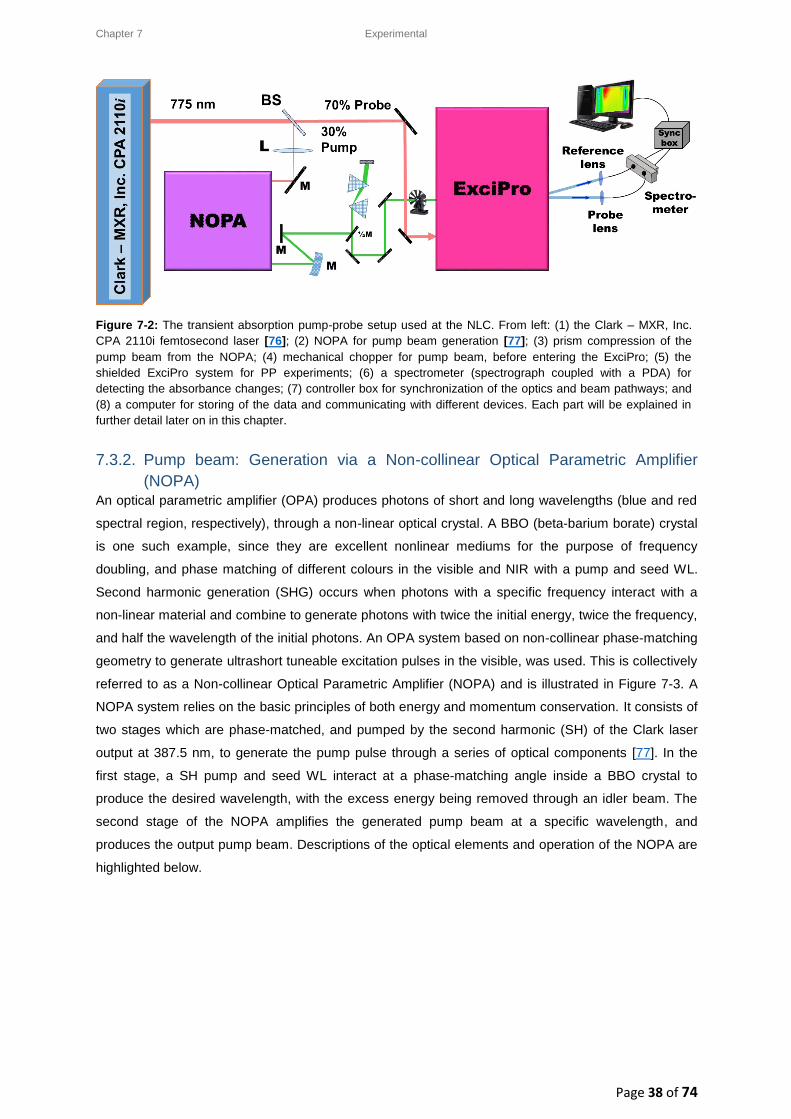
Chapter 7 Experimental
Page 38 of 74
Figure 7-2: The transient absorption pump-probe setup used at the NLC. From left: (1) the Clark – MXR, Inc.
CPA 2110i femtosecond laser [76]; (2) NOPA for pump beam generation [77]; (3) prism compression of the
pump beam from the NOPA; (4) mechanical chopper for pump beam, before entering the ExciPro; (5) the
shielded ExciPro system for PP experiments; (6) a spectrometer (spectrograph coupled with a PDA) for
detecting the absorbance changes; (7) controller box for synchronization of the optics and beam pathways; and
(8) a computer for storing of the data and communicating with different devices. Each part will be explained in
further detail later on in this chapter.
7.3.2. Pump beam: Generation via a Non-collinear Optical Parametric Amplifier
(NOPA) An optical parametric amplifier (OPA) produces photons of short and long wavelengths (blue and red
spectral region, respectively), through a non-linear optical crystal. A BBO (beta-barium borate) crystal
is one such example, since they are excellent nonlinear mediums for the purpose of frequency
doubling, and phase matching of different colours in the visible and NIR with a pump and seed WL.
Second harmonic generation (SHG) occurs when photons with a specific frequency interact with a
non-linear material and combine to generate photons with twice the initial energy, twice the frequency,
and half the wavelength of the initial photons. An OPA system based on non-collinear phase-matching
geometry to generate ultrashort tuneable excitation pulses in the visible, was used. This is collectively
referred to as a Non-collinear Optical Parametric Amplifier (NOPA) and is illustrated in Figure 7-3. A
NOPA system relies on the basic principles of both energy and momentum conservation. It consists of
two stages which are phase-matched, and pumped by the second harmonic (SH) of the Clark laser
output at 387.5 nm, to generate the pump pulse through a series of optical components [77]. In the
first stage, a SH pump and seed WL interact at a phase-matching angle inside a BBO crystal to
produce the desired wavelength, with the excess energy being removed through an idler beam. The
second stage of the NOPA amplifies the generated pump beam at a specific wavelength, and
produces the output pump beam. Descriptions of the optical elements and operation of the NOPA are
highlighted below.
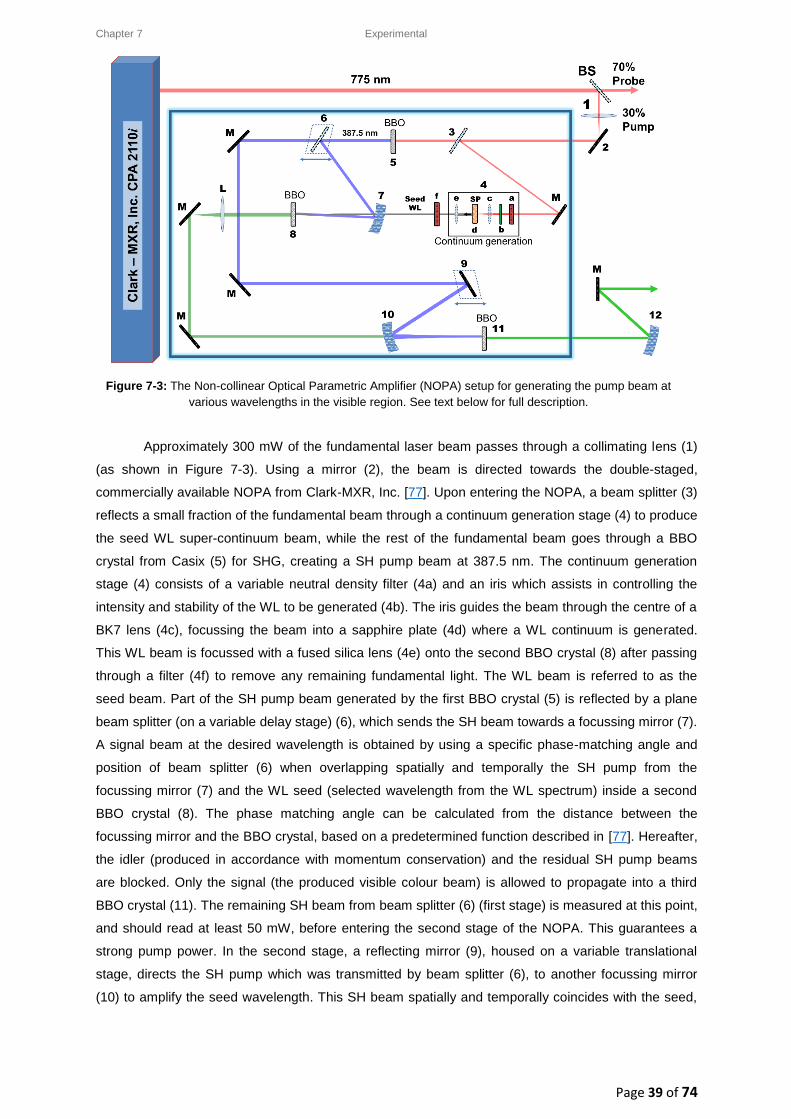
Chapter 7 Experimental
Page 39 of 74
Figure 7-3: The Non-collinear Optical Parametric Amplifier (NOPA) setup for generating the pump beam at
various wavelengths in the visible region. See text below for full description.
Approximately 300 mW of the fundamental laser beam passes through a collimating lens (1)
(as shown in Figure 7-3). Using a mirror (2), the beam is directed towards the double-staged,
commercially available NOPA from Clark-MXR, Inc. [77]. Upon entering the NOPA, a beam splitter (3)
reflects a small fraction of the fundamental beam through a continuum generation stage (4) to produce
the seed WL super-continuum beam, while the rest of the fundamental beam goes through a BBO
crystal from Casix (5) for SHG, creating a SH pump beam at 387.5 nm. The continuum generation
stage (4) consists of a variable neutral density filter (4a) and an iris which assists in controlling the
intensity and stability of the WL to be generated (4b). The iris guides the beam through the centre of a
BK7 lens (4c), focussing the beam into a sapphire plate (4d) where a WL continuum is generated.
This WL beam is focussed with a fused silica lens (4e) onto the second BBO crystal (8) after passing
through a filter (4f) to remove any remaining fundamental light. The WL beam is referred to as the
seed beam. Part of the SH pump beam generated by the first BBO crystal (5) is reflected by a plane
beam splitter (on a variable delay stage) (6), which sends the SH beam towards a focussing mirror (7).
A signal beam at the desired wavelength is obtained by using a specific phase-matching angle and
position of beam splitter (6) when overlapping spatially and temporally the SH pump from the
focussing mirror (7) and the WL seed (selected wavelength from the WL spectrum) inside a second
BBO crystal (8). The phase matching angle can be calculated from the distance between the
focussing mirror and the BBO crystal, based on a predetermined function described in [77]. Hereafter,
the idler (produced in accordance with momentum conservation) and the residual SH pump beams
are blocked. Only the signal (the produced visible colour beam) is allowed to propagate into a third
BBO crystal (11). The remaining SH beam from beam splitter (6) (first stage) is measured at this point,
and should read at least 50 mW, before entering the second stage of the NOPA. This guarantees a
strong pump power. In the second stage, a reflecting mirror (9), housed on a variable translational
stage, directs the SH pump which was transmitted by beam splitter (6), to another focussing mirror
(10) to amplify the seed wavelength. This SH beam spatially and temporally coincides with the seed,
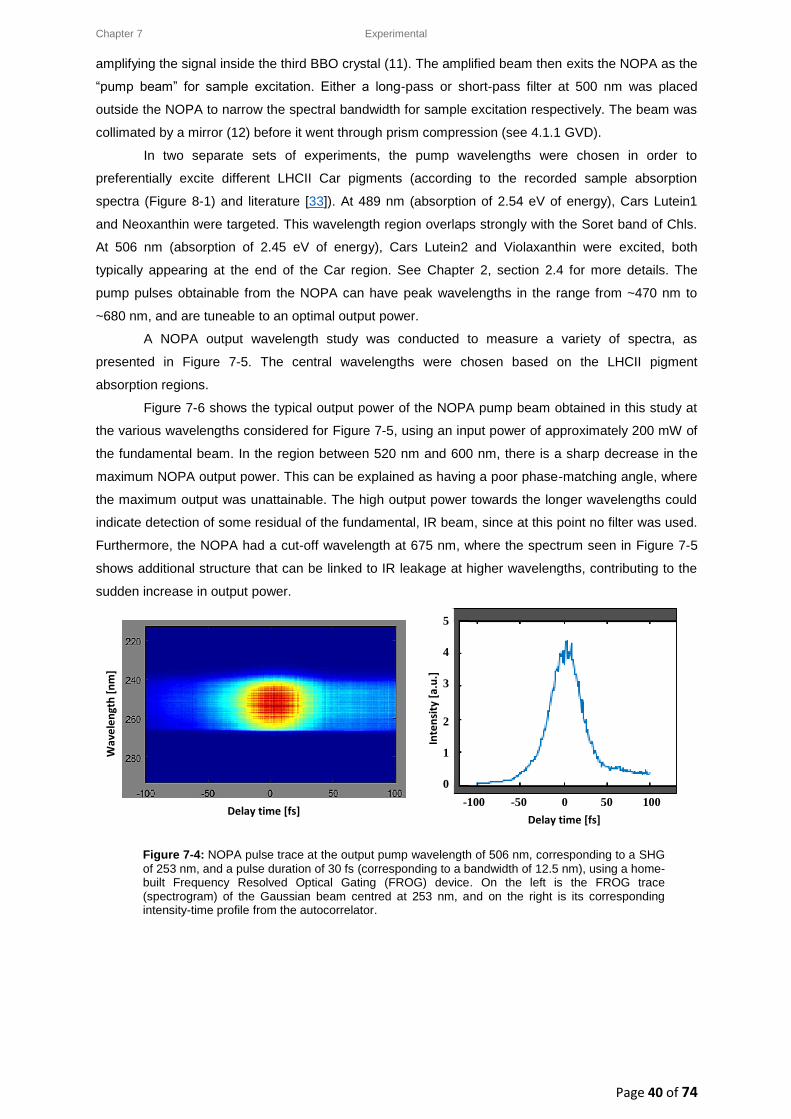
Chapter 7 Experimental
Page 40 of 74
amplifying the signal inside the third BBO crystal (11). The amplified beam then exits the NOPA as the
“pump beam” for sample excitation. Either a long-pass or short-pass filter at 500 nm was placed
outside the NOPA to narrow the spectral bandwidth for sample excitation respectively. The beam was
collimated by a mirror (12) before it went through prism compression (see 4.1.1 GVD).
In two separate sets of experiments, the pump wavelengths were chosen in order to
preferentially excite different LHCII Car pigments (according to the recorded sample absorption
spectra (Figure 8-1) and literature [33]). At 489 nm (absorption of 2.54 eV of energy), Cars Lutein1
and Neoxanthin were targeted. This wavelength region overlaps strongly with the Soret band of Chls.
At 506 nm (absorption of 2.45 eV of energy), Cars Lutein2 and Violaxanthin were excited, both
typically appearing at the end of the Car region. See Chapter 2, section 2.4 for more details. The
pump pulses obtainable from the NOPA can have peak wavelengths in the range from ~470 nm to
~680 nm, and are tuneable to an optimal output power.
A NOPA output wavelength study was conducted to measure a variety of spectra, as
presented in Figure 7-5. The central wavelengths were chosen based on the LHCII pigment
absorption regions.
Figure 7-6 shows the typical output power of the NOPA pump beam obtained in this study at
the various wavelengths considered for Figure 7-5, using an input power of approximately 200 mW of
the fundamental beam. In the region between 520 nm and 600 nm, there is a sharp decrease in the
maximum NOPA output power. This can be explained as having a poor phase-matching angle, where
the maximum output was unattainable. The high output power towards the longer wavelengths could
indicate detection of some residual of the fundamental, IR beam, since at this point no filter was used.
Furthermore, the NOPA had a cut-off wavelength at 675 nm, where the spectrum seen in Figure 7-5
shows additional structure that can be linked to IR leakage at higher wavelengths, contributing to the
sudden increase in output power.
Figure 7-4: NOPA pulse trace at the output pump wavelength of 506 nm, corresponding to a SHG
of 253 nm, and a pulse duration of 30 fs (corresponding to a bandwidth of 12.5 nm), using a home-built Frequency Resolved Optical Gating (FROG) device. On the left is the FROG trace (spectrogram) of the Gaussian beam centred at 253 nm, and on the right is its corresponding intensity-time profile from the autocorrelator.
Wav
ele
ngt
h [
nm
]
Delay time [fs] Delay time [fs]
-100 -50 0 50 100
5
4
3
2
1
0
Inte
nsi
ty [
a.u
.]
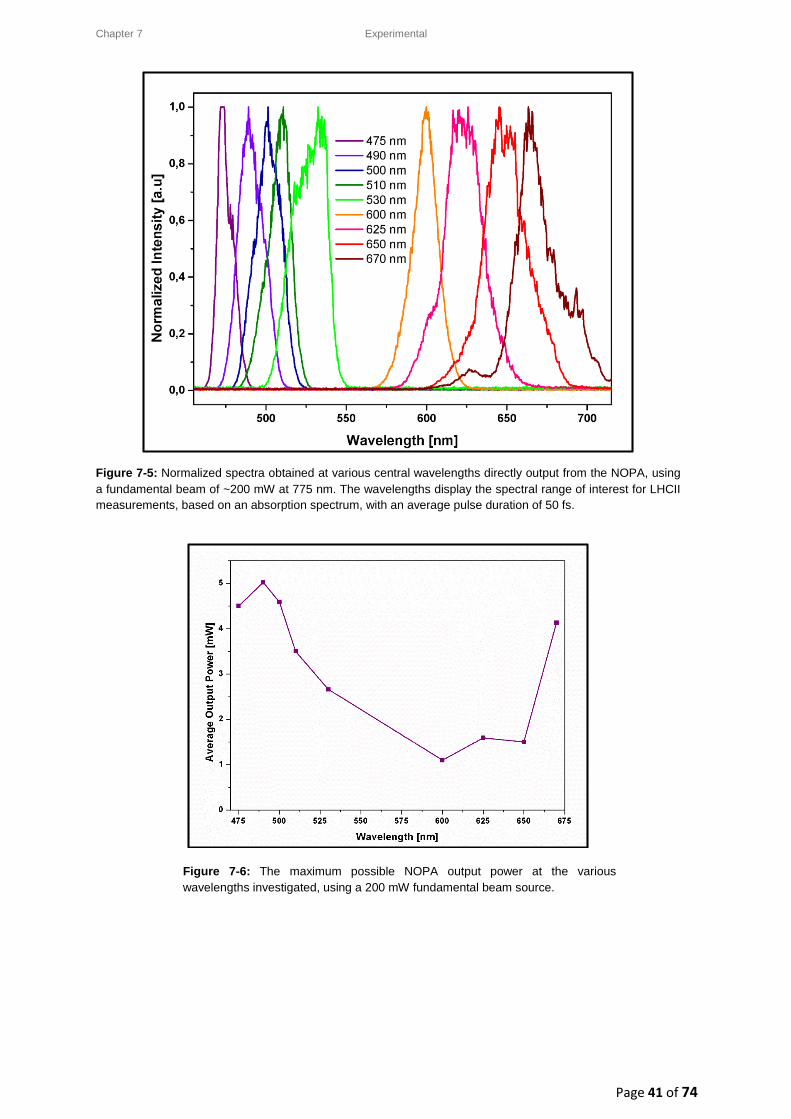
Chapter 7 Experimental
Page 41 of 74
Figure 7-5: Normalized spectra obtained at various central wavelengths directly output from the NOPA, using
a fundamental beam of ~200 mW at 775 nm. The wavelengths display the spectral range of interest for LHCII
measurements, based on an absorption spectrum, with an average pulse duration of 50 fs.
Figure 7-6: The maximum possible NOPA output power at the various
wavelengths investigated, using a 200 mW fundamental beam source.
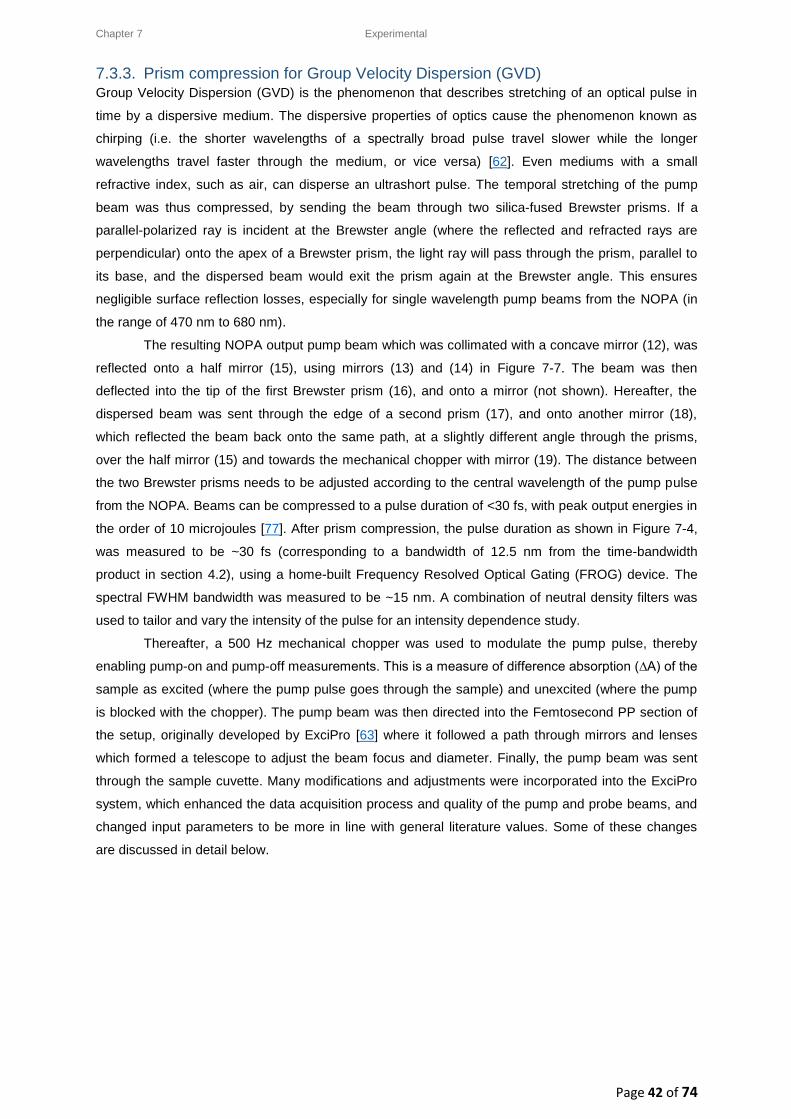
Chapter 7 Experimental
Page 42 of 74
7.3.3. Prism compression for Group Velocity Dispersion (GVD) Group Velocity Dispersion (GVD) is the phenomenon that describes stretching of an optical pulse in
time by a dispersive medium. The dispersive properties of optics cause the phenomenon known as
chirping (i.e. the shorter wavelengths of a spectrally broad pulse travel slower while the longer
wavelengths travel faster through the medium, or vice versa) [62]. Even mediums with a small
refractive index, such as air, can disperse an ultrashort pulse. The temporal stretching of the pump
beam was thus compressed, by sending the beam through two silica-fused Brewster prisms. If a
parallel-polarized ray is incident at the Brewster angle (where the reflected and refracted rays are
perpendicular) onto the apex of a Brewster prism, the light ray will pass through the prism, parallel to
its base, and the dispersed beam would exit the prism again at the Brewster angle. This ensures
negligible surface reflection losses, especially for single wavelength pump beams from the NOPA (in
the range of 470 nm to 680 nm).
The resulting NOPA output pump beam which was collimated with a concave mirror (12), was
reflected onto a half mirror (15), using mirrors (13) and (14) in Figure 7-7. The beam was then
deflected into the tip of the first Brewster prism (16), and onto a mirror (not shown). Hereafter, the
dispersed beam was sent through the edge of a second prism (17), and onto another mirror (18),
which reflected the beam back onto the same path, at a slightly different angle through the prisms,
over the half mirror (15) and towards the mechanical chopper with mirror (19). The distance between
the two Brewster prisms needs to be adjusted according to the central wavelength of the pump pulse
from the NOPA. Beams can be compressed to a pulse duration of <30 fs, with peak output energies in
the order of 10 microjoules [77]. After prism compression, the pulse duration as shown in Figure 7-4,
was measured to be ~30 fs (corresponding to a bandwidth of 12.5 nm from the time-bandwidth
product in section 4.2), using a home-built Frequency Resolved Optical Gating (FROG) device. The
spectral FWHM bandwidth was measured to be ~15 nm. A combination of neutral density filters was
used to tailor and vary the intensity of the pulse for an intensity dependence study.
Thereafter, a 500 Hz mechanical chopper was used to modulate the pump pulse, thereby
enabling pump-on and pump-off measurements. This is a measure of difference absorption (∆A) of the
sample as excited (where the pump pulse goes through the sample) and unexcited (where the pump
is blocked with the chopper). The pump beam was then directed into the Femtosecond PP section of
the setup, originally developed by ExciPro [63] where it followed a path through mirrors and lenses
which formed a telescope to adjust the beam focus and diameter. Finally, the pump beam was sent
through the sample cuvette. Many modifications and adjustments were incorporated into the ExciPro
system, which enhanced the data acquisition process and quality of the pump and probe beams, and
changed input parameters to be more in line with general literature values. Some of these changes
are discussed in detail below.
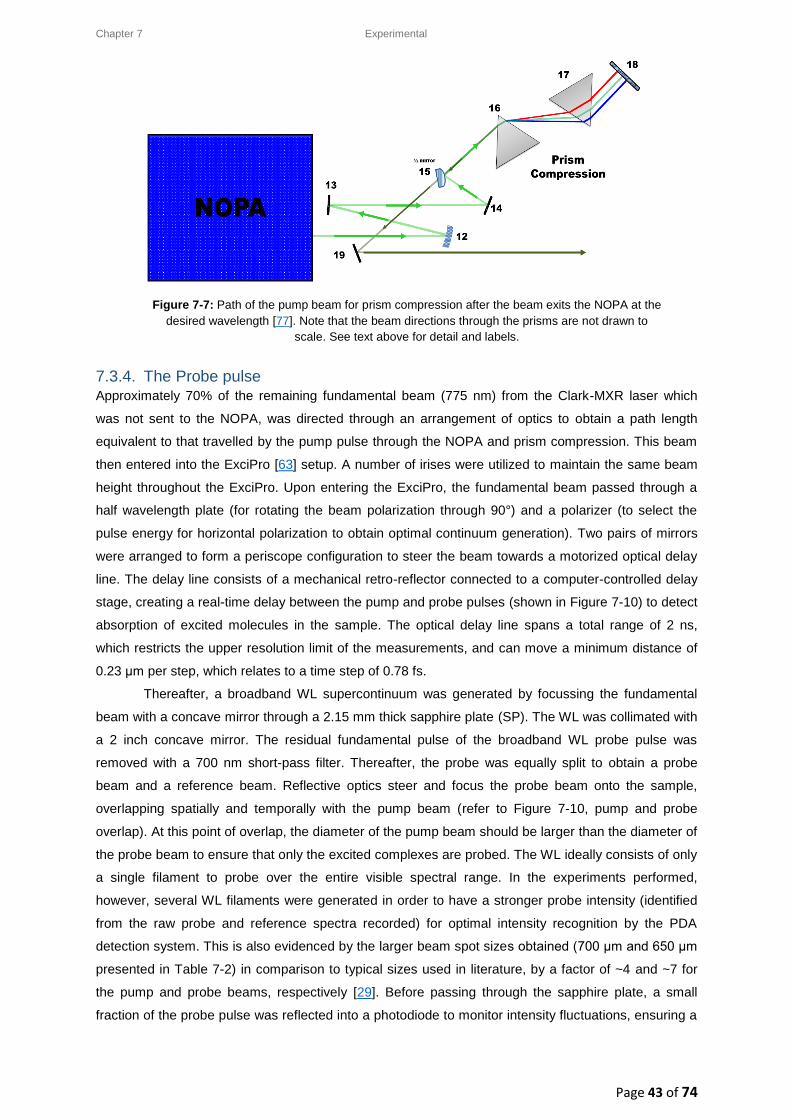
Chapter 7 Experimental
Page 43 of 74
Figure 7-7: Path of the pump beam for prism compression after the beam exits the NOPA at the
desired wavelength [77]. Note that the beam directions through the prisms are not drawn to
scale. See text above for detail and labels.
7.3.4. The Probe pulse Approximately 70% of the remaining fundamental beam (775 nm) from the Clark-MXR laser which
was not sent to the NOPA, was directed through an arrangement of optics to obtain a path length
equivalent to that travelled by the pump pulse through the NOPA and prism compression. This beam
then entered into the ExciPro [63] setup. A number of irises were utilized to maintain the same beam
height throughout the ExciPro. Upon entering the ExciPro, the fundamental beam passed through a
half wavelength plate (for rotating the beam polarization through 90°) and a polarizer (to select the
pulse energy for horizontal polarization to obtain optimal continuum generation). Two pairs of mirrors
were arranged to form a periscope configuration to steer the beam towards a motorized optical delay
line. The delay line consists of a mechanical retro-reflector connected to a computer-controlled delay
stage, creating a real-time delay between the pump and probe pulses (shown in Figure 7-10) to detect
absorption of excited molecules in the sample. The optical delay line spans a total range of 2 ns,
which restricts the upper resolution limit of the measurements, and can move a minimum distance of
0.23 μm per step, which relates to a time step of 0.78 fs.
Thereafter, a broadband WL supercontinuum was generated by focussing the fundamental
beam with a concave mirror through a 2.15 mm thick sapphire plate (SP). The WL was collimated with
a 2 inch concave mirror. The residual fundamental pulse of the broadband WL probe pulse was
removed with a 700 nm short-pass filter. Thereafter, the probe was equally split to obtain a probe
beam and a reference beam. Reflective optics steer and focus the probe beam onto the sample,
overlapping spatially and temporally with the pump beam (refer to Figure 7-10, pump and probe
overlap). At this point of overlap, the diameter of the pump beam should be larger than the diameter of
the probe beam to ensure that only the excited complexes are probed. The WL ideally consists of only
a single filament to probe over the entire visible spectral range. In the experiments performed,
however, several WL filaments were generated in order to have a stronger probe intensity (identified
from the raw probe and reference spectra recorded) for optimal intensity recognition by the PDA
detection system. This is also evidenced by the larger beam spot sizes obtained (700 μm and 650 μm
presented in Table 7-2) in comparison to typical sizes used in literature, by a factor of ~4 and ~7 for
the pump and probe beams, respectively [29]. Before passing through the sapphire plate, a small
fraction of the probe pulse was reflected into a photodiode to monitor intensity fluctuations, ensuring a
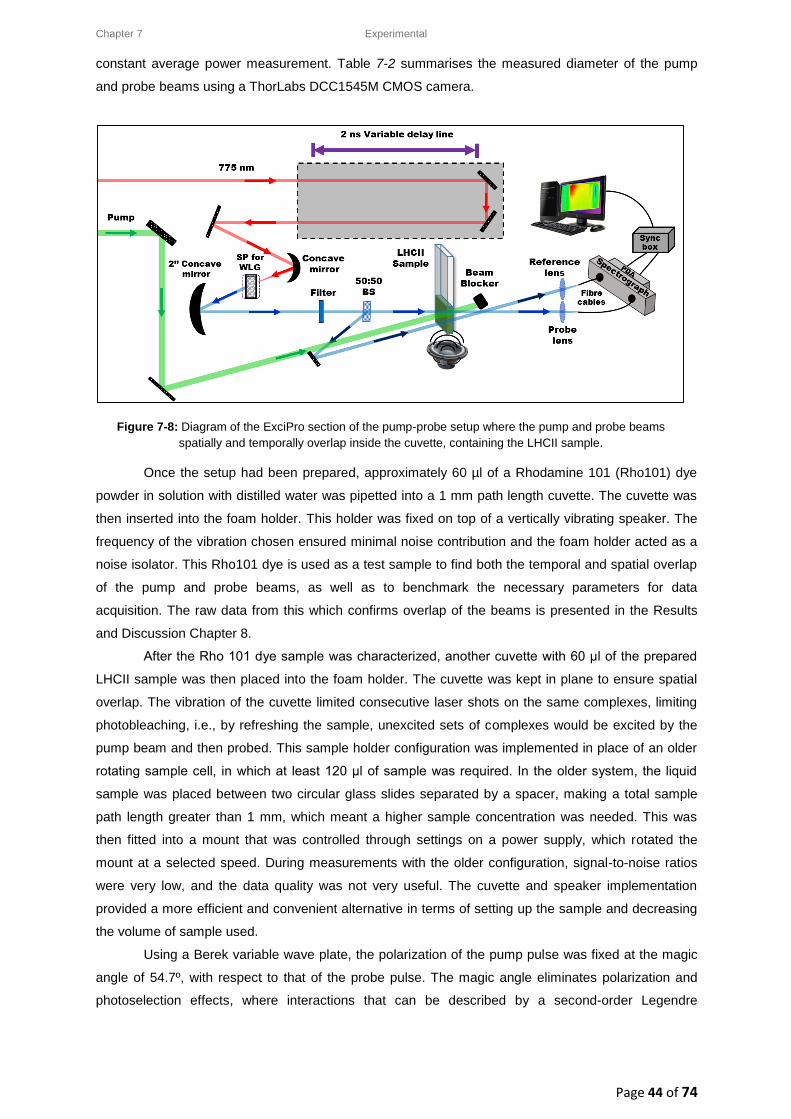
Chapter 7 Experimental
Page 44 of 74
constant average power measurement. Table 7-2 summarises the measured diameter of the pump
and probe beams using a ThorLabs DCC1545M CMOS camera.
Figure 7-8: Diagram of the ExciPro section of the pump-probe setup where the pump and probe beams
spatially and temporally overlap inside the cuvette, containing the LHCII sample.
Once the setup had been prepared, approximately 60 µl of a Rhodamine 101 (Rho101) dye
powder in solution with distilled water was pipetted into a 1 mm path length cuvette. The cuvette was
then inserted into the foam holder. This holder was fixed on top of a vertically vibrating speaker. The
frequency of the vibration chosen ensured minimal noise contribution and the foam holder acted as a
noise isolator. This Rho101 dye is used as a test sample to find both the temporal and spatial overlap
of the pump and probe beams, as well as to benchmark the necessary parameters for data
acquisition. The raw data from this which confirms overlap of the beams is presented in the Results
and Discussion Chapter 8.
After the Rho 101 dye sample was characterized, another cuvette with 60 μl of the prepared
LHCII sample was then placed into the foam holder. The cuvette was kept in plane to ensure spatial
overlap. The vibration of the cuvette limited consecutive laser shots on the same complexes, limiting
photobleaching, i.e., by refreshing the sample, unexcited sets of complexes would be excited by the
pump beam and then probed. This sample holder configuration was implemented in place of an older
rotating sample cell, in which at least 120 μl of sample was required. In the older system, the liquid
sample was placed between two circular glass slides separated by a spacer, making a total sample
path length greater than 1 mm, which meant a higher sample concentration was needed. This was
then fitted into a mount that was controlled through settings on a power supply, which rotated the
mount at a selected speed. During measurements with the older configuration, signal-to-noise ratios
were very low, and the data quality was not very useful. The cuvette and speaker implementation
provided a more efficient and convenient alternative in terms of setting up the sample and decreasing
the volume of sample used.
Using a Berek variable wave plate, the polarization of the pump pulse was fixed at the magic
angle of 54.7º, with respect to that of the probe pulse. The magic angle eliminates polarization and
photoselection effects, where interactions that can be described by a second-order Legendre
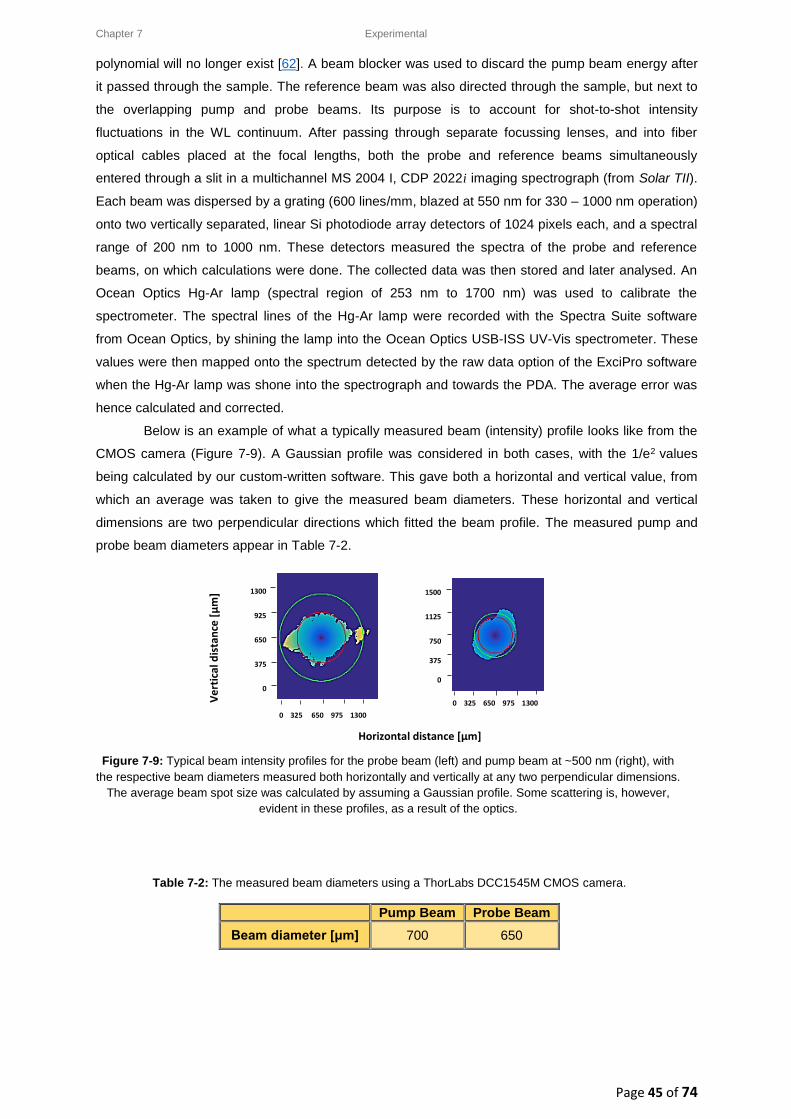
Chapter 7 Experimental
Page 45 of 74
polynomial will no longer exist [62]. A beam blocker was used to discard the pump beam energy after
it passed through the sample. The reference beam was also directed through the sample, but next to
the overlapping pump and probe beams. Its purpose is to account for shot-to-shot intensity
fluctuations in the WL continuum. After passing through separate focussing lenses, and into fiber
optical cables placed at the focal lengths, both the probe and reference beams simultaneously
entered through a slit in a multichannel MS 2004 I, CDP 2022i imaging spectrograph (from Solar TII).
Each beam was dispersed by a grating (600 lines/mm, blazed at 550 nm for 330 – 1000 nm operation)
onto two vertically separated, linear Si photodiode array detectors of 1024 pixels each, and a spectral
range of 200 nm to 1000 nm. These detectors measured the spectra of the probe and reference
beams, on which calculations were done. The collected data was then stored and later analysed. An
Ocean Optics Hg-Ar lamp (spectral region of 253 nm to 1700 nm) was used to calibrate the
spectrometer. The spectral lines of the Hg-Ar lamp were recorded with the Spectra Suite software
from Ocean Optics, by shining the lamp into the Ocean Optics USB-ISS UV-Vis spectrometer. These
values were then mapped onto the spectrum detected by the raw data option of the ExciPro software
when the Hg-Ar lamp was shone into the spectrograph and towards the PDA. The average error was
hence calculated and corrected.
Below is an example of what a typically measured beam (intensity) profile looks like from the
CMOS camera (Figure 7-9). A Gaussian profile was considered in both cases, with the 1/e2 values
being calculated by our custom-written software. This gave both a horizontal and vertical value, from
which an average was taken to give the measured beam diameters. These horizontal and vertical
dimensions are two perpendicular directions which fitted the beam profile. The measured pump and
probe beam diameters appear in Table 7-2.
Figure 7-9: Typical beam intensity profiles for the probe beam (left) and pump beam at ~500 nm (right), with
the respective beam diameters measured both horizontally and vertically at any two perpendicular dimensions.
The average beam spot size was calculated by assuming a Gaussian profile. Some scattering is, however,
evident in these profiles, as a result of the optics.
Table 7-2: The measured beam diameters using a ThorLabs DCC1545M CMOS camera.
Pump Beam Probe Beam
Beam diameter [μm] 700 650
Ve
rtic
al d
ista
nce
[µ
m]
Horizontal distance [µm]
1300
925
650
375
0
0 325 650 975 1300
1500
1125
750
375
0
0 325 650 975 1300
Chapter 7 Experimental
Page 46 of 74
7.4. Data acquisition: the ExciPro
The data was recorded by the ExciPro data acquisition software [78], with an average noise level
(sensitivity) of <1 mOD needed to detect the spectral signatures. Prior to initiating the experiments,
the quality of the raw probe and reference spectra were adjusted by transversely and/or longitudinally
tweaking the light through the optical fibres, and onto two separate PDAs, such that the recorded
spectral intensities were optimised and the spectral profiles were similar (see Raw spectra in Chapter
8, Figure 8-2),. A better signal-to-noise ratio can be achieved by increasing the sample averaging at
each delay time. The TA spectral data ∆𝑂𝐷(𝜆, 𝑡) is obtained as a function of delay time (t) and
wavelength (𝜆). The recorded parameters include the number of averages per time point, different
recording wavelength windows, and the number of passes (i.e., scanning through all the time points)
to get an overall sample measurement. The average IRF of the setup was obtained as 200 fs from the
data analysis process of Glotaran.
The instant when the pump and probe beams arrive simultaneously inside the sample (i.e.
temporal overlap) is termed time zero. Time zero is characterized by a negative amplitude (trough)
signal of change in sample absorption due to a GSB (see Chapter 3 and Chapter 4). A few data points
are taken before this instant to ensure not dynamics are lost, however, it can induce a coherent
artefact. Following this, the probe pulse is delayed in time tD, with respect to the pump pulse, and
hence a change in absorption can be characterized at specified probe delay times, after sample
excitation. The shorter the pulses, the easier it is to determine the ET dynamics of the fastest
processes. Measurements for the samples excited at 489 nm were first conducted and analysed with
the original system, prior to any changes in the setup. After the analysis, the necessary changes and
modifications mentioned above were all implemented in the system and improved before the samples
excited at 506 nm were investigated.
The photoinduced absorbance changes are calculated using equation (4-6) (section 4.3,
Chapter 4), in accordance to the ratio of the pump and reference beam intensities at a specific
wavelength for an excited and unexcited sample. The recorded data was saved, and exported in
ASCII format to the Glotaran [37] software for further analysis to extract decay lifetimes.
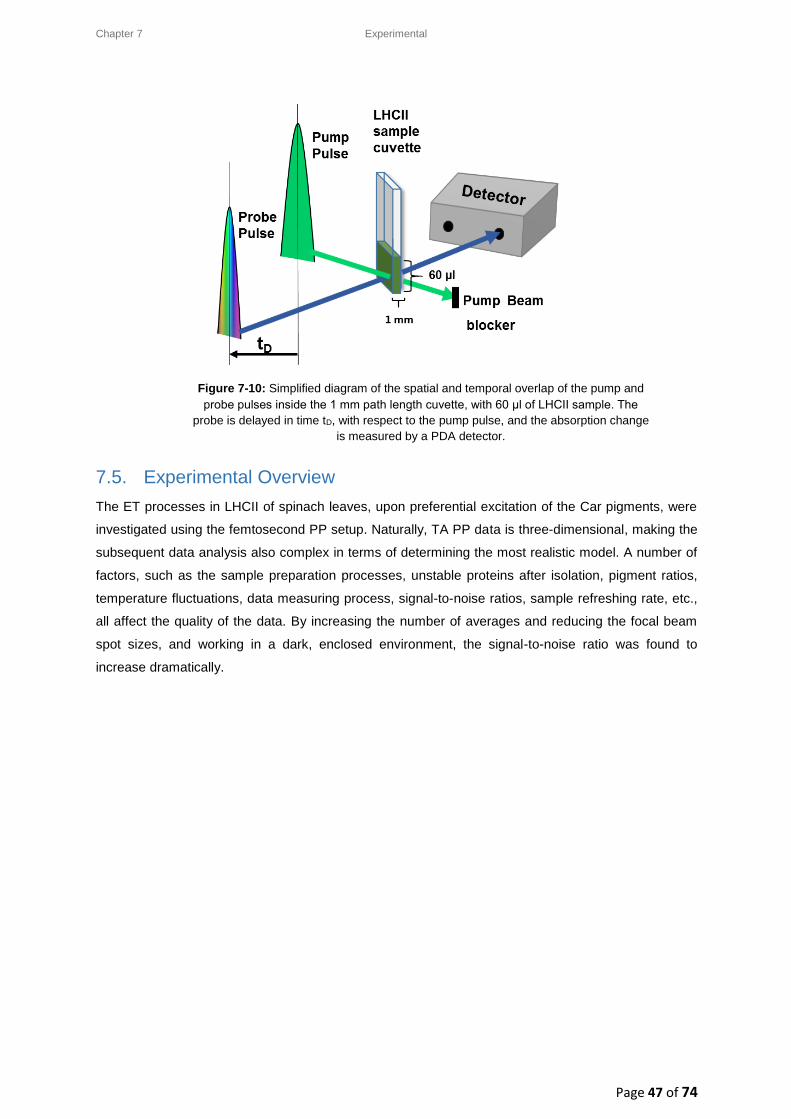
Chapter 7 Experimental
Page 47 of 74
Figure 7-10: Simplified diagram of the spatial and temporal overlap of the pump and
probe pulses inside the 1 mm path length cuvette, with 60 μl of LHCII sample. The
probe is delayed in time tD, with respect to the pump pulse, and the absorption change
is measured by a PDA detector.
7.5. Experimental Overview
The ET processes in LHCII of spinach leaves, upon preferential excitation of the Car pigments, were
investigated using the femtosecond PP setup. Naturally, TA PP data is three-dimensional, making the
subsequent data analysis also complex in terms of determining the most realistic model. A number of
factors, such as the sample preparation processes, unstable proteins after isolation, pigment ratios,
temperature fluctuations, data measuring process, signal-to-noise ratios, sample refreshing rate, etc.,
all affect the quality of the data. By increasing the number of averages and reducing the focal beam
spot sizes, and working in a dark, enclosed environment, the signal-to-noise ratio was found to
increase dramatically.
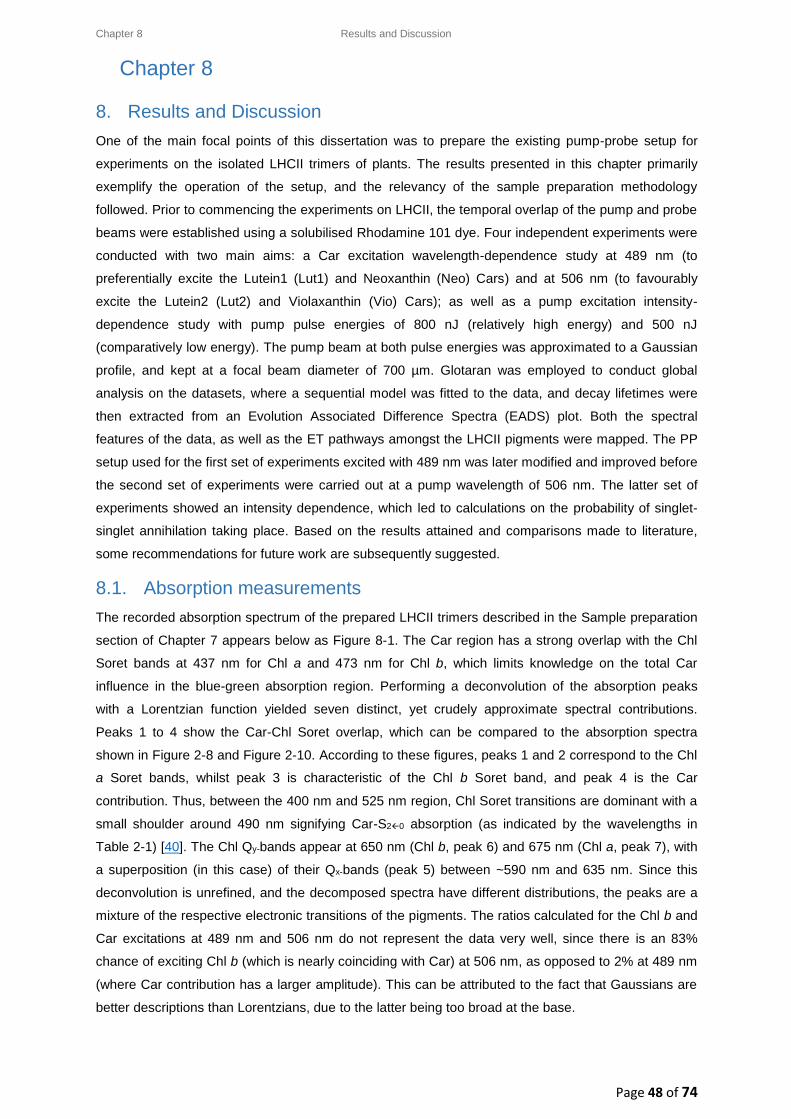
Chapter 8 Results and Discussion
Page 48 of 74
Chapter 8
8. Results and Discussion
One of the main focal points of this dissertation was to prepare the existing pump-probe setup for
experiments on the isolated LHCII trimers of plants. The results presented in this chapter primarily
exemplify the operation of the setup, and the relevancy of the sample preparation methodology
followed. Prior to commencing the experiments on LHCII, the temporal overlap of the pump and probe
beams were established using a solubilised Rhodamine 101 dye. Four independent experiments were
conducted with two main aims: a Car excitation wavelength-dependence study at 489 nm (to
preferentially excite the Lutein1 (Lut1) and Neoxanthin (Neo) Cars) and at 506 nm (to favourably
excite the Lutein2 (Lut2) and Violaxanthin (Vio) Cars); as well as a pump excitation intensity-
dependence study with pump pulse energies of 800 nJ (relatively high energy) and 500 nJ
(comparatively low energy). The pump beam at both pulse energies was approximated to a Gaussian
profile, and kept at a focal beam diameter of 700 µm. Glotaran was employed to conduct global
analysis on the datasets, where a sequential model was fitted to the data, and decay lifetimes were
then extracted from an Evolution Associated Difference Spectra (EADS) plot. Both the spectral
features of the data, as well as the ET pathways amongst the LHCII pigments were mapped. The PP
setup used for the first set of experiments excited with 489 nm was later modified and improved before
the second set of experiments were carried out at a pump wavelength of 506 nm. The latter set of
experiments showed an intensity dependence, which led to calculations on the probability of singlet-
singlet annihilation taking place. Based on the results attained and comparisons made to literature,
some recommendations for future work are subsequently suggested.
8.1. Absorption measurements
The recorded absorption spectrum of the prepared LHCII trimers described in the Sample preparation
section of Chapter 7 appears below as Figure 8-1. The Car region has a strong overlap with the Chl
Soret bands at 437 nm for Chl a and 473 nm for Chl b, which limits knowledge on the total Car
influence in the blue-green absorption region. Performing a deconvolution of the absorption peaks
with a Lorentzian function yielded seven distinct, yet crudely approximate spectral contributions.
Peaks 1 to 4 show the Car-Chl Soret overlap, which can be compared to the absorption spectra
shown in Figure 2-8 and Figure 2-10. According to these figures, peaks 1 and 2 correspond to the Chl
a Soret bands, whilst peak 3 is characteristic of the Chl b Soret band, and peak 4 is the Car
contribution. Thus, between the 400 nm and 525 nm region, Chl Soret transitions are dominant with a
small shoulder around 490 nm signifying Car-S20 absorption (as indicated by the wavelengths in
Table 2-1) [40]. The Chl Qy-bands appear at 650 nm (Chl b, peak 6) and 675 nm (Chl a, peak 7), with
a superposition (in this case) of their Qx-bands (peak 5) between ~590 nm and 635 nm. Since this
deconvolution is unrefined, and the decomposed spectra have different distributions, the peaks are a
mixture of the respective electronic transitions of the pigments. The ratios calculated for the Chl b and
Car excitations at 489 nm and 506 nm do not represent the data very well, since there is an 83%
chance of exciting Chl b (which is nearly coinciding with Car) at 506 nm, as opposed to 2% at 489 nm
(where Car contribution has a larger amplitude). This can be attributed to the fact that Gaussians are
better descriptions than Lorentzians, due to the latter being too broad at the base.
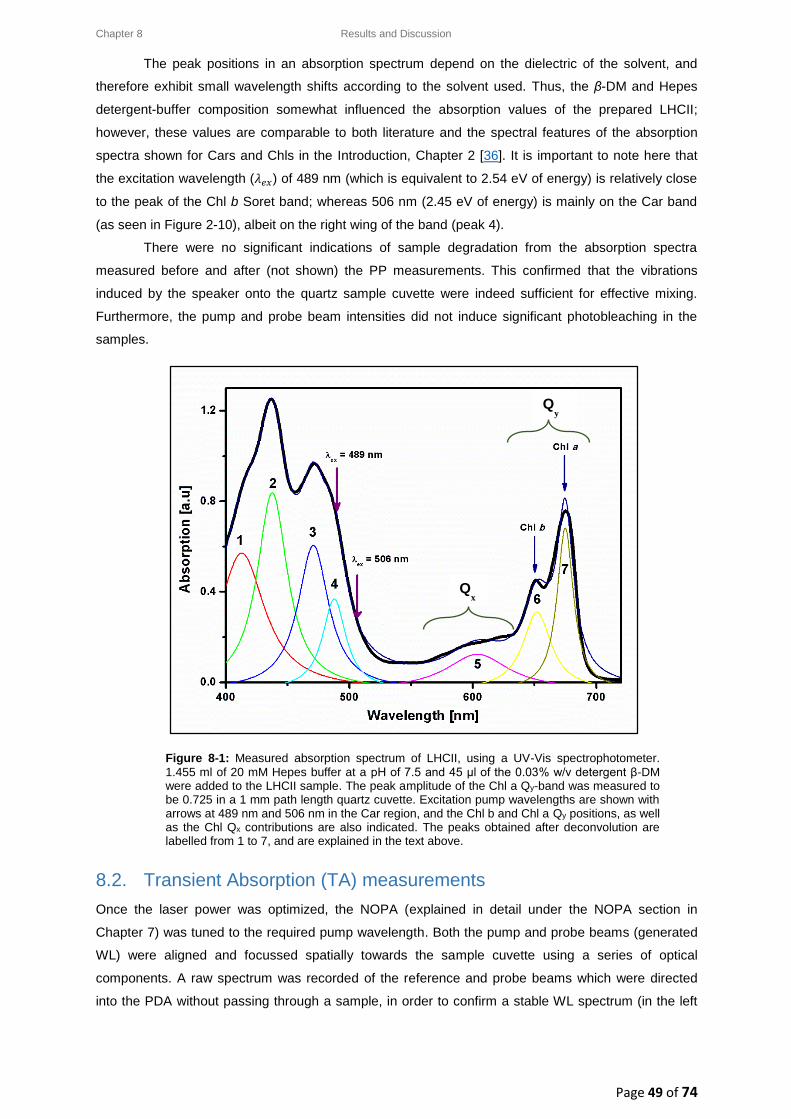
Chapter 8 Results and Discussion
Page 49 of 74
The peak positions in an absorption spectrum depend on the dielectric of the solvent, and
therefore exhibit small wavelength shifts according to the solvent used. Thus, the β-DM and Hepes
detergent-buffer composition somewhat influenced the absorption values of the prepared LHCII;
however, these values are comparable to both literature and the spectral features of the absorption
spectra shown for Cars and Chls in the Introduction, Chapter 2 [36]. It is important to note here that
the excitation wavelength (𝜆𝑒𝑥) of 489 nm (which is equivalent to 2.54 eV of energy) is relatively close
to the peak of the Chl b Soret band; whereas 506 nm (2.45 eV of energy) is mainly on the Car band
(as seen in Figure 2-10), albeit on the right wing of the band (peak 4).
There were no significant indications of sample degradation from the absorption spectra
measured before and after (not shown) the PP measurements. This confirmed that the vibrations
induced by the speaker onto the quartz sample cuvette were indeed sufficient for effective mixing.
Furthermore, the pump and probe beam intensities did not induce significant photobleaching in the
samples.
8.2. Transient Absorption (TA) measurements
Once the laser power was optimized, the NOPA (explained in detail under the NOPA section in
Chapter 7) was tuned to the required pump wavelength. Both the pump and probe beams (generated
WL) were aligned and focussed spatially towards the sample cuvette using a series of optical
components. A raw spectrum was recorded of the reference and probe beams which were directed
into the PDA without passing through a sample, in order to confirm a stable WL spectrum (in the left
Figure 8-1: Measured absorption spectrum of LHCII, using a UV-Vis spectrophotometer.
1.455 ml of 20 mM Hepes buffer at a pH of 7.5 and 45 μl of the 0.03% w/v detergent β-DM were added to the LHCII sample. The peak amplitude of the Chl a Qy-band was measured to be 0.725 in a 1 mm path length quartz cuvette. Excitation pump wavelengths are shown with arrows at 489 nm and 506 nm in the Car region, and the Chl b and Chl a Qy positions, as well as the Chl Qx contributions are also indicated. The peaks obtained after deconvolution are labelled from 1 to 7, and are explained in the text above.
Qy
Qx
Chapter 8 Results and Discussion
Page 50 of 74
panel of Figure 8-2, only a typical distinct spectrum of the WL probe, generated through a sapphire
plate, is shown). The raw data intensities of the reference and probe spectra should ideally be the
same (not differ by more than 6%) to ensure coverage of the spectral window of interest from 475 nm
to 690 nm for an optimal signal-to-noise ratio for LHCII. This also ensures a distinction between
pumped and unpumped light. Figure 8-2 (right) illustrates a typical overlap between the probe and
reference beams for light passing through an unpumped preparation of the LHCII sample in a quartz
cuvette. Inspection of the raw data of both the probe and reference spectra here, in the spectral
window of 485 nm to 700 nm, we notice two small shoulders at 640 nm and 660 nm, which is similar
to the inverse of what is seen in the absorption spectrum (Figure 8-1). A dip at 675 nm represents the
Chl a peak, and a small dip at 650 nm confirms the presence of Chl b, through the sensitivity of the
instrument. A difference is expected between the raw probe spectra detected without a sample and
with a sample, which confirms that the WL was indeed absorbed by the sample, around the expected
absorption wavelengths.
Figure 8-2: The raw spectrum of the WL probe beam (left) detected by the PDA, without passing
through any sample. This shows the WL spectrum generated through the sapphire plate. On the right is a raw spectrum of both the reference (dashed-dotted line) and probe (solid line) beams detected after passing through an unpumped LHCII sample in a 1 mm quartz cuvette. These spectral signatures confirm that the sample absorbs the WL, and that the approximate absorption peak positions are identifiable by the instrument.
In general, LHCII is known to have a very short Car ES lifetime, as well as a high sensitivity to
degradation through photobleaching. Thus, prior to the commencement of the LHCII measurements, a
temporal and spatial overlap of the pump and probe beams was established in the sample cuvette. A
more stable compound such as Rhodamine (Rho101) dye powder in solution with distilled water was
used.
8.2.1. Establishing temporal overlap The temporal overlap of the pump and probe beams was found as the “time zero” between 0 ps (black
spectrum) and 1 ps (red spectrum) in Figure 8-3 with Rho101 dye solubilised in distilled water. This
overlap was detected between the first GSB at 500 nm and the second bleach at 573 nm. Maximum
bleaching at 500 nm took place around 2 ps, after which the sample decays with a larger change at 4
ps. The corresponding decay profile for the bleach at 573 nm in Figure 8-4 has large time steps, which
were used to track the progression of the data recording process.
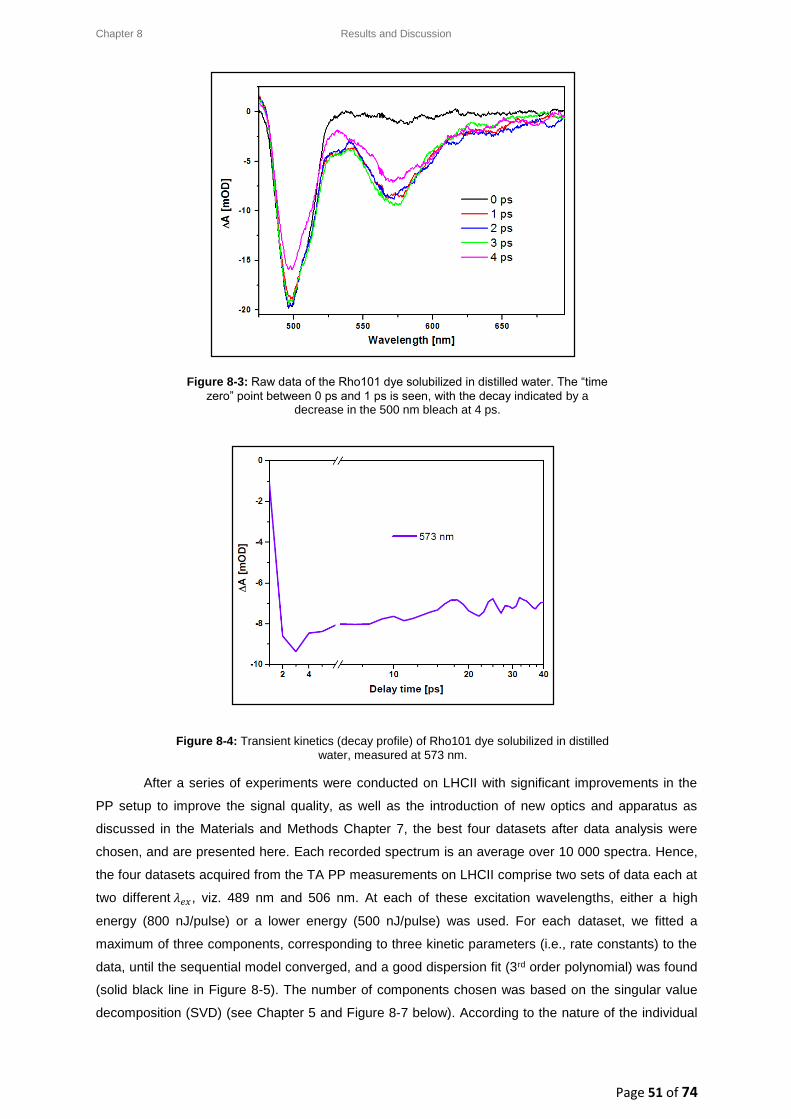
Chapter 8 Results and Discussion
Page 51 of 74
Figure 8-3: Raw data of the Rho101 dye solubilized in distilled water. The “time
zero” point between 0 ps and 1 ps is seen, with the decay indicated by a decrease in the 500 nm bleach at 4 ps.
Figure 8-4: Transient kinetics (decay profile) of Rho101 dye solubilized in distilled
water, measured at 573 nm.
After a series of experiments were conducted on LHCII with significant improvements in the
PP setup to improve the signal quality, as well as the introduction of new optics and apparatus as
discussed in the Materials and Methods Chapter 7, the best four datasets after data analysis were
chosen, and are presented here. Each recorded spectrum is an average over 10 000 spectra. Hence,
the four datasets acquired from the TA PP measurements on LHCII comprise two sets of data each at
two different 𝜆𝑒𝑥, viz. 489 nm and 506 nm. At each of these excitation wavelengths, either a high
energy (800 nJ/pulse) or a lower energy (500 nJ/pulse) was used. For each dataset, we fitted a
maximum of three components, corresponding to three kinetic parameters (i.e., rate constants) to the
data, until the sequential model converged, and a good dispersion fit (3rd order polynomial) was found
(solid black line in Figure 8-5). The number of components chosen was based on the singular value
decomposition (SVD) (see Chapter 5 and Figure 8-7 below). According to the nature of the individual
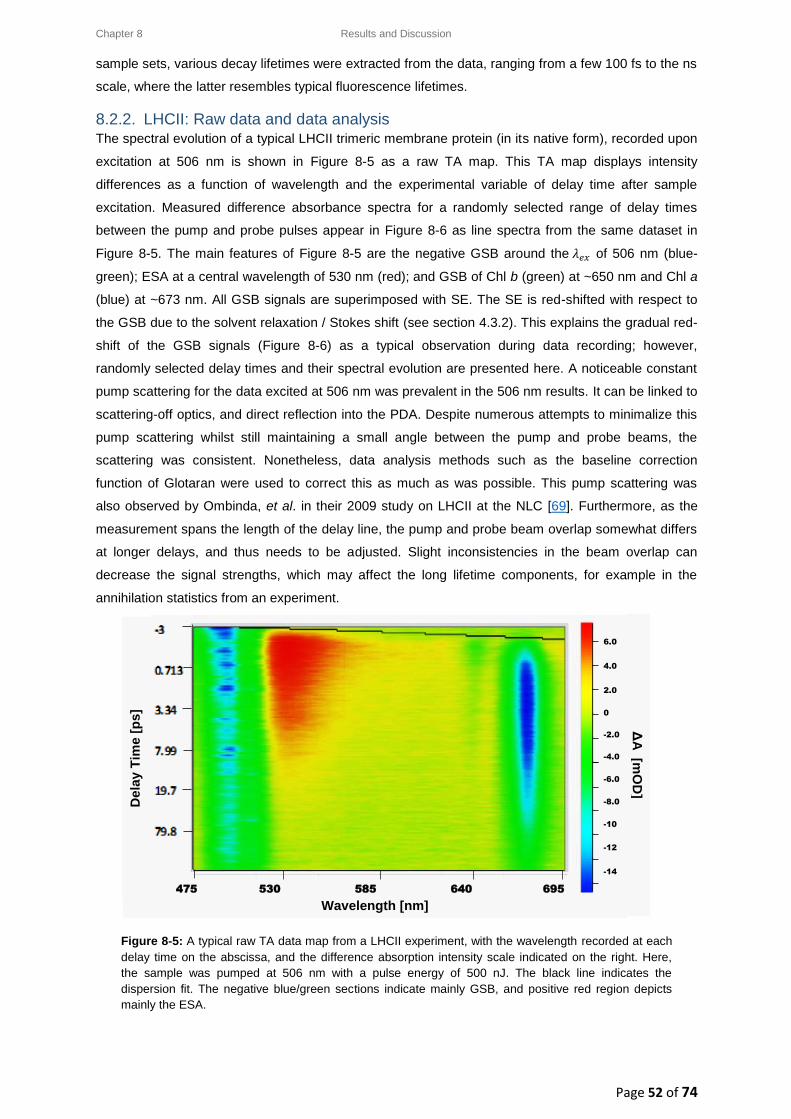
Chapter 8 Results and Discussion
Page 52 of 74
sample sets, various decay lifetimes were extracted from the data, ranging from a few 100 fs to the ns
scale, where the latter resembles typical fluorescence lifetimes.
8.2.2. LHCII: Raw data and data analysis The spectral evolution of a typical LHCII trimeric membrane protein (in its native form), recorded upon
excitation at 506 nm is shown in Figure 8-5 as a raw TA map. This TA map displays intensity
differences as a function of wavelength and the experimental variable of delay time after sample
excitation. Measured difference absorbance spectra for a randomly selected range of delay times
between the pump and probe pulses appear in Figure 8-6 as line spectra from the same dataset in
Figure 8-5. The main features of Figure 8-5 are the negative GSB around the 𝜆𝑒𝑥 of 506 nm (blue-
green); ESA at a central wavelength of 530 nm (red); and GSB of Chl b (green) at ~650 nm and Chl a
(blue) at ~673 nm. All GSB signals are superimposed with SE. The SE is red-shifted with respect to
the GSB due to the solvent relaxation / Stokes shift (see section 4.3.2). This explains the gradual red-
shift of the GSB signals (Figure 8-6) as a typical observation during data recording; however,
randomly selected delay times and their spectral evolution are presented here. A noticeable constant
pump scattering for the data excited at 506 nm was prevalent in the 506 nm results. It can be linked to
scattering-off optics, and direct reflection into the PDA. Despite numerous attempts to minimalize this
pump scattering whilst still maintaining a small angle between the pump and probe beams, the
scattering was consistent. Nonetheless, data analysis methods such as the baseline correction
function of Glotaran were used to correct this as much as was possible. This pump scattering was
also observed by Ombinda, et al. in their 2009 study on LHCII at the NLC [69]. Furthermore, as the
measurement spans the length of the delay line, the pump and probe beam overlap somewhat differs
at longer delays, and thus needs to be adjusted. Slight inconsistencies in the beam overlap can
decrease the signal strengths, which may affect the long lifetime components, for example in the
annihilation statistics from an experiment.
Figure 8-5: A typical raw TA data map from a LHCII experiment, with the wavelength recorded at each
delay time on the abscissa, and the difference absorption intensity scale indicated on the right. Here,
the sample was pumped at 506 nm with a pulse energy of 500 nJ. The black line indicates the
dispersion fit. The negative blue/green sections indicate mainly GSB, and positive red region depicts
mainly the ESA.
Dela
y T
ime [
ps]
Wavelength [nm]
ΔA
[mO
D]
6.0
4.0
2.0
0
-2.0
-4.0
-6.0
-8.0
-10
-12
-14
475 530 585 640 695
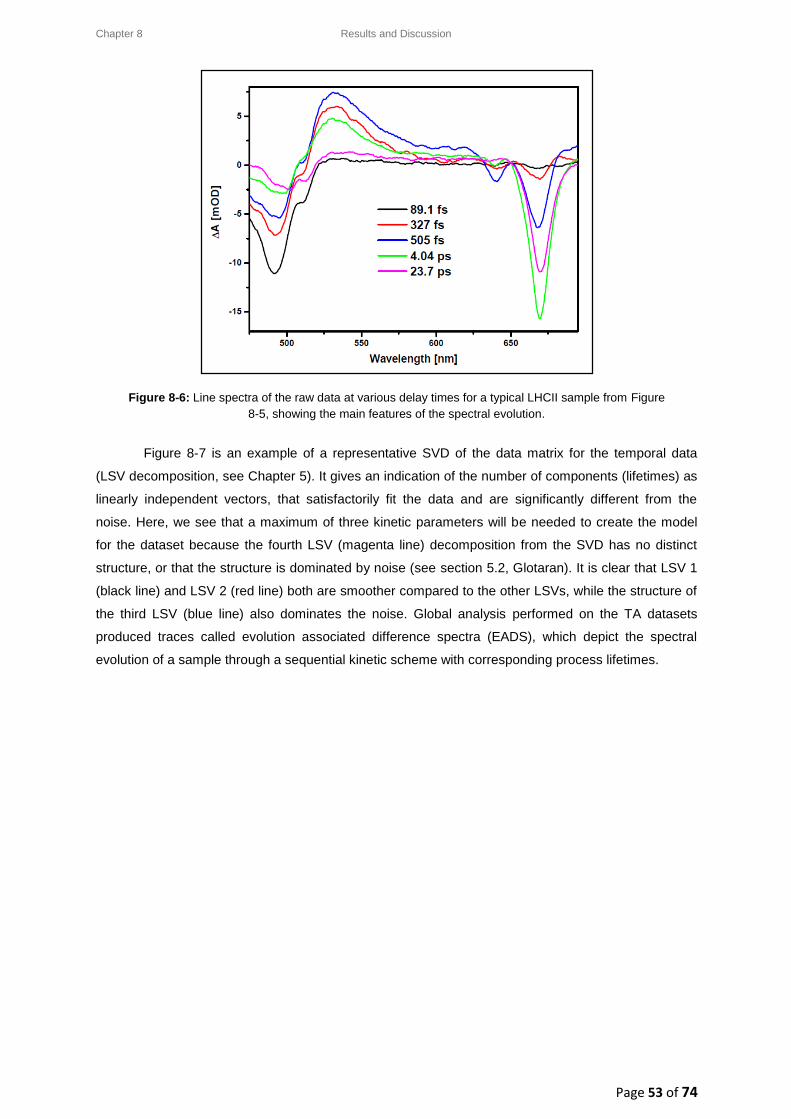
Chapter 8 Results and Discussion
Page 53 of 74
Figure 8-6: Line spectra of the raw data at various delay times for a typical LHCII sample from Figure
8-5, showing the main features of the spectral evolution.
Figure 8-7 is an example of a representative SVD of the data matrix for the temporal data
(LSV decomposition, see Chapter 5). It gives an indication of the number of components (lifetimes) as
linearly independent vectors, that satisfactorily fit the data and are significantly different from the
noise. Here, we see that a maximum of three kinetic parameters will be needed to create the model
for the dataset because the fourth LSV (magenta line) decomposition from the SVD has no distinct
structure, or that the structure is dominated by noise (see section 5.2, Glotaran). It is clear that LSV 1
(black line) and LSV 2 (red line) both are smoother compared to the other LSVs, while the structure of
the third LSV (blue line) also dominates the noise. Global analysis performed on the TA datasets
produced traces called evolution associated difference spectra (EADS), which depict the spectral
evolution of a sample through a sequential kinetic scheme with corresponding process lifetimes.
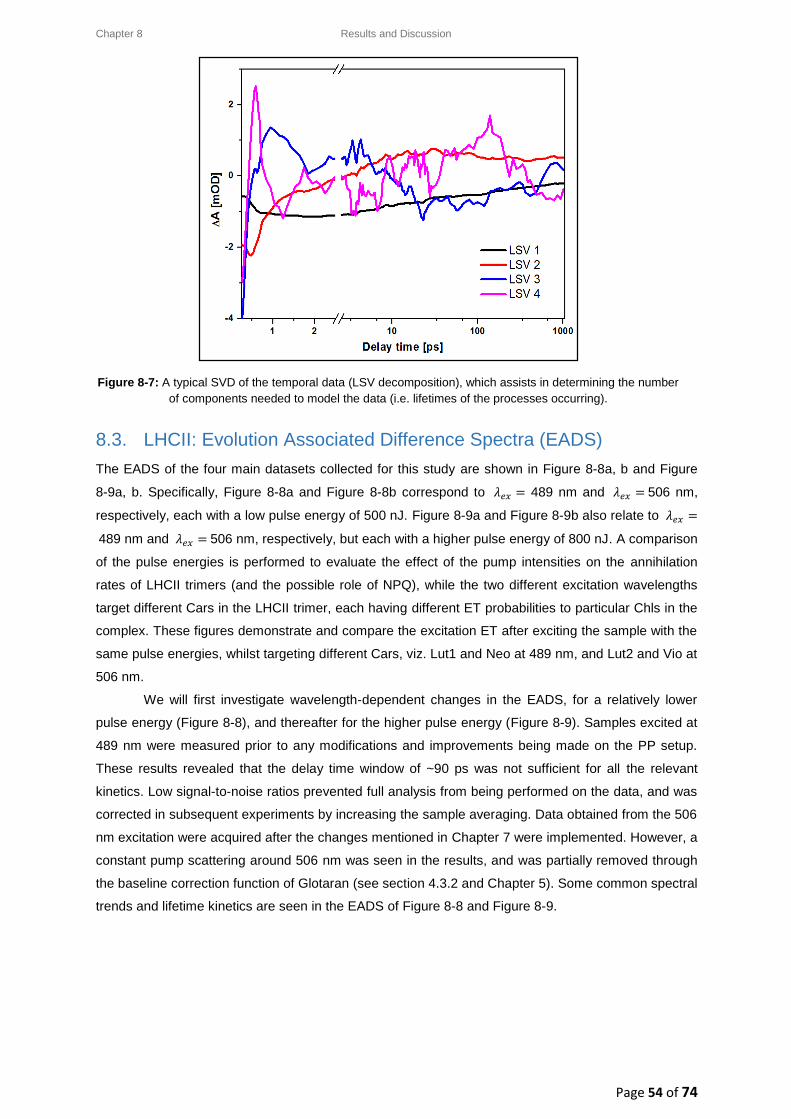
Chapter 8 Results and Discussion
Page 54 of 74
Figure 8-7: A typical SVD of the temporal data (LSV decomposition), which assists in determining the number
of components needed to model the data (i.e. lifetimes of the processes occurring).
8.3. LHCII: Evolution Associated Difference Spectra (EADS)
The EADS of the four main datasets collected for this study are shown in Figure 8-8a, b and Figure
8-9a, b. Specifically, Figure 8-8a and Figure 8-8b correspond to 𝜆𝑒𝑥 = 489 nm and 𝜆𝑒𝑥 = 506 nm,
respectively, each with a low pulse energy of 500 nJ. Figure 8-9a and Figure 8-9b also relate to 𝜆𝑒𝑥 =
489 nm and 𝜆𝑒𝑥 = 506 nm, respectively, but each with a higher pulse energy of 800 nJ. A comparison
of the pulse energies is performed to evaluate the effect of the pump intensities on the annihilation
rates of LHCII trimers (and the possible role of NPQ), while the two different excitation wavelengths
target different Cars in the LHCII trimer, each having different ET probabilities to particular Chls in the
complex. These figures demonstrate and compare the excitation ET after exciting the sample with the
same pulse energies, whilst targeting different Cars, viz. Lut1 and Neo at 489 nm, and Lut2 and Vio at
506 nm.
We will first investigate wavelength-dependent changes in the EADS, for a relatively lower
pulse energy (Figure 8-8), and thereafter for the higher pulse energy (Figure 8-9). Samples excited at
489 nm were measured prior to any modifications and improvements being made on the PP setup.
These results revealed that the delay time window of ~90 ps was not sufficient for all the relevant
kinetics. Low signal-to-noise ratios prevented full analysis from being performed on the data, and was
corrected in subsequent experiments by increasing the sample averaging. Data obtained from the 506
nm excitation were acquired after the changes mentioned in Chapter 7 were implemented. However, a
constant pump scattering around 506 nm was seen in the results, and was partially removed through
the baseline correction function of Glotaran (see section 4.3.2 and Chapter 5). Some common spectral
trends and lifetime kinetics are seen in the EADS of Figure 8-8 and Figure 8-9.
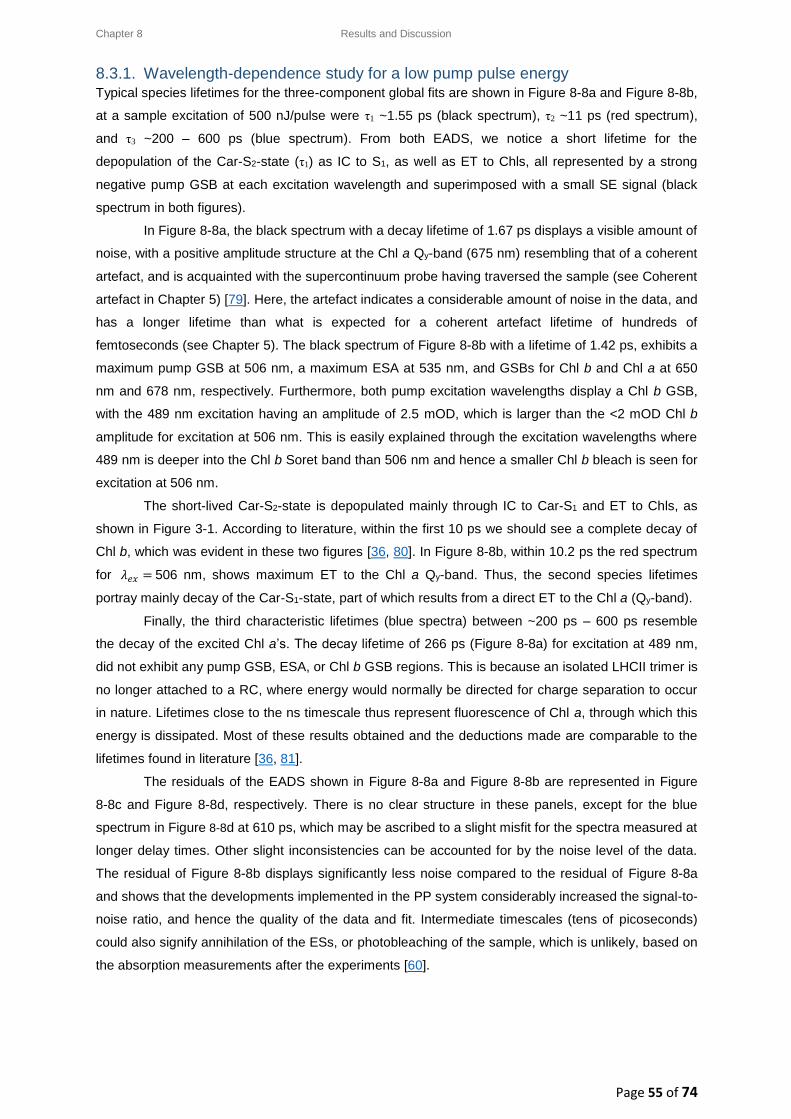
Chapter 8 Results and Discussion
Page 55 of 74
8.3.1. Wavelength-dependence study for a low pump pulse energy Typical species lifetimes for the three-component global fits are shown in Figure 8-8a and Figure 8-8b,
at a sample excitation of 500 nJ/pulse were τ1 ~1.55 ps (black spectrum), τ2 ~11 ps (red spectrum),
and τ3 ~200 – 600 ps (blue spectrum). From both EADS, we notice a short lifetime for the
depopulation of the Car-S2-state (τ1) as IC to S1, as well as ET to Chls, all represented by a strong
negative pump GSB at each excitation wavelength and superimposed with a small SE signal (black
spectrum in both figures).
In Figure 8-8a, the black spectrum with a decay lifetime of 1.67 ps displays a visible amount of
noise, with a positive amplitude structure at the Chl a Qy-band (675 nm) resembling that of a coherent
artefact, and is acquainted with the supercontinuum probe having traversed the sample (see Coherent
artefact in Chapter 5) [79]. Here, the artefact indicates a considerable amount of noise in the data, and
has a longer lifetime than what is expected for a coherent artefact lifetime of hundreds of
femtoseconds (see Chapter 5). The black spectrum of Figure 8-8b with a lifetime of 1.42 ps, exhibits a
maximum pump GSB at 506 nm, a maximum ESA at 535 nm, and GSBs for Chl b and Chl a at 650
nm and 678 nm, respectively. Furthermore, both pump excitation wavelengths display a Chl b GSB,
with the 489 nm excitation having an amplitude of 2.5 mOD, which is larger than the <2 mOD Chl b
amplitude for excitation at 506 nm. This is easily explained through the excitation wavelengths where
489 nm is deeper into the Chl b Soret band than 506 nm and hence a smaller Chl b bleach is seen for
excitation at 506 nm.
The short-lived Car-S2-state is depopulated mainly through IC to Car-S1 and ET to Chls, as
shown in Figure 3-1. According to literature, within the first 10 ps we should see a complete decay of
Chl b, which was evident in these two figures [36, 80]. In Figure 8-8b, within 10.2 ps the red spectrum
for 𝜆𝑒𝑥 = 506 nm, shows maximum ET to the Chl a Qy-band. Thus, the second species lifetimes
portray mainly decay of the Car-S1-state, part of which results from a direct ET to the Chl a (Qy-band).
Finally, the third characteristic lifetimes (blue spectra) between ~200 ps – 600 ps resemble
the decay of the excited Chl a’s. The decay lifetime of 266 ps (Figure 8-8a) for excitation at 489 nm,
did not exhibit any pump GSB, ESA, or Chl b GSB regions. This is because an isolated LHCII trimer is
no longer attached to a RC, where energy would normally be directed for charge separation to occur
in nature. Lifetimes close to the ns timescale thus represent fluorescence of Chl a, through which this
energy is dissipated. Most of these results obtained and the deductions made are comparable to the
lifetimes found in literature [36, 81].
The residuals of the EADS shown in Figure 8-8a and Figure 8-8b are represented in Figure
8-8c and Figure 8-8d, respectively. There is no clear structure in these panels, except for the blue
spectrum in Figure 8-8d at 610 ps, which may be ascribed to a slight misfit for the spectra measured at
longer delay times. Other slight inconsistencies can be accounted for by the noise level of the data.
The residual of Figure 8-8b displays significantly less noise compared to the residual of Figure 8-8a
and shows that the developments implemented in the PP system considerably increased the signal-to-
noise ratio, and hence the quality of the data and fit. Intermediate timescales (tens of picoseconds)
could also signify annihilation of the ESs, or photobleaching of the sample, which is unlikely, based on
the absorption measurements after the experiments [60].
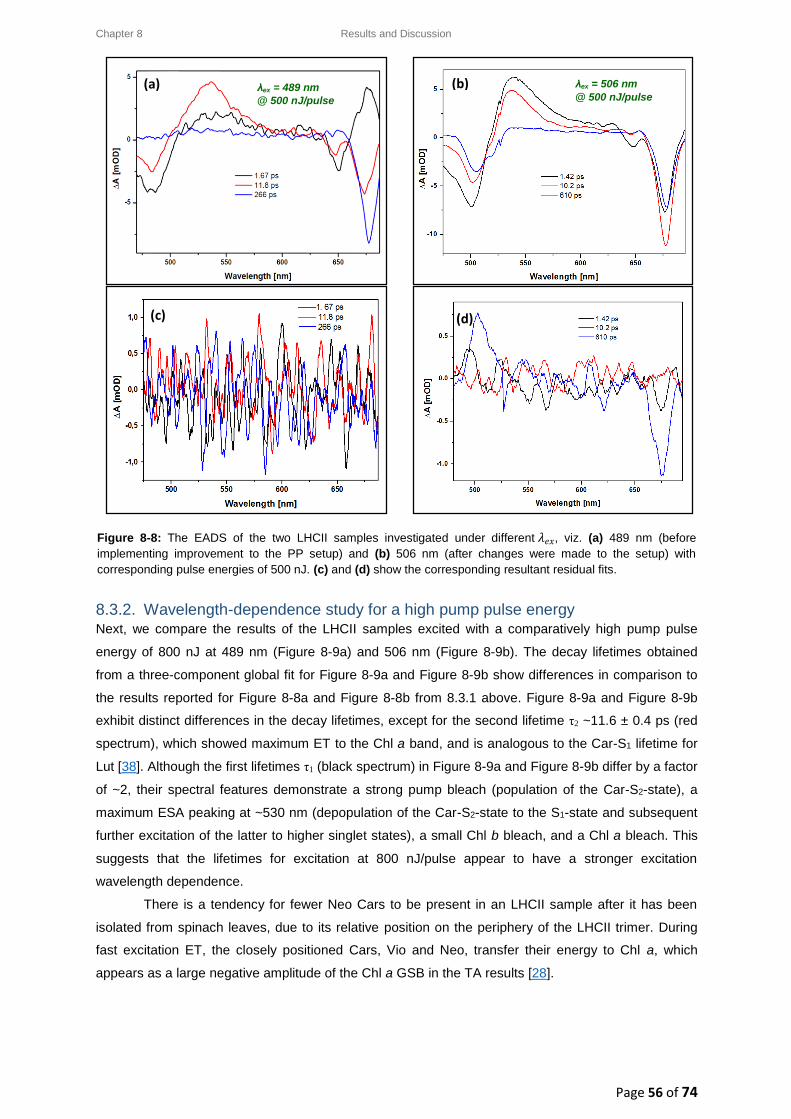
Chapter 8 Results and Discussion
Page 56 of 74
Figure 8-8: The EADS of the two LHCII samples investigated under different 𝜆𝑒𝑥, viz. (a) 489 nm (before
implementing improvement to the PP setup) and (b) 506 nm (after changes were made to the setup) with
corresponding pulse energies of 500 nJ. (c) and (d) show the corresponding resultant residual fits.
8.3.2. Wavelength-dependence study for a high pump pulse energy Next, we compare the results of the LHCII samples excited with a comparatively high pump pulse
energy of 800 nJ at 489 nm (Figure 8-9a) and 506 nm (Figure 8-9b). The decay lifetimes obtained
from a three-component global fit for Figure 8-9a and Figure 8-9b show differences in comparison to
the results reported for Figure 8-8a and Figure 8-8b from 8.3.1 above. Figure 8-9a and Figure 8-9b
exhibit distinct differences in the decay lifetimes, except for the second lifetime τ2 ~11.6 ± 0.4 ps (red
spectrum), which showed maximum ET to the Chl a band, and is analogous to the Car-S1 lifetime for
Lut [38]. Although the first lifetimes τ1 (black spectrum) in Figure 8-9a and Figure 8-9b differ by a factor
of ~2, their spectral features demonstrate a strong pump bleach (population of the Car-S2-state), a
maximum ESA peaking at ~530 nm (depopulation of the Car-S2-state to the S1-state and subsequent
further excitation of the latter to higher singlet states), a small Chl b bleach, and a Chl a bleach. This
suggests that the lifetimes for excitation at 800 nJ/pulse appear to have a stronger excitation
wavelength dependence.
There is a tendency for fewer Neo Cars to be present in an LHCII sample after it has been
isolated from spinach leaves, due to its relative position on the periphery of the LHCII trimer. During
fast excitation ET, the closely positioned Cars, Vio and Neo, transfer their energy to Chl a, which
appears as a large negative amplitude of the Chl a GSB in the TA results [28].
λex = 506 nm
@ 500 nJ/pulse λex = 489 nm
@ 500 nJ/pulse
(a) (b)
(c) (d)
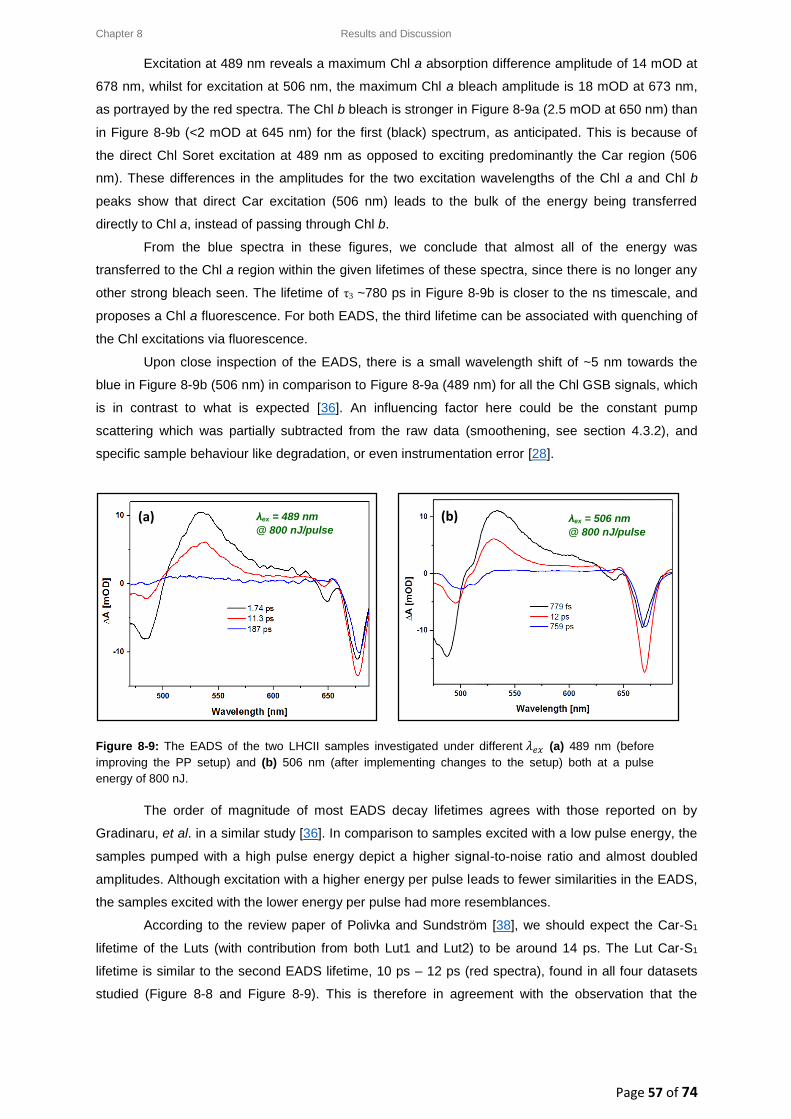
Chapter 8 Results and Discussion
Page 57 of 74
Excitation at 489 nm reveals a maximum Chl a absorption difference amplitude of 14 mOD at
678 nm, whilst for excitation at 506 nm, the maximum Chl a bleach amplitude is 18 mOD at 673 nm,
as portrayed by the red spectra. The Chl b bleach is stronger in Figure 8-9a (2.5 mOD at 650 nm) than
in Figure 8-9b (<2 mOD at 645 nm) for the first (black) spectrum, as anticipated. This is because of
the direct Chl Soret excitation at 489 nm as opposed to exciting predominantly the Car region (506
nm). These differences in the amplitudes for the two excitation wavelengths of the Chl a and Chl b
peaks show that direct Car excitation (506 nm) leads to the bulk of the energy being transferred
directly to Chl a, instead of passing through Chl b.
From the blue spectra in these figures, we conclude that almost all of the energy was
transferred to the Chl a region within the given lifetimes of these spectra, since there is no longer any
other strong bleach seen. The lifetime of τ3 ~780 ps in Figure 8-9b is closer to the ns timescale, and
proposes a Chl a fluorescence. For both EADS, the third lifetime can be associated with quenching of
the Chl excitations via fluorescence.
Upon close inspection of the EADS, there is a small wavelength shift of ~5 nm towards the
blue in Figure 8-9b (506 nm) in comparison to Figure 8-9a (489 nm) for all the Chl GSB signals, which
is in contrast to what is expected [36]. An influencing factor here could be the constant pump
scattering which was partially subtracted from the raw data (smoothening, see section 4.3.2), and
specific sample behaviour like degradation, or even instrumentation error [28].
The order of magnitude of most EADS decay lifetimes agrees with those reported on by
Gradinaru, et al. in a similar study [36]. In comparison to samples excited with a low pulse energy, the
samples pumped with a high pulse energy depict a higher signal-to-noise ratio and almost doubled
amplitudes. Although excitation with a higher energy per pulse leads to fewer similarities in the EADS,
the samples excited with the lower energy per pulse had more resemblances.
According to the review paper of Polivka and Sundström [38], we should expect the Car-S1
lifetime of the Luts (with contribution from both Lut1 and Lut2) to be around 14 ps. The Lut Car-S1
lifetime is similar to the second EADS lifetime, 10 ps – 12 ps (red spectra), found in all four datasets
studied (Figure 8-8 and Figure 8-9). This is therefore in agreement with the observation that the
Figure 8-9: The EADS of the two LHCII samples investigated under different 𝜆𝑒𝑥 (a) 489 nm (before
improving the PP setup) and (b) 506 nm (after implementing changes to the setup) both at a pulse
energy of 800 nJ.
λex = 506 nm
@ 800 nJ/pulse
λex = 489 nm
@ 800 nJ/pulse (a) (b)
Chapter 8 Results and Discussion
Page 58 of 74
second EADS (red spectra) resembles mainly Car-S1 decay, after which ET to Chl a was seen.
Lifetimes longer than the 10 ps regime correspond to the other LHCII Cars, but could also be an
indication of faster annihilation rates compared to what has previously been reported [61]. For the first
lifetimes (black spectra) in all four EADS, we see the characteristic spectral features, particularly a
small Chl b GSB is detected. The third lifetimes (blue spectra) for the 489 nm excitation at high and
low pulse energies have a faster ~100 ps – 300 ps timescale compared to the excitations at 506 nm,
where the timescales are slower between 600 ps – 800 ps. This means that the excited Chl Soret
band at 489 nm contributes to quicker ET towards the Chl region, and the longer lifetimes extending
towards the ns timescale is synonymous of Chl a fluorescence.
8.4. LHCII: Intensity-dependence studies
The intensity-dependent studies provide some vital information on the behaviour of LHCII under
different circumstances. Firstly, we shall investigate the transient kinetics of the various bleaches and
spectral phenomena detected in the experiments. For a more detailed study, the Chl a GSB (for each
intensity) was chosen for a bi-exponential fit, since the Chl a Qy bleach is associated with singlet-
singlet annihilation. Two lifetimes each are extracted and compared to each other from the LHCII
samples excited at 506 nm. Thereafter, in section 8.5, some basic annihilation calculations are
performed on the data and linked to literature to better understand the effects of the different
conditions on the LHCII sample.
8.4.1. Typical decay transient kinetics for LHCII Figure 8-10 shows the archetypal kinetic profiles of Figure 8-9a at characteristic wavelengths (scaled),
i.e., a pump GSB at 489 nm, ESA at 530 nm, and the Qy GSBs of Chl b and Chl a at 645 nm and 675
nm respectively. These profiles have the same time origin from which they evolve, and are
characteristic of a sequential model. At first glance, it is apparent that these decay profiles are noisy
due to a small sampling average. Each trace decays at a different rate, with the trace at 489 nm (black
line) reflecting the rapid decay of the Car-S2-state. The positive 530 nm ESA trace (red line) signifies
the population of higher vibrational levels of the Car electronic ESs. The ES decays to lower Car
states, or the energy is transferred towards the Chl region (as explained through Figure 3-1). At 645
nm, the peak of the Chl b GSB (blue line) displays a rapid decay as energy is transferred to Chl a.
This wavelength of 645 nm has a very small change in absorption (~3 mOD), implying a possible loss
of some of the peripheral Chl b pigments from the sample. The 675 nm trace (magenta line),
corresponding to the strong Chl a bleach, has the longest rise time, suggesting that ET to the Chl a
Qy-band was the dominant and terminal process. Each trace is characteristic to the positive and
negative signals seen in the EADS at the various wavelengths as introduced in Figure 4-2 of section
4.3.
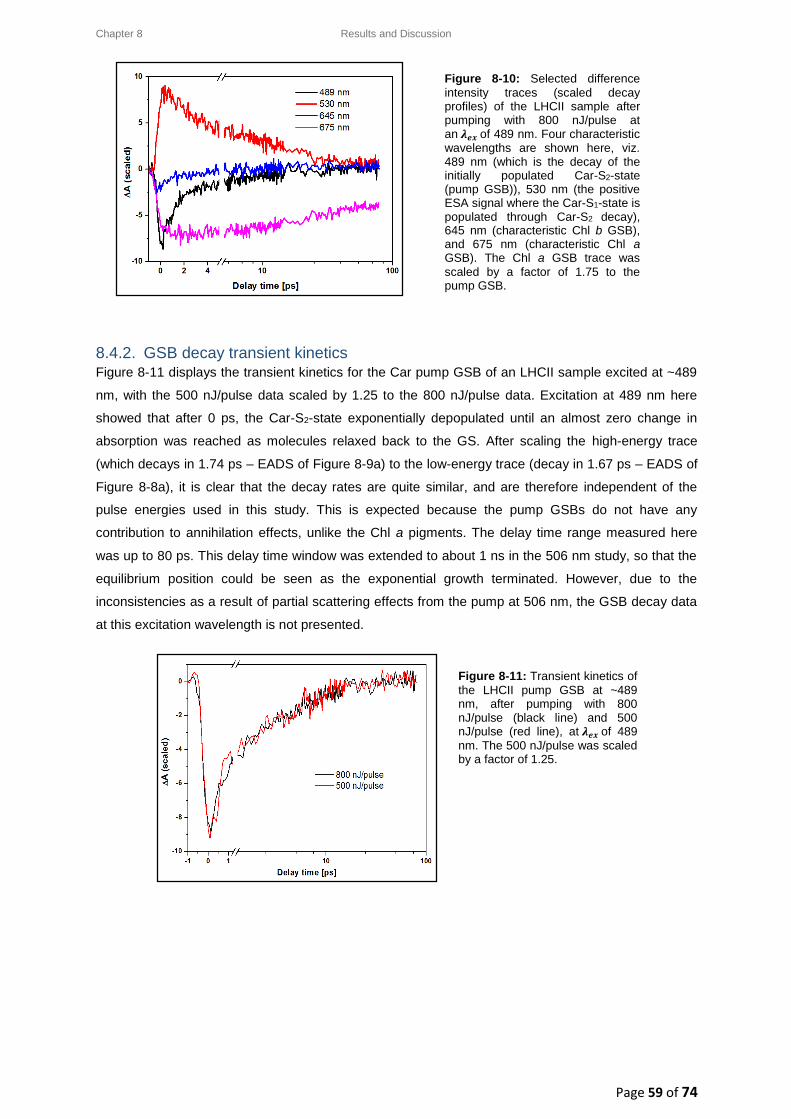
Chapter 8 Results and Discussion
Page 59 of 74
Figure 8-10: Selected difference
intensity traces (scaled decay profiles) of the LHCII sample after pumping with 800 nJ/pulse at an 𝝀𝒆𝒙 of 489 nm. Four characteristic wavelengths are shown here, viz. 489 nm (which is the decay of the initially populated Car-S2-state (pump GSB)), 530 nm (the positive ESA signal where the Car-S1-state is populated through Car-S2 decay), 645 nm (characteristic Chl b GSB), and 675 nm (characteristic Chl a GSB). The Chl a GSB trace was
scaled by a factor of 1.75 to the pump GSB.
8.4.2. GSB decay transient kinetics Figure 8-11 displays the transient kinetics for the Car pump GSB of an LHCII sample excited at ~489
nm, with the 500 nJ/pulse data scaled by 1.25 to the 800 nJ/pulse data. Excitation at 489 nm here
showed that after 0 ps, the Car-S2-state exponentially depopulated until an almost zero change in
absorption was reached as molecules relaxed back to the GS. After scaling the high-energy trace
(which decays in 1.74 ps – EADS of Figure 8-9a) to the low-energy trace (decay in 1.67 ps – EADS of
Figure 8-8a), it is clear that the decay rates are quite similar, and are therefore independent of the
pulse energies used in this study. This is expected because the pump GSBs do not have any
contribution to annihilation effects, unlike the Chl a pigments. The delay time range measured here
was up to 80 ps. This delay time window was extended to about 1 ns in the 506 nm study, so that the
equilibrium position could be seen as the exponential growth terminated. However, due to the
inconsistencies as a result of partial scattering effects from the pump at 506 nm, the GSB decay data
at this excitation wavelength is not presented.
Figure 8-11: Transient kinetics of
the LHCII pump GSB at ~489 nm, after pumping with 800 nJ/pulse (black line) and 500 nJ/pulse (red line), at 𝝀𝒆𝒙 of 489
nm. The 500 nJ/pulse was scaled by a factor of 1.25.
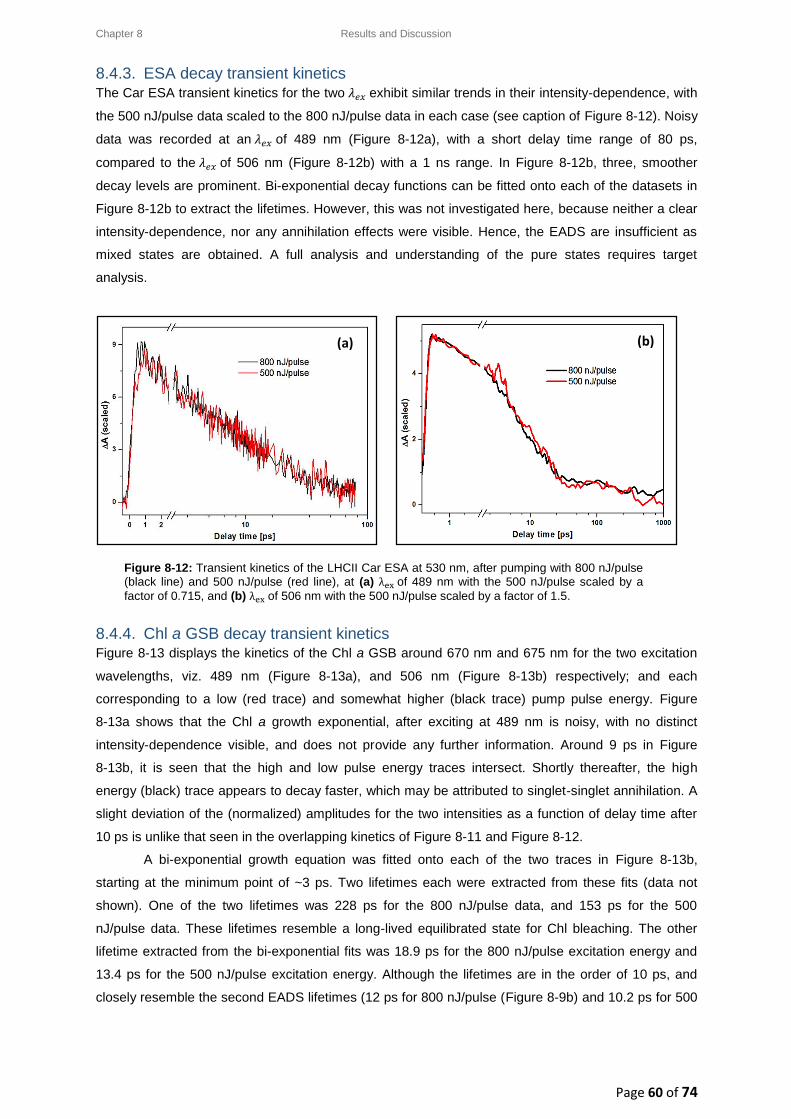
Chapter 8 Results and Discussion
Page 60 of 74
8.4.3. ESA decay transient kinetics The Car ESA transient kinetics for the two 𝜆𝑒𝑥 exhibit similar trends in their intensity-dependence, with
the 500 nJ/pulse data scaled to the 800 nJ/pulse data in each case (see caption of Figure 8-12). Noisy
data was recorded at an 𝜆𝑒𝑥 of 489 nm (Figure 8-12a), with a short delay time range of 80 ps,
compared to the 𝜆𝑒𝑥 of 506 nm (Figure 8-12b) with a 1 ns range. In Figure 8-12b, three, smoother
decay levels are prominent. Bi-exponential decay functions can be fitted onto each of the datasets in
Figure 8-12b to extract the lifetimes. However, this was not investigated here, because neither a clear
intensity-dependence, nor any annihilation effects were visible. Hence, the EADS are insufficient as
mixed states are obtained. A full analysis and understanding of the pure states requires target
analysis.
Figure 8-12: Transient kinetics of the LHCII Car ESA at 530 nm, after pumping with 800 nJ/pulse (black line) and 500 nJ/pulse (red line), at (a) λex of 489 nm with the 500 nJ/pulse scaled by a
factor of 0.715, and (b) λex of 506 nm with the 500 nJ/pulse scaled by a factor of 1.5.
8.4.4. Chl a GSB decay transient kinetics Figure 8-13 displays the kinetics of the Chl a GSB around 670 nm and 675 nm for the two excitation
wavelengths, viz. 489 nm (Figure 8-13a), and 506 nm (Figure 8-13b) respectively; and each
corresponding to a low (red trace) and somewhat higher (black trace) pump pulse energy. Figure
8-13a shows that the Chl a growth exponential, after exciting at 489 nm is noisy, with no distinct
intensity-dependence visible, and does not provide any further information. Around 9 ps in Figure
8-13b, it is seen that the high and low pulse energy traces intersect. Shortly thereafter, the high
energy (black) trace appears to decay faster, which may be attributed to singlet-singlet annihilation. A
slight deviation of the (normalized) amplitudes for the two intensities as a function of delay time after
10 ps is unlike that seen in the overlapping kinetics of Figure 8-11 and Figure 8-12.
A bi-exponential growth equation was fitted onto each of the two traces in Figure 8-13b,
starting at the minimum point of ~3 ps. Two lifetimes each were extracted from these fits (data not
shown). One of the two lifetimes was 228 ps for the 800 nJ/pulse data, and 153 ps for the 500
nJ/pulse data. These lifetimes resemble a long-lived equilibrated state for Chl bleaching. The other
lifetime extracted from the bi-exponential fits was 18.9 ps for the 800 nJ/pulse excitation energy and
13.4 ps for the 500 nJ/pulse excitation energy. Although the lifetimes are in the order of 10 ps, and
closely resemble the second EADS lifetimes (12 ps for 800 nJ/pulse (Figure 8-9b) and 10.2 ps for 500
(a) (b)
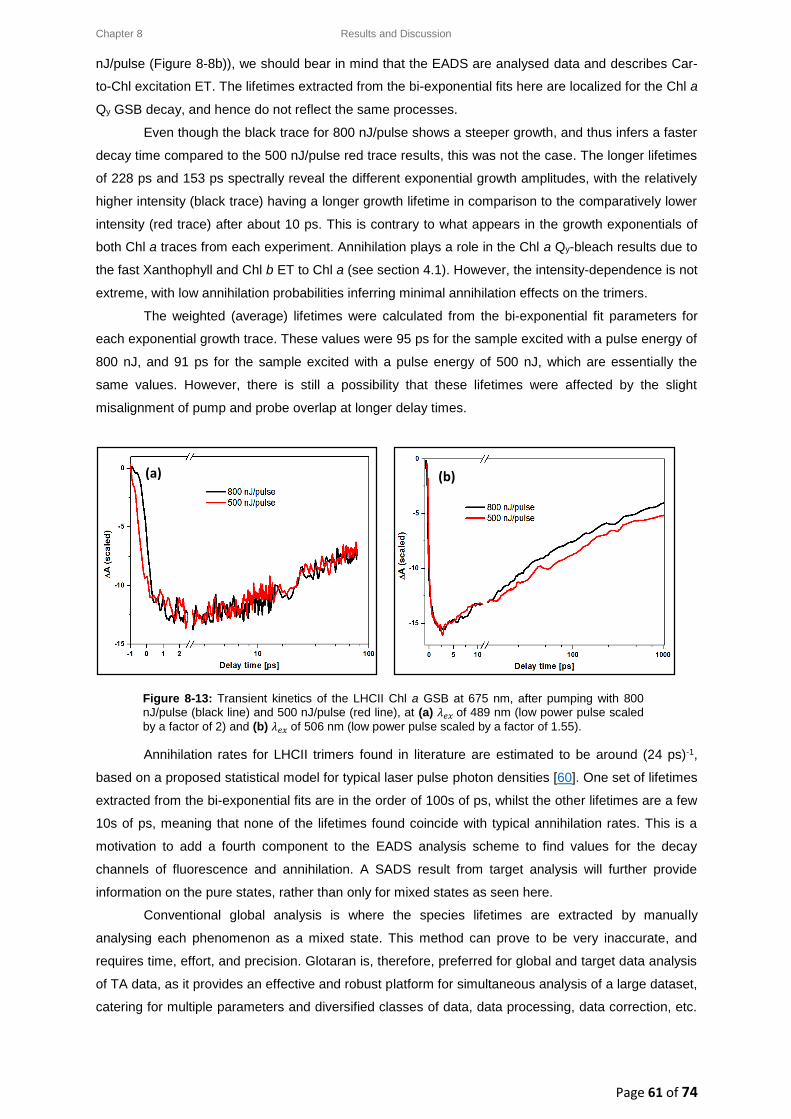
Chapter 8 Results and Discussion
Page 61 of 74
nJ/pulse (Figure 8-8b)), we should bear in mind that the EADS are analysed data and describes Car-
to-Chl excitation ET. The lifetimes extracted from the bi-exponential fits here are localized for the Chl a
Qy GSB decay, and hence do not reflect the same processes.
Even though the black trace for 800 nJ/pulse shows a steeper growth, and thus infers a faster
decay time compared to the 500 nJ/pulse red trace results, this was not the case. The longer lifetimes
of 228 ps and 153 ps spectrally reveal the different exponential growth amplitudes, with the relatively
higher intensity (black trace) having a longer growth lifetime in comparison to the comparatively lower
intensity (red trace) after about 10 ps. This is contrary to what appears in the growth exponentials of
both Chl a traces from each experiment. Annihilation plays a role in the Chl a Qy-bleach results due to
the fast Xanthophyll and Chl b ET to Chl a (see section 4.1). However, the intensity-dependence is not
extreme, with low annihilation probabilities inferring minimal annihilation effects on the trimers.
The weighted (average) lifetimes were calculated from the bi-exponential fit parameters for
each exponential growth trace. These values were 95 ps for the sample excited with a pulse energy of
800 nJ, and 91 ps for the sample excited with a pulse energy of 500 nJ, which are essentially the
same values. However, there is still a possibility that these lifetimes were affected by the slight
misalignment of pump and probe overlap at longer delay times.
Annihilation rates for LHCII trimers found in literature are estimated to be around (24 ps)-1,
based on a proposed statistical model for typical laser pulse photon densities [60]. One set of lifetimes
extracted from the bi-exponential fits are in the order of 100s of ps, whilst the other lifetimes are a few
10s of ps, meaning that none of the lifetimes found coincide with typical annihilation rates. This is a
motivation to add a fourth component to the EADS analysis scheme to find values for the decay
channels of fluorescence and annihilation. A SADS result from target analysis will further provide
information on the pure states, rather than only for mixed states as seen here.
Conventional global analysis is where the species lifetimes are extracted by manually
analysing each phenomenon as a mixed state. This method can prove to be very inaccurate, and
requires time, effort, and precision. Glotaran is, therefore, preferred for global and target data analysis
of TA data, as it provides an effective and robust platform for simultaneous analysis of a large dataset,
catering for multiple parameters and diversified classes of data, data processing, data correction, etc.
Figure 8-13: Transient kinetics of the LHCII Chl a GSB at 675 nm, after pumping with 800 nJ/pulse (black line) and 500 nJ/pulse (red line), at (a) 𝜆𝑒𝑥 of 489 nm (low power pulse scaled
by a factor of 2) and (b) 𝜆𝑒𝑥 of 506 nm (low power pulse scaled by a factor of 1.55).
(a) (b)
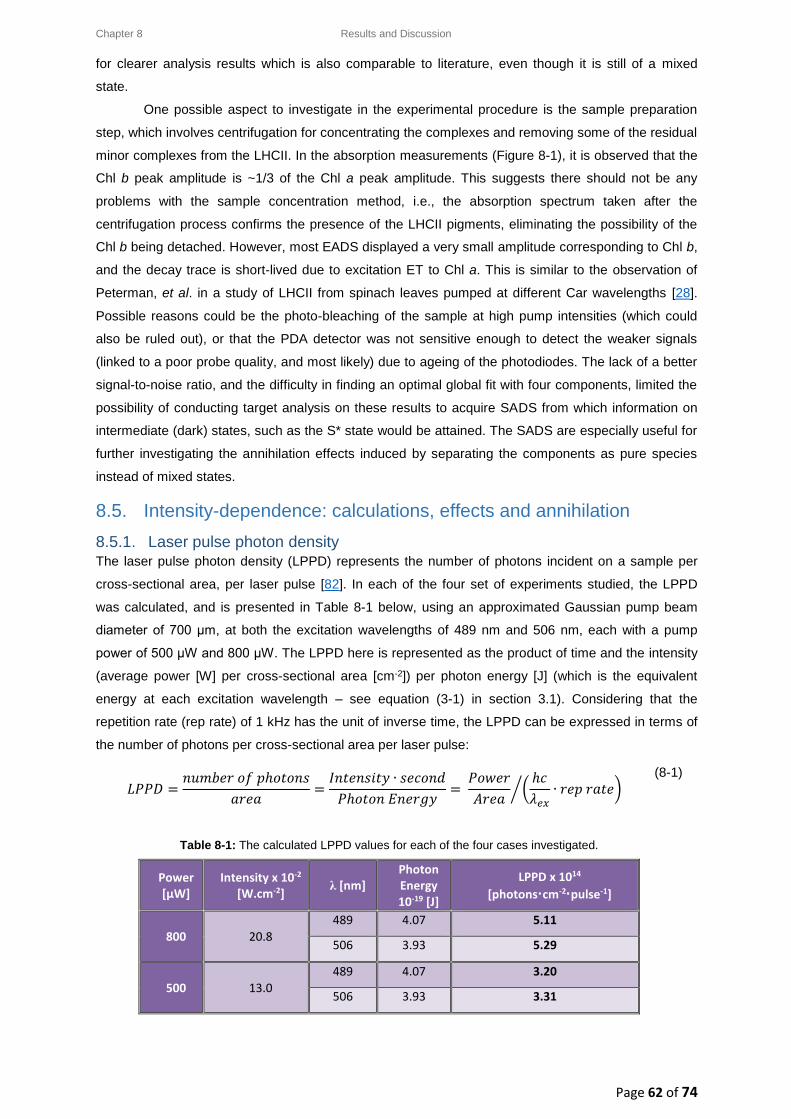
Chapter 8 Results and Discussion
Page 62 of 74
for clearer analysis results which is also comparable to literature, even though it is still of a mixed
state.
One possible aspect to investigate in the experimental procedure is the sample preparation
step, which involves centrifugation for concentrating the complexes and removing some of the residual
minor complexes from the LHCII. In the absorption measurements (Figure 8-1), it is observed that the
Chl b peak amplitude is ~1/3 of the Chl a peak amplitude. This suggests there should not be any
problems with the sample concentration method, i.e., the absorption spectrum taken after the
centrifugation process confirms the presence of the LHCII pigments, eliminating the possibility of the
Chl b being detached. However, most EADS displayed a very small amplitude corresponding to Chl b,
and the decay trace is short-lived due to excitation ET to Chl a. This is similar to the observation of
Peterman, et al. in a study of LHCII from spinach leaves pumped at different Car wavelengths [28].
Possible reasons could be the photo-bleaching of the sample at high pump intensities (which could
also be ruled out), or that the PDA detector was not sensitive enough to detect the weaker signals
(linked to a poor probe quality, and most likely) due to ageing of the photodiodes. The lack of a better
signal-to-noise ratio, and the difficulty in finding an optimal global fit with four components, limited the
possibility of conducting target analysis on these results to acquire SADS from which information on
intermediate (dark) states, such as the S* state would be attained. The SADS are especially useful for
further investigating the annihilation effects induced by separating the components as pure species
instead of mixed states.
8.5. Intensity-dependence: calculations, effects and annihilation
8.5.1. Laser pulse photon density The laser pulse photon density (LPPD) represents the number of photons incident on a sample per
cross-sectional area, per laser pulse [82]. In each of the four set of experiments studied, the LPPD
was calculated, and is presented in Table 8-1 below, using an approximated Gaussian pump beam
diameter of 700 μm, at both the excitation wavelengths of 489 nm and 506 nm, each with a pump
power of 500 μW and 800 μW. The LPPD here is represented as the product of time and the intensity
(average power [W] per cross-sectional area [cm-2]) per photon energy [J] (which is the equivalent
energy at each excitation wavelength – see equation (3-1) in section 3.1). Considering that the
repetition rate (rep rate) of 1 kHz has the unit of inverse time, the LPPD can be expressed in terms of
the number of photons per cross-sectional area per laser pulse:
𝐿𝑃𝑃𝐷 =𝑛𝑢𝑚𝑏𝑒𝑟 𝑜𝑓 𝑝ℎ𝑜𝑡𝑜𝑛𝑠
𝑎𝑟𝑒𝑎=𝐼𝑛𝑡𝑒𝑛𝑠𝑖𝑡𝑦 ∙ 𝑠𝑒𝑐𝑜𝑛𝑑
𝑃ℎ𝑜𝑡𝑜𝑛 𝐸𝑛𝑒𝑟𝑔𝑦= 𝑃𝑜𝑤𝑒𝑟
𝐴𝑟𝑒𝑎(ℎ𝑐
𝜆𝑒𝑥∙ 𝑟𝑒𝑝 𝑟𝑎𝑡𝑒)⁄
(8-1)
Table 8-1: The calculated LPPD values for each of the four cases investigated.
Power [µW]
Intensity x 10-2 [W.cm-2] λ [nm]
Photon Energy 10-19 [J]
LPPD x 1014
[photons·cm-2·pulse-1]
800 20.8
489 4.07 5.11
506 3.93 5.29
500 13.0
489 4.07 3.20
506 3.93 3.31
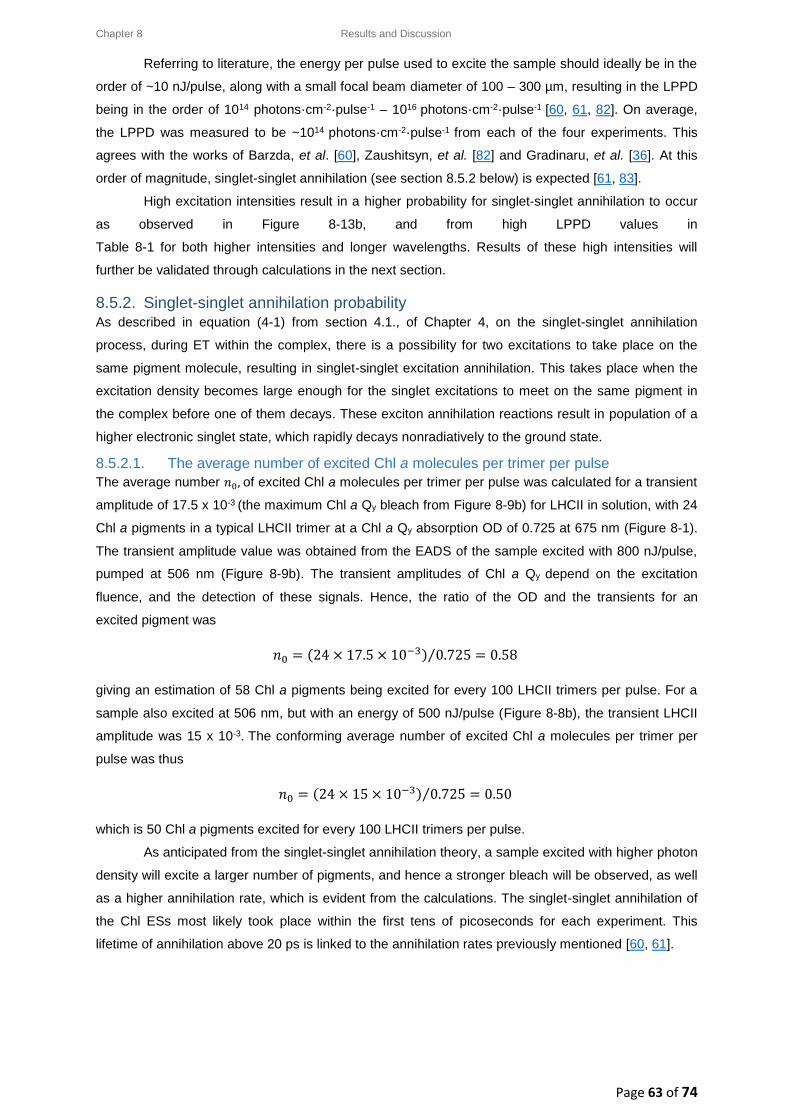
Chapter 8 Results and Discussion
Page 63 of 74
Referring to literature, the energy per pulse used to excite the sample should ideally be in the
order of ~10 nJ/pulse, along with a small focal beam diameter of 100 – 300 µm, resulting in the LPPD
being in the order of 1014 photons·cm-2·pulse-1 – 1016 photons·cm-2·pulse-1 [60, 61, 82]. On average,
the LPPD was measured to be ~1014 photons·cm-2·pulse-1 from each of the four experiments. This
agrees with the works of Barzda, et al. [60], Zaushitsyn, et al. [82] and Gradinaru, et al. [36]. At this
order of magnitude, singlet-singlet annihilation (see section 8.5.2 below) is expected [61, 83].
High excitation intensities result in a higher probability for singlet-singlet annihilation to occur
as observed in Figure 8-13b, and from high LPPD values in
Table 8-1 for both higher intensities and longer wavelengths. Results of these high intensities will
further be validated through calculations in the next section.
8.5.2. Singlet-singlet annihilation probability As described in equation (4-1) from section 4.1., of Chapter 4, on the singlet-singlet annihilation
process, during ET within the complex, there is a possibility for two excitations to take place on the
same pigment molecule, resulting in singlet-singlet excitation annihilation. This takes place when the
excitation density becomes large enough for the singlet excitations to meet on the same pigment in
the complex before one of them decays. These exciton annihilation reactions result in population of a
higher electronic singlet state, which rapidly decays nonradiatively to the ground state.
8.5.2.1. The average number of excited Chl a molecules per trimer per pulse
The average number 𝑛0, of excited Chl a molecules per trimer per pulse was calculated for a transient
amplitude of 17.5 x 10⁻³ (the maximum Chl a Qy bleach from Figure 8-9b) for LHCII in solution, with 24
Chl a pigments in a typical LHCII trimer at a Chl a Qy absorption OD of 0.725 at 675 nm (Figure 8-1).
The transient amplitude value was obtained from the EADS of the sample excited with 800 nJ/pulse,
pumped at 506 nm (Figure 8-9b). The transient amplitudes of Chl a Qy depend on the excitation
fluence, and the detection of these signals. Hence, the ratio of the OD and the transients for an
excited pigment was
𝑛0 = (24 × 17.5 × 10−3) 0.725⁄ = 0.58
giving an estimation of 58 Chl a pigments being excited for every 100 LHCII trimers per pulse. For a
sample also excited at 506 nm, but with an energy of 500 nJ/pulse (Figure 8-8b), the transient LHCII
amplitude was 15 x 10-3. The conforming average number of excited Chl a molecules per trimer per
pulse was thus
𝑛0 = (24 × 15 × 10−3) 0.725⁄ = 0.50
which is 50 Chl a pigments excited for every 100 LHCII trimers per pulse.
As anticipated from the singlet-singlet annihilation theory, a sample excited with higher photon
density will excite a larger number of pigments, and hence a stronger bleach will be observed, as well
as a higher annihilation rate, which is evident from the calculations. The singlet-singlet annihilation of
the Chl ESs most likely took place within the first tens of picoseconds for each experiment. This
lifetime of annihilation above 20 ps is linked to the annihilation rates previously mentioned [60, 61].
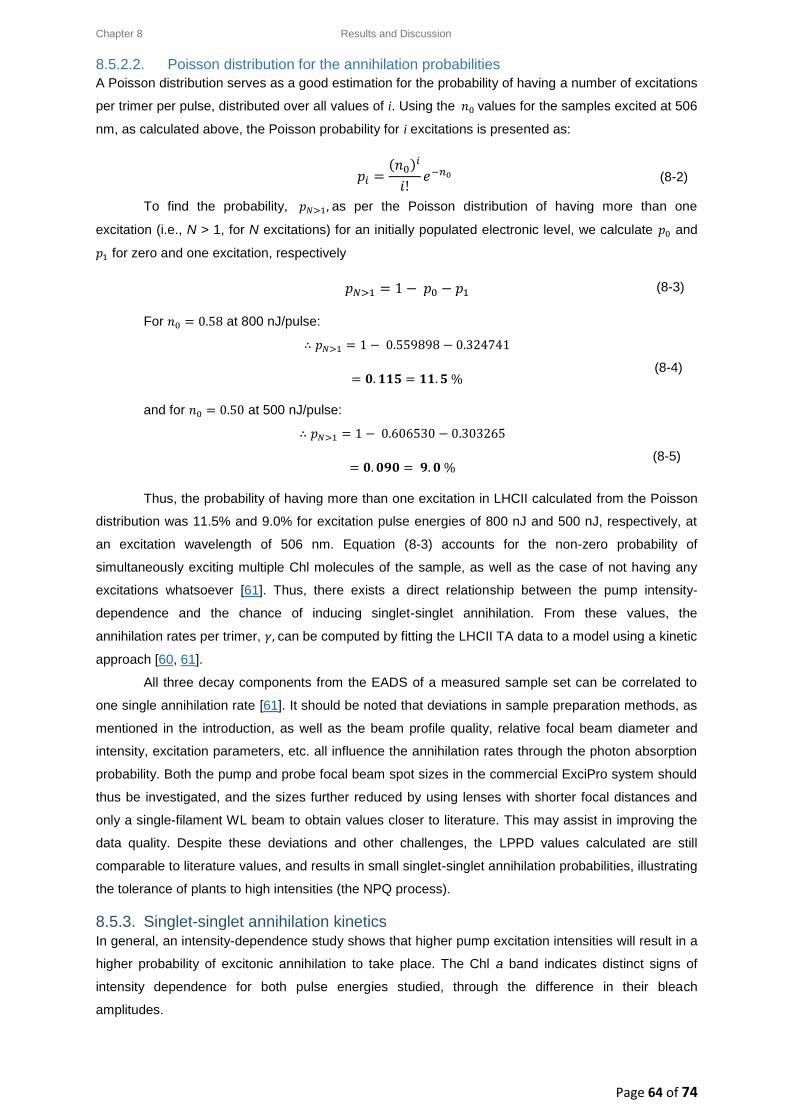
Chapter 8 Results and Discussion
Page 64 of 74
8.5.2.2. Poisson distribution for the annihilation probabilities
A Poisson distribution serves as a good estimation for the probability of having a number of excitations
per trimer per pulse, distributed over all values of i. Using the 𝑛0 values for the samples excited at 506
nm, as calculated above, the Poisson probability for i excitations is presented as:
𝑝𝑖 =
(𝑛0)𝑖
𝑖!𝑒−𝑛0 (8-2)
To find the probability, 𝑝𝑁>1, as per the Poisson distribution of having more than one
excitation (i.e., N > 1, for N excitations) for an initially populated electronic level, we calculate 𝑝0 and
𝑝1 for zero and one excitation, respectively
𝑝𝑁>1 = 1 − 𝑝0 − 𝑝1 (8-3)
For 𝑛0 = 0.58 at 800 nJ/pulse:
∴ 𝑝𝑁>1 = 1 − 0.559898 − 0.324741
= 𝟎. 𝟏𝟏𝟓 = 𝟏𝟏. 𝟓 %
(8-4)
and for 𝑛0 = 0.50 at 500 nJ/pulse:
∴ 𝑝𝑁>1 = 1 − 0.606530 − 0.303265
= 𝟎. 𝟎𝟗𝟎 = 𝟗. 𝟎 %
(8-5)
Thus, the probability of having more than one excitation in LHCII calculated from the Poisson
distribution was 11.5% and 9.0% for excitation pulse energies of 800 nJ and 500 nJ, respectively, at
an excitation wavelength of 506 nm. Equation (8-3) accounts for the non-zero probability of
simultaneously exciting multiple Chl molecules of the sample, as well as the case of not having any
excitations whatsoever [61]. Thus, there exists a direct relationship between the pump intensity-
dependence and the chance of inducing singlet-singlet annihilation. From these values, the
annihilation rates per trimer, 𝛾, can be computed by fitting the LHCII TA data to a model using a kinetic
approach [60, 61].
All three decay components from the EADS of a measured sample set can be correlated to
one single annihilation rate [61]. It should be noted that deviations in sample preparation methods, as
mentioned in the introduction, as well as the beam profile quality, relative focal beam diameter and
intensity, excitation parameters, etc. all influence the annihilation rates through the photon absorption
probability. Both the pump and probe focal beam spot sizes in the commercial ExciPro system should
thus be investigated, and the sizes further reduced by using lenses with shorter focal distances and
only a single-filament WL beam to obtain values closer to literature. This may assist in improving the
data quality. Despite these deviations and other challenges, the LPPD values calculated are still
comparable to literature values, and results in small singlet-singlet annihilation probabilities, illustrating
the tolerance of plants to high intensities (the NPQ process).
8.5.3. Singlet-singlet annihilation kinetics In general, an intensity-dependence study shows that higher pump excitation intensities will result in a
higher probability of excitonic annihilation to take place. The Chl a band indicates distinct signs of
intensity dependence for both pulse energies studied, through the difference in their bleach
amplitudes.
Chapter 8 Results and Discussion
Page 65 of 74
Barzda, et al. [60] employed a statistical approach to determine the singlet-singlet annihilation
kinetics of trimeric LHCII, where the annihilation rate was found to be (24 ps)-1 based on their
experiments. LHCII aggregates were also studied during their experiments through a kinetic approach,
spanning over hundreds of picoseconds, from which they attained a normalized value of (16 ps)-1 for
the annihilation rate per trimer [60]. This is the rate at which two Chl a excitations would encounter
each other on average. Similarly, in the study by Rutkauskas, et al. [61] the annihilation rate for an
LHCII aggregate normalized per trimer was (20 ps)-1, whilst the annihilation rate for different sample
solution preparations of the LHCII trimer ranged from (86 ps)-1 to (20 ps)-1 [61].
Excited singlet states play the role of mobile quenching centres for other singlet excitations in
aggregated systems, decreasing ES lifetimes for high excitation energies, and further decreasing the
fluorescence yield [60]. These literature values presented above are for the purpose of visualizing the
difference in annihilation rates for trimers and aggregates of LHCII, as well as to reveal the
dependence of excitation annihilation rates in LHCII on environmental conditions (e.g. light exposure)
[60, 61]. The light exposure level is connected to the pump intensity-dependence, and can hence be
acquainted with the NPQ process. Figure 8-13b demonstrated this intensity-dependence, and the
effects of the excitation pulses on the probability of having more than one excitation. However, the
values of 9.0% and 11.5% are relatively small, and are close enough to not cause any major intensity
difference in the probability of more than one excitation, and reducing photobleaching effects.
8.5.4. Annihilation summary Slight annihilation effects are visible from the intensity-dependence comparisons, as well as the
calculations from sections 8.4 to 8.5. Decay kinetic traces were distinctly identified for each of the four
spectral phenomena witnessed in the raw data, and in the EADS. Only the Chl a decay kinetics
showed a pronounced intensity-dependence from about 10 ps for the sample excited at 506 nm, and
thus the effect of annihilation on the LHCII sample. After comparing the four datasets, there was a
noticeable shift of the Chl a bleach from 670 nm when pumped at 489 nm, to 675 nm when pumped at
506 nm. This was expected, since pumping the different pigment regions induces a wavelength shift
with regards to the peak positions.
The laser pulse photon density calculated for each dataset was in the order of 1014
photons·cm-2·pulse-1, with high excitation intensities and longer wavelengths resulting in a greater
chance for singlet-singlet annihilation to take place, agreeing with literature works [60, 61, 82, 83].
Singlet-singlet annihilation probabilities were considered for the relatively high and comparatively low
excitation intensities, for an average number 𝑛0 of excited Chl a molecules per trimer per pulse,
through a Poisson distribution. Low probabilities for more than one excitation confirmed that
photobleaching was not taking place in the sample, and these probabilities for both excitation
intensities were almost the same. Except for annihilation effects, there is a possibility that a lack of
constant pump and probe beam overlap (alignment), as the delay line proceeded to longer delay
times, would influence the results. It can be concluded that, although minimal annihilation effects were
seen from the probability and excitation pulse density calculations, as well as the bi-exponential fits,
there was still a small intensity-dependence in the LHCII samples prepared and studied.
Chapter 9 Conclusion
Page 66 of 74
Chapter 9
9. Conclusion
Time-resolved transient absorption pump-probe spectroscopic signals depict a map of the difference
absorbance at various delay times, relative to the instant of excitation (time zero), and as a function of
wavelength [37]. Analysis of these signals provides the difference spectra, and their corresponding
decay lifetimes (inverse decay rates) in the form of Evolution Associated Difference Spectra (EADS),
which is based on a sequential model. The global and target analysis software package, Glotaran,
was utilized to acquire the global EADS, providing the overall decay of a system as a whole (a mixture
of pure molecular states) for a sequential compartmental model [45]. A maximum of three components
were used for the global analysis, as determined from a singular value decomposition.
Excitation wavelength-dependent measurements, as well as an intensity-dependent study
were performed on isolated LHCII trimers of spinach leaves, which were measured to have a Chl a
Qy-band absorption of 0.725 OD at 675 nm in a 1 mm path length cuvette. Specifically, excitation at
489 nm (absorption of 2.54 eV of energy) targeted Cars Lutein1 and Neoxanthin, which overlapped
strongly with the Chl b Soret band; and at an excitation wavelength of 506 nm (2.45 eV of energy),
Cars Lutein2 and Violaxanthin, which both exist in the tail at the end of the Car absorption region,
were probed. Intensity-dependence of each of these two wavelengths was studied at a relatively high
(800 nJ) and low (500 nJ) pulse energy, disclosing sensitivity to these parameters through changing
signal amplitudes in LHCII of spinach leaves.
General spectral observations from the results include a negative pump ground state bleach
(GSB) superimposed with stimulated emission (SE) signals at the excitation wavelength, a negative
Chl b and Chl a pigment GSB, and a positive excited state absorption (ESA) band. Kinetic information
like species lifetimes for the different ET mechanisms amongst the Cars and Chls in the spinach LHCII
was extracted from a global analysis as the EADS.
Cars absorb blue and green light (400 nm – 500 nm), which promotes electrons to higher
electronic ESs. This energy in turn is further transferred to pigments within the complex, or to other
energy levels within the same molecule. Lutein (Lut) was the dominant Car, as the Car-S1 lifetime for
Lut was seen in all four datasets around 10 ps – 12 ps. Each of the four datasets revealed a small, but
distinct Chl b signal (<3 mOD) within the first few picoseconds, with a stronger bleach seen upon
excitation at 489 nm due to direct excitation of the Chl b Soret band. A lack of a stronger Chl b GSB
(which originally was ~1/3 of the Chl a band in the absorption spectrum) is explained by the direct
transfer of energy from the excited Cars (ESA) to the Chl a bleach, or the fast transfer of energy from
Chl b to Chl a [28].
Despite the fact that the experimental results are not quantitatively comparable to studies
done by Gradinaru, et al. [35], it is worthy to note that these results have shown a significant
improvement in the experimental setup and sample preparation for LHCII trimers in comparison to
what has previously been reported on for a similar configuration of the setup used before [69]. Some
of the future work discussed in the paper of Ombinda, et al. [69] in 2009, has been addressed during
this project. Furthermore, optimizations and improvements such as sample preparation methods,
additions and alterations of the PP setup, etc. proved to yield better data quality for the LHCII samples
Chapter 9 Conclusion
Page 67 of 74
excited at 506 nm, as opposed to the samples initially studied at 489 nm, before the changes to the
setup were applied.
On account of higher quality data from the 506 nm excitation, the decay profiles for these
samples were studied in more detail. Improvements made to the PP system aided in refining the
quality of the data, the signal-to-noise ratios, as well as the data acquisition process through
enhanced software upgrades. The spectral residuals from the data following excitation at 489 nm did
not show much structure, although the samples excited with 506 nm had smaller residuals.
High laser pulse photon density values infer a greater chance for singlet-singlet annihilation to
occur, with the calculated values being in the order of 1014 photons·cm-2·pulse-1, which were
comparable to literature [60]. Nonetheless, the kinetic values for the various ET mechanisms amongst
the LHCII Cars and Chls provide a good indication that the setup can be used for more sophisticated
experiments.
Intensity-dependent studies on LHCII should contribute to validating optimal light exposure
conditions needed by a plant for the NPQ process of photosynthesis to operate, for comprehending
the role of Cars during NPQ. As witnessed from the results presented above, a higher excitation pulse
energy produced a higher signal-to-noise ratio, with both a smoother spectrum and more realistic
process lifetimes. Furthermore, the Chl a annihilation probabilities for samples excited at 506 nm
ranged from around 9.0% for an excitation pulse energy of 500 nJ to about 11.5% for a pulse energy
of 800 nJ. Singlet-singlet annihilation rates can thereafter be calculated to describe LHCII trimers or
aggregates using diverse approaches [60, 61].
Artificial LH antennas can be tailored and optimized for possible solar cells, based on the
research conducted on their natural counterparts. A detailed understanding of both the photophysical
and photochemical properties of natural LH antennas, as well as the general response to their local
and foreign environments is thus imperative for extending solar cell research to provide relief to the
looming energy crisis.
Chapter 10 Future Work
Page 68 of 74
Chapter 10
10. Future Work
This dissertation has identified further improvements needed for the experimental aspects of PP
measurements on LHCII trimers, by using the ExciPro setup at the National Laser Centre. One
foremost future project would be to replace the current PDA system with a more sensitive detector,
such as a CMOS or CCD camera. The new camera should easily allow for the detection of weaker WL
probe signals (i.e., a detector that is more susceptible to record minor signals needed for possible
studies on the intermediate states of Cars as formerly cited). After detecting small absorption change
signals, target analysis would need to be performed on the dataset in order to more accurately map
the decay pathways of the excited trimeric complexes, and to highlight the characteristics of the pure
species. Papagiannakis, et al. give an adequate introduction and explanation of the target analysis
models which can be applied to the data in a way that the dark states of Cars can best be understood
[84]. Results from this dissertation should serve as a basic foundation for further investigations of Car
intermediate ESs.
Generation of the probe WL through the sapphire plate with a single filament of WL in the
ExciPro, should be fully characterized with a CMOS/CCD camera, minimalizing the number of
filaments needed to probe the sample, as well as reduce any distortions. Similarly, by reducing the
beam focal spot sizes with lenses, signal-to-noise ratios may be improved to enable the identification
of smaller signals for intermediate states like S* through in-depth pump excitation wavelength and
intensity-dependent studies.
Accurate absorption spectra taken before and after the PP measurements will further assist in
identifying the sample integrity, and the effect of a laser beam (pump) on the samples. This accuracy
would require longer integration times, and optimal software and hardware functionality. Moreover, the
sample isolation protocol can be tailored to ensure maximum pigment extraction and better complex
structure. An additional aspect is to reduce the constant pump scattering appearing in the data which
was also observed by Ombinda, et al. [69] during their experiments, by making use of less reflective
optics, wavelength selection filters or polarisers. Albeit the scattering was reduced in our case, it was
not completely removed and was still prevalent in the samples pumped at 506 nm.
With regards to the sample preparation method, different sample absorption values (OD) at
the Chl Qy-bands can be investigated for a 1 mm path length, along with a variation in the number of
complexes, as well as introducing aggregation of the complexes. The photoprotective behaviour of
LHCII trimeric units can also be compared to that of LHCII aggregates of various sizes. The S1 and S*
populations of the Cars in LHCII aggregates are expected to provide information to identify and
characterize another potential energy pathway with relation to the photoprotective process of NPQ.
This may provide additional conclusions of the role Cars play in the photoprotective, energy
dependent (qE) process of NPQ, through a thorough intensity-dependence study.
The door to additional exciting projects has been opened to further develop the sample
preparation methods, data acquisition approaches, and to conduct more sophisticated measurements
using PP spectroscopy. In summary, it is evident that the femtosecond facilities of the NLC at CSIR
are now prepared for more serious biophysics experiments, and will serve as an excellent asset to
South Africa, for multiple purposes with promises for ground-breaking results in the near future!
References
Page 69 of 74
References
[1]. Energy, U. S. D. o., INTERNATIONAL ENERGY OUTLOOK 2016, Chapter 1. World energy demand and economic outlook, 2016.
[2]. Hall, D. O., Biomass for Energy, in: Hall, D. O. (Ed.) UK Section of International Solar Energy Society, London, 1979, pp. 1-18.
[3]. Repository, F. C. D., Chapter 2 - Energy conversion by photosynthetic organisms, in: Miyamoto, K. (Ed.) Food and Agriculture Organization of the United Nations, Osaka, Japan, 2017.
[4]. Meftah, M.; Chevalier, A.; Conscience, C. and Nevens, S., Total solar irradiance as measured by the SOVAP radiometer onboard PICARD, J. Space Weather Space Clim. 6 (2016) A34.
[5]. Agency, I. E., Key World Energy Statistics 2015. <www.iea.org>, 2015 (accessed January 2017).
[6]. Department of energy, S. A., Renewable Energy. <http://www.energy.gov.za/files/esources/renewables/r_solar.html>, (accessed 20 February 2017).
[7]. SolarGIS, Global Horizontal Irradiation (GHI), SolarGIS © 2015 GeoModel Solar, 2015.
[8]. Surek, T., Crystal growth and materials research in photovoltaics: progress and challenges, Journal of Crystal Growth 275(1) (2005) 292-304.
[9]. Roach, T. and Krieger-Liszkay, A. K., Regulation of Photosynthetic Electron Transport and Photoinhibition, Current Protein & Peptide Science 15(4) (2014) 351-362.
[10]. Manas, K. P.; Kalliopi, L. and Athanassios, G. C., Porphyrins in bio-inspired transformations: Light-harvesting to solar cell, Coordination Chemistry Reviews 256(21-22) (2012) 2601-2627.
[11]. Higher Plants, Oxford Dictionaries, Oxford University Press, 2015.
[12]. Cyanobacteria, Oxford Dictionaries, 2015 Oxford University Press, 2015.
[13]. Blankenship, R. E., Molecular Mechanisms of Photosynthesis, Blackwell Science Ltd, Oxford, 2002.
[14]. Dekker, J. P. and Boekema, E. J., Supramolecular organization of thylakoid membrane proteins in green plants, Biochimica et Biophysica Acta (BBA)-Bioenergetics 1706(1) (2005) 12-39.
[15]. Andrews, D. L., Biological Energy 3: Light, energy and upstream processes. <http://biologicalphysics.iop.org/cws/article/lectures/50852>, 2013 (accessed 13 July 2015).
[16]. Kylew, W., StudyBlue, Bio study guide 5, 2014.
[17]. Nield, J., Investigating macromolecular structures, Queen Mary, University of London, UK, 2013.
[18]. van Grondelle, R.; Dekker, J. P.; Gillbro, T. and Sundstrom, V., Energy transfer and trapping in photosynthesis, Biochimica et Biophysica Acta (BBA)-Bioenergetics 1187(1) (1994) 1-65.
References
Page 70 of 74
[19]. Boichenko, V. A.; Hou, J.-M. and Mauzerall, D., Thermodynamics of electron transfer in oxygenic photosynthetic reaction centers: volume change, enthalpy, and entropy of electron-transfer reactions in the intact cells of the cyanobacterium Synechocystis PCC 6803, Biochemistry 40(24) (2001) 7126-7132.
[20]. Qin, X.; Suga, M.; Kuang, T. and Shen, J.-R., Structural basis for energy transfer pathways in the plant PSI-LHCI supercomplex, Science 348(6238) (2015) 989-995.
[21]. Ben-Shem, A.; Frolow, F. and Nelson, N., Crystal structure of plant photosystem I, Nature 426(6967) (2003) 630-635.
[22]. Croce, R. and Xu, P., Structural biology: A photo shoot of plant photosystem II, Nature 534(7605) (2016) 42-43.
[23]. Liu, Z.; Yan, H.; Wang, K.; Kuang, T.; Zhang, J.; Gui, L.; An, X. and Chang, W., PDB ID: 1RWT. X-ray diffraction. Crystal Structure of Spinach Major Light-harvesting complex at 2.72 Angstrom Resolution, Nature, 2004.
[24]. Liu, Z.; Yan, H.; Wang, K.; Kuang, T.; Zhang, J.; Gui, L.; An, X. and Chang, W., Crystal structure of spinach major light-harvesting complex at 2.72A˚ resolution, Nature 428 (2004).
[25]. Ruban, A. V.; Berera, R.; Ilioaia, C.; van Stokkum, I. H. M.; Kennis, J. T. M.; Pascal, A. A.; van Amerongen, H.; Robert, B.; Horton, P. and van Grondelle, R., Identification of a mechanism of photoprotective energy dissipation in higher plants, Nature 450(06262) (2007) 575-579.
[26]. van Grondelle, R. and Novoderezhkin, V. I., Energy transfer in photosynthesis: experimental insights and quantitative models, Physical Chemistry Chemical Physics 8 (2006) 793–807.
[27]. van Grondelle, R., Biophysics, Biophysics Course book 2008.
[28]. Peterman, E. J.; Monshouwer, R.; van Stokkum, I. H.; van Grondelle, R. and van Amerongen, H., Ultrafast singlet excitation transfer from carotenoids to chlorophylls via different pathways in light-harvesting complex II of higher plants, Chemical physics letters 264(3-4) (1997) 279-284.
[29]. Papagiannakis, E.; Van Stokkum, I. H.; Vengris, M.; Cogdell, R. J.; Van Grondelle, R. and Larsen, D. S., Excited-state dynamics of carotenoids in light-harvesting complexes. 1. Exploring the relationship between the S1 and S* states, The Journal of Physical Chemistry B 110(11) (2006) 5727-5736.
[30]. Demmig-Adams, B., Carotenoids and photoprotection in plants: a role for the xanthophyll zeaxanthin, Biochimica et Biophysica Acta (BBA)-Bioenergetics 1020(1) (1990) 1-24.
[31]. Zaks, J.; Amarnath, K.; Sylak-Glassman, E. J. and Fleming, G. R., Models and measurements of energy-dependent quenching, Photosynthesis research 116(2-3) (2013) 389-409.
[32]. Ostroumov, E. E.; Mulvaney, R. M.; Cogdell, R. J. and Scholes, G. D., Broadband 2D electronic spectroscopy reveals a carotenoid dark state in purple bacteria, Science 340(6128) (2013) 52-56.
[33]. Croce, R.; Cinque, G.; Holzwarth, A. R. and Bassi, R., The Soret absorption properties of carotenoids and chlorophylls in antenna complexes of higher plants, Photosynthesis Research 64(2) (2000) 221-231.
References
Page 71 of 74
[34]. Polívka, T. and Sundström, V., Dark excited states of carotenoids: Consensus and controversy, Chemical Physics Letters 477(1) (2009) 1-11.
[35]. Gradinaru, C. C.; Kennis, J. T.; Papagiannakis, E.; van Stokkum, I. H.; Cogdell, R. J.; Fleming, G. R.; Niederman, R. A. and van Grondelle, R., An unusual pathway of excitation energy deactivation in carotenoids: singlet-to-triplet conversion on an ultrafast timescale in a photosynthetic antenna, Proceedings of the National Academy of Sciences 98(5) (2001) 2364-2369.
[36]. Gradinaru, C. C.; van Stokkum, I. H.; Pascal, A. A.; van Grondelle, R. and van Amerongen, H., Identifying the pathways of energy transfer between carotenoids and chlorophylls in LHCII and CP29. A multicolor, femtosecond pump− probe study, The Journal of Physical Chemistry B 104(39) (2000) 9330-9342.
[37]. Snellenburg, J. J.; Laptenok, S. P.; Seger, R.; Mullen, K. M. and van Stokkum, I. H. M., Glotaran: A Java-Based Graphical User Interface for the R Package TIMP, Journal of Statistical Software 49(3) (2012).
[38]. Polívka, T. and Sundström, V., Ultrafast dynamics of carotenoid excited states− from solution to natural and artificial systems, Chemical Reviews 104(4) (2004) 2021-2072.
[39]. Hashimoto, H.; Yanagi, K.; Yoshizwa, M.; Polli, D.; Cerullo, G.; Lanzani, G.; De Silvestri, S.; Gardiner, A. T. and Codgell, R. J., The Very Early Events Following Photoexcitation of Carotenoids, Arch. Biochem. Biophys. 430(1) (2004) 61-69.
[40]. Croce, R.; Müller, M. G.; Bassi, R. and Holzwarth, A. R., Carotenoid-to-chlorophyll energy transfer in recombinant major light-harvesting complex (LHCII) of higher plants. I. Femtosecond transient absorption measurements, Biophysical Journal 80(2) (2001) 901-915.
[41]. Lichtenthaler, H. K. and Buschmann, C., Current Protocols in Food Analytical Chemistry John Wiley & Sons, Inc. 2001.
[42]. Snellenburg, J. J., Glotaran: Introduction. <http://glotaran.org/wiki/doku.php?id=introduction>, 2010 (accessed 26 March 2015).
[43]. Tavan, P. and Schulten, K., The low‐lying electronic excitations in long polyenes: A PPP‐MRD‐CI study, The Journal of chemical physics 85(11) (1986) 6602-6609.
[44]. Tavan, P. and Schulten, K., Electronic excitations in finite and infinite polyenes, Physical Review B 36(8) (1987) 4337.
[45]. Snellenburg, J. J., Glotaran, Physics and Astronomy, VU University Amsterdam, 2010.
[46]. Papagiannakis, E.; Kennis, J. T.; van Stokkum, I. H.; Cogdell, R. J. and van Grondelle, R., An alternative carotenoid-to-bacteriochlorophyll energy transfer pathway in photosynthetic light harvesting, Proceedings of the National Academy of Sciences 99(9) (2002) 6017-6022.
[47]. Wohlleben, W.; Buckup, T.; Herek, J. L.; Cogdell, R. J. and Motzkus, M., Multichannel carotenoid deactivation in photosynthetic light harvesting as identified by an evolutionary target analysis, Biophysical journal 85(1) (2003) 442-450.
[48]. Rademaker, H.; Hoff, A. J.; Van Grondelle, R. and Duysens, L. N. M., Carotenoid triplet yields in normal and deuterated Rhodospirillum rubrum, Biochimica et Biophysica Acta (BBA)-Bioenergetics 592(2) (1980) 240-257.
References
Page 72 of 74
[49]. Kloz, M.; Weißenborn, J.; Polívka, T.; Frank, H. A. and Kennis, J. T., Spectral watermarking in femtosecond stimulated Raman spectroscopy: resolving the nature of the carotenoid S* state, Physical Chemistry Chemical Physics 18(21) (2016) 14619-14628.
[50]. Demmig-Adams, B.; Garab, G.; Adams III, W. and Govindjee, U. o. I., Non-photochemical quenching and energy dissipation in plants, algae and cyanobacteria, Springer 2014.
[51]. Krüger, T. P. J.; Novoderezhkin, V. I.; Romero, E. and van Grondelle, R., Chapter 3: Photosynthetic Energy Transfer and Charge Separation in Higher Plants, in: Golbeck, J. and Est, A. v. d. (Eds.), The Biophysics of Photosynthesis, Springer, New York, 2014.
[52]. Berera, R., The role of carotenoids in natural and artificial photosynthesis, Vrije Universiteit Amsterdam, 2007.
[53]. Ruban, A. V.; Johnson, M. P. and Duffy, C. D., The photoprotective molecular switch in the photosystem II antenna, Biochimica et Biophysica Acta (BBA)-Bioenergetics 1817(1) (2012) 167-181.
[54]. Horton, P., Developments in Research on Non-Photochemical Fluorescence Quenching: Emergence of Key Ideas, Theories and Experimental Approaches, in: Demmig-Adams, B.; Garab, G.; Adams, W. W. and Govindjee (Eds.), Non-Photochemical Quenching and Energy Dissipation in Plants, Algae and Cyanobacteria, Springer Dordrecht Heidelberg New York London, 2014.
[55]. Yena, T.-C. and Cheng, Y.-C., Electronic coherence effects in photosynthetic light harvesting, Procedia Chemistry 3(1) (2011) 211-221.
[56]. Johnson, M. P.; Goral, T. K.; Duffy, C. D. P.; Brain, A. P. R.; Mullineaux, C. W. and Ruban, A., Photoprotective energy dissipation involves the reorganization of photosystem II light-harvesting complexes in the grana membranes of spinach chloroplasts, Plant Cell 23 (2011) 1468-1479.
[57]. Demtröder, W., Laser Spectroscopy, 4th ed., Springer-Verlag, Berlin Heidelberg, 2008.
[58]. Silfvast, W. T., Laser Fundamentals, 2nd ed., The Press Syndicate of the University of Cambridge, United Kingdom, 2004.
[59]. Van Amerongen, H. and Dekker, J. P., Chapter 7: Photosystem II, in: Beverley G. and Parson, W. W. (Eds.), Light-Harvesting Antennas in Photosynthesis, Kluwer Academic Publishers, The Netherlands, 2003.
[60]. Barzda, V.; Gulbinas, V.; Kananavicius, R.; Cervinskas, V.; van Amerongen, H.; van Grondelle, R. and Valkunas, L., Singlet–Singlet Annihilation Kinetics in Aggregates and Trimers of LHCII, Biophysical Journal 80(5) (2001) 2409-2421.
[61]. Rutkauskas, D.; Chmeliov, J.; Johnson, M.; Ruban, A. and Valkunas, L., Exciton annihilation as a probe of the light-harvesting antenna transition into the photoprotective mode, Chemical Physics 404 (2012) 123-128.
[62]. Berera, R.; van Grondelle, R. and Kennis, J. T., Ultrafast transient absorption spectroscopy: principles and application to photosynthetic systems, Photosynthesis research 101(2-3) (2009) 105-118.
[63]. Femtosecond Pump-Probe system: ExiPro User's Manual, CDP Corp. 2004-2007.
References
Page 73 of 74
[64]. van Stokkum, I., Global and target analysis of time-resolved spectra, Lecture notes for the Troisième Cycle de la Physique en Suisse Romande, Tech. rep., Department of Physics and Astronomy, Faculty of Sciences, Vrije Universiteit, Amsterdam, The Netherlands, http://www.nat.vu.nl/ivo/lecturenotes.pdf, 2005.
[65]. Mullen, K. M., Separable nonlinear models: theory, implementation and applications in physics and chemistry, Vrijie Universiteit, Amsterdam, 2008.
[66]. van Stokkum, I. H.; Papagiannakis, E.; Vengris, M.; Salverda, J. M.; Polívka, T.; Zigmantas, D.; Larsen, D. S.; Lampoura, S. S.; Hiller, R. G. and van Grondelle, R., Inter-pigment interactions in the peridinin chlorophyll protein studied by global and target analysis of time resolved absorption spectra, Chemical Physics 357(1) (2009) 70-78.
[67]. Snellenburg, J. J., Glotaran Theory: Theoretical background. <glotaran.org/wiki/doku.php?id=theory>, 2010 (accessed 26 March 2015).
[68]. Ekvall, K.; Van der Meulen, P.; Dhollande, C.; Berg, L.-E.; Pommeret, S.; Naskrecki, R. and Mialocq, J.-C., Cross phase modulation artifact in liquid phase transient absorption spectroscopy, Journal of applied physics 87(5) (2000) 2340-2352.
[69]. Ombinda-Lemboumba, S.; Plessis, A. d.; Sparrow, R. W.; Molukanele, P.; Botha, L. R.; Rohwer, E. G.; Steenkamp, C. M. and Rensburg, L. v., Femtosecond pump probe spectroscopy for the study of energy transfer of light-harvesting complexes from extractions of spinach leaves, South African Journal of Science 105 (2009) 376-386.
[70]. Koyama, Y. and Hashimoto, H., Spectroscopic studies of carotenoids in photosynthetic systems, Carotenoids in photosynthesis, Springer(1993), pp. 327-408.
[71]. Koyama, Y.; Kuki, M.; Andersson, P. O. and Gillbro, T., Photochem. Photobiol 63 (1995) 243–256.
[72]. Ostroumov, E. E.; Reus, M. G. M. l., Michael and Holzwarth, A. R., On the nature of the “dark S*” excited state of β-carotene, The Journal of Physical Chemistry A 115(16) (2010) 3698-3712.
[73]. Van Roon, H.; Breemen, J. F. L. v.; Weerd, F. L. d.; Dekker, J. P. and Boekema, E. J., Solubilisation of green plant thylakoid membranes with n-dodecyl-α,D-maltoside. Implications for the structural organisation of the Photosystem II, Photosystem I, ATP synthase and cytochrome b6f complexes., Photosynthesis Research 64 (2000) 155–166.
[74]. Leeuwen, P. J. v.; Nieveen, M. C.; Meent, E. J. v. d.; Dekker, J. P. and Gorkom, H. J. v., Rapid and simple isolation of pure photosystem II core and reaction center particles from spinach, Photosynthesis Research 28(3) (1991) 149-153.
[75]. Schaller, S.; Latowski, D.; Jemioła-Rzemińska, M.; Dawood, A.; Wilhelm, C.; Strzałka, K. and Goss, R., Regulation of LHCII aggregation by different thylakoid membrane lipids, Biochimica et Biophysica Acta (BBA) - Bioenergetics 1807(3) (2011) 326-335.
[76]. Clark-MXR, I., System Components, CPA-Series User Manual, 2008.
[77]. Riedle, E., NOPA Fundamentals and Instructions Manual, University of München, 2005.
[78]. Kurbasov, S. V., ExciPro User Manual, 2.4.3 ed.2001-2007.
References
Page 74 of 74
[79]. Lebedev, M. V.; Misochko, O. V.; Dekorsy, T. and Georgiev, N., On the Nature of “Coherent Artifact”, Journal of Experimental & Theoretical Physics 100(2) (2005) 272-282.
[80]. Marin, A., Energy transport pathways in photosynthetic antennas, Faculteit der Exacte Wetenschappen, Vrije Universiteit Amsterdam, 2012.
[81]. van Amerongen, H. and Croce, R., Light harvesting in photosystem II, Photosynthesis Research 116(2) (2013) 251-263.
[82]. Zaushitsyn, Y.; Jespersen, K. G.; Valkunas, L.; Sundström, V. and Yartsev, A., Ultrafast dynamics of singlet-singlet and singlet-triplet exciton annihilation in poly (3-2′-methoxy-5′ octylphenyl) thiophene films, Physical Review B 75(19) (2007) 195201.
[83]. Schödel, R.; Hillmann, F.; Schrötter, T.; Voigt, J.; Irrgang, K.-D. and Renger, G., Kinetics of excited states of pigment clusters in solubilized light-harvesting complex II: photon density-dependent fluorescence yield and transmittance, Biophysical journal 71(6) (1996) 3370-3380.
[84]. Papagiannakis, E., Shedding light on the dark states of Carotenoids, Physics, Universiteit Amsterdam, PrintPartners Ipskamp B.V., Enschede, 2004.