Embed Size (px)
Citation preview
/ Slide 1
ASML Fourth Quarter and 2010 Annual ResultsRecord backlog supports a strong 2011
January 19, 2011
/ Slide 2
Safe Harbor
"Safe Harbor" Statement under the US Private Securities Litigation Reform Act of
1995: the matters discussed in this document may include forward-looking
statements, including statements made about our outlook, realization of backlog, IC
unit demand, financial results, average selling price, gross margin and expenses,
dividend policy and intention to repurchase shares.
These forward looking statements are subject to risks and uncertainties including,
but not limited to: economic conditions, product demand and semiconductor
equipment industry capacity, worldwide demand and manufacturing capacity
utilization for semiconductors (the principal product of our customer base),
including the impact of general economic conditions on consumer confidence and
demand for our customers’ products, competitive products and pricing, the impact
of manufacturing efficiencies and capacity constraints, the pace of new product
development and customer acceptance of new products, our ability to enforce
patents and protect intellectual property rights, the risk of intellectual property
litigation, availability of raw materials and critical manufacturing equipment, trade
environment, changes in exchange rates, available cash, distributable reserves for
dividend payments and share repurchases and other risks indicated in the risk
factors included in ASML’s Annual Report on Form 20-F and other filings with the
US Securities and Exchange Commission.
/ Slide 3
Agenda
� Business summary
� Market
� ASML business update
� Outlook and summary
/ Slide 4
Business summary
/ Slide 5
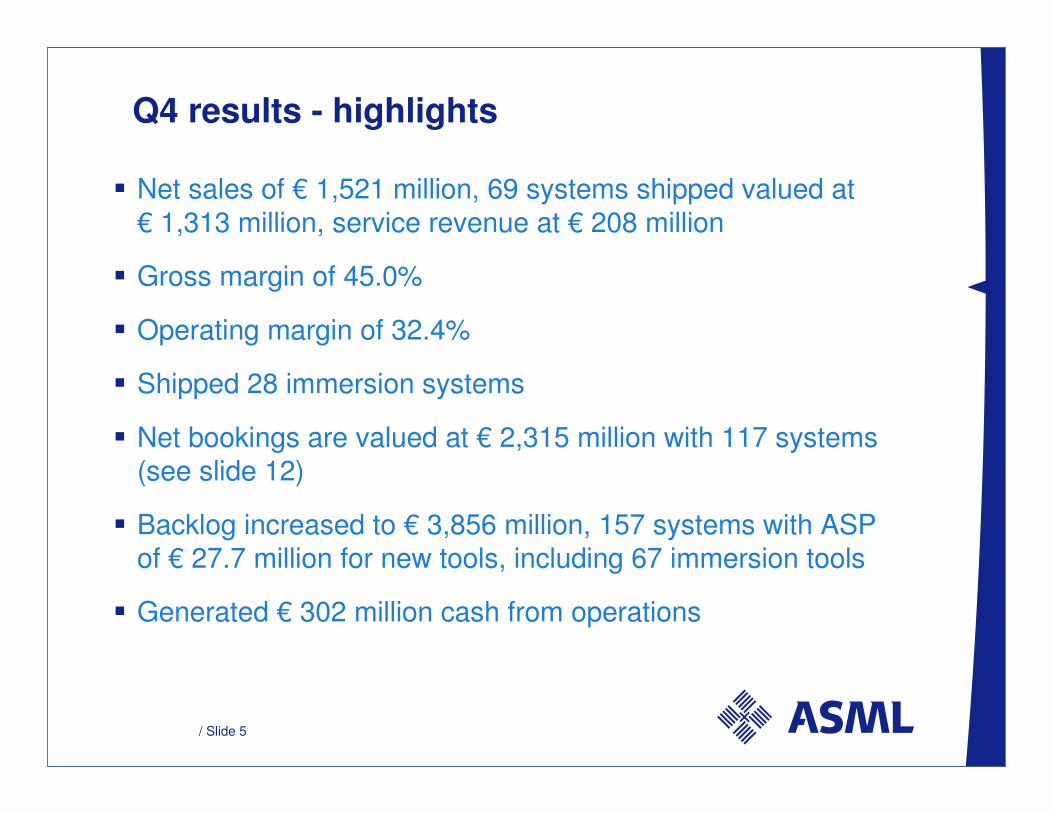
Q4 results - highlights
� Net sales of € 1,521 million, 69 systems shipped valued at
€ 1,313 million, service revenue at € 208 million
� Gross margin of 45.0%
� Operating margin of 32.4%
� Shipped 28 immersion systems
� Net bookings are valued at € 2,315 million with 117 systems
(see slide 12)
� Backlog increased to € 3,856 million, 157 systems with ASP
of € 27.7 million for new tools, including 67 immersion tools
� Generated € 302 million cash from operations
/ Slide 6
685 629949 919
183
742
763 942
930 844
277
1,069
533
958
934697
555
1,176548
1,053955
494
581
1,521
0
500
1,000
1,500
2,000
2,500
3,000
3,500
4,000
4,500
5,000
2005 2006 2007 2008 2009 2010
Ne
t sa
les Q4
Q3
Q2
Q1
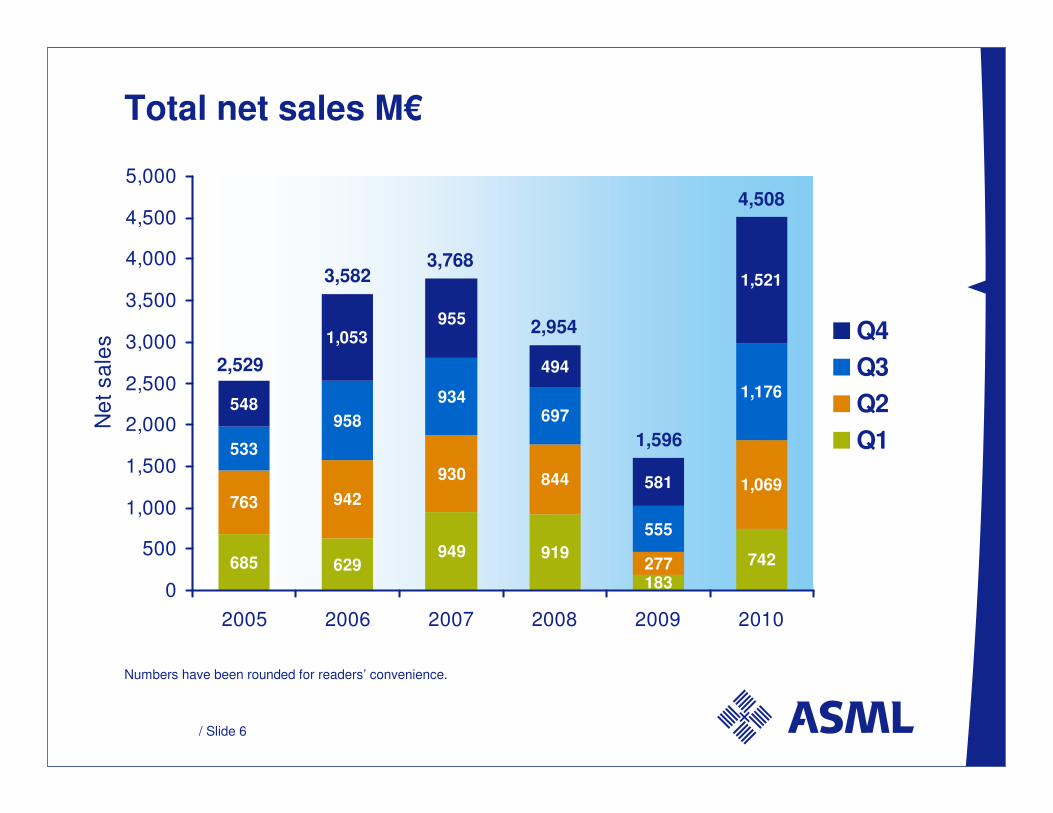
Total net sales M€
2,529
3,5823,768
Numbers have been rounded for readers’ convenience.
2,954
1,596
4,508
/ Slide 7
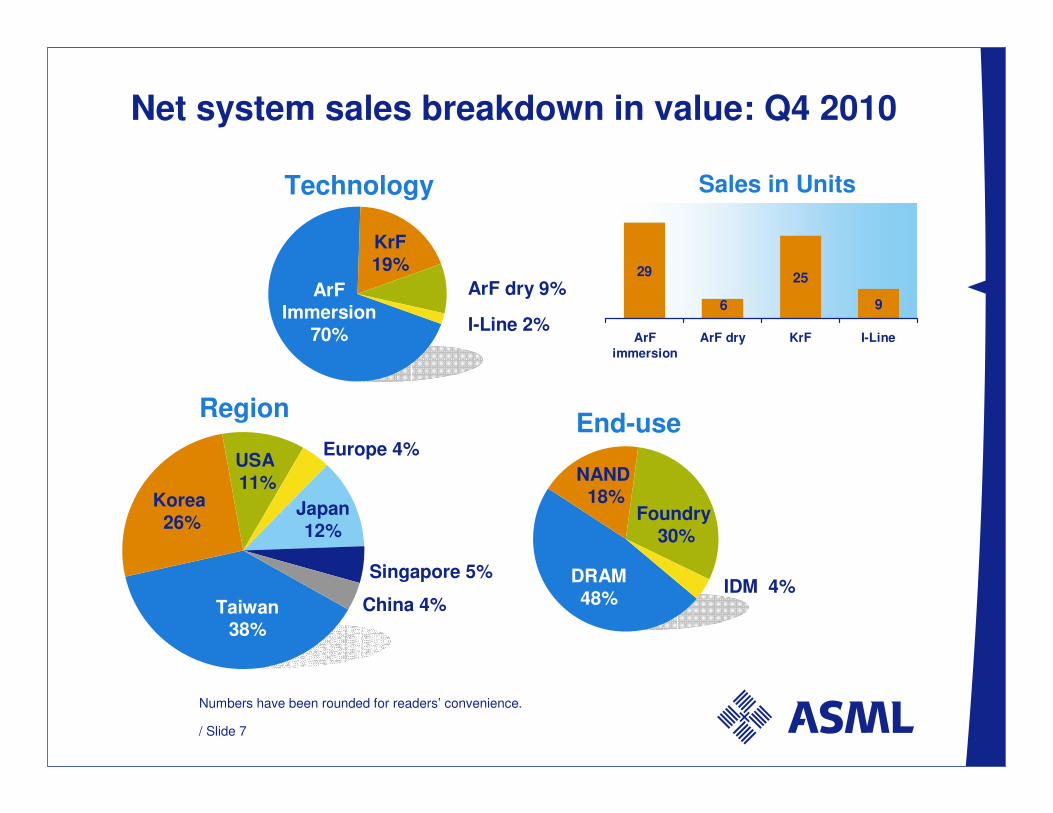
Net system sales breakdown in value: Q4 2010
End-use
Foundry30%
Numbers have been rounded for readers’ convenience.
Technology
ArF immersion
83% ArF dry 9%
USA11%
Korea 26%
25
96
29
ArF
immersion
ArF dry KrF I-Line
Sales in Units
Region
Singapore 5%
Taiwan38%
DRAM48%
IDM 4%
Japan12%
I-Line 2%
China 4%
ArFImmersion
70%
NAND18%
KrF19%
Europe 4%
/ Slide 8
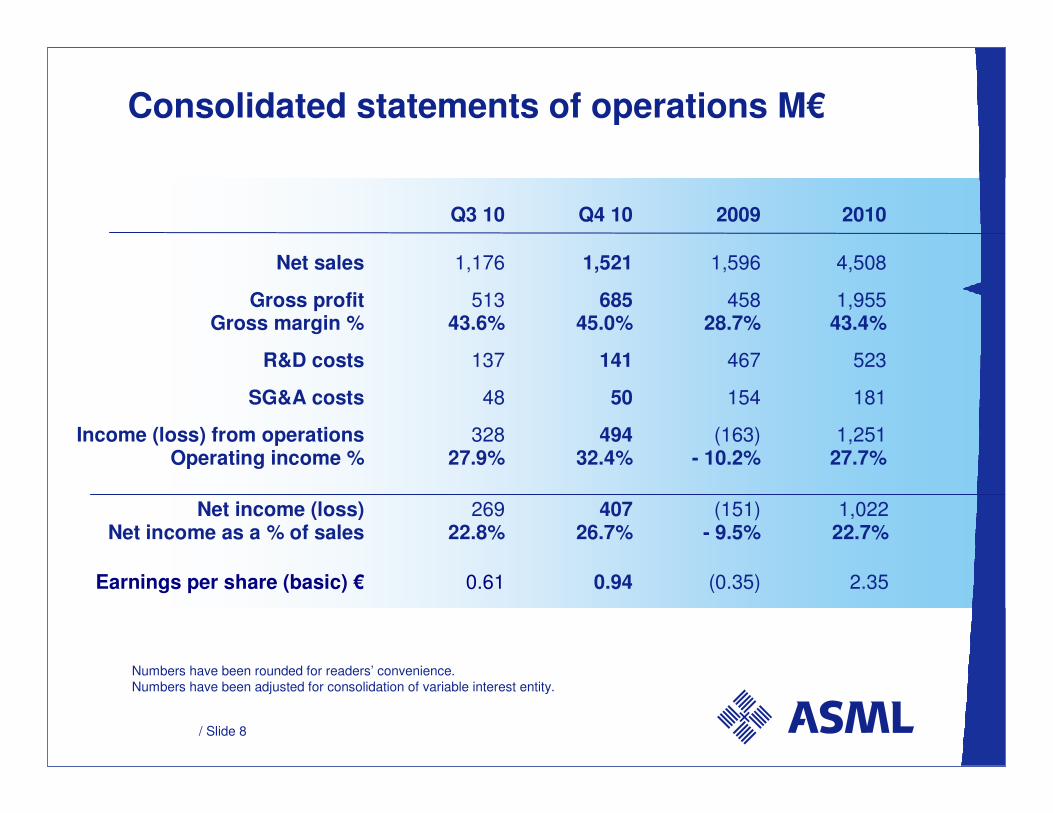
Consolidated statements of operations M€
Numbers have been rounded for readers’ convenience.
Numbers have been adjusted for consolidation of variable interest entity.
Q3 10 Q4 10 2009 2010
Net sales 1,176 1,521 1,596 4,508
Gross profit Gross margin %
513 43.6%
685 45.0%
458 28.7%
1,955 43.4%
R&D costs 137 141 467 523
SG&A costs 48 50 154 181
Income (loss) from operations Operating income %
328 27.9%
494 32.4%
(163) - 10.2%
1,251 27.7%
Net income (loss) Net income as a % of sales
269 22.8%
407 26.7%
(151) - 9.5%
1,022 22.7%
Earnings per share (basic) € 0.61 0.94 (0.35) 2.35
/ Slide 9
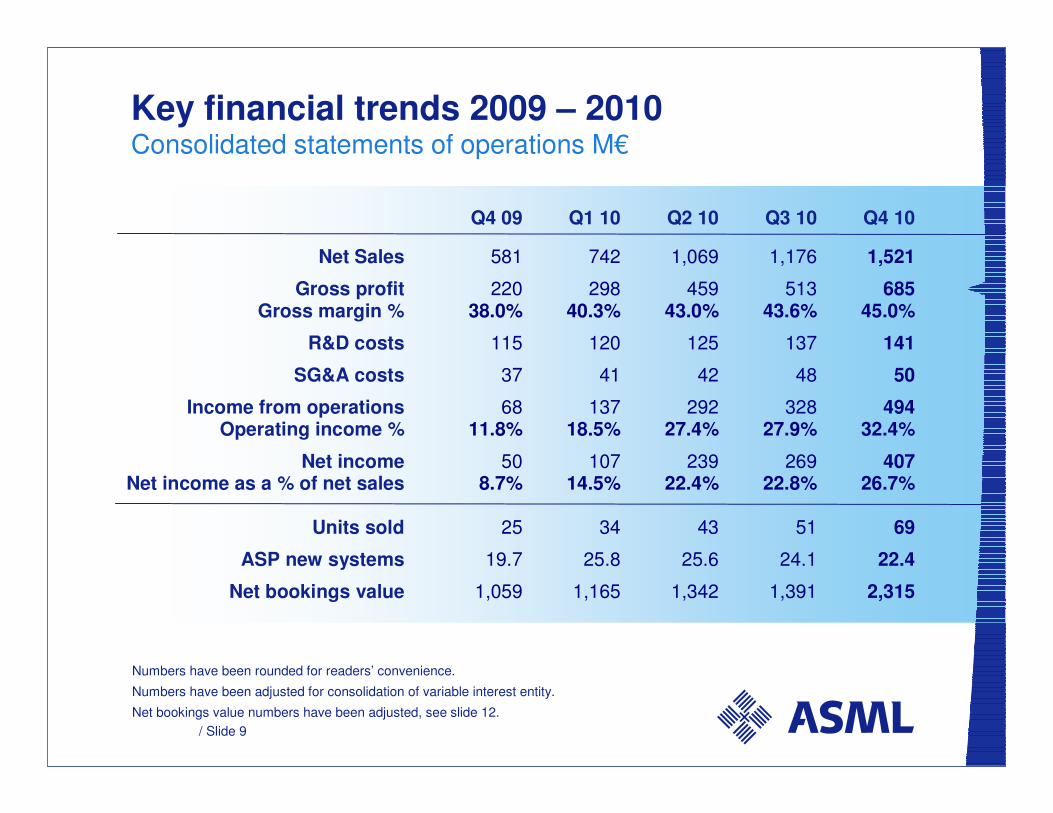
Key financial trends 2009 – 2010Consolidated statements of operations M€
Q4 09 Q1 10 Q2 10 Q3 10 Q4 10
Net Sales 581 742 1,069 1,176 1,521
Gross profit Gross margin %
220 38.0%
298 40.3%
459 43.0%
513 43.6%
685 45.0%
R&D costs 115 120 125 137 141
SG&A costs 37 41 42 48 50
Income from operations Operating income %
68 11.8%
137 18.5%
292 27.4%
328 27.9%
494 32.4%
Net income Net income as a % of net sales
50 8.7%
107 14.5%
239 22.4%
269 22.8%
407 26.7%
Units sold 25 34 43 51 69
ASP new systems 19.7 25.8 25.6 24.1 22.4
Net bookings value 1,059 1,165 1,342 1,391 2,315
Numbers have been rounded for readers’ convenience.
Numbers have been adjusted for consolidation of variable interest entity.
Net bookings value numbers have been adjusted, see slide 12.
/ Slide 10
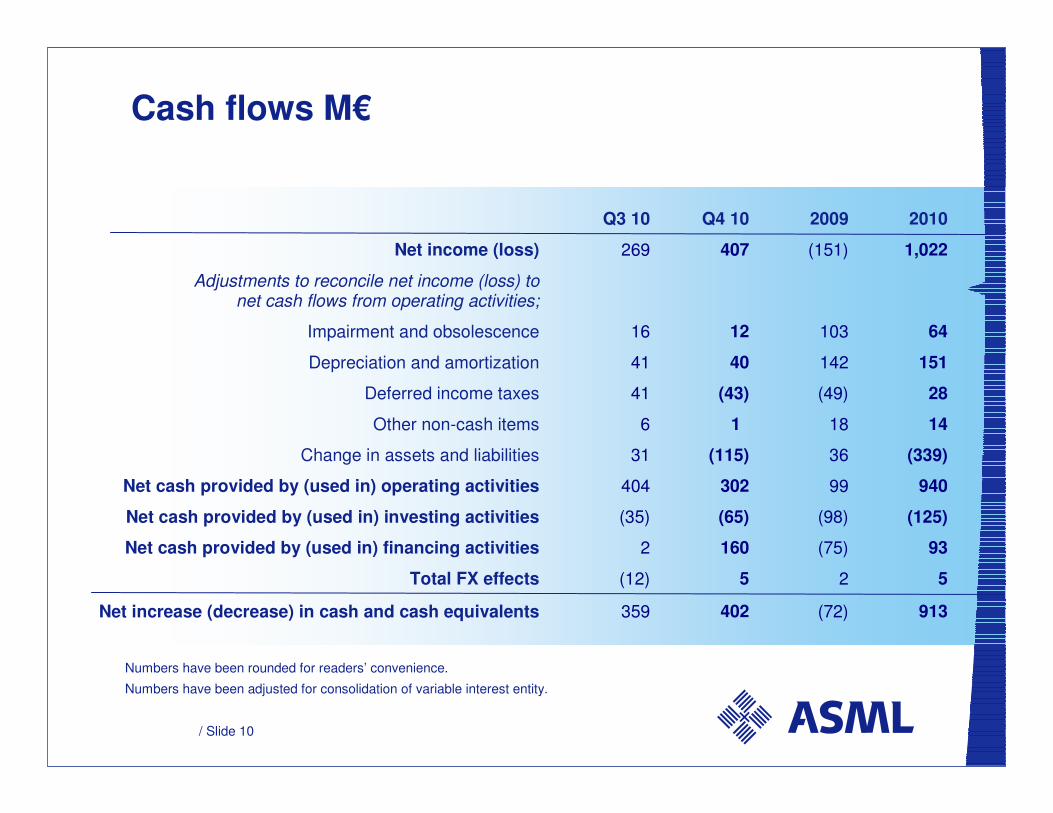
Cash flows M€
Numbers have been rounded for readers’ convenience.
Numbers have been adjusted for consolidation of variable interest entity.
Q3 10 Q4 10 2009 2010
Net income (loss) 269 407 (151) 1,022
Adjustments to reconcile net income (loss) to net cash flows from operating activities;
Impairment and obsolescence 16 12 103 64
Depreciation and amortization 41 40 142 151
Deferred income taxes 41 (43) (49) 28
Other non-cash items 6 1 18 14
Change in assets and liabilities 31 (115) 36 (339)
Net cash provided by (used in) operating activities 404 302 99 940
Net cash provided by (used in) investing activities (35) (65) (98) (125)
Net cash provided by (used in) financing activities 2 160 (75) 93
Total FX effects (12) 5 2 5
Net increase (decrease) in cash and cash equivalents 359 402 (72) 913
/ Slide 11
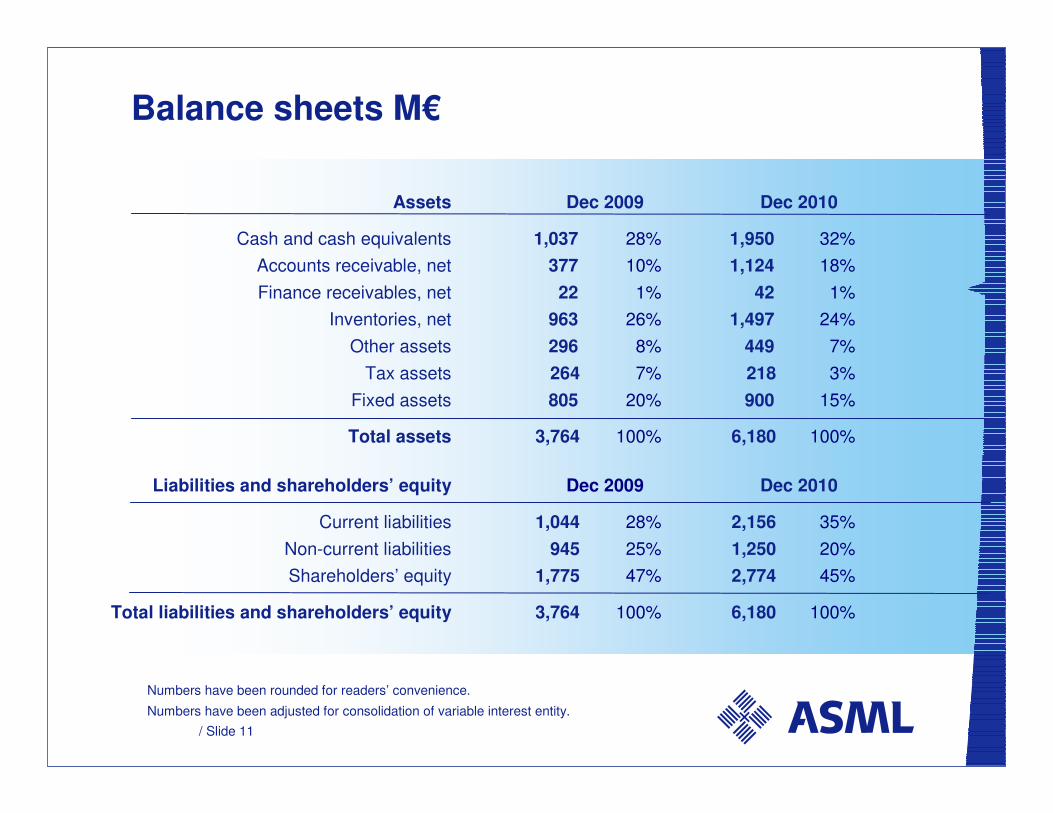
Assets Dec 2009 Dec 2010
Cash and cash equivalents 1,037 28% 1,950 32%
Accounts receivable, net 377 10% 1,124 18%
Finance receivables, net 22 1% 42 1%
Inventories, net 963 26% 1,497 24%
Other assets 296 8% 449 7%
Tax assets 264 7% 218 3%
Fixed assets 805 20% 900 15%
Total assets 3,764 100% 6,180 100%
Liabilities and shareholders’ equity Dec 2009 Dec 2010
Current liabilities 1,044 28% 2,156 35%
Non-current liabilities 945 25% 1,250 20%
Shareholders’ equity 1,775 47% 2,774 45%
Total liabilities and shareholders’ equity 3,764 100% 6,180 100%
Balance sheets M€
Numbers have been rounded for readers’ convenience.
Numbers have been adjusted for consolidation of variable interest entity.
/ Slide 12
Backlog and bookings to better represent future sales potential
� ASML will report from Q4 2010 full order values which include all contract-committed items that are associated with a system sale
� Not included in the order book and backlog will still be the separate service and field options orders for the already installed base of ASML systems at customer sites
/ Slide 13
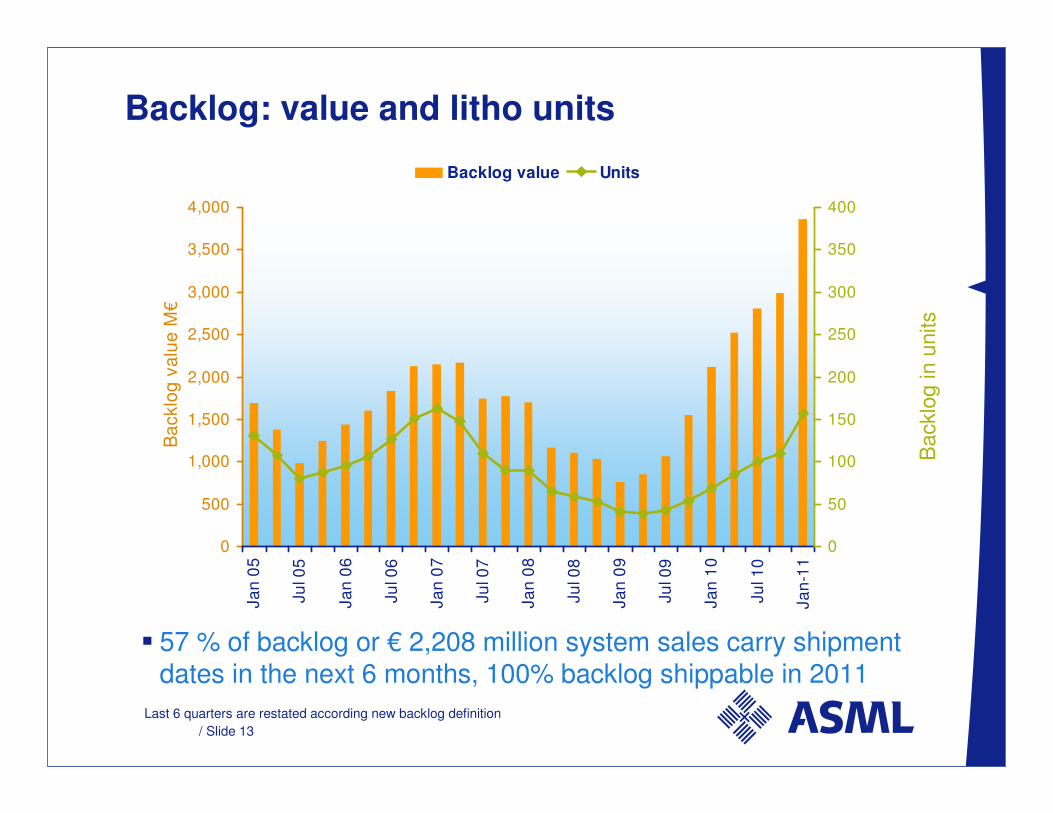
Backlog: value and litho units
0
500
1,000
1,500
2,000
2,500
3,000
3,500
4,000
Ja
n 0
5
Ju
l 05
Ja
n 0
6
Ju
l 06
Ja
n 0
7
Ju
l 07
Ja
n 0
8
Ju
l 08
Ja
n 0
9
Ju
l 09
Ja
n 1
0
Ju
l 10
Ja
n-1
1
Ba
cklo
g v
alu
e M
€
0
50
100
150
200
250
300
350
400
Backlog value Units
Backlo
g in u
nits
� 57 % of backlog or € 2,208 million system sales carry shipment dates in the next 6 months, 100% backlog shippable in 2011
Last 6 quarters are restated according new backlog definition
/ Slide 14
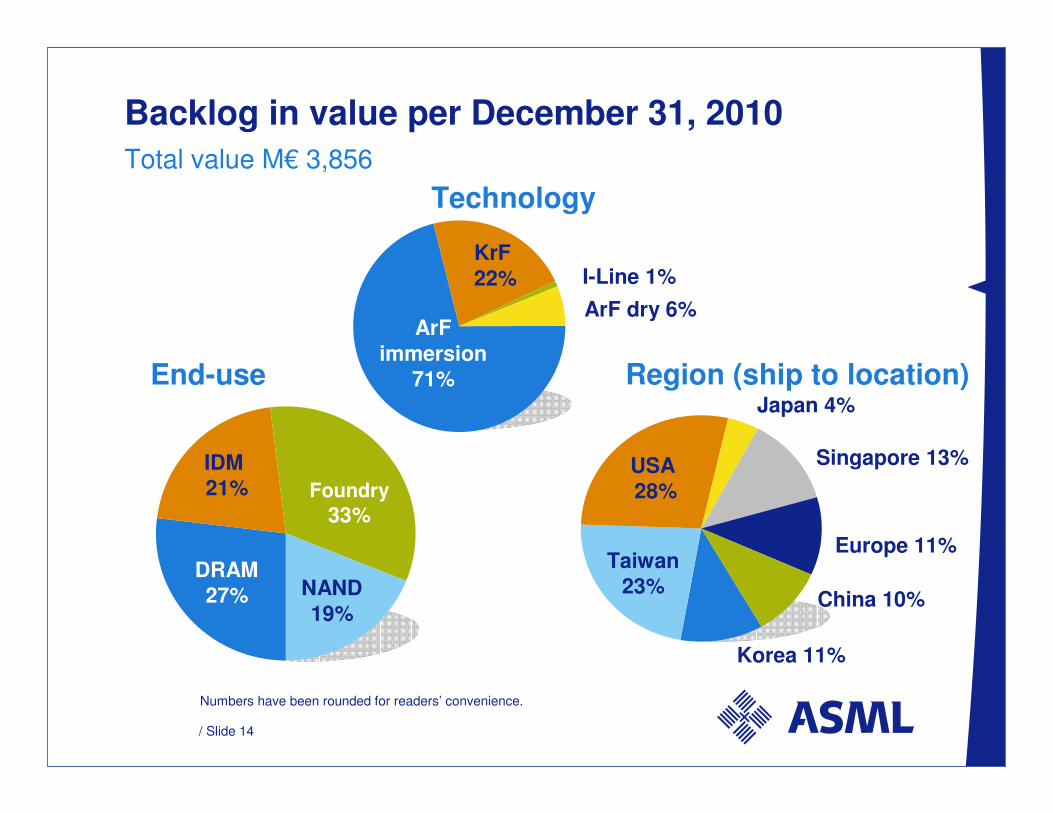
Backlog in value per December 31, 2010
Total value M€ 3,856
Technology
ArF
immersion
71%
KrF
22% I-Line 1%
Region (ship to location)
USA
28%
Taiwan
23%
Korea 11%
Europe 11%
Japan 4%
End-use
DRAM
27%
IDM
21% Foundry
33%
Numbers have been rounded for readers’ convenience.
Singapore 13%
China 10%
ArF dry 6%
NAND
19%
/ Slide 15
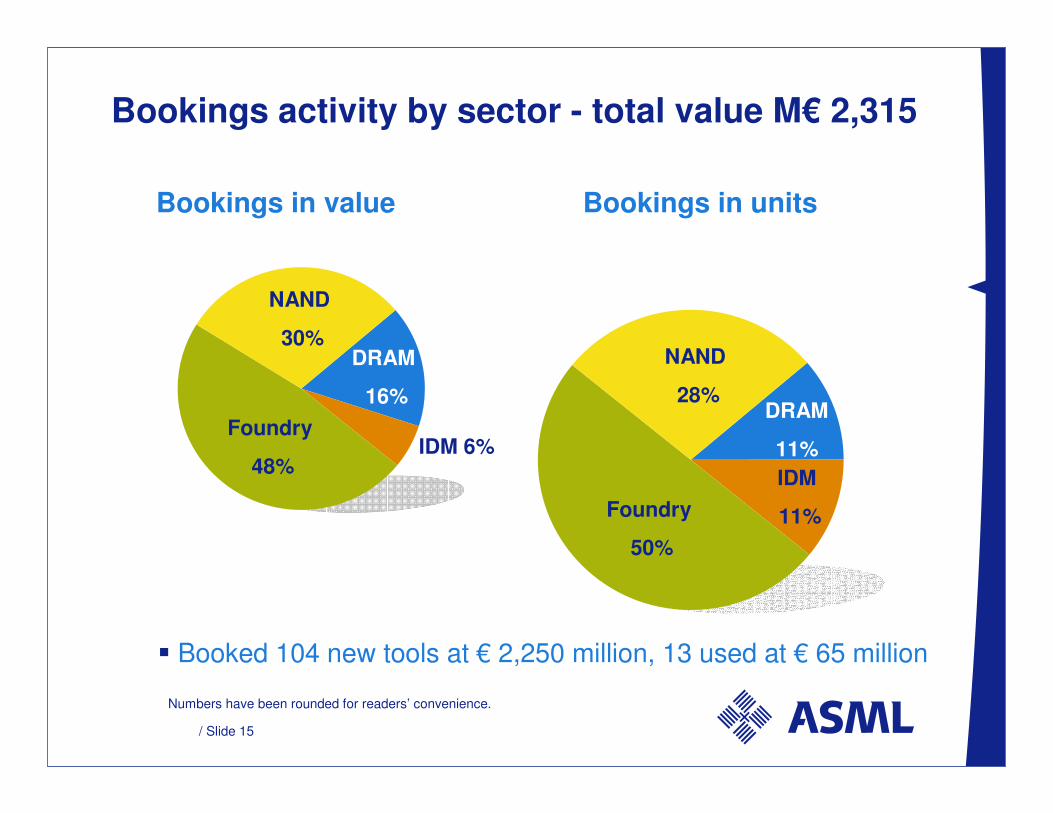
Bookings activity by sector - total value M€ 2,315
Bookings in value Bookings in units
IDM 6%Foundry
48%
DRAM
16%
IDM
11%Foundry
50%
DRAM
11%
NAND
28%
NAND
30%
� Booked 104 new tools at € 2,250 million, 13 used at € 65 million
Numbers have been rounded for readers’ convenience.
/ Slide 16
Market
/ Slide 17
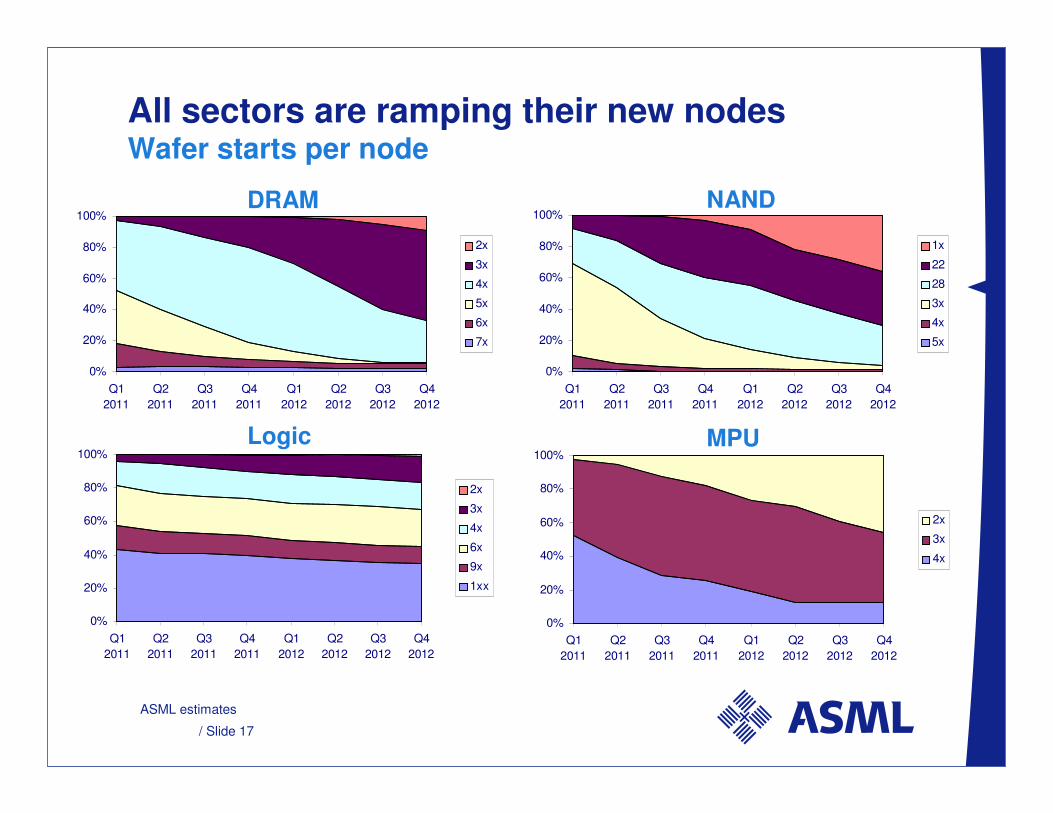
All sectors are ramping their new nodesWafer starts per node
0%
20%
40%
60%
80%
100%
Q1
2011
Q2
2011
Q3
2011
Q4
2011
Q1
2012
Q2
2012
Q3
2012
Q4
2012
2x
3x
4x
5x
6x
7x
0%
20%
40%
60%
80%
100%
Q1
2011
Q2
2011
Q3
2011
Q4
2011
Q1
2012
Q2
2012
Q3
2012
Q4
2012
1x
22
28
3x
4x
5x
0%
20%
40%
60%
80%
100%
Q1
2011
Q2
2011
Q3
2011
Q4
2011
Q1
2012
Q2
2012
Q3
2012
Q4
2012
2x
3x
4x
0%
20%
40%
60%
80%
100%
Q1
2011
Q2
2011
Q3
2011
Q4
2011
Q1
2012
Q2
2012
Q3
2012
Q4
2012
2x
3x
4x
6x
9x
1xx
DRAM NAND
Logic MPU
ASML estimates
/ Slide 18
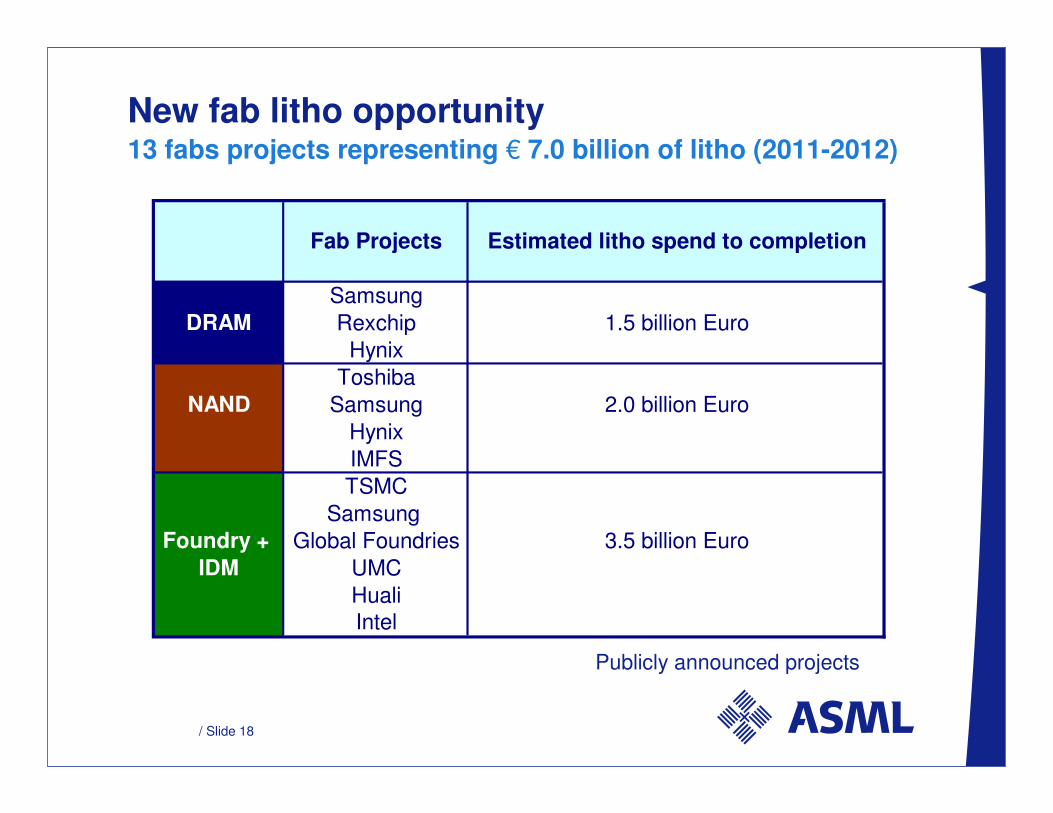
New fab litho opportunity13 fabs projects representing € 7.0 billion of litho (2011-2012)
Publicly announced projects
Fab Projects Estimated litho spend to completion
Samsung
DRAM Rexchip 1.5 billion Euro
Hynix
Toshiba
NAND Samsung 2.0 billion Euro
Hynix
IMFS
TSMC
Samsung
Foundry + Global Foundries 3.5 billion Euro
IDM UMC
Huali
Intel
/ Slide 19
ASML business update
/ Slide 20
Technology - TWINSCAN NXT
� Productivity at specified 175 wafers per hour, 3 nm overlay
� FlexRay, programmable illuminator, shipping in high
volume
� System production capacity increasing by cycle time
improvement and cabin conversions
� Q4 NXT shipments surpassed Q4 XT immersion for the
first time
/ Slide 21
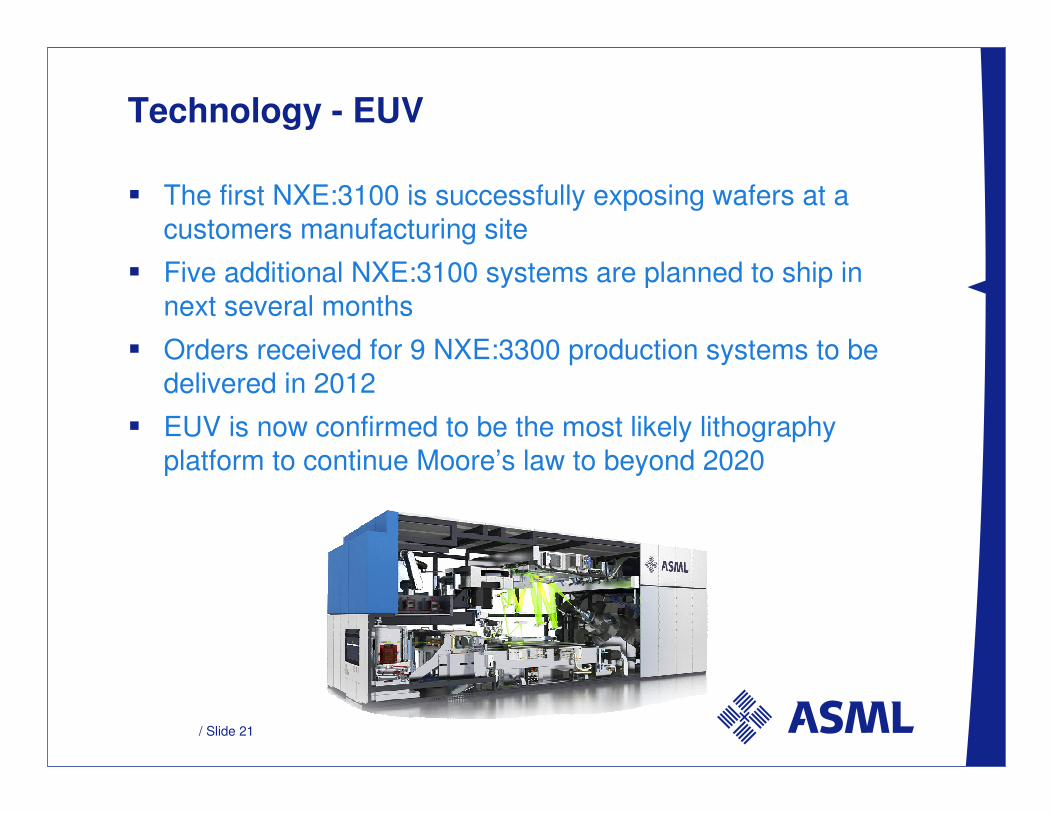
Technology - EUV
� The first NXE:3100 is successfully exposing wafers at a
customers manufacturing site
� Five additional NXE:3100 systems are planned to ship in
next several months
� Orders received for 9 NXE:3300 production systems to be
delivered in 2012
� EUV is now confirmed to be the most likely lithography
platform to continue Moore’s law to beyond 2020
/ Slide 22
Cash return
� Announcing a share buy back program of up to € 1 billion
executed within a 2 year timeframe
� Proposed dividend for 2010 of € 0.40 per ordinary share
(approx. € 175 million) vs. € 0.20 per share in 2009
/ Slide 23
Outlook and summary
/ Slide 24
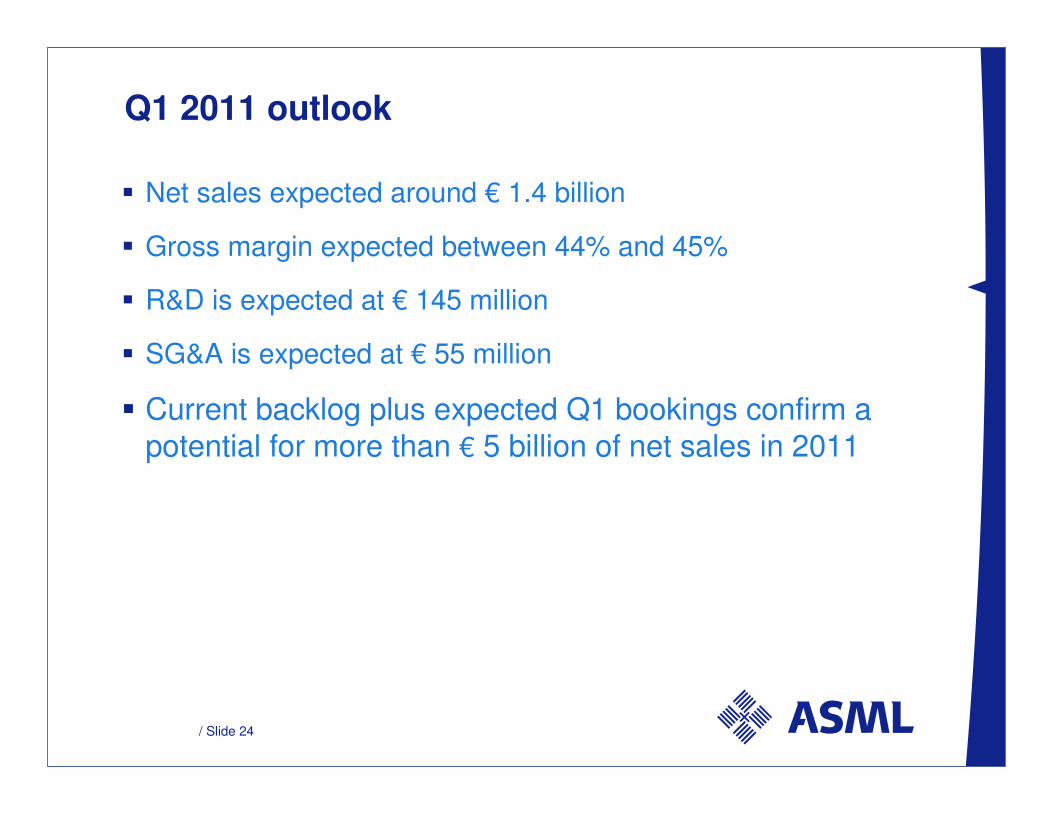
Q1 2011 outlook
� Net sales expected around € 1.4 billion
� Gross margin expected between 44% and 45%
� R&D is expected at € 145 million
� SG&A is expected at € 55 million
� Current backlog plus expected Q1 bookings confirm a
potential for more than € 5 billion of net sales in 2011
/ Slide 25