Embed Size (px)
Citation preview
37 (2007) 231–241
Cement and Concrete ResearchAspects of moisture kinetics of coal bottom ash in concrete
L.B. Andrade, J.C. Rocha ⁎, M. Cheriaf
Department of Civil Engineering, Federal University of Santa Catarina, Florianópolis-SC, 88040-900, Brazil
Received 20 July 2005; accepted 2 November 2006
Abstract
The moisture kinetics aspects of composite granular material samples composed of natural sand and bottom ash (BA) from thermoelectricpower stations and the use of this material in the production of durable concretes, in relation to water transport, are here discussed. The evaluationsof the phenomenon of water absorption by capillarity and the loss of water through air drying until hygroscopic equilibrium, were carried out inaccordance with classic procedures found in the literature and also newly developed procedures. The results showed that due to the high porosityof BA, the water absorption by capillarity along with the absorption velocity were higher in the compositions with greater BA content. The valuesfor moisture equilibrium from air drying, absorption from capillarity and sorptivity obtained in the hygroscopic equilibrium tests, carried out onthe same samples after absorption, were also higher in the samples with BA. These samples also requited a longer drying time.© 2006 Elsevier Ltd. All rights reserved.
Keywords: Bottom ash; Coal; Concrete; Moisture; Drying; Capillarity
1. Introduction
The use of by-products or wastes from coal-fired thermo-electric power plants has evolved into a reality in the productionof concrete, resulting in good mechanical performance, goodcompatibility with raw materials in the concrete and durability[1–3].
The use of fly ash in the production of concrete, both in thereplacement of cement – larger consumption – and in thesubstitution of the natural fine aggregates, has been widelypresented as a suitable solution for the reduction of this waste [4].
Bottom ash (BA) has also been targeted in some publicationsfor its use in concrete and mortar [5–9].
The most important properties of BA are the size and shapeof the particles and the porosity. Such properties depend on theburning efficiency, the method in which the BA is obtained andthe type of combustion. When very small molten and wellvitrified particles around 30 μm are formed, this satisfies thebasic requirements of a fine aggregate for concrete and mortar,even if grain size distribution varies. There is also pozzolanicpotential, although this is low due to the grain size [5].
⁎ Corresponding author. Tel.: +55 4833315169; fax: +55 4833319272.E-mail address: [email protected] (J.C. Rocha).
0008-8846/$ - see front matter © 2006 Elsevier Ltd. All rights reserved.doi:10.1016/j.cemconres.2006.11.001
The low pozzolanic potential of BA is not a limiting factorfor its use as a fine aggregate, since any positive influencecaused by the pozzolanic effect improves the mechanicalperformance and durability, due to calcium hydroxide con-sumption and formation of calcium silicate hydrate (C-S-H),which can be seen as a positive contribution of the BA [10,11].
However, to use BA as a raw material for concrete andmortar it is necessary to pay due attention mainly to the dosageparameters, for example, to the water/cement ratio [6]. Thisparameter is directly influenced by the hygroscopic character-istic of the BA and is difficult to control, since it is dependent onthe raw material and the burning process, on the dimension ofthe particles and on the residue being extracted through aprocess involving a humid system.
Thus, BAwill influencemany properties: 1. water requirement,because of the fineness, the unburned material and the naturalmoisture content which is retained internally [1]; 2. filler effect,with an improvement in the filling role [6,10–13]; 3. mechanicalproperties, due to the pozzolanic effect, which stimulates theconsumption of calcium hydroxide and the formation of C-S-H,which contributes to the filling of voids [10,12].
Furthermore, since BA has a high capacity for water retention,this feature must be considered in the evaluation of concreteproduced with this by-product for use in water reservoirs [14].
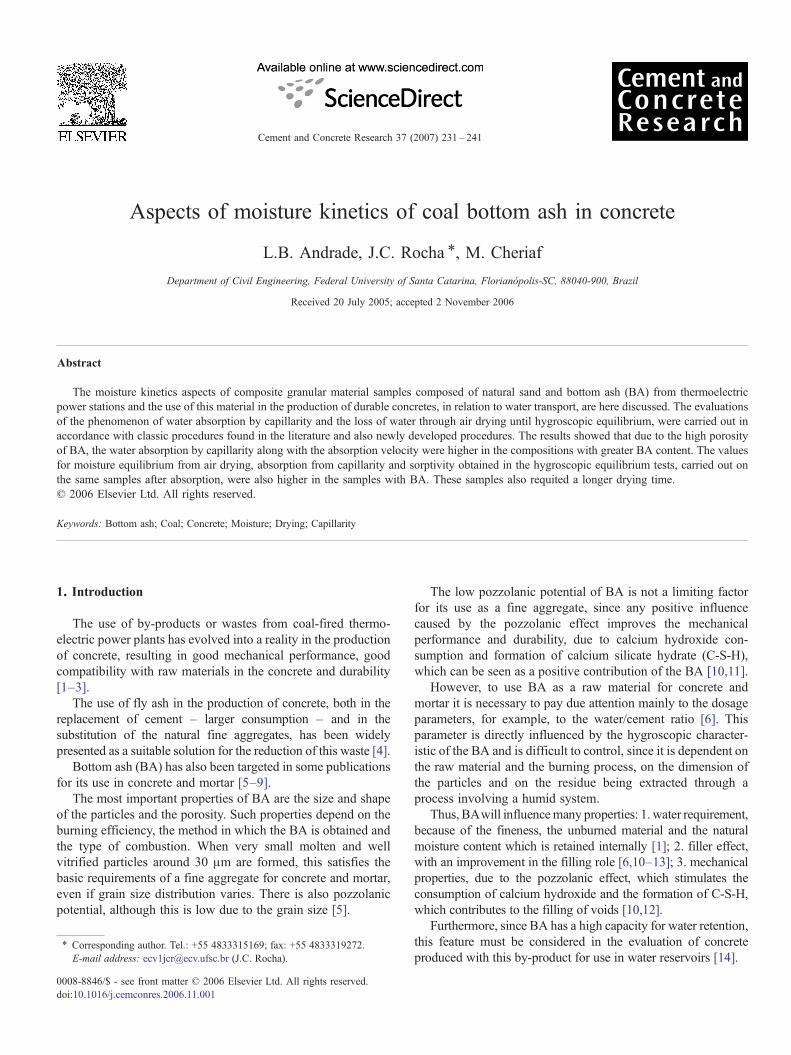
Fig. 1. SEM of bottom ash (ϕb250 μm).
Fig. 2. X-ray diffraction analysis of bottom ash.
232 L.B. Andrade et al. / Cement and Concrete Research 37 (2007) 231–241
The moisture kinetics were studied in order to find a suitableselection of BA as a fine aggregate, with a view to gaining abetter understanding of the characteristics of BA, considering itas a granular material like natural sand.
In this context, this paper reports on the effect of the moisturekinetics of BA as a granular material with an aggregate functionand also evaluates the performance of concrete using BA as anatural sand replacement. The evaluation will be carried out usingtest methods to measure the capillary absorption and the waterloss during air drying in tests with granular blends and concretewith bottom ash as a partial or total natural sand replacement.
2. Materials
The bottom ash used was collected from the Jorge Lacerdathermoelectric power station pond, SantaCatarina, southernBrazil,where 840million tons of ash are available annually (Fig. 1). It has
Table 1Chemical and physical characteristics of Portland cement and bottom ash
Content (%) Cement Bottom ash
Chemical analysisSiO2 18.13 50.46Al2O3 4.28 28.35Fe2O3 2.54 10.69K2O – 3.81CaO 59.80 2.07TiO2 – 1.57SO3 3.14 0.34ZrO2 – 0.18V2O5 – 0.09MnO – 0.07ZnO – 0.03Y2O3 – 0.03SrO – 0.03MgO 5.25 –CaO free 1.47 –Loss on ignition 3.29 2.3
Physical testsBlaine (cm2/g) 4.098 –Start of setting (h:min) 1:30 –End of setting (h:min) 2:37 –Specific gravity (g/cm3) 3.12 1.674
a specific gravity of 1.67 g/cm3 and fineness modulus of 1.55. TheBA was used in the concrete with its natural moisture content(55%), without previous oven drying. The bottom ash was collect-ed and maintained in polypropylene bags and HDPE containersuntil the concrete production, to ensure the samewater content. CPV Portland cement was used—ARI (high-early strength Portlandcement), according to Brazilian standard NBR 5733/91 (similar totype IIIASTMC150-05). The natural fine aggregatewas river sand(NS) with a specific gravity of 2.63 g/cm3 and fineness modulus of2.50. The specific gravity of the natural coarse aggregate was2.70 g/cm3 and the maximum diameter was 19.0 mm.
The chemical and physical characteristics of the cement andthe BA are shown in Table 1. In the chemical analysis of the BAparticles, using X-ray dispersion spectrometry (XDS/Shi-madzu), it was observed that approximately 78% of the materialwas composed of silica and alumina. The X-ray diffractionanalysis (Fig. 2) indicates that the BA is comprised mainly ofquartz and mullite.
Mixtures were made with bottom ash as a natural sandreplacement (BA/NS) for analysis of the BA influence on thegrain size distribution, as shown in Table 2.
In this paper, the assessment of the action of bottom ash as afine aggregate involved the following procedures:
– elaboration of natural sand and BA blends;– evaluation of the absorption by capillarity of the blends interms of time;
– evaluation of the moisture kinetics of the drying of the blends.
Table 2Grain size distribution of some of granular material compositions
Blend Sand —NS (%)
Bottomash — BA(%)
Grain size distribution (%)
b250 µm 250 — 500 µm N500 µm
0% BA/NS a 100 0 19.0 21.0 60.025% BA/NS 75 25 22.0 26.0 52.050% BA/NS 50 50 28.0 22.0 50.075% BA/NS 25 75 36.0 24.0 40.0100% BA/NS 0 100 50.0 28.0 22.0a Reference granular sample.
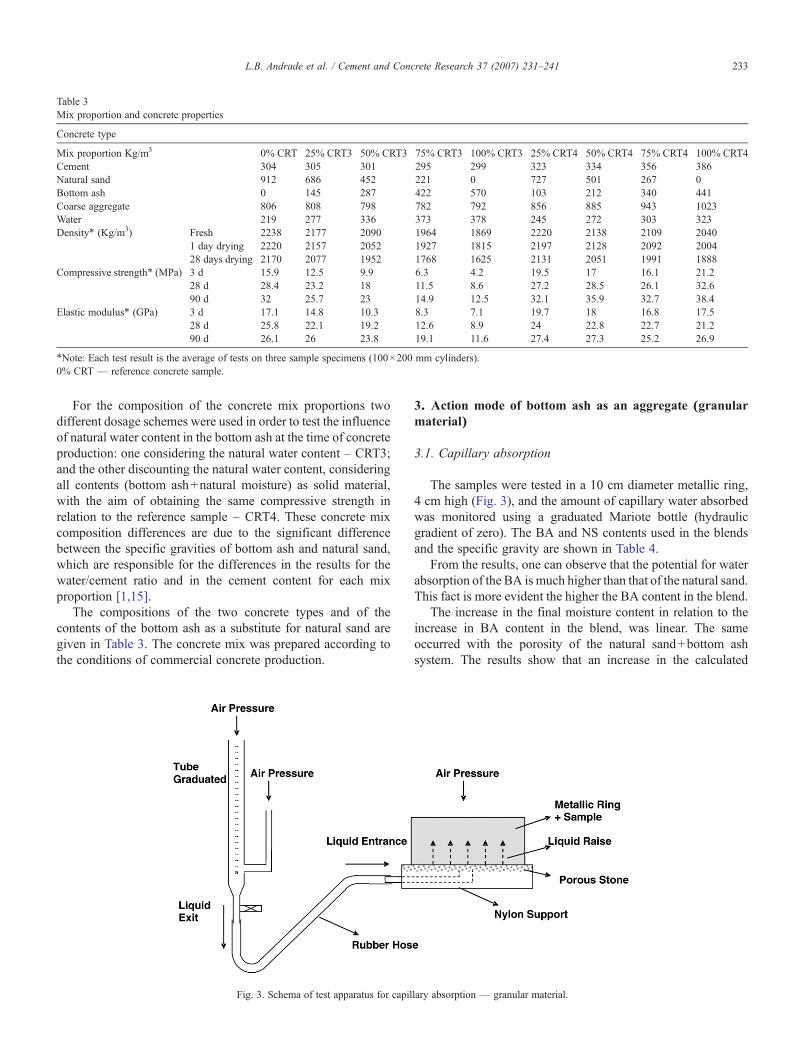
Table 3Mix proportion and concrete properties
Concrete type
Mix proportion Kg/m3 0% CRT 25% CRT3 50% CRT3 75% CRT3 100% CRT3 25% CRT4 50% CRT4 75% CRT4 100% CRT4Cement 304 305 301 295 299 323 334 356 386Natural sand 912 686 452 221 0 727 501 267 0Bottom ash 0 145 287 422 570 103 212 340 441Coarse aggregate 806 808 798 782 792 856 885 943 1023Water 219 277 336 373 378 245 272 303 323Density⁎ (Kg/m3) Fresh 2238 2177 2090 1964 1869 2220 2138 2109 2040
1 day drying 2220 2157 2052 1927 1815 2197 2128 2092 200428 days drying 2170 2077 1952 1768 1625 2131 2051 1991 1888
Compressive strength⁎ (MPa) 3 d 15.9 12.5 9.9 6.3 4.2 19.5 17 16.1 21.228 d 28.4 23.2 18 11.5 8.6 27.2 28.5 26.1 32.690 d 32 25.7 23 14.9 12.5 32.1 35.9 32.7 38.4
Elastic modulus⁎ (GPa) 3 d 17.1 14.8 10.3 8.3 7.1 19.7 18 16.8 17.528 d 25.8 22.1 19.2 12.6 8.9 24 22.8 22.7 21.290 d 26.1 26 23.8 19.1 11.6 27.4 27.3 25.2 26.9
⁎Note: Each test result is the average of tests on three sample specimens (100×200 mm cylinders).0% CRT — reference concrete sample.
233L.B. Andrade et al. / Cement and Concrete Research 37 (2007) 231–241
For the composition of the concrete mix proportions twodifferent dosage schemes were used in order to test the influenceof natural water content in the bottom ash at the time of concreteproduction: one considering the natural water content – CRT3;and the other discounting the natural water content, consideringall contents (bottom ash+natural moisture) as solid material,with the aim of obtaining the same compressive strength inrelation to the reference sample – CRT4. These concrete mixcomposition differences are due to the significant differencebetween the specific gravities of bottom ash and natural sand,which are responsible for the differences in the results for thewater/cement ratio and in the cement content for each mixproportion [1,15].
The compositions of the two concrete types and of thecontents of the bottom ash as a substitute for natural sand aregiven in Table 3. The concrete mix was prepared according tothe conditions of commercial concrete production.
Fig. 3. Schema of test apparatus for capil
3. Action mode of bottom ash as an aggregate (granularmaterial)
3.1. Capillary absorption
The samples were tested in a 10 cm diameter metallic ring,4 cm high (Fig. 3), and the amount of capillary water absorbedwas monitored using a graduated Mariote bottle (hydraulicgradient of zero). The BA and NS contents used in the blendsand the specific gravity are shown in Table 4.
From the results, one can observe that the potential for waterabsorption of the BA is much higher than that of the natural sand.This fact is more evident the higher the BA content in the blend.
The increase in the final moisture content in relation to theincrease in BA content in the blend, was linear. The sameoccurred with the porosity of the natural sand+bottom ashsystem. The results show that an increase in the calculated
lary absorption — granular material.
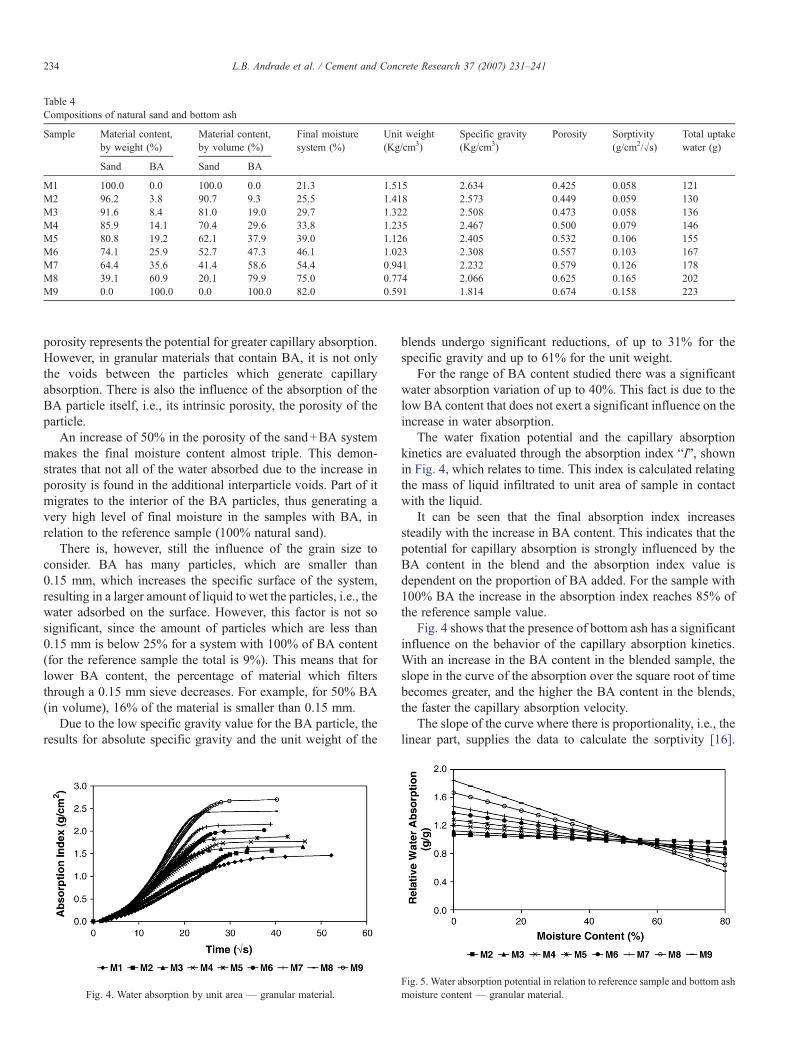
Table 4Compositions of natural sand and bottom ash
Sample Material content,by weight (%)
Material content,by volume (%)
Final moisturesystem (%)
Unit weight(Kg/cm3)
Specific gravity(Kg/cm3)
Porosity Sorptivity(g/cm2/√s)
Total uptakewater (g)
Sand BA Sand BA
M1 100.0 0.0 100.0 0.0 21.3 1.515 2.634 0.425 0.058 121M2 96.2 3.8 90.7 9.3 25.5 1.418 2.573 0.449 0.059 130M3 91.6 8.4 81.0 19.0 29.7 1.322 2.508 0.473 0.058 136M4 85.9 14.1 70.4 29.6 33.8 1.235 2.467 0.500 0.079 146M5 80.8 19.2 62.1 37.9 39.0 1.126 2.405 0.532 0.106 155M6 74.1 25.9 52.7 47.3 46.1 1.023 2.308 0.557 0.103 167M7 64.4 35.6 41.4 58.6 54.4 0.941 2.232 0.579 0.126 178M8 39.1 60.9 20.1 79.9 75.0 0.774 2.066 0.625 0.165 202M9 0.0 100.0 0.0 100.0 82.0 0.591 1.814 0.674 0.158 223
234 L.B. Andrade et al. / Cement and Concrete Research 37 (2007) 231–241
porosity represents the potential for greater capillary absorption.However, in granular materials that contain BA, it is not onlythe voids between the particles which generate capillaryabsorption. There is also the influence of the absorption of theBA particle itself, i.e., its intrinsic porosity, the porosity of theparticle.
An increase of 50% in the porosity of the sand+BA systemmakes the final moisture content almost triple. This demon-strates that not all of the water absorbed due to the increase inporosity is found in the additional interparticle voids. Part of itmigrates to the interior of the BA particles, thus generating avery high level of final moisture in the samples with BA, inrelation to the reference sample (100% natural sand).
There is, however, still the influence of the grain size toconsider. BA has many particles, which are smaller than0.15 mm, which increases the specific surface of the system,resulting in a larger amount of liquid to wet the particles, i.e., thewater adsorbed on the surface. However, this factor is not sosignificant, since the amount of particles which are less than0.15 mm is below 25% for a system with 100% of BA content(for the reference sample the total is 9%). This means that forlower BA content, the percentage of material which filtersthrough a 0.15 mm sieve decreases. For example, for 50% BA(in volume), 16% of the material is smaller than 0.15 mm.
Due to the low specific gravity value for the BA particle, theresults for absolute specific gravity and the unit weight of the
Fig. 4. Water absorption by unit area — granular material.
blends undergo significant reductions, of up to 31% for thespecific gravity and up to 61% for the unit weight.
For the range of BA content studied there was a significantwater absorption variation of up to 40%. This fact is due to thelow BA content that does not exert a significant influence on theincrease in water absorption.
The water fixation potential and the capillary absorptionkinetics are evaluated through the absorption index “I”, shownin Fig. 4, which relates to time. This index is calculated relatingthe mass of liquid infiltrated to unit area of sample in contactwith the liquid.
It can be seen that the final absorption index increasessteadily with the increase in BA content. This indicates that thepotential for capillary absorption is strongly influenced by theBA content in the blend and the absorption index value isdependent on the proportion of BA added. For the sample with100% BA the increase in the absorption index reaches 85% ofthe reference sample value.
Fig. 4 shows that the presence of bottom ash has a significantinfluence on the behavior of the capillary absorption kinetics.With an increase in the BA content in the blended sample, theslope in the curve of the absorption over the square root of timebecomes greater, and the higher the BA content in the blends,the faster the capillary absorption velocity.
The slope of the curve where there is proportionality, i.e., thelinear part, supplies the data to calculate the sorptivity [16].
Fig. 5. Water absorption potential in relation to reference sample and bottom ashmoisture content — granular material.
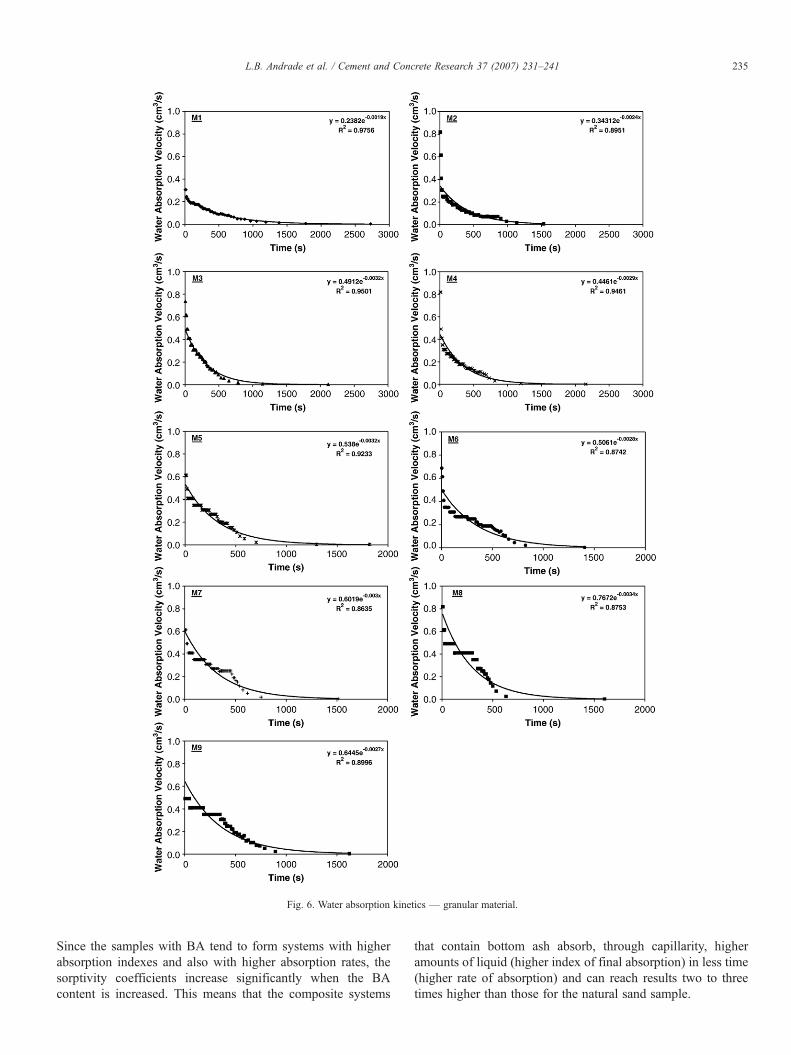
Fig. 6. Water absorption kinetics — granular material.
235L.B. Andrade et al. / Cement and Concrete Research 37 (2007) 231–241
Since the samples with BA tend to form systems with higherabsorption indexes and also with higher absorption rates, thesorptivity coefficients increase significantly when the BAcontent is increased. This means that the composite systems
that contain bottom ash absorb, through capillarity, higheramounts of liquid (higher index of final absorption) in less time(higher rate of absorption) and can reach results two to threetimes higher than those for the natural sand sample.
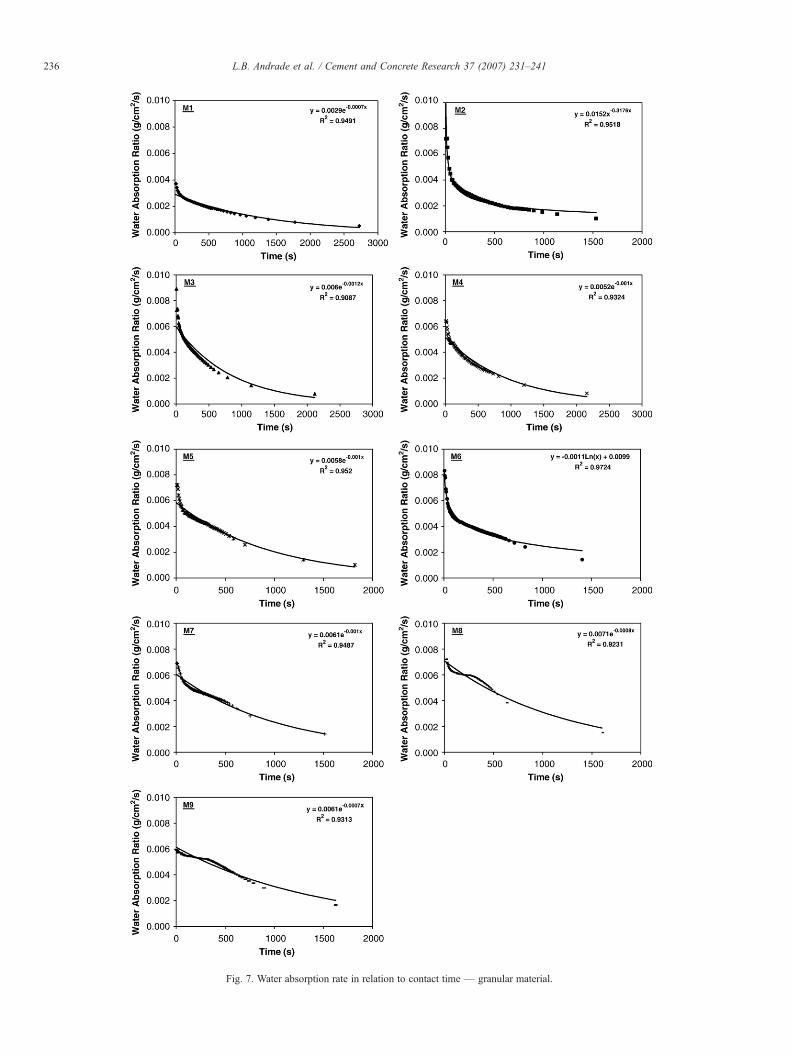
Fig. 7. Water absorption rate in relation to contact time — granular material.
236 L.B. Andrade et al. / Cement and Concrete Research 37 (2007) 231–241
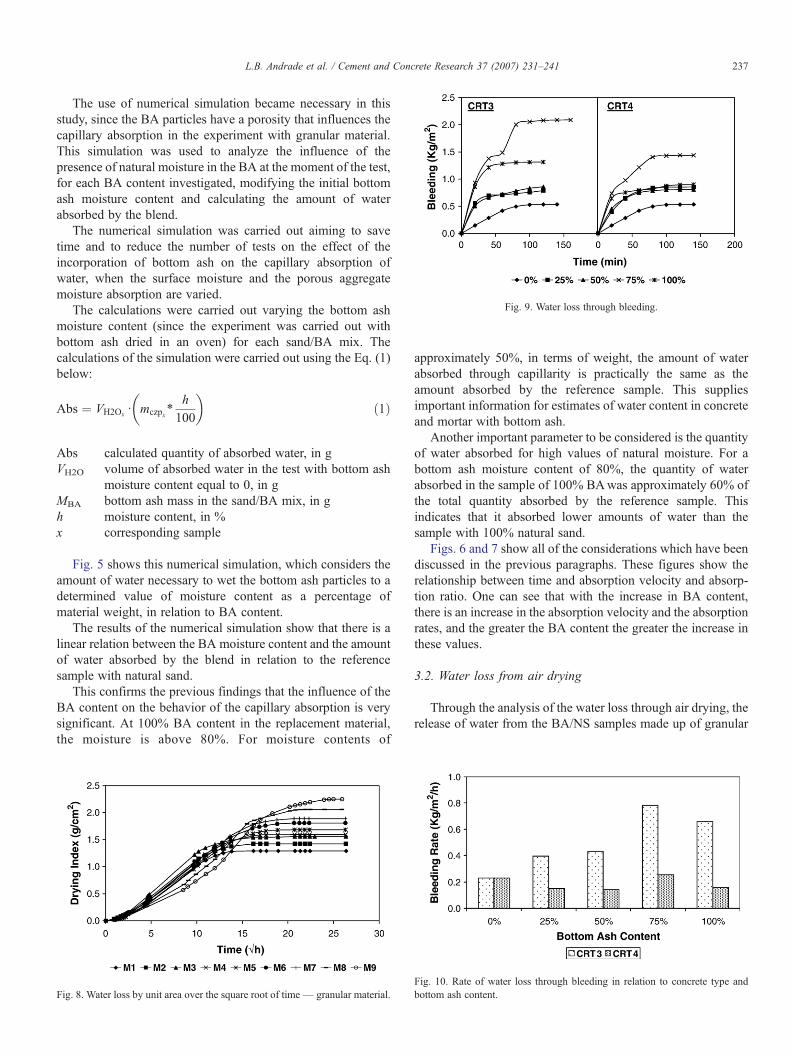
Fig. 9. Water loss through bleeding.
237L.B. Andrade et al. / Cement and Concrete Research 37 (2007) 231–241
The use of numerical simulation became necessary in thisstudy, since the BA particles have a porosity that influences thecapillary absorption in the experiment with granular material.This simulation was used to analyze the influence of thepresence of natural moisture in the BA at the moment of the test,for each BA content investigated, modifying the initial bottomash moisture content and calculating the amount of waterabsorbed by the blend.
The numerical simulation was carried out aiming to savetime and to reduce the number of tests on the effect of theincorporation of bottom ash on the capillary absorption ofwater, when the surface moisture and the porous aggregatemoisture absorption are varied.
The calculations were carried out varying the bottom ashmoisture content (since the experiment was carried out withbottom ash dried in an oven) for each sand/BA mix. Thecalculations of the simulation were carried out using the Eq. (1)below:
Abs ¼ VH2Ox d mczpxTh
100
� �ð1Þ
Abs calculated quantity of absorbed water, in gVH2O volume of absorbed water in the test with bottom ash
moisture content equal to 0, in gMBA bottom ash mass in the sand/BA mix, in gh moisture content, in %x corresponding sample
Fig. 5 shows this numerical simulation, which considers theamount of water necessary to wet the bottom ash particles to adetermined value of moisture content as a percentage ofmaterial weight, in relation to BA content.
The results of the numerical simulation show that there is alinear relation between the BA moisture content and the amountof water absorbed by the blend in relation to the referencesample with natural sand.
This confirms the previous findings that the influence of theBA content on the behavior of the capillary absorption is verysignificant. At 100% BA content in the replacement material,the moisture is above 80%. For moisture contents of
Fig. 8. Water loss by unit area over the square root of time— granular material.
approximately 50%, in terms of weight, the amount of waterabsorbed through capillarity is practically the same as theamount absorbed by the reference sample. This suppliesimportant information for estimates of water content in concreteand mortar with bottom ash.
Another important parameter to be considered is the quantityof water absorbed for high values of natural moisture. For abottom ash moisture content of 80%, the quantity of waterabsorbed in the sample of 100% BAwas approximately 60% ofthe total quantity absorbed by the reference sample. Thisindicates that it absorbed lower amounts of water than thesample with 100% natural sand.
Figs. 6 and 7 show all of the considerations which have beendiscussed in the previous paragraphs. These figures show therelationship between time and absorption velocity and absorp-tion ratio. One can see that with the increase in BA content,there is an increase in the absorption velocity and the absorptionrates, and the greater the BA content the greater the increase inthese values.
3.2. Water loss from air drying
Through the analysis of the water loss through air drying, therelease of water from the BA/NS samples made up of granular
Fig. 10. Rate of water loss through bleeding in relation to concrete type andbottom ash content.
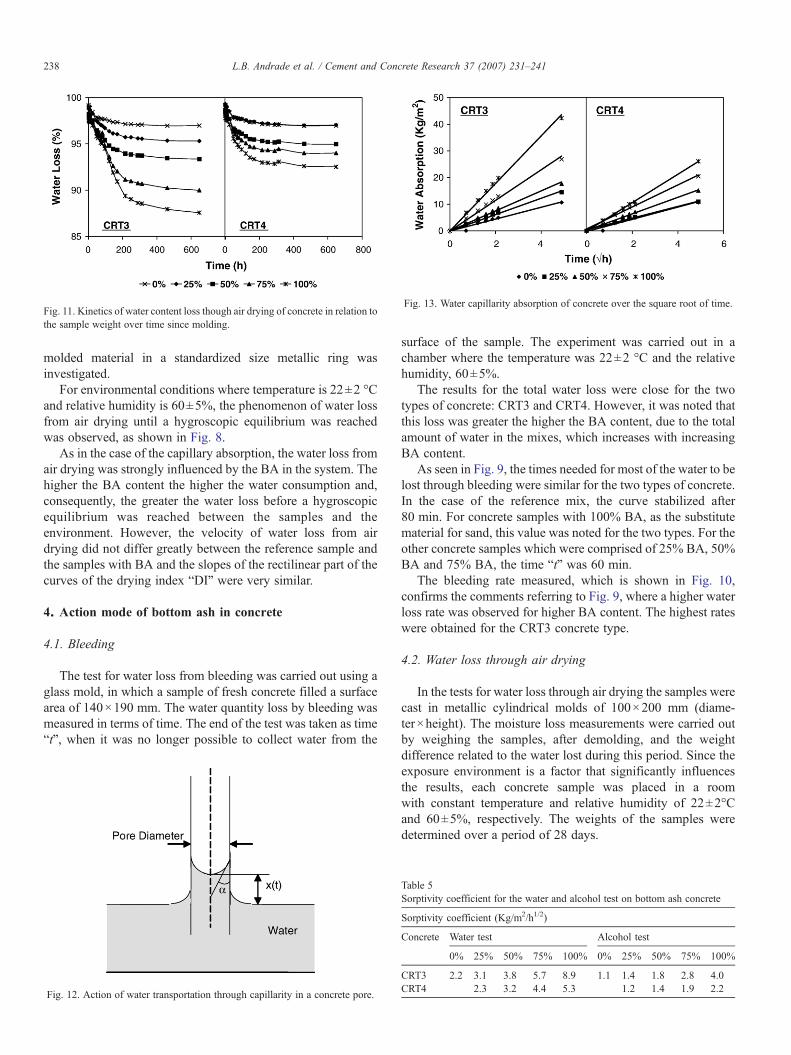
Fig. 11. Kinetics of water content loss though air drying of concrete in relation tothe sample weight over time since molding.
Fig. 13. Water capillarity absorption of concrete over the square root of time.
238 L.B. Andrade et al. / Cement and Concrete Research 37 (2007) 231–241
molded material in a standardized size metallic ring wasinvestigated.
For environmental conditions where temperature is 22±2 °Cand relative humidity is 60±5%, the phenomenon of water lossfrom air drying until a hygroscopic equilibrium was reachedwas observed, as shown in Fig. 8.
As in the case of the capillary absorption, the water loss fromair drying was strongly influenced by the BA in the system. Thehigher the BA content the higher the water consumption and,consequently, the greater the water loss before a hygroscopicequilibrium was reached between the samples and theenvironment. However, the velocity of water loss from airdrying did not differ greatly between the reference sample andthe samples with BA and the slopes of the rectilinear part of thecurves of the drying index “DI” were very similar.
4. Action mode of bottom ash in concrete
4.1. Bleeding
The test for water loss from bleeding was carried out using aglass mold, in which a sample of fresh concrete filled a surfacearea of 140×190 mm. The water quantity loss by bleeding wasmeasured in terms of time. The end of the test was taken as time“t”, when it was no longer possible to collect water from the
Fig. 12. Action of water transportation through capillarity in a concrete pore.
surface of the sample. The experiment was carried out in achamber where the temperature was 22±2 °C and the relativehumidity, 60±5%.
The results for the total water loss were close for the twotypes of concrete: CRT3 and CRT4. However, it was noted thatthis loss was greater the higher the BA content, due to the totalamount of water in the mixes, which increases with increasingBA content.
As seen in Fig. 9, the times needed for most of the water to belost through bleeding were similar for the two types of concrete.In the case of the reference mix, the curve stabilized after80 min. For concrete samples with 100% BA, as the substitutematerial for sand, this value was noted for the two types. For theother concrete samples which were comprised of 25% BA, 50%BA and 75% BA, the time “t” was 60 min.
The bleeding rate measured, which is shown in Fig. 10,confirms the comments referring to Fig. 9, where a higher waterloss rate was observed for higher BA content. The highest rateswere obtained for the CRT3 concrete type.
4.2. Water loss through air drying
In the tests for water loss through air drying the samples werecast in metallic cylindrical molds of 100×200 mm (diame-ter×height). The moisture loss measurements were carried outby weighing the samples, after demolding, and the weightdifference related to the water lost during this period. Since theexposure environment is a factor that significantly influencesthe results, each concrete sample was placed in a roomwith constant temperature and relative humidity of 22±2°Cand 60±5%, respectively. The weights of the samples weredetermined over a period of 28 days.
Table 5Sorptivity coefficient for the water and alcohol test on bottom ash concrete
Sorptivity coefficient (Kg/m2/h1/2)
Concrete Water test Alcohol test
0% 25% 50% 75% 100% 0% 25% 50% 75% 100%
CRT3 2.2 3.1 3.8 5.7 8.9 1.1 1.4 1.8 2.8 4.0CRT4 2.3 3.2 4.4 5.3 1.2 1.4 1.9 2.2
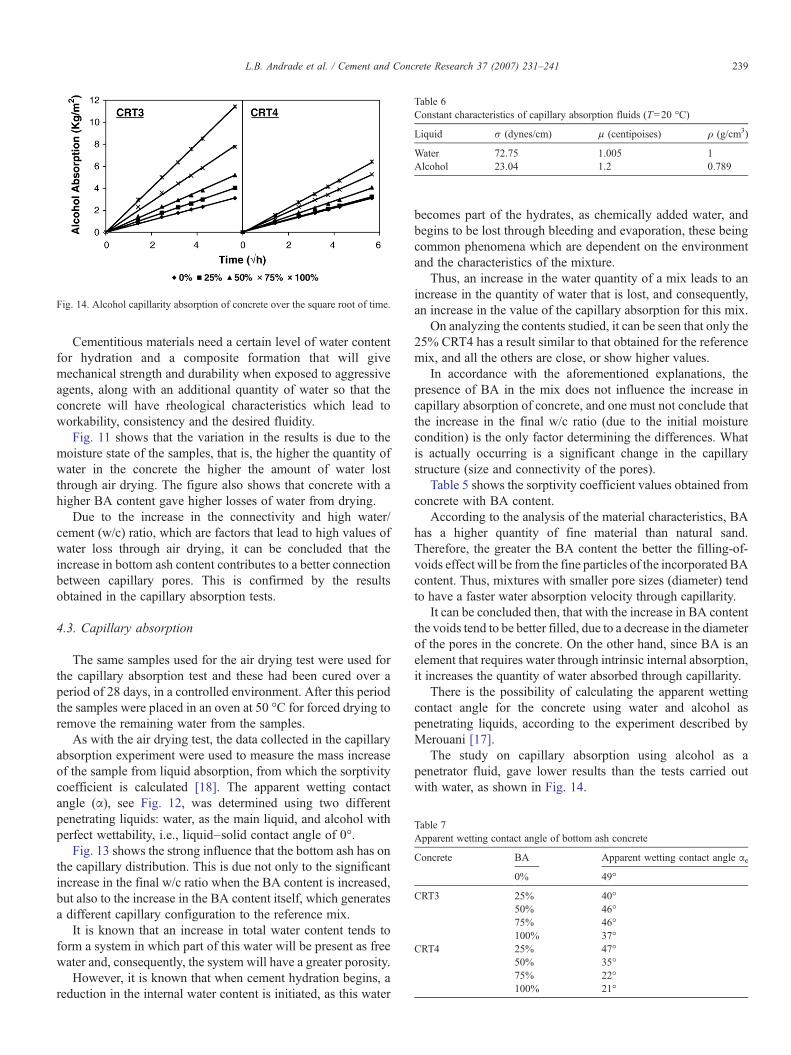
Fig. 14. Alcohol capillarity absorption of concrete over the square root of time.
Table 6Constant characteristics of capillary absorption fluids (T=20 °C)
Liquid σ (dynes/cm) μ (centipoises) ρ (g/cm3)
Water 72.75 1.005 1Alcohol 23.04 1.2 0.789
Table 7Apparent wetting contact angle of bottom ash concrete
Concrete BA Apparent wetting contact angle αe
0% 49°
CRT3 25% 40°50% 46°75% 46°100% 37°
CRT4 25% 47°50% 35°75% 22°100% 21°
239L.B. Andrade et al. / Cement and Concrete Research 37 (2007) 231–241
Cementitious materials need a certain level of water contentfor hydration and a composite formation that will givemechanical strength and durability when exposed to aggressiveagents, along with an additional quantity of water so that theconcrete will have rheological characteristics which lead toworkability, consistency and the desired fluidity.
Fig. 11 shows that the variation in the results is due to themoisture state of the samples, that is, the higher the quantity ofwater in the concrete the higher the amount of water lostthrough air drying. The figure also shows that concrete with ahigher BA content gave higher losses of water from drying.
Due to the increase in the connectivity and high water/cement (w/c) ratio, which are factors that lead to high values ofwater loss through air drying, it can be concluded that theincrease in bottom ash content contributes to a better connectionbetween capillary pores. This is confirmed by the resultsobtained in the capillary absorption tests.
4.3. Capillary absorption
The same samples used for the air drying test were used forthe capillary absorption test and these had been cured over aperiod of 28 days, in a controlled environment. After this periodthe samples were placed in an oven at 50 °C for forced drying toremove the remaining water from the samples.
As with the air drying test, the data collected in the capillaryabsorption experiment were used to measure the mass increaseof the sample from liquid absorption, from which the sorptivitycoefficient is calculated [18]. The apparent wetting contactangle (α), see Fig. 12, was determined using two differentpenetrating liquids: water, as the main liquid, and alcohol withperfect wettability, i.e., liquid–solid contact angle of 0°.
Fig. 13 shows the strong influence that the bottom ash has onthe capillary distribution. This is due not only to the significantincrease in the final w/c ratio when the BA content is increased,but also to the increase in the BA content itself, which generatesa different capillary configuration to the reference mix.
It is known that an increase in total water content tends toform a system in which part of this water will be present as freewater and, consequently, the system will have a greater porosity.
However, it is known that when cement hydration begins, areduction in the internal water content is initiated, as this water
becomes part of the hydrates, as chemically added water, andbegins to be lost through bleeding and evaporation, these beingcommon phenomena which are dependent on the environmentand the characteristics of the mixture.
Thus, an increase in the water quantity of a mix leads to anincrease in the quantity of water that is lost, and consequently,an increase in the value of the capillary absorption for this mix.
On analyzing the contents studied, it can be seen that only the25% CRT4 has a result similar to that obtained for the referencemix, and all the others are close, or show higher values.
In accordance with the aforementioned explanations, thepresence of BA in the mix does not influence the increase incapillary absorption of concrete, and one must not conclude thatthe increase in the final w/c ratio (due to the initial moisturecondition) is the only factor determining the differences. Whatis actually occurring is a significant change in the capillarystructure (size and connectivity of the pores).
Table 5 shows the sorptivity coefficient values obtained fromconcrete with BA content.
According to the analysis of the material characteristics, BAhas a higher quantity of fine material than natural sand.Therefore, the greater the BA content the better the filling-of-voids effect will be from the fine particles of the incorporated BAcontent. Thus, mixtures with smaller pore sizes (diameter) tendto have a faster water absorption velocity through capillarity.
It can be concluded then, that with the increase in BA contentthe voids tend to be better filled, due to a decrease in the diameterof the pores in the concrete. On the other hand, since BA is anelement that requires water through intrinsic internal absorption,it increases the quantity of water absorbed through capillarity.
There is the possibility of calculating the apparent wettingcontact angle for the concrete using water and alcohol aspenetrating liquids, according to the experiment described byMerouani [17].
The study on capillary absorption using alcohol as apenetrator fluid, gave lower results than the tests carried outwith water, as shown in Fig. 14.
240 L.B. Andrade et al. / Cement and Concrete Research 37 (2007) 231–241
Table 6 shows the apparent wetting contact angles obtainedfor BA concrete, using water and alcohol. Since the apparentwetting contact angle has an inversely proportional relation withthe slope of the curve for the menisci position over a certaintime period, the small apparent contact angles characterizebetter wettability. This means that mixtures with larger apparentwetting angles tend to have a more advanced capillary front;however, they have less infiltrated liquid.
For the calculation of the apparent wetting contact angle,Eqs. (2) and (3) were used. Table 7 gives the constants for thecalculations of Eqs. (2) and (3).
cosae ¼ SeSa
� �2le � rala � re
ð2Þ
Where,
αe apparent wetting contact angle (°);μe dynamic viscosity of water (centipoises);μa dynamic viscosity of alcohol (centipoises);σe superficial tension of water/air (dynes/cm);σa superficial tension of alcohol/air (dynes/cm);Se slope of the straight line of the graph which relates to
water absorption (St) versus the square root of time (cm);Sa slope of the straight line of the graph which relates to
alcohol absorption (St) versus square root of time (cm).
SðtÞ ¼ mðtÞ−ms
q1 � Að3Þ
Where,
S(t) quantity of infiltrated liquid (cm);m(t) weight of the sample at a specific moment (g);ms weight of the sample dried in an oven (g);ρl density of the liquid used (g/cm3);A cross sectional area of sample=78.540 cm2.
5. Conclusions
The following conclusions can be drawn from this research:
• The potential for capillary absorption of granular materialswas greater when bottom ash (BA) was present in thesystem. Also, the greater the BA content the higher theabsorption. However, this increase in the capillary absorp-tion of the natural sand+bottom ash blend was not a directresult of an increase in the number of small particles, but wasthe result of the porosity of the bottom ash particles whichdirectly influenced the increase in water content due to themigration of quantities of water from the BA. This can beproven by the test method used in this study.
• The absorption index "I " was 85% higher in the sample with100% of bottom ash in relation to the reference sample whichwas composed of only natural sand. The absorption velocitywas also higher in the BA/NS blends and in the sample withonly bottom ash. Due to this, the sorptivity increased when
the BA content increased, reaching a three-fold increase witha quantity of 100% BA in relation to the reference sample.When the bottom ash that was added to the blends ofgranular material contained some moisture, considered inthis paper through numerical simulation, the quantity ofabsorbed water was less. At 50% levels of humidity, thequantities absorbed in the samples with bottom ash aresimilar to those absorbed in the reference sample.
• The fact that the bottom ash absorbed part of the water that wasused in the capillary absorption study, suggests that this waterhas a great potential for being released in the same way as it isabsorbed. This can be seen in the study on water loss throughair drying or hygroscopic equilibrium. For all the cases –M1…, M9 – the samples went through the process of almosttotally drying out, leading us to believe that all the water that isabsorbed by bottom ash tends to subsequently leave it.
• The tests carried out with the presence of bottom ash (BA) asa fine porous aggregate with a high potential for waterabsorption, indicate that the parameters relating to watertransport behavior – bleeding, moisture equilibrium from airdrying, absorption from capillarity, sorptivity – are greatlyaffected in relation to those for normal concrete.
• In relation to the study on water loss from bleeding, it can beconcluded that the higher the quantity of water in BAconcrete, the higher the amount of water lost throughbleeding, since BA concrete has a lesser capacity of waterretention. The fact that the CRT4 concrete had less BA in itscomposition in relation to the total weight of the concrete didnot change this performance, even though lower values wereobtained than those for the CRT3 concrete.
• With reference to the water loss from air drying, it can beseen that the quantity of water which was present in theconcrete, was the most important factor for the increase inlost water. Comparing the CRT3 and CRT4 mix proportions,it can be noted that the concrete type 3, was the one whichlost the most moisture, because of the higher water content inrelation to CRT4.
• Capillary absorption potential of the fine aggregates of theconcrete was higher when there was bottom ash in thesystem. Also the absorption was higher, the higher the BAcontent which was incorporated. In the case of the CRT4concrete the results for the apparent wetting contact anglesshow a decreasing trend when the BA content was increased.The bottom ash has a greater quantity of fine particles inrelation to the natural sand. For this reason, the greater thebottom ash content the better will be the effect of the fillingrole by the fine particles of the bottom ash incorporated.
References
[1] N. Ghafoori, J. Bucholc, Investigation of lignite-based bottom ash forstructural concrete, J. Mater. Civ. Eng. 8 (3) (1996) 128–137.
[2] N. Ghafoori, J. Bucholc, Properties of high-calcium dry bottom ashconcrete, ACI Mater. J. 94 (2) (1997) 90–101.
[3] O.E. Manz, Worldwide production of coal ash and utilization in concreteand others products, Fuel 76 (1997) 691–696.
[4] D. Ravina, Properties of fresh concrete incorporating a high volume of flyash as partial fine sand replacement, Mater. Struct. 30 (1997) 473–479.
241L.B. Andrade et al. / Cement and Concrete Research 37 (2007) 231–241
[5] M. Cheriaf, J. Péra, J.C. Rocha, Pozzolanic properties of pulverized coalcombustion bottom ash, Cem. Concr. Res. 29 (1999) 1387–1391.
[6] L.B. Andrade, Methodology of assessment to use of bottom ash ofthermoelectric power plants as aggregate in concrete (M.Sc. Thesis),Department of Civil Engineer, Federal University of Santa Catarina, SantaCatarina, Brazil, 2004. (in Portuguese).
[7] L.B. Andrade, J.C. Rocha, M. Cheriaf, Performance of concrete mortarwith bottom ash as fine natural aggregate replacement, Proceedings ofConference on Sustainability Development and Recycling in CivilConstruction — Recycled Materials and its Applications, São Paulo:Ibracon — Technical Committee, vol. 206, 2003. (in Portuguese).
[8] L.B. Andrade, J.C. Rocha, M. Cheriaf, Study of use of coal bottom ash ofthermoelectric as fine aggregate in concrete, Proceedings of 1° Latin–American Conference of Sustainable Construction and 10° NationalMeeting of Technology of Environment Built, São Paulo: ANTAC, 2004.(in Portuguese).
[9] A.L. Kreuz, M. Cheriaf, J.C. Rocha, Properties of structural concrete withbottom ash as partial sand replacement, Proceedings of Conference onSustainability Development and Recycling in Civil Construction —Recycled Materials and its Applications, São Paulo: Ibracon — TechnicalCommittee, vol. 206, 2001, pp. 215–224. (in Portuguese).
[10] S.P. Pandey, R.L. Sharma, The influence of mineral additives on thestrength and porosity of OPC mortar, Cem. Concr. Res. 30 (2000) 19–23.
[11] Z. Chengzi, W. Aiqin, T. Mingshu, L. Xiaoyu, The filling role ofpozzolanic material, Cem. Concr. Res. 26 (1996) 943–947.
[12] G.C. Isaia, A. Gastaldini, R. Moraes, Physical and pozzolanic action ofmineral additions on the mechanical strength of high-performanceconcrete, Cem. Concr. Compos. 25 (2003) 69–76.
[13] I. Odler, M. Robler, Investigations on the relationship between porosity,structure and strength of hydrated Portland cement pastes. ii — effect ofpore structure and of degree of hydration, Cem. Concr. Res. 15 (1985)401–410.
[14] N. Barbare, A. Shukla, A. Bose, Uptake and loss of water in cenosphere–concrete composite material, Cem. Concr. Res. 33 (2003) 1681–1686.
[15] P.J. Wainwright, H. Ait-Aider, The influence of cement source and slagadditions on the bleeding of concrete, Cem. Concr. Res. 25 (1995)1445–1456.
[16] L. Hanzic, R. Ilic, Relationship between liquid sorptivity and capillarity inconcrete, Cem. Concr. Res. 33 (2003) 1385–1388.
[17] L. Merouani, Phénomènes de sorption et de transfert d'humidité dans desmatériaux du bâtiment. Étude expérimentale comparative d'un mortier deciment et d'un enduit de façade. Thèse Docteur 3o Cycle. Institut NationalPolytechnique de Grenoble, 1987 (in French).
[18] C. Hall, Water sorptivity of mortars an concretes: a review, Mag. Concr.Res. 41 (1989) 51–61.


![Kinetics of Water Vapor Sorption in Wood Cell Walls: State ...processes [7]. “Sorption kinetics” describes the change in moisture content over time in the approach to equilibrium](https://img.pdfslide.net/doc/110x75/5ffe6ebc6e35a468752fa9e7/kinetics-of-water-vapor-sorption-in-wood-cell-walls-state-processes-7-aoesorption.jpg)