Embed Size (px)
Citation preview
ASSESSING IMPERVIOUS SURFACE CONNECTIVITY ANDAPPLICATIONS FOR WATERSHED MANAGEMENT1
Allison H. Roy and William D. Shuster2
ABSTRACT: Although total impervious area (TIA) is often used as an indicator of urban disturbance, recentstudies suggest that the subset of impervious surfaces that route stormwater runoff directly to streams viastormwater pipes, called directly connected impervious area (DCIA), may be a better predictor of stream ecosys-tem alteration. We evaluated the differences between TIA and DCIA in the Shepherd Creek catchment, a small(1.85-km2), suburban basin in Cincinnati, Ohio. Imperviousness determinations were calculated based on pub-licly available geographic information system (GIS) data and parcel-scale field assessments, and these directassessments were compared to DCIA calculated from published, empirical relationships. Impervious and semi-impervious area comprised 13.1% of the catchment area, with 56.3% of the impervious area connected. Whensummarized by subcatchments (0.26-1.85 km2), TIA measured in the field (11-23%) was considerably higherthan that calculated from the National Land Cover Data Imperviousness Layer (7-18%). In contrast, TIA calcu-lated based on aerial photos was similar to TIA calculated from field assessments, thus indicating that photointerpretation may be adequate for catchment-scale (>25 ha) TIA determinations. While these GIS data sourcescan be used to calculate TIA, on-site assessments were necessary to accurately determine DCIA within residen-tial parcels. There was a wide variation in percent connectivity across parcels, and, subsequently, DCIA was notaccurately predicted from empirical relationships with TIA. We discuss applications of DCIA data that highlightthe importance of parcel-scale field assessments for managing suburban watersheds.
(KEY TERMS: impervious surfaces; directly connected impervious area; disconnected impervious area; effectiveimpervious area; stormwater management; watershed management; rivers ⁄ streams; urban areas.)
Roy, Allison H. and William D. Shuster, 2009. Assessing Impervious Surface Connectivity and Applications forWatershed Management. Journal of the American Water Resources Association (JAWRA) 45(1):198-209. DOI:10.1111 ⁄ j.1752-1688.2008.00271.x
INTRODUCTION
Urban and suburban landscapes are characterizedby relatively high amounts of total impervious area(TIA), resulting in lower potential for infiltration,higher surface runoff, and reduced ground-water
recharge compared to forested areas (Arnold and Gib-bons, 1996; Konrad and Booth, 2005). Increased TIAin the landscape translates to altered storm-flow andbase-flow hydrology in streams. For example, studieshave demonstrated a reduced lag time among the ini-tiation of precipitation and peak storm flow,increased peak discharge, and increased rise and fall
1Paper No. JAWRA-07-0165-P of the Journal of the American Water Resources Association (JAWRA). Received December 4, 2007; acceptedJuly 1, 2008. ª 2008 American Water Resources Association. No claim to original U.S. government works. Discussions are open untilAugust 1, 2009.
2Respectively, Ecologist and Hydrologist, National Risk Management Research Laboratory, Office of Research and Development, U.S.Environmental Protection Agency, 26 West Martin Luther King Drive, Cincinnati, Ohio 45268 (E-Mail ⁄ Roy: [email protected]).
JAWRA 198 JOURNAL OF THE AMERICAN WATER RESOURCES ASSOCIATION
JOURNAL OF THE AMERICAN WATER RESOURCES ASSOCIATION
Vol. 45, No. 1 AMERICAN WATER RESOURCES ASSOCIATION February 2009
rates or ‘‘flashiness’’ (Arnold and Gibbons, 1996; Pauland Meyer, 2001; Konrad and Booth, 2005). Base-flowresponses to urbanization are more variable, as TIAcan lead to reduced base flows from higher surfacedrainage and lower water tables, or increased baseflows from imported water for landscape irrigationand septic tanks (Brandes et al., 2005; Konrad andBooth, 2005). Due to changes in the quantity andquality of flows, catchments with high levels of TIAalso exhibit geomorphic (Booth and Jackson, 1997;Bledsoe and Watson, 2001) and biotic alteration com-pared to vegetated watersheds where infiltration pro-cesses predominate (see reviews Schueler, 1994; Pauland Meyer, 2001; Walsh et al., 2005b).
Although TIA has been used as an indicator ofurban disturbance, recent studies suggest that thesubset of impervious surfaces that route stormwaterrunoff directly to streams via stormwater pipes,called directly connected impervious area (DCIA) oreffective impervious area (hereafter, DCIA), may beresponsible for the majority of stream alteration dueto urbanization (Booth and Jackson, 1997; Brabecet al., 2002; Walsh, 2004; Walsh et al., 2005a). Forexample, studies have found DCIA to be highly corre-lated with aspects of water quality, and algal, macro-invertebrate and fish assemblage integrity (Wanget al., 2001; Hatt et al., 2004; Taylor et al., 2004;Walsh et al., 2004; Newall and Walsh, 2005).
While DCIA may be a better predictor of streamecosystem health than TIA in urbanizing areas, itsdetermination presents several challenges. Somestudies have predicted DCIA based on an empiricalrelationship with TIA (Alley and Veenhuis, 1983;Wang et al., 2001; Wenger et al., 2008), although theaccuracy of such relationships has not been tested ina widespread manner (Brabec et al., 2002). Whiledelineation of DCIA is necessary to verify empiricalrelationships, very few studies have calculated DCIAindependently of TIA (but see Rouge Program Office,1994; Lee and Heaney, 2003). Independent calcula-tion of DCIA involves overlaying stormwater convey-ances on maps of impervious area to determine whichimpervious areas are connected to storm, sanitary, orcombined sewer pipes (Krug and Goddard, 1986;Rouge Program Office, 1994; Walsh et al., 2002).Although the increasing prevalence of digital map-ping and more complete geographic information sys-tem (GIS) coverage at local and county levels makesthis type of data more available than in the past(Brabec et al., 2002), available maps and GIS datatypically do not include information about actual run-off routing from impervious surfaces based on specificon-lot drainage patterns (e.g., discharge from roofdownspouts, driveway slopes, etc.) (Lee and Heaney,2003). Therefore, an accurate assessment of DCIAcalls for field investigations to identify and verify
where pipes are draining (Walsh et al., 2002).Although the level of effort for on-site assessmentscan be quite high (Lee and Heaney, 2003), field cam-paigns to determine DCIA may be necessary so as tounderstand its extent and design optimal approachesto stormwater management.
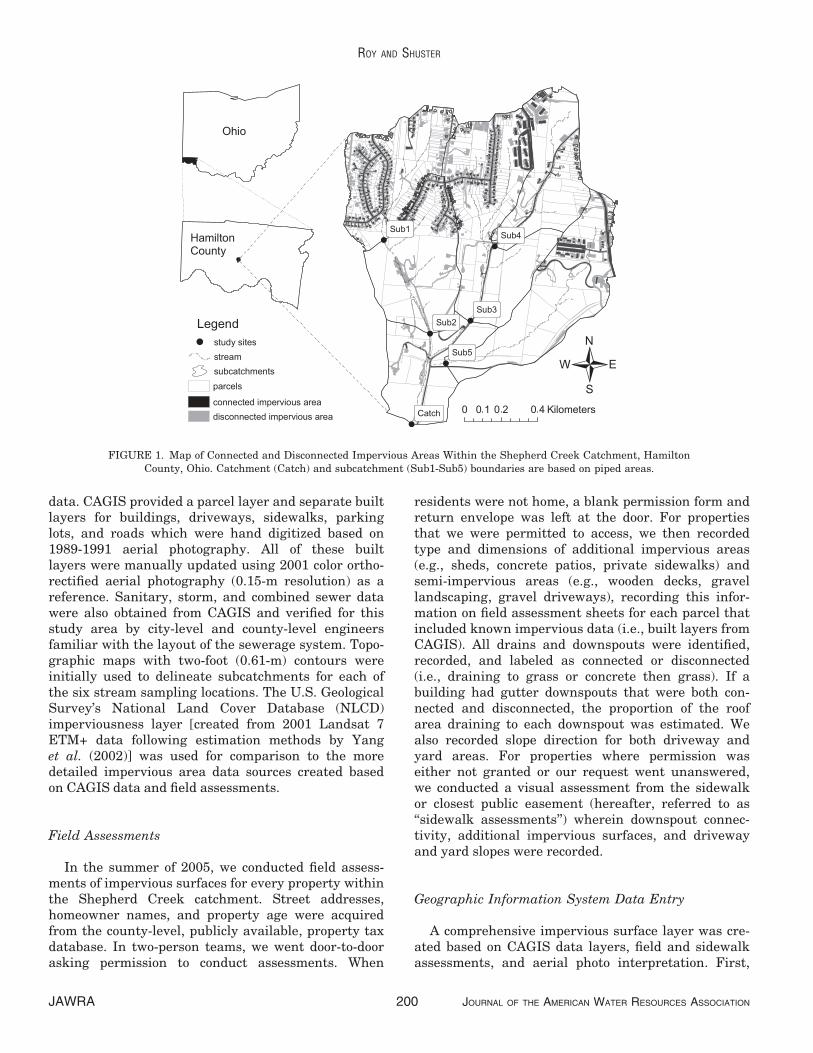
The setting for this study was the Shepherd Creekcatchment, a 1.85-km2 (457-acre) basin in Cincinnati(Hamilton County), Ohio (Figure 1). The eastern one-third of the catchment lies within a city park withmature deciduous forest. The central and westerntwo-thirds of the catchment represent a mix of resi-dential parcels in the headwaters and horse pasturesat downstream locations. The residential areaconsists primarily of single family homes and has amedian lot size of 880 m2 (0.22 acres). Over three-quarters of the 406 houses in the catchment werebuilt between 1950 and 1990. There are also threeapartment complexes (27 buildings) in the headwa-ters and several public buildings with parking lots(e.g., church, police station, park arboretum). TheShepherd Creek catchment is the focus of a multidis-ciplinary project investigating the use of economicincentives to install retrofit stormwater best manage-ment practices (BMPs) so as to mitigate the effects ofexcess stormwater runoff on stream hydrology, waterquality, and biotic integrity (Roy et al., 2006).
In this study we assess the importance of field-baseddelineation of impervious surfaces, as applied to theShepherd Creek catchment. TIA and DCIA were delin-eated using a combination of GIS data compilation,aerial photo interpretation, and field assessments, andsubsequently summarized within parcels (<10 ha) andsubcatchments (0.26-1.85 km2). The objectives of thisstudy were: (1) to evaluate the primary sources ofimperviousness and differences between TIA andDCIA data based on land ownership (public vs. pri-vate) and impervious surface type, and (2) to compareour results among data collected with various levels ofeffort (GIS only, field assessments, and publishedempirical formulas). We use these results to determinethe best approach and potential for retrofit stormwatermanagement within the catchment, and to discuss theapplications of impervious area connectivity data forunderstanding and restoring stream ecosystems.
METHODS
Initial Geographic Information System DataCompilation
GIS data were acquired through the CincinnatiArea GIS (CAGIS), a city-level repository of geographic
ASSESSING IMPERVIOUS SURFACE CONNECTIVITY AND APPLICATIONS FOR WATERSHED MANAGEMENT
JOURNAL OF THE AMERICAN WATER RESOURCES ASSOCIATION 199 JAWRA
data. CAGIS provided a parcel layer and separate builtlayers for buildings, driveways, sidewalks, parkinglots, and roads which were hand digitized based on1989-1991 aerial photography. All of these builtlayers were manually updated using 2001 color ortho-rectified aerial photography (0.15-m resolution) as areference. Sanitary, storm, and combined sewer datawere also obtained from CAGIS and verified for thisstudy area by city-level and county-level engineersfamiliar with the layout of the sewerage system. Topo-graphic maps with two-foot (0.61-m) contours wereinitially used to delineate subcatchments for each ofthe six stream sampling locations. The U.S. GeologicalSurvey’s National Land Cover Database (NLCD)imperviousness layer [created from 2001 Landsat 7ETM+ data following estimation methods by Yanget al. (2002)] was used for comparison to the moredetailed impervious area data sources created basedon CAGIS data and field assessments.
Field Assessments
In the summer of 2005, we conducted field assess-ments of impervious surfaces for every property withinthe Shepherd Creek catchment. Street addresses,homeowner names, and property age were acquiredfrom the county-level, publicly available, property taxdatabase. In two-person teams, we went door-to-doorasking permission to conduct assessments. When
residents were not home, a blank permission form andreturn envelope was left at the door. For propertiesthat we were permitted to access, we then recordedtype and dimensions of additional impervious areas(e.g., sheds, concrete patios, private sidewalks) andsemi-impervious areas (e.g., wooden decks, gravellandscaping, gravel driveways), recording this infor-mation on field assessment sheets for each parcel thatincluded known impervious data (i.e., built layers fromCAGIS). All drains and downspouts were identified,recorded, and labeled as connected or disconnected(i.e., draining to grass or concrete then grass). If abuilding had gutter downspouts that were both con-nected and disconnected, the proportion of the roofarea draining to each downspout was estimated. Wealso recorded slope direction for both driveway andyard areas. For properties where permission waseither not granted or our request went unanswered,we conducted a visual assessment from the sidewalkor closest public easement (hereafter, referred to as‘‘sidewalk assessments’’) wherein downspout connec-tivity, additional impervious surfaces, and drivewayand yard slopes were recorded.
Geographic Information System Data Entry
A comprehensive impervious surface layer was cre-ated based on CAGIS data layers, field and sidewalkassessments, and aerial photo interpretation. First,
FIGURE 1. Map of Connected and Disconnected Impervious Areas Within the Shepherd Creek Catchment, HamiltonCounty, Ohio. Catchment (Catch) and subcatchment (Sub1-Sub5) boundaries are based on piped areas.
ROY AND SHUSTER
JAWRA 200 JOURNAL OF THE AMERICAN WATER RESOURCES ASSOCIATION
CAGIS impervious surface layers (building, driveway,sidewalk, street, and parking) were merged into asingle layer. The resulting composite layer was subse-quently updated using field assessments, and someimpervious surface locations were verified with 2001aerial photography. For properties that had only side-walk surveys, aerial photos were primarily used toupdate this new surface layer. All impervious surfacefeatures were attributed (i.e., assigned information)by surface type (e.g., pool, shed, sidewalk, etc.) andsurface category (impervious or semi-impervious).Concrete patios, sheds, sidewalks, and pools were allattributed as impervious. As gravel driveways, land-scaping pavers, and wooden decks all had somecapacity for the abstraction of rainfall, these wereattributed as semi-impervious.
Downspout and drain locations were digitized intoseparate GIS point shapefiles, and attributed accord-ing to downspout category (piped to sewer, piped tostream channel, or piped to landscape) and drainagestatus (connected or disconnected). Impervious areasthat sloped toward drains that were assumed to beconnected to the sewer system were always consid-ered connected. Impervious areas that sloped towardyards or were piped to the landscape (based on visualinspection or as informed by a homeowner) were con-sidered disconnected. Surface layer polygons weresubdivided, as necessary, to reflect multiple levels ofconnectivity (e.g., part of roof draining to connecteddownspouts and part draining to disconnected down-spouts). Where connectivity could not be determined(e.g., for some surfaces assessed from sidewalks), weestimated this attribute based on the characteristicsof neighboring houses that were of similar age, occu-pied comparable topography, and were along streetswith the same sewerage infrastructure.
After surface connectivity was defined, we manu-ally adjusted topographic subcatchment boundaries to‘‘piped’’ subcatchment boundaries to account for thedirection of water flow based on stormwater convey-ances. For example, impervious areas that were con-nected to sewers that flowed outside of the ShepherdCreek catchment were eliminated from the pipedcatchment. Similarly, impervious surfaces in Sub1that were connected to sewers which drained intoSub2 were subsequently included in the Sub2 pipedsubcatchment.
Data Summarization and Analysis
The GIS impervious data were summarized at twoscales: (1) the Shepherd Creek catchment (‘‘Catch’’)and its five subcatchments (‘‘Sub1’’ to ‘‘Sub5’’; Fig-ure 1) and (2) individual parcels. In ArcGIS� (ESRI,Redlands, California), we combined the surface,
subcatchment, and parcel layers into a new outputlayer. We then determined the area and percent ofpervious area, TIA, and DCIA, and proportion of TIAthat is DCIA within subcatchments and for varioussurface types with standard ArcGIS� summarizationtools. Mean and median pervious area, TIA, DCIA,and percent connectivity for individual parcels werecalculated in MS Access (Microsoft Office Access,version 2003). We used a t-test (assuming unequalvariances) to compare mean percent connectivityfrom older residences (1860-1959) to houses builtmore recently (1960-1999; JMP 5.1, SAS Institute,Inc., Cary, North Carolina).
We compared TIA and DCIA generated from dataderived with various levels of effort. SubcatchmentTIA was calculated using three data sources: (1)NLCD imperviousness layer, (2) CAGIS built layersderived from aerial photography, and (3) field assess-ments and subsequent data interpretation. DCIA wasonly available from field assessment data, but wascalculated for both the topographic catchment andpiped catchment to explicitly assess the effects ofstormwater flow routing along catchment boundarieson catchment-scale DCIA.
Lastly, we determined the relationship between %TIA and % DCIA within parcels using linear regres-sion analysis (JMP 5.1; SAS Institute). The linearregression model from this analysis was compared toother published models that predict DCIA based onTIA. We first derived % DCIA from an empirical for-mula developed by Alley and Veenhuis (1983) basedon 14 urban catchments in Denver, Colorado
DCIA ¼ 0:15� TIA1:41 ð1Þ
where TIA and DCIA units are percent of totalarea (r2 = 0.98). Percent DCIA was also calculatedfrom a formula developed by Wenger et al. (2008)for the Etowah River basin north of Atlanta, Geor-gia. For their study, TIA data were generated fromthe NLCD imperviousness layer and DCIA datawere determined based on interpretation of high-resolution aerial photographs for 15 sites thatranged in size from 25 to 70 ha. The best fitmodel was
DCIA ¼ ð1:046� TIA)� 6:23% ð2Þ
where DCIA is 0 for areas where TIA values are lessthan 6.23% (r2 = 0.98). We applied the three models(one generated from our data and the two publishedformulas) to generate % DCIA predicted for each par-cel in this study. Predicted % DCIA was comparedwith % DCIA observed in field assessments (n = 524parcels with impervious surfaces), and coefficients of
ASSESSING IMPERVIOUS SURFACE CONNECTIVITY AND APPLICATIONS FOR WATERSHED MANAGEMENT
JOURNAL OF THE AMERICAN WATER RESOURCES ASSOCIATION 201 JAWRA
determination (r2) for best fit linear models were usedto determine the amount of variance explained byeach of the three models.
RESULTS
Comparisons Between Total and Directly ConnectedImpervious Area
TIA for the Shepherd Creek piped catchment was22.1 ha, and semi-impervious area was 1.8 ha,together comprising 13.1% of the catchment area(Table 1). Subcatchments (Sub1-Sub5) exhibited dif-ferences in the amount of pervious (80.1-88.8%),impervious (10.8-18.1%), and semi-impervious (0.4-1.9%) area. The catchment boundary adjustments forpiped sewers resulted in a slightly smaller catchmentsize compared to the topographic catchment boundary(182.7 ha vs. 184.5 ha). This was due to subtractionof impervious areas on the catchment perimeter thatwere connected to sewers draining outside of thecatchment (Figure 1). The subcatchment boundarieswithin the catchment were largely unaltered by thepiping, with the exception of several houses along theboundary between Sub1 and Sub2, which drainedinto Sub1 with the topographic boundaries and Sub2with the piped boundaries. Slightly more than half ofthe impervious area in Shepherd Creek catchment
was connected (56.3%) (Table 2). Percent subcatch-ment DCIA ranged from 5.4 (Sub4) to 11.6 (Sub1).
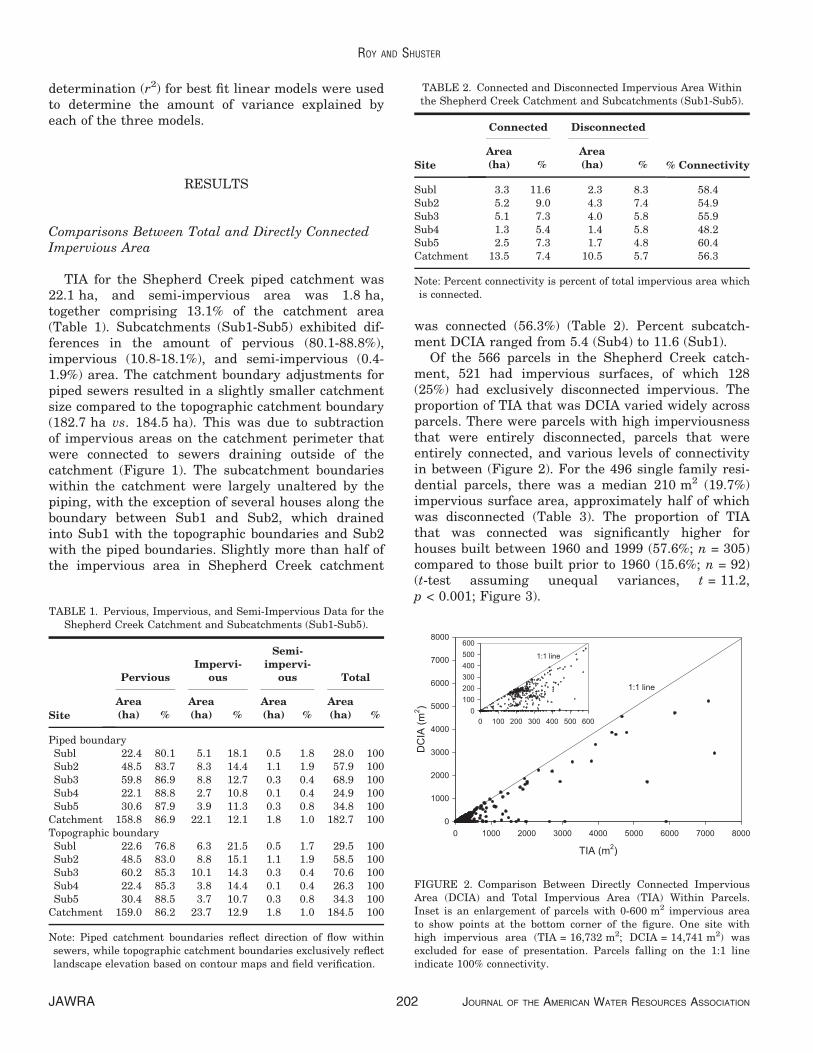
Of the 566 parcels in the Shepherd Creek catch-ment, 521 had impervious surfaces, of which 128(25%) had exclusively disconnected impervious. Theproportion of TIA that was DCIA varied widely acrossparcels. There were parcels with high imperviousnessthat were entirely disconnected, parcels that wereentirely connected, and various levels of connectivityin between (Figure 2). For the 496 single family resi-dential parcels, there was a median 210 m2 (19.7%)impervious surface area, approximately half of whichwas disconnected (Table 3). The proportion of TIAthat was connected was significantly higher forhouses built between 1960 and 1999 (57.6%; n = 305)compared to those built prior to 1960 (15.6%; n = 92)(t-test assuming unequal variances, t = 11.2,p < 0.001; Figure 3).
TABLE 1. Pervious, Impervious, and Semi-Impervious Data for theShepherd Creek Catchment and Subcatchments (Sub1-Sub5).
Site
PerviousImpervi-
ous
Semi-impervi-
ous Total
Area(ha) %
Area(ha) %
Area(ha) %
Area(ha) %
Piped boundarySubl 22.4 80.1 5.1 18.1 0.5 1.8 28.0 100Sub2 48.5 83.7 8.3 14.4 1.1 1.9 57.9 100Sub3 59.8 86.9 8.8 12.7 0.3 0.4 68.9 100Sub4 22.1 88.8 2.7 10.8 0.1 0.4 24.9 100Sub5 30.6 87.9 3.9 11.3 0.3 0.8 34.8 100
Catchment 158.8 86.9 22.1 12.1 1.8 1.0 182.7 100Topographic boundarySubl 22.6 76.8 6.3 21.5 0.5 1.7 29.5 100Sub2 48.5 83.0 8.8 15.1 1.1 1.9 58.5 100Sub3 60.2 85.3 10.1 14.3 0.3 0.4 70.6 100Sub4 22.4 85.3 3.8 14.4 0.1 0.4 26.3 100Sub5 30.4 88.5 3.7 10.7 0.3 0.8 34.3 100
Catchment 159.0 86.2 23.7 12.9 1.8 1.0 184.5 100
Note: Piped catchment boundaries reflect direction of flow withinsewers, while topographic catchment boundaries exclusively reflectlandscape elevation based on contour maps and field verification.
TABLE 2. Connected and Disconnected Impervious Area Withinthe Shepherd Creek Catchment and Subcatchments (Sub1-Sub5).
Site
Connected Disconnected
% Connectivity
Area(ha) %
Area(ha) %
Subl 3.3 11.6 2.3 8.3 58.4Sub2 5.2 9.0 4.3 7.4 54.9Sub3 5.1 7.3 4.0 5.8 55.9Sub4 1.3 5.4 1.4 5.8 48.2Sub5 2.5 7.3 1.7 4.8 60.4Catchment 13.5 7.4 10.5 5.7 56.3
Note: Percent connectivity is percent of total impervious area whichis connected.
FIGURE 2. Comparison Between Directly Connected ImperviousArea (DCIA) and Total Impervious Area (TIA) Within Parcels.Inset is an enlargement of parcels with 0-600 m2 impervious areato show points at the bottom corner of the figure. One site withhigh impervious area (TIA = 16,732 m2; DCIA = 14,741 m2) wasexcluded for ease of presentation. Parcels falling on the 1:1 lineindicate 100% connectivity.
ROY AND SHUSTER
JAWRA 202 JOURNAL OF THE AMERICAN WATER RESOURCES ASSOCIATION
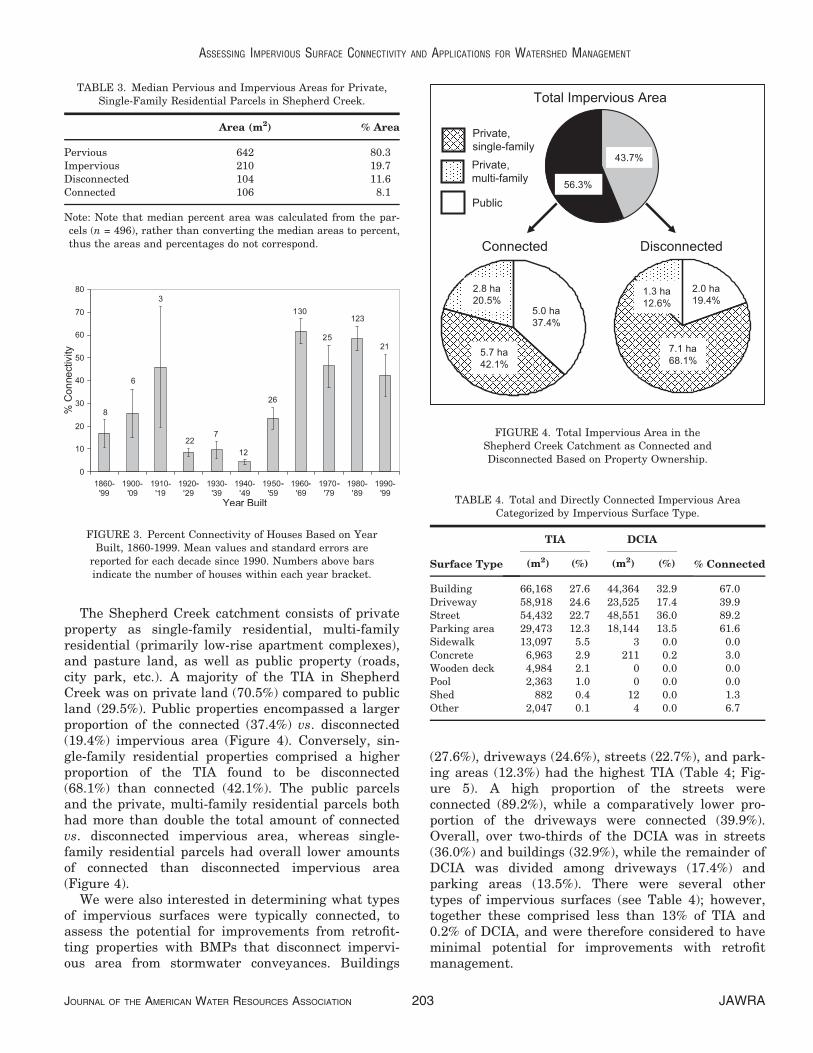
The Shepherd Creek catchment consists of privateproperty as single-family residential, multi-familyresidential (primarily low-rise apartment complexes),and pasture land, as well as public property (roads,city park, etc.). A majority of the TIA in ShepherdCreek was on private land (70.5%) compared to publicland (29.5%). Public properties encompassed a largerproportion of the connected (37.4%) vs. disconnected(19.4%) impervious area (Figure 4). Conversely, sin-gle-family residential properties comprised a higherproportion of the TIA found to be disconnected(68.1%) than connected (42.1%). The public parcelsand the private, multi-family residential parcels bothhad more than double the total amount of connectedvs. disconnected impervious area, whereas single-family residential parcels had overall lower amountsof connected than disconnected impervious area(Figure 4).
We were also interested in determining what typesof impervious surfaces were typically connected, toassess the potential for improvements from retrofit-ting properties with BMPs that disconnect impervi-ous area from stormwater conveyances. Buildings
(27.6%), driveways (24.6%), streets (22.7%), and park-ing areas (12.3%) had the highest TIA (Table 4; Fig-ure 5). A high proportion of the streets wereconnected (89.2%), while a comparatively lower pro-portion of the driveways were connected (39.9%).Overall, over two-thirds of the DCIA was in streets(36.0%) and buildings (32.9%), while the remainder ofDCIA was divided among driveways (17.4%) andparking areas (13.5%). There were several othertypes of impervious surfaces (see Table 4); however,together these comprised less than 13% of TIA and0.2% of DCIA, and were therefore considered to haveminimal potential for improvements with retrofitmanagement.
TABLE 3. Median Pervious and Impervious Areas for Private,Single-Family Residential Parcels in Shepherd Creek.
Area (m2) % Area
Pervious 642 80.3Impervious 210 19.7Disconnected 104 11.6Connected 106 8.1
Note: Note that median percent area was calculated from the par-cels (n = 496), rather than converting the median areas to percent,thus the areas and percentages do not correspond.
FIGURE 3. Percent Connectivity of Houses Based on YearBuilt, 1860-1999. Mean values and standard errors are
reported for each decade since 1990. Numbers above barsindicate the number of houses within each year bracket.
FIGURE 4. Total Impervious Area in theShepherd Creek Catchment as Connected andDisconnected Based on Property Ownership.
TABLE 4. Total and Directly Connected Impervious AreaCategorized by Impervious Surface Type.
Surface Type
TIA DCIA
% Connected(m2) (%) (m2) (%)
Building 66,168 27.6 44,364 32.9 67.0Driveway 58,918 24.6 23,525 17.4 39.9Street 54,432 22.7 48,551 36.0 89.2Parking area 29,473 12.3 18,144 13.5 61.6Sidewalk 13,097 5.5 3 0.0 0.0Concrete 6,963 2.9 211 0.2 3.0Wooden deck 4,984 2.1 0 0.0 0.0Pool 2,363 1.0 0 0.0 0.0Shed 882 0.4 12 0.0 1.3Other 2,047 0.1 4 0.0 6.7
ASSESSING IMPERVIOUS SURFACE CONNECTIVITY AND APPLICATIONS FOR WATERSHED MANAGEMENT
JOURNAL OF THE AMERICAN WATER RESOURCES ASSOCIATION 203 JAWRA
Level of Effort
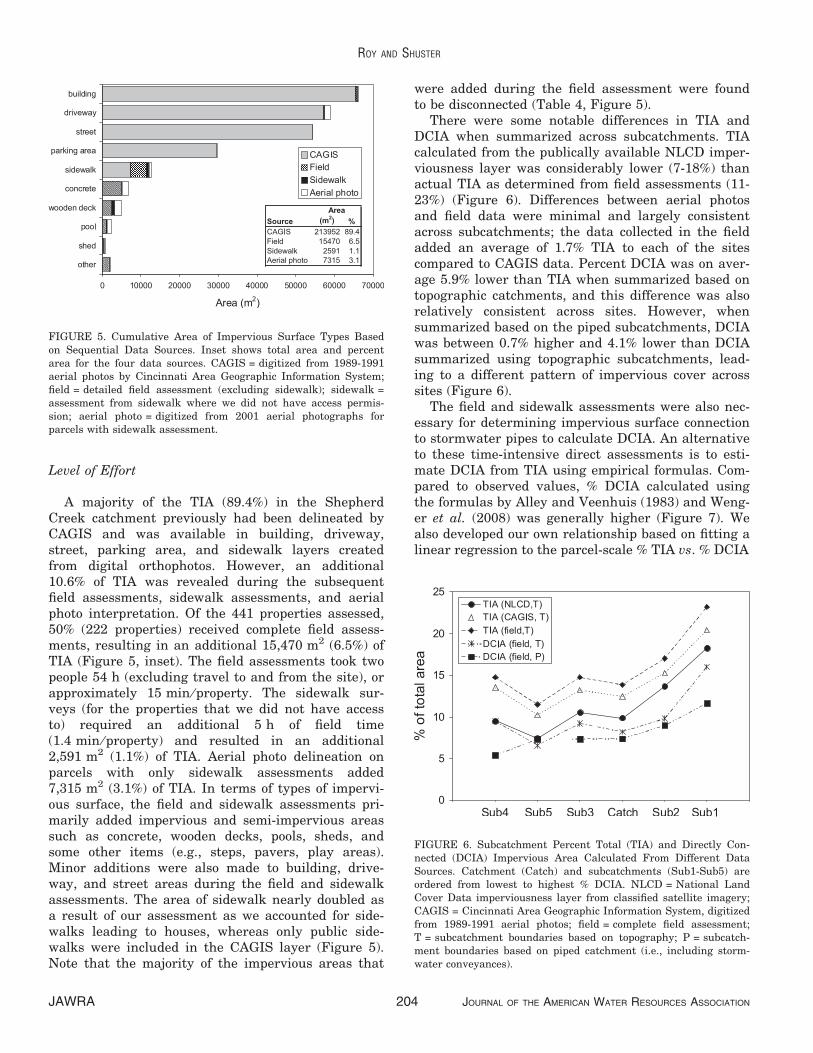
A majority of the TIA (89.4%) in the ShepherdCreek catchment previously had been delineated byCAGIS and was available in building, driveway,street, parking area, and sidewalk layers createdfrom digital orthophotos. However, an additional10.6% of TIA was revealed during the subsequentfield assessments, sidewalk assessments, and aerialphoto interpretation. Of the 441 properties assessed,50% (222 properties) received complete field assess-ments, resulting in an additional 15,470 m2 (6.5%) ofTIA (Figure 5, inset). The field assessments took twopeople 54 h (excluding travel to and from the site), orapproximately 15 min ⁄ property. The sidewalk sur-veys (for the properties that we did not have accessto) required an additional 5 h of field time(1.4 min ⁄ property) and resulted in an additional2,591 m2 (1.1%) of TIA. Aerial photo delineation onparcels with only sidewalk assessments added7,315 m2 (3.1%) of TIA. In terms of types of impervi-ous surface, the field and sidewalk assessments pri-marily added impervious and semi-impervious areassuch as concrete, wooden decks, pools, sheds, andsome other items (e.g., steps, pavers, play areas).Minor additions were also made to building, drive-way, and street areas during the field and sidewalkassessments. The area of sidewalk nearly doubled asa result of our assessment as we accounted for side-walks leading to houses, whereas only public side-walks were included in the CAGIS layer (Figure 5).Note that the majority of the impervious areas that
were added during the field assessment were foundto be disconnected (Table 4, Figure 5).
There were some notable differences in TIA andDCIA when summarized across subcatchments. TIAcalculated from the publically available NLCD imper-viousness layer was considerably lower (7-18%) thanactual TIA as determined from field assessments (11-23%) (Figure 6). Differences between aerial photosand field data were minimal and largely consistentacross subcatchments; the data collected in the fieldadded an average of 1.7% TIA to each of the sitescompared to CAGIS data. Percent DCIA was on aver-age 5.9% lower than TIA when summarized based ontopographic catchments, and this difference was alsorelatively consistent across sites. However, whensummarized based on the piped subcatchments, DCIAwas between 0.7% higher and 4.1% lower than DCIAsummarized using topographic subcatchments, lead-ing to a different pattern of impervious cover acrosssites (Figure 6).
The field and sidewalk assessments were also nec-essary for determining impervious surface connectionto stormwater pipes to calculate DCIA. An alternativeto these time-intensive direct assessments is to esti-mate DCIA from TIA using empirical formulas. Com-pared to observed values, % DCIA calculated usingthe formulas by Alley and Veenhuis (1983) and Weng-er et al. (2008) was generally higher (Figure 7). Wealso developed our own relationship based on fitting alinear regression to the parcel-scale % TIA vs. % DCIA
FIGURE 5. Cumulative Area of Impervious Surface Types Basedon Sequential Data Sources. Inset shows total area and percentarea for the four data sources. CAGIS = digitized from 1989-1991aerial photos by Cincinnati Area Geographic Information System;field = detailed field assessment (excluding sidewalk); sidewalk =assessment from sidewalk where we did not have access permis-sion; aerial photo = digitized from 2001 aerial photographs forparcels with sidewalk assessment.
FIGURE 6. Subcatchment Percent Total (TIA) and Directly Con-nected (DCIA) Impervious Area Calculated From Different DataSources. Catchment (Catch) and subcatchments (Sub1-Sub5) areordered from lowest to highest % DCIA. NLCD = National LandCover Data imperviousness layer from classified satellite imagery;CAGIS = Cincinnati Area Geographic Information System, digitizedfrom 1989-1991 aerial photos; field = complete field assessment;T = subcatchment boundaries based on topography; P = subcatch-ment boundaries based on piped catchment (i.e., including storm-water conveyances).
ROY AND SHUSTER
JAWRA 204 JOURNAL OF THE AMERICAN WATER RESOURCES ASSOCIATION
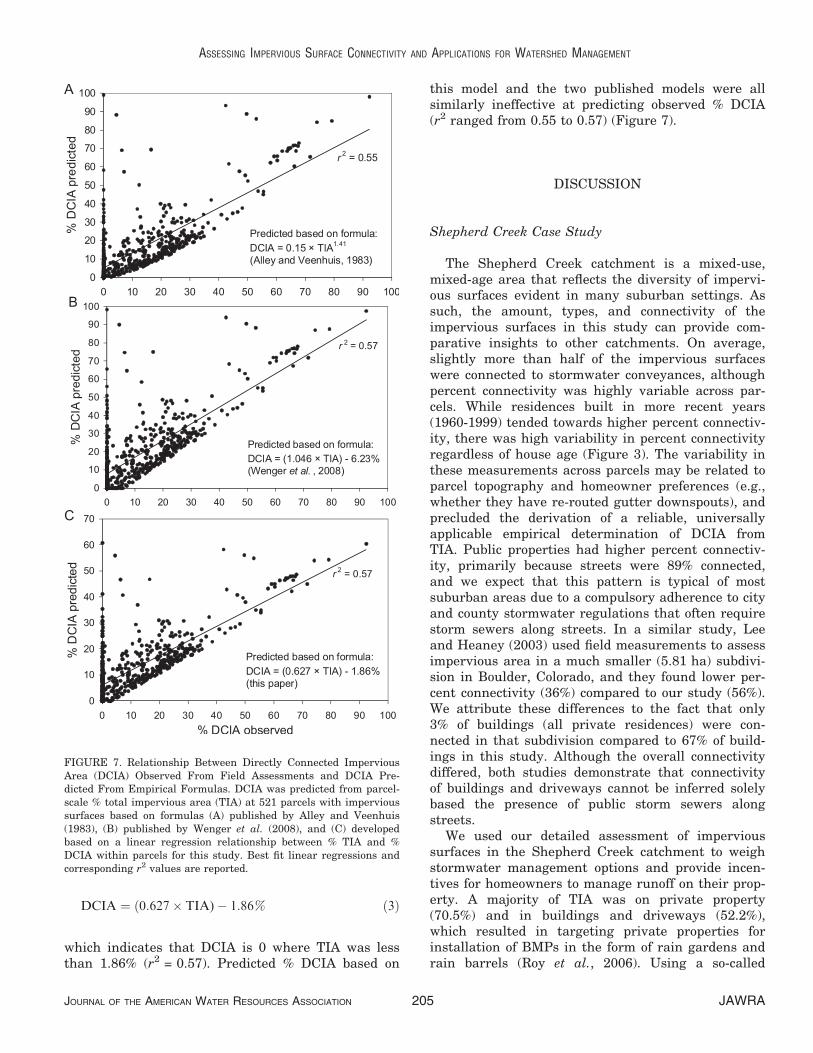
DCIA ¼ ð0:627� TIA)� 1:86% ð3Þ
which indicates that DCIA is 0 where TIA was lessthan 1.86% (r2 = 0.57). Predicted % DCIA based on
this model and the two published models were allsimilarly ineffective at predicting observed % DCIA(r2 ranged from 0.55 to 0.57) (Figure 7).
DISCUSSION
Shepherd Creek Case Study
The Shepherd Creek catchment is a mixed-use,mixed-age area that reflects the diversity of impervi-ous surfaces evident in many suburban settings. Assuch, the amount, types, and connectivity of theimpervious surfaces in this study can provide com-parative insights to other catchments. On average,slightly more than half of the impervious surfaceswere connected to stormwater conveyances, althoughpercent connectivity was highly variable across par-cels. While residences built in more recent years(1960-1999) tended towards higher percent connectiv-ity, there was high variability in percent connectivityregardless of house age (Figure 3). The variability inthese measurements across parcels may be related toparcel topography and homeowner preferences (e.g.,whether they have re-routed gutter downspouts), andprecluded the derivation of a reliable, universallyapplicable empirical determination of DCIA fromTIA. Public properties had higher percent connectiv-ity, primarily because streets were 89% connected,and we expect that this pattern is typical of mostsuburban areas due to a compulsory adherence to cityand county stormwater regulations that often requirestorm sewers along streets. In a similar study, Leeand Heaney (2003) used field measurements to assessimpervious area in a much smaller (5.81 ha) subdivi-sion in Boulder, Colorado, and they found lower per-cent connectivity (36%) compared to our study (56%).We attribute these differences to the fact that only3% of buildings (all private residences) were con-nected in that subdivision compared to 67% of build-ings in this study. Although the overall connectivitydiffered, both studies demonstrate that connectivityof buildings and driveways cannot be inferred solelybased the presence of public storm sewers alongstreets.
We used our detailed assessment of impervioussurfaces in the Shepherd Creek catchment to weighstormwater management options and provide incen-tives for homeowners to manage runoff on their prop-erty. A majority of TIA was on private property(70.5%) and in buildings and driveways (52.2%),which resulted in targeting private properties forinstallation of BMPs in the form of rain gardens andrain barrels (Roy et al., 2006). Using a so-called
FIGURE 7. Relationship Between Directly Connected ImperviousArea (DCIA) Observed From Field Assessments and DCIA Pre-dicted From Empirical Formulas. DCIA was predicted from parcel-scale % total impervious area (TIA) at 521 parcels with impervioussurfaces based on formulas (A) published by Alley and Veenhuis(1983), (B) published by Wenger et al. (2008), and (C) developedbased on a linear regression relationship between % TIA and %DCIA within parcels for this study. Best fit linear regressions andcorresponding r2 values are reported.
ASSESSING IMPERVIOUS SURFACE CONNECTIVITY AND APPLICATIONS FOR WATERSHED MANAGEMENT
JOURNAL OF THE AMERICAN WATER RESOURCES ASSOCIATION 205 JAWRA
‘‘reverse’’ auction, we offered homeowners the oppor-tunity to submit bids for the amount of money theywould accept to receive one free rain garden and upto four free rain barrels. We then used parcel-scaleimperviousness data to evaluate potential benefits ofinstalling BMPs on each parcel, and developed anenvironmental benefits index that was used in con-junction with costs (e.g., bid amount) to rank home-owners’ bids for BMPs. Characteristics of impervioussurfaces such as the type of imperviousness (e.g.,road vs. rooftop), location in the catchment (e.g., dis-tance from stream), and connectivity to stormwaterconveyances, have been shown to qualify the extentof the impervious impact in streams (Brabec et al.,2002; Walsh et al., 2005a). We therefore consideredparcels with high % TIA, low soil infiltrative capacity,and close proximity to the stream channel to yieldthe highest benefits for installing rain gardens, and,accordingly, gave these sites the highest environmen-tal benefits scores. For rain barrels, higher rooftopconnectivity was expected to result in higher poten-tial benefits from installing the BMPs, and thoseresidences subsequently received higher scores. Incor-porating these data into the bid ranking processensured that we were not just installing BMPs to thelowest bidders, but that the locations selected wouldresult in maximum environmental benefits.
Comparison of Field-Based Assessments toGeographic Information System Approaches
In this study we used field assessments to accu-rately determine the spatial extent and types ofimpervious surfaces. The additional impervious sur-face area added from field assessments accounted for10.6% of impervious surface area, primarily fromsidewalks leading to houses, concrete patios, woodendecks, and pools. We expect that most of these imper-vious surfaces could have been digitized from high-resolution aerial photos without the need for on-siteassessments. These additional surfaces measuredwere primarily disconnected from sewer conveyances,further suggesting that field assessments may not becritical for assessing imperviousness that can altercatchment hydrology and impair stream ecosystems.However, it is important to acknowledge that aerialphoto interpretation is a time consuming process, andcan account for just as much time and effort as fieldinvestigations (Lee and Heaney, 2003). The existingimpervious surface data layers in the Cincinnati GISallowed us to easily quantify buildings, driveways,streets, parking areas, and sidewalks. If our methodsare to be applied elsewhere, similar information isessential for evaluating sources and solutions tostormwater runoff in a catchment.
We summarized subcatchment TIA and DCIAbased on various GIS and field data sources to assesswhether the additional effort could potentiallyincrease our ability to predict instream conditionsacross sites. The NLCD imperviousness layer is themost widely available impervious surface data and isincreasingly being used for catchment-scale impervi-ous area assessments, although the coarse spatialresolution (30 m) limits its utility at fine spatialscales. The NLCD data greatly underestimated actualTIA, though given the small range in % TIA acrosssubcatchments in this study, we are unable to deter-mine whether a systematic adjustment of NLCD %imperviousness would result in a more accurate esti-mation of TIA. When compared to TIA assessed fromaerial photography (the CAGIS dataset), the field andsidewalk assessments resulted in an additional 1.7%TIA, which was found to be consistent across the sub-catchments. This suggests that a standard adjust-ment of % TIA (e.g., 1.7%) would account foradditional sources, and field-based mapping of TIAmay not be necessary when using the data for catch-ment-scale predictors of downstream conditions. Con-versely, the range in percent connectivity acrosssubcatchments in this localized area (48.2-60.4)(Table 2) suggests that percent connectivity wouldhelp explain additional variability in instream condi-tions beyond that explained by TIA, as observed byWalsh (2004). It is important to highlight that theinconsistent relationship between TIA and DCIAacross subcatchments was primarily due to differ-ences in the routing of water between subcatchments,as shown by the difference between the topographicand piped catchment (Figure 6). These differenceswere especially pronounced along roads adjacent tocatchment boundaries. Accurate maps of stormwaterconveyance and the direction of surface water floware therefore likely to be critical datasets for accu-rately assessing catchment-scale DCIA.
Finally, we resolved the use of empirical relation-ships with % TIA to accurately estimate % DCIA,which would obviate the need for field-based assess-ments. Based on our assessments, none of the rela-tionships can do better than explaining 57% of thevariance in this nominal relationship. The formulafrom Alley and Veenhuis (1983) was developed basedon aerial photos and, as deemed necessary, fieldinspections. While their relationship between TIAand DCIA was strong (r2 = 0.98), the formula was notas accurate for predicting % DCIA based on data inthis study. Wenger et al. (2008) exclusively usedhigh-resolution aerial photographs to determineDCIA for a subset of locations and developed a rela-tionship between TIA and DCIA that was similarlystrong (r2 = 0.98), but this strong relationship did notextend to predicting parcel-scale % DCIA using our
ROY AND SHUSTER
JAWRA 206 JOURNAL OF THE AMERICAN WATER RESOURCES ASSOCIATION
data. There are several possible explanations for thelack of consistent performance of these models acrossdatasets. First, the formulas were developed for pre-dicting DCIA within catchments, and the authors didnot address variability or discuss applications of theformula based on data at the parcel scale. Second,while high-resolution aerial photography can be usedto determine whether there are sewers along roads, itcannot be used to determine slopes of driveways andresolve where sewers have outlets, which are appar-ently critical for accurate assessment of DCIA withincatchments. Lastly, these studies were conducted inDenver, Colorado and north of Atlanta, Georgia thateach had mixed urban land uses (commercial and res-idential), so the lack of commercial properties inShepherd Creek and general differences in buildingsand imperviousness across the United States (U.S.)may partially explain the consistency in model over-estimation. However, the formula created in thisstudy from highly reliable TIA was also unable toreliably predict % DCIA in parcels, and this is attrib-uted to the high variability in parcel-scale DCIA. Bydefinition, site-to-site variability in percent connectiv-ity prevents reasonable prediction of DCIA from TIA,unless this can be explained by other factors thatremain unresolved in this study. Our field visits andconversations with homeowners revealed that indi-vidual decisions are made by homeowners as towhether they will disconnect or connect rooftops,driveways, or patios to sewer inlets. This suggeststhat empirical formulas are unlikely to accuratelypredict parcel-scale DCIA, and that time and effortspent in structured field surveys will result in novelinformation not otherwise attainable.
The utility of field-based assessments vs. empiricalformulas for obtaining DCIA data also depends onthe temporal and spatial scale of the data and howit is summarized. The age of development in aregion will likely regulate the accessibility and avail-ability of GIS data. For example, recent develop-ments may have GIS data on sewer pipes, thoughwe found that records of older developments areoften unavailable or incomplete. Homes within sub-divisions built by a single developer are also likelymore homogenous in relationships between TIA andDCIA, thus increasing the accuracy of empirical for-mulas and decreasing the importance of field-basedassessments, offering potential for a ‘‘developer-shed’’delineation. However, as educational campaigns andoptions for storing and infiltrating stormwater runoffvia low impact development become more prevalent,there is likely to be additional increased variationin connectivity among parcels, even in newerdevelopments.
In this study we have demonstrated that at a par-cel scale, there is high variability in DCIA (Figure 2);
however, when DCIA is summarized at the subcatch-ment scale (25-182 ha), the differences between TIAand DCIA are relatively uniform (Figure 6). This isbecause the relative importance of parcel- and street-level stormwater routing will necessarily decreasewhen averaged across these larger areas. Thus, whencomparing data across catchments (e.g., >25 ha), it ispossible that aerial photographs or classified satelliteimagery, along with sewer conveyance information(to assess whether pipes flow into or out of the catch-ment), will adequately assess DCIA and predict in-stream conditions.
Further Applications for DCIA Data in WatershedManagement
Characterization of DCIA represents an importantshift in urban stream ecology from calculating distur-bance indicators to identifying mechanisms of impactthat can be linked to management. In the last15 years, several studies have been published relat-ing % urban and % impervious land cover to streamhydrology, geomorphology, habitat, biology, and eco-system functions (see reviews by Schueler, 1994; Pauland Meyer, 2001; Walsh et al., 2005b). More recently,studies have reported relationships with DCIA; thereare greatly reduced macroinvertebrate assemblagesabove 6-14% DCIA (Walsh et al., 2005a) and fishassemblages above 8-10% DCIA (Wang et al., 2001).Much lower thresholds have been reported for waterquality (1-5% DCIA), algae (2-5% DCIA) (Walshet al., 2005a), and sensitive fish species (2-4% DCIA)(Wenger et al., 2008), and some of these relationshipsare linear for portions of the response (Walsh et al.,2005a). From these and other studies, we now havean understanding of impacts of urbanization onstream ecosystems, although the exact nature of therelationship (e.g., linear, threshold, or steppedthreshold) remains a subject of debate (Walsh et al.,2005b). The differences in response curves andthresholds may be a function of biotic sensitivity todisturbance or specific response variables used, ormay be a product of different methods used to calcu-late TIA and DCIA. Consistent and accurate delinea-tion of impervious surfaces may help refine theserelationships (Brabec et al., 2002). Calculation ofDCIA, in particular, provides data that represents adirect mechanistic link between urbanization and theimpairment of stream ecosystems via piped storm-water runoff. Consequently, DCIA offers a similarlydirect approach to watershed management throughdisconnection of impervious surfaces from storm sew-ers and streams (Walsh, 2004).
Another potential use of detailed, parcel-scaleimpervious area and connectivity data is for develop-
ASSESSING IMPERVIOUS SURFACE CONNECTIVITY AND APPLICATIONS FOR WATERSHED MANAGEMENT
JOURNAL OF THE AMERICAN WATER RESOURCES ASSOCIATION 207 JAWRA
ing a market to encourage runoff-mitigating actions(Parikh et al., 2005). Market-based mechanisms suchas stormwater fees (Fullerton and Wolverton, 1999),tradable allowances (Thurston et al., 2003; Ross-Rakesh et al., 2006), and voluntary offsets adminis-tered via auctions (Roy et al., 2006; Greenhalghet al., 2007) have been proposed for mitigating storm-water runoff. The effectiveness of these approachesdepends on determining a price or payoff that encour-ages implementation of environmental management(Doll and Lindsey, 1999). For example, in many partsof the U.S., stormwater fees are minimal and aredetermined based on average imperviousness for cer-tain property types (e.g., residential, commercial,etc.) rather than the actual amount of stormwatergenerated from individual properties (Keeley, 2007).If municipalities had parcel-specific information onTIA and percent connectivity, they could charge prop-erty owners based on stormwater generated across areasonable annual rainfall distribution, which couldbe directly offset by stormwater-mitigating actions.This approach to fee-setting is used in Germany andbeing considered in several communities in the U.S.(Keeley, 2007); however, the expense of parcel-levelimperviousness calculations remains a hurdle (Kas-persen, 2000). As local governments and municipalsewer districts face growing problems of aging storm-water infrastructure, combined sewer overflows, anddeclining water quality of streams and rivers, theywill likely look toward private property owners tohelp offset the stormwater burden through sourcecontrol retrofit and low impact development.
CONCLUSIONS
The detailed impervious assessment of the Shep-herd Creek catchment presented in this paper andcomparisons to other data sources offers several,important insights for calculating imperviousness inother areas.
1. Digitizing impervious surfaces from aerial photosshould provide an accurate assessment of TIAwithin parcels. Further, if imperviousness isclassified by type (e.g., building, street, side-walk), this information can be used to assess theprimary sources of imperviousness and developwatershed management plans according to TIAcontributions.
2. Classified satellite imagery (NLCD impervious-ness layer) underestimates actual TIA. Althoughwe cannot determine whether a standardadjustment can improve TIA estimates across
catchments, it is important to note that relation-ships between impervious area and stream eco-system impairment will be affected by the sourceof impervious surface cover.
3. Imperviousness connectivity can only be accu-rately assessed via field assessments. The highparcel-scale variability in DCIA renders estima-tions from empirical relationships with TIA inac-curate. However, depending on study objectives,when calculating average DCIA at a catchmentscale (e.g., >25 ha) over multiple parcels, esti-mates of DCIA based on TIA may be sufficientlyaccurate.
Although individual parcel assessments are consid-ered time-consuming (15 min per property), the datagathered can contribute valuable information thatcan then play a key role in management of storm-water volume. For example, quantification of parcel-scale DCIA may be used to assess the extent ofimperviousness linked to downstream ecosystemsand to predict the potential hydrological and ecologi-cal responses to management by disconnection viaretrofit BMPs. Parcel-scale DCIA can also be used toset fair stormwater fees and provide a basis forapplication of incentives that can encourage privateproperty owners to mitigate stormwater on theirproperty. Ultimately, assessment of impervious sur-face connectivity within parcels should result in moreeffective and efficient management of urban andsuburban watersheds.
ACKNOWLEDGMENTS
We thank Karsten Head and Daniel Kowalski for compiling andprinting field assessment forms, and assisting in conducting fieldassessments during their internships at the U.S. EnvironmentalProtection Agency (USEPA) in summer 2005. Andrew Swift fromCAGIS supplied impervious surface cover outlines that they cre-ated from aerial photographs. Eastern Research Group conductedthe GIS data entry under EPA Contract Number EP-C-05-059(Task Order 9). This manuscript was improved by comments fromTim Carter and three anonymous reviewers. AHR was a postdoc-toral associate with the Oak Ridge Institute for Science and Educa-tion during project planning and initial field assessment phases.The views expressed herein are strictly the opinions of the authorsand in no manner represent or reflect current or planned policy bythe USEPA.
LITERATURE CITED
Alley, W.M. and J.E. Veenhuis, 1983. Effective Impervious Area inUrban Runoff Modeling. Journal of Hydraulic Engineering109:313-319.
Arnold, C.L. and C.J. Gibbons, 1996. Impervious Surface Coverage:The Emergence of a key Environmental Indicator. Journal ofthe American Planning Association 62:243-258.
ROY AND SHUSTER
JAWRA 208 JOURNAL OF THE AMERICAN WATER RESOURCES ASSOCIATION
Bledsoe, B.P. and C.C. Watson, 2001. Effects of Urbanization onChannel Instability. Journal of the American Water ResourcesAssociation 37:255-270.
Booth, D.B. and C.R. Jackson, 1997. Urbanization of Aquatic Sys-tems: Degradation Thresholds, Stormwater Detention, and theLimits of Mitigation. Journal of the American Water ResourcesAssociation 33:1077-1090.
Brabec, E., S. Schulte, and P.L. Richards, 2002. Impervious Sur-faces and Water Quality: A Review of Current Literature andits Implications for Watershed Planning. Journal of PlanningLiterature 16:499-514.
Brandes, D., G.J. Cavallo, and M.L. Nilson, 2005. Base FlowTrends in Urbanizing Watersheds of the Delaware River Basin.Journal of the American Water Resources Association 41:1377-1391.
Doll, A. and G. Lindsey, 1999. Credits Bring Economic Incentivesfor Onsite Stormwater Management. Watershed and WetWeather Technical Bulletin 4:12-15.
Fullerton, D. and A. Wolverton, 1999. The Case for a two-PartInstrument: Presumptive tax and Environmental Subsidy.In: Environmental and Public Economics: Essays in Honor ofWallace E. Oates, A. Panagariya, P. Portney, and R. Schwab(Editors). Edward Elgar, Cheltenham, United Kingdom, pp.32-57.
Greenhalgh, S., J. Guiling, M. Selman, and J. St. John, 2007. Pay-ing for Environmental Performance: Using Reverse Auctions toAllocate Funding for Conservation. WRI Policy Note 3:1-6.
Hatt, B.E., T.D. Fletcher, C.J. Walsh, and S.L. Taylor, 2004. TheInfluence of Urban Density and Drainage Infrastructure on theConcentrations and Loads of Pollutants in Small Streams. Envi-ronmental Management 34:112-124.
Kaspersen, J., 2000. The Stormwater Utility: Will it Work in YourCommunity? Stormwater 1(1):22-28.
Keeley, M., 2007. Using Individual Parcel Assessments to ImproveStormwater Management. Journal of the American PlanningAssociation 73:149-160.
Konrad, C.P. and D.B. Booth, 2005. Hydrologic Changes in UrbanStreams and Their Ecological Significance. In: Effects of Urbani-zation on Stream Ecosystems, L.R. Brown, R.H. Gray, R.M.Hughes, and M.R. Meador (Editors). American Fisheries Soci-ety, Symposium 47, Bethesda, Maryland, pp. 157-177.
Krug, W.R. and G.L. Goddard, 1986. Effects of Urbanization onStream Flow, Sediments Loads and Channel Morphology inPheasant Branch Basin Near Middleton, Wisconsin. U.S. Geo-logical Survey Water Resources Investigations Report 85-4068,Madison, Wisconsin, 82 pp.
Lee, J.G. and J.P. Heaney, 2003. Estimation of Urban Impervious-ness and its Impacts on Storm Water Systems. Journal of WaterResources Planning and Management 129:419-426.
Newall, P. and C.J. Walsh, 2005. Response of Epilithic DiatomAssemblages to Urbanization Influences. Hydrobiologia 532:53-67.
Parikh, P., M. Taylor, T. Hoagland, H. Thurston, and W. Shuster,2005. At the Intersection of Hydrology, Economics, and law:Application of Market Mechanisms and Incentives to ReduceStormwater Runoff. Environmental Science and Policy 8:133-144.
Paul, M.J. and J.L. Meyer, 2001. Streams in the Urban Landscape.Annual Review of Ecology and Systematics 32:333-365.
RossRakesh, S., M. Francey, and C.J. Chesterfield, 2006. Mel-bourne Water’s Stormwater Quality Offsets. In: Proceedings ofthe 7th Urban Drainage Modelling and 4th Water SensitiveUrban Design Conference (Vol. 2), A. Deletic and T. Fletcher(Editors). Melbourne, Australia, pp. 207-216.
Rouge Program Office, 1994. Determination of Impervious Areaand Directly Connected Impervious Area, Memorandum, WayneCounty Rouge Program Office, Detroit, Michigan.
Roy, A.H., H. Cabezas, M.P. Clagett, N.T. Hoagland, A.L. Mayer,M.A. Morrison, W.D. Shuster, J.J. Templeton, and H.W. Thur-ston, 2006. Retrofit Stormwater Management: Navigating Multi-disciplinary Hurdles at the Watershed Scale. Stormwater 7:16-29.
Schueler, T.R., 1994. The Importance of Imperviousness.Watershed Protection Techniques 1:100-111.
Taylor, S.L., S.C. Roberts, C.J. Walsh, and B.E. Hatt, 2004. Catch-ment Urbanisation and Increased Benthic Algal Biomass inStreams: Linking Mechanisms to Management. FreshwaterBiology 49:835-851.
Thurston, H.W., H.C. Goddard, D. Szlag, and B. Lemberg, 2003.Controlling Stormwater Runoff With Tradable Allowances forImpervious Surfaces. Journal of Water Resources Planning andManagement 129:409-418.
Walsh, C.J., 2004. Protection of in-Stream Biota From UrbanImpacts: Minimize Catchment Imperviousness or ImproveDrainage Design? Marine and Freshwater Research 55:317-326.
Walsh, C.J., T.M. Fletcher, and A.R. Ladson, 2005a. Stream Resto-ration in Urban Watersheds Through re-Designing StormwaterSystems: A Hypothetical Framework for ExperimentalWatershed Manipulation. Journal of the North American Ben-thological Society 24(3):690-705.
Walsh, C.J., P.J. Papas, C. Crowther, P.T. Sim, and J. Yoo, 2004.Stormwater Drainage Pipes as a Threat to a Stream-DwellingAmphipod of Conservation Significance, Austrogammarus Aus-tralis, in Southeastern Australia. Biodiversity and Conservation13:781-793.
Walsh, C.J., A.H. Roy, J.W. Feminella, P.D. Cottingham, P.M.Groffman, and R.P. Morgan, II, 2005b. The Urban Stream Syn-drome: Current Knowledge and the Search for a Cure. Journalof the North American Benthological Society 24(3):706-723.
Walsh, C.J., P.T. Sim, and J. Yoo, 2002. Methods for the Determi-nation of Catchment Imperviousness and Drainage Connection.Project D210. Cooperative Research Centre for Freshwater Ecol-ogy, Melbourne, Australia.
Wang, L., J. Lyons, P. Kanehl, and R. Bannerman, 2001. Impactsof Urbanization on Stream Habitat and Fish Across MultipleSpatial Scales. Environmental Management 28:255-266.
Wenger, S.J., J.T. Peterson, M.C. Freeman, B.J. Freeman, andD.D. Homans, 2008. Stream Fish Occurrence in Response toImpervious Cover, Historic Land use, and HydrogeomorphicFactors. Canadian Journal of Fisheries and Aquatic Sciences65:1250-1264.
Yang, L., C. Huang, C. Homer, B. Wylie, and M. Coan, 2002. AnApproach for Mapping Large- Area Impervious Surfaces: Syner-gistic use of Landsat 7 ETM+ and High Spatial ResolutionImagery. Canadian Journal of Remote Sensing 29(2):230-240.
ASSESSING IMPERVIOUS SURFACE CONNECTIVITY AND APPLICATIONS FOR WATERSHED MANAGEMENT
JOURNAL OF THE AMERICAN WATER RESOURCES ASSOCIATION 209 JAWRA