Embed Size (px)
Citation preview
Assessing the Effectiveness of Tennessee’s
Pre-Kindergarten Program: Preliminary Report
July 16, 2007
Revised September 4, 2007
995 Goodale Blvd ● Columbus, Ohio 43212
Phone: (614) 220-8860 ● Fax: (614) 220-8845 www.strategicresearchgroup.com
Strategic Research Group (SRG) is a full-service research firm that provides data collection, consultative, and research services. SRG specializes in conducting public opinion surveys, program evaluations, policy assessments, customer satisfaction studies, and community needs assessments on national, state, and local levels.
3
TABLE OF CONTENTS
Executive Summary....................................................................................................................5
Evaluating the Effectiveness of Tennessee’s Pre-Kindergarten Programs ..........................8 Background and Implementation of Tennessee’s Pre-Kindergarten Program .......................... 8
Pre-K Pilot Sites ................................................................................................................10 Lottery/General Fund Sites ..............................................................................................10 The Community Pre-K Advisory Council ........................................................................10 Application Criteria for the Voluntary Pre-K for Tennessee Program..........................11 Collaborative Partnerships ..............................................................................................11 Student Eligibility ..............................................................................................................11 Classroom Requirements.................................................................................................12 Program Effectiveness .....................................................................................................12 Preliminary Results...........................................................................................................13
Organization of This Report .................................................................................................... 14
Data Sources .......................................................................................................................... 15
1. Pre-Kindergarten Demographic File............................................................................15 2. Education Information System Data............................................................................15 3. K-12 Student Assessment Data ..................................................................................17 Merging Data Sources: The Issue of Student Identifiers...............................................18
Preliminary Data Management and Analysis .......................................................................... 18
Managing the Data ............................................................................................................19 Who Participates in the Pre-K Program? ................................................................................ 20
Pre-K Student Demographic Characteristics .................................................................21 Other Student Information ...............................................................................................22 Program Information: Pre-K Funding Source.................................................................23
Methodology: Assessing the Impact of the Pre-K Program .................................................24 Sampling Strategy for Pre-K Students and Non-Pre-K Students ............................................ 24
Pre-K Students ..................................................................................................................24 Non Pre-K Attendees ........................................................................................................25
Proposed Analytical Approach for Research Question 1 ........................................................ 26

4
Short-term Effect of Pre-K on Assessment Test Scores ...............................................26 Long-term Effect of Pre-K on Assessment Test Scores................................................27 Additional Outcomes ........................................................................................................28
Proposed Analytical Approach for Research Question 2 ........................................................ 28
Cohort Trajectories and the School Years Covered in Each Report....................................29
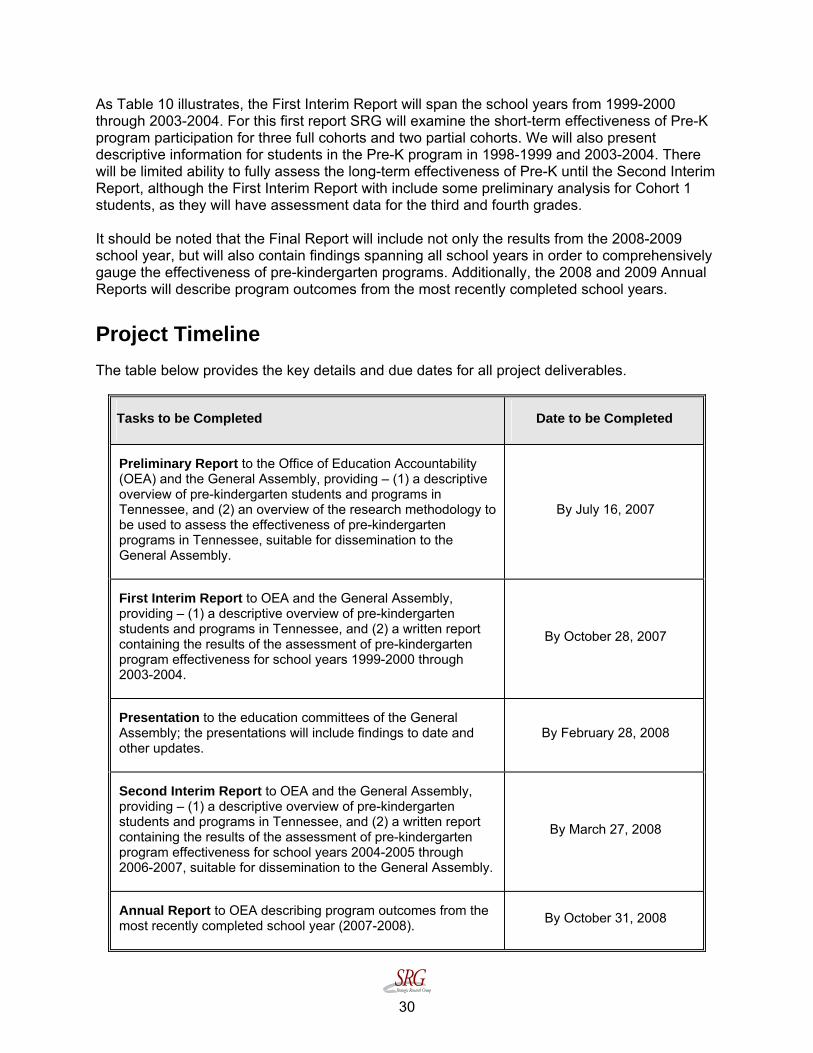
Project Timeline ........................................................................................................................30
5
Executive Summary The State of Tennessee has commissioned an evaluation of the effectiveness of its Pre-Kindergarten program. The primary objective of the project is to assess whether children who attended a state-funded Pre-Kindergarten program perform better academically in the short and long term than a comparable group of peers who did not attend Tennessee’s Pre-Kindergarten program. The evaluation will also investigate whether various characteristics of Tennessee’s Pre-Kindergarten programs impact short- and long-term achievement among students who attended these programs.
The State of Tennessee has been funding Early Childhood Education (ECE) since the 1990s and has been collecting data on student participants since Pilot Pre-K sites were established in the 1998-1999 academic year. The program has expanded significantly since then, with a major increase in funding in 2005-2006 that effectively tripled the number of state-funded Pre-K classrooms serving at-risk four-year-olds.
A significant advantage of the organization and structure of the Pre-K program is its ability to track student progress beyond the Pre-K program as students move through elementary and eventually high school. This affords the state of Tennessee the ability to determine whether students who participated in state-funded Pre-K perform better on standardized assessments in grades K-12 relative to a similar group of their peers who did not participate in state-funded Pre-K.
The present study will investigate student progress through the fifth grade on norm-referenced (Kindergarten through grade two) and criterion-referenced (grades three through five) assessments. SRG will integrate and analyze Pre-Kindergarten enrollment files provided by the Tennessee Department of Education (TDOE) Office of Early Learning, data from the Tennessee Education Information System (EIS), and student test scores from the TDOE Assessment, Evaluation, and Research Division to address two research questions:
Research Question 1: Do students who attend state-funded Pre-Kindergarten programs have higher short- and long-term academic achievement than students who do not attend state-funded Pre-Kindergarten programs?
Research Question 2: For those students who do attend state-funded Pre-Kindergarten programs, what programmatic characteristics are related to higher short- and long-term academic achievement?
To address Research Question 1, SRG will include all Pre-K participants from the first three years of the Pilot Pre-K program (1998-1999 through 2000-2001) and select a random sample of 1,000 Pre-K participants from each subsequent academic year. Then, from the EIS files of all other eligible students in Tennessee, we will select a comparable random sample using proportional probability sampling. The end result will provide a sample of non-Pre-K attendees for each program year that will have roughly equal percentages of males/females, racial groups, eligibility for FRPL, and special education status as their respective Pre-K participant groups.
Once the samples are selected, SRG will utilize Analysis of Variance and multiple regression analysis to determine whether Pre-K participants ultimately perform better on standardized assessments than a comparable group of peers who did not participate in state-funded Pre-K. Each cohort (i.e., program year) will be evaluated separately.
6
The short-term impact of participation in the Pre-K program will be investigated in analysis of norm-referenced assessments conducted in Kindergarten, first, and second grades. The long-term impact of Pre-K participation will be investigated in analysis of criterion-referenced assessments conducted in grades three, four, and five.
Additional student outcomes to be evaluated include attendance, behavioral problems (i.e., disciplinary action), and grade retention. An examination of multiple indicators of academic achievement will result in a comprehensive evaluation of the effectiveness of Tennessee’s Pre-Kindergarten program.
The second research question examines program characteristics. Analyses will be limited only to students who have participated in the Pre-K program and will test the effect that Pre-K program characteristics have on Pre-K student outcomes year by year and over time. The primary program characteristics to be investigated in this analysis include:
1. Size of the program both at the Local Education Agency (LEA)-level and classroom-level (i.e. number of students enrolled, number of free/reduced price lunch-eligible students/at-risk students, number of sites/classrooms, and/or number of teachers).
2. Teacher credentials/experience. 3. Geographic location (i.e. region of the state and urban/rural/suburban locations). 4. Program type (i.e. Pilot, General fund/Lottery). 5. For students participating in the Pilot program, the impact of two consecutive years of
Pre-K participation. 6. Type of program/structure (i.e. collaborative versus school-based site, number of days
the program served children, hours of training offered; results of family survey).
Regression analysis will be used to determine whether there are differential effects of participation in certain types of Pre-K programs, depending on student and program characteristics. For example, do certain types of students benefit more from participating in certain types of programs?
The present report outlines SRG’s approach to this project and recommended strategies for data management, sampling, and data analysis. This report also provides an overview of the number of students who have participated in state-funded Pre-K in Tennessee between 1998-1999 and 2005-2006 and their demographic characteristics.
Overview of Pre-K Student Data
To date, SRG has reviewed each year’s list of Pre-K student participants. Because these lists were maintained for administrative purposes, they have been reviewed and prepared for data analysis. This process required removal of duplicate cases and review for integrity to correct any possible data entry errors. The table below summarizes the number of students that were enrolled in Tennessee’s Pre-K program from 1998-1999 through 2005-2006.

7
Participants in State-Funded Pre-K for Each Program Year: Number of Cases for Analysis
Year Total Number of Pre-K Students
1998-1999 472 1999-2000 448 2000-2001 2,014 2001-2002 3,203 2002-2003 3,370 2003-2004 3,014 2004-2005 3,025 2005-2006 8,318
Total 23,864
To summarize the overall demographic composition of the Pre-K students over five program years (2001-2002 through 2005-2006)1:
• 51.5% of Pre-K students were male and 48.5% were female.
• 63.1% of the students who participated in Pre-K program were white, 31.4% were African-American, 4.9% were Hispanic/Latino, 0.7% were Asian, and less than 0.1% were Native Hawaiian/Pacific Islander.
• Prior to the 2005-2006 academic year, all Pre-K programs were primarily funded through Pilot funds. In the 2005-2006 academic year, 32.6% of the students were primarily funded through Pilot funds, 65.5% through the Lottery funds, 1.5% through Title funds, and 0.5% through other sources.
Some additional demographic information was collected in the 2005-2006 program year:
• 83.7% of Pre-K students were eligible for Free and Reduced Price Lunch (FRPL).2
• 20.4% had other at-risk qualifiers.
• 16.1% were transported by the school.
• 5.2% did not have English as their home language.
1 Demographic characteristics such as gender and race were not maintained in a state database for program years 1998-1999 through 2000-2001. 2 Of note, although local program sites verified at-risk status (including FRPL eligibility) for Pre-K participants, these data were not recorded and maintained at the individual student level for each program year. Thus the datasets available for analysis do not include this information for all students for all program years. However, this does not prevent us from examining FRPL status in the evaluation, as it is available for some years from other data sources.

8
Evaluating the Effectiveness of Tennessee’s Pre-Kindergarten Programs The State of Tennessee has commissioned an evaluation of the effectiveness of its Pre-Kindergarten program. The primary objective of the project is to assess whether children who attended a state-funded Pre-Kindergarten program perform better academically in the short and long term than a comparable group of peers who did not attend Tennessee’s Pre-Kindergarten program. The evaluation will also investigate whether various characteristics of Tennessee’s Pre-Kindergarten programs impact short- and long-term achievement among students who attended these programs.
Beginning with the Pre-Kindergarten student cohort of 1998-1999, students will be tracked through the fifth grade in order to capture both short- and long-term academic achievement. At the conclusion of the project, the evaluation will span eleven cohorts of students who attended Tennessee’s Pre-Kindergarten program and ten cohorts of students who did not. Overall, there will be a total of five cohorts that have a full set of data spanning from Pre-Kindergarten to fifth grade. The results from analyses of these cohorts will be covered over the course of six project reports (two annual, three interim, and one final report).
The objective of this Preliminary Report is to provide the Office of Education Accountability (OEA) and the General Assembly a descriptive overview of Pre-Kindergarten students and programs in Tennessee, and an overview of the research methodology to be used to assess the effectiveness of Pre-Kindergarten programs in Tennessee.
Background and Implementation of Tennessee’s Pre-Kindergarten Program
Across the nation, access to high-quality state-funded Pre-Kindergarten (Pre-K) has steadily increased in the last 10 years. The National Institute for Early Education Research (NIEER) estimates that almost 1 million children participated in state Pre-K initiatives in 2005-2006, and spending in the states offering Pre-K totaled over $3 billion.3 Although state standards vary widely, more than three-quarters of state programs adhere to comprehensive early learning standards and more than half require teachers to have a Bachelor’s degree; 73% require teachers to have specialized Pre-K training. Over the last five years, NIEER estimates 14% of 4-year-olds participated in state-funded Pre-K in 2002, but in 2006 20% of 4-year olds were enrolled.
The State of Tennessee has been funding Early Childhood Education (ECE) since the 1990s. Legislation enacted in 1996 permitted the creation of Pilot early childhood and Pre-Kindergarten programs for economically disadvantaged three- and four-year-olds. In the 1998-1999 school year, 30 Pilot Pre-K classrooms were created, serving approximately 600 students. Since then the program has grown to over 934 classrooms, serving approximately 17,000 children. Table 1 summarizes the number of students served and the number of classrooms in operation in Tennessee since 1998-1999, according to Tennessee Department of Education, Office of Early Learning.
3 Barnett, W.S., Hustedt, J.T., Hawkinson, L.E., Robin, K.B. (2006). The State of Preschool 2006. National Institute for Early Education Research. Downloaded from the Internet at http://nieer.org/yearbook/.
9
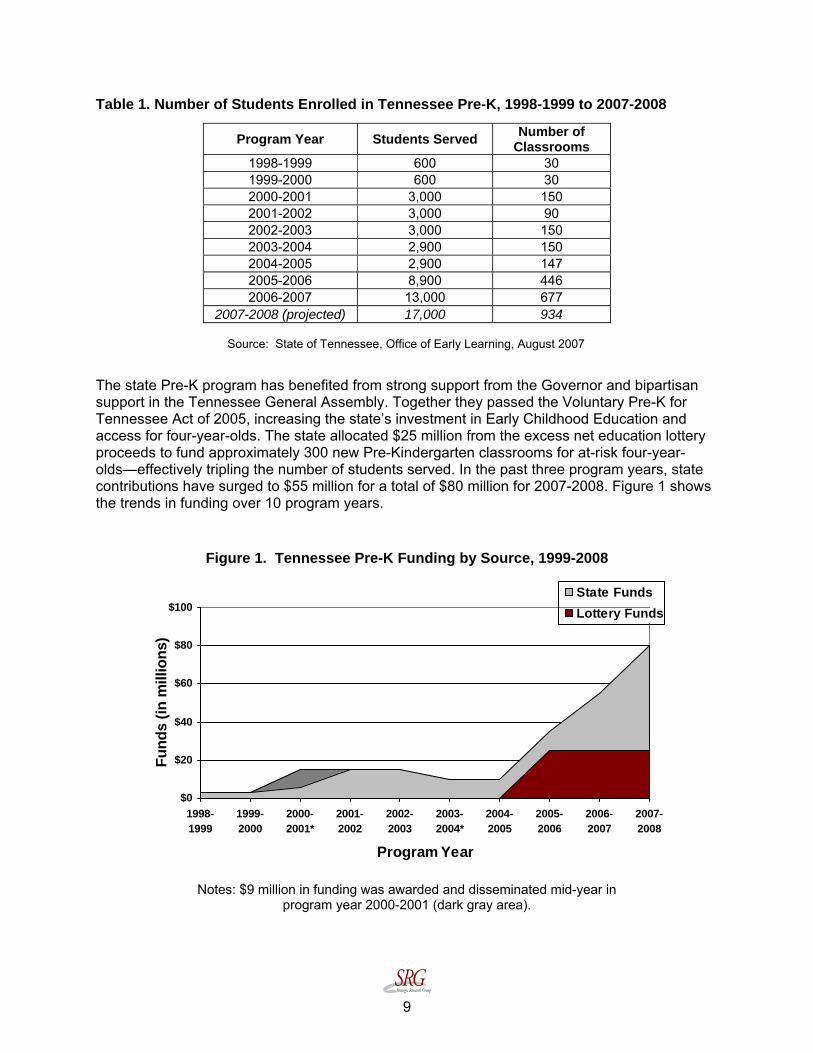
Table 1. Number of Students Enrolled in Tennessee Pre-K, 1998-1999 to 2007-2008
Program Year Students Served Number of Classrooms
1998-1999 600 30 1999-2000 600 30 2000-2001 3,000 150 2001-2002 3,000 90 2002-2003 3,000 150 2003-2004 2,900 150 2004-2005 2,900 147 2005-2006 8,900 446 2006-2007 13,000 677
2007-2008 (projected) 17,000 934 Source: State of Tennessee, Office of Early Learning, August 2007
The state Pre-K program has benefited from strong support from the Governor and bipartisan support in the Tennessee General Assembly. Together they passed the Voluntary Pre-K for Tennessee Act of 2005, increasing the state’s investment in Early Childhood Education and access for four-year-olds. The state allocated $25 million from the excess net education lottery proceeds to fund approximately 300 new Pre-Kindergarten classrooms for at-risk four-year-olds—effectively tripling the number of students served. In the past three program years, state contributions have surged to $55 million for a total of $80 million for 2007-2008. Figure 1 shows the trends in funding over 10 program years.
Figure 1. Tennessee Pre-K Funding by Source, 1999-2008
$0
$20
$40
$60
$80
$100
1998-1999
1999-2000
2000-2001*
2001-2002
2002-2003
2003-2004*
2004-2005
2005-2006
2006-2007
2007-2008
Program Year
Fund
s (in
mill
ions
)
State FundsLottery Funds
Notes: $9 million in funding was awarded and disseminated mid-year in
program year 2000-2001 (dark gray area).

10
Pre-K Pilot Sites
The expansion of the Pre-Kindergarten program in 2005 resulted in two systems of Pre-Kindergarten instruction: the Pilot programs that were begun in 1998 and the lottery/general fund-funded programs that were begun in 2005. The two systems are alike in their classroom requirements regarding teacher credentials, class size, and curricular focus; however, they differ in their funding amount and source and their affiliation with the public school system. Pilot Pre-K program sites were not required to be affiliated with a local education agency (LEA) although most were located in schools. Although the majority of Pilot Pre-K providers are LEAs, 14 private providers (approximately 22 classrooms) have continued to serve three- and four-year olds. In 2006-2007, approximately 3,000 students were served in the Pilot program.
In fiscal years 2002 and 2003, funding of the Pilot sites was supplemented by federal Temporary Assistance for Needy Families (TANF) funds. When the TANF funding ended in the 2003-2004 school year, the state became the program’s sole funding source and each classroom’s funding was reduced by $30,000. In 2005-2006, each classroom received $65,000 in state funds. A local match is not required; however, most pilot sites supplement the state allocation with local funds.
Lottery/General Fund Sites
Classrooms formed since the expansion of 2005-2006 (Lottery/General Fund sites) are slightly different from their Pilot Pre-K counterparts. Under the new program, the state grants funds to the LEA, but the LEA may subcontract with various providers. The advantage of this system is a greater level of accountability with funding among LEAs.
For the 2005-2006 school year, the total funding for each classroom was $101,149. The per pupil expenditure was $5,057. Programs that receive Pre-K funding must provide a matching amount of funding. The LEA contribution may include grants, federal funds, or private funds, and may be in-kind matches such as the use of non-LEA owned facilities, instructional materials, equipment and supplies, food and nutrition services and transportation.
A significant change for programs formed since the expansion of 2005 is the requirement of a “Community Pre-K Advisory Council.” This is a required form of community collaboration that is a pre-requisite for programs submitting a Pre-K grant application.
The Community Pre-K Advisory Council
As of 2005-2006, each LEA applying for programs under the Voluntary Pre-K for Tennessee initiative must create and appoint an Advisory Council. The director of schools (or a designee) serves as chair and coordinates council activity. The Council must include members representing the local school board, parents, teachers, non-profit providers, for-profit providers, a Head Start representative, a business community representative, and a representative of local government funding bodies (e.g., county commission, city council, etc.) where applicable. The Council is intended to provide input to the local board of education in applying for programs (taking into consideration existing programs serving four-year-olds in the local area).
The purpose of the Advisory Council is to develop a Pre-K implementation plan to meet the needs of the four-year-old population in the geographic area served by the LEA, with first priority being four-year-olds who are considered to be “at risk.” Through collaboration and

11
cooperation, each Council is required to develop short- and long-term plans for implementation of the Pre-K program, including such issues as a timeline for Pre-K expansion, access to adequate facilities, equipment, and staff, and identification of community resources. Community resources include materials and supplies, auxiliary services, and a required local funding match.
Each site must be affiliated with a local school, and the active participation of a Pre-K Advisory Council is required for submission of a Pre-K grant application.
Application Criteria for the Voluntary Pre-K for Tennessee Program
Currently, any local LEA that has established a Community Pre-K Advisory Council and wishes to provide a Pre-K program serving at-risk four-year-olds in their geographic area of Tennessee may apply for state funding. The LEA may apply for Pre-K classrooms located at more than one site, and an LEA may partner or subcontract with multiple agencies, provided they meet the criteria specified by the TN Department of Human Services.
Collaborative Partnerships
Since 2005, the Voluntary Pre-K for Tennessee program has experienced rapid growth. According to the Office of Early Learning, to meet the needs of all students as the program grows, many classrooms will need to be located outside of the schools. Thus, collaborative partnerships are an important means of meeting the growing demand for Pre-K services. In response to this demand, local school systems have developed a variety of partnerships with a range of providers for classroom and non-classroom services.
As a result of the initial expansion in 2005, 66 collaborative Pre-K classrooms were created. In 2006, the program expanded again to create an additional 82 collaborative classrooms, totaling 148 collaborative classrooms (28% of all Voluntary Pre-K Classrooms). These 148 collaborative classrooms were developed by 39 LEAs with a variety of providers, and as of 2006-2007, approximately one-half (71) of these classrooms were located in non-school sites. Table 2 provides a breakdown of these collaborative classrooms.
Table 2. Collaborative Classrooms in 2005 and 2006
2005 2006 Total Head Start 31 60 91 Even Start 3 0 3 Non-Profit 7 3 10 For-Profit 6 12 18 Faith Based 0 0 0 Higher-Ed 1 2 3 Community Based 6 0 6 Other* 12 5 17 Total 66 79 148
*Examples of other sites include boys clubs, girls clubs, housing developments and community centers.
Student Eligibility
Enrollment in the Voluntary Pre-K for Tennessee program is based upon legislation (TCA 49-6-101-104). The Pre-K state statute specifies that each LEA is authorized to and may

12
enroll any at-risk child who is four years old by September 30 and resides in the geographic area served by the LEA. Priority is given to those children who are eligible for the free/reduced price lunch (FRPL) program. The state of Tennessee Department of Education encourages school systems to accurately identify the number of unserved at-risk children in the school district, making every effort to fill Pre-K classrooms with at-risk children.
If, however, there is space available after priority is given to at-risk four-year-olds, the LEA may enroll students with disabilities, students identified as English language learners (ELLs), students in state custody, or students identified as educationally at-risk for failure due to circumstances of abuse or neglect.
At the end of the first Pre-K student attendance period, if an insufficient number of children meeting the aforementioned enrollment requirements are enrolled in a specific classroom, an LEA may submit a written request to the Office of Early Learning for approval to enroll children identified with other at-risk factors as determined by the local school board and the Pre-K Advisory Council, such as children with a parent(s) in the military deployed to active duty, teen parents, or parents with limited education. In these cases a written request must be submitted and approved by the Office of Early Learning.
If not enough at-risk children enroll to fill a classroom, students who do not meet any at-risk criteria but who are considered unserved or underserved may be enrolled after a written request is submitted and approved by the Office of Early Learning.
Classroom Requirements
Classroom requirements for all Pre-K classrooms in Tennessee are the same for all sites, regardless of whether they are considered Pilot or Lottery/general fund-funded Pre-K programs. The requirements are as follows:
• Maximum class size is 20 students. • Each class must have at least one licensed teacher who is certified in early
childhood education, and at least one educational assistant who has either a child development associate credential (CDA) or an associate degree in early childhood education, or who is working toward acquiring these credentials.
• The program must provide a minimum of five and one-half hours of quality instructional time per day.
• Classroom instruction must include the use of an educational, age- appropriate curriculum that aligns with the state department of education approved early learning standards and includes literacy, writing, math, and science skills.
• Instruction must also include a developmental learning program that addresses the cognitive, physical, emotional, social, and communication areas of child development.
• In addition, each program must comply with the state board of education’s early childhood education and Pre-Kindergarten program rules and policies.
Program Effectiveness
Clearly, Tennessee’s Pre-K program has experienced significant growth over the past three years. In 2005, the program served approximately 3,000 three- and four-year-olds in 148 classrooms funded with $10 million in state revenue, but is expected to increase to over 900 classrooms (17,000 students) in 2007-2008, representing an increase of over 750

13
classrooms in just 3 years. By 2008, state Pre-K is expected to have expanded to 132 of the 136 school systems in 93 of the 95 counties in Tennessee. The Governor and Legislature have made Pre-K a priority in Tennessee, and funding for Pre-K education has increased from $10 million in 2004-2005 to $80 million in 2007-2008 through excess lottery funds and state revenue.
Collaboration is a distinctive characteristic of Tennessee’s Pre-K program, as evidenced by the importance of classroom partnerships in the TN Pre-K program. In 2006-2007 there were 148 collaborative classroom partnerships between 39 local school systems and non-profit and for profit providers. Tennessee statute allows for state collaboration with agencies such as Head Start, Even Start, for-profit and not-for-profit child care providers, faith-based agencies, community-based agencies, and higher education institutions. Further, the program requires the active participation and collaboration of stakeholders at the local and state level in the form of Community and State Pre-K Advisory Committees.
The Tennessee Voluntary Pre-K program has been recognized as achieving 9 out of 10 quality standard benchmarks of the National Institute for Early Education Research (NIEER), for the past two years—one of only 6 states to achieve a score of 9 or 10. These benchmarks include:
• Comprehensive early learning standards. • Teacher degree of BA or higher. • Teacher specialized training in Pre-K. • Assistant teacher degree of CDA or equivalent. • Teacher in-service of at least 15 hours per year. • Maximum class size of 20 students. • Staff: child ratio 1:10 or better. • Vision, hearing, health screenings and one support service. • At least one meal per day. • Monitoring/site visits.
Tennessee meets all these criteria with one exception (assistant teacher degrees). Requirements are the same for teacher degrees in both the Pilot Pre-K program and the Voluntary Pre-K expansion. However, assistant teacher degree requirements differ between the two programs. In the Pilot program, all assistant teachers are required to have a CDA. In the Voluntary Pre-K expansion, the LEA is required to hire an assistant teacher with a CDA if one is available, but if not the LEA may hire one with a high school diploma and relevant experience working with ECE programs. Otherwise, Tennessee’s state-funded program conforms to all of the other quality standards.
As the program continues to grow and more children are exposed to high-quality early childhood education in Tennessee, research is increasingly able to investigate the short- and long-term impact of Pre-K on student outcomes in elementary and middle school. The state of Tennessee has been collecting data on student participation in Pre-K since the inception of the Pilot Pre-K program in 1998, and is in the unique position to track student outcomes longitudinally.
Preliminary Results
Preliminary data analysis conducted on students who participated in the Pilot program suggests that at-risk students who participate in Tennessee Pre-K perform better than the at-risk students with no Pre-K experience on standardized achievement tests.
14
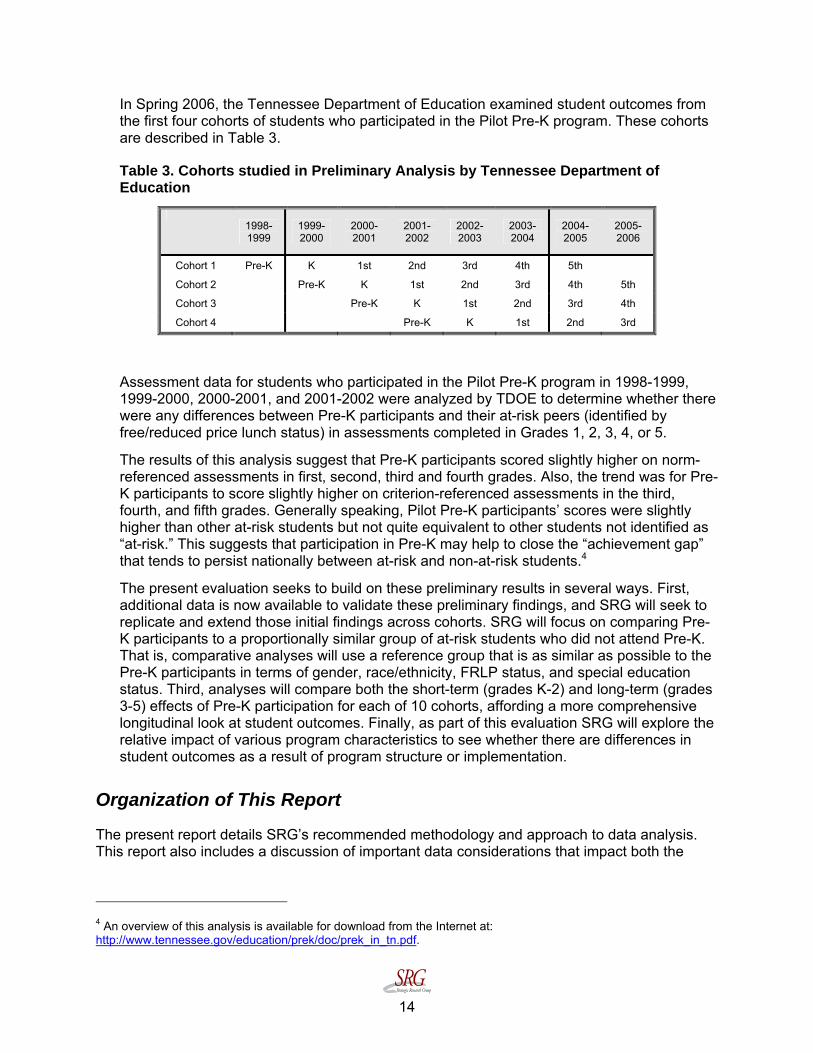
In Spring 2006, the Tennessee Department of Education examined student outcomes from the first four cohorts of students who participated in the Pilot Pre-K program. These cohorts are described in Table 3.
Table 3. Cohorts studied in Preliminary Analysis by Tennessee Department of Education
1998-1999
1999-2000
2000-2001
2001-2002
2002-2003
2003-2004
2004-2005
2005-2006
Cohort 1 Pre-K K 1st 2nd 3rd 4th 5th
Cohort 2 Pre-K K 1st 2nd 3rd 4th 5th
Cohort 3 Pre-K K 1st 2nd 3rd 4th
Cohort 4 Pre-K K 1st 2nd 3rd
Assessment data for students who participated in the Pilot Pre-K program in 1998-1999, 1999-2000, 2000-2001, and 2001-2002 were analyzed by TDOE to determine whether there were any differences between Pre-K participants and their at-risk peers (identified by free/reduced price lunch status) in assessments completed in Grades 1, 2, 3, 4, or 5.
The results of this analysis suggest that Pre-K participants scored slightly higher on norm-referenced assessments in first, second, third and fourth grades. Also, the trend was for Pre-K participants to score slightly higher on criterion-referenced assessments in the third, fourth, and fifth grades. Generally speaking, Pilot Pre-K participants’ scores were slightly higher than other at-risk students but not quite equivalent to other students not identified as “at-risk.” This suggests that participation in Pre-K may help to close the “achievement gap” that tends to persist nationally between at-risk and non-at-risk students.4
The present evaluation seeks to build on these preliminary results in several ways. First, additional data is now available to validate these preliminary findings, and SRG will seek to replicate and extend those initial findings across cohorts. SRG will focus on comparing Pre-K participants to a proportionally similar group of at-risk students who did not attend Pre-K. That is, comparative analyses will use a reference group that is as similar as possible to the Pre-K participants in terms of gender, race/ethnicity, FRLP status, and special education status. Third, analyses will compare both the short-term (grades K-2) and long-term (grades 3-5) effects of Pre-K participation for each of 10 cohorts, affording a more comprehensive longitudinal look at student outcomes. Finally, as part of this evaluation SRG will explore the relative impact of various program characteristics to see whether there are differences in student outcomes as a result of program structure or implementation.
Organization of This Report
The present report details SRG’s recommended methodology and approach to data analysis. This report also includes a discussion of important data considerations that impact both the
4 An overview of this analysis is available for download from the Internet at: http://www.tennessee.gov/education/prek/doc/prek_in_tn.pdf.
15
nature of the analysis as well as the interpretation of results. The remainder of the report is organized into the following sections:
• An overview of the three data sources available for analysis and some important considerations in terms of the quality and format of the data.
• An overview of Pre-K participants in Tennessee—both the number of students who
have attended state-funded Pre-K from 1998-1999 to 2005-2006 as well as their demographic characteristics.
• Proposed methodology including a sampling plan and analytical approach for
addressing the evaluation’s two primary research questions.
Data Sources
In order to assess the effectiveness of Tennessee’s Pre-Kindergarten program, SRG will primarily draw from three data sources: 1) Pre-Kindergarten demographic data, 2) Education Information System (EIS) student demographic data, and 3) K-12 student assessment data. The following discussion provides a general description of these three data sources.
1. Pre-Kindergarten Demographic File
The Pre-Kindergarten (Pre-K) demographic file is a database maintained by the TDOE’s Office of Early Learning containing information about Pre-K students. It was provided to SRG via the Director of Data Quality for the TDOE. The database spans eight academic years from 1998-1999 to 2005-2006. Starting with the 2006-2007 school year, information about Pre-K students is included in the Education Information System (for more information about the EIS, see the following section).
The Pre-K database contains information on the school (including county, system/LEA, and school/provider name), program information (e.g., Pre-K funding source), and student demographic information (including encrypted student Social Security Number (SSN), date of birth, gender, race, Free and Reduced Price Lunch (FRPL) status, special education status, whether English is the student’s native language, and whether the school provided transportation). Although information is not available for all variables for all years in the Pre-K demographic file, the most important function of this data source is to identify students who participated in Tennessee’s Voluntary Pre-K Program since 1998-1999 through 2005-2006.
To protect student confidentiality and to comply with federal regulations regarding student FRPL status, SRG did not obtain student names or Social Security Numbers.
2. Education Information System Data
The Education Information System (EIS) is a web-based data repository containing a wealth of student, teacher, school, and district level information. This database is advantageous in that there is a standardized format for all schools to input information and the EIS system is designed to catch data entry errors. EIS data is available beginning with the 2005-2006 school year. EIS includes data for prior school years; however, SRG was told that this data is not complete and the state-assigned student ID number was only implemented in 2005-2006.
16
SRG has thus far obtained EIS data for the 2005-2006 school year which will allow us to analyze the first five cohorts of Pre-K students included in the First Interim Report (due October 28, 2007).5 EIS files were provided to SRG by the TDOE Director of Data Quality. The data is in the form of spreadsheets that include demographic information, attendance records, disciplinary records, and special education records. EIS contains data for students in Kindergarten through 12th grade, and for Pre-K students beginning in 2006-2007. SRG did not obtain data for students in grades 7-12 as they are not needed for the present evaluation.
Student information contained in the EIS is more robust than the Pre-K demographic file; not all demographic variables were collected in the Pre-K records for all years. Because EIS data is more complete, EIS student demographic data will be merged with the information contained in the Pre-K demographic file. Merging these two data sources will provide us the ability to obtain important student information that is missing in the Pre-K demographic file—for example, information on student gender and race that was not included for Pre-K students from 1998-1999 through 2000-2001.
Some assumptions are required when dealing with the EIS data in its current form. It is important to note that comparisons of outcomes for Pre-K and non-Pre-K students will start with assessment results from the 1999-2000 school year, yet complete EIS information is not available for students prior to 2005-2006. The implication is that any demographic information for students (and particularly for the non-Pre-K students, for whom there is no database comparable to the Pre-K demographic file) from 1999-2000 through 2001-2002 will have to be inferred from information reported in a later year. This is not an issue when examining student characteristics that do not change over time, such as gender and race. There are potential issues, though, with characteristics that can change over time. For example, a student may have received FRPL status for the first time in 2001-2002, but complete student information for that particular school year is not available. Fortunately, FRPL status is maintained for additional years in other databases; it is available with student assessment data beginning in 2002-2003 and EIS data beginning in 2005-2006. Still, changes in student FRPL status cannot be conclusively determined, retrospectively, for each school year being analyzed in the present study. 6
The inclusion of FRPL status in the present analysis outweighs potential problems associated with retroactively identifying students based on their status in years prior to 2002-2003. Further, even though FRPL status may change over time, it is also feasible that it is fairly constant for many students. Fortunately, this is a possibility that can be examined at the conclusion of the study, when EIS data from 2005-2006 through 2008-2009 are available. Examining trends in change in FRPL status over several consecutive years will provide a better sense of the degree of stability in this characteristic; any necessary adjustments can be made at that time.
5 As of the writing of this report, SRG has also received preliminary EIS data for 2006-2007 for use in subsequent analyses and reports. 6 Again, this is not to say that student FRPL information is not collected and verified at the local level; this information simply has not been maintained in a statewide dataset suitable for longitudinal data analysis for all years included in the present evaluation.
17
3. K-12 Student Assessment Data
The third data source available for this evaluation is standardized assessment scores for students. These files were provided to us by the TDOE Assessment, Evaluation, and Research Division via the Department’s Director of Data Quality. SRG requested and received scores for the 1999-2000 through 2005-2006 school years. SRG will obtain scores for future years as they become available and necessary for subsequent stages in the analysis.
The files contain: 1) demographic characteristics of students and 2) test scores in the following subject areas: reading/language arts, mathematics, science, and social studies, along with composite scores by academic year. Assessment data will be merged with the Pre-K and EIS data sources to examine the short- and long-term impact of Pre-K participation.
There are a few data considerations, however, that will need to be addressed. First, LEAs are not required to conduct assessment tests in grades K-2, and the decision whether to do so varies from year to year. As a result, there is a large amount of missing data for students in these grades. Additionally, because the decision to test in grades K-2 is largely budget-driven (LEAs must absorb the costs of these assessments), the samples of students for whom assessments are available in these grades are likely to be biased toward Pre-K programs and elementary schools with larger budgets. These issues make evaluating the short-term effectiveness of Pre-K using assessment scores challenging. As discussed later, however, assessment scores are just one outcome to be examined, so these challenges do not preclude a thorough investigation of the effects of Pre-K.
A second issue involves the nature of the tests administered to students. Two different types of tests, norm-referenced and criterion-referenced, are used depending on school year and grade level. These two tests differ in content and purpose. Specifically, norm-referenced tests measure broad skill areas sampled from a variety of textbooks, syllabi, and the judgments of curriculum experts, and rank each student with respect to the achievement of other students. Criterion-referenced tests, on the other hand, measure specific skills which make up a designated curriculum as identified by teachers and curriculum experts, and assess whether each student has achieved specific skills or concepts. Interpretation of scores also differs: for norm-referenced tests, students are compared with other test takers and then assigned a score, whereas for criterion-referenced tests, students are compared with a pre-determined standard for acceptable achievement irrespective of the performance of other test takers.7
From 1999-2000 to 2001-2002, districts administered norm-referenced tests to students in all grades. Starting in 2002-2003, norm-referenced tests are given for students in grades K-2 whereas criterion-referenced tests are conducted for grades 3-5. That students are administered two qualitatively different types of tests should not pose a problem, however, given that the state of Tennessee has requested an evaluation of the short-term (grades K-2) and long-term (grades 3-5) effectiveness of the Pre-K program. SRG proposes to analyze the results of these two types of assessments separately. If there is consensus amongst the
7 Huitt, W. (1996). Measurement and evaluation: Criterion- versus norm-referenced testing. Educational Psychology Interactive. Valdosta State University. Retrieved July 13, 2007 from http://chiron.valdosta.edu/whuitt/col/measeval/crnmref.html.
18
experts on the Advisory Committee that norm- and criterion-referenced test scores are, in fact, comparable and should be analyzed differently, SRG will revisit the issue.
Third, the 2002-2003 tests for grades 3-8 included only reading and language arts and math. From 2003-2004 on, tests cover all four areas (i.e., reading and language arts, math, social studies, and science). As such, composite scores across years will not be comparable. Area-specific scores will still be comparable, however.
It should also be noted that the scaling of the criterion-referenced scores changed between 2002-2003 and 2003-2004. However, SRG was provided information from the Assessment, Evaluation, and Research Division on how to transform 2002-2003 scores to 2003-2004 scores, so this will not pose any problems for comparability across years.
Merging Data Sources: The Issue of Student Identifiers
The data merging process requires every student have a unique identifier. For individual-level data, the most reliable unique identifier is Social Security Number (SSN). Unfortunately, the TDOE could not provide this information to SRG in conjunction with FRPL status at the individual student level, due to strict privacy laws mandated by the Federal School Lunch Act. Because SRG is not contracted through the TDOE it was not appropriate for them to release to us any individuating information associated with FRPL status (i.e., names, SSN, etc.).
To enable SRG to have access to the data necessary for our analysis while still maintaining compliance with the Federal School Lunch Act, the Director of Data Quality for the TDOE proposed a mechanism by which the TDOE could provide SRG an encoded identifier to enable us to match across various data sets. The process entailed removing student names from all files and encrypting students’ SSNs. This meant that TDOE staff created a new, confidential identifier that they would be able to link back to the original student records in their system. They provided the same (encrypted) identifier for both EIS data and assessment data files. They also obtained the Pre-K attendance files from the Office of Early Learning and used the EIS data to insert the current (2005-2006) FRPL status for all Pre-K attendees. The matching of records across the various datasets (Pre-K, EIS, and assessment) was then done by SRG using the encrypted student social security numbers (ESSNs). This process was extremely effective in protecting student confidentiality while enabling us to have a common identifier across various data sources.
It is important to note that even after these efforts, there are 2,432 students (11.5%) in the Pre-K data set without a unique student identifier (i.e. an ESSN). Not surprisingly, there are proportionately fewer students without an ESSN in more recent years. For this preliminary report, we will include these students when reporting demographic information for Pre-K participants (i.e., sex, race, and so on). However, because cases missing a unique identifier cannot be merged with EIS or assessment data, it will not be possible to include these students in any other later analyses.
Preliminary Data Management and Analysis
The bulk of the data management and analysis thus far has been conducted on the Pre-K demographic file, as SRG was provided this data source first (on May 18, 2007). The following discussion outlines the procedures used to clean the Pre-K demographic file, the issues encountered, and solutions devised.

19
Managing the Data
The Pre-K demographic file that was provided to SRG needed to be reviewed and formatted in preparation for analysis. This was done in consultation with the Office of Early Learning and the Director of Data Quality.
One reason the data needed to be reviewed and formatted was to remove duplicate records from the data set. Duplicate records occur when the same student is listed more than once, as indicated by the ESSN. It is important that each student have only one record in the dataset to ensure the accuracy of the demographic descriptive information as well as any inferences drawn from the data. Additionally, a dataset cannot be merged with another dataset if there is even one case (student) with multiple records.
There were a total of 5,798 (23.5%) duplicate records in the Pre-K files SRG received. In the majority of instances, students had duplicate records because: 1) they were enrolled in Pre-K for two consecutive academic years (i.e., at age 3 and age 4) and/or 2) they changed schools in the same academic year. So, in most instances duplicate records do not imply data entry errors.
For students who were in Pre-K programs for two consecutive academic years, the latter year of attendance was removed, leaving the earliest academic year of attendance. When demographic information was missing from this record (such as gender, race, etc.), information from the duplicate record was input, whenever possible. Additionally, a new variable was created indicating that the student had attended the Pre-K program in two consecutive years.
Although the majority of students with duplicate records appear in the dataset twice, 196 students were enrolled in Pre-K for three consecutive years. SRG consulted the Executive Director of the Office of Early Learning and the Director of Data Quality and was informed that this was most likely the result of data entry errors. To ensure that these were in fact errors, the Director of Data Quality and the Office of Early Learning examined these cases. They provided SRG with corrected entries, when possible, and in the cases where entries could not be corrected, the erroneous entries were removed from the dataset.
Additionally, there was a small number of duplicate records (less than 2% of all records) that contained inconsistent information; for example, a student might have a different date of birth, race, and/or gender in two records. Because there was no way to determine which record is correct, these students were removed from the dataset. When possible, however, these students’ information will be checked against their record in the EIS system, and students for whom correct information can be obtained will be added back into the dataset for analysis.
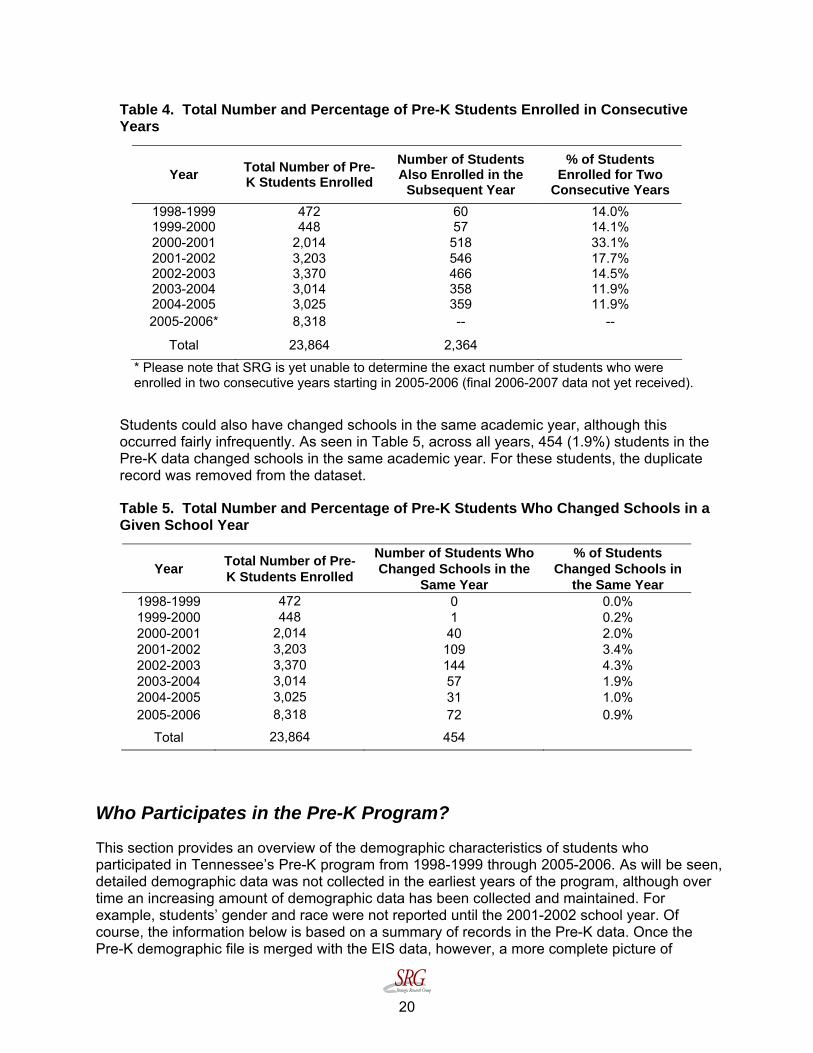
Given all these efforts to prepare the data for analysis, Table 4 summarizes the total number of students enrolled in Pre-K for each academic year, the number of students also enrolled in the subsequent school year, and the percentage of students who were enrolled in two consecutive years (i.e., the number attending at both age 3 and 4).
20
Table 4. Total Number and Percentage of Pre-K Students Enrolled in Consecutive Years
Year Total Number of Pre-K Students Enrolled
Number of Students Also Enrolled in the
Subsequent Year
% of Students Enrolled for Two
Consecutive Years 1998-1999 472 60 14.0% 1999-2000 448 57 14.1% 2000-2001 2,014 518 33.1% 2001-2002 3,203 546 17.7% 2002-2003 3,370 466 14.5% 2003-2004 3,014 358 11.9% 2004-2005 3,025 359 11.9% 2005-2006* 8,318 -- --
Total 23,864 2,364
* Please note that SRG is yet unable to determine the exact number of students who were enrolled in two consecutive years starting in 2005-2006 (final 2006-2007 data not yet received).
Students could also have changed schools in the same academic year, although this occurred fairly infrequently. As seen in Table 5, across all years, 454 (1.9%) students in the Pre-K data changed schools in the same academic year. For these students, the duplicate record was removed from the dataset.
Table 5. Total Number and Percentage of Pre-K Students Who Changed Schools in a Given School Year
Year Total Number of Pre-K Students Enrolled
Number of Students Who Changed Schools in the
Same Year
% of Students Changed Schools in
the Same Year 1998-1999 472 0 0.0% 1999-2000 448 1 0.2% 2000-2001 2,014 40 2.0% 2001-2002 3,203 109 3.4% 2002-2003 3,370 144 4.3% 2003-2004 3,014 57 1.9% 2004-2005 3,025 31 1.0% 2005-2006 8,318 72 0.9%
Total 23,864 454
Who Participates in the Pre-K Program?
This section provides an overview of the demographic characteristics of students who participated in Tennessee’s Pre-K program from 1998-1999 through 2005-2006. As will be seen, detailed demographic data was not collected in the earliest years of the program, although over time an increasing amount of demographic data has been collected and maintained. For example, students’ gender and race were not reported until the 2001-2002 school year. Of course, the information below is based on a summary of records in the Pre-K data. Once the Pre-K demographic file is merged with the EIS data, however, a more complete picture of
21
student characteristics will be available. The preliminary analysis below only summarizes information contained in the Pre-K demographic file.
Pre-K Student Demographic Characteristics
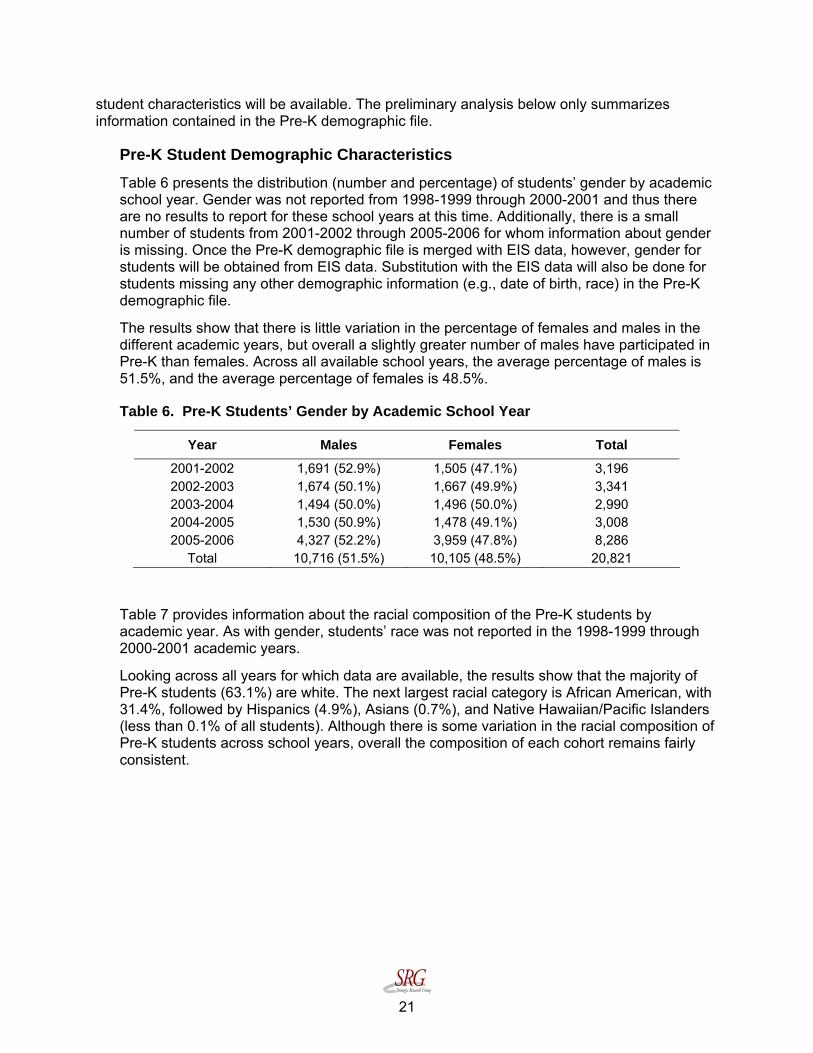
Table 6 presents the distribution (number and percentage) of students’ gender by academic school year. Gender was not reported from 1998-1999 through 2000-2001 and thus there are no results to report for these school years at this time. Additionally, there is a small number of students from 2001-2002 through 2005-2006 for whom information about gender is missing. Once the Pre-K demographic file is merged with EIS data, however, gender for students will be obtained from EIS data. Substitution with the EIS data will also be done for students missing any other demographic information (e.g., date of birth, race) in the Pre-K demographic file.
The results show that there is little variation in the percentage of females and males in the different academic years, but overall a slightly greater number of males have participated in Pre-K than females. Across all available school years, the average percentage of males is 51.5%, and the average percentage of females is 48.5%.
Table 6. Pre-K Students’ Gender by Academic School Year
Year Males Females Total
2001-2002 1,691 (52.9%) 1,505 (47.1%) 3,196 2002-2003 1,674 (50.1%) 1,667 (49.9%) 3,341 2003-2004 1,494 (50.0%) 1,496 (50.0%) 2,990 2004-2005 1,530 (50.9%) 1,478 (49.1%) 3,008 2005-2006 4,327 (52.2%) 3,959 (47.8%) 8,286
Total 10,716 (51.5%) 10,105 (48.5%) 20,821
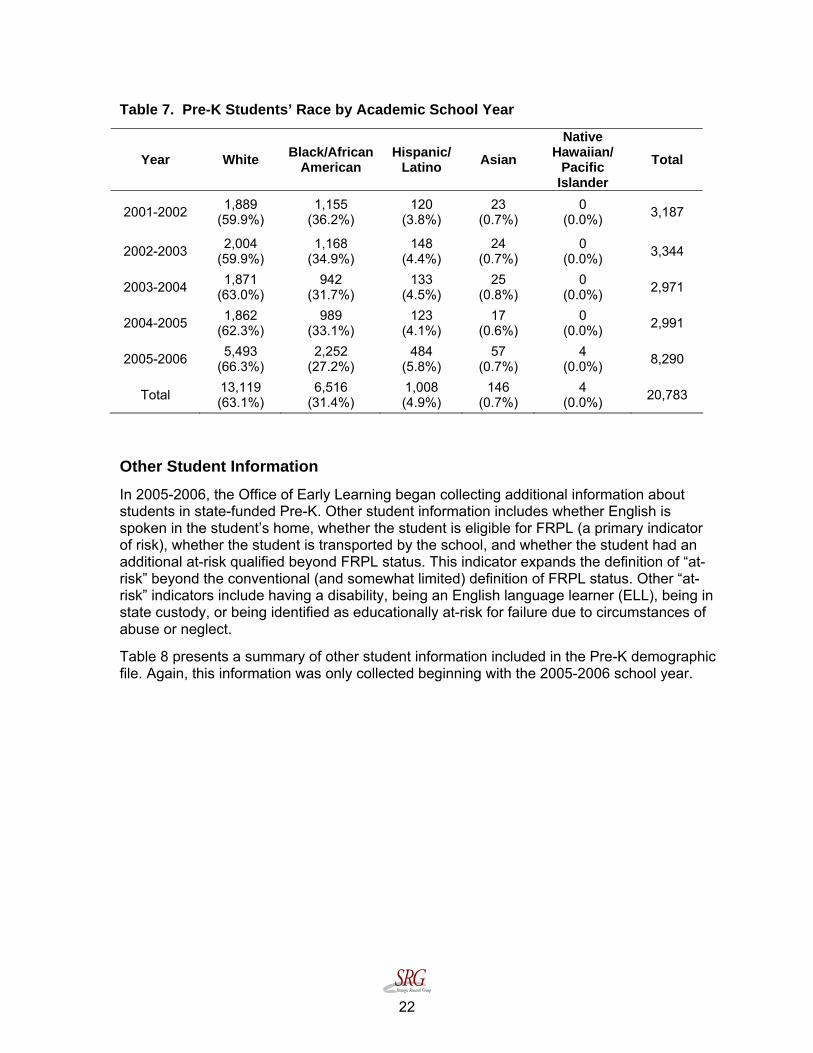
Table 7 provides information about the racial composition of the Pre-K students by academic year. As with gender, students’ race was not reported in the 1998-1999 through 2000-2001 academic years.
Looking across all years for which data are available, the results show that the majority of Pre-K students (63.1%) are white. The next largest racial category is African American, with 31.4%, followed by Hispanics (4.9%), Asians (0.7%), and Native Hawaiian/Pacific Islanders (less than 0.1% of all students). Although there is some variation in the racial composition of Pre-K students across school years, overall the composition of each cohort remains fairly consistent.
22
Table 7. Pre-K Students’ Race by Academic School Year
Year White Black/African American
Hispanic/ Latino Asian
Native Hawaiian/
Pacific Islander
Total
2001-2002 1,889 (59.9%)
1,155 (36.2%)
120 (3.8%)
23 (0.7%)
0 (0.0%) 3,187
2002-2003 2,004 (59.9%)
1,168 (34.9%)
148 (4.4%)
24 (0.7%)
0 (0.0%) 3,344
2003-2004 1,871 (63.0%)
942 (31.7%)
133 (4.5%)
25 (0.8%)
0 (0.0%) 2,971
2004-2005 1,862 (62.3%)
989 (33.1%)
123 (4.1%)
17 (0.6%)
0 (0.0%) 2,991
2005-2006 5,493 (66.3%)
2,252 (27.2%)
484 (5.8%)
57 (0.7%)
4 (0.0%) 8,290
Total 13,119 (63.1%)
6,516 (31.4%)
1,008 (4.9%)
146 (0.7%)
4 (0.0%) 20,783
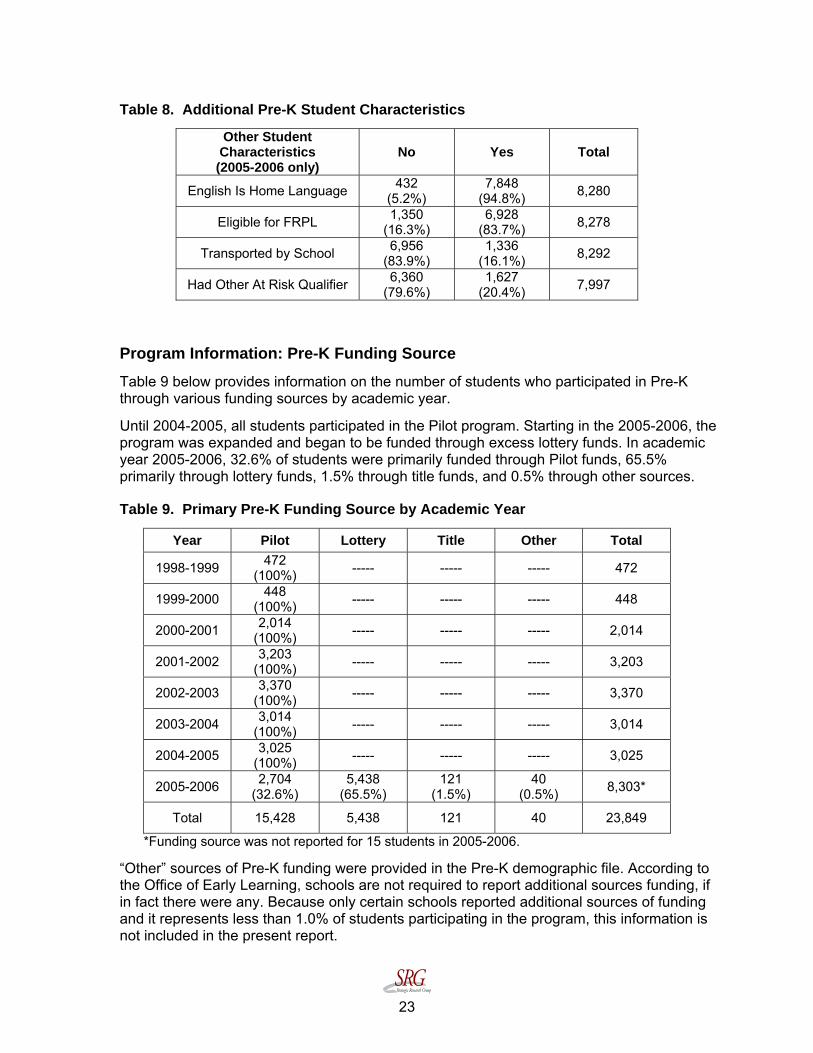
Other Student Information
In 2005-2006, the Office of Early Learning began collecting additional information about students in state-funded Pre-K. Other student information includes whether English is spoken in the student’s home, whether the student is eligible for FRPL (a primary indicator of risk), whether the student is transported by the school, and whether the student had an additional at-risk qualified beyond FRPL status. This indicator expands the definition of “at-risk” beyond the conventional (and somewhat limited) definition of FRPL status. Other “at-risk” indicators include having a disability, being an English language learner (ELL), being in state custody, or being identified as educationally at-risk for failure due to circumstances of abuse or neglect.
Table 8 presents a summary of other student information included in the Pre-K demographic file. Again, this information was only collected beginning with the 2005-2006 school year.
23
Table 8. Additional Pre-K Student Characteristics
Other Student Characteristics (2005-2006 only)
No Yes Total
English Is Home Language 432 (5.2%)
7,848 (94.8%) 8,280
Eligible for FRPL 1,350 (16.3%)
6,928 (83.7%) 8,278
Transported by School 6,956 (83.9%)
1,336 (16.1%) 8,292
Had Other At Risk Qualifier 6,360 (79.6%)
1,627 (20.4%) 7,997
Program Information: Pre-K Funding Source
Table 9 below provides information on the number of students who participated in Pre-K through various funding sources by academic year.
Until 2004-2005, all students participated in the Pilot program. Starting in the 2005-2006, the program was expanded and began to be funded through excess lottery funds. In academic year 2005-2006, 32.6% of students were primarily funded through Pilot funds, 65.5% primarily through lottery funds, 1.5% through title funds, and 0.5% through other sources.
Table 9. Primary Pre-K Funding Source by Academic Year
Year Pilot Lottery Title Other Total
1998-1999 472 (100%) ----- ----- ----- 472
1999-2000 448 (100%) ----- ----- ----- 448
2000-2001 2,014 (100%) ----- ----- ----- 2,014
2001-2002 3,203 (100%) ----- ----- ----- 3,203
2002-2003 3,370 (100%) ----- ----- ----- 3,370
2003-2004 3,014 (100%) ----- ----- ----- 3,014
2004-2005 3,025 (100%) ----- ----- ----- 3,025
2005-2006 2,704 (32.6%)
5,438 (65.5%)
121 (1.5%)
40 (0.5%) 8,303*
Total 15,428 5,438 121 40 23,849
*Funding source was not reported for 15 students in 2005-2006.
“Other” sources of Pre-K funding were provided in the Pre-K demographic file. According to the Office of Early Learning, schools are not required to report additional sources funding, if in fact there were any. Because only certain schools reported additional sources of funding and it represents less than 1.0% of students participating in the program, this information is not included in the present report.
24
Methodology: Assessing the Impact of the Pre-K Program The proceeding section outlines SRG’s proposed methodology in assessing the impact of the Pre-K program, including the sampling strategy and statistical analyses. SRG would like to mention, however, that the proposed methodology presented here might change after consulting with our Advisory Committee on the effectiveness of this approach. Also, we may need to make adjustments to the analysis plan after merging the three data sources and becoming more familiar with the data.
Sampling Strategy for Pre-K Students and Non-Pre-K Students
In order to evaluate the short- and long-term impact of Pre-K on student outcomes, Pre-K students must be compared to a similar group of students that did not attend Tennessee’s Pre-K program. SRG’s sampling plan is outlined below.
Pre-K Students
As Table 1 illustrates, there were relatively small numbers of Pre-K students in the first three cohorts (1998-1999 through 2000-2001); over time, however, the cohort sizes increased substantially. In order to achieve an adequate number of observations for the first three cohorts, all students in the Pre-K demographic file will be included, with two exceptions: students without an ESSN and students who do not appear in the 2005-2006 EIS file will not be included in the sample. This second exclusion criteria is necessary given that students’ FRPL status was not maintained in the Pre-K demographic file nor was it included in the EIS until the 2005-2006 school year; thus, FRPL status for students in school years 1998-1999 through 2004-2005 must be inferred from other sources.8 Taking into account the initial small cohort sizes and necessary exclusions, we anticipate that the first three cohorts of Pre-K students will be fairly small; the exact number of students in each cohort will be determined after the three data sources are merged.
Due to the larger cohort sizes starting with the 2001-2002 academic year, SRG recommends taking a random sample of Pre-K students from each cohort. We propose extracting a sample of Pre-K students because statistically, the inclusion of all Pre-K students is not necessary in order to perform the analyses. In fact, in inferential statistics very large samples can be problematic because the results can be more of an indicator of sample size rather than substantive findings.
In determining the appropriate number of students to sample, it is imperative that two major methodological issues are accounted for. First, one must ensure the number of observations included in the analyses is of sufficient size.9 There is no hard-and-fast rule, however, as to what constitutes “sufficient” (Frankfort-Nachmias and Leon-Guerrero 200610), although there
8 Because student FRPL eligibility is not maintained in all data sources for all years under study in this evaluation, student FRPL status will be inferred using information from the 2005-2006 EIS data or from assessment records for academic years 2002-2003 and later. 9 It should be noted that this minimum sufficient number of observations implies a final number of students, after taking into account exclusion criterion and missing data. 10 Frankfort-Nachmias, Chava and Anna Leon-Guerrero. 2006. Social Statistics for a Diverse Society, 4th ed. Thousand Oaks: Pine Forge Press.
25
are guidelines for sample size depending on the type of analysis to be performed and the number of additional variables to be examined. Second, the sample must be large enough so that sub-groups that are proportionately small in the population are represented in sufficient numbers in the sample. For this evaluation, for example, it is important to have a sufficient number of racial minorities in each cohort sample. For the current study, a beginning sample of 1,000 students from each cohort should ensure a sufficient number of cases (overall and for specific sub-groups) and a sufficient degree of statistical power for subsequent analyses. It is possible, however, that the sample size may need to be increased for some cohorts to ensure adequate representations of subgroups.
Additionally, each sample of Pre-K students will be comprised of those who began Kindergarten in the same school year. That is, although three- and four-year-olds may have entered into the Pilot Pre-K program during the same year, they will be considered to be in two different Kindergarten cohorts. SRG has identified students who attended Pre-K for two years (age three and four in the Pilot Pre-K program) and will include this as a variable in later analyses.
Non Pre-K Attendees
As previously mentioned, all samples of non-Pre-K students from the 1999-2000 through 2005-2006 school years will be obtained from the 2005-2006 EIS files. Fortunately, there are more than sufficient numbers of students who did not attend Pre-K available for inclusion in the comparison group. Because the EIS files contain information for all students in the Tennessee public education system, for all cohorts SRG will randomly select 1,000 non-Pre-K students from the EIS files. This approach will yield roughly equivalent sample sizes for the Pre-K and non-Pre-K groups, with the exception Kindergarten cohorts of 1999-2000 and 2000-2001, in which the Pre-K groups will be smaller. The discrepancy in group size between these cohorts, however, will not impact any statistical analyses or hinder comparability between the Pre-K and non-Pre-K groups.
SRG will employ proportional probability sampling to ensure that each cohort sample of non-Pre-K students proportionally resembles each cohort of Pre-K students with regard to important student characteristics (gender, race, FRPL status, and special education status). Specifically, the samples of non-Pre-K students will be randomly selected in a manner such that they have roughly equal percentages of males/females, racial groups, eligibility for FRPL, and special education status as their respective Pre-K cohort groups. This sampling strategy will ensure that the groups are as comparable as possible and any significant differences that might emerge between the Pre-K and non-Pre-K groups are not due to compositional differences between the two groups.
Although the EIS is a rich source of data for student demographic information, it is a limitation that incomplete data exists for non-Pre-K students prior to the 2005-2006 school year. Thus, samples for non-Pre-K cohorts in the 1999-2000 through 2004-2005 school years will be obtained using the 2005-2006 EIS data. This means that, for example, the sample of non-Pre-K students who were Kindergarteners in 1999-2000 will be drawn from the population of sixth grade students in the 2005-2006 EIS data; the Kindergarteners in 2000-2001 will be drawn from the population of fifth grade students, and so on.
One disadvantage of this approach is that variables that have the potential to change from year to year (for example, school, district, or teacher information) cannot be determined and thus cannot be analyzed. However, FRPL status and special education status will be inferred from other data sources (2005-2006 EIS data or assessment data after 2002-2003) because they are such critical pieces of information. Fortunately, from 2005-2006 on, EIS

26
data will be available for each cohort so over time additional analyses on variables that change each year may become possible.
Another important limitation is that there is no way to determine conclusively whether a student selected for the non-Pre-K group did not, in fact, attend a preschool program. We can only determine that the non-Pre-K students did not attend state-funded preschool in Tennessee. It is possible that some students in the non-Pre-K group attended some form of preschool. However, random selection of students into the non-Pre-K should minimize the potential threat to internal validity posed by this issue.
Proposed Analytical Approach for Research Question 1
The first research question this evaluation will address is: Do students who attend state-funded Pre-K have higher short and long-term academic achievement than students who do not attend state-funded Pre-K programs? Academic achievement can be measured in a number of ways, including achievement test scores, grade retention, attendance, and disciplinary problems. The following section will provide an overview for how each of these measures will be used to address the research question.
Although multiple measures of academic achievement will be examined in the study, the main outcome of interest will be achievement test scores (TCAPS). For each year, these scores will be converted into percentiles.11 Standardizing test scores is necessary in order to be able to compare scores across grade levels, because students took different types of tests (i.e. criterion- and norm-referenced tests) in different years and in different grades. Further, the scores for the norm-referenced tests were rescaled between 2002-2003 and 2003-2004. By converting the scores into percentiles, then, we are able to overcome these challenges to comparability between the various assessments.
Short-term Effect of Pre-K on Assessment Test Scores
As indicated in the research question, SRG will examine both the short- and long-term effects of Pre-K. “Short term” refers to Kindergarten through the second grade. To empirically test the short-term effect, SRG proposes using mixed-model Analysis of Variance (ANOVA) for each cohort and each year. Each cohort will be analyzed separately. This type of analysis will allow us to test for changes in the repeated measure (student test scores) as well as whether there is a statistically significant difference in the mean assessment scores for the Pre-K students and non-Pre-K students controlling for gender, race, or other individual difference variables.
Substantively, this test will investigate whether at-risk students who participate in Pre-K ultimately perform better on assessments than a similar group of their at-risk peers. This analysis will also investigate whether there are certain subgroups of Pre-K students who are more likely to benefit from participation in Pre-K. By comparing different groups of Pre-K and non-Pre-K participants, we can discern whether there are different patterns in academic achievement that emerge over time.
11 Converting test scores into percentiles is one way to standardize the test scores. Test scores can also be standardized through z-scores. However, z-scores lack the more concrete interpretation that percentiles have.
27
It is important to note that we will be somewhat limited in our ability to assess the short-term effect of the Pre-K program using assessment scores. As mentioned previously, there is a large amount of missing data for students in grades K-2 across all years because LEAs are not required to conduct assessment tests in these grades. Analyzing data for students who started Kindergarten in the 1999-2000 and 2000-2001 school years may be especially problematic, given the very small number of students in the initial years of the Pre-K program. However, this does not preclude an evaluation of the short-term impact of the Pre-K program because academic achievement will be measured by additional factors other than assessment scores. Still, depending on the actual pattern of missing data in K-2 assessments, there may be some resulting problems with generalizeability, or the extent to which the results can be generalized to students attending grades K-2 in other schools and districts where these assessments are not administered. We can attempt to control for relevant district-level characteristics in this analysis (such as total enrollment in the district or district annual budget), but ultimately generalizeability depends on the pattern we will ultimately observe in missing data among students in grades K-2.
Long-term Effect of Pre-K on Assessment Test Scores
To assess the effect of Pre-K on long-term academic achievement (third, fourth, and fifth grades), SRG will employ change score regression. In change score regression, the dependent variable (i.e., the outcome of interest) is the change in test scores from the last academic year (grade 5) to the first academic year (grade 3), where test scores are standardized into percentiles. The result provides the change in test scores over time.
Several important variables have been consistently shown to predict performance on standardized test scores (Henry, Gordon, Henderson, and Ponder, 200312). These variables include gender, race, economic disadvantage (as indicated by FRPL status), and special education status. These variables, along with interactions between these variables, will be included in the model to control for the effects of these characteristics on student outcomes. Examining interactions will allow us to evaluate if there are differential effects of participation in Pre-K depending on gender, race, special education status, or FRPL status. That is, this analysis will reveal whether there are different patterns of student outcomes for students with different characteristics. For example, do African-American female students tend to have different outcomes than other groups of female students?
The change in student test scores will be assessed for all years’ data for each cohort of students. This will allow us to measure the amount of change over time that is associated with either participating or not participating in Pre-K, holding constant other important variables, such as gender, race, FRPL status, and special education status.13
12 Henry, Gary T., Craig S. Gordon, Laura W. Henderson, and Bentley D. Ponder. 2003. “Georgia Pre-K Longitudinal Study: Final Report 1996-2001.” Last accessed July 13, 2007. http://aysps.gsu.edu/publications/GPKLSFinalReportMay2003.pdf 13 For the regression analyses, student test scores (in percentiles) at the previous time period (t-1) will be entered into the regression models to control previous test scores. One problem we are likely to encounter by including test scores from the previous time period is heteroskedasticity. However, we will statistically correct for this in the model. In multivariate regression, heteroskedasticity is defined as an unequal variance in regression errors and can cause biased estimates.
28
In sum, change score regression will allow us to answer the question: taking into account a student’s previous test scores, what is the change in test scores over time that can be attributed to Pre-K participation?
Additional Outcomes
Achievement test are commonly used to measure the effect of Pre-K programs (Gilliam and Zigler, 2004;14 McCaffrey, Lockwood, Koretz, Lousi, and Hamilton 200415); however, other studies have found that participation in Pre-K programs may impact other important outcomes, such as attendance, behavioral problems (i.e. disciplinary problems), and grade retention (Gilliam and Zigler, 2004; McCaffrey et al. 2004).
All of the aforementioned outcomes are contained in the EIS data and thus can be included in the study. An examination of several outcomes will result in a much more comprehensive evaluation of the impact of Tennessee’s Pre-Kindergarten program. Because the EIS data files begin with the 2005-2006 school year and the first interim report covers the years prior to 2005-2006, the first interim report will not include these additional outcomes; they will, however, be included in the subsequent reports.
Proposed Analytical Approach for Research Question 2
The second research question this evaluation will address is: For those students who do attend state-funded Pre-K, what programmatic characteristics are related to higher short- and long-term academic achievement? To answer this question, analyses will be limited only to students participating in the Pre-K program. Analyses will test the effect that Pre-K program characteristics have on Pre-K student outcomes year-by-year and over time. The primary program characteristics to be investigated in this analysis include:
1. Size of the program both at the Local Education Agency (LEA)-level and classroom-level (i.e. number of students enrolled, number of free or reduced price lunch-eligible students/at-risk students, number of sites/classrooms, and/or number of teachers).
2. Teacher credentials/experience.16 3. Geographic location (i.e. region of the state and urban/rural/suburban locations) 4. Program type (i.e. Pilot, General fund/Lottery). 5. For students participating in the Pilot program, the impact of two consecutive years of
Pre-K participation. 6. Type of program/structure (i.e. collaborative versus school-based site, number of days
the program served children, hours of training offered; results of family survey).
SRG proposes using these program-level characteristics to test their effect on academic achievement for every year, every cohort, and over time using regression analysis. Regression analysis will include “nesting” students within LEAs and schools in order to reveal program and
14 Gilliam, Walter S. and Edward F. Zigler. 2004. “State Efforts to Evaluate the Effects of Prekindergarten: 1977 to 2003.” Last accessed July 13, 2007. http://nieer.org/resources/research/StateEfforts.pdf 15 McCaffrey, Daniel F., J.R. Lockwoods, Daniel Koretz, Thomas A. Louis, and Laura Hamilton. 2004. “Models for Value-Added Modeling of Teacher Effects.” Journal of Educational and Behavioral Statistics 29(1):67-101. 16 Teacher characteristics will be aggregated to the program (LEA and/or provider) level. Teacher experience is a new variable being collected starting in the 2007-2008 program year.
29
school effects on student outcomes. As with Research Question 1, all analyses will control for important student-level variables (i.e., gender, race, FRPL status, and special education status). In other words, the analysis will determine whether there are differential effects of participation in certain types of Pre-K programs, depending on student and program characteristics. For example, do certain types of students benefit more from participating in certain types of programs?
The Office of Early Learning may collect new program-level information during the course of this evaluation, and if that information may be beneficial to include in this analysis, SRG will work with TDOE to obtain and incorporate that information.
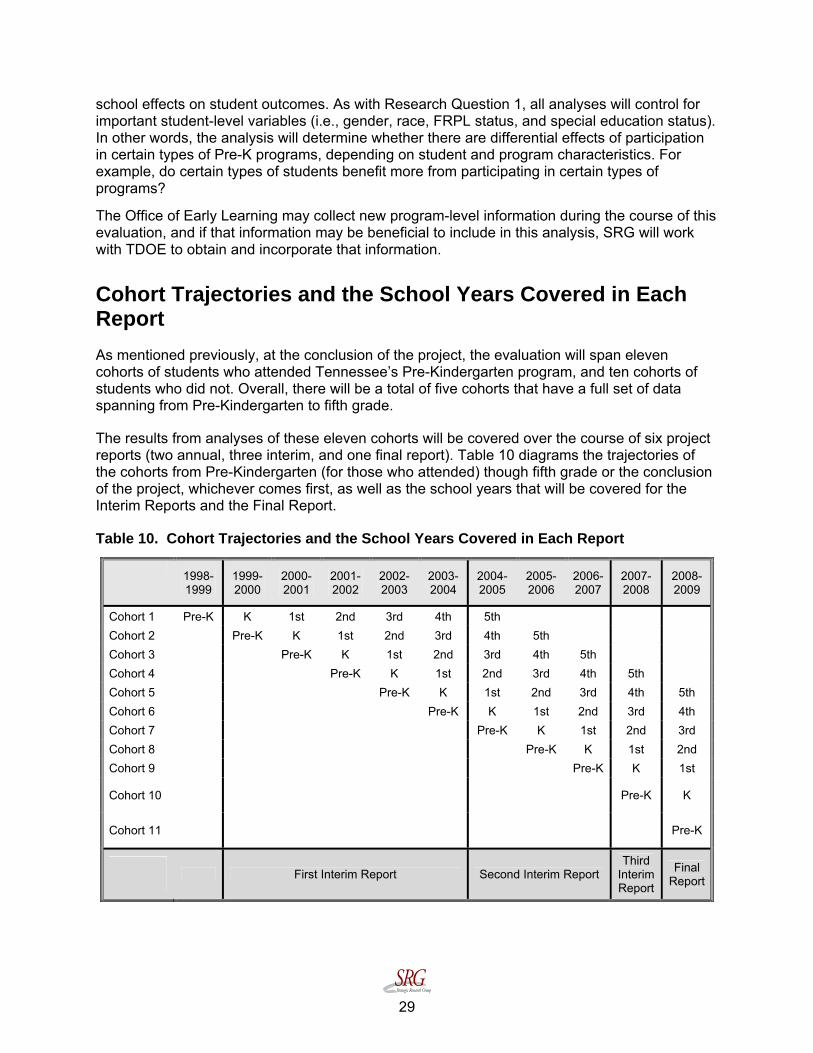
Cohort Trajectories and the School Years Covered in Each Report As mentioned previously, at the conclusion of the project, the evaluation will span eleven cohorts of students who attended Tennessee’s Pre-Kindergarten program, and ten cohorts of students who did not. Overall, there will be a total of five cohorts that have a full set of data spanning from Pre-Kindergarten to fifth grade.
The results from analyses of these eleven cohorts will be covered over the course of six project reports (two annual, three interim, and one final report). Table 10 diagrams the trajectories of the cohorts from Pre-Kindergarten (for those who attended) though fifth grade or the conclusion of the project, whichever comes first, as well as the school years that will be covered for the Interim Reports and the Final Report.
Table 10. Cohort Trajectories and the School Years Covered in Each Report
1998-1999
1999-2000
2000-2001
2001-2002
2002-2003
2003-2004
2004-2005
2005-2006
2006-2007
2007-2008
2008-2009
Cohort 1 Pre-K K 1st 2nd 3rd 4th 5th Cohort 2 Pre-K K 1st 2nd 3rd 4th 5th Cohort 3 Pre-K K 1st 2nd 3rd 4th 5th Cohort 4 Pre-K K 1st 2nd 3rd 4th 5th Cohort 5 Pre-K K 1st 2nd 3rd 4th 5th Cohort 6 Pre-K K 1st 2nd 3rd 4th Cohort 7 Pre-K K 1st 2nd 3rd Cohort 8 Pre-K K 1st 2nd Cohort 9 Pre-K K 1st
Cohort 10 Pre-K K
Cohort 11 Pre-K
First Interim Report Second Interim Report Third
Interim Report
Final Report
30
As Table 10 illustrates, the First Interim Report will span the school years from 1999-2000 through 2003-2004. For this first report SRG will examine the short-term effectiveness of Pre-K program participation for three full cohorts and two partial cohorts. We will also present descriptive information for students in the Pre-K program in 1998-1999 and 2003-2004. There will be limited ability to fully assess the long-term effectiveness of Pre-K until the Second Interim Report, although the First Interim Report with include some preliminary analysis for Cohort 1 students, as they will have assessment data for the third and fourth grades. It should be noted that the Final Report will include not only the results from the 2008-2009 school year, but will also contain findings spanning all school years in order to comprehensively gauge the effectiveness of pre-kindergarten programs. Additionally, the 2008 and 2009 Annual Reports will describe program outcomes from the most recently completed school years.
Project Timeline
The table below provides the key details and due dates for all project deliverables.
Tasks to be Completed Date to be Completed
Preliminary Report to the Office of Education Accountability (OEA) and the General Assembly, providing – (1) a descriptive overview of pre-kindergarten students and programs in Tennessee, and (2) an overview of the research methodology to be used to assess the effectiveness of pre-kindergarten programs in Tennessee, suitable for dissemination to the General Assembly.
By July 16, 2007
First Interim Report to OEA and the General Assembly, providing – (1) a descriptive overview of pre-kindergarten students and programs in Tennessee, and (2) a written report containing the results of the assessment of pre-kindergarten program effectiveness for school years 1999-2000 through 2003-2004.
By October 28, 2007
Presentation to the education committees of the General Assembly; the presentations will include findings to date and other updates.
By February 28, 2008
Second Interim Report to OEA and the General Assembly, providing – (1) a descriptive overview of pre-kindergarten students and programs in Tennessee, and (2) a written report containing the results of the assessment of pre-kindergarten program effectiveness for school years 2004-2005 through 2006-2007, suitable for dissemination to the General Assembly.
By March 27, 2008
Annual Report to OEA describing program outcomes from the most recently completed school year (2007-2008). By October 31, 2008
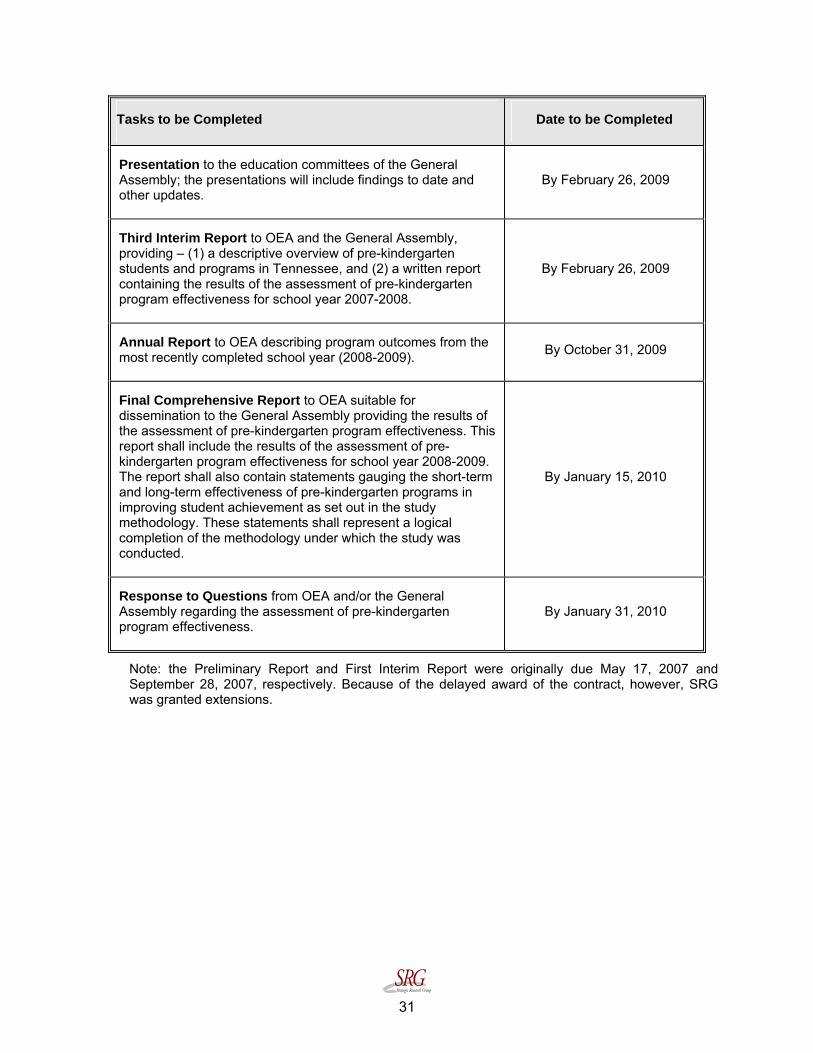
31
Tasks to be Completed Date to be Completed
Presentation to the education committees of the General Assembly; the presentations will include findings to date and other updates.
By February 26, 2009
Third Interim Report to OEA and the General Assembly, providing – (1) a descriptive overview of pre-kindergarten students and programs in Tennessee, and (2) a written report containing the results of the assessment of pre-kindergarten program effectiveness for school year 2007-2008.
By February 26, 2009
Annual Report to OEA describing program outcomes from the most recently completed school year (2008-2009). By October 31, 2009
Final Comprehensive Report to OEA suitable for dissemination to the General Assembly providing the results of the assessment of pre-kindergarten program effectiveness. This report shall include the results of the assessment of pre-kindergarten program effectiveness for school year 2008-2009. The report shall also contain statements gauging the short-term and long-term effectiveness of pre-kindergarten programs in improving student achievement as set out in the study methodology. These statements shall represent a logical completion of the methodology under which the study was conducted.
By January 15, 2010
Response to Questions from OEA and/or the General Assembly regarding the assessment of pre-kindergarten program effectiveness.
By January 31, 2010
Note: the Preliminary Report and First Interim Report were originally due May 17, 2007 and September 28, 2007, respectively. Because of the delayed award of the contract, however, SRG was granted extensions.