Embed Size (px)
Citation preview
Ophrhal. Physiof. Opt. Vol. 16, Suppl. 2, pp. S26-S32, 1996 Copyright Q 1996 The College of Optometrists. Published by Elsevier Science Ltd
Printed in Great Britain 0275-.5408/96 $15.00 +O.OO
Assessment of vision behind cataracts
Paul V. McGraw*, Brendan T. Barrett* and David Whitaker”
Department of Optometry, University of Bradford, Richmond Road, Bradford BD7 1 DP, West Yorkshire, UK
Introduction
Causes of reduced visual function can be grouped into three broad categories, pre-retinal (i.e. optical), retinal/neural, and a combination of the two. It is now widely accepted that one of the penalties of longevity is the eventual development of cataracts, which scatter light and reduce visual performance. To date, the generally accepted form of treatment is the surgical removal of the cataractous lens and compensation for its refractive power by either spectacles, contact lenses or, more commonly, by insertion of an intra- ocular implant lens. There are a number of clinical investigative techniques employed by practitioners to detect and evaluate lenticular opacification. Similarly, retinal/neural disease, in isolation, is readily identified using a number of established investigative techniques. Considerable problems exist, however, when optical and retinal/neural defects co-exist, since the clinician is faced with the arduous task of attempting to quantify the relative contribution of each factor to the observed loss in vision. This problem is confounded since the like- lihood of cataract and retinal/neural disease co-existing increases rapidly with age (Courtney, 1992).
A related problem is faced by the ophthalmologist when patients present with dense media opacification and
*MCOptom
therapy is implemented to treat estab- lished retinal/neural disease. If the cataract is the limiting factor determin- ing visual function between visits, then progression of retinal/neural disease may go unnoticed, giving the ophthalmologist a misplaced confidence in the treatment regime. Conversely, any progression in the density of the cataract between visits may erroneously lead the clinician to conclude that therapy directed at the retinal/neural disease is ineffective.
Cataract extraction and insertion of an intra-ocular lens has become an extremely successful procedure, with approximately 90% of patients achiev- ing a post-operative acuity of 6112 or better (Cataract Manage-ment Guide- line Panel, 1993). When cataract surgery is completed without significant complications, the success of the surgery depends upon two main factors: the degree of optical degradation produced by the cataract, and the functional capabilities of the retina and its neural system. Presumably cataract surgery, a group of procedures with significant risks, would not be employ- ed if the degree of optical degradation is extremely small or if retinal function is severely impaired, since the surgery will be of little benefit. The most common cause of ‘unsuccessful’ sur- gery remains underlying retinal/neural disease. However, assessment of retinal integrity in the presence of dense opacification is often problematic due to the absence of an adequate
S26
ophthalmoscopic view of the fundus. Clinical assessment of the effect of lenticular opacification on vision is highly subjective and unreliable. In addition, the presence of identifiable retinal pathology does not preclude improvement in visual acuity following cataract surgery. Over the past three decades, the problem of assessing retinal/neural function in the presence of ocular media opacities has attracted considerable attention. The large number of techniques which have been developed and the voluminous body of literature in this field are indicative of the difficulty posed by this problem.
To assess the functional capability of the macula in the presence of media opacities, a test must be employed which has one or more of the follow- ing features: does not require the ocular system to produce a high quality image; projects an image through the opacity; or bypasses the optical system
of the eye. This review will be divided into three broad categories. The first section will contain basic clinical tests. These rudimentary techniques provide qualitative rather than quantitative in- formation. The second category des- cribes techniques which require addi- tional dedicated instrumentation and are most commonly used by ophthal- mologists . The final category describes two relatively new approaches to the problem. While these are essentially still research methods, both have recently made important inroads into
Assessment of vision behind cataracts: P. V. McGraw et al. S27
the clinical domain. For a more detailed treatment of this area the interested reader should consult a comprehensive review by Hurst and Douthwaite (1993).
Basic clinical tests
The earliest attempts to investigate retinal/neural function behind ocular media opacities include Maddox-rod orientation discrimination, colour dis- crimination, two-point light discrimi- nation, the light-projection test and Comberg’s inter-ocular brightness test (Comberg, 1938). For a review of these methods see Fuller and Hutton (1982). While quick and simple to perform, these techniques are of limited predictive value. However, they do remain useful in locations where more modern methods are un- available (Minkowski, 1983).
Trans-illuminated amsler grid
This is a modified version of the standard Amsler test, first described by Miller, Lanberts and Perry (1978). The trans-illuminated grid is identical in size to the standard Amsler test, but has 1 mm holes located at the inter- section of the horizontal and vertical grid lines. The grid is mounted on a light box containing two 15watt neon tubes, and contains a 4mm fixation hole at its centre. Patients with media opacities, who often cannot see the lines on the standard Amsler grid, can be considered as having normal macular function if all the lines joining the retro-illuminated holes are perceived as being straight; metamorphopsias or scotomas are suggestive of abnormal macular function. The predictive ability of this technique has been investigated by Bernth-Petersen (198 1) who found that the technique correctly identified reduced retinal/neural function in more than two-thirds of patients with cataract and co-existent macular pathology. However, a significant disadvantage of the test is the high proportion of patients with dense opacities who are unable to see the
grid; the latter group comprised more than a quarter of the patients in the study conducted by Bernth-Petersen (1981).
Tests using entoptic imagery
Entoptic images arise from optical phenomena within the eye. Most types occur when the retina is stimulated with light in some unusual way. These images are sufficiently novel that their description by a naive patient is per- suasive evidence that a significant level of macular function exists (Brodie, 1987). However, the perception of many entoptic phenomena does not depend on fovea1 function alone (Guyton, 1987). Hence, description of the image by a patient with ocular media opacities cannot be taken as a guarantee of normal fovea1 function. Equally, the inability of a cataract patient to describe an entoptic pheno- menon does not necessarily imply a poor post-surgical visual prognosis; there may simply be poor communi- cation between clinician and patient, or even an inability of the patient to articulate such a novel sensation (Brodie, 1987).
The diagnostic value of entoptic imagery may be improved if the test is first administered to the cataractous eye, and subsequently to the normal fellow eye. If the entoptic images are perceived in the fellow eye, but not in the cataractous eye, the visual prog- nosis is less favourable.
There are many types of entoptic phenomena. These include Maxwell’s spot, Haidinger brushes, the Purkinje vascular shadow and the blue-field entoptic phenomenon (also known as the Flying Corpuscle Phenomenon). Purkinje vascular shadow and blue- field entoptic phenomena are the most suitable for investigating retinal/neural function behind ocular media opacities (Brodie, 1987).
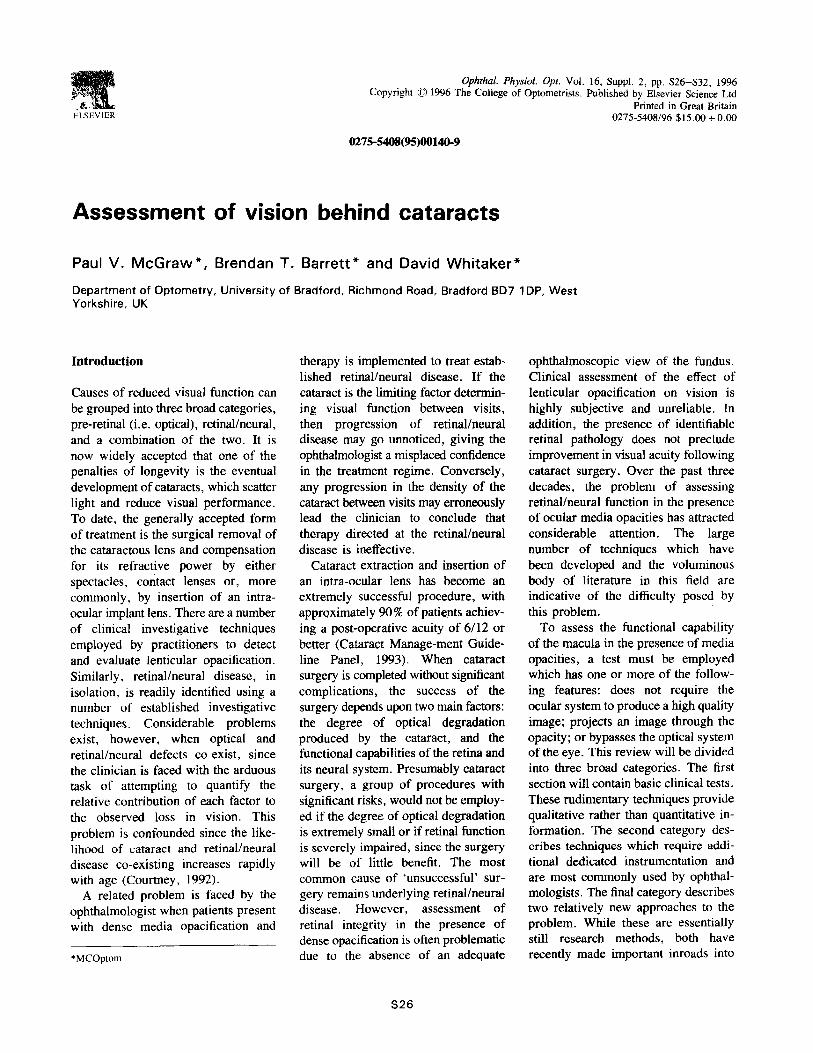
The Purkinje tree is an image of the retinal vasculature seen in fluctuating positive and negative contrast, and is the most familiar entoptic image (Figure / ). This entoptic phenomenon
Figure 1. Purkinje vascular shadow.
may be produced by illuminating the globe either trans-sclerally (Brodie, 1987), or through closed eyelids with the patient looking up (Fuller and Hutton, 1982). The image arises from the sudden illumination by the oblique light source of photoreceptors which are normally in the shadow of the retinal vessels. To prevent image fading, the light source must be con- tinuously moved. This results in a constant shifting of the position of the vascular shadows on the retina. Astute observers will identify not only the shadows of the retinal vasculature, but also the avascular fovea1 area and the optic disc area.
The advantages of using this test to evaluate retinal/neural function behind media opacities include the ease and speed with which the test may be carried out. Other advantages are that this test may prove useful in patients with dense cataracts, and the general reliability of a positive test result when the image is reported without the need for prompting from the clinician (Minkowski, 1983). How- ever, 20% of patients with normal posterior segments and 616 acuity cannot see the Purkinje entoptic pheno- menon, even after leading remarks from the examiner (Goldmann, 1972). The possibility of leading or confusing the patient is not the only disadvantage of this test. Since the macroscopically visible vessels do not closely approach the fovea, the Purkinje tree may be seen by patients with macular pathology (Minkowski, 1983; Goldmann. 1972).

S28 Ophthal. Physiol. Opt. 1996 16: Suppl. 2
Blue-field entoptoscopy , another en- toptic test, will be discussed in the next section.
Tests requiring additional instrumentation
Blue--eld entoptic phenomenon
Like the Purkinje vascular shadow, this phenomenon is generated via the retinal vasculature. It arises when the retina is stimulated with short- wavelength visible blue light. The blue light passes through the translucent white blood cells, and stimulates the relatively dark-adapted photoreceptors located beneath the capillaries (Guyton, 1987). In essence, the observer is viewing his or her own white blood cells flowing in the perifoveal retinal capillaries. Individual white blood corpuscles are seen as bright dots with elongated tails, and normally between 25 and 40 corpuscles are seen simultaneously (Loebl and Riva, 1978). The series of accelerations and decelerations of the corpuscles occurs in tandem with the cardiac cycle. There are two commercially available devices facilitating the phenomenon’s observation. The first is a slit-lamp attachment, and is known as the flying corpuscle viewer (Adams and Shock, 1986). The second, the blue-field entoptoscope, provides a self-contained high intensity light source and 430-nm filter (Sinclair et al., 1979). The higher intensity light source of the blue-field entoptoscope enables the image to be seen by patients with dense cataracts.
The uniform blue field of the entop- toscope subtends approximately 20” at the patient’s eye, and is divided into quadrants by means of a graticule. Testing is carried out monocularly and is usually, but not necessarily, per- formed following pupillary dilation. No refractive correction is necessary. The patient is asked whether corpuscles are visible in all four quadrants, and is also asked to estimate the total number seen. Visibility of 15 or more cor- puscles in patients with cataract is
classified as a normal result (Sinclair et al., 1981). The result is equivocal if the patient reports that portions of the visual field are without cor- puscles, and an abnormal result is recorded if few or no corpuscles are seen (Figure 2). The diagnostic value of the test is enhanced if the fellow eye is also examined. Comparison between the eyes in terms of speed, number, and distribution of the corpuscles may then be made (Loebl and Riva, 1978).
Studies suggest that the blue-field entoptoscope is only slightly more accurate than the Purkinje entoptic test in predicting good macular function in cataract patients. But it is considerably more accurate in predicting poor macular function (Sinclair et al., 1979), because the blue-field entopto- scope comments more specifically on central visual function than the Purkinje test, which covers approxi- mately 30” of the central visual field (Fuller and Hutton, 1982).
Potential acuity meter
This test uses a single channel Max- wellian view projection system to image a small light source in the plane of the patient’s entrance pupil (Minkowski er al., 1983). The position of this highly localised beam can then be manipulated by the examiner so that it is projected through a clear or relatively clear portion of the cataractous lens. An aerial image of
a Snellen chart is projected onto the retina (6” visual field), and the patient is instructed to read out the letters. The patient is usually dilated. It is important that the patient is optically corrected to ensure optimal clarity of the chart when projected onto the fundus. Essentially, this instrument is similar to using a pin-hole in conjunc- tion with a Snellen chart, the differ- ences being that the reduced retinal illumination and increased diffraction associated with the conventional pin- hole are avoided. Advantages of using a letter chart are that the task of identifying letters is universally used and understood by both clinicians and patients, and that a threshold can be identified rapidly.
The potential acuity meter has a tendency to overestimate the post- operative acuity level in eyes with relative!y moderate cataract and certain pathological conditions such as cystoid macular oedema and macular holes. One possible explanation may be that the retinal illumination of the projected test chart is higher than a standard Snellen chart (Guyton, 1987). Another disadvantage of this test is that often the only clear portion of the cataractous lens is located peri- pherally. Projection of the beam through such regions creates problems with longitudinal chromatic aberrations and off-axis aberrations. Several studies have reported that the instrument beam is unable to penetrate dense cataracts (Minkowski et al., 1983;
Normal Equivocal Abnormal
Figure 2. Blue-field entoptoscope responses: normal, equivocal and abnormal
(see text for details).
Assessment of vision behind: P. V. McGraw et al. s29
Christenbury and MacPherson, 1985)) restricting its clinical utility.
Inter$erometers
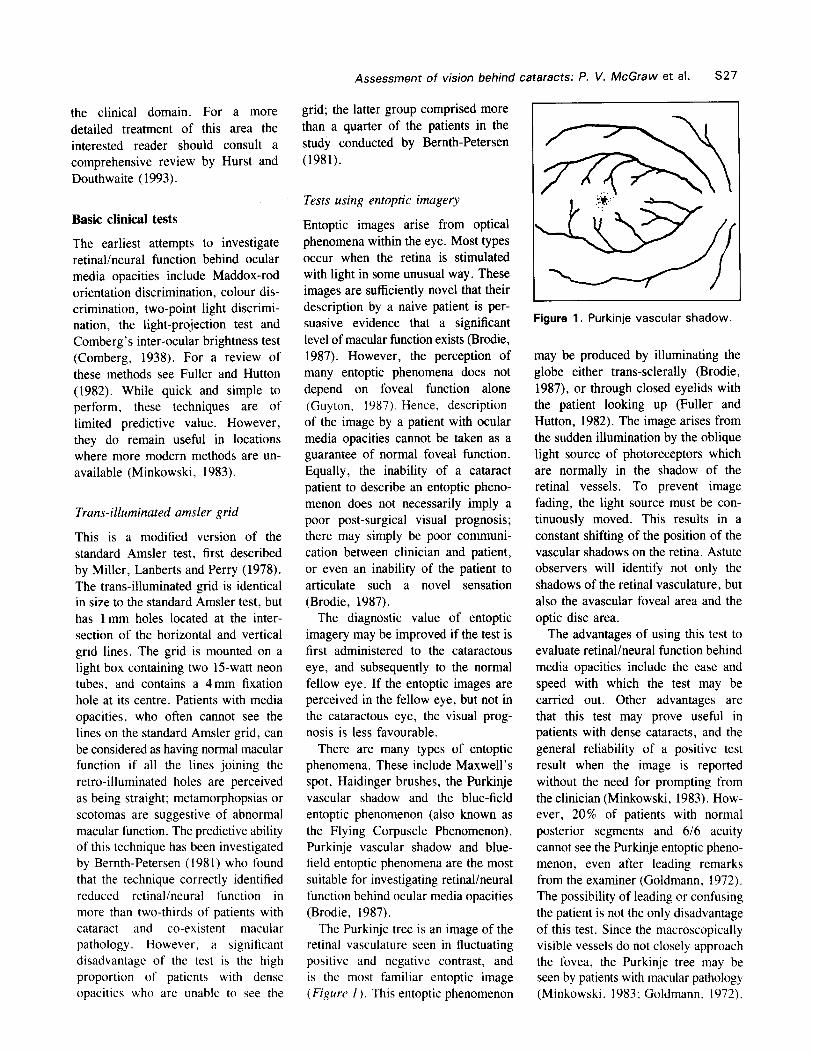
These instruments also employ Max- wellian view optical systems to project two coherent beams of light through the patient’s pupil. After traversing the pupil, the beams interfere construc- tively and destructively, to produce an interference pattern on the patient’s retina. An example of the interference pattern seen by a patient is shown in Figure 3. The spacing between the black and white bars (spatial frequency) of the interference pattern can be adjusted by manipulating the spacing between the two beams. The greater the beam separation the finer the inter- ference pattern produced on the retina. The orientation of the grating pattern
can be altered (90”, 180”, 45” and 135”) and the patient’s task is to identify the orientation. The highest spatial frequency at which the orien- tation can be correctly identified is taken as a measure of the retinal/ neural resolution. The grating acuity can then be converted to a Snellen equivalent to form the predicted post- operative acuity level.
The clinical interferometers, like the potential acuity meter, also have a tendency to overestimate the post- operative visual acuity. Several studies have found poor agreement between interferometric acuity and letter acuity (Gstadler and Green, 1971). This may be partially explained by the fact that, in general, grating acuity tends to be higher than Snellen acuity, particularly in patients with posterior segment pathology (Faulkner, 1983) and amblyopia (Gstadler and Green,
Figure 3. An example of the interference fringes seen by a patient. This pattern was generated by a Rodenstock retinometer (reprinted with permission from Hurst and Douthwaite, 1993).
1971). The predictive abilities of clinical interferometers have been the focus of much research. However, clinical opinion as to the value of these instruments in predicting post- operative visual function varies con- siderably (Faulkner, 1983; Guyton, 1986). Interferometers also suffer from the problem that they do not penetrate dense cataracts, restricting their use to mild or moderate levels of opacifica- tion. This is rather unfortunate, since it is patients with dense cataracts for whom assessment of retinal/neural function is most important.
Electrophysiological tests
Roth the electroretinogram (ERG) and visually evoked potentials (VEP) are useful for assessing retinal/neural function in the presence of cataract. The major drawback to the ERG is that it reflects only gross retinal function, and patients with some forms of macular disease may show a normal ERG response. For this reason, the VEP is the more useful test as it primarily reflects macular function. Pattern VEP responses, where the visual stimulus is a checkerboard, are degraded by the presence of cataract. Therefore, flash VEPs are favoured in pre-operative evaluation. A high intensity flash, modulated at a fre- quency of approximately lOHz, is presented, and the second peak in the waveform is analysed. One advantage of the flash VEP over many of the previously described techniques is its ability to penetrate very dense cataracts. However, due to the cost of the equipment and the expertise required to perform these procedures they are not used routinely in preoperative assessment.
Research based tests
Hyperacuity tasks
The term ‘hyperacuity’ is used to describe a set of spatial thresholds which exhibit clear superiority over
s30 Ophthal. Physiol. Opt. 1996 16: Suppl. 2
conventional spatial thresholds such as visual acuity (Westheimer, 1975). The precision with which relative localis- ation can be performed is often of the order of 5 seconds of arc, and is achieved despite the limitations im- posed by both the visual pathways and aberrations produced by the optical media. Examples of hyperacuity include Vernier acuity, stereoacuity, bisection acuity and displacement detection,
The resolving capacity of the eye relies on the ability to distinguish two objects as being spatially separate. As the retinal image becomes increasingly diffused over a larger retinal area due to hazy optical media or uncorrected refractive error, the two objects merge and the eye becomes unable to resolve them as separate. For this reason measures of visual acuity are of little value in patients with media opacities as it is impossible to distinguish between reductions in acuity caused by the
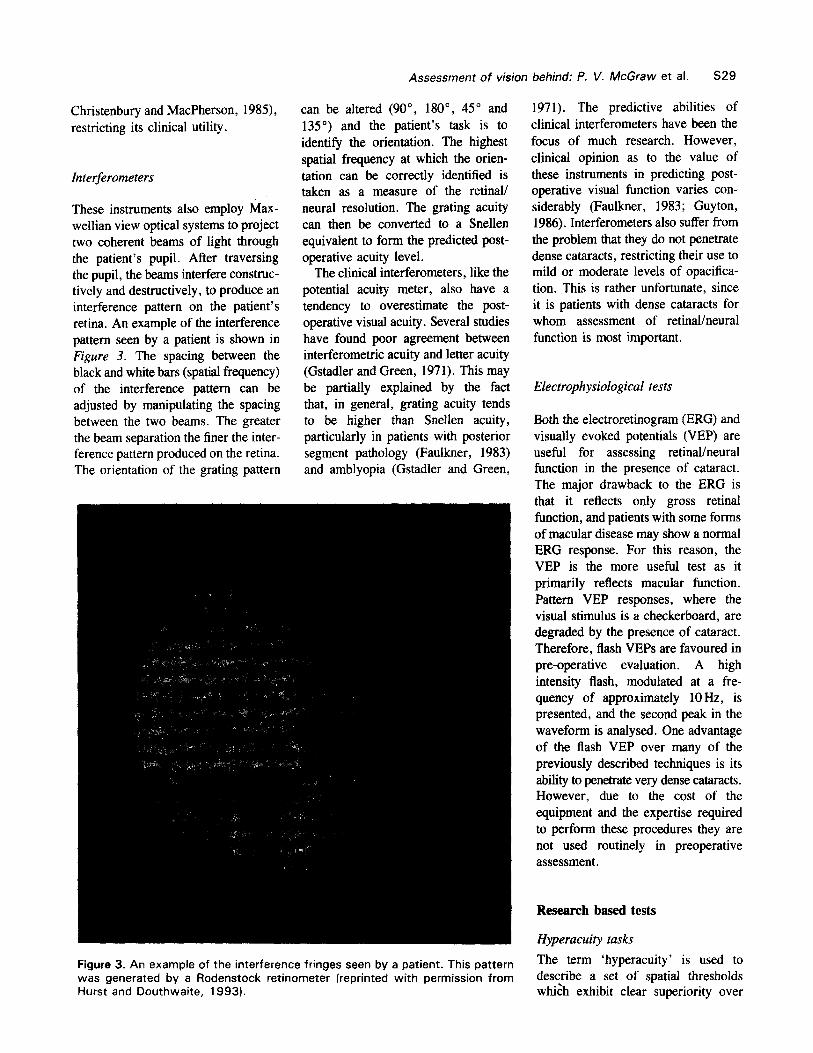
opacity and those caused by underlying posterior pole pathology. As hyper- acuity thresholds such as Vernier acuity and displacement thresholds are ex- tremely resistant to the effects of retinal image degradation produced by media opacities (Essock et al., 1984), the threshold obtained should relate directly to the functional capabilities of the retina and its neural system. This can be understood by considering that the human visual system is able to calculate the ‘centre of gravity’ or centroid of the retinal light distribution of the target (Whitaker and Walker, 1988). When this light distribution is diffused over a larger retinal area by the media opacity, the position of the centroid of the target remains un-altered, thus leaving the judgement that the subject must make relatively unaffected. A com- parison of positional acuity and resolution is shown in Figure 4.
Many studies examining hyperacuity thresholds in the presence of cataract have utilised Vernier acuity (Essock et al., 1984; Enoch et al., 1985). However, this type of hyperacuity may not be ideal as Vernier threshold varies as a function of the vertical sep- aration between the stimulus features.
Figure 4. Circularly symmetric resolution and Vernier acuity targets which have been successively low-pass filtered to mimic the effects of media opacification.
A single measure of Vernier acuity provides little useful information as a range of gap separations must be exam- ined to determine optimum threshold. This leads to an increase in test times and a consequent reduction in the clinical appeal of the test. Measures of Vernier acuity have been modified to create the ‘hyperacuity gap test’. This is essentially a comparison of fovea1 Vernier thresholds with those of eccen- tric retinal locations in the same subject. Since optimum Vernier threshold is obtained at the fovea, measurement of Vernier acuity with increasing eccen- tricity, creates an inverted v-shaped function, broadly similar in shape to that found for visual acuity. A lack of a pronounced central peak in this function is indicative of a fovea1 lesion. Simi- larl y , marked asymmetry in the function is thought to be characteristic of abnormal retinal/neural function. Although this technique has been shown to be useful in evaluating visual function in the presence of cataract, even when the opacification is dense, the procedure is time consuming (up to 25 min) and the results can be difficult to interpret (Guyton, 1987).
An alternative method is to use displacement detection; an example of
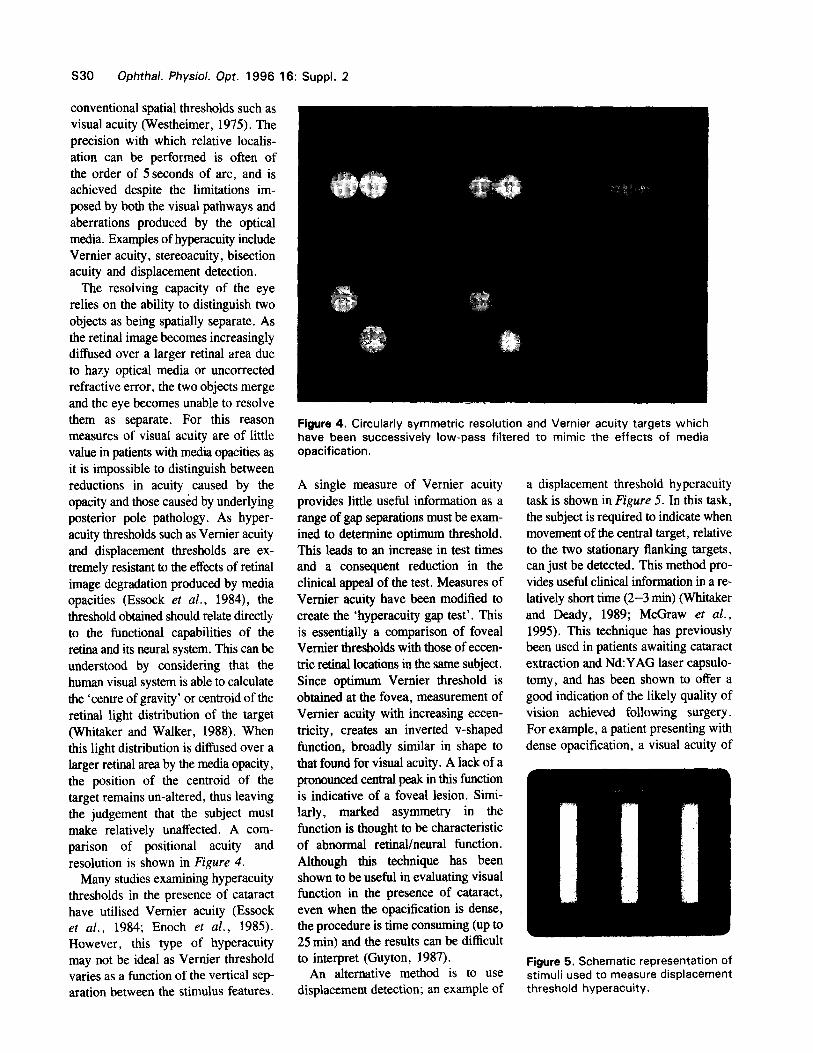
a displacement threshold hyperacuity task is shown in Figure 5. In this task, the subject is required to indicate when movement of the central target, relative to the two stationary flanking targets, can just be detected. This method pro- vides useful clinical information in a re- latively short time (2-3 mitt) (Whitaker and Deady, 1989; McGraw et al.,
1995). This technique has previously been used in patients awaiting cataract extraction and Nd:YAG laser capsulo- tomy, and has been shown to offer a good indication of the likely quality of vision achieved following surgery. For example, a patient presenting with dense opacification, a visual acuity of
Figure 5. Schematic representation of stimuli used to measure displacement threshold hyperacuity.
Assessment of vision behind cataracts: P. V. McGraw et al. s31
3/60 but with normal retinal/neural function, should obtain a low pre- opeative displacement threshold. As these thresholds are highly resistant to the effects of optical degradation, the magnitude of the post-operative dis- placement threshold should be &&ar, and several studies have found this to be the case (Whitaker and Deady , 1989; McGraw er al., 1995). On the other hand, a patient with dense opacification coupled with the coexistence of abnormal retinal/neural function should show raised displacement thresholds.
Contrast detection in noise
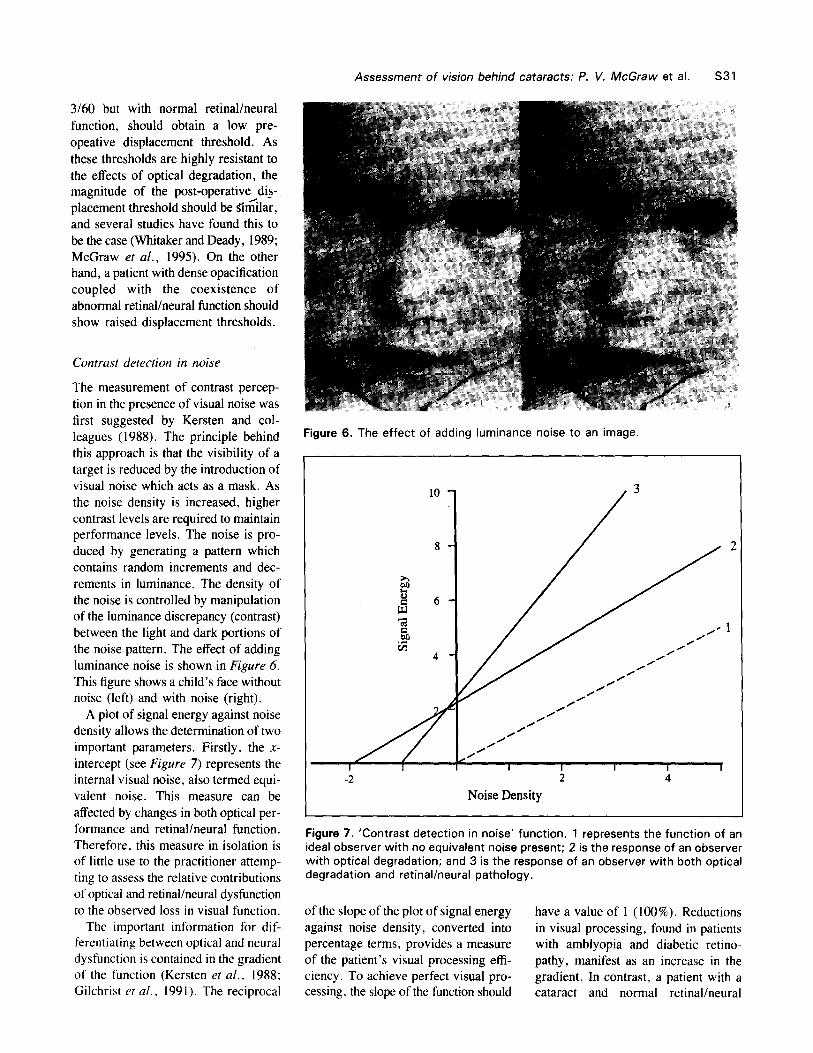
The measurement of contrast percep- tion in the presence of visual noise was first suggested by Kersten and col- leagues (1988). The principle behind this approach is that the visibility of a target is reduced by the introduction of visual noise which acts as a mask. As the noise density is increased, higher contrast levels are required to maintain performance levels. The noise is pro- duced by generating a pattern which contains random increments and dec- rements in luminance. The density of the noise is controlled by manipulation of the luminance discrepancy (contrast) between the light and dark portions of the noise pattern. The effect of adding luminance noise is shown in Figure 6. This figure shows a child’s face without noise (left) and with noise (right).
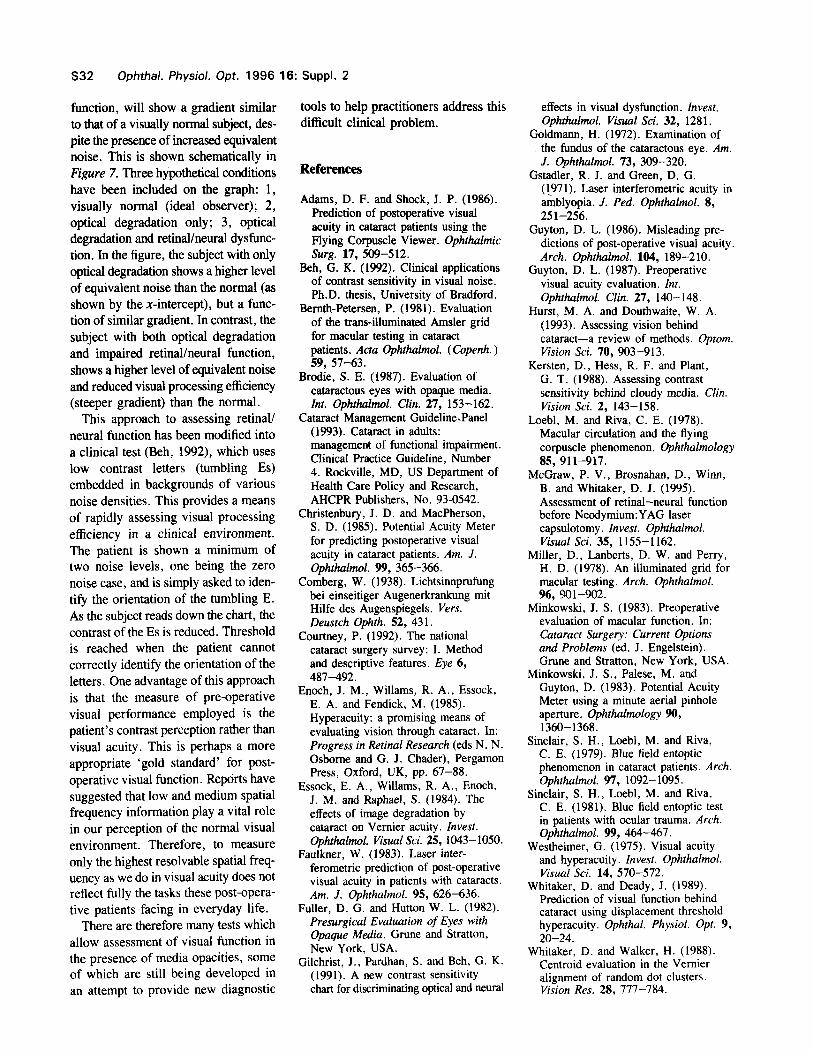
A plot of signal energy against noise density allows the determination of two important parameters. Firstly, the X- intercept (see Figure 7) represents the internal visual noise, also termed equi- valent noise. This measure can be affected by changes in both optical per- formance and retinal/neural function. Therefore, this measure in isolation is of little use to the practitioner attemp- ting to assess the relative contributions of optical and retinal/neural dysfunction to the observed loss in visual function.
The important information for dif- ferentiating between optical and neural dysfunction is contained in the gradient of the function (Kersten et al., 1988; Gilchrist et a/., 1991). The reciprocal
Figure 6. The effect of adding luminance noise to an image.
2 4
Noise Density
Figure 7. ‘Contrast detection in noise‘ function. 1 represents the function of an ideal observer with no equivalent noise present; 2 is the response of an observer with optical degradation; and 3 is the response of an observer with both optical degradation and retinal/neural pathology.
of the slope of the plot of signal energy have a value of 1 (100%). Reductions against noise density, converted into in visual processing, found in patients percentage terms, provides a measure with amblyopia and diabetic retino- of the patient’s visual processing effi- pathy, manifest as an increase in the ciency. To achieve perfect visual pro- gradient. In contrast, a patient with a cessing, the slope of the function should cataract and normal retinal/neural
S32 Ophthal. Physiol. Opt. 1996 16: Suppl. 2
function, will show a gradient similar to that of a visually normal subject, des- pite the presence of increased equivalent noise. This is shown schematically in Figure 7. Three hypothetical conditions have been included on the graph: 1, visually normal (ideal observer); 2, optical degradation only; 3, optical degradation and retinal/neural dysfunc- tion. In the figure, the subject with only optical degradation shows a higher level of equivalent noise than the normal (as shown by the x-intercept), but a func- tion of similar gradient. In contrast, the subject with both optical degradation and impaired retinal/neural function, shows a higher level of equivalent noise and reduced visual processing efficiency (steeper gradient) than fhe normal.
This approach to assessing retinal/ neural function has been modified into a clinical test (Beh, 1992), which uses low contrast letters (tumbling Es) embedded in backgrounds of various noise densities. This provides a means of rapidly assessing visual processing efficiency in a clinical environment. The patient is shown a minimum of two noise levels, one being the zero noise case, and is simply asked to iden- tify the orientation of the tumbling E. As the subject reads down the chart, the contrast of the Es is reduced. Threshold is reached when the patient cannot correctly identify the orientation of the letters. One advantage of this approach is that the measure of pre-operative visual performance employed is the patient’s contrast perception rather than visual acuity. This is perhaps a more appropriate ‘gold standard’ for post- operative visual function. Reports have suggested that low and medium spatial frequency information play a vital role in our perception of the normal visual environment. Therefore, to measure only the highest resolvable spatial freq- uency as we do in visual acuity does not reflect fully the tasks these post-opera- tive patients facing in everyday life.
There are therefore many tests which allow assessment of visual function in the presence of media opacities, some of which are still being developed in an attempt to provide new diagnostic
tools to help practitioners address this difficult clinical problem.
References
Adams, D. F. and Shock, J. P. (1986). Prediction of postoperative visual acuity in cataract patients using the Flying Corpuscle Viewer. Ophthalmic slug. 17, 509-512.
Beh, G. K. (1992). Clinical applications of contrast sensitivity in visual noise. Ph.D. thesis, University of Bradford.
Bemth-Petersen, P. (1981). Evaluation of the tram-illuminated Amsler grid for macular testing in cataract patients. Acta Ophthalmol. (Copenh. ) 59, 57-63.
Brodie, S. E. (1987). Evaluation of cataractous eyes with opaque media. Int. Ophthalmol. Clin. 27, 153-162.
Cataract Management Guideline.Panel (1993). Cataract in adults: management of functional impairment. Clinical Practice Guideline, Number 4. Rockville, MD, US Department of Health Care Policy and Research, AHCPR Publishers, No. 93-0542.
Christenbury, J. D. and MacPherson, S. D. (1985). Potential Acuity Meter for predicting postoperative visual acuity in cataract patients. Am. J. Ophthalmol. 99, 365-366.
Comberg, W. (1938). Lichtsinnprufung bei einseitiger Augenerkrankung mit Hilfe des Augenspiegels. Vet-s. Deustch Ophth. 52, 431.
Courtney, P. (1992). The national cataract surgery survey: I. Method and descriptive features. Eye 6, 487-492.
Enoch, J. M., Willams, R. A., Essock, E. A. and Fendick, M. (1985). Hyperacuity: a promising means of evaluating vision through cataract. In: Progress in Retinal Research (eds N N. Osborne and G. J. Chader), Pergamon Press, Oxford, UK, pp. 67-88.
Essock, E. A., Willams, R. A., Enoch, J. M. and Raphael, S. (1984). The effects of image degradation by cataract on Vernier acuity. Invest. Ophthalmol. Visual Sci. 25, 1043-1050.
Faulkner, W. (1983). Laser inter- ferometric prediction of post-operative visual acuity in patients with cataracts. Am. J. Ophthalmol. 95, 626-636.
Fuller, D. G. and Hutton W. L. (1982). Presurgical Evaluation of Eyes with Opaque Media. Grune and Stratton, New York, USA.
Gilchrist, J., Pardhan, S. and Beh, G. K. (1991). A new contrast sensitivity chart for discriminating optical and neural
effects in visual dysfunction. Invest. Ophthalmol. Visual Sci. 32, 1281.
Goldmann, H. (1972). Examination of the fundus of the cataractous eye. Am. J. Ophthalmol. 73, 309-320.
Gstadler, R. J. and Green, D. G. (I971). Laser interferometric acuity in amblyopia. J. Ped. Ophthalmol. 8, 25 l-256.
Guyton, D. L. (1986). Misleading pre- dictions of post-operative visual acuity. Arch. Ophthalmol. 104, 189-210.
Guyton, D. L. (1987). Preoperative visual acuity evaluation. Int. Ophthalmol. Clin. 27, 140-148.
Hurst, M. A. and Douthwaite, W. A. (1993). Assessing vision behind cataract-a review of methods. Optom. Vision Sci. 70, 903-913.
Kersten, D., Hess, R. F. and Plant, G. T. (1988). Assessing contrast sensitivity behind cloudy media. Clin. Vision Sci. 2, 143-158.
Loebl, M. and Riva, C. E. (1978). Macular circulation and the flying corpuscle phenomenon. Ophthalmology 85, 911-917.
McGraw, P. V., Brosnahan, D., Winn, B. and Whitaker, D. J. (1995). Assessment of retinal-neural function before Neodymium:YAG laser capsulotomy. Invest. Ophthalmol. Visual Sci. 35, 1155-1162.
Miller, D., Lanberts, D. W. and Perry, H. D. (1978). An illuminated grid for macular testing. Arch. Ophthalmol. 96, 901-902.
Minkowski, J. S. (1983). Preoperative evaluation of macular function. In: Cataract Surgery: Current Options and Problems (ed. J. Engelstein). Grune and Stratton, New York, USA.
Minkowski, J. S., PaIese, M. and Guyton, D. (1983). Potential Acuity Meter using a minute aerial pinhole aperture. Ophthalmology 90, 1360-1368.
Sinclair, S. H., Loebl, M. and Riva, C. E. (1979). Blue field entoptic phenomenon in cataract patients. Arch. Ophthalmol. 97, 1092-1095.
Sinclair, S. H., Loebl, M. and Riva, C. E. (1981). Blue field entoptic test in patients with ocular trauma. Arch. Ophthalmol. 99, 464-467.
Westheimer, G. (1975). Visual acuity and hypcracuity. Invest. Ophthalmol. Visual Sci. 14, 570-572.
Whitaker, D. and Deady, J. (1989). Prediction of visual function behind cataract using displacement threshold hyperacuity. Ophthal. Physiol. Opt. 9, 20-24.
Whitaker, D. and Walker, H. (1988). Centroid evaluation in the Vernier alignment of random dot clusters. Vision Res. 28, 777-784.