Embed Size (px)
Citation preview

AECOM Iron Valley Below Water TableAssessment on Proponent Information - Environmental Review Document – IronValley Below Water Table
15-Jul-2016Prepared for – BC Iron Ltd – ABN: 45 152 574 813
Appendix G
Geochemistry
AECOM Iron Valley Below Water TableAssessment on Proponent Information - Environmental Review Document – IronValley Below Water Table
20-Jul-2016Prepared for – BC Iron Ltd – ABN: 45 152 574 813
G-1
Appendix G Geochemistry
A Member of the SOILWATER GROUP SOILWATER CONSULTANTS | SOILWATER ANALYSIS | SOILWATER TECHNOLOGIES
www.soilwatergroup.com 45 Gladstone Street, East Perth, WA 6004 | Tel: +61 8 9228 3060 | Email: [email protected]
SOILWATER CONSULTANTS
IRON VALLEY BELOW WATER TABLE PROJECT - GEOCHEMICAL INVESTIGATION
Prepared for: MINERAL RESOURCES
Date of Issue: 30/11/2015
Project No.: MIN-010-1-8
Distribution:
Electronic Copy James Hesford (Manager Environment)
Soilwater Consultants (Perth Office)
i
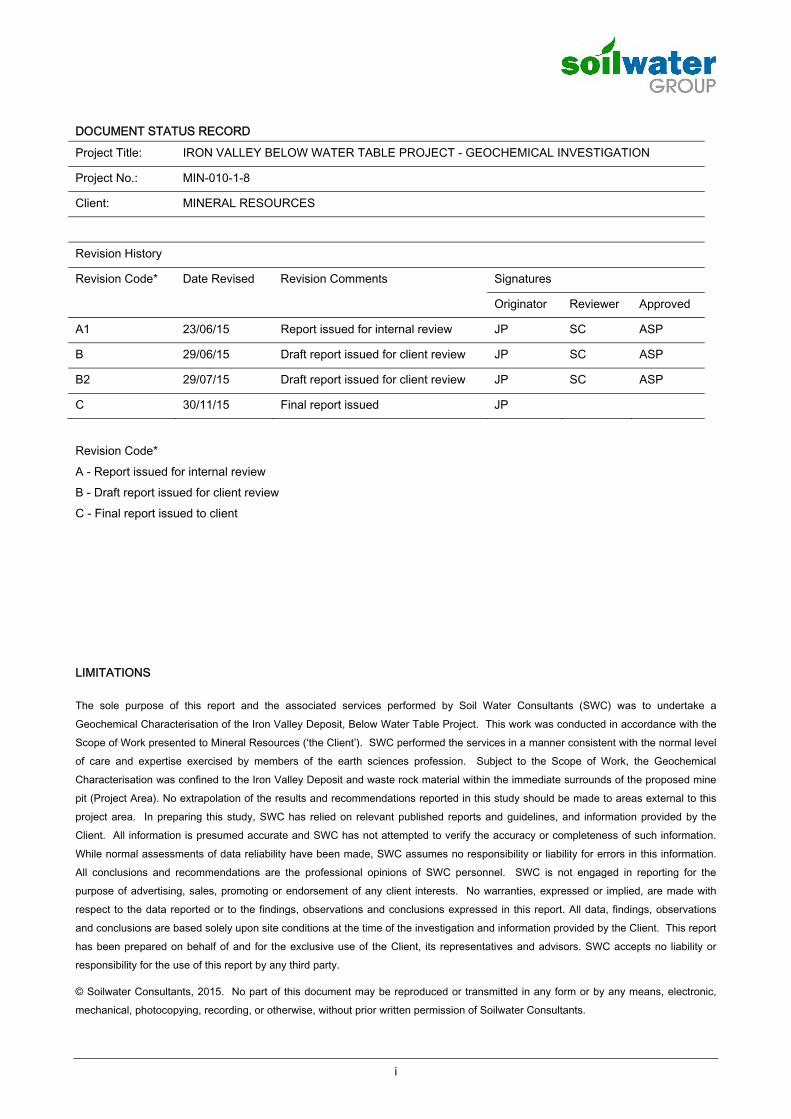
DOCUMENT STATUS RECORD
Project Title: IRON VALLEY BELOW WATER TABLE PROJECT - GEOCHEMICAL INVESTIGATION
Project No.: MIN-010-1-8
Client: MINERAL RESOURCES
Revision History
Revision Code* Date Revised Revision Comments Signatures
Originator Reviewer Approved
A1 23/06/15 Report issued for internal review JP SC ASP
B 29/06/15 Draft report issued for client review JP SC ASP
B2 29/07/15 Draft report issued for client review JP SC ASP
C 30/11/15 Final report issued JP
Revision Code* A - Report issued for internal review B - Draft report issued for client review C - Final report issued to client
LIMITATIONS
The sole purpose of this report and the associated services performed by Soil Water Consultants (SWC) was to undertake a Geochemical Characterisation of the Iron Valley Deposit, Below Water Table Project. This work was conducted in accordance with the Scope of Work presented to Mineral Resources (‘the Client’). SWC performed the services in a manner consistent with the normal level of care and expertise exercised by members of the earth sciences profession. Subject to the Scope of Work, the Geochemical Characterisation was confined to the Iron Valley Deposit and waste rock material within the immediate surrounds of the proposed mine pit (Project Area). No extrapolation of the results and recommendations reported in this study should be made to areas external to this project area. In preparing this study, SWC has relied on relevant published reports and guidelines, and information provided by the Client. All information is presumed accurate and SWC has not attempted to verify the accuracy or completeness of such information. While normal assessments of data reliability have been made, SWC assumes no responsibility or liability for errors in this information. All conclusions and recommendations are the professional opinions of SWC personnel. SWC is not engaged in reporting for the purpose of advertising, sales, promoting or endorsement of any client interests. No warranties, expressed or implied, are made with respect to the data reported or to the findings, observations and conclusions expressed in this report. All data, findings, observations and conclusions are based solely upon site conditions at the time of the investigation and information provided by the Client. This report has been prepared on behalf of and for the exclusive use of the Client, its representatives and advisors. SWC accepts no liability or responsibility for the use of this report by any third party.
© Soilwater Consultants, 2015. No part of this document may be reproduced or transmitted in any form or by any means, electronic, mechanical, photocopying, recording, or otherwise, without prior written permission of Soilwater Consultants.
IRON VALLEY BELOW WATER TABLE PROJECT - GEOCHEMICAL INVESTIGATION
CONTENTS
ii
CONTENTS
1 INTRODUCTION .................................................................................................................................................. 7
1.1 Study Objectives ........................................................................................................................................... 7 1.2 Scope of Work .............................................................................................................................................. 7
2 PROJECT DESCRIPTION ................................................................................................................................... 8
2.1 Site Layout .................................................................................................................................................... 8 2.2 Regional Geology ......................................................................................................................................... 8 2.3 Local Geology ............................................................................................................................................... 8
3 INVESTIGATION METHODOLOGY ................................................................................................................... 10
3.1 Geological Data Review ............................................................................................................................. 10 3.2 Waste Material Sample Collection .............................................................................................................. 11 3.3 Laboratory Analysis .................................................................................................................................... 13
4 STUDY RESULTS .............................................................................................................................................. 20
4.1 pH & pHfox .................................................................................................................................................... 20 4.2 Electrical Conductivity (EC) ........................................................................................................................ 20 4.3 Assay Total Sulfur ....................................................................................................................................... 21 4.4 Dispersion Testing ...................................................................................................................................... 21 4.5 Sulfur Speciation......................................................................................................................................... 27 4.6 Acid Neutralising Capacity .......................................................................................................................... 28 4.7 Acid Base Account ...................................................................................................................................... 29 4.8 Net Acid Generation ................................................................................................................................... 32 4.9 Geochemical Classification ......................................................................................................................... 33 4.10 Multi-element Composition ......................................................................................................................... 35 4.11 Metal Mobility .............................................................................................................................................. 35
5 CONCLUSIONS ................................................................................................................................................. 41
5.1 Screen Analysis .......................................................................................................................................... 41 5.2 Detailed ARD Assessment ......................................................................................................................... 41 5.3 Multi-element Composition ......................................................................................................................... 41 5.4 Management Recommendations ................................................................................................................ 42
6 REFERENCES ................................................................................................................................................... 43
APPENDICES
APPENDIX A SCREEN RESULTS AND DRILL LOGS
APPENDIX B LABORATORY CERTIFICATES

IRON VALLEY BELOW WATER TABLE PROJECT - GEOCHEMICAL INVESTIGATION
CONTENTS
ii
CONTENTS
1 INTRODUCTION ................................................................................................................................... 7
1.1 Study Objectives .................................................................................................................................... 7 1.2 Scope of Work ....................................................................................................................................... 7
2 PROJECT DESCRIPTION ...................................................................................................................... 8
2.1 Site Layout............................................................................................................................................. 8 2.2 Regional Geology................................................................................................................................... 8 2.3 Local Geology ........................................................................................................................................ 8
3 INVESTIGATION METHODOLOGY ....................................................................................................... 10
3.1 Geological Data Review ........................................................................................................................10 3.2 Waste Material Sample Collection .........................................................................................................11 3.3 Laboratory Analysis ...............................................................................................................................13
4 STUDY RESULTS ............................................................................................................................... 20
4.1 pH & pHfox ..............................................................................................................................................20 4.2 Electrical Conductivity (EC) ...................................................................................................................20 4.3 Assay Total Sulfur .................................................................................................................................21 4.4 Dispersion Testing ................................................................................................................................21 4.5 Sulfur Speciation ...................................................................................................................................27 4.6 Acid Neutralising Capacity .....................................................................................................................28 4.7 Acid Base Account ................................................................................................................................29 4.8 Net Acid Generation ..............................................................................................................................32 4.9 Geochemical Classification ....................................................................................................................33 4.10 Multi-element Composition ....................................................................................................................35 4.11 Metal Mobility ........................................................................................................................................35
5 CONCLUSIONS .................................................................................................................................. 41
5.1 Screen Analysis ....................................................................................................................................41 5.2 Detailed ARD Assessment ....................................................................................................................41 5.3 Multi-element Composition ....................................................................................................................41 5.4 Management Recommendations ...........................................................................................................42
6 REFERENCES .................................................................................................................................... 43
APPENDICES
APPENDIX A SCREEN RESULTS AND DRILL LOGS
APPENDIX B LABORATORY CERTIFICATES
IRON VALLEY BELOW WATER TABLE PROJECT - GEOCHEMICAL INVESTIGATION
CONTENTS
iii
LIST OF FIGURES
Figure 2.1: Current site layout ...................................................................................................................................... 9 Figure 3.1: Drillholes completed to date across the Project Area (SURPAC) .................................................................14 Figure 3.2 : Drillholes selected for screen analysis (SURPAC).....................................................................................15 Figure 3.3: Location of drillholes (GIS) .........................................................................................................................16 Figure 3.4: Drillholes containing 3 or more elevated sulfur samples .............................................................................17 Figure 3.5: Drillholes in northern area ..........................................................................................................................18 Figure 3.6: Drillholes in north eastern area ..................................................................................................................19 Figure 4.1: pH, pHfox and EC depth profiles for representative drillholes .....................................................................23 Figure 4.2: pH, pHfox and Total S depth profiles for representative drillholes ................................................................25 Figure 4.3: ABA plots of representative samples ..........................................................................................................31 Figure 4.4: Geochemical classification plots ................................................................................................................34
LIST OF TABLES
Table 3.1: Sulfur distribution across lithology types .....................................................................................................10 Table 3.2: Drill sampling frequency of major lithological units within the Project Area. ..................................................11 Table 3.3: Details of drillholes selected for screen analysis. ........................................................................................12 Table 3.4: Samples selected for screen analysis. ........................................................................................................12 Table 3.5: Details of the 20 samples selected for further ARD testing. .........................................................................13 Table 4.1: Summary statistics for the screen test results ..............................................................................................20 Table 4.2: Emerson score of different lithology.............................................................................................................22 Table 4.3: Results of sulfur speciation testing on representative samples ....................................................................27 Table 4.4: Results of buffering capacity testing on representative samples ...................................................................28 Table 4.5: Acid Base Account for representative samples ............................................................................................30 Table 4.6: Results of static NAG testing on representative samples .............................................................................32 Table 4.7: Multi element composition of representative waste material samples ...........................................................37 Table 4.8: Results of leaching tests conducted on representative waste material in neutral conditions ..........................39 Table 4.9: Results of leaching tests conducted on representative waste material in acidic conditions ............................40
IRON VALLEY BELOW WATER TABLE PROJECT - GEOCHEMICAL INVESTIGATION
Page 5 of 66
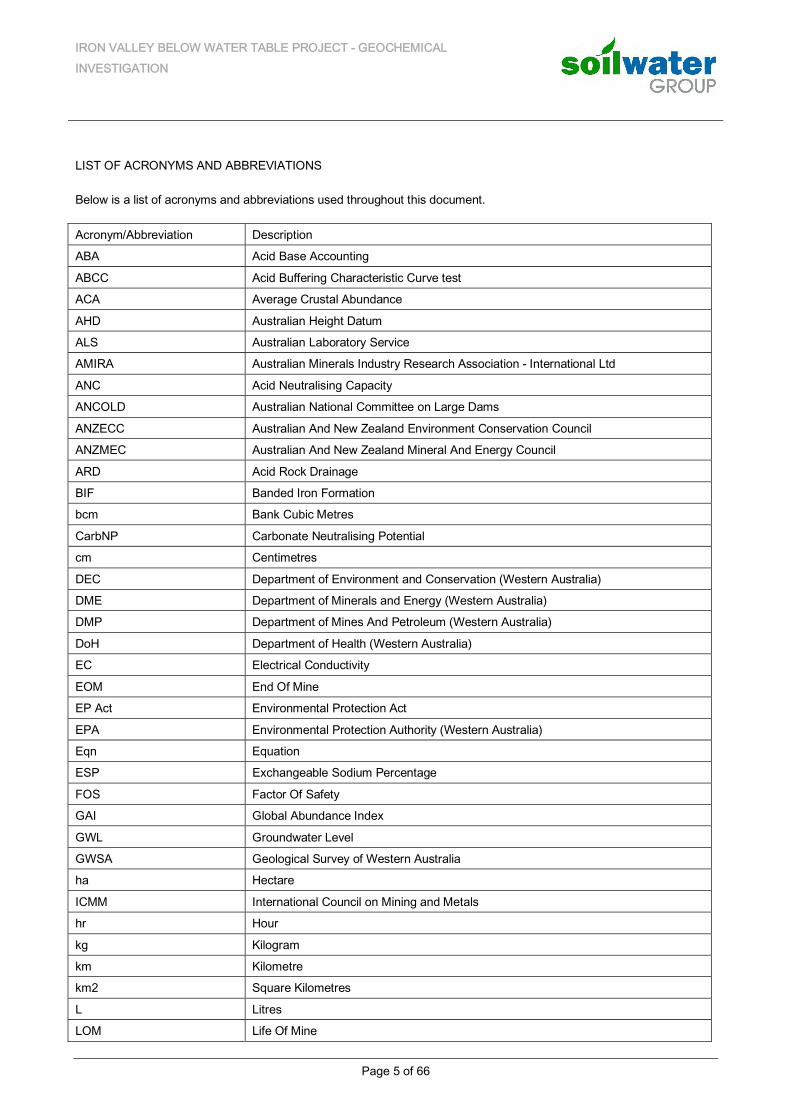
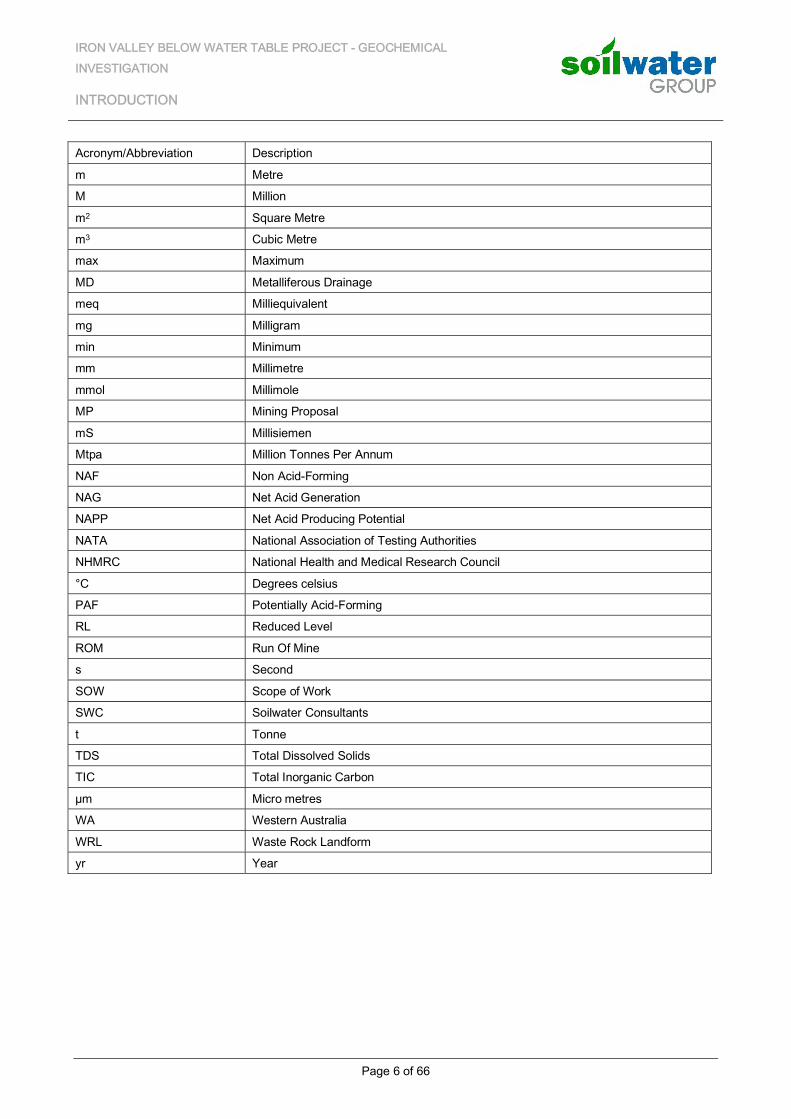
LIST OF ACRONYMS AND ABBREVIATIONS
Below is a list of acronyms and abbreviations used throughout this document.
Acronym/Abbreviation Description
ABA Acid Base Accounting
ABCC Acid Buffering Characteristic Curve test
ACA Average Crustal Abundance
AHD Australian Height Datum
ALS Australian Laboratory Service
AMIRA Australian Minerals Industry Research Association - International Ltd
ANC Acid Neutralising Capacity
ANCOLD Australian National Committee on Large Dams
ANZECC Australian And New Zealand Environment Conservation Council
ANZMEC Australian And New Zealand Mineral And Energy Council
ARD Acid Rock Drainage
BIF Banded Iron Formation
bcm Bank Cubic Metres
CarbNP Carbonate Neutralising Potential
cm Centimetres
DEC Department of Environment and Conservation (Western Australia)
DME Department of Minerals and Energy (Western Australia)
DMP Department of Mines And Petroleum (Western Australia)
DoH Department of Health (Western Australia)
EC Electrical Conductivity
EOM End Of Mine
EP Act Environmental Protection Act
EPA Environmental Protection Authority (Western Australia)
Eqn Equation
ESP Exchangeable Sodium Percentage
FOS Factor Of Safety
GAI Global Abundance Index
GWL Groundwater Level
GWSA Geological Survey of Western Australia
ha Hectare
ICMM International Council on Mining and Metals
hr Hour
kg Kilogram
km Kilometre
km2 Square Kilometres
L Litres
LOM Life Of Mine
IRON VALLEY BELOW WATER TABLE PROJECT - GEOCHEMICAL INVESTIGATION
INTRODUCTION
Page 6 of 66
Acronym/Abbreviation Description
m Metre
M Million
m2 Square Metre
m3 Cubic Metre
max Maximum
MD Metalliferous Drainage
meq Milliequivalent
mg Milligram
min Minimum
mm Millimetre
mmol Millimole
MP Mining Proposal
mS Millisiemen
Mtpa Million Tonnes Per Annum
NAF Non Acid-Forming
NAG Net Acid Generation
NAPP Net Acid Producing Potential
NATA National Association of Testing Authorities
NHMRC National Health and Medical Research Council
°C Degrees celsius
PAF Potentially Acid-Forming
RL Reduced Level
ROM Run Of Mine
s Second
SOW Scope of Work
SWC Soilwater Consultants
t Tonne
TDS Total Dissolved Solids
TIC Total Inorganic Carbon
µm Micro metres
WA Western Australia
WRL Waste Rock Landform
yr Year
IRON VALLEY BELOW WATER TABLE PROJECT - GEOCHEMICAL INVESTIGATION
INTRODUCTION
Page 7 of 66
1 INTRODUCTION
Soilwater Consultants (SWC) were engaged by Mineral Resources (MR) to carry out a geochemical characterisation for the proposed Below Water Table (BWT) expansion of the Iron Valley Project (IVP). This geochemical investigation was undertaken to identify the presence or absence of material which has the potential to form Acid Rock Drainage (ARD) or Metalliferous Drainage (MD), or other problematic materials which may impact on the surrounding environment and / or rehabilitation goals if managed inappropriately.
1.1 STUDY OBJECTIVES
The specific objectives of this work were to:
Assess the current baseline conditions existing below the water table within the deposit. Identify the major lithological units present below the water table within the deposit. Undertake an Acid Base Account (ABA) to identify the environmental risks associated with disturbance of any
potential ARD materials. Identify the risk of MD developing following disturbance of waste rock materials. Suggest management strategies for the handling and utilisation of waste rock materials during mining and
rehabilitation.
1.2 SCOPE OF WORK
The scope of work (SOW) completed by SWC during this investigation included:
Review of existing geological and assay drill data collected across the Project Area. Selection of samples for screen analysis to investigate conditions within the deposit. Undertake and coordinate laboratory screen analysis Selection of representative samples for additional detailed laboratory analysis to confirm their ARD and MD
status. Review of all laboratory results and preparation of this report. Incorporate previous geochemical testing results into a consolidated geochemical assessment for the Iron Valley
BWT Project.
IRON VALLEY BELOW WATER TABLE PROJECT - GEOCHEMICAL INVESTIGATION
PROJECT DESCRIPTION
Page 8 of 66
2 PROJECT DESCRIPTION
The IVP is an open pit iron ore mining operation located in the East Pilbara Shire within the Eastern Pilbara Region of Western Australia, approximately 90 km north-west of Newman and 250 km south of Port Hedland. The IVP is within the vicinity of a number of operating iron ore mines including the Rio Tinto Iron Ore Yandicoogina (5 km to the west) and Hope Downs operations (45 km to the south west), BHP Billiton Iron Ore Yandi operation (35 km to the west), and Fortescue Metals Group Cloudbreak operation (55 km to the north).
2.1 SITE LAYOUT
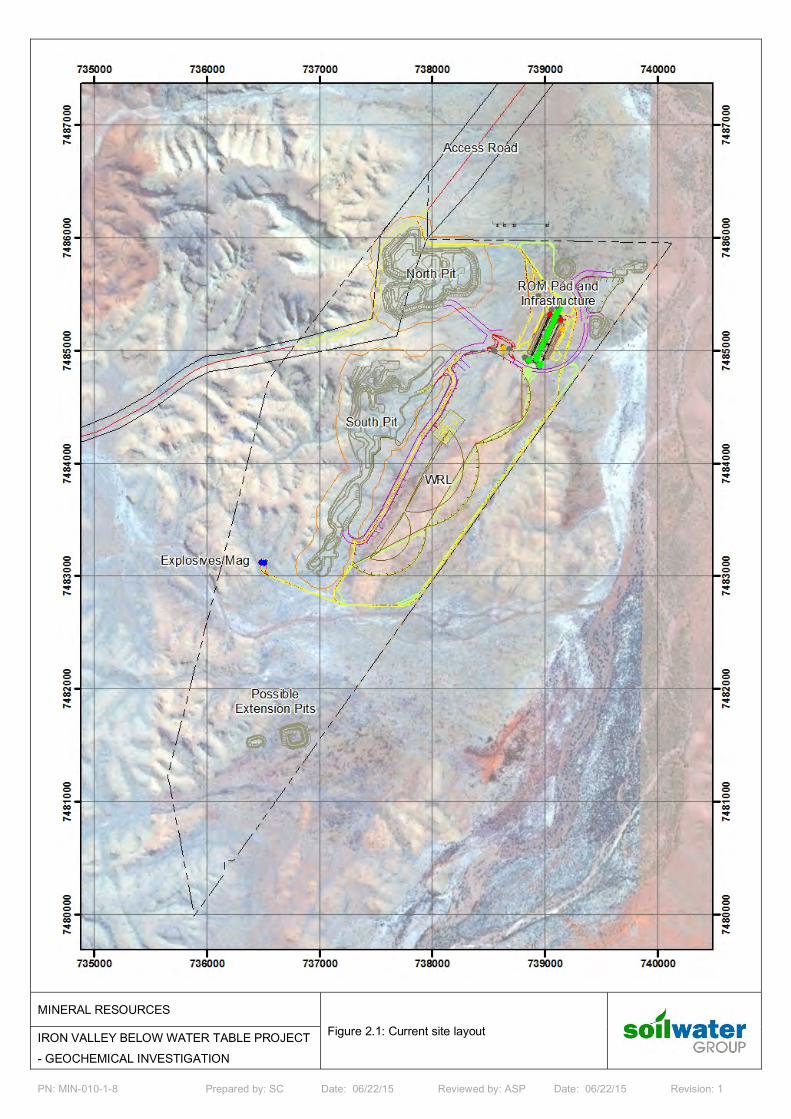
The IVP mining lease (47/1439) is owned by Iron Ore Holdings Ltd, and the mine is operated by Mineral Resources. The current layout of the IVP is shown in Figure 2.1. Within the approved 674 ha disturbance area, the ore will be mined from multiple pits through multiple stages, and sent to a Run of Mine (ROM) pad for blending. The ore will be dry-crushed and screened, before being transported via road for gate sale. Approximately 288 million dry tonnes of waste rock / uneconomic ore is expected to be generated and stored on the waste rock landform (WRL) adjacent to the main pit, with 133 million dry tonnes of ore generated.
2.2 REGIONAL GEOLOGY
The Iron Valley Project is contained within the Brockman Iron Formation which is part of the Precambrian iron formations present within the volcanic and sedimentary sequence of the Mount Bruce Supergroup, which spans a time interval of over 400 m.y. from > 2.77 to near 2.35 Ga. The deposit is hosted predominately within the eastern limb of a large anticlinal structure trending northeast/southwest, plunging to the south. The majority of mineralisation is contained within the upper Joffre Member (occurring in the limb of the anticline structure) with minor mineralisation occurring within the core of the anticline, confined to the Dales Gorge Member. A large dolerite dyke runs through the area, striking northeast/southwest and effectively dissects the deposit into northern and southern sections.
2.3 LOCAL GEOLOGY
The deposit is comprised of two categories of mineralisation; Tertiary Detrital and Bedded Mineralisation. The Tertiary Detrital mineralisation can be further sub-categorised based on the proportion of clay and chert fragments as compared to Hematite and Goethite mineralisation. The bedded mineralisation within the two geological members discussed above are composed of repeating formations of oxide Banded Iron Formation (BIF) ‘facies’ layers and intercalated chert-carbonate and silicate ‘facies’ layers (Ewers and Morris, 1981). These bands vary widely in thickness based on both seasonal conditions and the available supply of primary minerals (i.e. iron) at the time of deposition.
PN: MIN-010-1-8 Prepared by: SC Date: 06/22/15 Reviewed by: ASP Date: 06/22/15 Revision: 1
MINERAL RESOURCES
Figure 2.1: Current site layout
IRON VALLEY BELOW WATER TABLE PROJECT - GEOCHEMICAL INVESTIGATION
IRON VALLEY BELOW WATER TABLE PROJECT - GEOCHEMICAL INVESTIGATION
INVESTIGATION METHODOLOGY
Page 10 of 66
3 INVESTIGATION METHODOLOGY
3.1 GEOLOGICAL DATA REVIEW
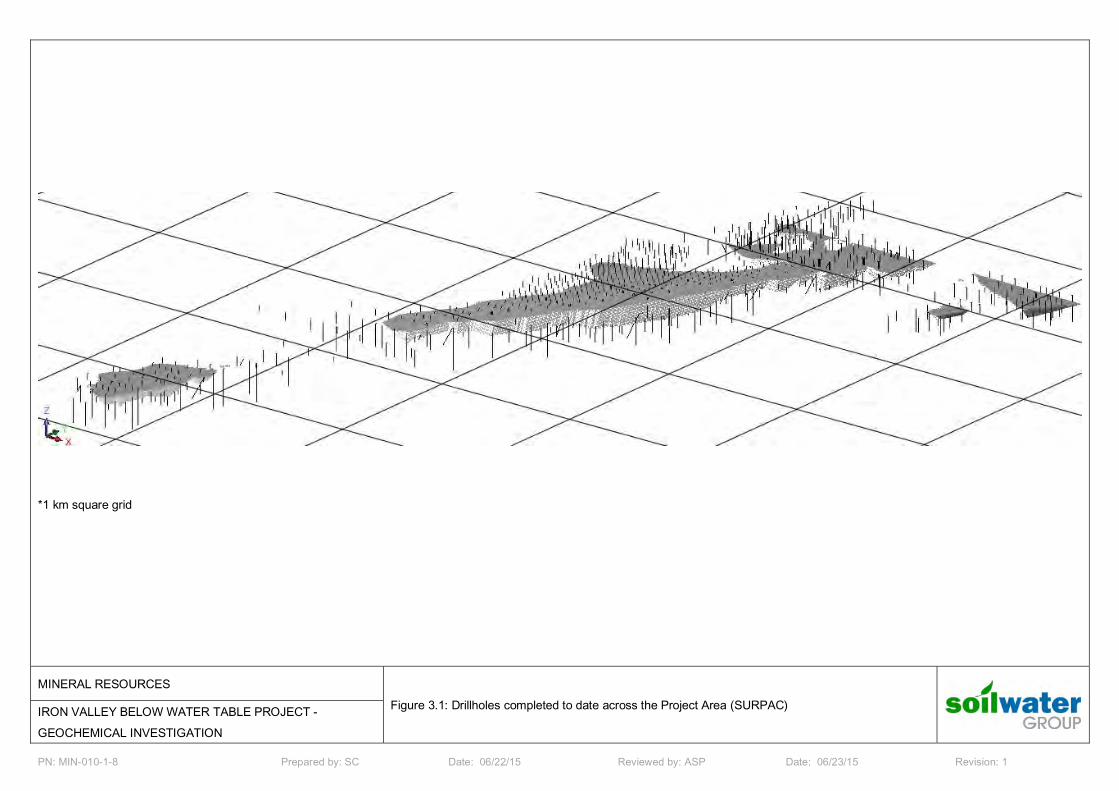
A total of 664 drillholes are included in geological database which covers the Project Area (Figure 3.1 and 3.3). The drillholes were completed using Reverse Cycle (RC) drilling to depths of up to 358 m. Samples were logged at 2 m vertical intervals across the entire depth drilled resulting in over 36,000 separate samples logged and recorded as part of this database. Of these, 34,721 logged entries had values assigned for both lithology and total sulfur, across 658 unique drillhole collars. In order to classify samples, a cut-off grade of 50% Fe was used to delineate between ore and waste material. Using this criteria, 11,628 of the 34,721 samples classify as ore (33.5%) with the remaining 23,093 (66.5%) classified as waste material samples.
There are no unifying ‘standard’ criteria for classifying the acid production potential of mine waste materials, which reflects the diversity of possible sulfide mineral assemblages within lithologies of varying weathering and alteration status. Best practice guidelines recommend site specific approach to classification which allows the criteria to be tailored to deposit specific geochemistry and mineralogy. For the purposes of initial data review however, a cut-off value of 0.3% for Total S has been used to allow preliminary classification. This value for Total S % was chosen as there is general consensus (e.g. mining/environmental regulators in British Columbia, Canada) that materials with contents of Sulfide-Sulfur less than 0.3% are unlikely to oxidise at rates fast enough to result in acidification (Soregaroli and Lawrence, 1997). This position assumes that the groundmass hosting these sulfides is not simply quartz and/or clays, and for a carbonate deficient material the sulfides are not unusually reactive.
Of the more than 36,000 individual samples submitted for assay analysis of Total S contained within the database, only 153 samples (< 0.5 %) were identified as containing significant Sulfur content (samples with a Total Sulfur content of ≥0.3%). This indicates that the occurrence of minerals containing significant sulfur content is rare within the materials surrounding the deposit. Whilst not all sulfur present within these samples will be in a reduced (and therefore potentially reactive) state, taking a conservative approach and assuming that all sulfur recorded is capable of oxidising and subsequently producing acid, and then comparing the levels with the investigation criteria discussed above, the implied risk of ARD following disturbance is low.
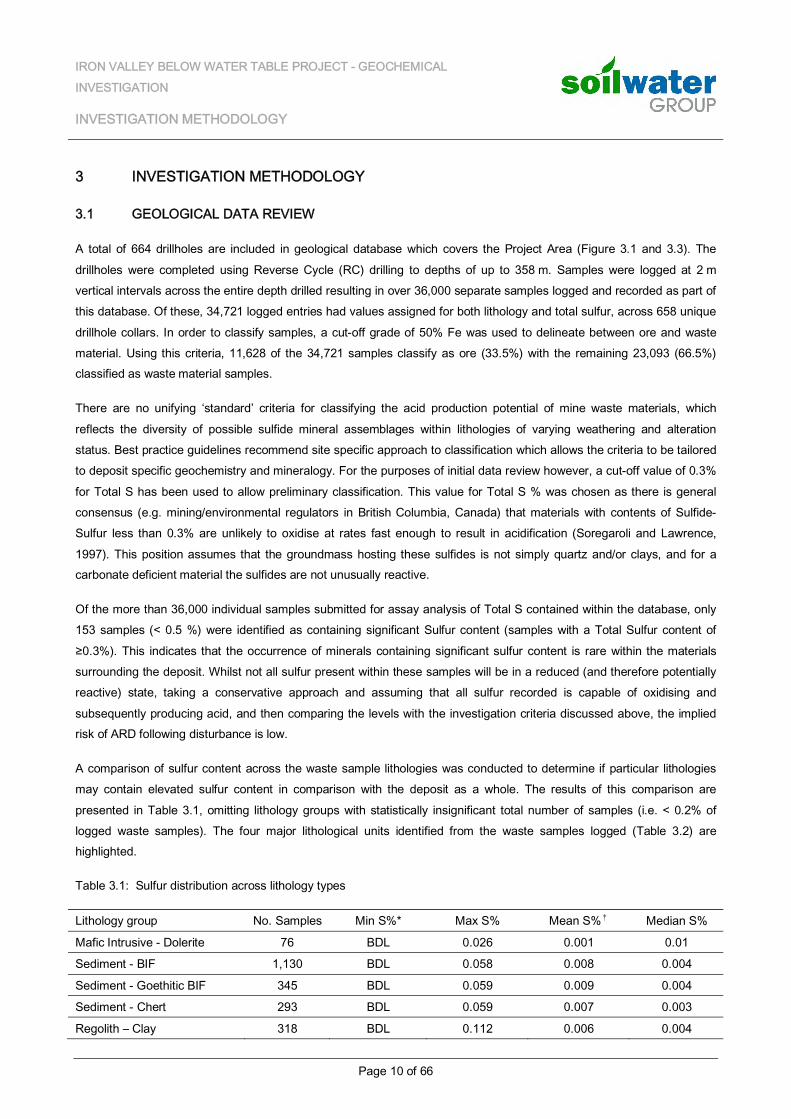
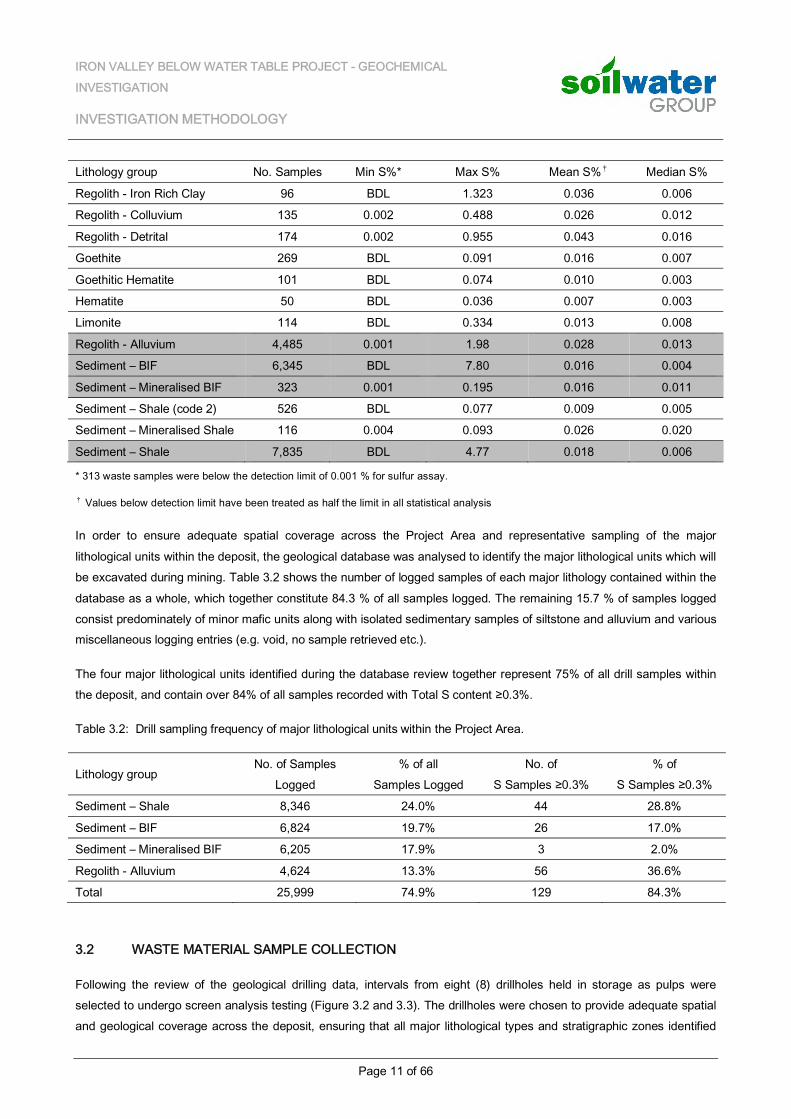
A comparison of sulfur content across the waste sample lithologies was conducted to determine if particular lithologies may contain elevated sulfur content in comparison with the deposit as a whole. The results of this comparison are presented in Table 3.1, omitting lithology groups with statistically insignificant total number of samples (i.e. < 0.2% of logged waste samples). The four major lithological units identified from the waste samples logged (Table 3.2) are highlighted.
Table 3.1: Sulfur distribution across lithology types
Lithology group No. Samples Min S%* Max S% Mean S%† Median S%
Mafic Intrusive - Dolerite 76 BDL 0.026 0.001 0.01
Sediment - BIF 1,130 BDL 0.058 0.008 0.004
Sediment - Goethitic BIF 345 BDL 0.059 0.009 0.004
Sediment - Chert 293 BDL 0.059 0.007 0.003
Regolith – Clay 318 BDL 0.112 0.006 0.004
IRON VALLEY BELOW WATER TABLE PROJECT - GEOCHEMICAL INVESTIGATION
INVESTIGATION METHODOLOGY
Page 11 of 66
Lithology group No. Samples Min S%* Max S% Mean S%† Median S%
Regolith - Iron Rich Clay 96 BDL 1.323 0.036 0.006
Regolith - Colluvium 135 0.002 0.488 0.026 0.012
Regolith - Detrital 174 0.002 0.955 0.043 0.016
Goethite 269 BDL 0.091 0.016 0.007
Goethitic Hematite 101 BDL 0.074 0.010 0.003
Hematite 50 BDL 0.036 0.007 0.003
Limonite 114 BDL 0.334 0.013 0.008
Regolith - Alluvium 4,485 0.001 1.98 0.028 0.013
Sediment – BIF 6,345 BDL 7.80 0.016 0.004
Sediment – Mineralised BIF 323 0.001 0.195 0.016 0.011
Sediment – Shale (code 2) 526 BDL 0.077 0.009 0.005
Sediment – Mineralised Shale 116 0.004 0.093 0.026 0.020
Sediment – Shale 7,835 BDL 4.77 0.018 0.006
* 313 waste samples were below the detection limit of 0.001 % for sulfur assay.
† Values below detection limit have been treated as half the limit in all statistical analysis
In order to ensure adequate spatial coverage across the Project Area and representative sampling of the major lithological units within the deposit, the geological database was analysed to identify the major lithological units which will be excavated during mining. Table 3.2 shows the number of logged samples of each major lithology contained within the database as a whole, which together constitute 84.3 % of all samples logged. The remaining 15.7 % of samples logged consist predominately of minor mafic units along with isolated sedimentary samples of siltstone and alluvium and various miscellaneous logging entries (e.g. void, no sample retrieved etc.).
The four major lithological units identified during the database review together represent 75% of all drill samples within the deposit, and contain over 84% of all samples recorded with Total S content ≥0.3%.
Table 3.2: Drill sampling frequency of major lithological units within the Project Area.
Lithology group No. of Samples
Logged % of all
Samples Logged No. of
S Samples ≥0.3% % of
S Samples ≥0.3%
Sediment – Shale 8,346 24.0% 44 28.8%
Sediment – BIF 6,824 19.7% 26 17.0%
Sediment – Mineralised BIF 6,205 17.9% 3 2.0%
Regolith - Alluvium 4,624 13.3% 56 36.6%
Total 25,999 74.9% 129 84.3%
3.2 WASTE MATERIAL SAMPLE COLLECTION
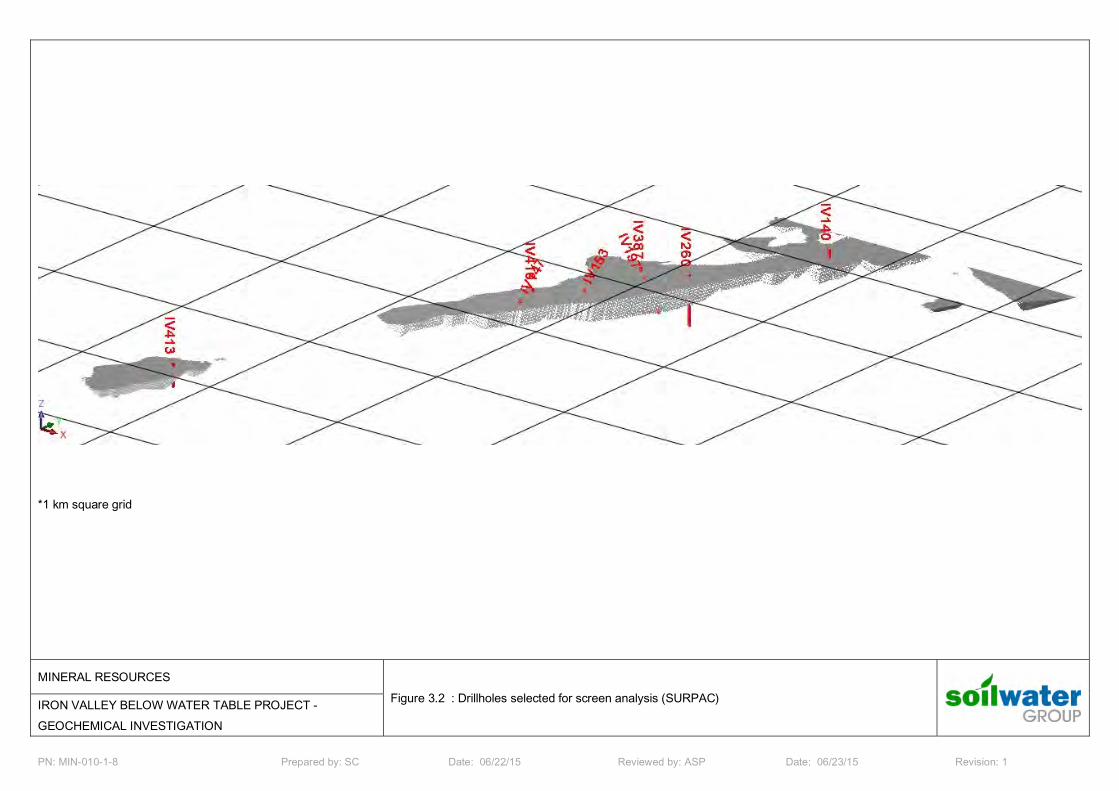
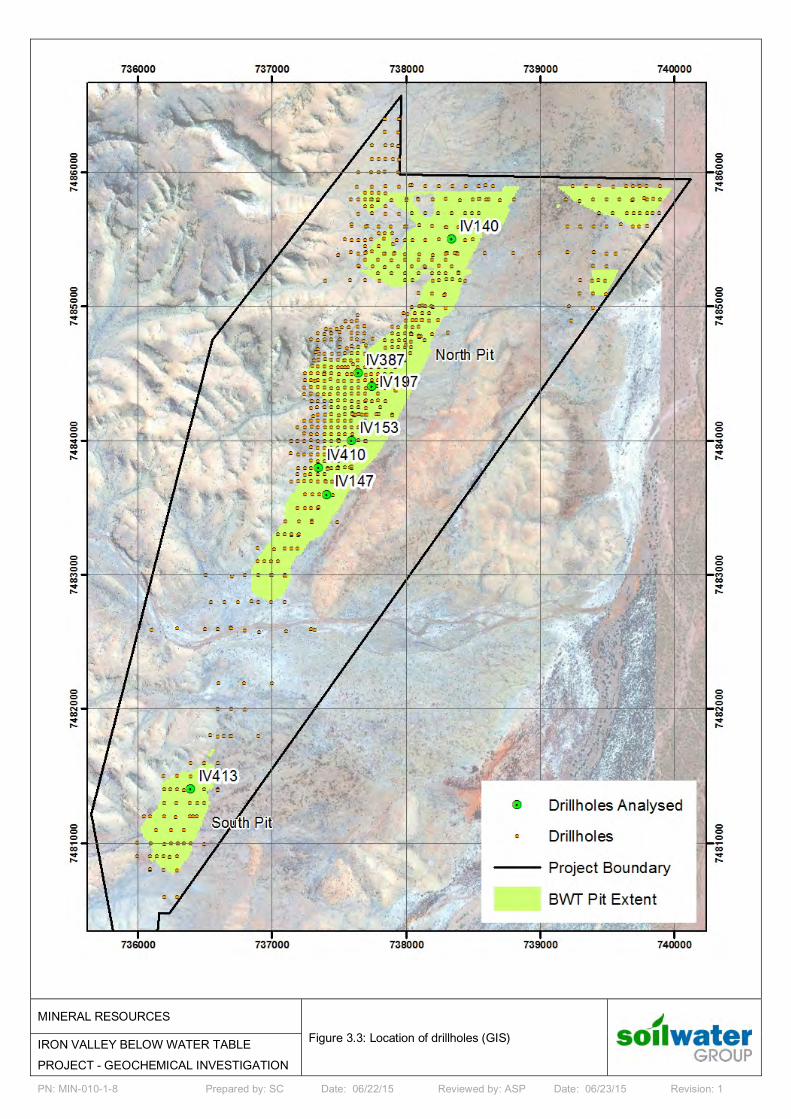
Following the review of the geological drilling data, intervals from eight (8) drillholes held in storage as pulps were selected to undergo screen analysis testing (Figure 3.2 and 3.3). The drillholes were chosen to provide adequate spatial and geological coverage across the deposit, ensuring that all major lithological types and stratigraphic zones identified
IRON VALLEY BELOW WATER TABLE PROJECT - GEOCHEMICAL INVESTIGATION
INVESTIGATION METHODOLOGY
Page 12 of 66
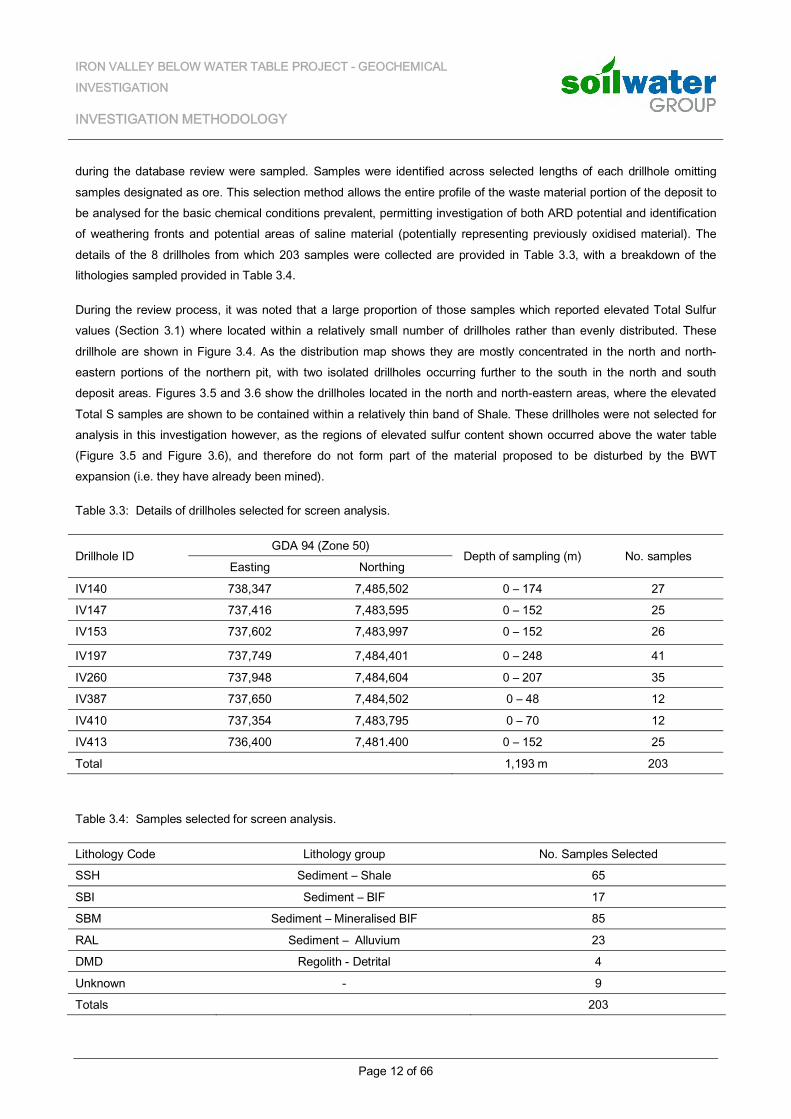
during the database review were sampled. Samples were identified across selected lengths of each drillhole omitting samples designated as ore. This selection method allows the entire profile of the waste material portion of the deposit to be analysed for the basic chemical conditions prevalent, permitting investigation of both ARD potential and identification of weathering fronts and potential areas of saline material (potentially representing previously oxidised material). The details of the 8 drillholes from which 203 samples were collected are provided in Table 3.3, with a breakdown of the lithologies sampled provided in Table 3.4.
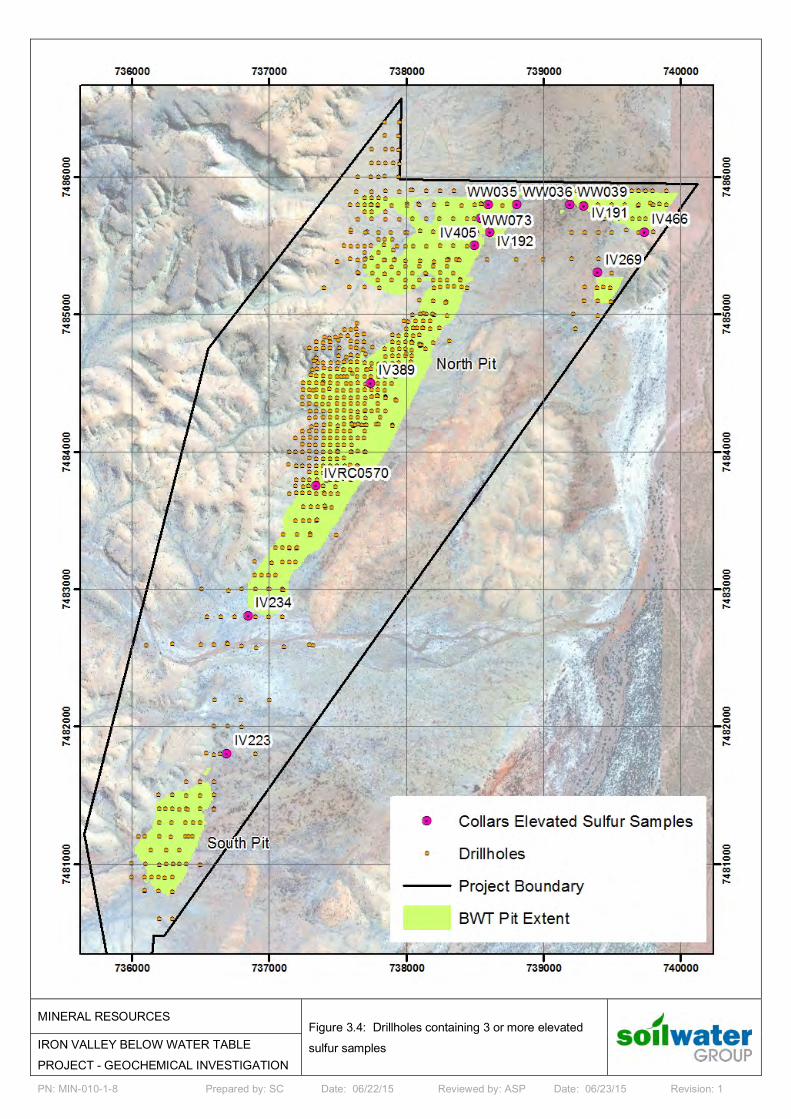
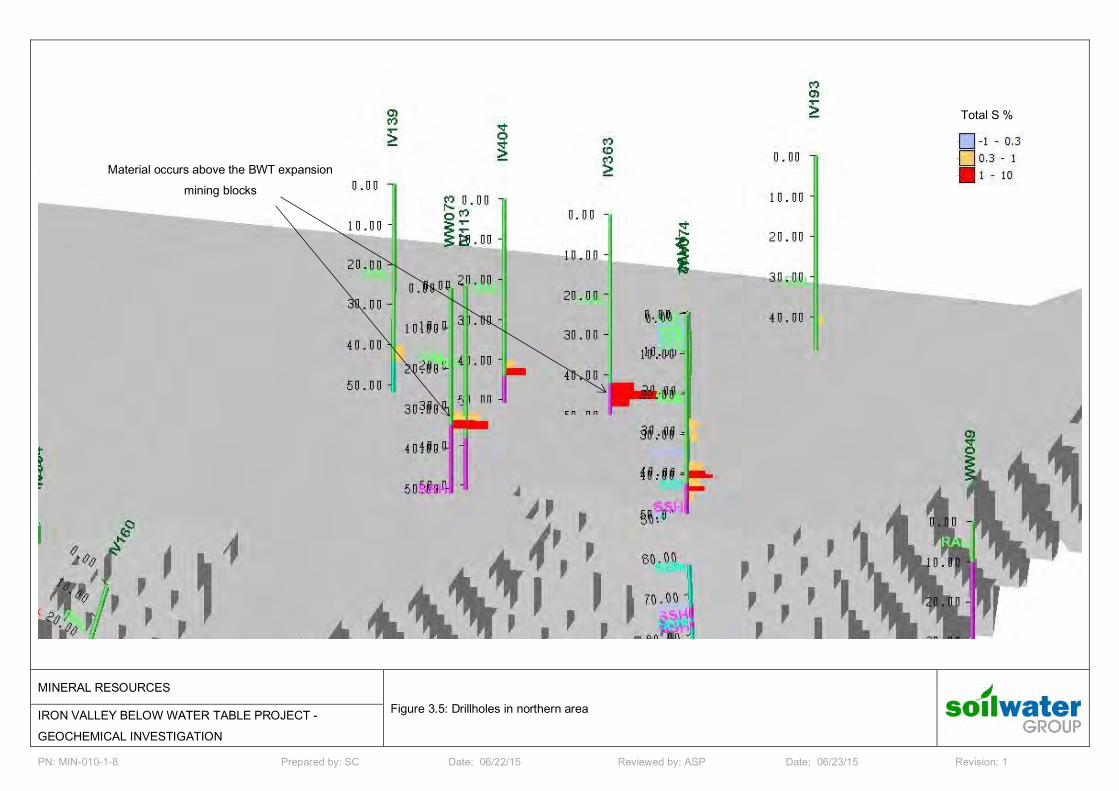
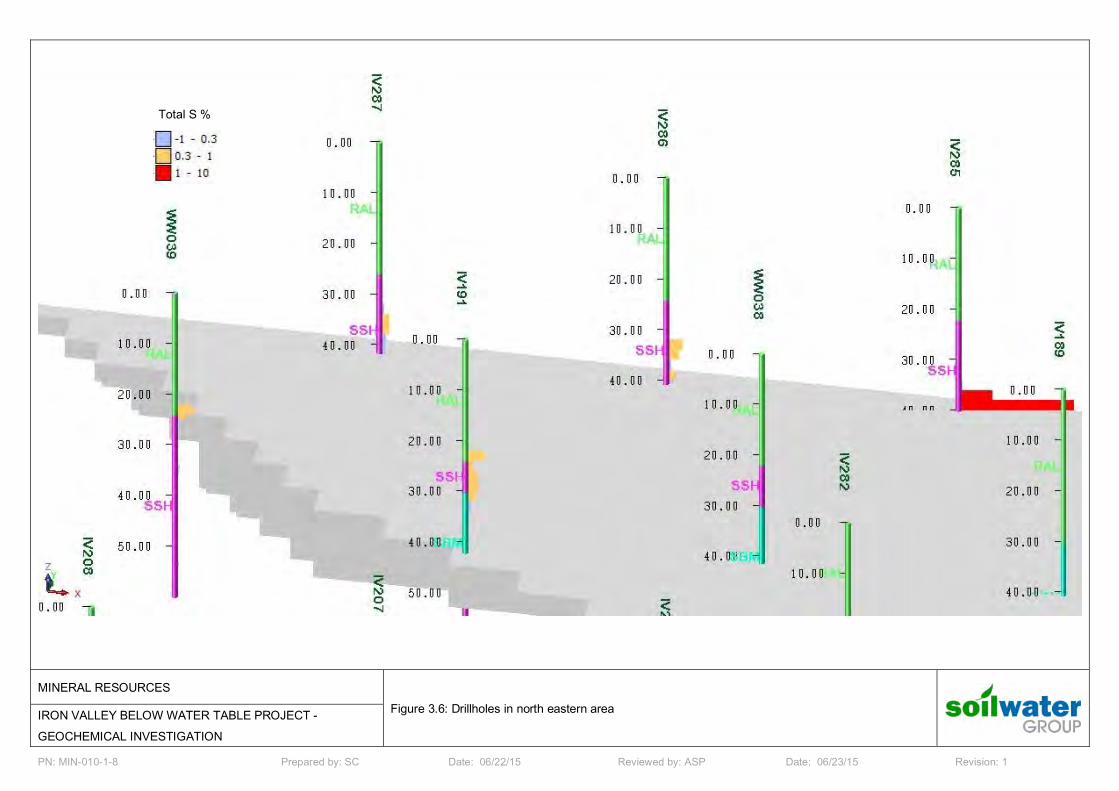
During the review process, it was noted that a large proportion of those samples which reported elevated Total Sulfur values (Section 3.1) where located within a relatively small number of drillholes rather than evenly distributed. These drillhole are shown in Figure 3.4. As the distribution map shows they are mostly concentrated in the north and north-eastern portions of the northern pit, with two isolated drillholes occurring further to the south in the north and south deposit areas. Figures 3.5 and 3.6 show the drillholes located in the north and north-eastern areas, where the elevated Total S samples are shown to be contained within a relatively thin band of Shale. These drillholes were not selected for analysis in this investigation however, as the regions of elevated sulfur content shown occurred above the water table (Figure 3.5 and Figure 3.6), and therefore do not form part of the material proposed to be disturbed by the BWT expansion (i.e. they have already been mined).
Table 3.3: Details of drillholes selected for screen analysis.
Drillhole ID GDA 94 (Zone 50)
Depth of sampling (m) No. samples Easting Northing
IV140 738,347 7,485,502 0 – 174 27
IV147 737,416 7,483,595 0 – 152 25
IV153 737,602 7,483,997 0 – 152 26
IV197 737,749 7,484,401 0 – 248 41
IV260 737,948 7,484,604 0 – 207 35
IV387 737,650 7,484,502 0 – 48 12
IV410 737,354 7,483,795 0 – 70 12
IV413 736,400 7,481.400 0 – 152 25
Total 1,193 m 203
Table 3.4: Samples selected for screen analysis.
Lithology Code Lithology group No. Samples Selected
SSH Sediment – Shale 65
SBI Sediment – BIF 17
SBM Sediment – Mineralised BIF 85
RAL Sediment – Alluvium 23
DMD Regolith - Detrital 4
Unknown - 9
Totals 203
IRON VALLEY BELOW WATER TABLE PROJECT - GEOCHEMICAL INVESTIGATION
INVESTIGATION METHODOLOGY
Page 13 of 66
3.3 LABORATORY ANALYSIS
Samples collected in this investigation were assessed for pH, pHFOX, dispersion characteristics and electrical conductivity (EC), according to the following methods:
pH – 1:5 soil/water extraction. This parameter measures the existing acidity of the waste material sample and provides indication of previous oxidation of sulfides and the potential buffering capacity of the sample.
EC – 1:5 soil/water extraction. This parameter measures the level of salinity of the waste materials, which may reflect previous oxidation of sulfides.
pHFOX – This parameter measures the pH of the waste materials following the addition of 30 % hydrogen peroxide to rapidly oxidise any sulfides present. The method followed is outlined in (Stone and Ahern et al., 1998).
Modified Emerson Dispersion (Aggregate Method) – This methods tests the dispersion potential of the fine (<2 mm) fraction of a material following AS 1289.3.8.1-2006
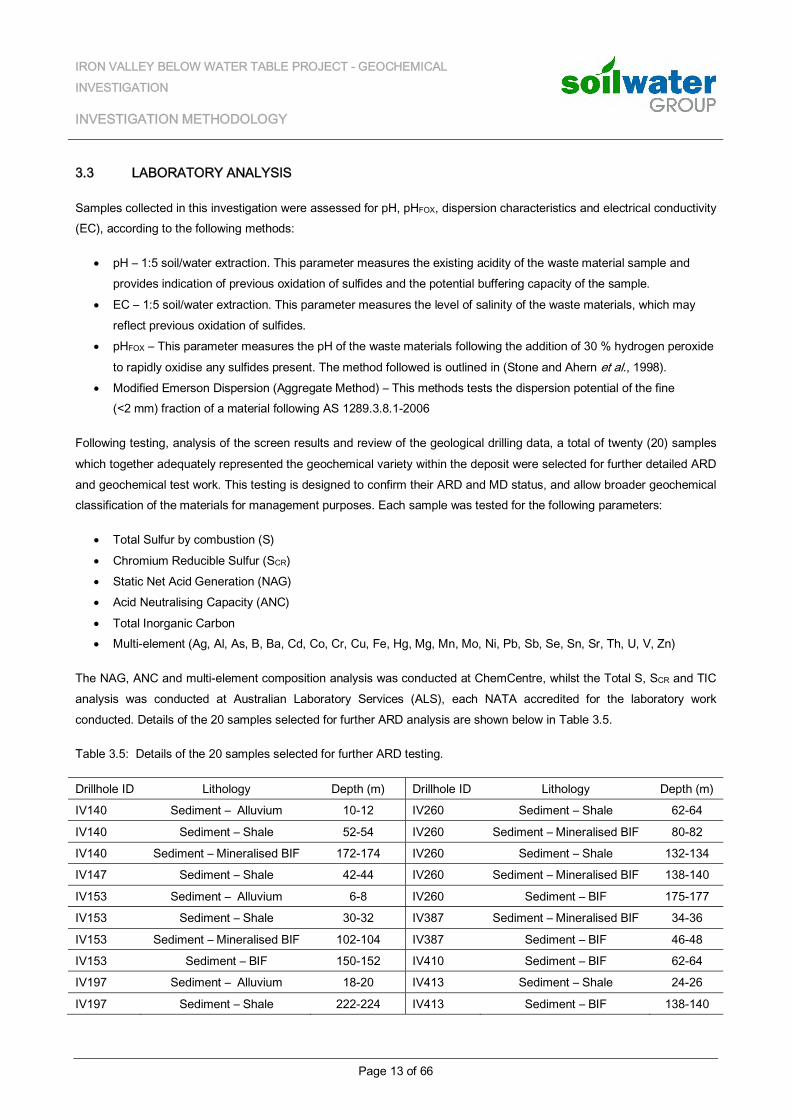
Following testing, analysis of the screen results and review of the geological drilling data, a total of twenty (20) samples which together adequately represented the geochemical variety within the deposit were selected for further detailed ARD and geochemical test work. This testing is designed to confirm their ARD and MD status, and allow broader geochemical classification of the materials for management purposes. Each sample was tested for the following parameters:
Total Sulfur by combustion (S) Chromium Reducible Sulfur (SCR) Static Net Acid Generation (NAG) Acid Neutralising Capacity (ANC) Total Inorganic Carbon Multi-element (Ag, Al, As, B, Ba, Cd, Co, Cr, Cu, Fe, Hg, Mg, Mn, Mo, Ni, Pb, Sb, Se, Sn, Sr, Th, U, V, Zn)
The NAG, ANC and multi-element composition analysis was conducted at ChemCentre, whilst the Total S, SCR and TIC analysis was conducted at Australian Laboratory Services (ALS), each NATA accredited for the laboratory work conducted. Details of the 20 samples selected for further ARD analysis are shown below in Table 3.5.
Table 3.5: Details of the 20 samples selected for further ARD testing.
Drillhole ID Lithology Depth (m) Drillhole ID Lithology Depth (m)
IV140 Sediment – Alluvium 10-12 IV260 Sediment – Shale 62-64
IV140 Sediment – Shale 52-54 IV260 Sediment – Mineralised BIF 80-82
IV140 Sediment – Mineralised BIF 172-174 IV260 Sediment – Shale 132-134
IV147 Sediment – Shale 42-44 IV260 Sediment – Mineralised BIF 138-140
IV153 Sediment – Alluvium 6-8 IV260 Sediment – BIF 175-177
IV153 Sediment – Shale 30-32 IV387 Sediment – Mineralised BIF 34-36
IV153 Sediment – Mineralised BIF 102-104 IV387 Sediment – BIF 46-48
IV153 Sediment – BIF 150-152 IV410 Sediment – BIF 62-64
IV197 Sediment – Alluvium 18-20 IV413 Sediment – Shale 24-26
IV197 Sediment – Shale 222-224 IV413 Sediment – BIF 138-140
PN: MIN-010-1-8 Prepared by: SC Date: 06/22/15 Reviewed by: ASP Date: 06/23/15 Revision: 1
*1 km square grid
MINERAL RESOURCES Figure 3.1: Drillholes completed to date across the Project Area (SURPAC)
IRON VALLEY BELOW WATER TABLE PROJECT - GEOCHEMICAL INVESTIGATION
PN: MIN-010-1-8 Prepared by: SC Date: 06/22/15 Reviewed by: ASP Date: 06/23/15 Revision: 1
*1 km square grid
MINERAL RESOURCES Figure 3.2 : Drillholes selected for screen analysis (SURPAC)
IRON VALLEY BELOW WATER TABLE PROJECT - GEOCHEMICAL INVESTIGATION
PN: MIN-010-1-8 Prepared by: SC Date: 06/22/15 Reviewed by: ASP Date: 06/23/15 Revision: 1
MINERAL RESOURCES
Figure 3.3: Location of drillholes (GIS)
IRON VALLEY BELOW WATER TABLE PROJECT - GEOCHEMICAL INVESTIGATION
PN: MIN-010-1-8 Prepared by: SC Date: 06/22/15 Reviewed by: ASP Date: 06/23/15 Revision: 1
MINERAL RESOURCES Figure 3.4: Drillholes containing 3 or more elevated sulfur samples
IRON VALLEY BELOW WATER TABLE PROJECT - GEOCHEMICAL INVESTIGATION
PN: MIN-010-1-8 Prepared by: SC Date: 06/22/15 Reviewed by: ASP Date: 06/23/15 Revision: 1
MINERAL RESOURCES Figure 3.5: Drillholes in northern area
IRON VALLEY BELOW WATER TABLE PROJECT - GEOCHEMICAL INVESTIGATION
Total S %
Material occurs above the BWT expansion mining blocks
PN: MIN-010-1-8 Prepared by: SC Date: 06/22/15 Reviewed by: ASP Date: 06/23/15 Revision: 1
MINERAL RESOURCES Figure 3.6: Drillholes in north eastern area
IRON VALLEY BELOW WATER TABLE PROJECT - GEOCHEMICAL INVESTIGATION
Total S %
IRON VALLEY BELOW WATER TABLE PROJECT - GEOCHEMICAL INVESTIGATION
STUDY RESULTS
Page 20 of 66
4 STUDY RESULTS
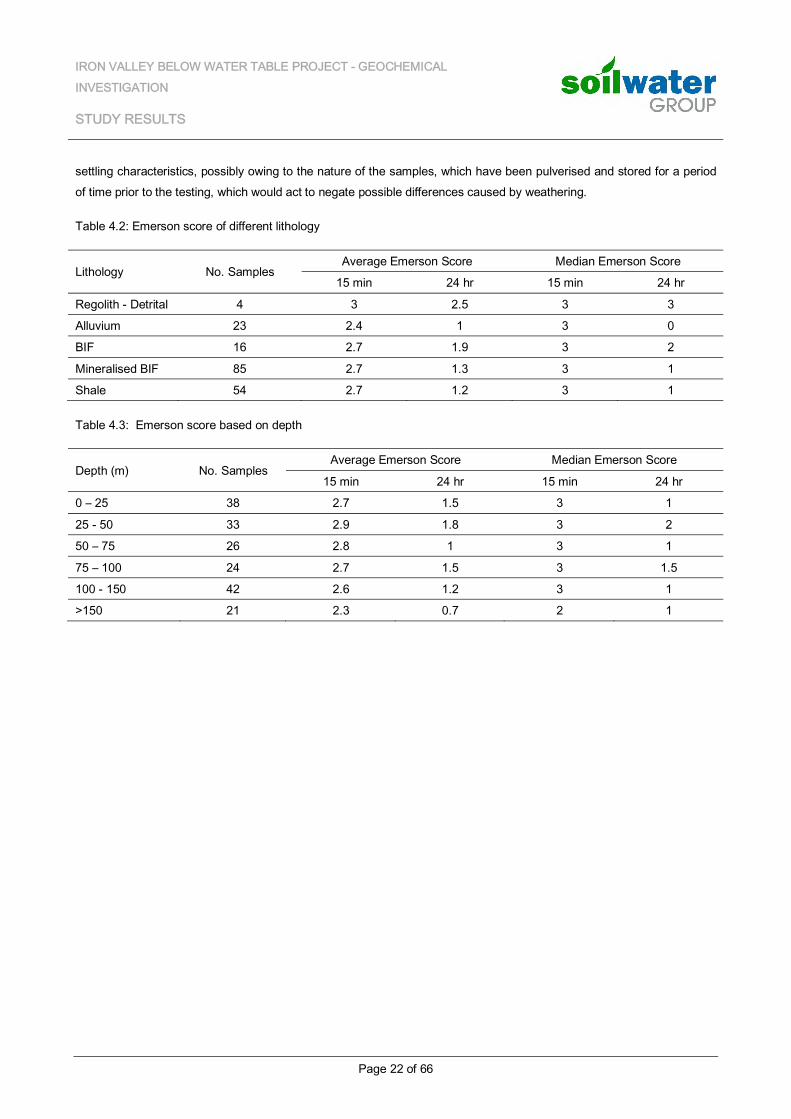
4.1 PH & PHFOX
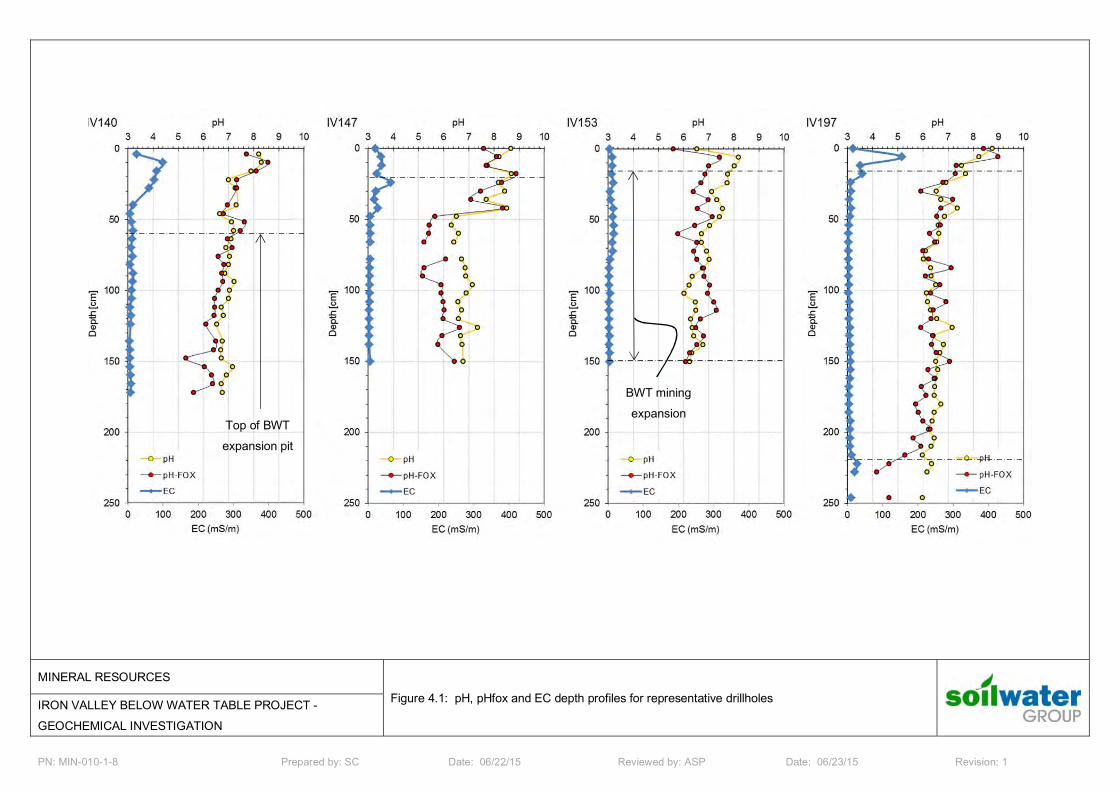
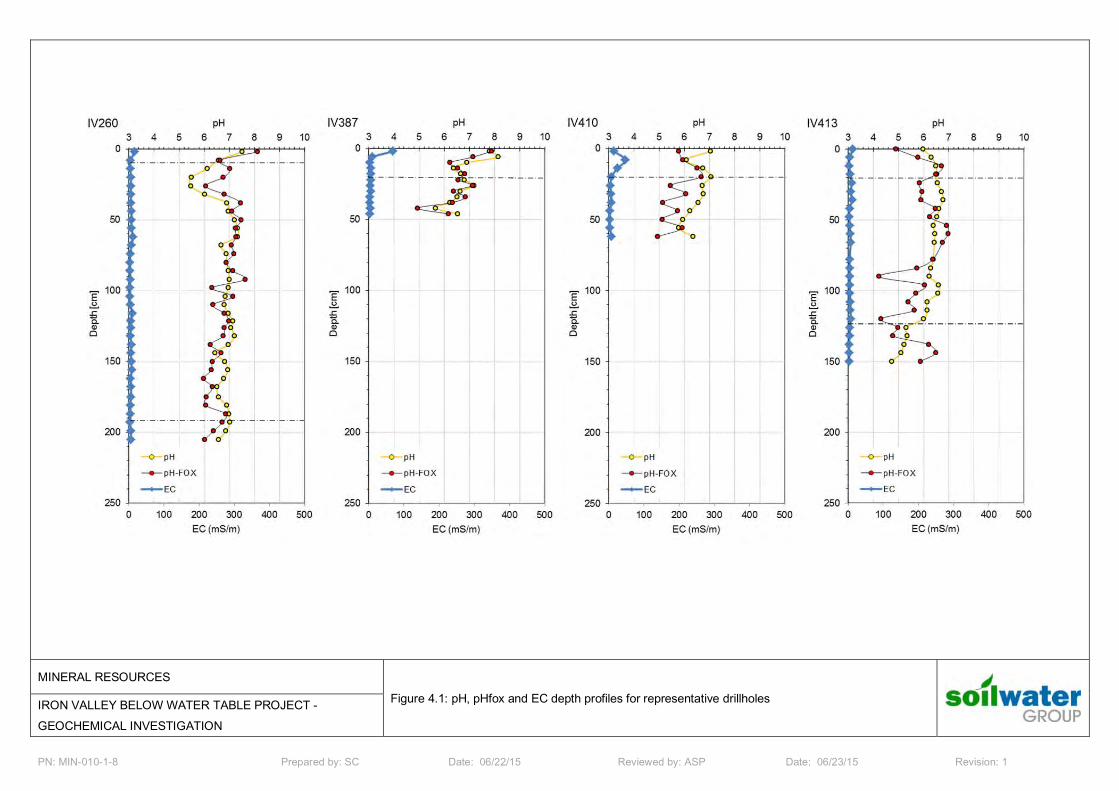
The pH and pHFOX depth profiles for the 8 representative drill holes selected for screen testing (encompassing 203 samples) are shown in Figure 4.1, along with the electrical conductivity data. The pH measurements indicate that the majority of the in situ profile appears to be circum-neutral, with pH values typically within the range of pH = 6-8. Many of the drill holes indicated slightly more alkaline materials at surface, with pH decreasing with depth. Most of the slightly acidic materials existed at depths in excess of 40 m. Drillhole IV147 shows a pronounced change in pH at a depth of approximately 50 m. This depth does not match up with a change in logged lithology (the drillhole encountered Shale in the upper 80 m and Mineralised BIF for the remainder) and may possibly indicate a change in redox conditions caused by the presence of groundwater, although the other drillholes sampled do not repeat this occurrence.
The pHFOX results varied from 8.98 (alkaline) to 4.16 (acidic) with an average of 6.47. The pHFOX results are obtained from analysis modified from acid sulfate soils methods which is similar to the single addition NAG testing discussed in Section 4.7; the main difference being that a direct measurement of the acidity is not conducted. The method allows a quick and cost effective estimation of the potential un-oxidised sulfide concentration within a material for a large number of samples. Due to the similarity with the NAG test, the results are interpreted in a similar fashion. Both the magnitude of change in pH following oxidation (i.e.pHFOX-pH) and the final pH (i.e. pHFOX) are considered. The criteria applied which indicate the possible oxidation of sulfides within a material is a change in pH of > -1 pH unit, coupled with pHFOX values < 4.5.
The pHFOX test results indicate that sulphides are not likely to be present in the BWT materials based on the criteria discussed above, and that there is little potential for further oxidation and subsequent acidification of the tested materials. Measured values were typically pHFOX > 5, and were rarely more than 1 pH units below the corresponding pH measurement.
Table 4.1: Summary statistics for the screen test results
Parameter pH pHFOX pHFOX-pH EC (mS/m)
Maximum 8.76 8.98 -2.02 155.1
Minimum 4.74 4.16 1.39 2.6
Average 6.77 6.47 -0.31 11.2
Median 6.71 6.45 -0.32 6.3
Standard Deviation 0.64 0.81 0.61 17.0
4.2 ELECTRICAL CONDUCTIVITY (EC)
The results of Electrical Conductivity (EC) testing are presented as depth profiles in Figure 4.1. The majority of measured EC values in the BWT portion of the profile were less than 20 mS/m (some larger values were encountered higher in the profile), indicating a deeper profile of relatively low salinity in which past oxidation is unlikely to have occurred. The upper 10 – 20 m of each drillhole display slightly higher EC values, corresponding to increased weathering / oxidation and
IRON VALLEY BELOW WATER TABLE PROJECT - GEOCHEMICAL INVESTIGATION
STUDY RESULTS
Page 21 of 66
regolith development in this portion of the profile. The generally low EC values provide an indication that previous oxidation of sulfides is unlikely to have occurred.
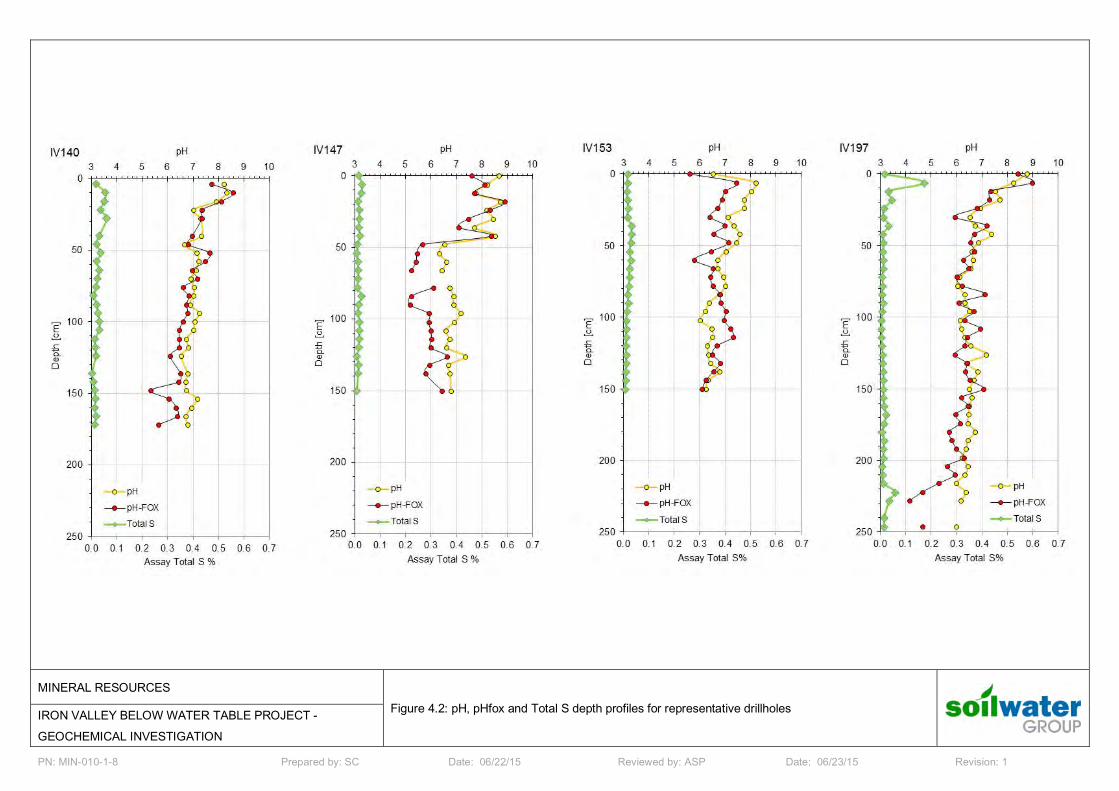
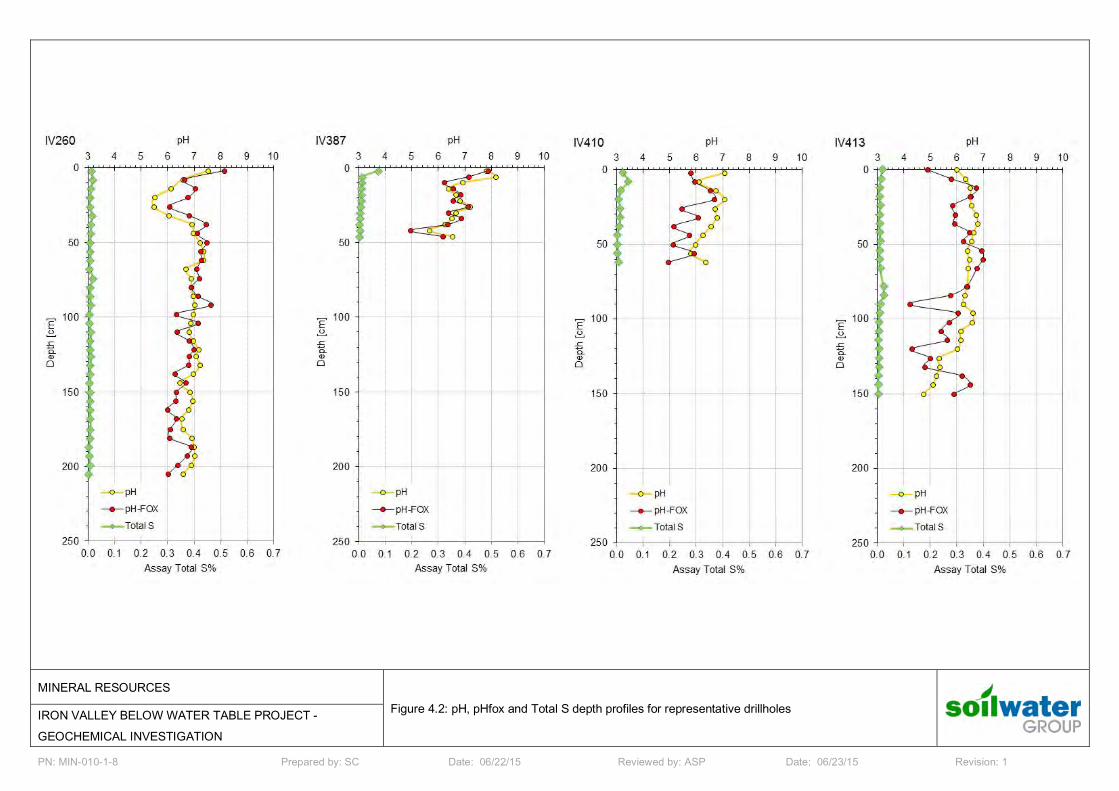
4.3 ASSAY TOTAL SULFUR
The results of Total Sulfur assay testing carried out for the samples within each of the 8 drillholes selected for screen testing are shown in comparison to the pH and pHFOX values within Figure 4.2. The profiles highlight the low Total Sulfur values contained within these drillholes, with only one sample across the 8 drillholes exceeding a Total Sulfur content of 0.1%. These low values place an upper limit on sulfide concentration which is also low, a conclusion which is reinforced by the pHFOX results which show little reaction in the majority of cases in response to forced oxidation via the addition of hydrogen peroxide.
Several samples at the base of Drillhole IV197 show a moderate drop in pHFOX values matching a slight increase in the Total Sulfur values recorded from assay data. Whilst a correlation between these two data sets can be seen, the overall magnitude of the pH drops within these samples is small (max 2 pH units) and crucially the resultant pH after oxidation is still relatively high (above pH 4). This reflects the small Total Sulfur content reported within the material from the assay results; and the resultant limit this places on sulfide concentration.
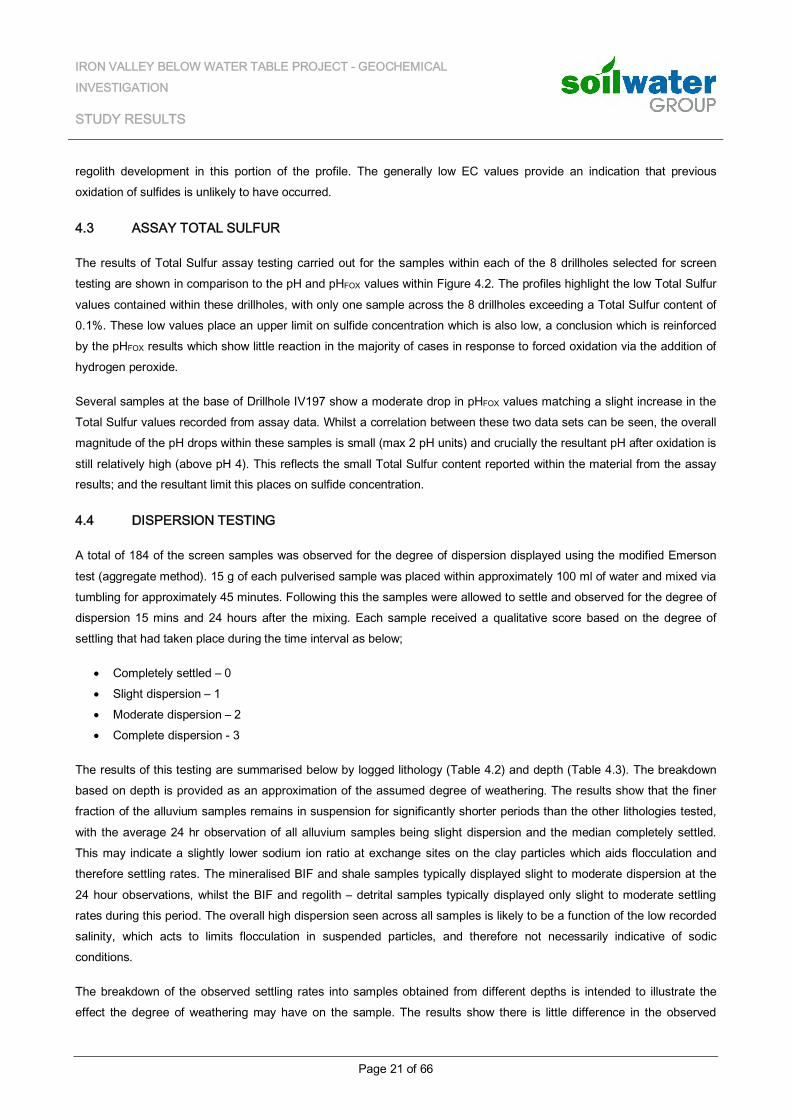
4.4 DISPERSION TESTING
A total of 184 of the screen samples was observed for the degree of dispersion displayed using the modified Emerson test (aggregate method). 15 g of each pulverised sample was placed within approximately 100 ml of water and mixed via tumbling for approximately 45 minutes. Following this the samples were allowed to settle and observed for the degree of dispersion 15 mins and 24 hours after the mixing. Each sample received a qualitative score based on the degree of settling that had taken place during the time interval as below;
Completely settled – 0 Slight dispersion – 1 Moderate dispersion – 2 Complete dispersion - 3
The results of this testing are summarised below by logged lithology (Table 4.2) and depth (Table 4.3). The breakdown based on depth is provided as an approximation of the assumed degree of weathering. The results show that the finer fraction of the alluvium samples remains in suspension for significantly shorter periods than the other lithologies tested, with the average 24 hr observation of all alluvium samples being slight dispersion and the median completely settled. This may indicate a slightly lower sodium ion ratio at exchange sites on the clay particles which aids flocculation and therefore settling rates. The mineralised BIF and shale samples typically displayed slight to moderate dispersion at the 24 hour observations, whilst the BIF and regolith – detrital samples typically displayed only slight to moderate settling rates during this period. The overall high dispersion seen across all samples is likely to be a function of the low recorded salinity, which acts to limits flocculation in suspended particles, and therefore not necessarily indicative of sodic conditions.
The breakdown of the observed settling rates into samples obtained from different depths is intended to illustrate the effect the degree of weathering may have on the sample. The results show there is little difference in the observed
IRON VALLEY BELOW WATER TABLE PROJECT - GEOCHEMICAL INVESTIGATION
STUDY RESULTS
Page 22 of 66
settling characteristics, possibly owing to the nature of the samples, which have been pulverised and stored for a period of time prior to the testing, which would act to negate possible differences caused by weathering.
Table 4.2: Emerson score of different lithology
Lithology No. Samples Average Emerson Score Median Emerson Score
15 min 24 hr 15 min 24 hr
Regolith - Detrital 4 3 2.5 3 3
Alluvium 23 2.4 1 3 0
BIF 16 2.7 1.9 3 2
Mineralised BIF 85 2.7 1.3 3 1
Shale 54 2.7 1.2 3 1
Table 4.3: Emerson score based on depth
Depth (m) No. Samples Average Emerson Score Median Emerson Score
15 min 24 hr 15 min 24 hr
0 – 25 38 2.7 1.5 3 1
25 - 50 33 2.9 1.8 3 2
50 – 75 26 2.8 1 3 1
75 – 100 24 2.7 1.5 3 1.5
100 - 150 42 2.6 1.2 3 1
>150 21 2.3 0.7 2 1
PN: MIN-010-1-8 Prepared by: SC Date: 06/22/15 Reviewed by: ASP Date: 06/23/15 Revision: 1
MINERAL RESOURCES Figure 4.1: pH, pHfox and EC depth profiles for representative drillholes
IRON VALLEY BELOW WATER TABLE PROJECT - GEOCHEMICAL INVESTIGATION
BWT mining expansion
Top of BWT expansion pit
PN: MIN-010-1-8 Prepared by: SC Date: 06/22/15 Reviewed by: ASP Date: 06/23/15 Revision: 1
MINERAL RESOURCES
Figure 4.1: pH, pHfox and EC depth profiles for representative drillholes
IRON VALLEY BELOW WATER TABLE PROJECT - GEOCHEMICAL INVESTIGATION
PN: MIN-010-1-8 Prepared by: SC Date: 06/22/15 Reviewed by: ASP Date: 06/23/15 Revision: 1
MINERAL RESOURCES Figure 4.2: pH, pHfox and Total S depth profiles for representative drillholes
IRON VALLEY BELOW WATER TABLE PROJECT - GEOCHEMICAL INVESTIGATION
PN: MIN-010-1-8 Prepared by: SC Date: 06/22/15 Reviewed by: ASP Date: 06/23/15 Revision: 1
MINERAL RESOURCES Figure 4.2: pH, pHfox and Total S depth profiles for representative drillholes
IRON VALLEY BELOW WATER TABLE PROJECT - GEOCHEMICAL INVESTIGATION
IRON VALLEY BELOW WATER TABLE PROJECT - GEOCHEMICAL INVESTIGATION
STUDY RESULTS
Page 27 of 66
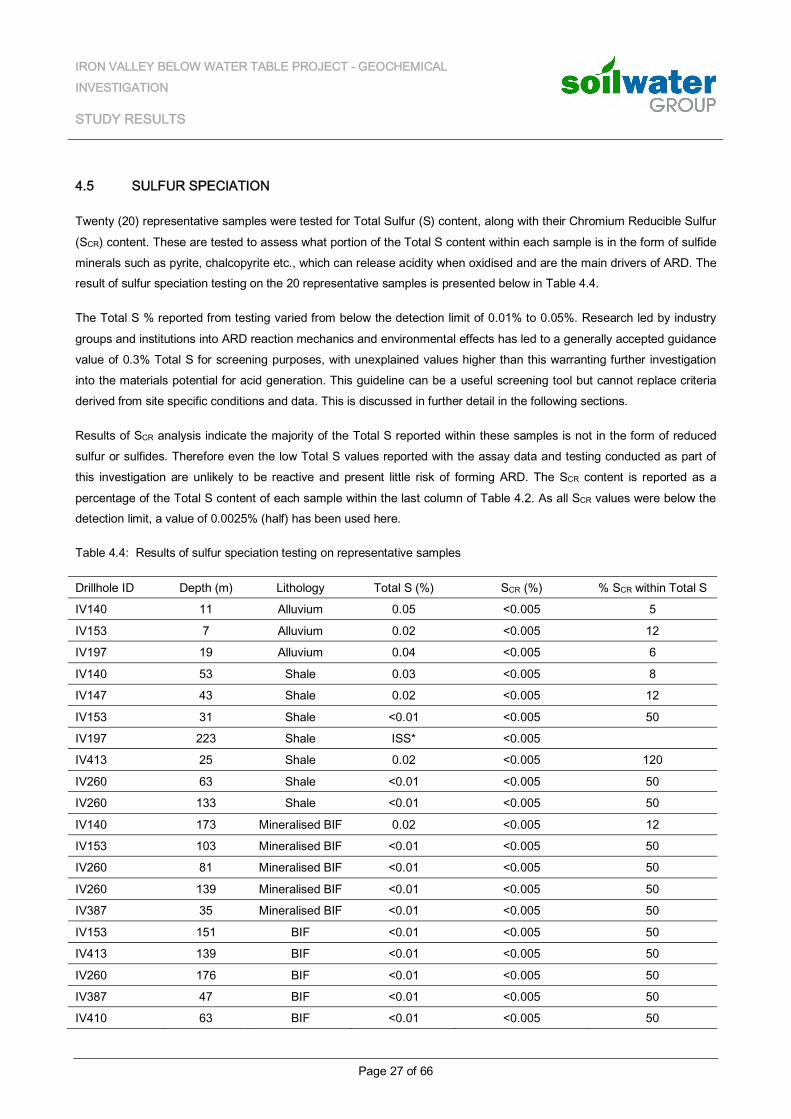
4.5 SULFUR SPECIATION
Twenty (20) representative samples were tested for Total Sulfur (S) content, along with their Chromium Reducible Sulfur (SCR) content. These are tested to assess what portion of the Total S content within each sample is in the form of sulfide minerals such as pyrite, chalcopyrite etc., which can release acidity when oxidised and are the main drivers of ARD. The result of sulfur speciation testing on the 20 representative samples is presented below in Table 4.4.
The Total S % reported from testing varied from below the detection limit of 0.01% to 0.05%. Research led by industry groups and institutions into ARD reaction mechanics and environmental effects has led to a generally accepted guidance value of 0.3% Total S for screening purposes, with unexplained values higher than this warranting further investigation into the materials potential for acid generation. This guideline can be a useful screening tool but cannot replace criteria derived from site specific conditions and data. This is discussed in further detail in the following sections.
Results of SCR analysis indicate the majority of the Total S reported within these samples is not in the form of reduced sulfur or sulfides. Therefore even the low Total S values reported with the assay data and testing conducted as part of this investigation are unlikely to be reactive and present little risk of forming ARD. The SCR content is reported as a percentage of the Total S content of each sample within the last column of Table 4.2. As all SCR values were below the detection limit, a value of 0.0025% (half) has been used here.
Table 4.4: Results of sulfur speciation testing on representative samples
Drillhole ID Depth (m) Lithology Total S (%) SCR (%) % SCR within Total S
IV140 11 Alluvium 0.05 <0.005 5
IV153 7 Alluvium 0.02 <0.005 12
IV197 19 Alluvium 0.04 <0.005 6
IV140 53 Shale 0.03 <0.005 8
IV147 43 Shale 0.02 <0.005 12
IV153 31 Shale <0.01 <0.005 50
IV197 223 Shale ISS* <0.005
IV413 25 Shale 0.02 <0.005 120
IV260 63 Shale <0.01 <0.005 50
IV260 133 Shale <0.01 <0.005 50
IV140 173 Mineralised BIF 0.02 <0.005 12
IV153 103 Mineralised BIF <0.01 <0.005 50
IV260 81 Mineralised BIF <0.01 <0.005 50
IV260 139 Mineralised BIF <0.01 <0.005 50
IV387 35 Mineralised BIF <0.01 <0.005 50
IV153 151 BIF <0.01 <0.005 50
IV413 139 BIF <0.01 <0.005 50
IV260 176 BIF <0.01 <0.005 50
IV387 47 BIF <0.01 <0.005 50
IV410 63 BIF <0.01 <0.005 50
IRON VALLEY BELOW WATER TABLE PROJECT - GEOCHEMICAL INVESTIGATION
STUDY RESULTS
Page 28 of 66
*Insufficient sample remaining to carry out analysis
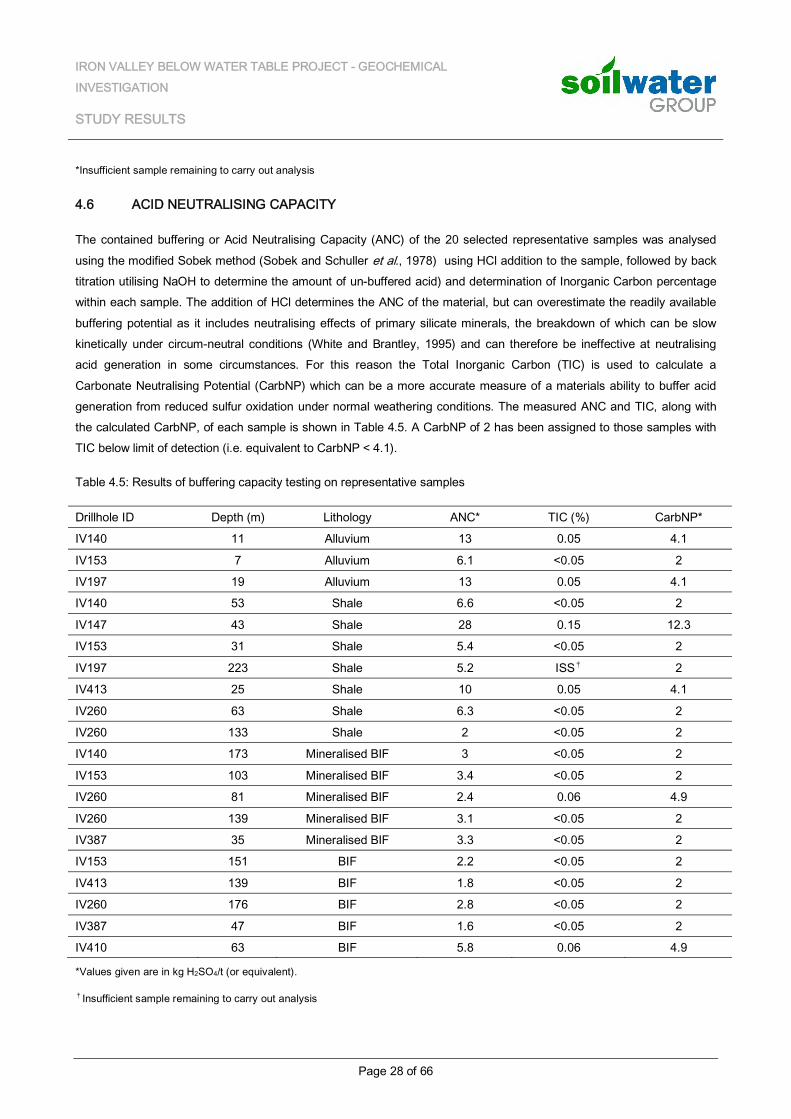
4.6 ACID NEUTRALISING CAPACITY
The contained buffering or Acid Neutralising Capacity (ANC) of the 20 selected representative samples was analysed using the modified Sobek method (Sobek and Schuller et al., 1978) using HCl addition to the sample, followed by back titration utilising NaOH to determine the amount of un-buffered acid) and determination of Inorganic Carbon percentage within each sample. The addition of HCl determines the ANC of the material, but can overestimate the readily available buffering potential as it includes neutralising effects of primary silicate minerals, the breakdown of which can be slow kinetically under circum-neutral conditions (White and Brantley, 1995) and can therefore be ineffective at neutralising acid generation in some circumstances. For this reason the Total Inorganic Carbon (TIC) is used to calculate a Carbonate Neutralising Potential (CarbNP) which can be a more accurate measure of a materials ability to buffer acid generation from reduced sulfur oxidation under normal weathering conditions. The measured ANC and TIC, along with the calculated CarbNP, of each sample is shown in Table 4.5. A CarbNP of 2 has been assigned to those samples with TIC below limit of detection (i.e. equivalent to CarbNP < 4.1).
Table 4.5: Results of buffering capacity testing on representative samples
Drillhole ID Depth (m) Lithology ANC* TIC (%) CarbNP*
IV140 11 Alluvium 13 0.05 4.1
IV153 7 Alluvium 6.1 <0.05 2
IV197 19 Alluvium 13 0.05 4.1
IV140 53 Shale 6.6 <0.05 2
IV147 43 Shale 28 0.15 12.3
IV153 31 Shale 5.4 <0.05 2
IV197 223 Shale 5.2 ISS† 2
IV413 25 Shale 10 0.05 4.1
IV260 63 Shale 6.3 <0.05 2
IV260 133 Shale 2 <0.05 2
IV140 173 Mineralised BIF 3 <0.05 2
IV153 103 Mineralised BIF 3.4 <0.05 2
IV260 81 Mineralised BIF 2.4 0.06 4.9
IV260 139 Mineralised BIF 3.1 <0.05 2
IV387 35 Mineralised BIF 3.3 <0.05 2
IV153 151 BIF 2.2 <0.05 2
IV413 139 BIF 1.8 <0.05 2
IV260 176 BIF 2.8 <0.05 2
IV387 47 BIF 1.6 <0.05 2
IV410 63 BIF 5.8 0.06 4.9
*Values given are in kg H2SO4/t (or equivalent).
†Insufficient sample remaining to carry out analysis
IRON VALLEY BELOW WATER TABLE PROJECT - GEOCHEMICAL INVESTIGATION
STUDY RESULTS
Page 29 of 66
It can be seen that in the case of one sample (Mineralised BIF from IV260 @ 81 m) the calculated CarbNP is larger than the corresponding ANC. In these instances it is likely that some portion of the TIC measured is in the form of Fe (siderite) and/or Mn (rhodochrosite) carbonates that do not generally contribute to acid neutralisation under normal weathering conditions (Price, 2009) and therefore are not detected during the ANC determination.
All of the major material types tested displayed relatively low ANC contents < 30 kg H2SO4/t which indicates a low expected buffering capacity within these materials. The regolith Alluvium samples contained the highest ANC as a group when compared to other waste material types tested, averaging over 10 kg H2SO4/t equivalent of measured buffering capacity across the three samples tested. The sedimentary BIF and Shale samples tested displayed lower buffering capacities; with Shale reporting an average ANC of 8 kg H2SO4/t equivalent, and the two BIF lithologies ANC of < 5 kg H2SO4/t equivalent. The calculated CarbNP results in general mirrored the ANC results, but were also generally lower, which as discussed is likely due to the inclusion of buffering effects from primary silicates in the ANC determination.
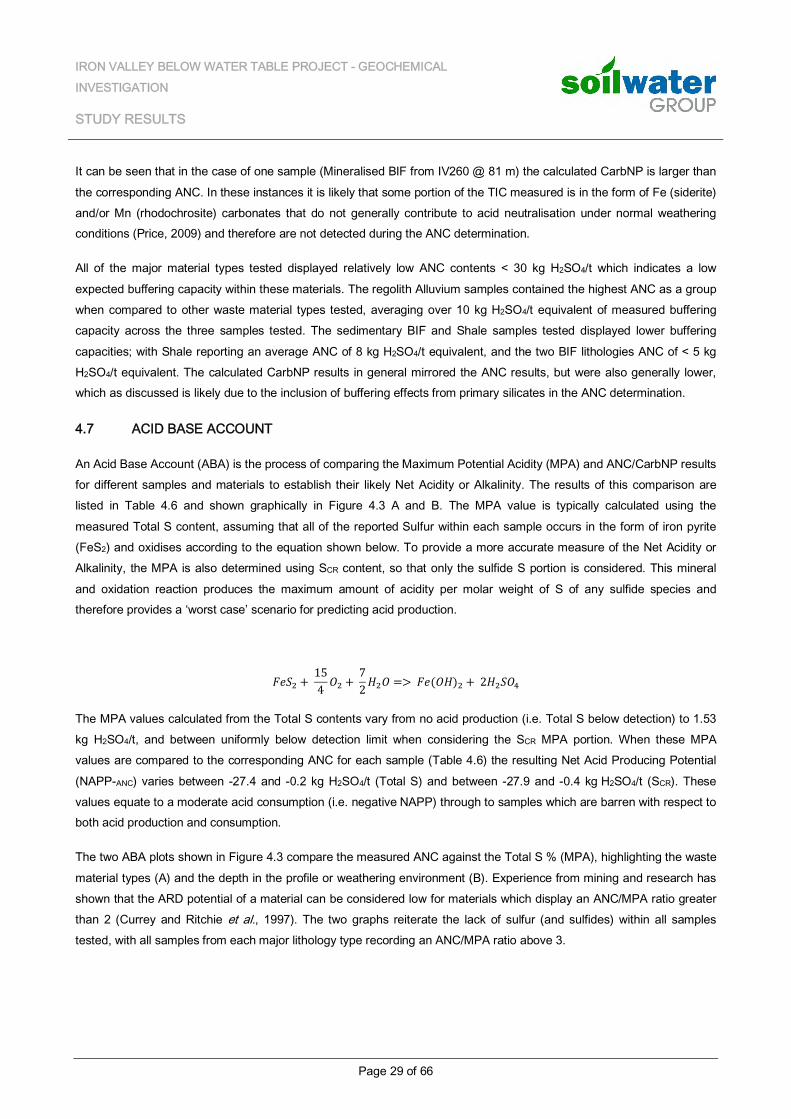
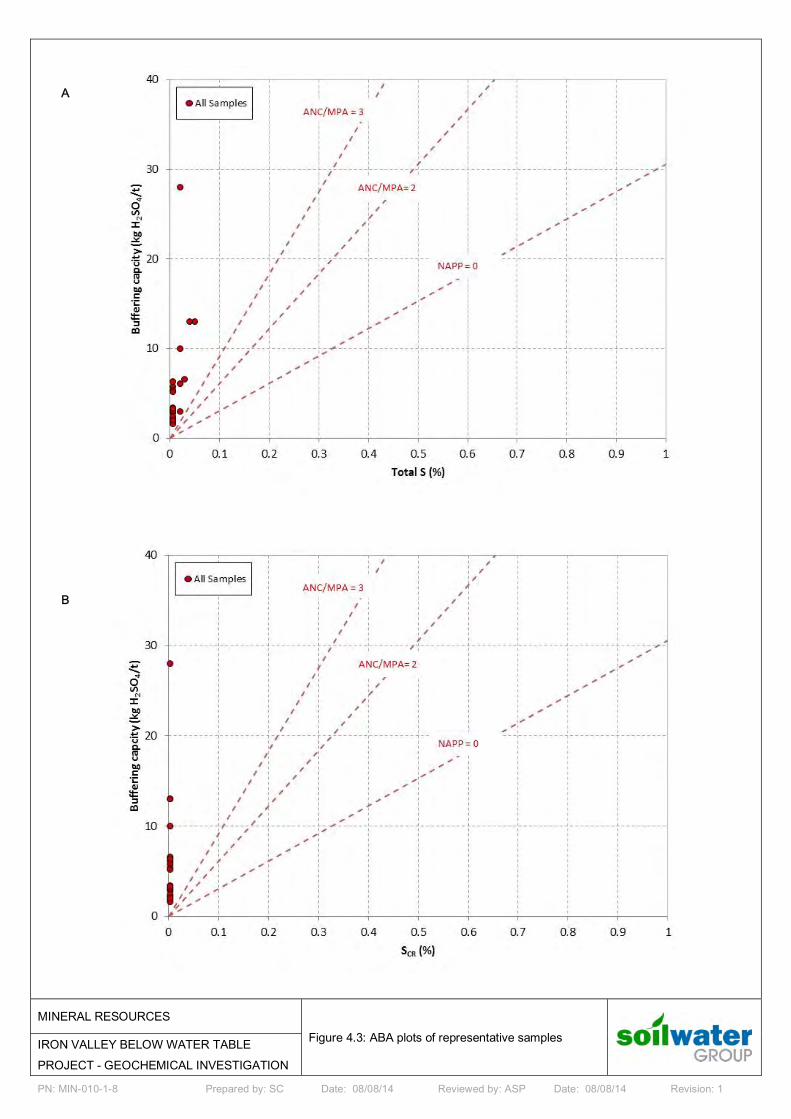
4.7 ACID BASE ACCOUNT
An Acid Base Account (ABA) is the process of comparing the Maximum Potential Acidity (MPA) and ANC/CarbNP results for different samples and materials to establish their likely Net Acidity or Alkalinity. The results of this comparison are listed in Table 4.6 and shown graphically in Figure 4.3 A and B. The MPA value is typically calculated using the measured Total S content, assuming that all of the reported Sulfur within each sample occurs in the form of iron pyrite (FeS2) and oxidises according to the equation shown below. To provide a more accurate measure of the Net Acidity or Alkalinity, the MPA is also determined using SCR content, so that only the sulfide S portion is considered. This mineral and oxidation reaction produces the maximum amount of acidity per molar weight of S of any sulfide species and therefore provides a ‘worst case’ scenario for predicting acid production.
154
72
2
The MPA values calculated from the Total S contents vary from no acid production (i.e. Total S below detection) to 1.53 kg H2SO4/t, and between uniformly below detection limit when considering the SCR MPA portion. When these MPA values are compared to the corresponding ANC for each sample (Table 4.6) the resulting Net Acid Producing Potential (NAPP-ANC) varies between -27.4 and -0.2 kg H2SO4/t (Total S) and between -27.9 and -0.4 kg H2SO4/t (SCR). These values equate to a moderate acid consumption (i.e. negative NAPP) through to samples which are barren with respect to both acid production and consumption.
The two ABA plots shown in Figure 4.3 compare the measured ANC against the Total S % (MPA), highlighting the waste material types (A) and the depth in the profile or weathering environment (B). Experience from mining and research has shown that the ARD potential of a material can be considered low for materials which display an ANC/MPA ratio greater than 2 (Currey and Ritchie et al., 1997). The two graphs reiterate the lack of sulfur (and sulfides) within all samples tested, with all samples from each major lithology type recording an ANC/MPA ratio above 3.
IRON VALLEY BELOW WATER TABLE PROJECT - GEOCHEMICAL INVESTIGATION
STUDY RESULTS
Page 30 of 66
Table 4.6: Acid Base Account for representative samples
Drillhole ID
Depth (m)
Lithology MPA* Total S MPA* SCR ANC* CarbNP* NAPP*Total S-
ANC NAPP*Total S-
CarbNP NAPP*SC
R-ANC NAPP*SCR-
CarbNP
IV140 11 Alluvium 1.53 <0.15 13 4.1 -11.5 -2.6 -12.9 -4.0
IV153 7 Alluvium 0.61 <0.15 6.1 <4.1 -5.5 -1.4 -6.0 -2.0
IV197 19 Alluvium 1.22 <0.15 13 4.1 -11.8 -2.9 -12.9 -4.0
IV140 53 Shale 0.92 <0.15 6.6 <4.1 -5.7 -1.1 -6.5 -2.0
IV147 43 Shale 0.61 <0.15 28 12.3 -27.4 -11.6 -27.9 -12.2
IV153 31 Shale <0.31 <0.15 5.4 <4.1 -5.2 -1.9 -5.3 -2.0
IV197 223 Shale <0.31 <0.15 5.2 <4.1 -5.0 -1.9 -5.1 -2.0
IV413 25 Shale 0.61 <0.15 10 4.1 -9.4 -3.5 -9.9 -4.0
IV260 63 Shale <0.31 <0.15 6.3 <4.1 -6.1 -1.9 -6.2 -2.0
IV260 133 Shale <0.31 <0.15 2 <4.1 -1.8 -1.9 -1.9 -2.0
IV140 173 Mineralised BIF 0.61 <0.15 3 <4.1 -2.4 -1.4 -2.9 -2.0
IV153 103 Mineralised BIF <0.31 <0.15 3.4 <4.1 -3.2 -1.9 -3.3 -2.0
IV260 81 Mineralised BIF <0.31 <0.15 2.4 4.9 -2.2 -1.9 -2.3 -4.8
IV260 139 Mineralised BIF <0.31 <0.15 3.1 <4.1 -2.9 -1.9 -3.0 -2.0
IV387 35 Mineralised BIF <0.31 <0.15 3.3 <4.1 -3.1 -1.9 -3.2 -2.0
IV153 151 BIF <0.31 <0.15 2.2 <4.1 -2.0 -1.9 -2.1 -2.0
IV413 139 BIF <0.31 <0.15 1.8 <4.1 -1.6 -1.9 -1.7 -2.0
IV260 176 BIF <0.31 <0.15 2.8 <4.1 -2.6 -1.9 -2.7 -2.0
IV387 47 BIF <0.31 <0.15 1.6 <4.1 -1.4 -1.9 -1.5 -2.0
IV410 63 BIF <0.31 <0.15 5.8 4.9 -5.6 -1.9 -5.7 -4.8
*Values given are in Kg H2SO4/t or equivalent.
PN: MIN-010-1-8 Prepared by: SC Date: 08/08/14 Reviewed by: ASP Date: 08/08/14 Revision: 1
MINERAL RESOURCES Figure 4.3: ABA plots of representative samples
IRON VALLEY BELOW WATER TABLE PROJECT - GEOCHEMICAL INVESTIGATION
A
B
IRON VALLEY BELOW WATER TABLE PROJECT - GEOCHEMICAL INVESTIGATION
STUDY RESULTS
Page 32 of 66
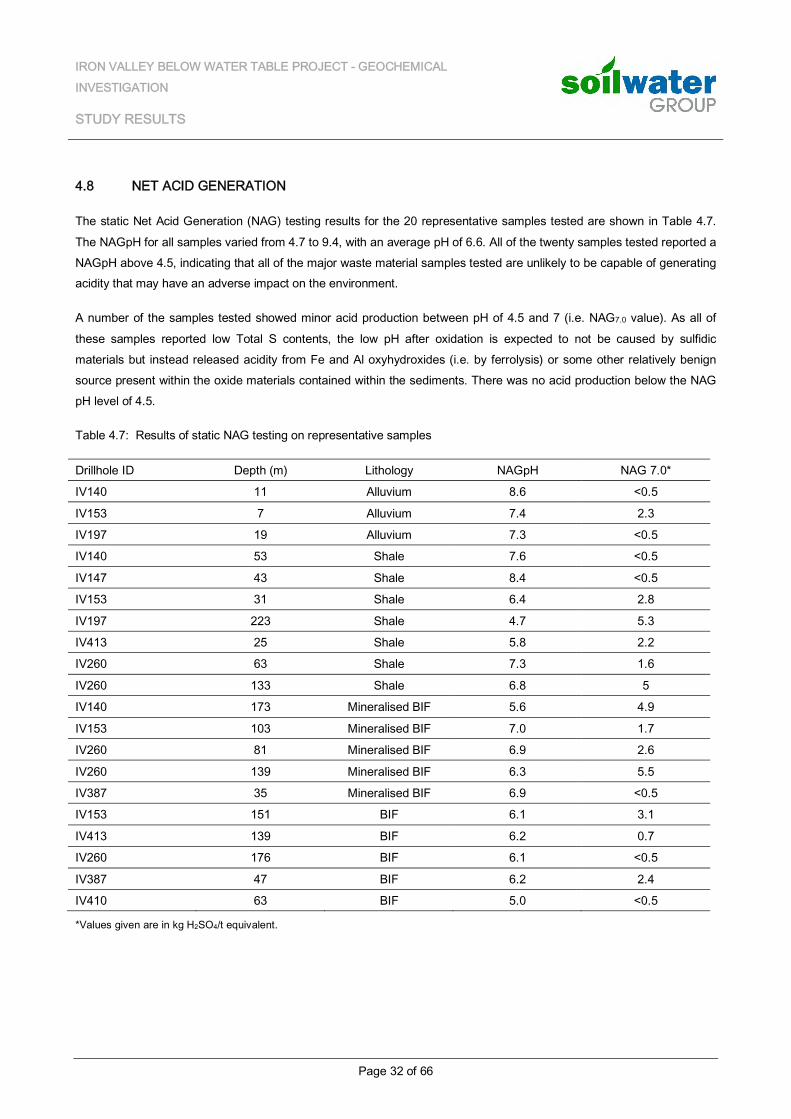
4.8 NET ACID GENERATION
The static Net Acid Generation (NAG) testing results for the 20 representative samples tested are shown in Table 4.7. The NAGpH for all samples varied from 4.7 to 9.4, with an average pH of 6.6. All of the twenty samples tested reported a NAGpH above 4.5, indicating that all of the major waste material samples tested are unlikely to be capable of generating acidity that may have an adverse impact on the environment.
A number of the samples tested showed minor acid production between pH of 4.5 and 7 (i.e. NAG7.0 value). As all of these samples reported low Total S contents, the low pH after oxidation is expected to not be caused by sulfidic materials but instead released acidity from Fe and Al oxyhydroxides (i.e. by ferrolysis) or some other relatively benign source present within the oxide materials contained within the sediments. There was no acid production below the NAG pH level of 4.5.
Table 4.7: Results of static NAG testing on representative samples
Drillhole ID Depth (m) Lithology NAGpH NAG 7.0*
IV140 11 Alluvium 8.6 <0.5
IV153 7 Alluvium 7.4 2.3
IV197 19 Alluvium 7.3 <0.5
IV140 53 Shale 7.6 <0.5
IV147 43 Shale 8.4 <0.5
IV153 31 Shale 6.4 2.8
IV197 223 Shale 4.7 5.3
IV413 25 Shale 5.8 2.2
IV260 63 Shale 7.3 1.6
IV260 133 Shale 6.8 5
IV140 173 Mineralised BIF 5.6 4.9
IV153 103 Mineralised BIF 7.0 1.7
IV260 81 Mineralised BIF 6.9 2.6
IV260 139 Mineralised BIF 6.3 5.5
IV387 35 Mineralised BIF 6.9 <0.5
IV153 151 BIF 6.1 3.1
IV413 139 BIF 6.2 0.7
IV260 176 BIF 6.1 <0.5
IV387 47 BIF 6.2 2.4
IV410 63 BIF 5.0 <0.5
*Values given are in kg H2SO4/t equivalent.
IRON VALLEY BELOW WATER TABLE PROJECT - GEOCHEMICAL INVESTIGATION
STUDY RESULTS
Page 33 of 66
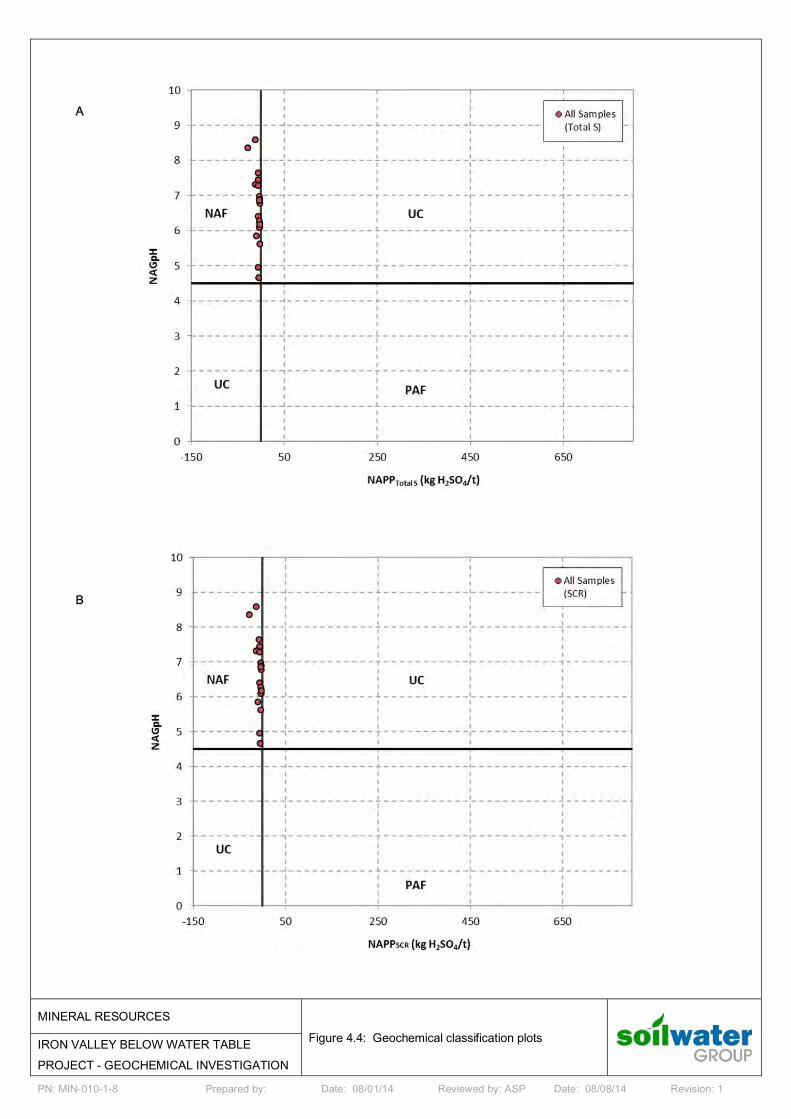
4.9 GEOCHEMICAL CLASSIFICATION
The results from the static NAG testing are used in conjunction with the NAPP results (ABA) to allow a geochemical classification of the acid generating potential of a material. Samples are placed into one of three categories based on the following criteria:
Non-acid forming (NAF) – Samples classified as NAF may have significant acid generating potential but contain sufficient readily available ANC to adequately buffer any acidity formed. A sample is classified as NAF when it has a negative NAPP and a final NAGpH ≥ 4.5.
Potentially-acid forming (PAF) – Samples with a PAF classification present the risk of generating acidic drainage if oxidation (i.e. exposure to atmospheric conditions) occurs. A sample is classified as PAF when it has a positive NAPP and a final NAGpH < 4.5.
Uncertain (UC) – An uncertain classification is used where there is a conflict between the NAPP and NAG test results (i.e. where the NAPP is positive and the NAGpH ≥ 4.5 or vice versa). Uncertain sample classification may require further investigation to determine the likely acid generation potential.
Geochemical classification plots of the 20 representative samples tested are presented in Figure 4.4 A (Total S) and Figure 4.4 B (SCR). The plots highlight the relatively low sulfur contents within all of the samples, and indicate all samples to be essentially barren of both acid producing and acid buffering capacity.
PN: MIN-010-1-8 Prepared by: Date: 08/01/14 Reviewed by: ASP Date: 08/08/14 Revision: 1
MINERAL RESOURCES
Figure 4.4: Geochemical classification plots
IRON VALLEY BELOW WATER TABLE PROJECT - GEOCHEMICAL INVESTIGATION
A
B
IRON VALLEY BELOW WATER TABLE PROJECT - GEOCHEMICAL INVESTIGATION
STUDY RESULTS
Page 35 of 66
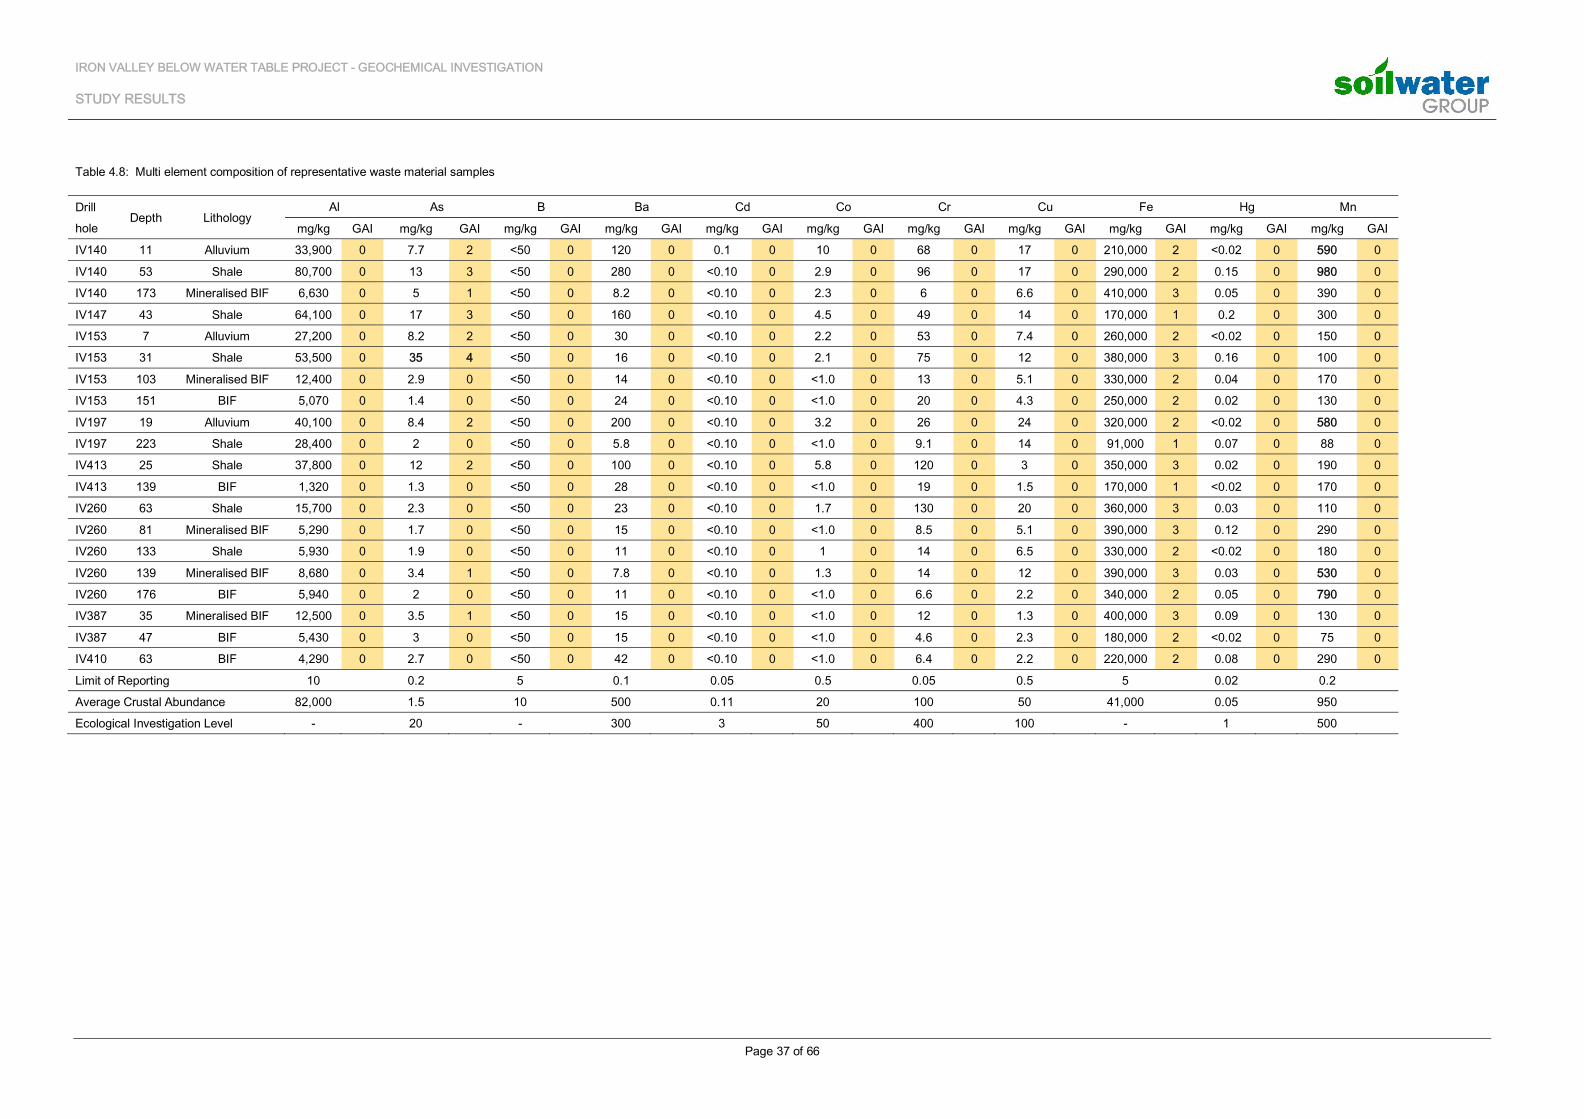
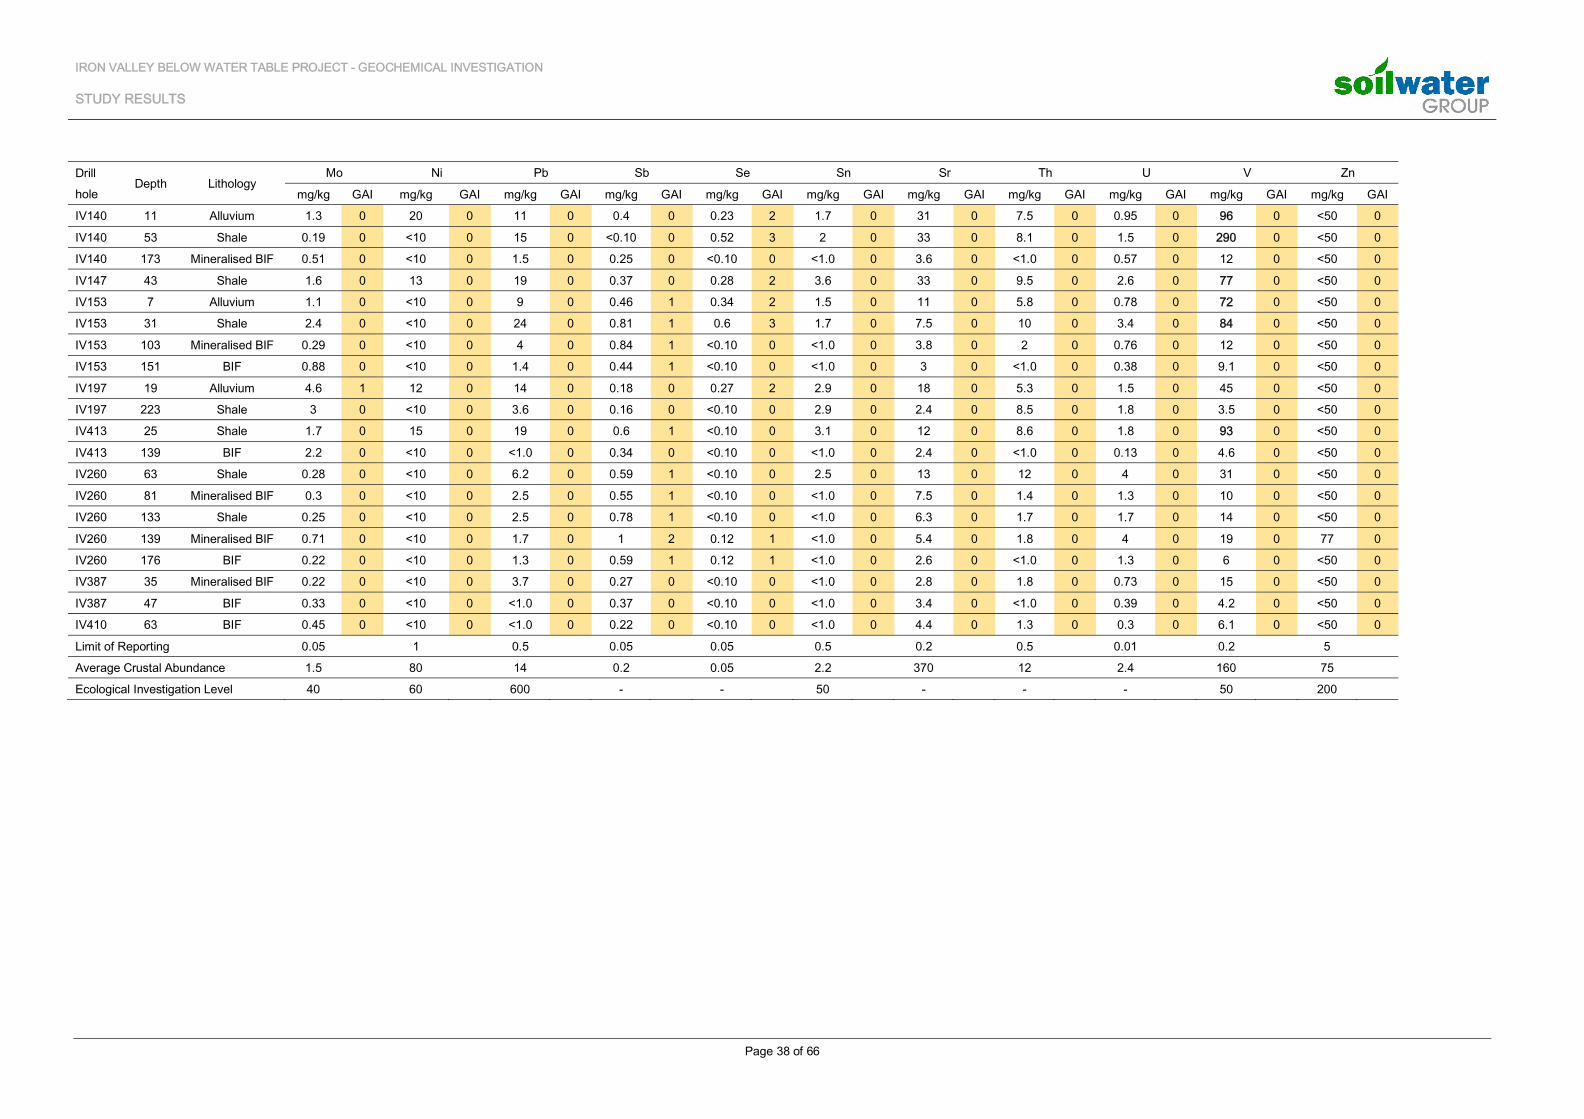
4.10 MULTI-ELEMENT COMPOSITION
The relative enrichment of the 20 selected samples tested was determined using the Geochemical Abundance Index (GAI) through the equation shown below:
log1.5 ∗
Where C = element content within the material in mg/kg and ACA = the average crustal abundance of the element (Bowen, 1979). A GAI of 0 indicates that the content of the element is less than, or similar to, the ACA. A GAI of 3 corresponds to a 12-fold enrichment above the ACA whilst a GAI of 6 indicates a 96-fold or greater enrichment above the average crustal abundance. In general, a GAI > 3 indicates a significant level of enrichment. The elemental contents are also compared against the Department of Environmental Regulation (DER) Ecological Investigation Levels (DEC, 2010) to identify metals and metalloid levels that may pose a risk to the environment if they become mobile (i.e. soluble). The EIL used by the DER are primarily based on the Environmental Investigation Levels listed in the Australian and New Zealand Guidelines for the Assessment and Management of Contaminated Sites (ANZECC & ARMCANZ, 2000). The EIL’s represent screening levels with which to provide a first-pass or Tier 1 level assessment for a site. It is important to note that these levels do not take into account mineralised zones where elevated metal and metalloid contents can exceed the EIL criteria. Site specific information therefore needs to be used in conjunction with the EIL’s to assess the appropriateness of each screening value. In the case of these materials the EIL’s are shown in comparison with the ACA and calculated GAI in order to provide a context within which to interpret them.
The multi-element composition of the 20 selected samples is provided in Table 4.8 along with the calculated GAI and associated EIL. Element contents which exceed the EIL for a given sample are highlighted in bold. The results show that whilst some samples exceeded the EIL for elements AS, Mn and V, only one samples tested for As received a GAI of over 4, whilst the remaining samples were not considered to be significantly enriched with regards to any of the elements tested when compared with natural background levels (ACA).
The relatively higher levels of Arsenic reported were restricted to the Shale waste rock lithology. The Arsenic is likely to be associated with the high levels of Fe prevalent within the materials possibly as a result of surface complexation or adsorption onto iron (and manganese) oxy-hydroxides.
4.11 METAL MOBILITY
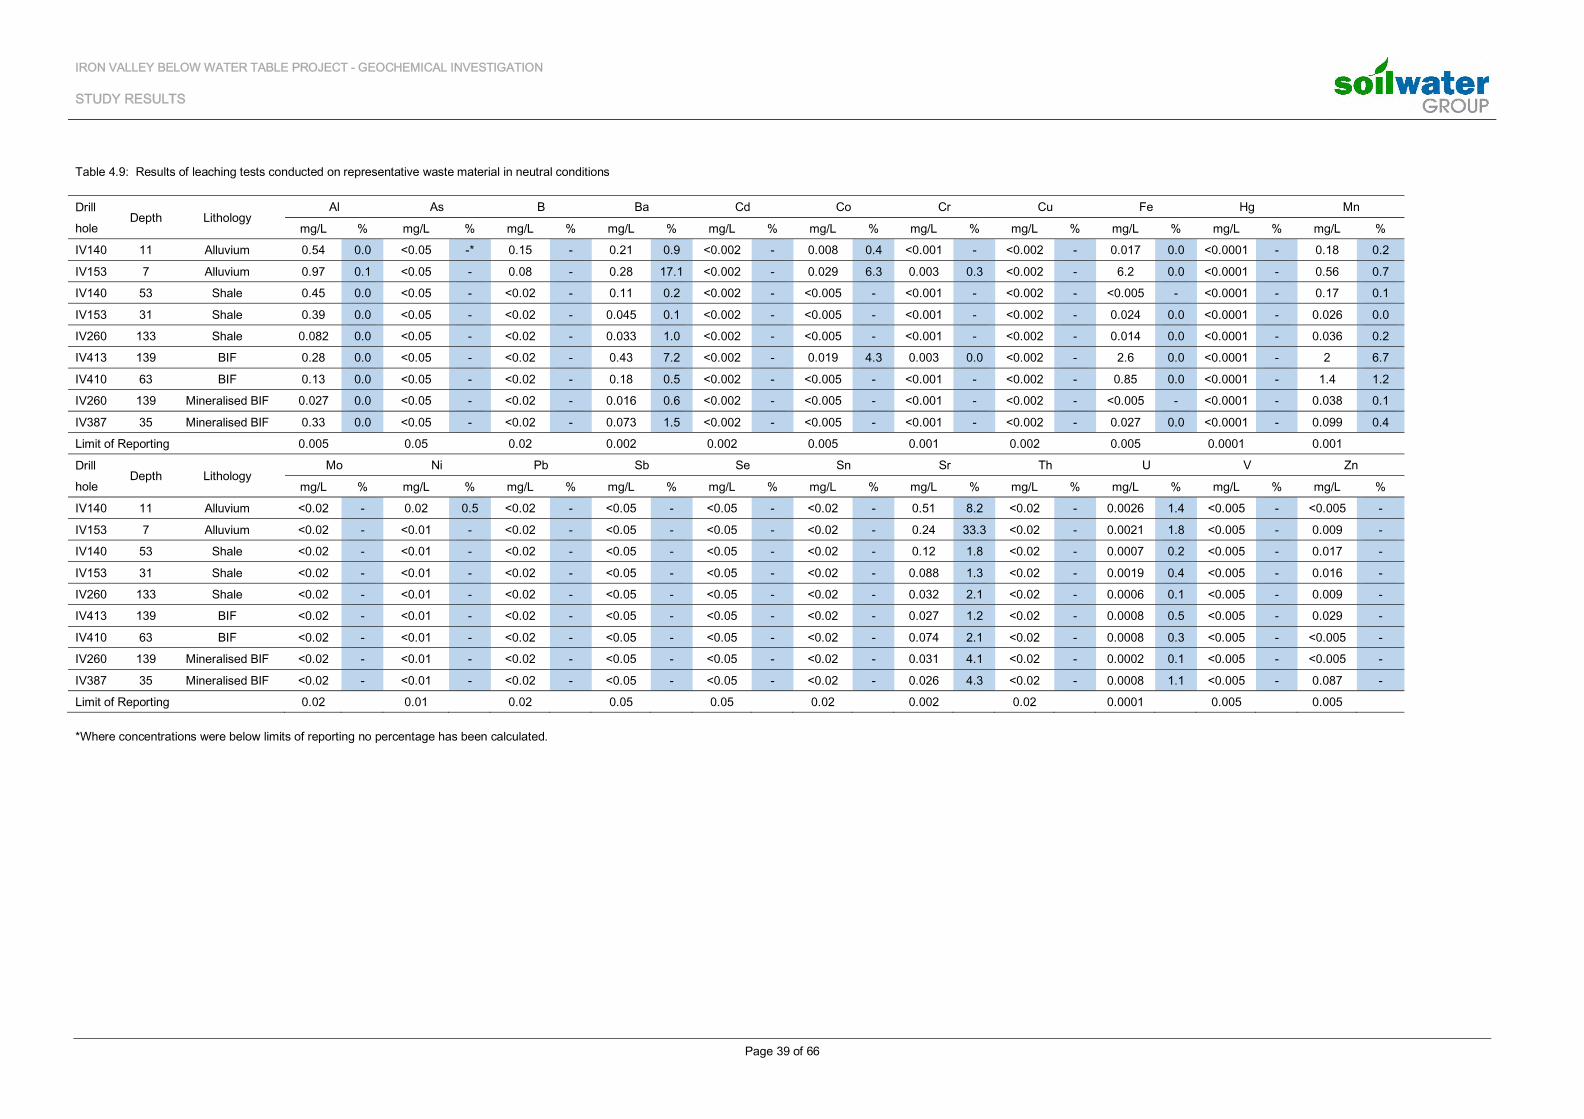
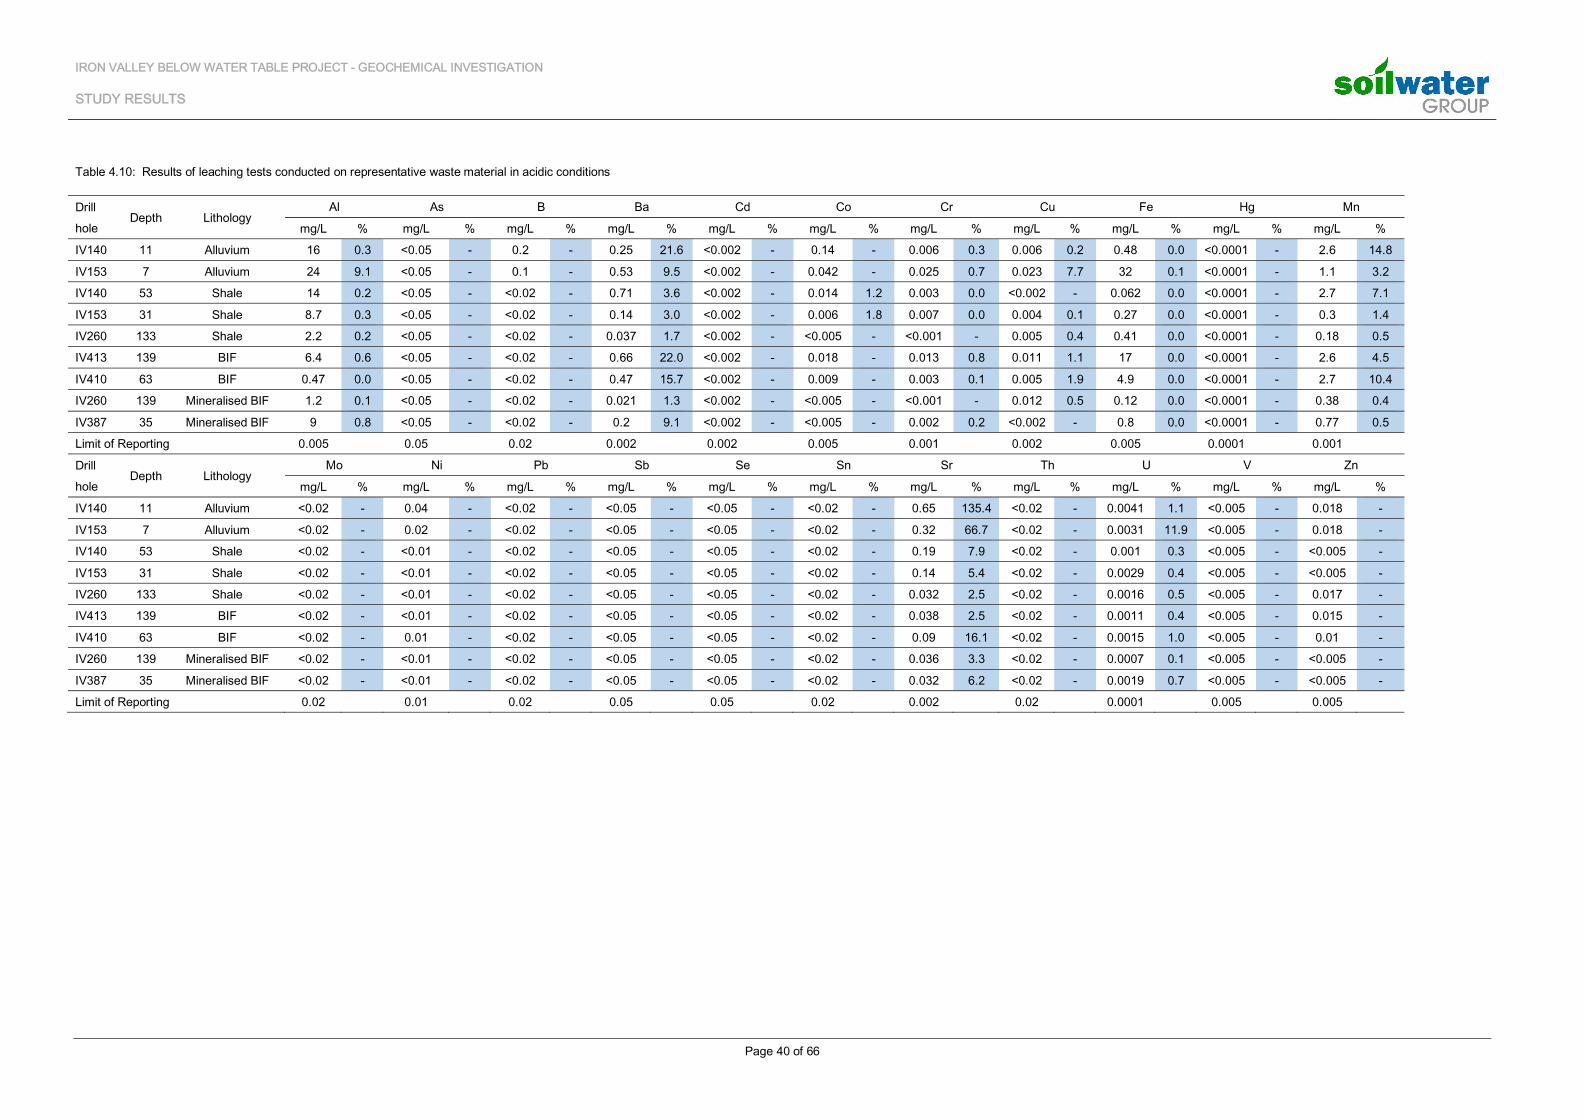
Two leaching trials were carried out using the Australian Standard Leaching Procedure (ASLP) on 9 of the samples selected for detailed ARD testing in this investigation. The first trial utilised a leaching agent of dilute glacial acetic acid (pH 5.0) simulating rainwater, whilst the second trial used a leaching agent of acetic acid (pH 2.9), following the leach agent preparations documented in AS 4439.3-1997.
The results of the leaching trials are provided in Table 4.9 (simulated near neutral conditions) and Table 4.10 (simulated acidic conditions).The tables show the amount of each element which was soluble (and therefore mobile) in mg/L. The amount which was reported within the solute of each trial is also given as a percentage of the total amount within the corresponding solid phase for the purpose of comparison. It should be noted that these values are not directly
IRON VALLEY BELOW WATER TABLE PROJECT - GEOCHEMICAL INVESTIGATION
STUDY RESULTS
Page 36 of 66
comparable, as different portions of each sample were used in each test (as the solid metal content testing destroys the sample during the analysis process), and are only included to provide an indication of relative proportions.
For the majority of the materials and elements tested under neutral conditions, the amount leached was low with values ≤ 10% (many elements were below detection limits within the collected leachate). The exception to this was a sample of Alluvium from Drillhole IV153 which reported leachate contents of Ba (17%) and Sr (33%) at a higher proportion when compared to the reported solid content. These results indicate that the majority of the elements are strongly bound within the mineral structure and are not readily soluble under neutral conditions. The samples which did display higher rates of leaching as a percentage of solid phase content (Ba and Sr) had uniformly low solid phase contents of these elements (i.e. GAI ≤ 0), making the total amount of these metals which became mobile within the leachate low. These results show that for the majority of elements mobility under normal leaching conditions within the waste materials will be limited, with significant metalliferous drainage unlikely to develop in the absence of ARD. However the potential elevated mobility of Ba and Sr should be addressed when managing runoff and/or seepage from WRL(s).
The results when simulating acidic leaching conditions show that in general the leaching rates as a percentage of solid phase content went up when compared to the neutral leachate, with almost all metals tested which were not below the detection limit showing a general increase in the amount of solute present in the acidic leachate. This increase in metal mobility with decrease in pH (from neutral range to acidic) is common for a range of metals. This has the effect of increasing the metal content within a number of samples for metals such as Al, Cu, Fe, Mn and Zn above the fresh water guidelines for slightly to moderately disturbed marine ecosystems set by ANZECC & ARMCANZ (2000). Whilst these guideline levels are intended for application to freshwater marine environments, the position of the Project within the catchment and adjacent to the lower reaches of the Weeli Wolli Creek makes their inclusion and discussion in this assessment relevant. However, as described in the preceding areas of this report the generation of acid following disturbance of the waste materials during proposed mining activities is considered unlikely due to the absence of sulfide minerals within the materials, therefore making the elevated rates of dissolution and mobility resulting from the simulation of acidic conditions during leaching unlikely to eventuate on site.
It should also be noted that the process involved in the use of standard bottle leach extraction (i.e. AS4439.3 – 1997) to study the mobility of metals and metalloids within the waste materials uses an aggressive soil/leaching agent ratio of 1:20. This large ratio is used to ensure that common ion effects which act to limit dissolution or desorption of elements into the liquid phase do not occur. In the case of field conditions under both saturated and unsaturated conditions a significantly lower solid/liquid ratio will occur (i.e. << 1:1), which will reduce the contact between mineral and liquid phases, thereby inhibiting the dissolution of the majority of soluble salts and restricting desorption of elements from the mineral surfaces. The overall effect of this decrease in solution to solid ratio is decreased metal and metalloid mobility occurring on site in comparison with those rates reported in this study.
IRON VALLEY BELOW WATER TABLE PROJECT - GEOCHEMICAL INVESTIGATION
STUDY RESULTS
Page 37 of 66
Table 4.8: Multi element composition of representative waste material samples
Drill hole
Depth Lithology Al As B Ba Cd Co Cr Cu Fe Hg Mn
mg/kg GAI mg/kg GAI mg/kg GAI mg/kg GAI mg/kg GAI mg/kg GAI mg/kg GAI mg/kg GAI mg/kg GAI mg/kg GAI mg/kg GAI
IV140 11 Alluvium 33,900 0 7.7 2 <50 0 120 0 0.1 0 10 0 68 0 17 0 210,000 2 <0.02 0 590 0
IV140 53 Shale 80,700 0 13 3 <50 0 280 0 <0.10 0 2.9 0 96 0 17 0 290,000 2 0.15 0 980 0
IV140 173 Mineralised BIF 6,630 0 5 1 <50 0 8.2 0 <0.10 0 2.3 0 6 0 6.6 0 410,000 3 0.05 0 390 0
IV147 43 Shale 64,100 0 17 3 <50 0 160 0 <0.10 0 4.5 0 49 0 14 0 170,000 1 0.2 0 300 0
IV153 7 Alluvium 27,200 0 8.2 2 <50 0 30 0 <0.10 0 2.2 0 53 0 7.4 0 260,000 2 <0.02 0 150 0
IV153 31 Shale 53,500 0 35 4 <50 0 16 0 <0.10 0 2.1 0 75 0 12 0 380,000 3 0.16 0 100 0
IV153 103 Mineralised BIF 12,400 0 2.9 0 <50 0 14 0 <0.10 0 <1.0 0 13 0 5.1 0 330,000 2 0.04 0 170 0
IV153 151 BIF 5,070 0 1.4 0 <50 0 24 0 <0.10 0 <1.0 0 20 0 4.3 0 250,000 2 0.02 0 130 0
IV197 19 Alluvium 40,100 0 8.4 2 <50 0 200 0 <0.10 0 3.2 0 26 0 24 0 320,000 2 <0.02 0 580 0
IV197 223 Shale 28,400 0 2 0 <50 0 5.8 0 <0.10 0 <1.0 0 9.1 0 14 0 91,000 1 0.07 0 88 0
IV413 25 Shale 37,800 0 12 2 <50 0 100 0 <0.10 0 5.8 0 120 0 3 0 350,000 3 0.02 0 190 0
IV413 139 BIF 1,320 0 1.3 0 <50 0 28 0 <0.10 0 <1.0 0 19 0 1.5 0 170,000 1 <0.02 0 170 0
IV260 63 Shale 15,700 0 2.3 0 <50 0 23 0 <0.10 0 1.7 0 130 0 20 0 360,000 3 0.03 0 110 0
IV260 81 Mineralised BIF 5,290 0 1.7 0 <50 0 15 0 <0.10 0 <1.0 0 8.5 0 5.1 0 390,000 3 0.12 0 290 0
IV260 133 Shale 5,930 0 1.9 0 <50 0 11 0 <0.10 0 1 0 14 0 6.5 0 330,000 2 <0.02 0 180 0
IV260 139 Mineralised BIF 8,680 0 3.4 1 <50 0 7.8 0 <0.10 0 1.3 0 14 0 12 0 390,000 3 0.03 0 530 0
IV260 176 BIF 5,940 0 2 0 <50 0 11 0 <0.10 0 <1.0 0 6.6 0 2.2 0 340,000 2 0.05 0 790 0
IV387 35 Mineralised BIF 12,500 0 3.5 1 <50 0 15 0 <0.10 0 <1.0 0 12 0 1.3 0 400,000 3 0.09 0 130 0
IV387 47 BIF 5,430 0 3 0 <50 0 15 0 <0.10 0 <1.0 0 4.6 0 2.3 0 180,000 2 <0.02 0 75 0
IV410 63 BIF 4,290 0 2.7 0 <50 0 42 0 <0.10 0 <1.0 0 6.4 0 2.2 0 220,000 2 0.08 0 290 0
Limit of Reporting 10 0.2 5 0.1 0.05 0.5 0.05 0.5 5 0.02 0.2
Average Crustal Abundance 82,000 1.5 10 500 0.11 20 100 50 41,000 0.05 950
Ecological Investigation Level - 20 - 300 3 50 400 100 - 1 500
IRON VALLEY BELOW WATER TABLE PROJECT - GEOCHEMICAL INVESTIGATION
STUDY RESULTS
Page 38 of 66
Drill hole
Depth Lithology Mo Ni Pb Sb Se Sn Sr Th U V Zn
mg/kg GAI mg/kg GAI mg/kg GAI mg/kg GAI mg/kg GAI mg/kg GAI mg/kg GAI mg/kg GAI mg/kg GAI mg/kg GAI mg/kg GAI
IV140 11 Alluvium 1.3 0 20 0 11 0 0.4 0 0.23 2 1.7 0 31 0 7.5 0 0.95 0 96 0 <50 0
IV140 53 Shale 0.19 0 <10 0 15 0 <0.10 0 0.52 3 2 0 33 0 8.1 0 1.5 0 290 0 <50 0
IV140 173 Mineralised BIF 0.51 0 <10 0 1.5 0 0.25 0 <0.10 0 <1.0 0 3.6 0 <1.0 0 0.57 0 12 0 <50 0
IV147 43 Shale 1.6 0 13 0 19 0 0.37 0 0.28 2 3.6 0 33 0 9.5 0 2.6 0 77 0 <50 0
IV153 7 Alluvium 1.1 0 <10 0 9 0 0.46 1 0.34 2 1.5 0 11 0 5.8 0 0.78 0 72 0 <50 0
IV153 31 Shale 2.4 0 <10 0 24 0 0.81 1 0.6 3 1.7 0 7.5 0 10 0 3.4 0 84 0 <50 0
IV153 103 Mineralised BIF 0.29 0 <10 0 4 0 0.84 1 <0.10 0 <1.0 0 3.8 0 2 0 0.76 0 12 0 <50 0
IV153 151 BIF 0.88 0 <10 0 1.4 0 0.44 1 <0.10 0 <1.0 0 3 0 <1.0 0 0.38 0 9.1 0 <50 0
IV197 19 Alluvium 4.6 1 12 0 14 0 0.18 0 0.27 2 2.9 0 18 0 5.3 0 1.5 0 45 0 <50 0
IV197 223 Shale 3 0 <10 0 3.6 0 0.16 0 <0.10 0 2.9 0 2.4 0 8.5 0 1.8 0 3.5 0 <50 0
IV413 25 Shale 1.7 0 15 0 19 0 0.6 1 <0.10 0 3.1 0 12 0 8.6 0 1.8 0 93 0 <50 0
IV413 139 BIF 2.2 0 <10 0 <1.0 0 0.34 0 <0.10 0 <1.0 0 2.4 0 <1.0 0 0.13 0 4.6 0 <50 0
IV260 63 Shale 0.28 0 <10 0 6.2 0 0.59 1 <0.10 0 2.5 0 13 0 12 0 4 0 31 0 <50 0
IV260 81 Mineralised BIF 0.3 0 <10 0 2.5 0 0.55 1 <0.10 0 <1.0 0 7.5 0 1.4 0 1.3 0 10 0 <50 0
IV260 133 Shale 0.25 0 <10 0 2.5 0 0.78 1 <0.10 0 <1.0 0 6.3 0 1.7 0 1.7 0 14 0 <50 0
IV260 139 Mineralised BIF 0.71 0 <10 0 1.7 0 1 2 0.12 1 <1.0 0 5.4 0 1.8 0 4 0 19 0 77 0
IV260 176 BIF 0.22 0 <10 0 1.3 0 0.59 1 0.12 1 <1.0 0 2.6 0 <1.0 0 1.3 0 6 0 <50 0
IV387 35 Mineralised BIF 0.22 0 <10 0 3.7 0 0.27 0 <0.10 0 <1.0 0 2.8 0 1.8 0 0.73 0 15 0 <50 0
IV387 47 BIF 0.33 0 <10 0 <1.0 0 0.37 0 <0.10 0 <1.0 0 3.4 0 <1.0 0 0.39 0 4.2 0 <50 0
IV410 63 BIF 0.45 0 <10 0 <1.0 0 0.22 0 <0.10 0 <1.0 0 4.4 0 1.3 0 0.3 0 6.1 0 <50 0
Limit of Reporting 0.05 1 0.5 0.05 0.05 0.5 0.2 0.5 0.01 0.2 5
Average Crustal Abundance 1.5 80 14 0.2 0.05 2.2 370 12 2.4 160 75
Ecological Investigation Level 40 60 600 - - 50 - - - 50 200
IRON VALLEY BELOW WATER TABLE PROJECT - GEOCHEMICAL INVESTIGATION
STUDY RESULTS
Page 39 of 66
Table 4.9: Results of leaching tests conducted on representative waste material in neutral conditions
Drill hole
Depth Lithology Al As B Ba Cd Co Cr Cu Fe Hg Mn
mg/L % mg/L % mg/L % mg/L % mg/L % mg/L % mg/L % mg/L % mg/L % mg/L % mg/L %
IV140 11 Alluvium 0.54 0.0 <0.05 -* 0.15 - 0.21 0.9 <0.002 - 0.008 0.4 <0.001 - <0.002 - 0.017 0.0 <0.0001 - 0.18 0.2
IV153 7 Alluvium 0.97 0.1 <0.05 - 0.08 - 0.28 17.1 <0.002 - 0.029 6.3 0.003 0.3 <0.002 - 6.2 0.0 <0.0001 - 0.56 0.7
IV140 53 Shale 0.45 0.0 <0.05 - <0.02 - 0.11 0.2 <0.002 - <0.005 - <0.001 - <0.002 - <0.005 - <0.0001 - 0.17 0.1
IV153 31 Shale 0.39 0.0 <0.05 - <0.02 - 0.045 0.1 <0.002 - <0.005 - <0.001 - <0.002 - 0.024 0.0 <0.0001 - 0.026 0.0
IV260 133 Shale 0.082 0.0 <0.05 - <0.02 - 0.033 1.0 <0.002 - <0.005 - <0.001 - <0.002 - 0.014 0.0 <0.0001 - 0.036 0.2
IV413 139 BIF 0.28 0.0 <0.05 - <0.02 - 0.43 7.2 <0.002 - 0.019 4.3 0.003 0.0 <0.002 - 2.6 0.0 <0.0001 - 2 6.7
IV410 63 BIF 0.13 0.0 <0.05 - <0.02 - 0.18 0.5 <0.002 - <0.005 - <0.001 - <0.002 - 0.85 0.0 <0.0001 - 1.4 1.2
IV260 139 Mineralised BIF 0.027 0.0 <0.05 - <0.02 - 0.016 0.6 <0.002 - <0.005 - <0.001 - <0.002 - <0.005 - <0.0001 - 0.038 0.1
IV387 35 Mineralised BIF 0.33 0.0 <0.05 - <0.02 - 0.073 1.5 <0.002 - <0.005 - <0.001 - <0.002 - 0.027 0.0 <0.0001 - 0.099 0.4
Limit of Reporting 0.005 0.05 0.02 0.002 0.002 0.005 0.001 0.002 0.005 0.0001 0.001
Drill hole
Depth Lithology Mo Ni Pb Sb Se Sn Sr Th U V Zn
mg/L % mg/L % mg/L % mg/L % mg/L % mg/L % mg/L % mg/L % mg/L % mg/L % mg/L %
IV140 11 Alluvium <0.02 - 0.02 0.5 <0.02 - <0.05 - <0.05 - <0.02 - 0.51 8.2 <0.02 - 0.0026 1.4 <0.005 - <0.005 -
IV153 7 Alluvium <0.02 - <0.01 - <0.02 - <0.05 - <0.05 - <0.02 - 0.24 33.3 <0.02 - 0.0021 1.8 <0.005 - 0.009 -
IV140 53 Shale <0.02 - <0.01 - <0.02 - <0.05 - <0.05 - <0.02 - 0.12 1.8 <0.02 - 0.0007 0.2 <0.005 - 0.017 -
IV153 31 Shale <0.02 - <0.01 - <0.02 - <0.05 - <0.05 - <0.02 - 0.088 1.3 <0.02 - 0.0019 0.4 <0.005 - 0.016 -
IV260 133 Shale <0.02 - <0.01 - <0.02 - <0.05 - <0.05 - <0.02 - 0.032 2.1 <0.02 - 0.0006 0.1 <0.005 - 0.009 -
IV413 139 BIF <0.02 - <0.01 - <0.02 - <0.05 - <0.05 - <0.02 - 0.027 1.2 <0.02 - 0.0008 0.5 <0.005 - 0.029 -
IV410 63 BIF <0.02 - <0.01 - <0.02 - <0.05 - <0.05 - <0.02 - 0.074 2.1 <0.02 - 0.0008 0.3 <0.005 - <0.005 -
IV260 139 Mineralised BIF <0.02 - <0.01 - <0.02 - <0.05 - <0.05 - <0.02 - 0.031 4.1 <0.02 - 0.0002 0.1 <0.005 - <0.005 -
IV387 35 Mineralised BIF <0.02 - <0.01 - <0.02 - <0.05 - <0.05 - <0.02 - 0.026 4.3 <0.02 - 0.0008 1.1 <0.005 - 0.087 -
Limit of Reporting 0.02 0.01 0.02 0.05 0.05 0.02 0.002 0.02 0.0001 0.005 0.005
*Where concentrations were below limits of reporting no percentage has been calculated.
IRON VALLEY BELOW WATER TABLE PROJECT - GEOCHEMICAL INVESTIGATION
STUDY RESULTS
Page 40 of 66
Table 4.10: Results of leaching tests conducted on representative waste material in acidic conditions
Drill hole
Depth Lithology Al As B Ba Cd Co Cr Cu Fe Hg Mn
mg/L % mg/L % mg/L % mg/L % mg/L % mg/L % mg/L % mg/L % mg/L % mg/L % mg/L %
IV140 11 Alluvium 16 0.3 <0.05 - 0.2 - 0.25 21.6 <0.002 - 0.14 - 0.006 0.3 0.006 0.2 0.48 0.0 <0.0001 - 2.6 14.8
IV153 7 Alluvium 24 9.1 <0.05 - 0.1 - 0.53 9.5 <0.002 - 0.042 - 0.025 0.7 0.023 7.7 32 0.1 <0.0001 - 1.1 3.2
IV140 53 Shale 14 0.2 <0.05 - <0.02 - 0.71 3.6 <0.002 - 0.014 1.2 0.003 0.0 <0.002 - 0.062 0.0 <0.0001 - 2.7 7.1
IV153 31 Shale 8.7 0.3 <0.05 - <0.02 - 0.14 3.0 <0.002 - 0.006 1.8 0.007 0.0 0.004 0.1 0.27 0.0 <0.0001 - 0.3 1.4
IV260 133 Shale 2.2 0.2 <0.05 - <0.02 - 0.037 1.7 <0.002 - <0.005 - <0.001 - 0.005 0.4 0.41 0.0 <0.0001 - 0.18 0.5
IV413 139 BIF 6.4 0.6 <0.05 - <0.02 - 0.66 22.0 <0.002 - 0.018 - 0.013 0.8 0.011 1.1 17 0.0 <0.0001 - 2.6 4.5
IV410 63 BIF 0.47 0.0 <0.05 - <0.02 - 0.47 15.7 <0.002 - 0.009 - 0.003 0.1 0.005 1.9 4.9 0.0 <0.0001 - 2.7 10.4
IV260 139 Mineralised BIF 1.2 0.1 <0.05 - <0.02 - 0.021 1.3 <0.002 - <0.005 - <0.001 - 0.012 0.5 0.12 0.0 <0.0001 - 0.38 0.4
IV387 35 Mineralised BIF 9 0.8 <0.05 - <0.02 - 0.2 9.1 <0.002 - <0.005 - 0.002 0.2 <0.002 - 0.8 0.0 <0.0001 - 0.77 0.5
Limit of Reporting 0.005 0.05 0.02 0.002 0.002 0.005 0.001 0.002 0.005 0.0001 0.001
Drill hole
Depth Lithology Mo Ni Pb Sb Se Sn Sr Th U V Zn
mg/L % mg/L % mg/L % mg/L % mg/L % mg/L % mg/L % mg/L % mg/L % mg/L % mg/L %
IV140 11 Alluvium <0.02 - 0.04 - <0.02 - <0.05 - <0.05 - <0.02 - 0.65 135.4 <0.02 - 0.0041 1.1 <0.005 - 0.018 -
IV153 7 Alluvium <0.02 - 0.02 - <0.02 - <0.05 - <0.05 - <0.02 - 0.32 66.7 <0.02 - 0.0031 11.9 <0.005 - 0.018 -
IV140 53 Shale <0.02 - <0.01 - <0.02 - <0.05 - <0.05 - <0.02 - 0.19 7.9 <0.02 - 0.001 0.3 <0.005 - <0.005 -
IV153 31 Shale <0.02 - <0.01 - <0.02 - <0.05 - <0.05 - <0.02 - 0.14 5.4 <0.02 - 0.0029 0.4 <0.005 - <0.005 -
IV260 133 Shale <0.02 - <0.01 - <0.02 - <0.05 - <0.05 - <0.02 - 0.032 2.5 <0.02 - 0.0016 0.5 <0.005 - 0.017 -
IV413 139 BIF <0.02 - <0.01 - <0.02 - <0.05 - <0.05 - <0.02 - 0.038 2.5 <0.02 - 0.0011 0.4 <0.005 - 0.015 -
IV410 63 BIF <0.02 - 0.01 - <0.02 - <0.05 - <0.05 - <0.02 - 0.09 16.1 <0.02 - 0.0015 1.0 <0.005 - 0.01 -
IV260 139 Mineralised BIF <0.02 - <0.01 - <0.02 - <0.05 - <0.05 - <0.02 - 0.036 3.3 <0.02 - 0.0007 0.1 <0.005 - <0.005 -
IV387 35 Mineralised BIF <0.02 - <0.01 - <0.02 - <0.05 - <0.05 - <0.02 - 0.032 6.2 <0.02 - 0.0019 0.7 <0.005 - <0.005 -
Limit of Reporting 0.02 0.01 0.02 0.05 0.05 0.02 0.002 0.02 0.0001 0.005 0.005
IRON VALLEY BELOW WATER TABLE PROJECT - GEOCHEMICAL INVESTIGATION
CONCLUSIONS
Page 41 of 66
5 CONCLUSIONS
A geochemical investigation was undertaken for the proposed Below Water Table expansion of the Iron Valley Project. The purpose of the investigation was to assess the potential for acid mine drainage (AMD) or metaliferous drainage (MD) to develop following disturbance of the waste rock materials within the deposit. The major findings from this investigation are:
5.1 SCREEN ANALYSIS
The pH of the majority of the waste rock materials tested was generally circum-neutral. The upper profile regolith materials displayed slightly alkaline conditions which gradually became more acidic in pH with increasing depth down profile. The pHFOX results closely mirrored the in situ pH, and provided no indication of potentially ARD producing material
The recorded EC of the materials tested showed that non-saline conditions prevail within the deposit; these results indicate that the pH and salinity levels within the waste rock materials are unlikely to negatively impact rehabilitation activities and revegetation efforts.
5.2 DETAILED ARD ASSESSMENT
The Total S assay results have shown that all waste material samples tested contained negligible Total S contents.
The assessment of the buffering capacity of the major waste rock materials showed that all materials contain moderate to negligible buffering capacity. This result indicates that there is unlikely to be a major rock unit or source of material which contains a large excess of buffering capacity.
Due to the lack of buffering capacity and carbonates within the materials tested in this assessment, it is recommended that a screen value of >0.1 % Total S is adopted at this stage for ongoing ARD management on site to indicate materials which require further assessment of their ARD status.
Geochemical classification of the major waste rock materials resulted in a NAF classification for all samples, reflecting the lack of sulfur within these samples. The testing also highlighted the lack of inherent buffering capacity.
5.3 MULTI-ELEMENT COMPOSITION
The major waste rock materials generally contained low levels of metals and metalloids, with the exception of some of the Shale samples which contained moderate levels of the element Arsenic.
Testing of total soluble metal contents under neutral conditions has shown that the majority of the metals and metalloids are either strongly bound to the mineral surface or held within the mineral structure and are therefore not readily soluble. Those elements which did show relatively increased leaching rates had insignificant contents within the solid phase. The elevated mobility of Ba and Sr will need to be considered by surface and groundwater management to ensure that adequate monitoring of runoff and/or seepage from the WRL(s) is conducted.
Testing of total soluble metal contents under acidic conditions indicated that a number of metals displayed increased mobility, with a number of samples recording levels of Al, Cu, Fe, Mn and Zn above relevant fresh water marine environment guidelines. These results are only applicable to the development of management
IRON VALLEY BELOW WATER TABLE PROJECT - GEOCHEMICAL INVESTIGATION
CONCLUSIONS
Page 42 of 66
strategies should acidic conditions develop within the waste material, which the results of this report show is considered unlikely.
5.4 MANAGEMENT RECOMMENDATIONS
The screen testing has indicated that the pH and salinity levels recorded within the waste materials are unlikely to inhibit rehabilitation activities; however the low salinity may impact on the stability of waste rock materials. Where weathering of waste rock material located on the surface of constructed landforms results in considerable fines content, runoff from these areas is likely to contain elevated sediment loadings which will require management.
The very low levels of Total S reported (in the geological database) and Sulfide-S (in this assessment) throughout the deposit and the classification of NAF for all waste material samples tested indicate that the development of ARD within the waste rock material tested is unlikely.
Whilst the low Total S across the deposit as a whole indicates the development of ARD on a large scale is unlikely, the lack of significant buffering capacity and carbonates within all materials tested presents the possibility that minor volumes of material with relatively low Total S contents can still develop ARD on a small scale. With this in mind it is recommended that assay for Total S content continue to be conducted during operations on waste rock materials, with an initial screen level of >0.1 % Total S adopted for the identification of materials warranting further investigation into their ARD characteristics.
IRON VALLEY BELOW WATER TABLE PROJECT - GEOCHEMICAL INVESTIGATION
REFERENCES
Page 43 of 66
6 REFERENCES
ANZECC & ARMCANZ (2000) Australian and New Zealand Guidelines for Fresh and Marine Water Quality. Australian and New Zealand Environment Conservation Council and Agriculture and Resource Management Council of Australia and New Zealand. Canberra, ACT.
Bowen, H. J. M. (1979) Environmental Chemistry of the Elements. Academic Press. New York, USA. Currey, H. J. M., Ritchie, P. J. and Murray, G. S. C. (1997) Management Strategies for Acid Rock Drainage at Kidstone
Gold Mine, North Queensland. Third Australian Workshop on Acid Mine Drainage Proceedings, Australian Centre for Minesite Rehabilitation Research. (ed by McClean, RW and Bell, LC), pp. 93-102.
DEC (2010) Contaminated Sites Management Series: Assessment Levels for Soils, Sediment and Water, Version 4, Revision 1. February. Department of Environment and Conservation, Government of Western Australia. Perth WA.
Ewers, W. E. and Morris, R. C. (1981) Studies of the Dales Gorge Member of the Brockman Iron Formation, Western Australia. Economic Geology, 76, 1929-1953.
Price, W. A. (2009) Prediction Manual for Drainage Chemistry from Sulphidic Geologic Materials. MEND Report 1.20.1. CANMET Mining and Mineral Sciences Laboratories. Smithers, British Columbia, Canada.
Sobek, A. A., Schuller, W. A., Freeman, J. R. and Smith, R. M. (1978) Field and Laboratory Methods Applicable to Overburden and Minesoils. EPA-600/2-78-054.
Soregaroli, B. A. and Lawrence, R. W. (1997) Waste Rock Characterization at Dublin Gulch: A Case Study. Fourth International Conference on Acid Rock Drainage. pp. 631-645. Vancouver.
Stone, Y., Ahern, C. R. and Blunden, B. (1998) Acid Sulfate Soils Manual 1998. Acid Sulfate Soils Advisory Committee. In. Wollongbar, NSW.
White, A. F. and Brantley, S. L. (1995) Chemical weathering rates of silicate minerals: an overview. Chemical Weathering Rates of Silicate Minerals, 31, 1-22.
IRON VALLEY BELOW WATER TABLE PROJECT - GEOCHEMICAL INVESTIGATION
APPENDIX A
Page 44 of 66
APPENDIX A SCREEN RESULTS AND DRILL LOGS
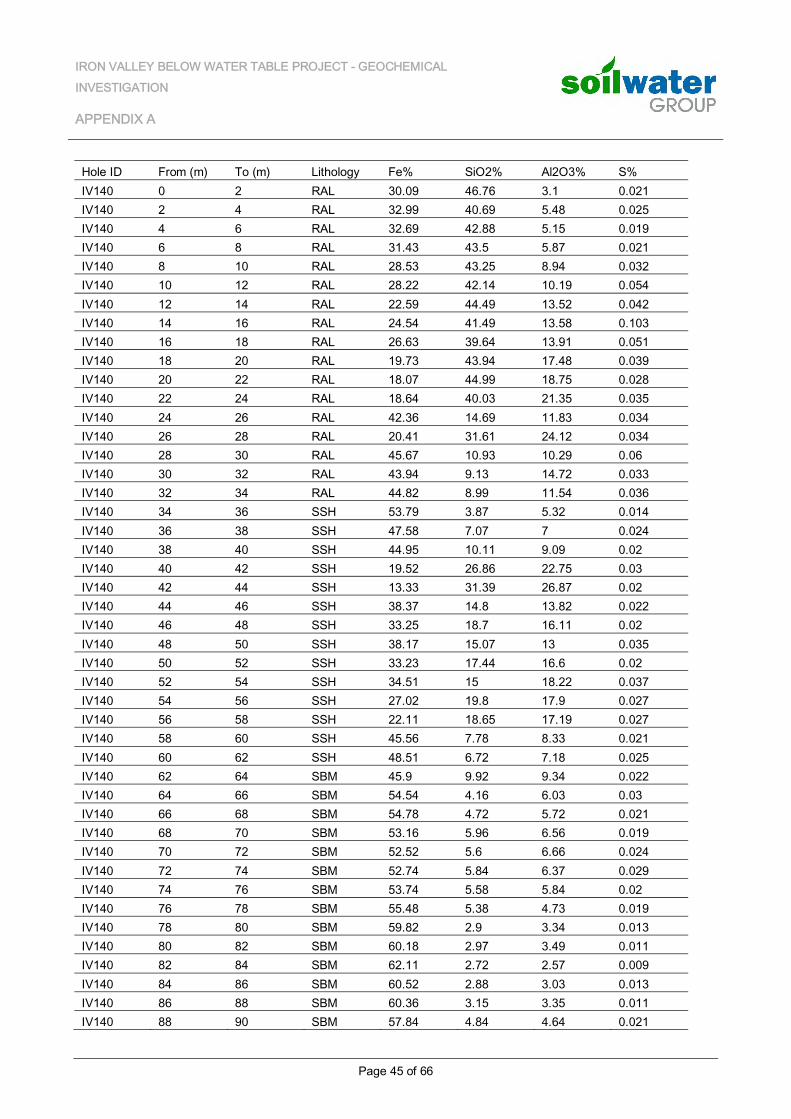
IRON VALLEY BELOW WATER TABLE PROJECT - GEOCHEMICAL INVESTIGATION
APPENDIX A
Page 45 of 66
Hole ID From (m) To (m) Lithology Fe% SiO2% Al2O3% S% IV140 0 2 RAL 30.09 46.76 3.1 0.021 IV140 2 4 RAL 32.99 40.69 5.48 0.025 IV140 4 6 RAL 32.69 42.88 5.15 0.019 IV140 6 8 RAL 31.43 43.5 5.87 0.021 IV140 8 10 RAL 28.53 43.25 8.94 0.032 IV140 10 12 RAL 28.22 42.14 10.19 0.054 IV140 12 14 RAL 22.59 44.49 13.52 0.042 IV140 14 16 RAL 24.54 41.49 13.58 0.103 IV140 16 18 RAL 26.63 39.64 13.91 0.051 IV140 18 20 RAL 19.73 43.94 17.48 0.039 IV140 20 22 RAL 18.07 44.99 18.75 0.028 IV140 22 24 RAL 18.64 40.03 21.35 0.035 IV140 24 26 RAL 42.36 14.69 11.83 0.034 IV140 26 28 RAL 20.41 31.61 24.12 0.034 IV140 28 30 RAL 45.67 10.93 10.29 0.06 IV140 30 32 RAL 43.94 9.13 14.72 0.033 IV140 32 34 RAL 44.82 8.99 11.54 0.036 IV140 34 36 SSH 53.79 3.87 5.32 0.014 IV140 36 38 SSH 47.58 7.07 7 0.024 IV140 38 40 SSH 44.95 10.11 9.09 0.02 IV140 40 42 SSH 19.52 26.86 22.75 0.03 IV140 42 44 SSH 13.33 31.39 26.87 0.02 IV140 44 46 SSH 38.37 14.8 13.82 0.022 IV140 46 48 SSH 33.25 18.7 16.11 0.02 IV140 48 50 SSH 38.17 15.07 13 0.035 IV140 50 52 SSH 33.23 17.44 16.6 0.02 IV140 52 54 SSH 34.51 15 18.22 0.037 IV140 54 56 SSH 27.02 19.8 17.9 0.027 IV140 56 58 SSH 22.11 18.65 17.19 0.027 IV140 58 60 SSH 45.56 7.78 8.33 0.021 IV140 60 62 SSH 48.51 6.72 7.18 0.025 IV140 62 64 SBM 45.9 9.92 9.34 0.022 IV140 64 66 SBM 54.54 4.16 6.03 0.03 IV140 66 68 SBM 54.78 4.72 5.72 0.021 IV140 68 70 SBM 53.16 5.96 6.56 0.019 IV140 70 72 SBM 52.52 5.6 6.66 0.024 IV140 72 74 SBM 52.74 5.84 6.37 0.029 IV140 74 76 SBM 53.74 5.58 5.84 0.02 IV140 76 78 SBM 55.48 5.38 4.73 0.019 IV140 78 80 SBM 59.82 2.9 3.34 0.013 IV140 80 82 SBM 60.18 2.97 3.49 0.011 IV140 82 84 SBM 62.11 2.72 2.57 0.009 IV140 84 86 SBM 60.52 2.88 3.03 0.013 IV140 86 88 SBM 60.36 3.15 3.35 0.011 IV140 88 90 SBM 57.84 4.84 4.64 0.021
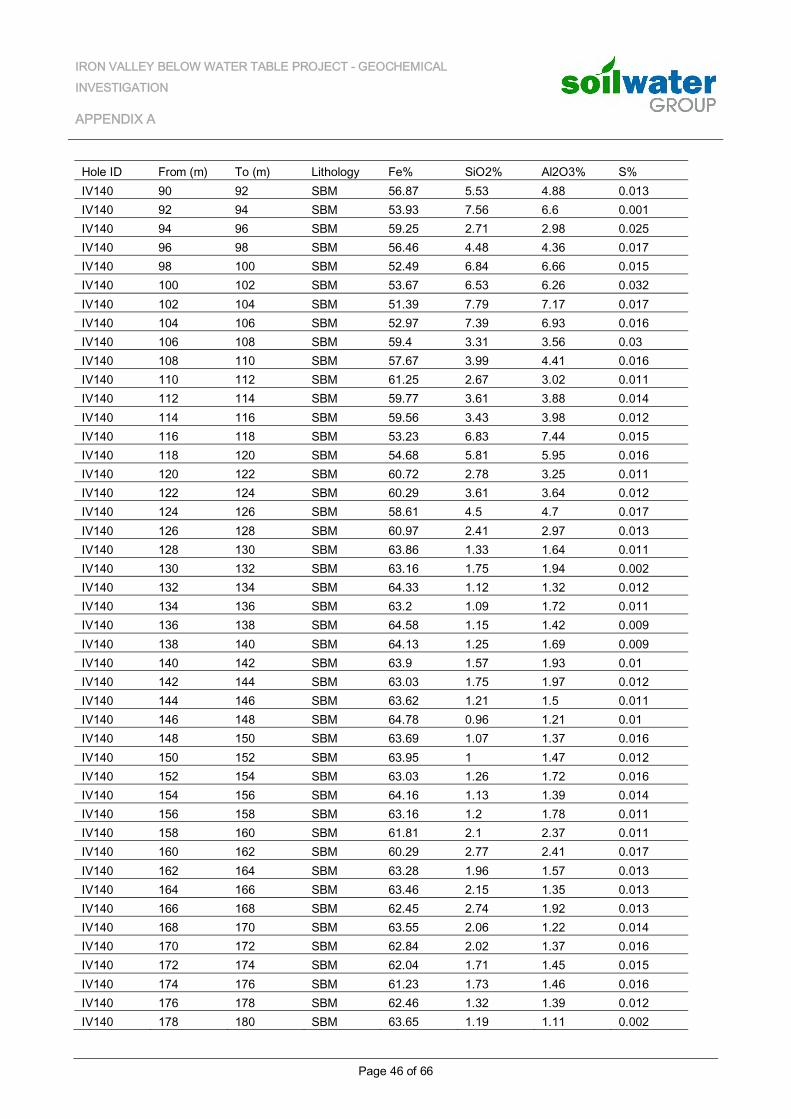
IRON VALLEY BELOW WATER TABLE PROJECT - GEOCHEMICAL INVESTIGATION
APPENDIX A
Page 46 of 66
Hole ID From (m) To (m) Lithology Fe% SiO2% Al2O3% S% IV140 90 92 SBM 56.87 5.53 4.88 0.013 IV140 92 94 SBM 53.93 7.56 6.6 0.001 IV140 94 96 SBM 59.25 2.71 2.98 0.025 IV140 96 98 SBM 56.46 4.48 4.36 0.017 IV140 98 100 SBM 52.49 6.84 6.66 0.015 IV140 100 102 SBM 53.67 6.53 6.26 0.032 IV140 102 104 SBM 51.39 7.79 7.17 0.017 IV140 104 106 SBM 52.97 7.39 6.93 0.016 IV140 106 108 SBM 59.4 3.31 3.56 0.03 IV140 108 110 SBM 57.67 3.99 4.41 0.016 IV140 110 112 SBM 61.25 2.67 3.02 0.011 IV140 112 114 SBM 59.77 3.61 3.88 0.014 IV140 114 116 SBM 59.56 3.43 3.98 0.012 IV140 116 118 SBM 53.23 6.83 7.44 0.015 IV140 118 120 SBM 54.68 5.81 5.95 0.016 IV140 120 122 SBM 60.72 2.78 3.25 0.011 IV140 122 124 SBM 60.29 3.61 3.64 0.012 IV140 124 126 SBM 58.61 4.5 4.7 0.017 IV140 126 128 SBM 60.97 2.41 2.97 0.013 IV140 128 130 SBM 63.86 1.33 1.64 0.011 IV140 130 132 SBM 63.16 1.75 1.94 0.002 IV140 132 134 SBM 64.33 1.12 1.32 0.012 IV140 134 136 SBM 63.2 1.09 1.72 0.011 IV140 136 138 SBM 64.58 1.15 1.42 0.009 IV140 138 140 SBM 64.13 1.25 1.69 0.009 IV140 140 142 SBM 63.9 1.57 1.93 0.01 IV140 142 144 SBM 63.03 1.75 1.97 0.012 IV140 144 146 SBM 63.62 1.21 1.5 0.011 IV140 146 148 SBM 64.78 0.96 1.21 0.01 IV140 148 150 SBM 63.69 1.07 1.37 0.016 IV140 150 152 SBM 63.95 1 1.47 0.012 IV140 152 154 SBM 63.03 1.26 1.72 0.016 IV140 154 156 SBM 64.16 1.13 1.39 0.014 IV140 156 158 SBM 63.16 1.2 1.78 0.011 IV140 158 160 SBM 61.81 2.1 2.37 0.011 IV140 160 162 SBM 60.29 2.77 2.41 0.017 IV140 162 164 SBM 63.28 1.96 1.57 0.013 IV140 164 166 SBM 63.46 2.15 1.35 0.013 IV140 166 168 SBM 62.45 2.74 1.92 0.013 IV140 168 170 SBM 63.55 2.06 1.22 0.014 IV140 170 172 SBM 62.84 2.02 1.37 0.016 IV140 172 174 SBM 62.04 1.71 1.45 0.015 IV140 174 176 SBM 61.23 1.73 1.46 0.016 IV140 176 178 SBM 62.46 1.32 1.39 0.012 IV140 178 180 SBM 63.65 1.19 1.11 0.002
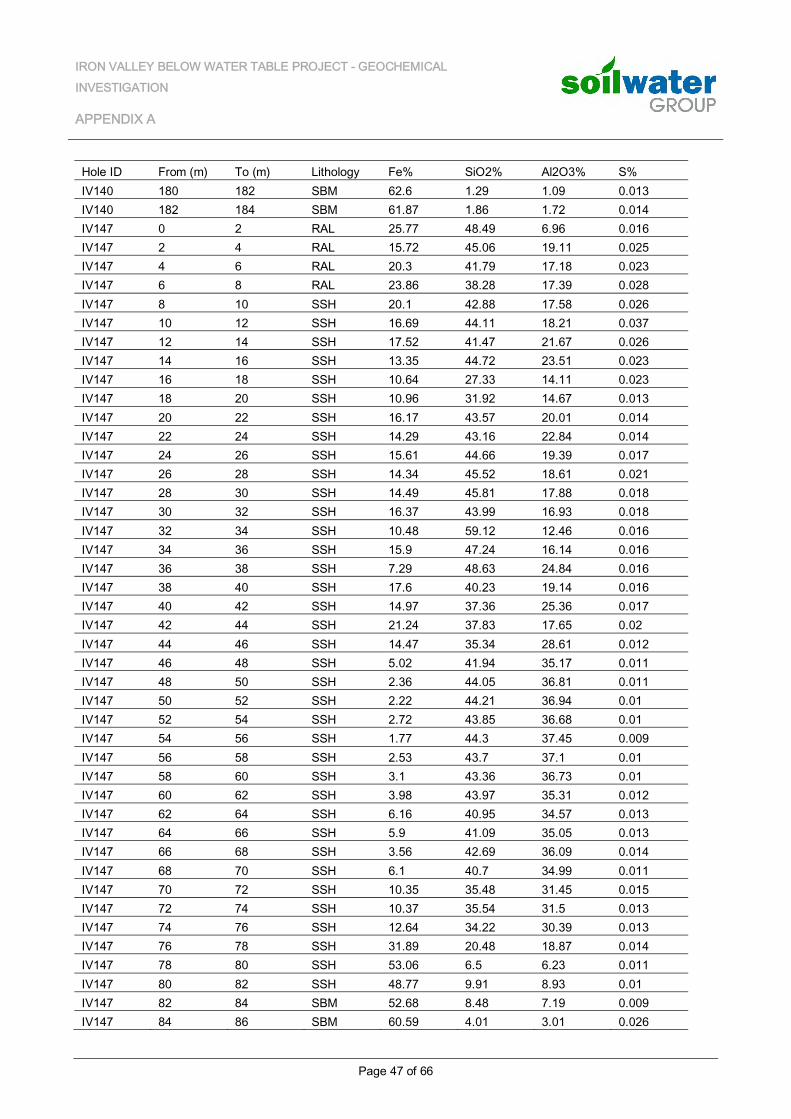
IRON VALLEY BELOW WATER TABLE PROJECT - GEOCHEMICAL INVESTIGATION
APPENDIX A
Page 47 of 66
Hole ID From (m) To (m) Lithology Fe% SiO2% Al2O3% S% IV140 180 182 SBM 62.6 1.29 1.09 0.013 IV140 182 184 SBM 61.87 1.86 1.72 0.014 IV147 0 2 RAL 25.77 48.49 6.96 0.016 IV147 2 4 RAL 15.72 45.06 19.11 0.025 IV147 4 6 RAL 20.3 41.79 17.18 0.023 IV147 6 8 RAL 23.86 38.28 17.39 0.028 IV147 8 10 SSH 20.1 42.88 17.58 0.026 IV147 10 12 SSH 16.69 44.11 18.21 0.037 IV147 12 14 SSH 17.52 41.47 21.67 0.026 IV147 14 16 SSH 13.35 44.72 23.51 0.023 IV147 16 18 SSH 10.64 27.33 14.11 0.023 IV147 18 20 SSH 10.96 31.92 14.67 0.013 IV147 20 22 SSH 16.17 43.57 20.01 0.014 IV147 22 24 SSH 14.29 43.16 22.84 0.014 IV147 24 26 SSH 15.61 44.66 19.39 0.017 IV147 26 28 SSH 14.34 45.52 18.61 0.021 IV147 28 30 SSH 14.49 45.81 17.88 0.018 IV147 30 32 SSH 16.37 43.99 16.93 0.018 IV147 32 34 SSH 10.48 59.12 12.46 0.016 IV147 34 36 SSH 15.9 47.24 16.14 0.016 IV147 36 38 SSH 7.29 48.63 24.84 0.016 IV147 38 40 SSH 17.6 40.23 19.14 0.016 IV147 40 42 SSH 14.97 37.36 25.36 0.017 IV147 42 44 SSH 21.24 37.83 17.65 0.02 IV147 44 46 SSH 14.47 35.34 28.61 0.012 IV147 46 48 SSH 5.02 41.94 35.17 0.011 IV147 48 50 SSH 2.36 44.05 36.81 0.011 IV147 50 52 SSH 2.22 44.21 36.94 0.01 IV147 52 54 SSH 2.72 43.85 36.68 0.01 IV147 54 56 SSH 1.77 44.3 37.45 0.009 IV147 56 58 SSH 2.53 43.7 37.1 0.01 IV147 58 60 SSH 3.1 43.36 36.73 0.01 IV147 60 62 SSH 3.98 43.97 35.31 0.012 IV147 62 64 SSH 6.16 40.95 34.57 0.013 IV147 64 66 SSH 5.9 41.09 35.05 0.013 IV147 66 68 SSH 3.56 42.69 36.09 0.014 IV147 68 70 SSH 6.1 40.7 34.99 0.011 IV147 70 72 SSH 10.35 35.48 31.45 0.015 IV147 72 74 SSH 10.37 35.54 31.5 0.013 IV147 74 76 SSH 12.64 34.22 30.39 0.013 IV147 76 78 SSH 31.89 20.48 18.87 0.014 IV147 78 80 SSH 53.06 6.5 6.23 0.011 IV147 80 82 SSH 48.77 9.91 8.93 0.01 IV147 82 84 SBM 52.68 8.48 7.19 0.009 IV147 84 86 SBM 60.59 4.01 3.01 0.026
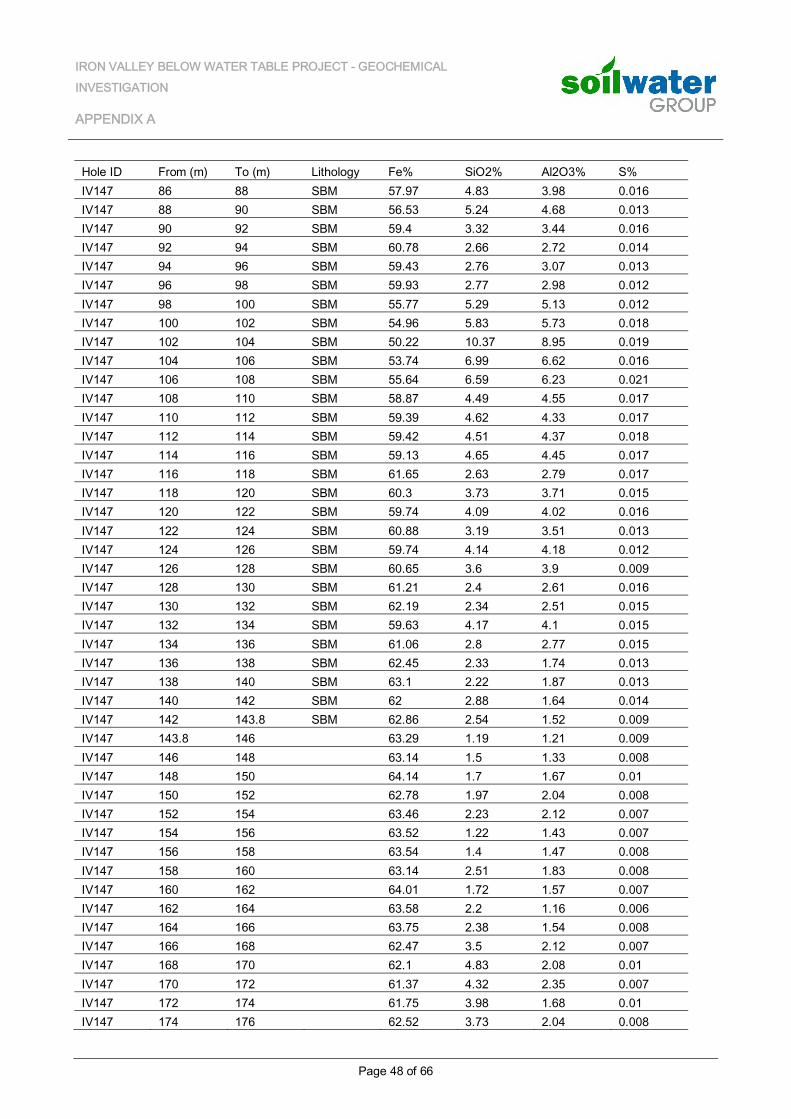
IRON VALLEY BELOW WATER TABLE PROJECT - GEOCHEMICAL INVESTIGATION
APPENDIX A
Page 48 of 66
Hole ID From (m) To (m) Lithology Fe% SiO2% Al2O3% S% IV147 86 88 SBM 57.97 4.83 3.98 0.016 IV147 88 90 SBM 56.53 5.24 4.68 0.013 IV147 90 92 SBM 59.4 3.32 3.44 0.016 IV147 92 94 SBM 60.78 2.66 2.72 0.014 IV147 94 96 SBM 59.43 2.76 3.07 0.013 IV147 96 98 SBM 59.93 2.77 2.98 0.012 IV147 98 100 SBM 55.77 5.29 5.13 0.012 IV147 100 102 SBM 54.96 5.83 5.73 0.018 IV147 102 104 SBM 50.22 10.37 8.95 0.019 IV147 104 106 SBM 53.74 6.99 6.62 0.016 IV147 106 108 SBM 55.64 6.59 6.23 0.021 IV147 108 110 SBM 58.87 4.49 4.55 0.017 IV147 110 112 SBM 59.39 4.62 4.33 0.017 IV147 112 114 SBM 59.42 4.51 4.37 0.018 IV147 114 116 SBM 59.13 4.65 4.45 0.017 IV147 116 118 SBM 61.65 2.63 2.79 0.017 IV147 118 120 SBM 60.3 3.73 3.71 0.015 IV147 120 122 SBM 59.74 4.09 4.02 0.016 IV147 122 124 SBM 60.88 3.19 3.51 0.013 IV147 124 126 SBM 59.74 4.14 4.18 0.012 IV147 126 128 SBM 60.65 3.6 3.9 0.009 IV147 128 130 SBM 61.21 2.4 2.61 0.016 IV147 130 132 SBM 62.19 2.34 2.51 0.015 IV147 132 134 SBM 59.63 4.17 4.1 0.015 IV147 134 136 SBM 61.06 2.8 2.77 0.015 IV147 136 138 SBM 62.45 2.33 1.74 0.013 IV147 138 140 SBM 63.1 2.22 1.87 0.013 IV147 140 142 SBM 62 2.88 1.64 0.014 IV147 142 143.8 SBM 62.86 2.54 1.52 0.009 IV147 143.8 146 63.29 1.19 1.21 0.009 IV147 146 148 63.14 1.5 1.33 0.008 IV147 148 150 64.14 1.7 1.67 0.01 IV147 150 152 62.78 1.97 2.04 0.008 IV147 152 154 63.46 2.23 2.12 0.007 IV147 154 156 63.52 1.22 1.43 0.007 IV147 156 158 63.54 1.4 1.47 0.008 IV147 158 160 63.14 2.51 1.83 0.008 IV147 160 162 64.01 1.72 1.57 0.007 IV147 162 164 63.58 2.2 1.16 0.006 IV147 164 166 63.75 2.38 1.54 0.008 IV147 166 168 62.47 3.5 2.12 0.007 IV147 168 170 62.1 4.83 2.08 0.01 IV147 170 172 61.37 4.32 2.35 0.007 IV147 172 174 61.75 3.98 1.68 0.01 IV147 174 176 62.52 3.73 2.04 0.008
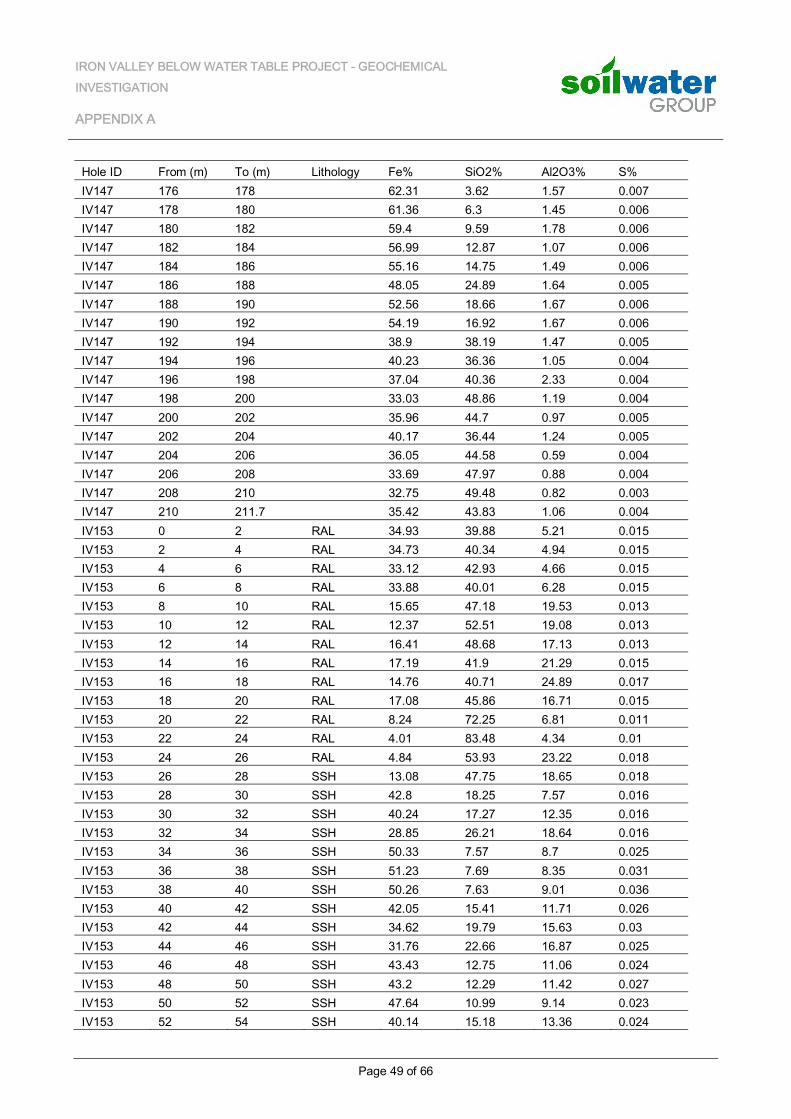
IRON VALLEY BELOW WATER TABLE PROJECT - GEOCHEMICAL INVESTIGATION
APPENDIX A
Page 49 of 66
Hole ID From (m) To (m) Lithology Fe% SiO2% Al2O3% S% IV147 176 178 62.31 3.62 1.57 0.007 IV147 178 180 61.36 6.3 1.45 0.006 IV147 180 182 59.4 9.59 1.78 0.006 IV147 182 184 56.99 12.87 1.07 0.006 IV147 184 186 55.16 14.75 1.49 0.006 IV147 186 188 48.05 24.89 1.64 0.005 IV147 188 190 52.56 18.66 1.67 0.006 IV147 190 192 54.19 16.92 1.67 0.006 IV147 192 194 38.9 38.19 1.47 0.005 IV147 194 196 40.23 36.36 1.05 0.004 IV147 196 198 37.04 40.36 2.33 0.004 IV147 198 200 33.03 48.86 1.19 0.004 IV147 200 202 35.96 44.7 0.97 0.005 IV147 202 204 40.17 36.44 1.24 0.005 IV147 204 206 36.05 44.58 0.59 0.004 IV147 206 208 33.69 47.97 0.88 0.004 IV147 208 210 32.75 49.48 0.82 0.003 IV147 210 211.7 35.42 43.83 1.06 0.004 IV153 0 2 RAL 34.93 39.88 5.21 0.015 IV153 2 4 RAL 34.73 40.34 4.94 0.015 IV153 4 6 RAL 33.12 42.93 4.66 0.015 IV153 6 8 RAL 33.88 40.01 6.28 0.015 IV153 8 10 RAL 15.65 47.18 19.53 0.013 IV153 10 12 RAL 12.37 52.51 19.08 0.013 IV153 12 14 RAL 16.41 48.68 17.13 0.013 IV153 14 16 RAL 17.19 41.9 21.29 0.015 IV153 16 18 RAL 14.76 40.71 24.89 0.017 IV153 18 20 RAL 17.08 45.86 16.71 0.015 IV153 20 22 RAL 8.24 72.25 6.81 0.011 IV153 22 24 RAL 4.01 83.48 4.34 0.01 IV153 24 26 RAL 4.84 53.93 23.22 0.018 IV153 26 28 SSH 13.08 47.75 18.65 0.018 IV153 28 30 SSH 42.8 18.25 7.57 0.016 IV153 30 32 SSH 40.24 17.27 12.35 0.016 IV153 32 34 SSH 28.85 26.21 18.64 0.016 IV153 34 36 SSH 50.33 7.57 8.7 0.025 IV153 36 38 SSH 51.23 7.69 8.35 0.031 IV153 38 40 SSH 50.26 7.63 9.01 0.036 IV153 40 42 SSH 42.05 15.41 11.71 0.026 IV153 42 44 SSH 34.62 19.79 15.63 0.03 IV153 44 46 SSH 31.76 22.66 16.87 0.025 IV153 46 48 SSH 43.43 12.75 11.06 0.024 IV153 48 50 SSH 43.2 12.29 11.42 0.027 IV153 50 52 SSH 47.64 10.99 9.14 0.023 IV153 52 54 SSH 40.14 15.18 13.36 0.024
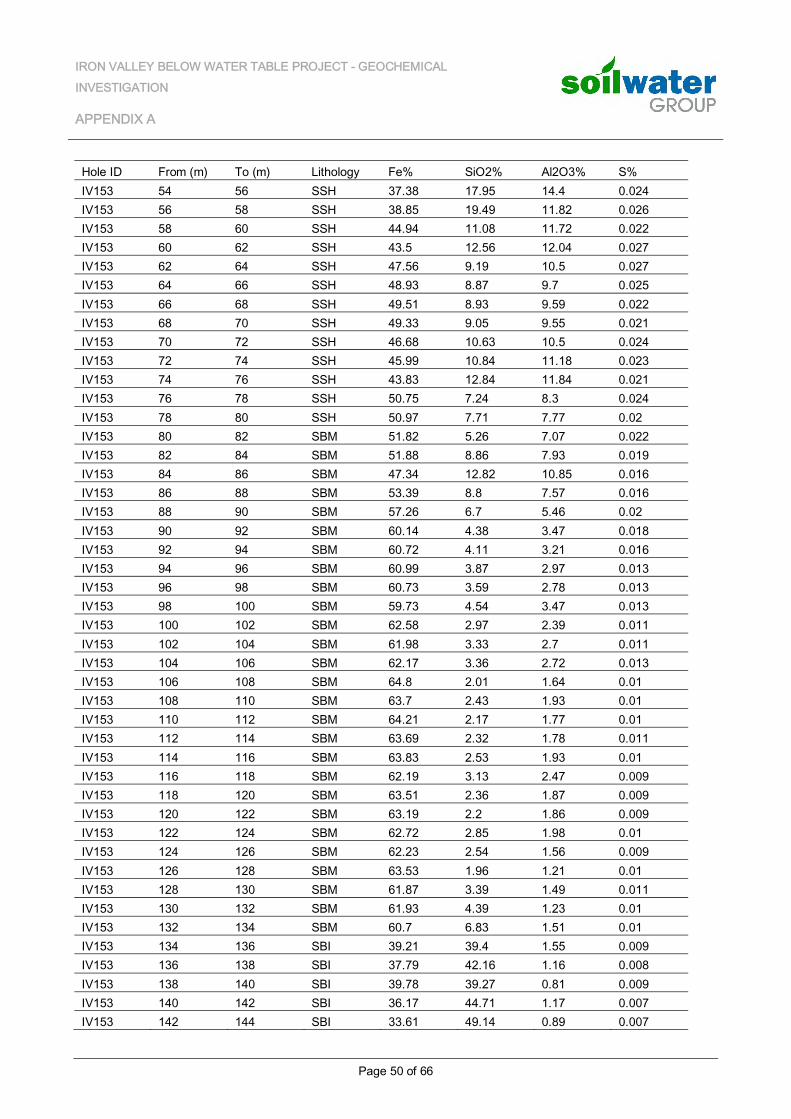
IRON VALLEY BELOW WATER TABLE PROJECT - GEOCHEMICAL INVESTIGATION
APPENDIX A
Page 50 of 66
Hole ID From (m) To (m) Lithology Fe% SiO2% Al2O3% S% IV153 54 56 SSH 37.38 17.95 14.4 0.024 IV153 56 58 SSH 38.85 19.49 11.82 0.026 IV153 58 60 SSH 44.94 11.08 11.72 0.022 IV153 60 62 SSH 43.5 12.56 12.04 0.027 IV153 62 64 SSH 47.56 9.19 10.5 0.027 IV153 64 66 SSH 48.93 8.87 9.7 0.025 IV153 66 68 SSH 49.51 8.93 9.59 0.022 IV153 68 70 SSH 49.33 9.05 9.55 0.021 IV153 70 72 SSH 46.68 10.63 10.5 0.024 IV153 72 74 SSH 45.99 10.84 11.18 0.023 IV153 74 76 SSH 43.83 12.84 11.84 0.021 IV153 76 78 SSH 50.75 7.24 8.3 0.024 IV153 78 80 SSH 50.97 7.71 7.77 0.02 IV153 80 82 SBM 51.82 5.26 7.07 0.022 IV153 82 84 SBM 51.88 8.86 7.93 0.019 IV153 84 86 SBM 47.34 12.82 10.85 0.016 IV153 86 88 SBM 53.39 8.8 7.57 0.016 IV153 88 90 SBM 57.26 6.7 5.46 0.02 IV153 90 92 SBM 60.14 4.38 3.47 0.018 IV153 92 94 SBM 60.72 4.11 3.21 0.016 IV153 94 96 SBM 60.99 3.87 2.97 0.013 IV153 96 98 SBM 60.73 3.59 2.78 0.013 IV153 98 100 SBM 59.73 4.54 3.47 0.013 IV153 100 102 SBM 62.58 2.97 2.39 0.011 IV153 102 104 SBM 61.98 3.33 2.7 0.011 IV153 104 106 SBM 62.17 3.36 2.72 0.013 IV153 106 108 SBM 64.8 2.01 1.64 0.01 IV153 108 110 SBM 63.7 2.43 1.93 0.01 IV153 110 112 SBM 64.21 2.17 1.77 0.01 IV153 112 114 SBM 63.69 2.32 1.78 0.011 IV153 114 116 SBM 63.83 2.53 1.93 0.01 IV153 116 118 SBM 62.19 3.13 2.47 0.009 IV153 118 120 SBM 63.51 2.36 1.87 0.009 IV153 120 122 SBM 63.19 2.2 1.86 0.009 IV153 122 124 SBM 62.72 2.85 1.98 0.01 IV153 124 126 SBM 62.23 2.54 1.56 0.009 IV153 126 128 SBM 63.53 1.96 1.21 0.01 IV153 128 130 SBM 61.87 3.39 1.49 0.011 IV153 130 132 SBM 61.93 4.39 1.23 0.01 IV153 132 134 SBM 60.7 6.83 1.51 0.01 IV153 134 136 SBI 39.21 39.4 1.55 0.009 IV153 136 138 SBI 37.79 42.16 1.16 0.008 IV153 138 140 SBI 39.78 39.27 0.81 0.009 IV153 140 142 SBI 36.17 44.71 1.17 0.007 IV153 142 144 SBI 33.61 49.14 0.89 0.007
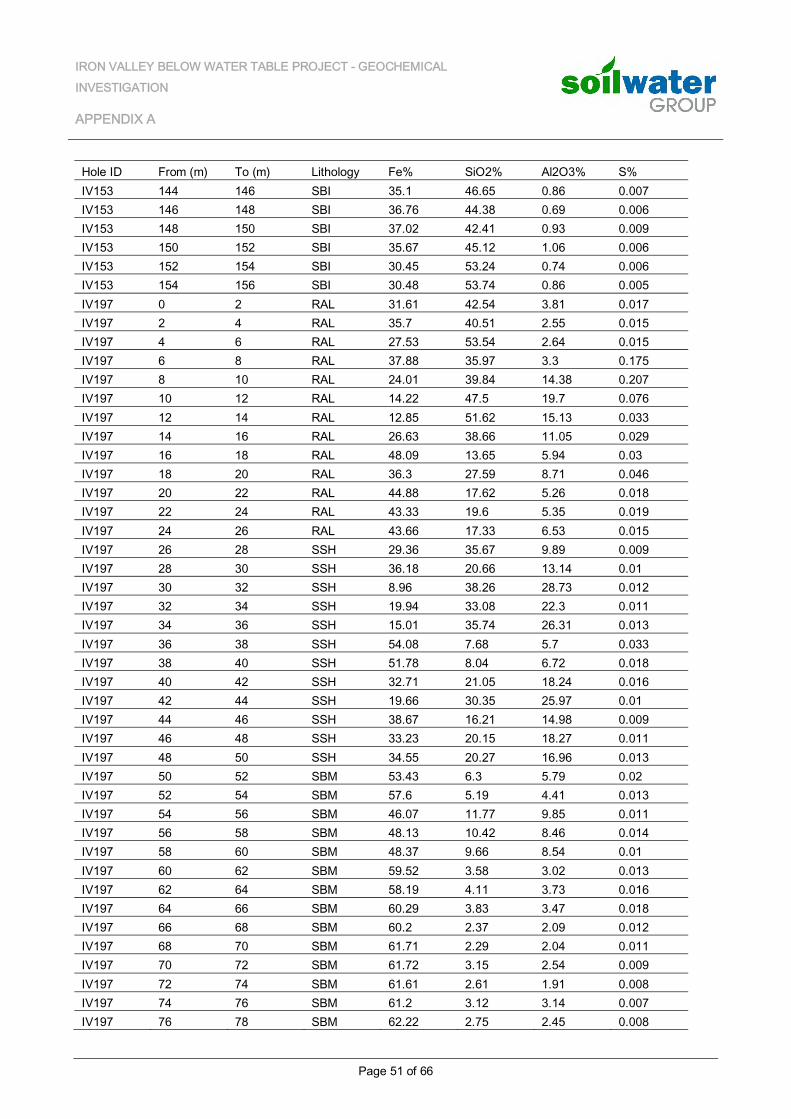
IRON VALLEY BELOW WATER TABLE PROJECT - GEOCHEMICAL INVESTIGATION
APPENDIX A
Page 51 of 66
Hole ID From (m) To (m) Lithology Fe% SiO2% Al2O3% S% IV153 144 146 SBI 35.1 46.65 0.86 0.007 IV153 146 148 SBI 36.76 44.38 0.69 0.006 IV153 148 150 SBI 37.02 42.41 0.93 0.009 IV153 150 152 SBI 35.67 45.12 1.06 0.006 IV153 152 154 SBI 30.45 53.24 0.74 0.006 IV153 154 156 SBI 30.48 53.74 0.86 0.005 IV197 0 2 RAL 31.61 42.54 3.81 0.017 IV197 2 4 RAL 35.7 40.51 2.55 0.015 IV197 4 6 RAL 27.53 53.54 2.64 0.015 IV197 6 8 RAL 37.88 35.97 3.3 0.175 IV197 8 10 RAL 24.01 39.84 14.38 0.207 IV197 10 12 RAL 14.22 47.5 19.7 0.076 IV197 12 14 RAL 12.85 51.62 15.13 0.033 IV197 14 16 RAL 26.63 38.66 11.05 0.029 IV197 16 18 RAL 48.09 13.65 5.94 0.03 IV197 18 20 RAL 36.3 27.59 8.71 0.046 IV197 20 22 RAL 44.88 17.62 5.26 0.018 IV197 22 24 RAL 43.33 19.6 5.35 0.019 IV197 24 26 RAL 43.66 17.33 6.53 0.015 IV197 26 28 SSH 29.36 35.67 9.89 0.009 IV197 28 30 SSH 36.18 20.66 13.14 0.01 IV197 30 32 SSH 8.96 38.26 28.73 0.012 IV197 32 34 SSH 19.94 33.08 22.3 0.011 IV197 34 36 SSH 15.01 35.74 26.31 0.013 IV197 36 38 SSH 54.08 7.68 5.7 0.033 IV197 38 40 SSH 51.78 8.04 6.72 0.018 IV197 40 42 SSH 32.71 21.05 18.24 0.016 IV197 42 44 SSH 19.66 30.35 25.97 0.01 IV197 44 46 SSH 38.67 16.21 14.98 0.009 IV197 46 48 SSH 33.23 20.15 18.27 0.011 IV197 48 50 SSH 34.55 20.27 16.96 0.013 IV197 50 52 SBM 53.43 6.3 5.79 0.02 IV197 52 54 SBM 57.6 5.19 4.41 0.013 IV197 54 56 SBM 46.07 11.77 9.85 0.011 IV197 56 58 SBM 48.13 10.42 8.46 0.014 IV197 58 60 SBM 48.37 9.66 8.54 0.01 IV197 60 62 SBM 59.52 3.58 3.02 0.013 IV197 62 64 SBM 58.19 4.11 3.73 0.016 IV197 64 66 SBM 60.29 3.83 3.47 0.018 IV197 66 68 SBM 60.2 2.37 2.09 0.012 IV197 68 70 SBM 61.71 2.29 2.04 0.011 IV197 70 72 SBM 61.72 3.15 2.54 0.009 IV197 72 74 SBM 61.61 2.61 1.91 0.008 IV197 74 76 SBM 61.2 3.12 3.14 0.007 IV197 76 78 SBM 62.22 2.75 2.45 0.008
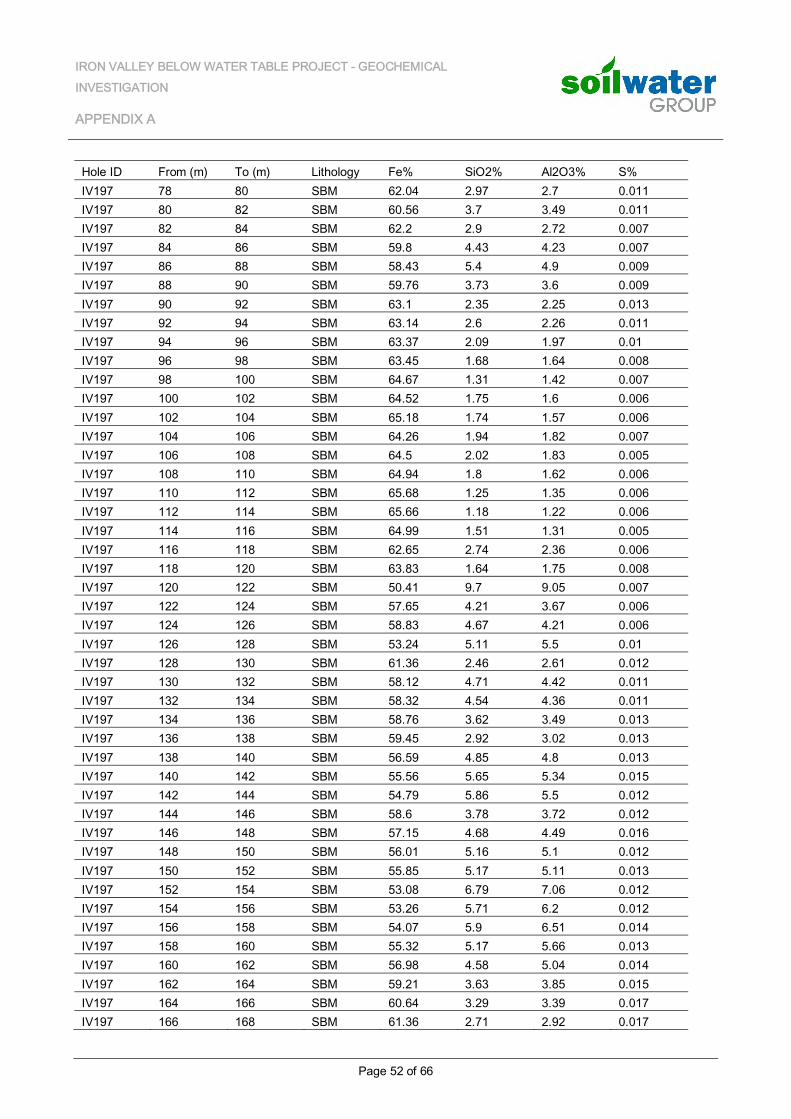
IRON VALLEY BELOW WATER TABLE PROJECT - GEOCHEMICAL INVESTIGATION
APPENDIX A
Page 52 of 66
Hole ID From (m) To (m) Lithology Fe% SiO2% Al2O3% S% IV197 78 80 SBM 62.04 2.97 2.7 0.011 IV197 80 82 SBM 60.56 3.7 3.49 0.011 IV197 82 84 SBM 62.2 2.9 2.72 0.007 IV197 84 86 SBM 59.8 4.43 4.23 0.007 IV197 86 88 SBM 58.43 5.4 4.9 0.009 IV197 88 90 SBM 59.76 3.73 3.6 0.009 IV197 90 92 SBM 63.1 2.35 2.25 0.013 IV197 92 94 SBM 63.14 2.6 2.26 0.011 IV197 94 96 SBM 63.37 2.09 1.97 0.01 IV197 96 98 SBM 63.45 1.68 1.64 0.008 IV197 98 100 SBM 64.67 1.31 1.42 0.007 IV197 100 102 SBM 64.52 1.75 1.6 0.006 IV197 102 104 SBM 65.18 1.74 1.57 0.006 IV197 104 106 SBM 64.26 1.94 1.82 0.007 IV197 106 108 SBM 64.5 2.02 1.83 0.005 IV197 108 110 SBM 64.94 1.8 1.62 0.006 IV197 110 112 SBM 65.68 1.25 1.35 0.006 IV197 112 114 SBM 65.66 1.18 1.22 0.006 IV197 114 116 SBM 64.99 1.51 1.31 0.005 IV197 116 118 SBM 62.65 2.74 2.36 0.006 IV197 118 120 SBM 63.83 1.64 1.75 0.008 IV197 120 122 SBM 50.41 9.7 9.05 0.007 IV197 122 124 SBM 57.65 4.21 3.67 0.006 IV197 124 126 SBM 58.83 4.67 4.21 0.006 IV197 126 128 SBM 53.24 5.11 5.5 0.01 IV197 128 130 SBM 61.36 2.46 2.61 0.012 IV197 130 132 SBM 58.12 4.71 4.42 0.011 IV197 132 134 SBM 58.32 4.54 4.36 0.011 IV197 134 136 SBM 58.76 3.62 3.49 0.013 IV197 136 138 SBM 59.45 2.92 3.02 0.013 IV197 138 140 SBM 56.59 4.85 4.8 0.013 IV197 140 142 SBM 55.56 5.65 5.34 0.015 IV197 142 144 SBM 54.79 5.86 5.5 0.012 IV197 144 146 SBM 58.6 3.78 3.72 0.012 IV197 146 148 SBM 57.15 4.68 4.49 0.016 IV197 148 150 SBM 56.01 5.16 5.1 0.012 IV197 150 152 SBM 55.85 5.17 5.11 0.013 IV197 152 154 SBM 53.08 6.79 7.06 0.012 IV197 154 156 SBM 53.26 5.71 6.2 0.012 IV197 156 158 SBM 54.07 5.9 6.51 0.014 IV197 158 160 SBM 55.32 5.17 5.66 0.013 IV197 160 162 SBM 56.98 4.58 5.04 0.014 IV197 162 164 SBM 59.21 3.63 3.85 0.015 IV197 164 166 SBM 60.64 3.29 3.39 0.017 IV197 166 168 SBM 61.36 2.71 2.92 0.017
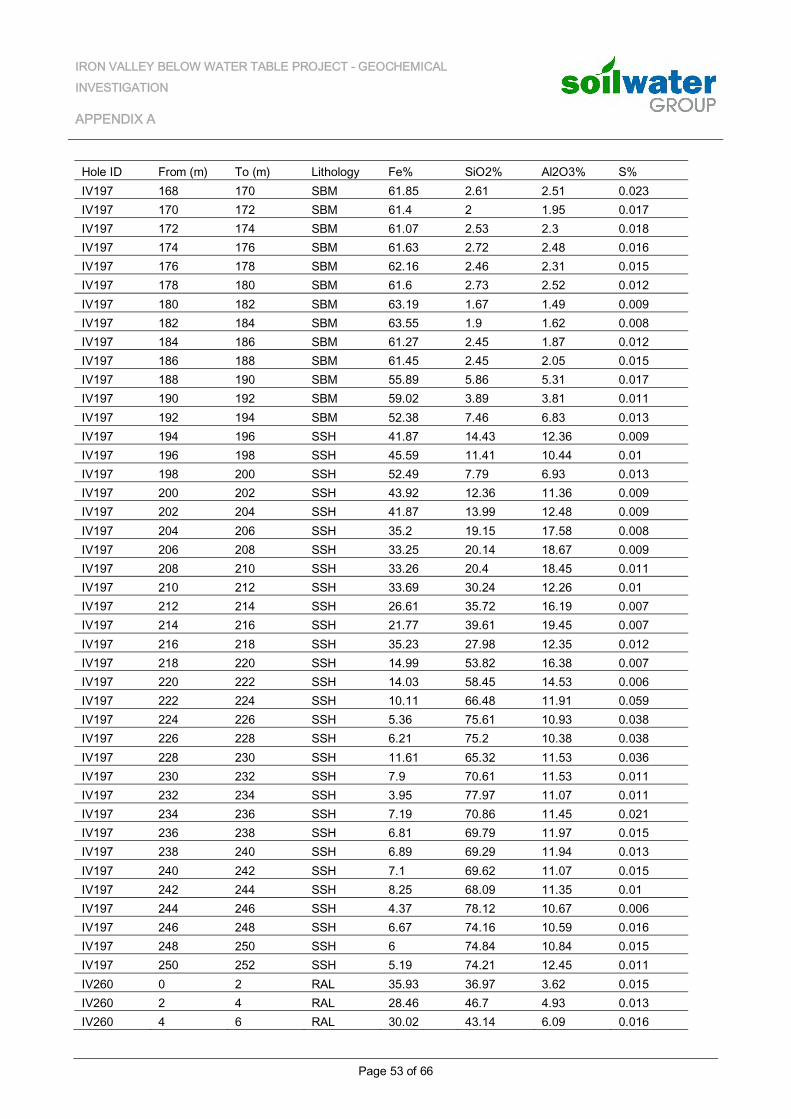
IRON VALLEY BELOW WATER TABLE PROJECT - GEOCHEMICAL INVESTIGATION
APPENDIX A
Page 53 of 66
Hole ID From (m) To (m) Lithology Fe% SiO2% Al2O3% S% IV197 168 170 SBM 61.85 2.61 2.51 0.023 IV197 170 172 SBM 61.4 2 1.95 0.017 IV197 172 174 SBM 61.07 2.53 2.3 0.018 IV197 174 176 SBM 61.63 2.72 2.48 0.016 IV197 176 178 SBM 62.16 2.46 2.31 0.015 IV197 178 180 SBM 61.6 2.73 2.52 0.012 IV197 180 182 SBM 63.19 1.67 1.49 0.009 IV197 182 184 SBM 63.55 1.9 1.62 0.008 IV197 184 186 SBM 61.27 2.45 1.87 0.012 IV197 186 188 SBM 61.45 2.45 2.05 0.015 IV197 188 190 SBM 55.89 5.86 5.31 0.017 IV197 190 192 SBM 59.02 3.89 3.81 0.011 IV197 192 194 SBM 52.38 7.46 6.83 0.013 IV197 194 196 SSH 41.87 14.43 12.36 0.009 IV197 196 198 SSH 45.59 11.41 10.44 0.01 IV197 198 200 SSH 52.49 7.79 6.93 0.013 IV197 200 202 SSH 43.92 12.36 11.36 0.009 IV197 202 204 SSH 41.87 13.99 12.48 0.009 IV197 204 206 SSH 35.2 19.15 17.58 0.008 IV197 206 208 SSH 33.25 20.14 18.67 0.009 IV197 208 210 SSH 33.26 20.4 18.45 0.011 IV197 210 212 SSH 33.69 30.24 12.26 0.01 IV197 212 214 SSH 26.61 35.72 16.19 0.007 IV197 214 216 SSH 21.77 39.61 19.45 0.007 IV197 216 218 SSH 35.23 27.98 12.35 0.012 IV197 218 220 SSH 14.99 53.82 16.38 0.007 IV197 220 222 SSH 14.03 58.45 14.53 0.006 IV197 222 224 SSH 10.11 66.48 11.91 0.059 IV197 224 226 SSH 5.36 75.61 10.93 0.038 IV197 226 228 SSH 6.21 75.2 10.38 0.038 IV197 228 230 SSH 11.61 65.32 11.53 0.036 IV197 230 232 SSH 7.9 70.61 11.53 0.011 IV197 232 234 SSH 3.95 77.97 11.07 0.011 IV197 234 236 SSH 7.19 70.86 11.45 0.021 IV197 236 238 SSH 6.81 69.79 11.97 0.015 IV197 238 240 SSH 6.89 69.29 11.94 0.013 IV197 240 242 SSH 7.1 69.62 11.07 0.015 IV197 242 244 SSH 8.25 68.09 11.35 0.01 IV197 244 246 SSH 4.37 78.12 10.67 0.006 IV197 246 248 SSH 6.67 74.16 10.59 0.016 IV197 248 250 SSH 6 74.84 10.84 0.015 IV197 250 252 SSH 5.19 74.21 12.45 0.011 IV260 0 2 RAL 35.93 36.97 3.62 0.015 IV260 2 4 RAL 28.46 46.7 4.93 0.013 IV260 4 6 RAL 30.02 43.14 6.09 0.016
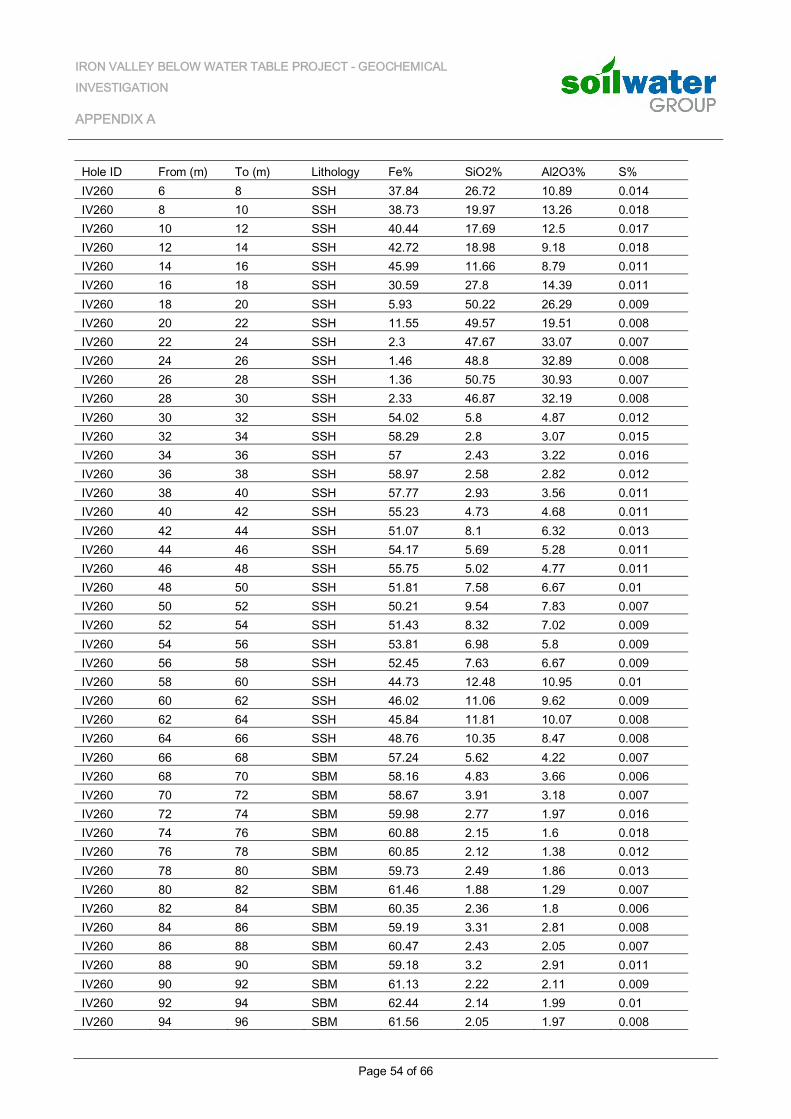
IRON VALLEY BELOW WATER TABLE PROJECT - GEOCHEMICAL INVESTIGATION
APPENDIX A
Page 54 of 66
Hole ID From (m) To (m) Lithology Fe% SiO2% Al2O3% S% IV260 6 8 SSH 37.84 26.72 10.89 0.014 IV260 8 10 SSH 38.73 19.97 13.26 0.018 IV260 10 12 SSH 40.44 17.69 12.5 0.017 IV260 12 14 SSH 42.72 18.98 9.18 0.018 IV260 14 16 SSH 45.99 11.66 8.79 0.011 IV260 16 18 SSH 30.59 27.8 14.39 0.011 IV260 18 20 SSH 5.93 50.22 26.29 0.009 IV260 20 22 SSH 11.55 49.57 19.51 0.008 IV260 22 24 SSH 2.3 47.67 33.07 0.007 IV260 24 26 SSH 1.46 48.8 32.89 0.008 IV260 26 28 SSH 1.36 50.75 30.93 0.007 IV260 28 30 SSH 2.33 46.87 32.19 0.008 IV260 30 32 SSH 54.02 5.8 4.87 0.012 IV260 32 34 SSH 58.29 2.8 3.07 0.015 IV260 34 36 SSH 57 2.43 3.22 0.016 IV260 36 38 SSH 58.97 2.58 2.82 0.012 IV260 38 40 SSH 57.77 2.93 3.56 0.011 IV260 40 42 SSH 55.23 4.73 4.68 0.011 IV260 42 44 SSH 51.07 8.1 6.32 0.013 IV260 44 46 SSH 54.17 5.69 5.28 0.011 IV260 46 48 SSH 55.75 5.02 4.77 0.011 IV260 48 50 SSH 51.81 7.58 6.67 0.01 IV260 50 52 SSH 50.21 9.54 7.83 0.007 IV260 52 54 SSH 51.43 8.32 7.02 0.009 IV260 54 56 SSH 53.81 6.98 5.8 0.009 IV260 56 58 SSH 52.45 7.63 6.67 0.009 IV260 58 60 SSH 44.73 12.48 10.95 0.01 IV260 60 62 SSH 46.02 11.06 9.62 0.009 IV260 62 64 SSH 45.84 11.81 10.07 0.008 IV260 64 66 SSH 48.76 10.35 8.47 0.008 IV260 66 68 SBM 57.24 5.62 4.22 0.007 IV260 68 70 SBM 58.16 4.83 3.66 0.006 IV260 70 72 SBM 58.67 3.91 3.18 0.007 IV260 72 74 SBM 59.98 2.77 1.97 0.016 IV260 74 76 SBM 60.88 2.15 1.6 0.018 IV260 76 78 SBM 60.85 2.12 1.38 0.012 IV260 78 80 SBM 59.73 2.49 1.86 0.013 IV260 80 82 SBM 61.46 1.88 1.29 0.007 IV260 82 84 SBM 60.35 2.36 1.8 0.006 IV260 84 86 SBM 59.19 3.31 2.81 0.008 IV260 86 88 SBM 60.47 2.43 2.05 0.007 IV260 88 90 SBM 59.18 3.2 2.91 0.011 IV260 90 92 SBM 61.13 2.22 2.11 0.009 IV260 92 94 SBM 62.44 2.14 1.99 0.01 IV260 94 96 SBM 61.56 2.05 1.97 0.008
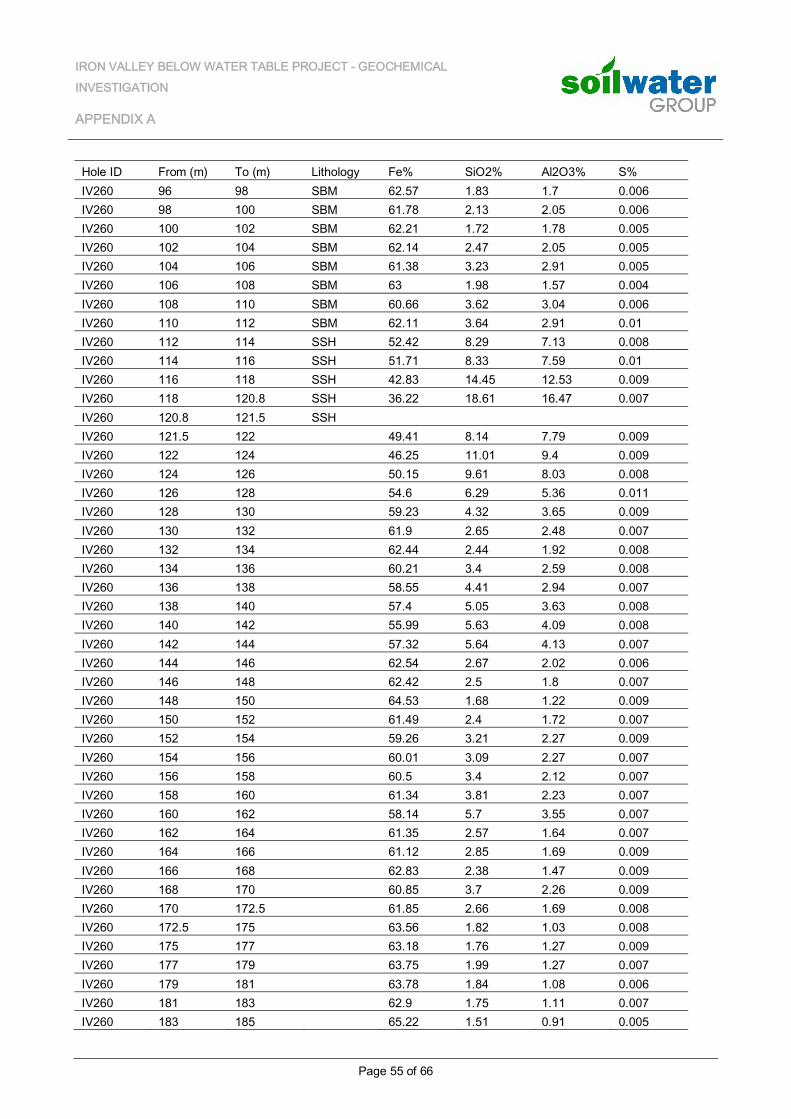
IRON VALLEY BELOW WATER TABLE PROJECT - GEOCHEMICAL INVESTIGATION
APPENDIX A
Page 55 of 66
Hole ID From (m) To (m) Lithology Fe% SiO2% Al2O3% S% IV260 96 98 SBM 62.57 1.83 1.7 0.006 IV260 98 100 SBM 61.78 2.13 2.05 0.006 IV260 100 102 SBM 62.21 1.72 1.78 0.005 IV260 102 104 SBM 62.14 2.47 2.05 0.005 IV260 104 106 SBM 61.38 3.23 2.91 0.005 IV260 106 108 SBM 63 1.98 1.57 0.004 IV260 108 110 SBM 60.66 3.62 3.04 0.006 IV260 110 112 SBM 62.11 3.64 2.91 0.01 IV260 112 114 SSH 52.42 8.29 7.13 0.008 IV260 114 116 SSH 51.71 8.33 7.59 0.01 IV260 116 118 SSH 42.83 14.45 12.53 0.009 IV260 118 120.8 SSH 36.22 18.61 16.47 0.007 IV260 120.8 121.5 SSH IV260 121.5 122 49.41 8.14 7.79 0.009 IV260 122 124 46.25 11.01 9.4 0.009 IV260 124 126 50.15 9.61 8.03 0.008 IV260 126 128 54.6 6.29 5.36 0.011 IV260 128 130 59.23 4.32 3.65 0.009 IV260 130 132 61.9 2.65 2.48 0.007 IV260 132 134 62.44 2.44 1.92 0.008 IV260 134 136 60.21 3.4 2.59 0.008 IV260 136 138 58.55 4.41 2.94 0.007 IV260 138 140 57.4 5.05 3.63 0.008 IV260 140 142 55.99 5.63 4.09 0.008 IV260 142 144 57.32 5.64 4.13 0.007 IV260 144 146 62.54 2.67 2.02 0.006 IV260 146 148 62.42 2.5 1.8 0.007 IV260 148 150 64.53 1.68 1.22 0.009 IV260 150 152 61.49 2.4 1.72 0.007 IV260 152 154 59.26 3.21 2.27 0.009 IV260 154 156 60.01 3.09 2.27 0.007 IV260 156 158 60.5 3.4 2.12 0.007 IV260 158 160 61.34 3.81 2.23 0.007 IV260 160 162 58.14 5.7 3.55 0.007 IV260 162 164 61.35 2.57 1.64 0.007 IV260 164 166 61.12 2.85 1.69 0.009 IV260 166 168 62.83 2.38 1.47 0.009 IV260 168 170 60.85 3.7 2.26 0.009 IV260 170 172.5 61.85 2.66 1.69 0.008 IV260 172.5 175 63.56 1.82 1.03 0.008 IV260 175 177 63.18 1.76 1.27 0.009 IV260 177 179 63.75 1.99 1.27 0.007 IV260 179 181 63.78 1.84 1.08 0.006 IV260 181 183 62.9 1.75 1.11 0.007 IV260 183 185 65.22 1.51 0.91 0.005
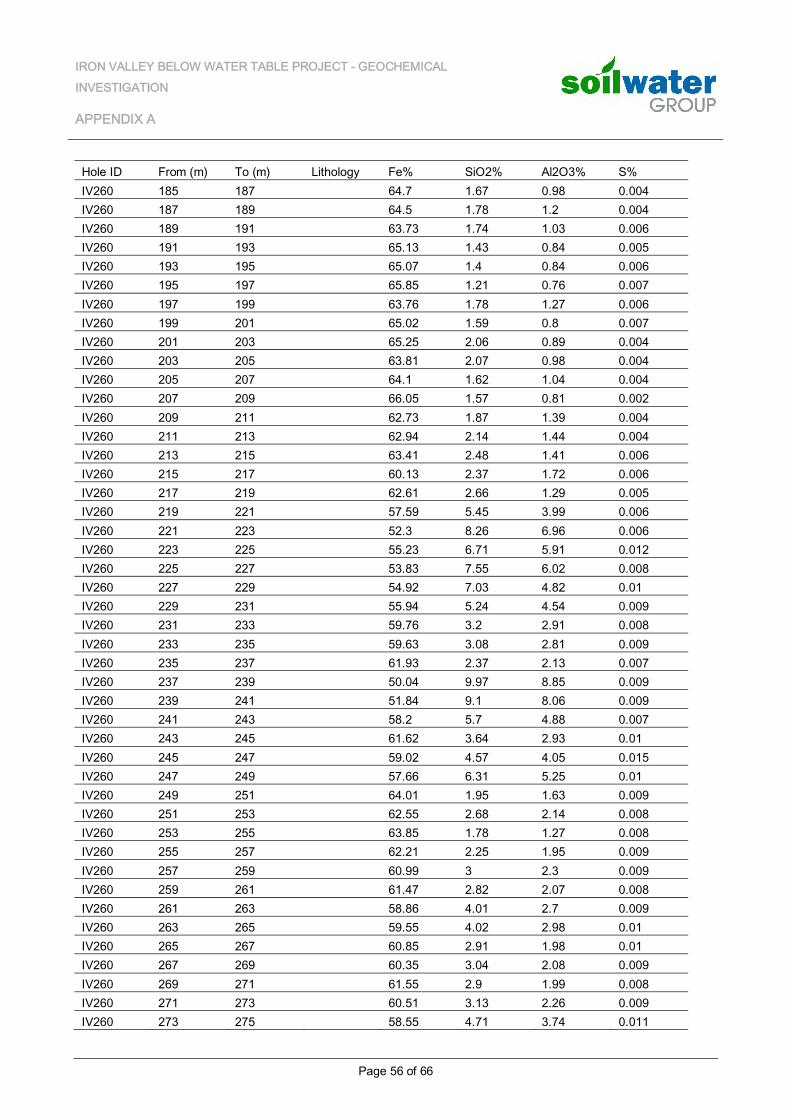
IRON VALLEY BELOW WATER TABLE PROJECT - GEOCHEMICAL INVESTIGATION
APPENDIX A
Page 56 of 66
Hole ID From (m) To (m) Lithology Fe% SiO2% Al2O3% S% IV260 185 187 64.7 1.67 0.98 0.004 IV260 187 189 64.5 1.78 1.2 0.004 IV260 189 191 63.73 1.74 1.03 0.006 IV260 191 193 65.13 1.43 0.84 0.005 IV260 193 195 65.07 1.4 0.84 0.006 IV260 195 197 65.85 1.21 0.76 0.007 IV260 197 199 63.76 1.78 1.27 0.006 IV260 199 201 65.02 1.59 0.8 0.007 IV260 201 203 65.25 2.06 0.89 0.004 IV260 203 205 63.81 2.07 0.98 0.004 IV260 205 207 64.1 1.62 1.04 0.004 IV260 207 209 66.05 1.57 0.81 0.002 IV260 209 211 62.73 1.87 1.39 0.004 IV260 211 213 62.94 2.14 1.44 0.004 IV260 213 215 63.41 2.48 1.41 0.006 IV260 215 217 60.13 2.37 1.72 0.006 IV260 217 219 62.61 2.66 1.29 0.005 IV260 219 221 57.59 5.45 3.99 0.006 IV260 221 223 52.3 8.26 6.96 0.006 IV260 223 225 55.23 6.71 5.91 0.012 IV260 225 227 53.83 7.55 6.02 0.008 IV260 227 229 54.92 7.03 4.82 0.01 IV260 229 231 55.94 5.24 4.54 0.009 IV260 231 233 59.76 3.2 2.91 0.008 IV260 233 235 59.63 3.08 2.81 0.009 IV260 235 237 61.93 2.37 2.13 0.007 IV260 237 239 50.04 9.97 8.85 0.009 IV260 239 241 51.84 9.1 8.06 0.009 IV260 241 243 58.2 5.7 4.88 0.007 IV260 243 245 61.62 3.64 2.93 0.01 IV260 245 247 59.02 4.57 4.05 0.015 IV260 247 249 57.66 6.31 5.25 0.01 IV260 249 251 64.01 1.95 1.63 0.009 IV260 251 253 62.55 2.68 2.14 0.008 IV260 253 255 63.85 1.78 1.27 0.008 IV260 255 257 62.21 2.25 1.95 0.009 IV260 257 259 60.99 3 2.3 0.009 IV260 259 261 61.47 2.82 2.07 0.008 IV260 261 263 58.86 4.01 2.7 0.009 IV260 263 265 59.55 4.02 2.98 0.01 IV260 265 267 60.85 2.91 1.98 0.01 IV260 267 269 60.35 3.04 2.08 0.009 IV260 269 271 61.55 2.9 1.99 0.008 IV260 271 273 60.51 3.13 2.26 0.009 IV260 273 275 58.55 4.71 3.74 0.011
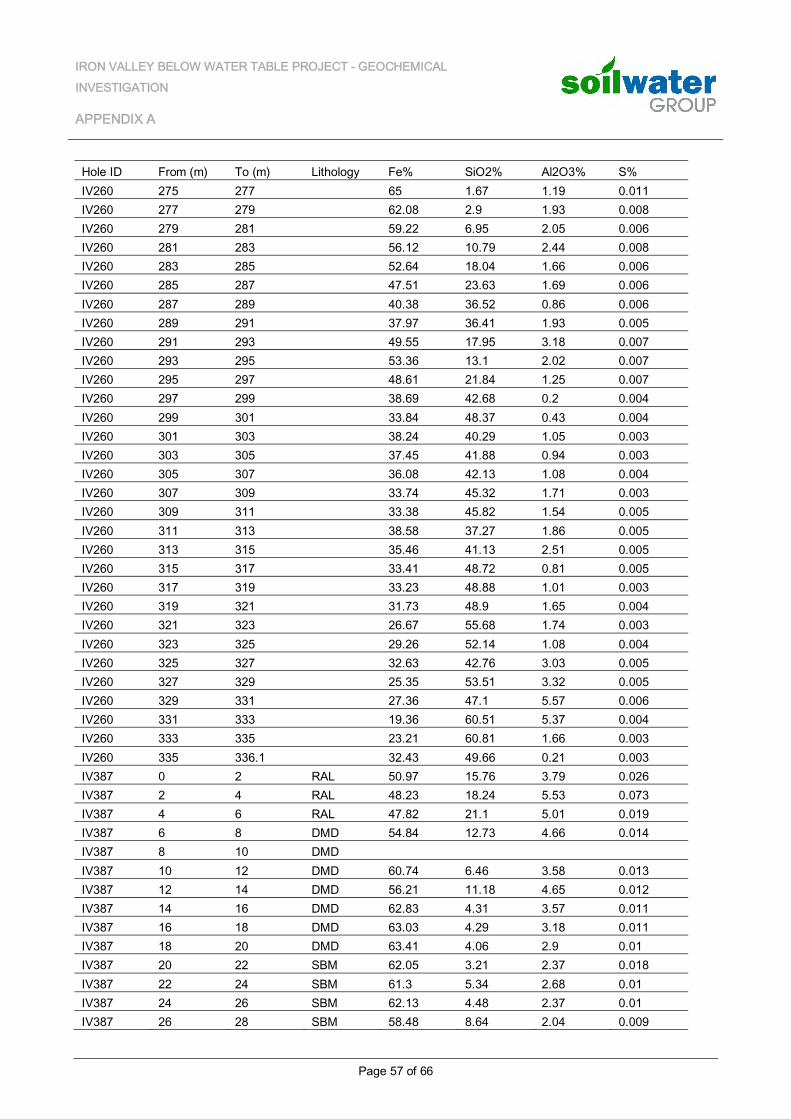
IRON VALLEY BELOW WATER TABLE PROJECT - GEOCHEMICAL INVESTIGATION
APPENDIX A
Page 57 of 66
Hole ID From (m) To (m) Lithology Fe% SiO2% Al2O3% S% IV260 275 277 65 1.67 1.19 0.011 IV260 277 279 62.08 2.9 1.93 0.008 IV260 279 281 59.22 6.95 2.05 0.006 IV260 281 283 56.12 10.79 2.44 0.008 IV260 283 285 52.64 18.04 1.66 0.006 IV260 285 287 47.51 23.63 1.69 0.006 IV260 287 289 40.38 36.52 0.86 0.006 IV260 289 291 37.97 36.41 1.93 0.005 IV260 291 293 49.55 17.95 3.18 0.007 IV260 293 295 53.36 13.1 2.02 0.007 IV260 295 297 48.61 21.84 1.25 0.007 IV260 297 299 38.69 42.68 0.2 0.004 IV260 299 301 33.84 48.37 0.43 0.004 IV260 301 303 38.24 40.29 1.05 0.003 IV260 303 305 37.45 41.88 0.94 0.003 IV260 305 307 36.08 42.13 1.08 0.004 IV260 307 309 33.74 45.32 1.71 0.003 IV260 309 311 33.38 45.82 1.54 0.005 IV260 311 313 38.58 37.27 1.86 0.005 IV260 313 315 35.46 41.13 2.51 0.005 IV260 315 317 33.41 48.72 0.81 0.005 IV260 317 319 33.23 48.88 1.01 0.003 IV260 319 321 31.73 48.9 1.65 0.004 IV260 321 323 26.67 55.68 1.74 0.003 IV260 323 325 29.26 52.14 1.08 0.004 IV260 325 327 32.63 42.76 3.03 0.005 IV260 327 329 25.35 53.51 3.32 0.005 IV260 329 331 27.36 47.1 5.57 0.006 IV260 331 333 19.36 60.51 5.37 0.004 IV260 333 335 23.21 60.81 1.66 0.003 IV260 335 336.1 32.43 49.66 0.21 0.003 IV387 0 2 RAL 50.97 15.76 3.79 0.026 IV387 2 4 RAL 48.23 18.24 5.53 0.073 IV387 4 6 RAL 47.82 21.1 5.01 0.019 IV387 6 8 DMD 54.84 12.73 4.66 0.014 IV387 8 10 DMD IV387 10 12 DMD 60.74 6.46 3.58 0.013 IV387 12 14 DMD 56.21 11.18 4.65 0.012 IV387 14 16 DMD 62.83 4.31 3.57 0.011 IV387 16 18 DMD 63.03 4.29 3.18 0.011 IV387 18 20 DMD 63.41 4.06 2.9 0.01 IV387 20 22 SBM 62.05 3.21 2.37 0.018 IV387 22 24 SBM 61.3 5.34 2.68 0.01 IV387 24 26 SBM 62.13 4.48 2.37 0.01 IV387 26 28 SBM 58.48 8.64 2.04 0.009
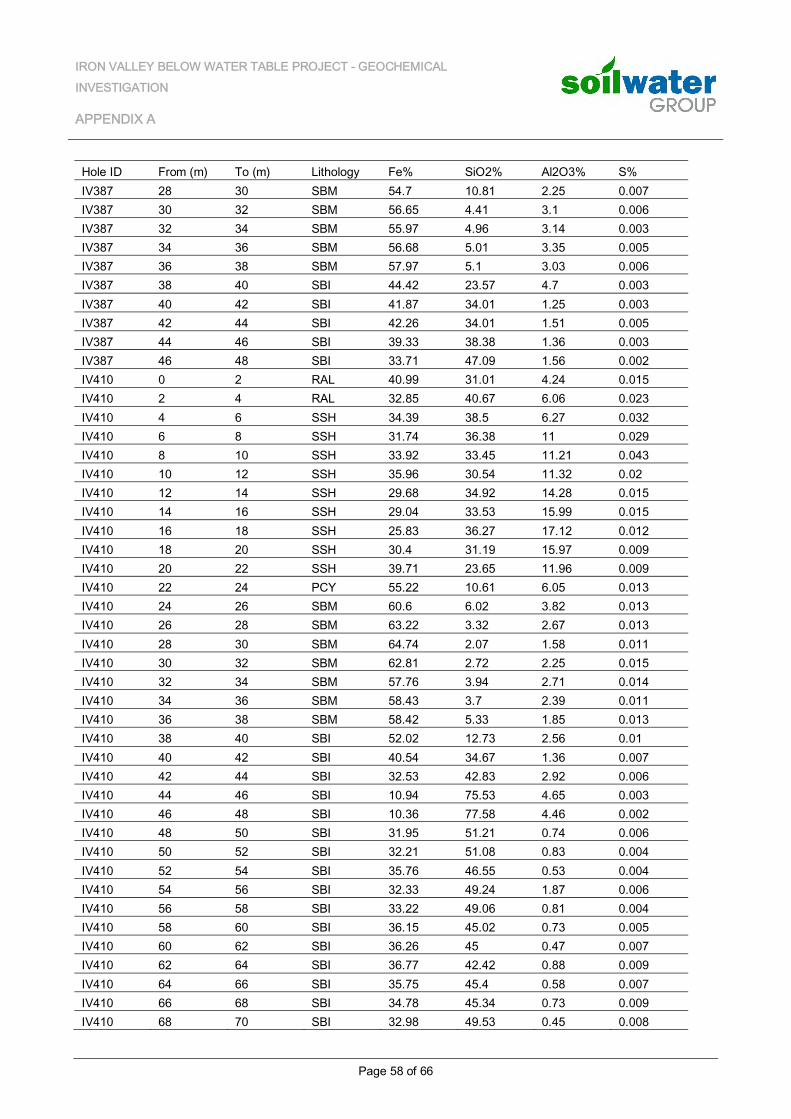
IRON VALLEY BELOW WATER TABLE PROJECT - GEOCHEMICAL INVESTIGATION
APPENDIX A
Page 58 of 66
Hole ID From (m) To (m) Lithology Fe% SiO2% Al2O3% S% IV387 28 30 SBM 54.7 10.81 2.25 0.007 IV387 30 32 SBM 56.65 4.41 3.1 0.006 IV387 32 34 SBM 55.97 4.96 3.14 0.003 IV387 34 36 SBM 56.68 5.01 3.35 0.005 IV387 36 38 SBM 57.97 5.1 3.03 0.006 IV387 38 40 SBI 44.42 23.57 4.7 0.003 IV387 40 42 SBI 41.87 34.01 1.25 0.003 IV387 42 44 SBI 42.26 34.01 1.51 0.005 IV387 44 46 SBI 39.33 38.38 1.36 0.003 IV387 46 48 SBI 33.71 47.09 1.56 0.002 IV410 0 2 RAL 40.99 31.01 4.24 0.015 IV410 2 4 RAL 32.85 40.67 6.06 0.023 IV410 4 6 SSH 34.39 38.5 6.27 0.032 IV410 6 8 SSH 31.74 36.38 11 0.029 IV410 8 10 SSH 33.92 33.45 11.21 0.043 IV410 10 12 SSH 35.96 30.54 11.32 0.02 IV410 12 14 SSH 29.68 34.92 14.28 0.015 IV410 14 16 SSH 29.04 33.53 15.99 0.015 IV410 16 18 SSH 25.83 36.27 17.12 0.012 IV410 18 20 SSH 30.4 31.19 15.97 0.009 IV410 20 22 SSH 39.71 23.65 11.96 0.009 IV410 22 24 PCY 55.22 10.61 6.05 0.013 IV410 24 26 SBM 60.6 6.02 3.82 0.013 IV410 26 28 SBM 63.22 3.32 2.67 0.013 IV410 28 30 SBM 64.74 2.07 1.58 0.011 IV410 30 32 SBM 62.81 2.72 2.25 0.015 IV410 32 34 SBM 57.76 3.94 2.71 0.014 IV410 34 36 SBM 58.43 3.7 2.39 0.011 IV410 36 38 SBM 58.42 5.33 1.85 0.013 IV410 38 40 SBI 52.02 12.73 2.56 0.01 IV410 40 42 SBI 40.54 34.67 1.36 0.007 IV410 42 44 SBI 32.53 42.83 2.92 0.006 IV410 44 46 SBI 10.94 75.53 4.65 0.003 IV410 46 48 SBI 10.36 77.58 4.46 0.002 IV410 48 50 SBI 31.95 51.21 0.74 0.006 IV410 50 52 SBI 32.21 51.08 0.83 0.004 IV410 52 54 SBI 35.76 46.55 0.53 0.004 IV410 54 56 SBI 32.33 49.24 1.87 0.006 IV410 56 58 SBI 33.22 49.06 0.81 0.004 IV410 58 60 SBI 36.15 45.02 0.73 0.005 IV410 60 62 SBI 36.26 45 0.47 0.007 IV410 62 64 SBI 36.77 42.42 0.88 0.009 IV410 64 66 SBI 35.75 45.4 0.58 0.007 IV410 66 68 SBI 34.78 45.34 0.73 0.009 IV410 68 70 SBI 32.98 49.53 0.45 0.008
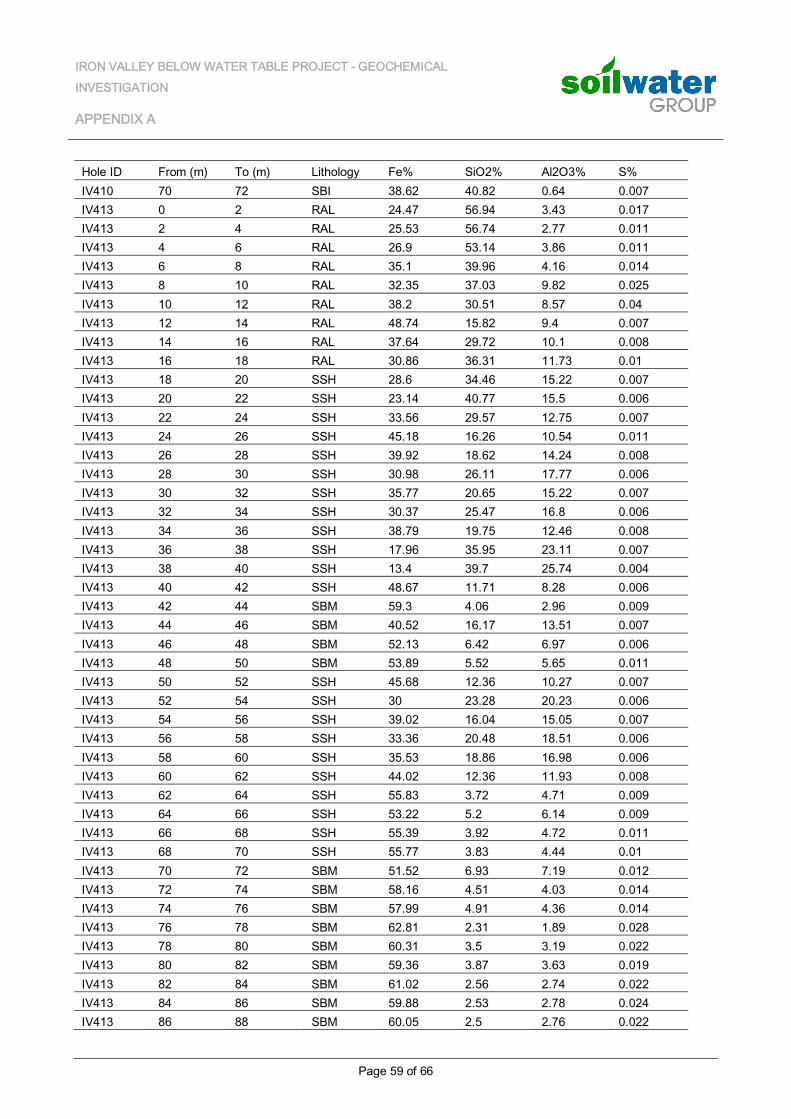
IRON VALLEY BELOW WATER TABLE PROJECT - GEOCHEMICAL INVESTIGATION
APPENDIX A
Page 59 of 66
Hole ID From (m) To (m) Lithology Fe% SiO2% Al2O3% S% IV410 70 72 SBI 38.62 40.82 0.64 0.007 IV413 0 2 RAL 24.47 56.94 3.43 0.017 IV413 2 4 RAL 25.53 56.74 2.77 0.011 IV413 4 6 RAL 26.9 53.14 3.86 0.011 IV413 6 8 RAL 35.1 39.96 4.16 0.014 IV413 8 10 RAL 32.35 37.03 9.82 0.025 IV413 10 12 RAL 38.2 30.51 8.57 0.04 IV413 12 14 RAL 48.74 15.82 9.4 0.007 IV413 14 16 RAL 37.64 29.72 10.1 0.008 IV413 16 18 RAL 30.86 36.31 11.73 0.01 IV413 18 20 SSH 28.6 34.46 15.22 0.007 IV413 20 22 SSH 23.14 40.77 15.5 0.006 IV413 22 24 SSH 33.56 29.57 12.75 0.007 IV413 24 26 SSH 45.18 16.26 10.54 0.011 IV413 26 28 SSH 39.92 18.62 14.24 0.008 IV413 28 30 SSH 30.98 26.11 17.77 0.006 IV413 30 32 SSH 35.77 20.65 15.22 0.007 IV413 32 34 SSH 30.37 25.47 16.8 0.006 IV413 34 36 SSH 38.79 19.75 12.46 0.008 IV413 36 38 SSH 17.96 35.95 23.11 0.007 IV413 38 40 SSH 13.4 39.7 25.74 0.004 IV413 40 42 SSH 48.67 11.71 8.28 0.006 IV413 42 44 SBM 59.3 4.06 2.96 0.009 IV413 44 46 SBM 40.52 16.17 13.51 0.007 IV413 46 48 SBM 52.13 6.42 6.97 0.006 IV413 48 50 SBM 53.89 5.52 5.65 0.011 IV413 50 52 SSH 45.68 12.36 10.27 0.007 IV413 52 54 SSH 30 23.28 20.23 0.006 IV413 54 56 SSH 39.02 16.04 15.05 0.007 IV413 56 58 SSH 33.36 20.48 18.51 0.006 IV413 58 60 SSH 35.53 18.86 16.98 0.006 IV413 60 62 SSH 44.02 12.36 11.93 0.008 IV413 62 64 SSH 55.83 3.72 4.71 0.009 IV413 64 66 SSH 53.22 5.2 6.14 0.009 IV413 66 68 SSH 55.39 3.92 4.72 0.011 IV413 68 70 SSH 55.77 3.83 4.44 0.01 IV413 70 72 SBM 51.52 6.93 7.19 0.012 IV413 72 74 SBM 58.16 4.51 4.03 0.014 IV413 74 76 SBM 57.99 4.91 4.36 0.014 IV413 76 78 SBM 62.81 2.31 1.89 0.028 IV413 78 80 SBM 60.31 3.5 3.19 0.022 IV413 80 82 SBM 59.36 3.87 3.63 0.019 IV413 82 84 SBM 61.02 2.56 2.74 0.022 IV413 84 86 SBM 59.88 2.53 2.78 0.024 IV413 86 88 SBM 60.05 2.5 2.76 0.022
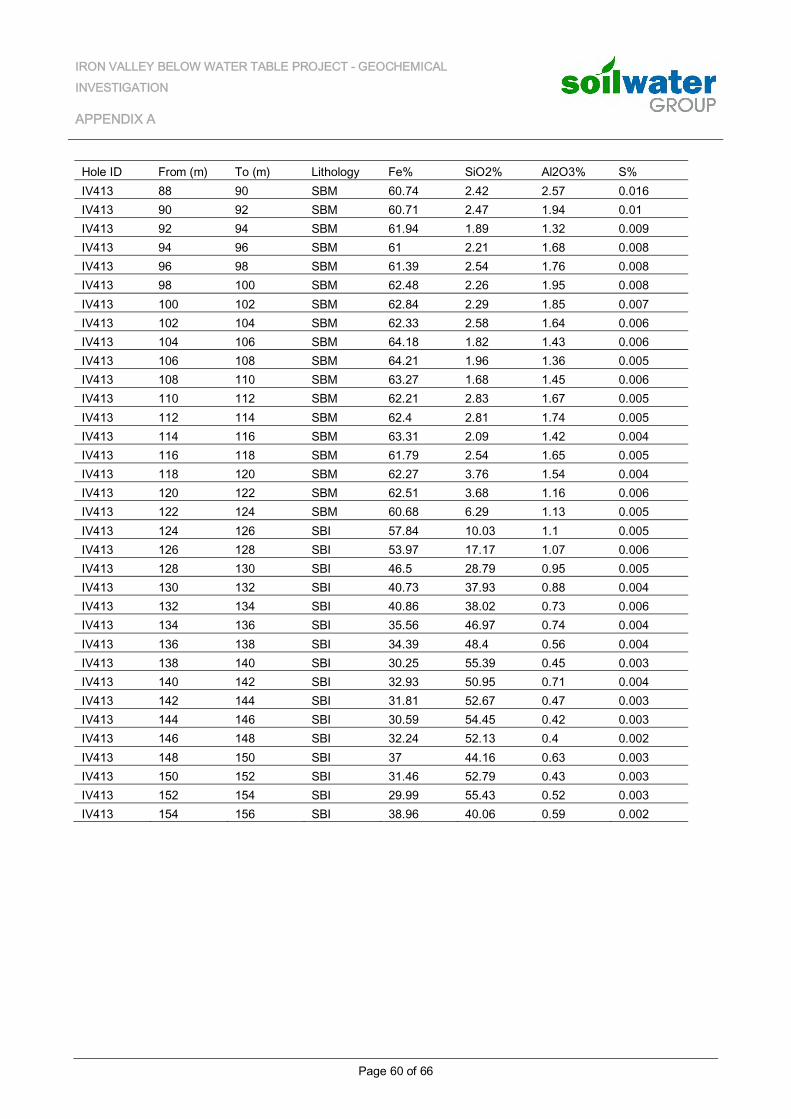
IRON VALLEY BELOW WATER TABLE PROJECT - GEOCHEMICAL INVESTIGATION
APPENDIX A
Page 60 of 66
Hole ID From (m) To (m) Lithology Fe% SiO2% Al2O3% S% IV413 88 90 SBM 60.74 2.42 2.57 0.016 IV413 90 92 SBM 60.71 2.47 1.94 0.01 IV413 92 94 SBM 61.94 1.89 1.32 0.009 IV413 94 96 SBM 61 2.21 1.68 0.008 IV413 96 98 SBM 61.39 2.54 1.76 0.008 IV413 98 100 SBM 62.48 2.26 1.95 0.008 IV413 100 102 SBM 62.84 2.29 1.85 0.007 IV413 102 104 SBM 62.33 2.58 1.64 0.006 IV413 104 106 SBM 64.18 1.82 1.43 0.006 IV413 106 108 SBM 64.21 1.96 1.36 0.005 IV413 108 110 SBM 63.27 1.68 1.45 0.006 IV413 110 112 SBM 62.21 2.83 1.67 0.005 IV413 112 114 SBM 62.4 2.81 1.74 0.005 IV413 114 116 SBM 63.31 2.09 1.42 0.004 IV413 116 118 SBM 61.79 2.54 1.65 0.005 IV413 118 120 SBM 62.27 3.76 1.54 0.004 IV413 120 122 SBM 62.51 3.68 1.16 0.006 IV413 122 124 SBM 60.68 6.29 1.13 0.005 IV413 124 126 SBI 57.84 10.03 1.1 0.005 IV413 126 128 SBI 53.97 17.17 1.07 0.006 IV413 128 130 SBI 46.5 28.79 0.95 0.005 IV413 130 132 SBI 40.73 37.93 0.88 0.004 IV413 132 134 SBI 40.86 38.02 0.73 0.006 IV413 134 136 SBI 35.56 46.97 0.74 0.004 IV413 136 138 SBI 34.39 48.4 0.56 0.004 IV413 138 140 SBI 30.25 55.39 0.45 0.003 IV413 140 142 SBI 32.93 50.95 0.71 0.004 IV413 142 144 SBI 31.81 52.67 0.47 0.003 IV413 144 146 SBI 30.59 54.45 0.42 0.003 IV413 146 148 SBI 32.24 52.13 0.4 0.002 IV413 148 150 SBI 37 44.16 0.63 0.003 IV413 150 152 SBI 31.46 52.79 0.43 0.003 IV413 152 154 SBI 29.99 55.43 0.52 0.003 IV413 154 156 SBI 38.96 40.06 0.59 0.002
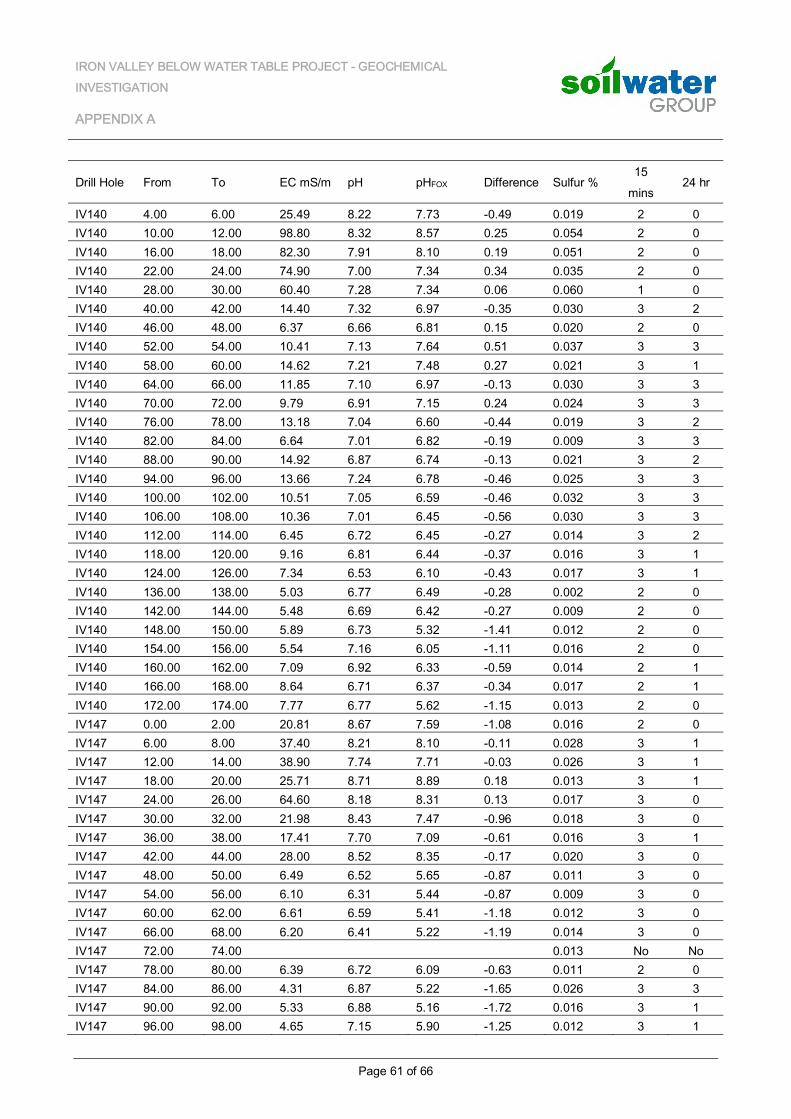
IRON VALLEY BELOW WATER TABLE PROJECT - GEOCHEMICAL INVESTIGATION
APPENDIX A
Page 61 of 66
Drill Hole From To EC mS/m pH pHFOX Difference Sulfur % 15
mins 24 hr
IV140 4.00 6.00 25.49 8.22 7.73 -0.49 0.019 2 0 IV140 10.00 12.00 98.80 8.32 8.57 0.25 0.054 2 0 IV140 16.00 18.00 82.30 7.91 8.10 0.19 0.051 2 0 IV140 22.00 24.00 74.90 7.00 7.34 0.34 0.035 2 0 IV140 28.00 30.00 60.40 7.28 7.34 0.06 0.060 1 0 IV140 40.00 42.00 14.40 7.32 6.97 -0.35 0.030 3 2 IV140 46.00 48.00 6.37 6.66 6.81 0.15 0.020 2 0 IV140 52.00 54.00 10.41 7.13 7.64 0.51 0.037 3 3 IV140 58.00 60.00 14.62 7.21 7.48 0.27 0.021 3 1 IV140 64.00 66.00 11.85 7.10 6.97 -0.13 0.030 3 3 IV140 70.00 72.00 9.79 6.91 7.15 0.24 0.024 3 3 IV140 76.00 78.00 13.18 7.04 6.60 -0.44 0.019 3 2 IV140 82.00 84.00 6.64 7.01 6.82 -0.19 0.009 3 3 IV140 88.00 90.00 14.92 6.87 6.74 -0.13 0.021 3 2 IV140 94.00 96.00 13.66 7.24 6.78 -0.46 0.025 3 3 IV140 100.00 102.00 10.51 7.05 6.59 -0.46 0.032 3 3 IV140 106.00 108.00 10.36 7.01 6.45 -0.56 0.030 3 3 IV140 112.00 114.00 6.45 6.72 6.45 -0.27 0.014 3 2 IV140 118.00 120.00 9.16 6.81 6.44 -0.37 0.016 3 1 IV140 124.00 126.00 7.34 6.53 6.10 -0.43 0.017 3 1 IV140 136.00 138.00 5.03 6.77 6.49 -0.28 0.002 2 0 IV140 142.00 144.00 5.48 6.69 6.42 -0.27 0.009 2 0 IV140 148.00 150.00 5.89 6.73 5.32 -1.41 0.012 2 0 IV140 154.00 156.00 5.54 7.16 6.05 -1.11 0.016 2 0 IV140 160.00 162.00 7.09 6.92 6.33 -0.59 0.014 2 1 IV140 166.00 168.00 8.64 6.71 6.37 -0.34 0.017 2 1 IV140 172.00 174.00 7.77 6.77 5.62 -1.15 0.013 2 0 IV147 0.00 2.00 20.81 8.67 7.59 -1.08 0.016 2 0 IV147 6.00 8.00 37.40 8.21 8.10 -0.11 0.028 3 1 IV147 12.00 14.00 38.90 7.74 7.71 -0.03 0.026 3 1 IV147 18.00 20.00 25.71 8.71 8.89 0.18 0.013 3 1 IV147 24.00 26.00 64.60 8.18 8.31 0.13 0.017 3 0 IV147 30.00 32.00 21.98 8.43 7.47 -0.96 0.018 3 0 IV147 36.00 38.00 17.41 7.70 7.09 -0.61 0.016 3 1 IV147 42.00 44.00 28.00 8.52 8.35 -0.17 0.020 3 0 IV147 48.00 50.00 6.49 6.52 5.65 -0.87 0.011 3 0 IV147 54.00 56.00 6.10 6.31 5.44 -0.87 0.009 3 0 IV147 60.00 62.00 6.61 6.59 5.41 -1.18 0.012 3 0 IV147 66.00 68.00 6.20 6.41 5.22 -1.19 0.014 3 0 IV147 72.00 74.00 0.013 No No IV147 78.00 80.00 6.39 6.72 6.09 -0.63 0.011 2 0 IV147 84.00 86.00 4.31 6.87 5.22 -1.65 0.026 3 3 IV147 90.00 92.00 5.33 6.88 5.16 -1.72 0.016 3 1 IV147 96.00 98.00 4.65 7.15 5.90 -1.25 0.012 3 1
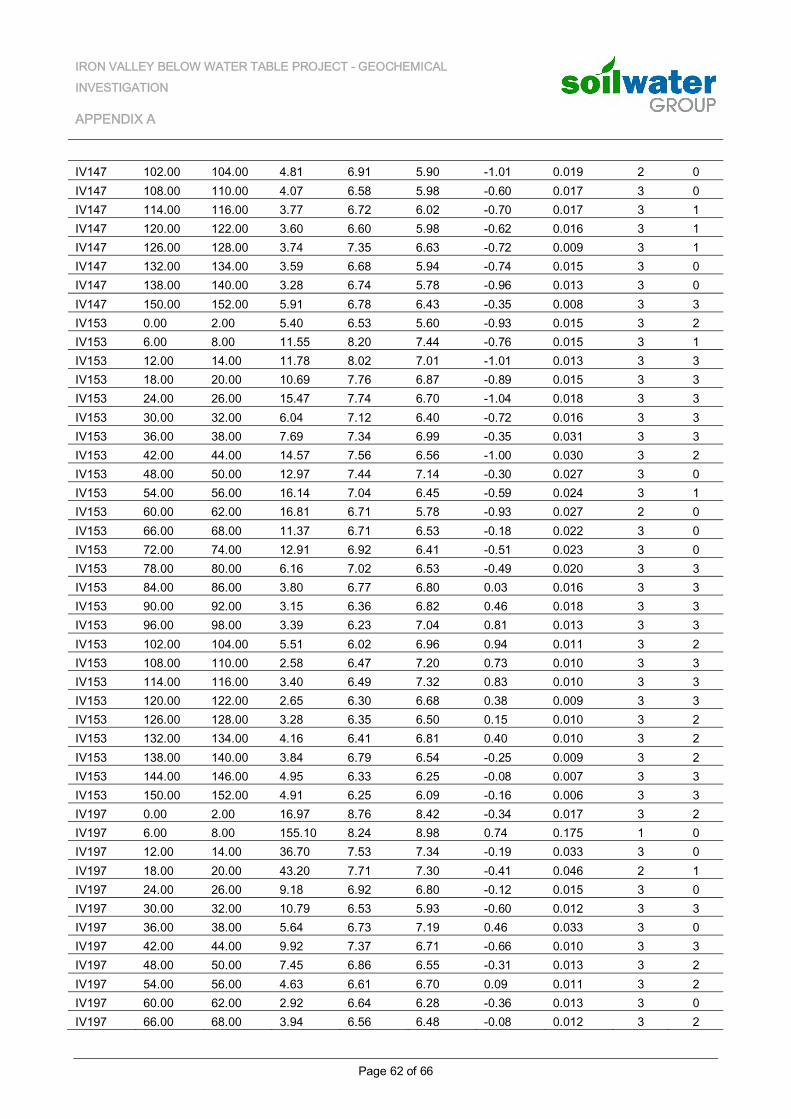
IRON VALLEY BELOW WATER TABLE PROJECT - GEOCHEMICAL INVESTIGATION
APPENDIX A
Page 62 of 66
IV147 102.00 104.00 4.81 6.91 5.90 -1.01 0.019 2 0 IV147 108.00 110.00 4.07 6.58 5.98 -0.60 0.017 3 0 IV147 114.00 116.00 3.77 6.72 6.02 -0.70 0.017 3 1 IV147 120.00 122.00 3.60 6.60 5.98 -0.62 0.016 3 1 IV147 126.00 128.00 3.74 7.35 6.63 -0.72 0.009 3 1 IV147 132.00 134.00 3.59 6.68 5.94 -0.74 0.015 3 0 IV147 138.00 140.00 3.28 6.74 5.78 -0.96 0.013 3 0 IV147 150.00 152.00 5.91 6.78 6.43 -0.35 0.008 3 3 IV153 0.00 2.00 5.40 6.53 5.60 -0.93 0.015 3 2 IV153 6.00 8.00 11.55 8.20 7.44 -0.76 0.015 3 1 IV153 12.00 14.00 11.78 8.02 7.01 -1.01 0.013 3 3 IV153 18.00 20.00 10.69 7.76 6.87 -0.89 0.015 3 3 IV153 24.00 26.00 15.47 7.74 6.70 -1.04 0.018 3 3 IV153 30.00 32.00 6.04 7.12 6.40 -0.72 0.016 3 3 IV153 36.00 38.00 7.69 7.34 6.99 -0.35 0.031 3 3 IV153 42.00 44.00 14.57 7.56 6.56 -1.00 0.030 3 2 IV153 48.00 50.00 12.97 7.44 7.14 -0.30 0.027 3 0 IV153 54.00 56.00 16.14 7.04 6.45 -0.59 0.024 3 1 IV153 60.00 62.00 16.81 6.71 5.78 -0.93 0.027 2 0 IV153 66.00 68.00 11.37 6.71 6.53 -0.18 0.022 3 0 IV153 72.00 74.00 12.91 6.92 6.41 -0.51 0.023 3 0 IV153 78.00 80.00 6.16 7.02 6.53 -0.49 0.020 3 3 IV153 84.00 86.00 3.80 6.77 6.80 0.03 0.016 3 3 IV153 90.00 92.00 3.15 6.36 6.82 0.46 0.018 3 3 IV153 96.00 98.00 3.39 6.23 7.04 0.81 0.013 3 3 IV153 102.00 104.00 5.51 6.02 6.96 0.94 0.011 3 2 IV153 108.00 110.00 2.58 6.47 7.20 0.73 0.010 3 3 IV153 114.00 116.00 3.40 6.49 7.32 0.83 0.010 3 3 IV153 120.00 122.00 2.65 6.30 6.68 0.38 0.009 3 3 IV153 126.00 128.00 3.28 6.35 6.50 0.15 0.010 3 2 IV153 132.00 134.00 4.16 6.41 6.81 0.40 0.010 3 2 IV153 138.00 140.00 3.84 6.79 6.54 -0.25 0.009 3 2 IV153 144.00 146.00 4.95 6.33 6.25 -0.08 0.007 3 3 IV153 150.00 152.00 4.91 6.25 6.09 -0.16 0.006 3 3 IV197 0.00 2.00 16.97 8.76 8.42 -0.34 0.017 3 2 IV197 6.00 8.00 155.10 8.24 8.98 0.74 0.175 1 0 IV197 12.00 14.00 36.70 7.53 7.34 -0.19 0.033 3 0 IV197 18.00 20.00 43.20 7.71 7.30 -0.41 0.046 2 1 IV197 24.00 26.00 9.18 6.92 6.80 -0.12 0.015 3 0 IV197 30.00 32.00 10.79 6.53 5.93 -0.60 0.012 3 3 IV197 36.00 38.00 5.64 6.73 7.19 0.46 0.033 3 0 IV197 42.00 44.00 9.92 7.37 6.71 -0.66 0.010 3 3 IV197 48.00 50.00 7.45 6.86 6.55 -0.31 0.013 3 2 IV197 54.00 56.00 4.63 6.61 6.70 0.09 0.011 3 2 IV197 60.00 62.00 2.92 6.64 6.28 -0.36 0.013 3 0 IV197 66.00 68.00 3.94 6.56 6.48 -0.08 0.012 3 2
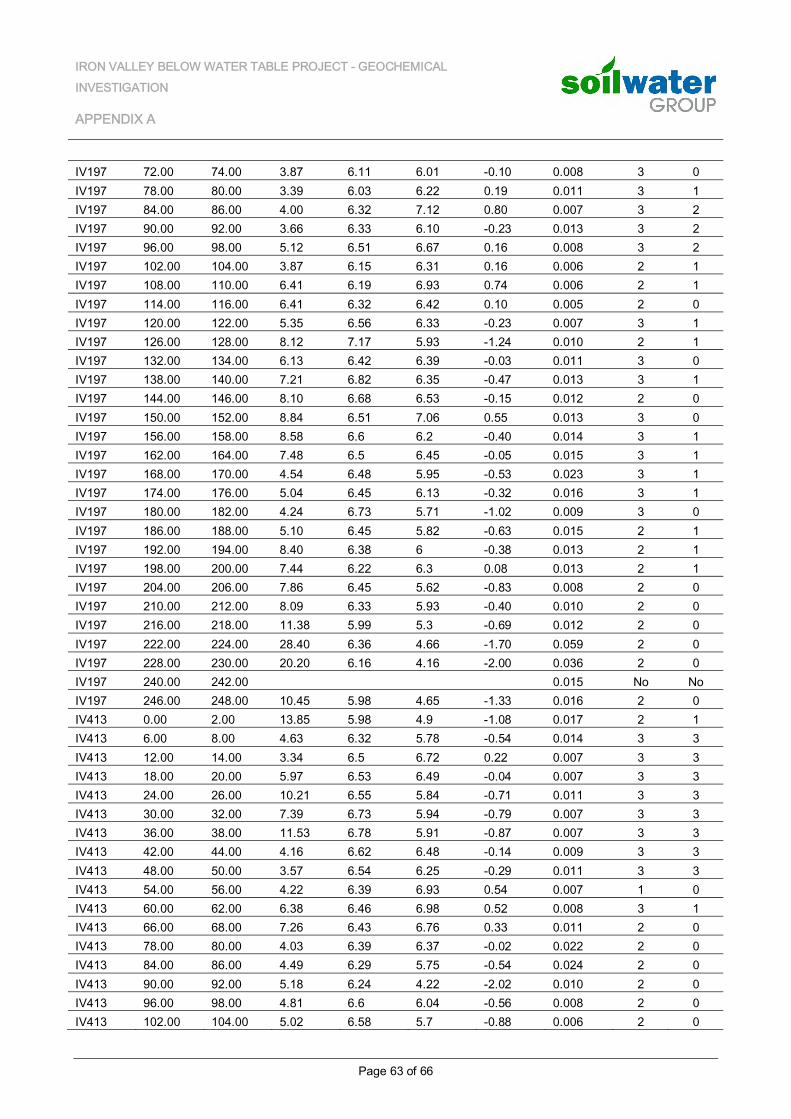
IRON VALLEY BELOW WATER TABLE PROJECT - GEOCHEMICAL INVESTIGATION
APPENDIX A
Page 63 of 66
IV197 72.00 74.00 3.87 6.11 6.01 -0.10 0.008 3 0 IV197 78.00 80.00 3.39 6.03 6.22 0.19 0.011 3 1 IV197 84.00 86.00 4.00 6.32 7.12 0.80 0.007 3 2 IV197 90.00 92.00 3.66 6.33 6.10 -0.23 0.013 3 2 IV197 96.00 98.00 5.12 6.51 6.67 0.16 0.008 3 2 IV197 102.00 104.00 3.87 6.15 6.31 0.16 0.006 2 1 IV197 108.00 110.00 6.41 6.19 6.93 0.74 0.006 2 1 IV197 114.00 116.00 6.41 6.32 6.42 0.10 0.005 2 0 IV197 120.00 122.00 5.35 6.56 6.33 -0.23 0.007 3 1 IV197 126.00 128.00 8.12 7.17 5.93 -1.24 0.010 2 1 IV197 132.00 134.00 6.13 6.42 6.39 -0.03 0.011 3 0 IV197 138.00 140.00 7.21 6.82 6.35 -0.47 0.013 3 1 IV197 144.00 146.00 8.10 6.68 6.53 -0.15 0.012 2 0 IV197 150.00 152.00 8.84 6.51 7.06 0.55 0.013 3 0 IV197 156.00 158.00 8.58 6.6 6.2 -0.40 0.014 3 1 IV197 162.00 164.00 7.48 6.5 6.45 -0.05 0.015 3 1 IV197 168.00 170.00 4.54 6.48 5.95 -0.53 0.023 3 1 IV197 174.00 176.00 5.04 6.45 6.13 -0.32 0.016 3 1 IV197 180.00 182.00 4.24 6.73 5.71 -1.02 0.009 3 0 IV197 186.00 188.00 5.10 6.45 5.82 -0.63 0.015 2 1 IV197 192.00 194.00 8.40 6.38 6 -0.38 0.013 2 1 IV197 198.00 200.00 7.44 6.22 6.3 0.08 0.013 2 1 IV197 204.00 206.00 7.86 6.45 5.62 -0.83 0.008 2 0 IV197 210.00 212.00 8.09 6.33 5.93 -0.40 0.010 2 0 IV197 216.00 218.00 11.38 5.99 5.3 -0.69 0.012 2 0 IV197 222.00 224.00 28.40 6.36 4.66 -1.70 0.059 2 0 IV197 228.00 230.00 20.20 6.16 4.16 -2.00 0.036 2 0 IV197 240.00 242.00 0.015 No No IV197 246.00 248.00 10.45 5.98 4.65 -1.33 0.016 2 0 IV413 0.00 2.00 13.85 5.98 4.9 -1.08 0.017 2 1 IV413 6.00 8.00 4.63 6.32 5.78 -0.54 0.014 3 3 IV413 12.00 14.00 3.34 6.5 6.72 0.22 0.007 3 3 IV413 18.00 20.00 5.97 6.53 6.49 -0.04 0.007 3 3 IV413 24.00 26.00 10.21 6.55 5.84 -0.71 0.011 3 3 IV413 30.00 32.00 7.39 6.73 5.94 -0.79 0.007 3 3 IV413 36.00 38.00 11.53 6.78 5.91 -0.87 0.007 3 3 IV413 42.00 44.00 4.16 6.62 6.48 -0.14 0.009 3 3 IV413 48.00 50.00 3.57 6.54 6.25 -0.29 0.011 3 3 IV413 54.00 56.00 4.22 6.39 6.93 0.54 0.007 1 0 IV413 60.00 62.00 6.38 6.46 6.98 0.52 0.008 3 1 IV413 66.00 68.00 7.26 6.43 6.76 0.33 0.011 2 0 IV413 78.00 80.00 4.03 6.39 6.37 -0.02 0.022 2 0 IV413 84.00 86.00 4.49 6.29 5.75 -0.54 0.024 2 0 IV413 90.00 92.00 5.18 6.24 4.22 -2.02 0.010 2 0 IV413 96.00 98.00 4.81 6.6 6.04 -0.56 0.008 2 0 IV413 102.00 104.00 5.02 6.58 5.7 -0.88 0.006 2 0
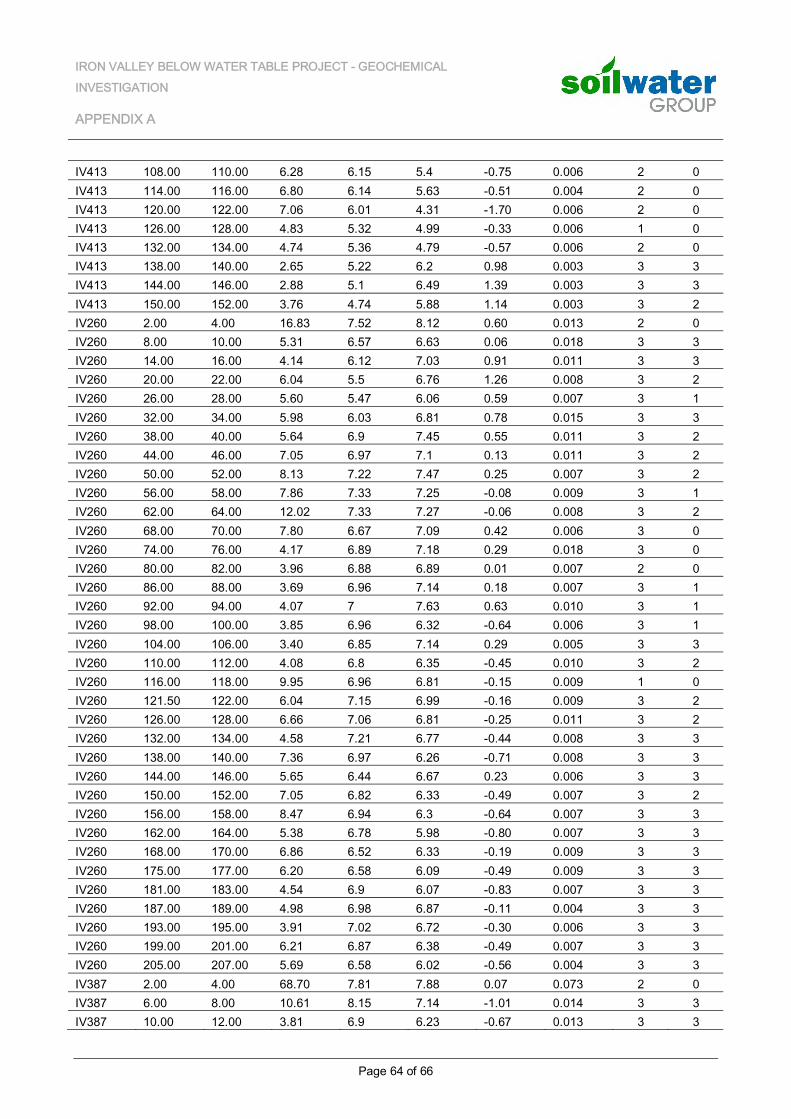
IRON VALLEY BELOW WATER TABLE PROJECT - GEOCHEMICAL INVESTIGATION
APPENDIX A
Page 64 of 66
IV413 108.00 110.00 6.28 6.15 5.4 -0.75 0.006 2 0 IV413 114.00 116.00 6.80 6.14 5.63 -0.51 0.004 2 0 IV413 120.00 122.00 7.06 6.01 4.31 -1.70 0.006 2 0 IV413 126.00 128.00 4.83 5.32 4.99 -0.33 0.006 1 0 IV413 132.00 134.00 4.74 5.36 4.79 -0.57 0.006 2 0 IV413 138.00 140.00 2.65 5.22 6.2 0.98 0.003 3 3 IV413 144.00 146.00 2.88 5.1 6.49 1.39 0.003 3 3 IV413 150.00 152.00 3.76 4.74 5.88 1.14 0.003 3 2 IV260 2.00 4.00 16.83 7.52 8.12 0.60 0.013 2 0 IV260 8.00 10.00 5.31 6.57 6.63 0.06 0.018 3 3 IV260 14.00 16.00 4.14 6.12 7.03 0.91 0.011 3 3 IV260 20.00 22.00 6.04 5.5 6.76 1.26 0.008 3 2 IV260 26.00 28.00 5.60 5.47 6.06 0.59 0.007 3 1 IV260 32.00 34.00 5.98 6.03 6.81 0.78 0.015 3 3 IV260 38.00 40.00 5.64 6.9 7.45 0.55 0.011 3 2 IV260 44.00 46.00 7.05 6.97 7.1 0.13 0.011 3 2 IV260 50.00 52.00 8.13 7.22 7.47 0.25 0.007 3 2 IV260 56.00 58.00 7.86 7.33 7.25 -0.08 0.009 3 1 IV260 62.00 64.00 12.02 7.33 7.27 -0.06 0.008 3 2 IV260 68.00 70.00 7.80 6.67 7.09 0.42 0.006 3 0 IV260 74.00 76.00 4.17 6.89 7.18 0.29 0.018 3 0 IV260 80.00 82.00 3.96 6.88 6.89 0.01 0.007 2 0 IV260 86.00 88.00 3.69 6.96 7.14 0.18 0.007 3 1 IV260 92.00 94.00 4.07 7 7.63 0.63 0.010 3 1 IV260 98.00 100.00 3.85 6.96 6.32 -0.64 0.006 3 1 IV260 104.00 106.00 3.40 6.85 7.14 0.29 0.005 3 3 IV260 110.00 112.00 4.08 6.8 6.35 -0.45 0.010 3 2 IV260 116.00 118.00 9.95 6.96 6.81 -0.15 0.009 1 0 IV260 121.50 122.00 6.04 7.15 6.99 -0.16 0.009 3 2 IV260 126.00 128.00 6.66 7.06 6.81 -0.25 0.011 3 2 IV260 132.00 134.00 4.58 7.21 6.77 -0.44 0.008 3 3 IV260 138.00 140.00 7.36 6.97 6.26 -0.71 0.008 3 3 IV260 144.00 146.00 5.65 6.44 6.67 0.23 0.006 3 3 IV260 150.00 152.00 7.05 6.82 6.33 -0.49 0.007 3 2 IV260 156.00 158.00 8.47 6.94 6.3 -0.64 0.007 3 3 IV260 162.00 164.00 5.38 6.78 5.98 -0.80 0.007 3 3 IV260 168.00 170.00 6.86 6.52 6.33 -0.19 0.009 3 3 IV260 175.00 177.00 6.20 6.58 6.09 -0.49 0.009 3 3 IV260 181.00 183.00 4.54 6.9 6.07 -0.83 0.007 3 3 IV260 187.00 189.00 4.98 6.98 6.87 -0.11 0.004 3 3 IV260 193.00 195.00 3.91 7.02 6.72 -0.30 0.006 3 3 IV260 199.00 201.00 6.21 6.87 6.38 -0.49 0.007 3 3 IV260 205.00 207.00 5.69 6.58 6.02 -0.56 0.004 3 3 IV387 2.00 4.00 68.70 7.81 7.88 0.07 0.073 2 0 IV387 6.00 8.00 10.61 8.15 7.14 -1.01 0.014 3 3 IV387 10.00 12.00 3.81 6.9 6.23 -0.67 0.013 3 3
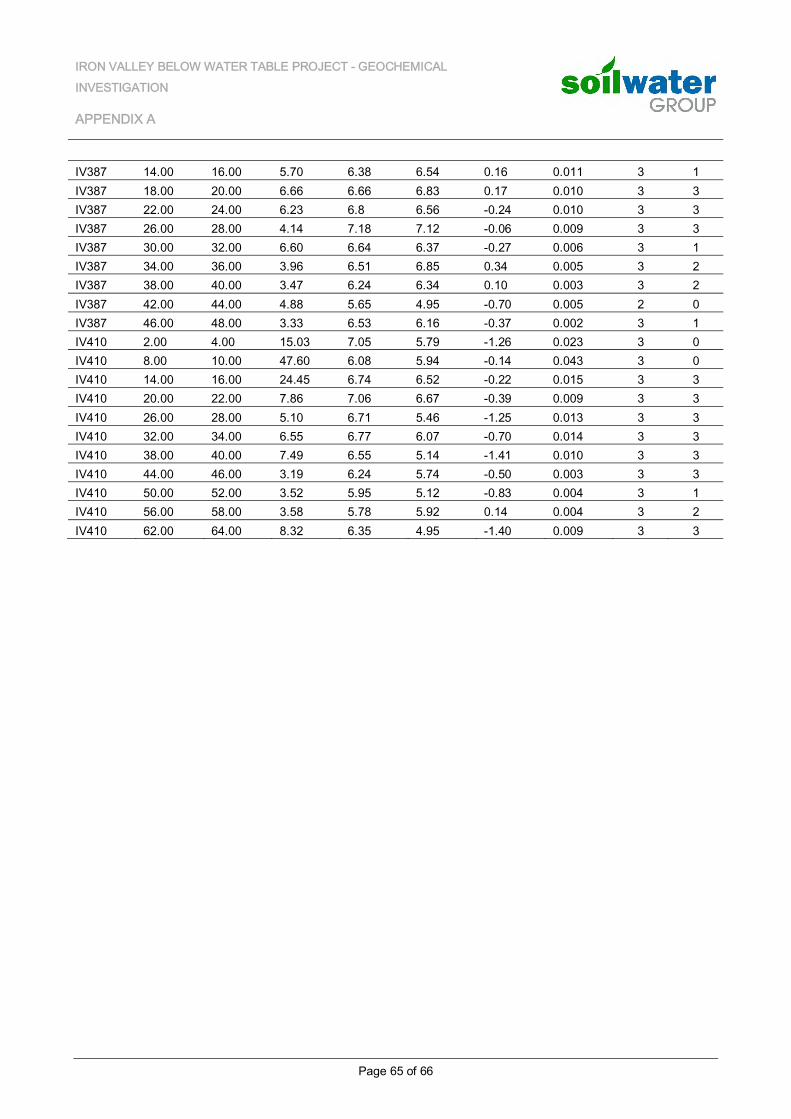
IRON VALLEY BELOW WATER TABLE PROJECT - GEOCHEMICAL INVESTIGATION
APPENDIX A
Page 65 of 66
IV387 14.00 16.00 5.70 6.38 6.54 0.16 0.011 3 1 IV387 18.00 20.00 6.66 6.66 6.83 0.17 0.010 3 3 IV387 22.00 24.00 6.23 6.8 6.56 -0.24 0.010 3 3 IV387 26.00 28.00 4.14 7.18 7.12 -0.06 0.009 3 3 IV387 30.00 32.00 6.60 6.64 6.37 -0.27 0.006 3 1 IV387 34.00 36.00 3.96 6.51 6.85 0.34 0.005 3 2 IV387 38.00 40.00 3.47 6.24 6.34 0.10 0.003 3 2 IV387 42.00 44.00 4.88 5.65 4.95 -0.70 0.005 2 0 IV387 46.00 48.00 3.33 6.53 6.16 -0.37 0.002 3 1 IV410 2.00 4.00 15.03 7.05 5.79 -1.26 0.023 3 0 IV410 8.00 10.00 47.60 6.08 5.94 -0.14 0.043 3 0 IV410 14.00 16.00 24.45 6.74 6.52 -0.22 0.015 3 3 IV410 20.00 22.00 7.86 7.06 6.67 -0.39 0.009 3 3 IV410 26.00 28.00 5.10 6.71 5.46 -1.25 0.013 3 3 IV410 32.00 34.00 6.55 6.77 6.07 -0.70 0.014 3 3 IV410 38.00 40.00 7.49 6.55 5.14 -1.41 0.010 3 3 IV410 44.00 46.00 3.19 6.24 5.74 -0.50 0.003 3 3 IV410 50.00 52.00 3.52 5.95 5.12 -0.83 0.004 3 1 IV410 56.00 58.00 3.58 5.78 5.92 0.14 0.004 3 2 IV410 62.00 64.00 8.32 6.35 4.95 -1.40 0.009 3 3
IRON VALLEY BELOW WATER TABLE PROJECT - GEOCHEMICAL INVESTIGATION
APPENDIX B
Page 66 of 66
APPENDIX B LABORATORY CERTIFICATES
ChemCentreInorganic Chemistry Section
Report of Examination
None
Soil Water Resources Pty Ltd
45 Gladstone St
East Perth WA 6004
Attention: Sam Collins
ABN 40 991 885 705
F +61 8 9422 9801
T +61 8 9422 9800
Bentley WA 6983
www.chemcentre.wa.gov.au
PO Box 1250, Bentley Delivery CentrePurchase Order:
ChemCentre Reference:
Final Report on 20 samples of received on 26/05/2015
Your Reference:
14A0381 R2
LAB ID Client ID and Description
14A0381 / 001 15-0438-002
14A0381 / 002 15-0438-008
14A0381 / 003 15-0438-027
14A0381 / 004 15-0438-035
14A0381 / 005 15-0438-054
14A0381 / 006 15-0438-058
14A0381 / 007 15-0438-070
14A0381 / 008 15-0438-078
14A0381 / 009 15-0438-082
14A0381 / 010 15-0438-116
14A0381 / 011 15-0438-124
14A0381 / 012 15-0438-142
14A0381 / 013 15-0438-155
14A0381 / 014 15-0438-158
14A0381 / 015 15-0438-167
14A0381 / 016 15-0438-168
14A0381 / 017 15-0438-174
14A0381 / 018 15-0438-188
14A0381 / 019 15-0438-191
14A0381 / 020 15-0438-202
Page 1 of 514A0381
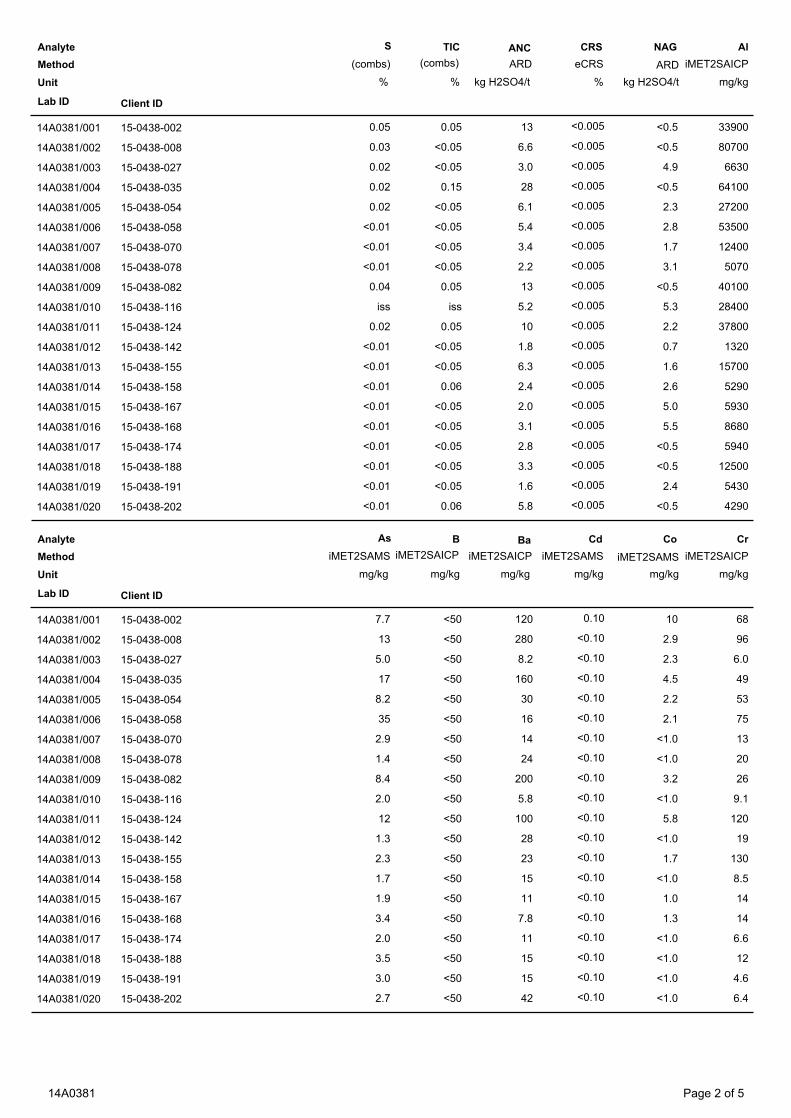
Analyte
Method
Unit
Lab ID Client ID
S TIC ANC CRS NAG Al
(combs) (combs) ARD eCRS ARD iMET2SAICP
% % kg H2SO4/t % kg H2SO4/t mg/kg
14A0381/001 15-0438-002 0.05 0.05 13 <0.005 <0.5 33900
14A0381/002 15-0438-008 0.03 <0.05 6.6 <0.005 <0.5 80700
14A0381/003 15-0438-027 0.02 <0.05 3.0 <0.005 4.9 6630
14A0381/004 15-0438-035 0.02 0.15 28 <0.005 <0.5 64100
14A0381/005 15-0438-054 0.02 <0.05 6.1 <0.005 2.3 27200
14A0381/006 15-0438-058 <0.01 <0.05 5.4 <0.005 2.8 53500
14A0381/007 15-0438-070 <0.01 <0.05 3.4 <0.005 1.7 12400
14A0381/008 15-0438-078 <0.01 <0.05 2.2 <0.005 3.1 5070
14A0381/009 15-0438-082 0.04 0.05 13 <0.005 <0.5 40100
14A0381/010 15-0438-116 iss iss 5.2 <0.005 5.3 28400
14A0381/011 15-0438-124 0.02 0.05 10 <0.005 2.2 37800
14A0381/012 15-0438-142 <0.01 <0.05 1.8 <0.005 0.7 1320
14A0381/013 15-0438-155 <0.01 <0.05 6.3 <0.005 1.6 15700
14A0381/014 15-0438-158 <0.01 0.06 2.4 <0.005 2.6 5290
14A0381/015 15-0438-167 <0.01 <0.05 2.0 <0.005 5.0 5930
14A0381/016 15-0438-168 <0.01 <0.05 3.1 <0.005 5.5 8680
14A0381/017 15-0438-174 <0.01 <0.05 2.8 <0.005 <0.5 5940
14A0381/018 15-0438-188 <0.01 <0.05 3.3 <0.005 <0.5 12500
14A0381/019 15-0438-191 <0.01 <0.05 1.6 <0.005 2.4 5430
14A0381/020 15-0438-202 <0.01 0.06 5.8 <0.005 <0.5 4290
Analyte
Method
Unit
Lab ID Client ID
As B Ba Cd Co Cr
iMET2SAMS iMET2SAICP iMET2SAICP iMET2SAMS iMET2SAMS iMET2SAICP
mg/kg mg/kg mg/kg mg/kg mg/kg mg/kg
14A0381/001 15-0438-002 7.7 <50 120 0.10 10 68
14A0381/002 15-0438-008 13 <50 280 <0.10 2.9 96
14A0381/003 15-0438-027 5.0 <50 8.2 <0.10 2.3 6.0
14A0381/004 15-0438-035 17 <50 160 <0.10 4.5 49
14A0381/005 15-0438-054 8.2 <50 30 <0.10 2.2 53
14A0381/006 15-0438-058 35 <50 16 <0.10 2.1 75
14A0381/007 15-0438-070 2.9 <50 14 <0.10 <1.0 13
14A0381/008 15-0438-078 1.4 <50 24 <0.10 <1.0 20
14A0381/009 15-0438-082 8.4 <50 200 <0.10 3.2 26
14A0381/010 15-0438-116 2.0 <50 5.8 <0.10 <1.0 9.1
14A0381/011 15-0438-124 12 <50 100 <0.10 5.8 120
14A0381/012 15-0438-142 1.3 <50 28 <0.10 <1.0 19
14A0381/013 15-0438-155 2.3 <50 23 <0.10 1.7 130
14A0381/014 15-0438-158 1.7 <50 15 <0.10 <1.0 8.5
14A0381/015 15-0438-167 1.9 <50 11 <0.10 1.0 14
14A0381/016 15-0438-168 3.4 <50 7.8 <0.10 1.3 14
14A0381/017 15-0438-174 2.0 <50 11 <0.10 <1.0 6.6
14A0381/018 15-0438-188 3.5 <50 15 <0.10 <1.0 12
14A0381/019 15-0438-191 3.0 <50 15 <0.10 <1.0 4.6
14A0381/020 15-0438-202 2.7 <50 42 <0.10 <1.0 6.4
Page 2 of 514A0381
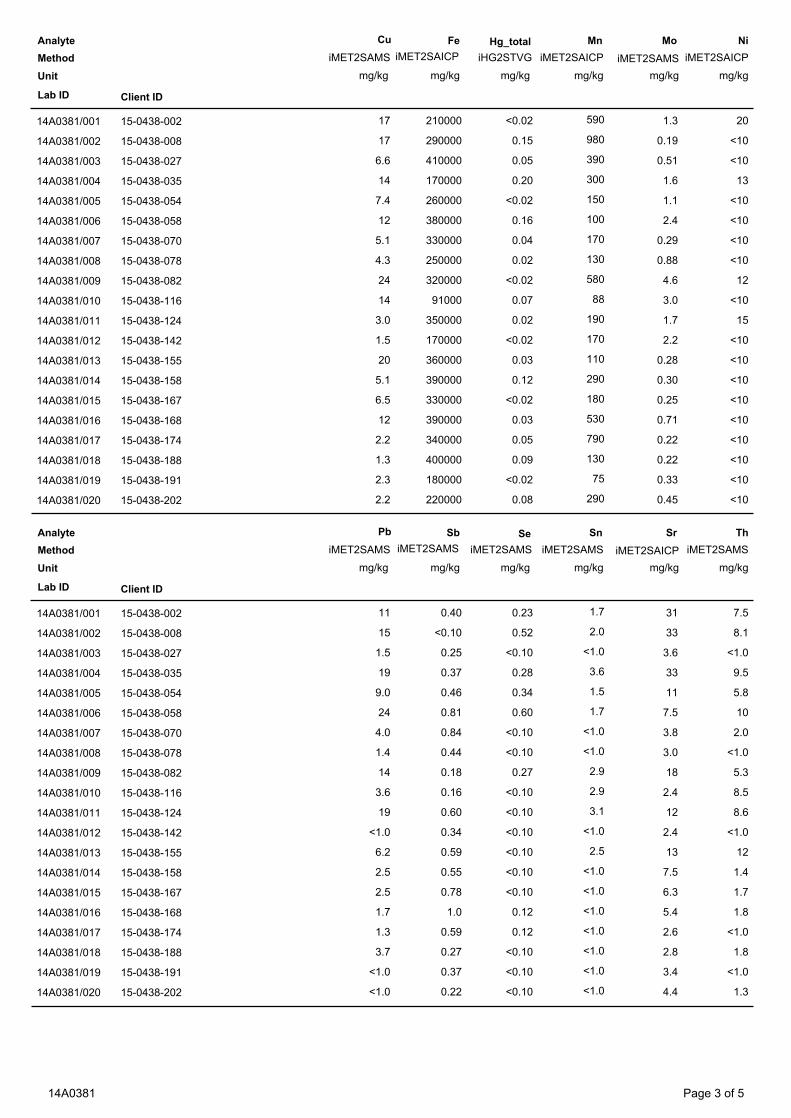
Analyte
Method
Unit
Lab ID Client ID
Cu Fe Hg_total Mn Mo Ni
iMET2SAMS iMET2SAICP iHG2STVG iMET2SAICP iMET2SAMS iMET2SAICP
mg/kg mg/kg mg/kg mg/kg mg/kg mg/kg
14A0381/001 15-0438-002 17 210000 <0.02 590 1.3 20
14A0381/002 15-0438-008 17 290000 0.15 980 0.19 <10
14A0381/003 15-0438-027 6.6 410000 0.05 390 0.51 <10
14A0381/004 15-0438-035 14 170000 0.20 300 1.6 13
14A0381/005 15-0438-054 7.4 260000 <0.02 150 1.1 <10
14A0381/006 15-0438-058 12 380000 0.16 100 2.4 <10
14A0381/007 15-0438-070 5.1 330000 0.04 170 0.29 <10
14A0381/008 15-0438-078 4.3 250000 0.02 130 0.88 <10
14A0381/009 15-0438-082 24 320000 <0.02 580 4.6 12
14A0381/010 15-0438-116 14 91000 0.07 88 3.0 <10
14A0381/011 15-0438-124 3.0 350000 0.02 190 1.7 15
14A0381/012 15-0438-142 1.5 170000 <0.02 170 2.2 <10
14A0381/013 15-0438-155 20 360000 0.03 110 0.28 <10
14A0381/014 15-0438-158 5.1 390000 0.12 290 0.30 <10
14A0381/015 15-0438-167 6.5 330000 <0.02 180 0.25 <10
14A0381/016 15-0438-168 12 390000 0.03 530 0.71 <10
14A0381/017 15-0438-174 2.2 340000 0.05 790 0.22 <10
14A0381/018 15-0438-188 1.3 400000 0.09 130 0.22 <10
14A0381/019 15-0438-191 2.3 180000 <0.02 75 0.33 <10
14A0381/020 15-0438-202 2.2 220000 0.08 290 0.45 <10
Analyte
Method
Unit
Lab ID Client ID
Pb Sb Se Sn Sr Th
iMET2SAMS iMET2SAMS iMET2SAMS iMET2SAMS iMET2SAICP iMET2SAMS
mg/kg mg/kg mg/kg mg/kg mg/kg mg/kg
14A0381/001 15-0438-002 11 0.40 0.23 1.7 31 7.5
14A0381/002 15-0438-008 15 <0.10 0.52 2.0 33 8.1
14A0381/003 15-0438-027 1.5 0.25 <0.10 <1.0 3.6 <1.0
14A0381/004 15-0438-035 19 0.37 0.28 3.6 33 9.5
14A0381/005 15-0438-054 9.0 0.46 0.34 1.5 11 5.8
14A0381/006 15-0438-058 24 0.81 0.60 1.7 7.5 10
14A0381/007 15-0438-070 4.0 0.84 <0.10 <1.0 3.8 2.0
14A0381/008 15-0438-078 1.4 0.44 <0.10 <1.0 3.0 <1.0
14A0381/009 15-0438-082 14 0.18 0.27 2.9 18 5.3
14A0381/010 15-0438-116 3.6 0.16 <0.10 2.9 2.4 8.5
14A0381/011 15-0438-124 19 0.60 <0.10 3.1 12 8.6
14A0381/012 15-0438-142 <1.0 0.34 <0.10 <1.0 2.4 <1.0
14A0381/013 15-0438-155 6.2 0.59 <0.10 2.5 13 12
14A0381/014 15-0438-158 2.5 0.55 <0.10 <1.0 7.5 1.4
14A0381/015 15-0438-167 2.5 0.78 <0.10 <1.0 6.3 1.7
14A0381/016 15-0438-168 1.7 1.0 0.12 <1.0 5.4 1.8
14A0381/017 15-0438-174 1.3 0.59 0.12 <1.0 2.6 <1.0
14A0381/018 15-0438-188 3.7 0.27 <0.10 <1.0 2.8 1.8
14A0381/019 15-0438-191 <1.0 0.37 <0.10 <1.0 3.4 <1.0
14A0381/020 15-0438-202 <1.0 0.22 <0.10 <1.0 4.4 1.3
Page 3 of 514A0381
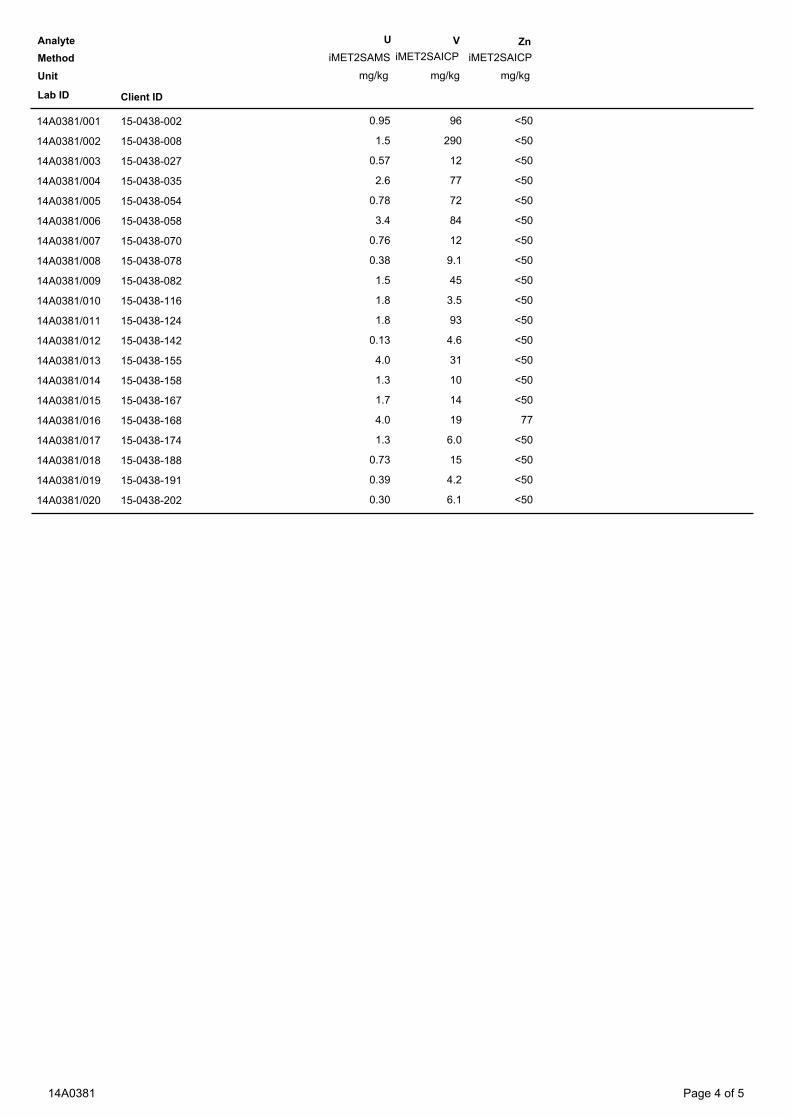
Analyte
Method
Unit
Lab ID Client ID
U V Zn
iMET2SAMS iMET2SAICP iMET2SAICP
mg/kg mg/kg mg/kg
14A0381/001 15-0438-002 0.95 96 <50
14A0381/002 15-0438-008 1.5 290 <50
14A0381/003 15-0438-027 0.57 12 <50
14A0381/004 15-0438-035 2.6 77 <50
14A0381/005 15-0438-054 0.78 72 <50
14A0381/006 15-0438-058 3.4 84 <50
14A0381/007 15-0438-070 0.76 12 <50
14A0381/008 15-0438-078 0.38 9.1 <50
14A0381/009 15-0438-082 1.5 45 <50
14A0381/010 15-0438-116 1.8 3.5 <50
14A0381/011 15-0438-124 1.8 93 <50
14A0381/012 15-0438-142 0.13 4.6 <50
14A0381/013 15-0438-155 4.0 31 <50
14A0381/014 15-0438-158 1.3 10 <50
14A0381/015 15-0438-167 1.7 14 <50
14A0381/016 15-0438-168 4.0 19 77
14A0381/017 15-0438-174 1.3 6.0 <50
14A0381/018 15-0438-188 0.73 15 <50
14A0381/019 15-0438-191 0.39 4.2 <50
14A0381/020 15-0438-202 0.30 6.1 <50
Page 4 of 514A0381
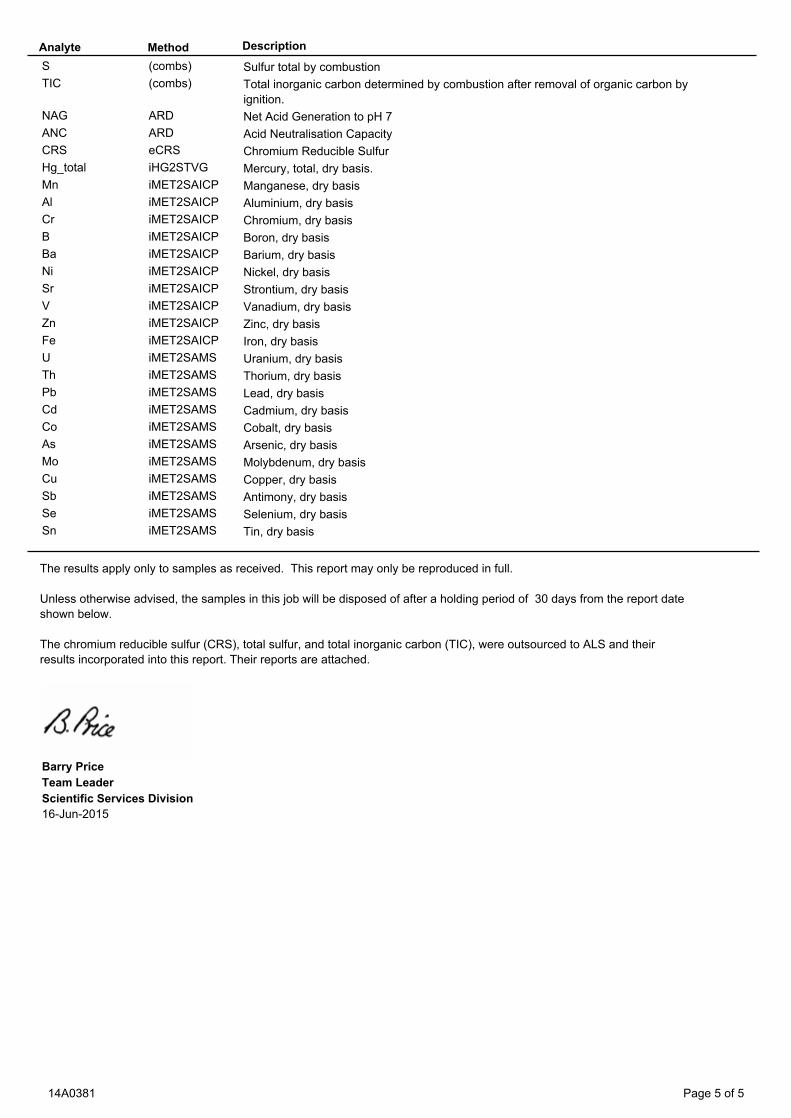
Analyte DescriptionMethod
S (combs) Sulfur total by combustion
TIC (combs) Total inorganic carbon determined by combustion after removal of organic carbon by
ignition.
NAG ARD Net Acid Generation to pH 7
ANC ARD Acid Neutralisation Capacity
CRS eCRS Chromium Reducible Sulfur
Hg_total iHG2STVG Mercury, total, dry basis.
Mn iMET2SAICP Manganese, dry basis
Al iMET2SAICP Aluminium, dry basis
Cr iMET2SAICP Chromium, dry basis
B iMET2SAICP Boron, dry basis
Ba iMET2SAICP Barium, dry basis
Ni iMET2SAICP Nickel, dry basis
Sr iMET2SAICP Strontium, dry basis
V iMET2SAICP Vanadium, dry basis
Zn iMET2SAICP Zinc, dry basis
Fe iMET2SAICP Iron, dry basis
U iMET2SAMS Uranium, dry basis
Th iMET2SAMS Thorium, dry basis
Pb iMET2SAMS Lead, dry basis
Cd iMET2SAMS Cadmium, dry basis
Co iMET2SAMS Cobalt, dry basis
As iMET2SAMS Arsenic, dry basis
Mo iMET2SAMS Molybdenum, dry basis
Cu iMET2SAMS Copper, dry basis
Sb iMET2SAMS Antimony, dry basis
Se iMET2SAMS Selenium, dry basis
Sn iMET2SAMS Tin, dry basis
The results apply only to samples as received. This report may only be reproduced in full.
Unless otherwise advised, the samples in this job will be disposed of after a holding period of 30 days from the report date
shown below.
The chromium reducible sulfur (CRS), total sulfur, and total inorganic carbon (TIC), were outsourced to ALS and their
results incorporated into this report. Their reports are attached.
Barry Price
16-Jun-2015
Scientific Services Division
Team Leader
Page 5 of 514A0381
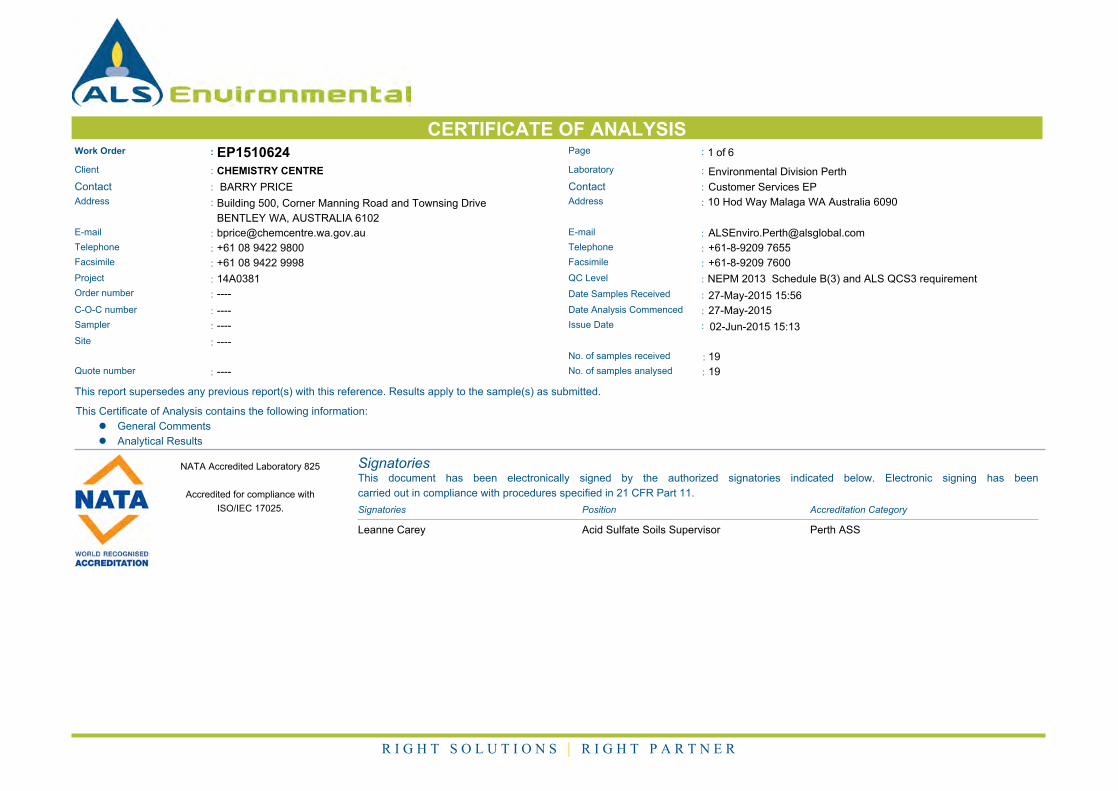
1 1.00 True
CERTIFICATE OF ANALYSISWork Order : Page : 1 of 6EP1510624
:: LaboratoryClient CHEMISTRY CENTRE Environmental Division Perth
: :ContactContact BARRY PRICE Customer Services EP
:: AddressAddress Building 500, Corner Manning Road and Townsing Drive
BENTLEY WA, AUSTRALIA 6102
10 Hod Way Malaga WA Australia 6090
:: E-mailE-mail [email protected] [email protected]
:: TelephoneTelephone +61 08 9422 9800 +61-8-9209 7655
:: FacsimileFacsimile +61 08 9422 9998 +61-8-9209 7600
:Project 14A0381 QC Level : NEPM 2013 Schedule B(3) and ALS QCS3 requirement
:Order number ---- Date Samples Received : 27-May-2015 15:56
:C-O-C number ---- Date Analysis Commenced : 27-May-2015
Sampler : ---- Issue Date : 02-Jun-2015 15:13
Site : ----
19:No. of samples received
Quote number : ---- 19:No. of samples analysed
This report supersedes any previous report(s) with this reference. Results apply to the sample(s) as submitted.
This Certificate of Analysis contains the following information:
l General Comments
l Analytical Results
SignatoriesThis document has been electronically signed by the authorized signatories indicated below. Electronic signing has been
carried out in compliance with procedures specified in 21 CFR Part 11.
Signatories Accreditation CategoryPosition
Leanne Carey Acid Sulfate Soils Supervisor Perth ASS
NATA Accredited Laboratory 825
Accredited for compliance with
ISO/IEC 17025.
R I G H T S O L U T I O N S | R I G H T P A R T N E R
2 of 6:Page
Work Order :
:Client
EP1510624
14A0381:Project
CHEMISTRY CENTRE
General Comments
The analytical procedures used by the Environmental Division have been developed from established internationally recognized procedures such as those published by the USEPA, APHA, AS and NEPM. In house
developed procedures are employed in the absence of documented standards or by client request.
Where moisture determination has been performed, results are reported on a dry weight basis.
Where a reported less than (<) result is higher than the LOR, this may be due to primary sample extract/digestate dilution and/or insufficient sample for analysis.
Where the LOR of a reported result differs from standard LOR, this may be due to high moisture content, insufficient sample (reduced weight employed) or matrix interference.
When sampling time information is not provided by the client, sampling dates are shown without a time component. In these instances, the time component has been assumed by the laboratory for processing purposes.
CAS Number = CAS registry number from database maintained by Chemical Abstracts Services. The Chemical Abstracts Service is a division of the American Chemical Society.
LOR = Limit of reporting
^ = This result is computed from individual analyte detections at or above the level of reporting
ø = ALS is not NATA accredited for these tests.
Key :
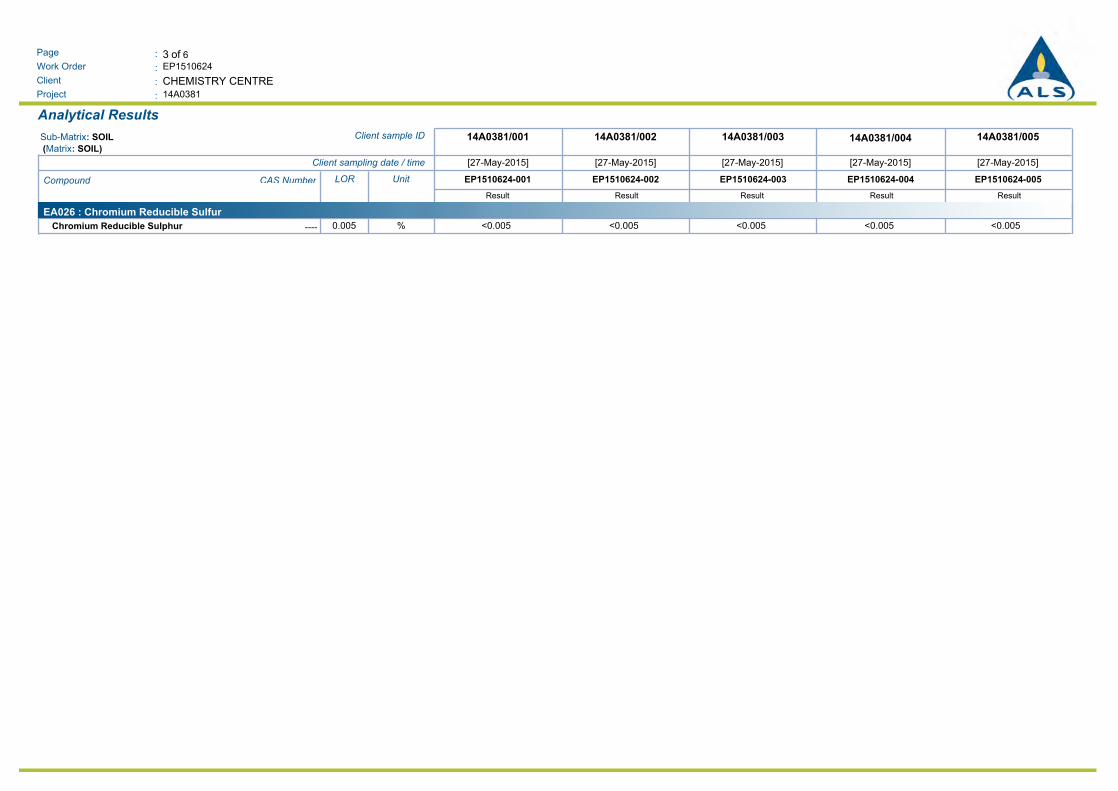
3 of 6:Page
Work Order :
:Client
EP1510624
14A0381:Project
CHEMISTRY CENTRE
Analytical Results
14A0381/00514A0381/00414A0381/00314A0381/00214A0381/001Client sample IDSub-Matrix: SOIL
(Matrix: SOIL)
[27-May-2015][27-May-2015][27-May-2015][27-May-2015][27-May-2015]Client sampling date / time
EP1510624-005EP1510624-004EP1510624-003EP1510624-002EP1510624-001UnitLORCAS NumberCompound
Result Result Result Result Result
EA026 : Chromium Reducible Sulfur
<0.005 <0.005 <0.005 <0.005 <0.005%0.005----Chromium Reducible Sulphur

4 of 6:Page
Work Order :
:Client
EP1510624
14A0381:Project
CHEMISTRY CENTRE
Analytical Results
14A0381/01114A0381/00914A0381/00814A0381/00714A0381/006Client sample IDSub-Matrix: SOIL
(Matrix: SOIL)
[27-May-2015][27-May-2015][27-May-2015][27-May-2015][27-May-2015]Client sampling date / time
EP1510624-010EP1510624-009EP1510624-008EP1510624-007EP1510624-006UnitLORCAS NumberCompound
Result Result Result Result Result
EA026 : Chromium Reducible Sulfur
<0.005 <0.005 <0.005 <0.005 <0.005%0.005----Chromium Reducible Sulphur
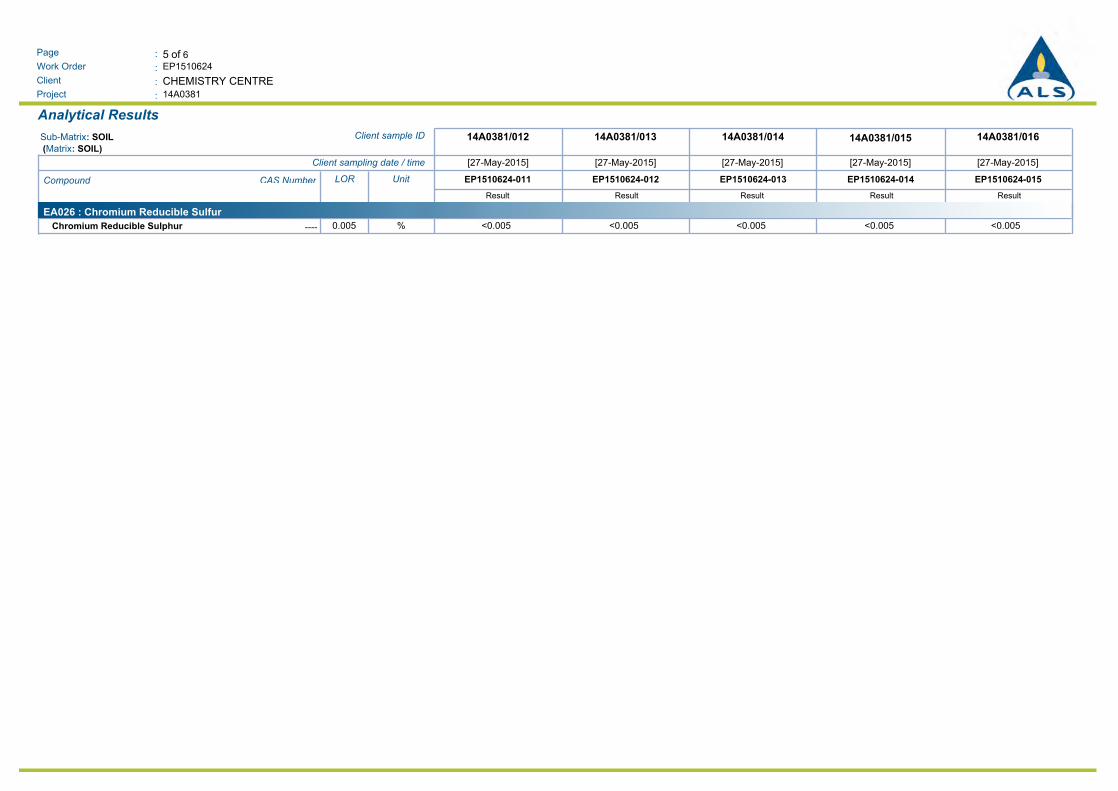
5 of 6:Page
Work Order :
:Client
EP1510624
14A0381:Project
CHEMISTRY CENTRE
Analytical Results
14A0381/01614A0381/01514A0381/01414A0381/01314A0381/012Client sample IDSub-Matrix: SOIL
(Matrix: SOIL)
[27-May-2015][27-May-2015][27-May-2015][27-May-2015][27-May-2015]Client sampling date / time
EP1510624-015EP1510624-014EP1510624-013EP1510624-012EP1510624-011UnitLORCAS NumberCompound
Result Result Result Result Result
EA026 : Chromium Reducible Sulfur
<0.005 <0.005 <0.005 <0.005 <0.005%0.005----Chromium Reducible Sulphur
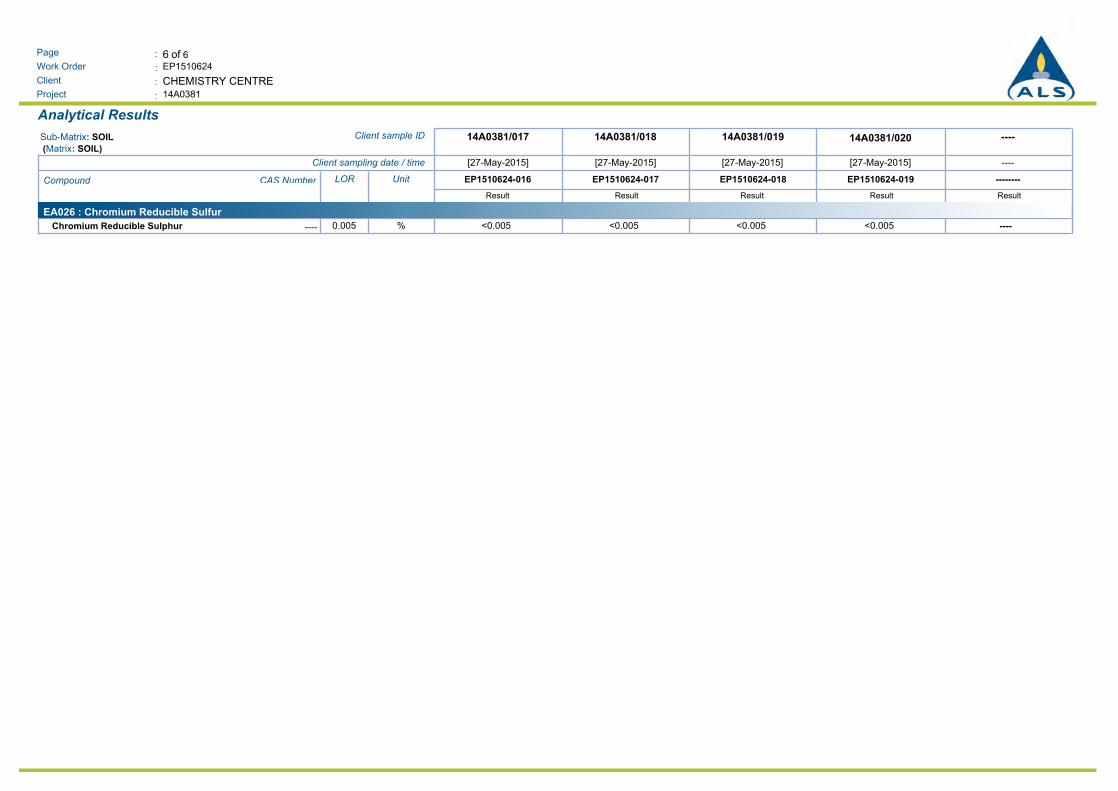
6 of 6:Page
Work Order :
:Client
EP1510624
14A0381:Project
CHEMISTRY CENTRE
Analytical Results
----14A0381/02014A0381/01914A0381/01814A0381/017Client sample IDSub-Matrix: SOIL
(Matrix: SOIL)
----[27-May-2015][27-May-2015][27-May-2015][27-May-2015]Client sampling date / time
--------EP1510624-019EP1510624-018EP1510624-017EP1510624-016UnitLORCAS NumberCompound
Result Result Result Result Result
EA026 : Chromium Reducible Sulfur
<0.005 <0.005 <0.005 <0.005 ----%0.005----Chromium Reducible Sulphur
1 1.00 True
CERTIFICATE OF ANALYSISWork Order : Page : 1 of 6EP1510886
:: LaboratoryClient CHEMISTRY CENTRE Environmental Division Perth
: :ContactContact BARRY PRICE Customer Services EP
:: AddressAddress Building 500, Corner Manning Road and Townsing Drive
BENTLEY WA, AUSTRALIA 6102
10 Hod Way Malaga WA Australia 6090
:: E-mailE-mail [email protected] [email protected]
:: TelephoneTelephone +61 08 9422 9800 +61-8-9209 7655
:: FacsimileFacsimile +61 08 9422 9998 +61-8-9209 7600
:Project 14A0381 QC Level : NEPM 2013 Schedule B(3) and ALS QCS3 requirement
:Order number ---- Date Samples Received : 03-Jun-2015 14:33
:C-O-C number ---- Date Analysis Commenced : 10-Jun-2015
Sampler : ---- Issue Date : 12-Jun-2015 11:14
Site : ----
19:No. of samples received
Quote number : ---- 19:No. of samples analysed
This report supersedes any previous report(s) with this reference. Results apply to the sample(s) as submitted.
This Certificate of Analysis contains the following information:
l General Comments
l Analytical Results
SignatoriesThis document has been electronically signed by the authorized signatories indicated below. Electronic signing has been
carried out in compliance with procedures specified in 21 CFR Part 11.
Signatories Accreditation CategoryPosition
Andrew Epps Senior Inorganic Chemist Brisbane Acid Sulphate Soils
NATA Accredited Laboratory 825
Accredited for compliance with
ISO/IEC 17025.
R I G H T S O L U T I O N S | R I G H T P A R T N E R
2 of 6:Page
Work Order :
:Client
EP1510886
14A0381:Project
CHEMISTRY CENTRE
General Comments
The analytical procedures used by the Environmental Division have been developed from established internationally recognized procedures such as those published by the USEPA, APHA, AS and NEPM. In house
developed procedures are employed in the absence of documented standards or by client request.
Where moisture determination has been performed, results are reported on a dry weight basis.
Where a reported less than (<) result is higher than the LOR, this may be due to primary sample extract/digestate dilution and/or insufficient sample for analysis.
Where the LOR of a reported result differs from standard LOR, this may be due to high moisture content, insufficient sample (reduced weight employed) or matrix interference.
When sampling time information is not provided by the client, sampling dates are shown without a time component. In these instances, the time component has been assumed by the laboratory for processing purposes.
CAS Number = CAS registry number from database maintained by Chemical Abstracts Services. The Chemical Abstracts Service is a division of the American Chemical Society.
LOR = Limit of reporting
^ = This result is computed from individual analyte detections at or above the level of reporting
ø = ALS is not NATA accredited for these tests.
Key :
TIC conducted by ALS Brisbane, NATA Site No. 818.l
LECO & TIC conducted by ALS Brisbane, NATA Site No. 818.l
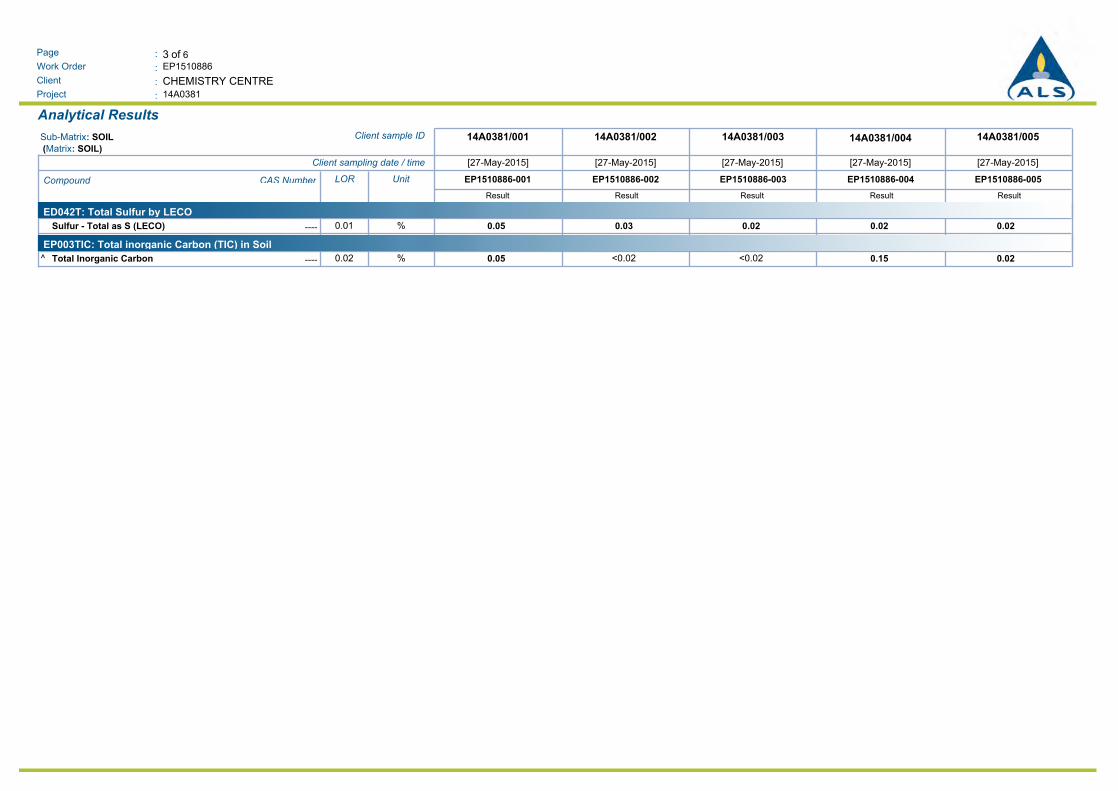
3 of 6:Page
Work Order :
:Client
EP1510886
14A0381:Project
CHEMISTRY CENTRE
Analytical Results
14A0381/00514A0381/00414A0381/00314A0381/00214A0381/001Client sample IDSub-Matrix: SOIL
(Matrix: SOIL)
[27-May-2015][27-May-2015][27-May-2015][27-May-2015][27-May-2015]Client sampling date / time
EP1510886-005EP1510886-004EP1510886-003EP1510886-002EP1510886-001UnitLORCAS NumberCompound
Result Result Result Result Result
ED042T: Total Sulfur by LECO
0.05 0.03 0.02 0.02 0.02%0.01----Sulfur - Total as S (LECO)
EP003TIC: Total inorganic Carbon (TIC) in Soil
0.05^ <0.02 <0.02 0.15 0.02%0.02----Total Inorganic Carbon
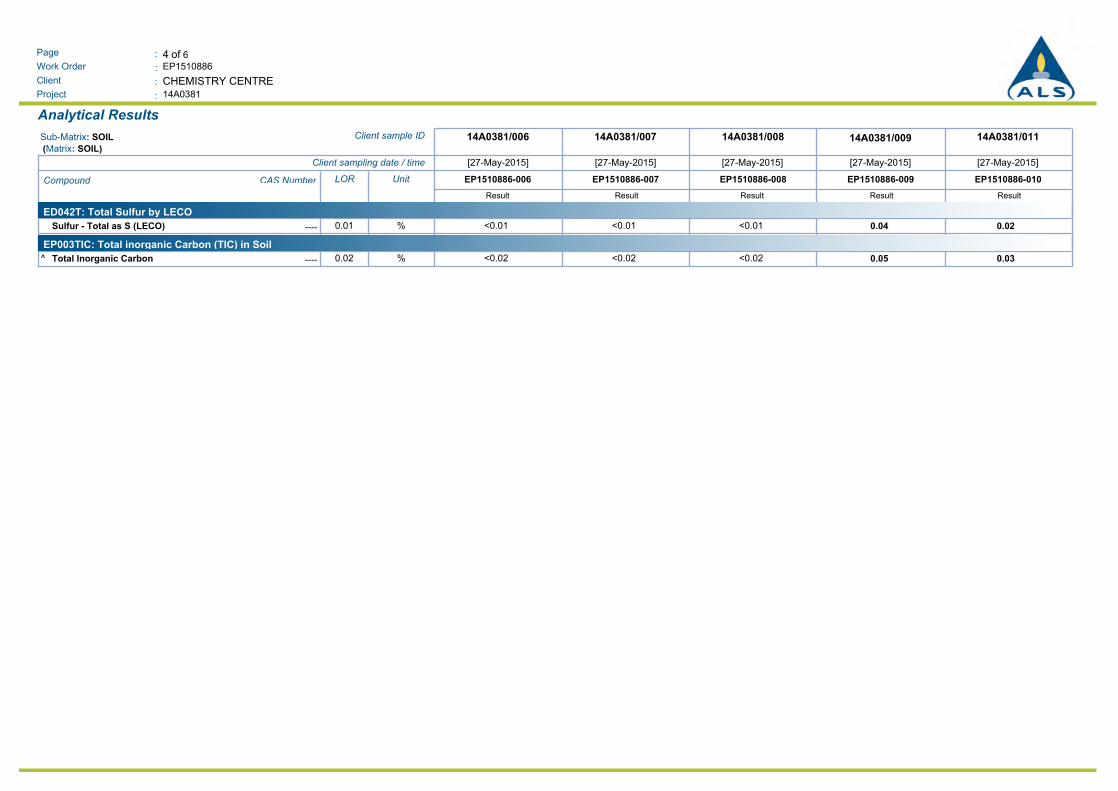
4 of 6:Page
Work Order :
:Client
EP1510886
14A0381:Project
CHEMISTRY CENTRE
Analytical Results
14A0381/01114A0381/00914A0381/00814A0381/00714A0381/006Client sample IDSub-Matrix: SOIL
(Matrix: SOIL)
[27-May-2015][27-May-2015][27-May-2015][27-May-2015][27-May-2015]Client sampling date / time
EP1510886-010EP1510886-009EP1510886-008EP1510886-007EP1510886-006UnitLORCAS NumberCompound
Result Result Result Result Result
ED042T: Total Sulfur by LECO
<0.01 <0.01 <0.01 0.04 0.02%0.01----Sulfur - Total as S (LECO)
EP003TIC: Total inorganic Carbon (TIC) in Soil
<0.02^ <0.02 <0.02 0.05 0.03%0.02----Total Inorganic Carbon
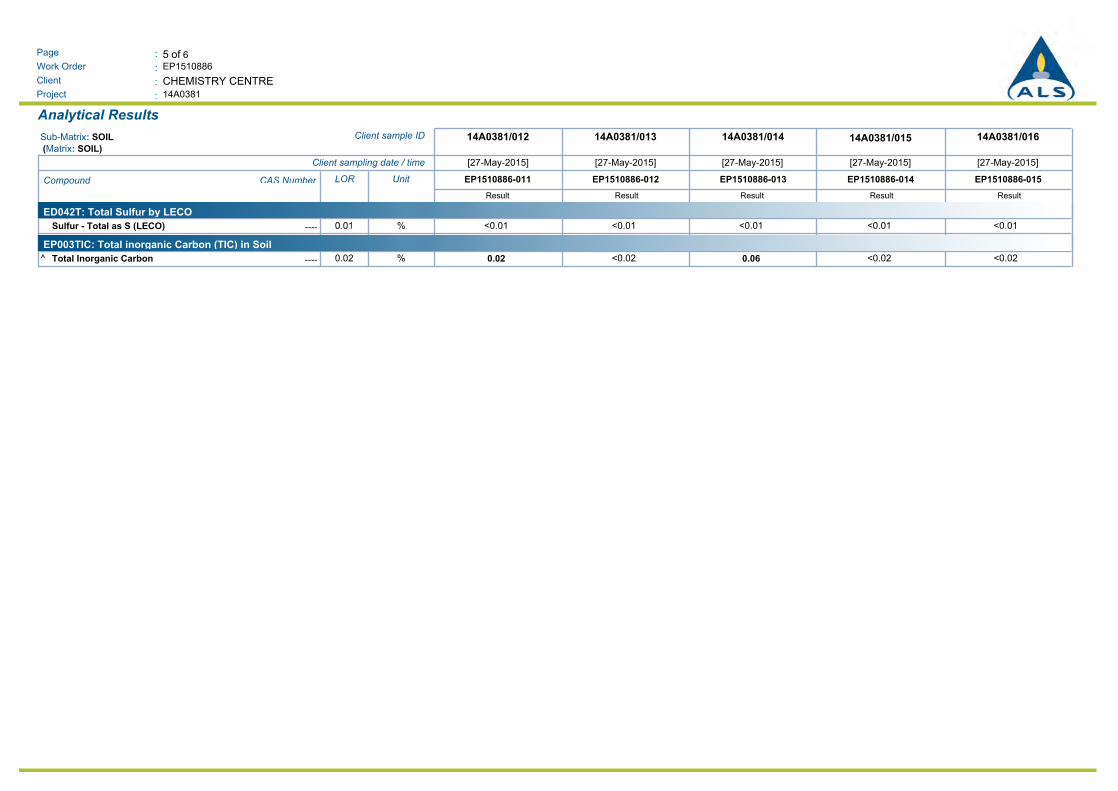
5 of 6:Page
Work Order :
:Client
EP1510886
14A0381:Project
CHEMISTRY CENTRE
Analytical Results
14A0381/01614A0381/01514A0381/01414A0381/01314A0381/012Client sample IDSub-Matrix: SOIL
(Matrix: SOIL)
[27-May-2015][27-May-2015][27-May-2015][27-May-2015][27-May-2015]Client sampling date / time
EP1510886-015EP1510886-014EP1510886-013EP1510886-012EP1510886-011UnitLORCAS NumberCompound
Result Result Result Result Result
ED042T: Total Sulfur by LECO
<0.01 <0.01 <0.01 <0.01 <0.01%0.01----Sulfur - Total as S (LECO)
EP003TIC: Total inorganic Carbon (TIC) in Soil
0.02^ <0.02 0.06 <0.02 <0.02%0.02----Total Inorganic Carbon
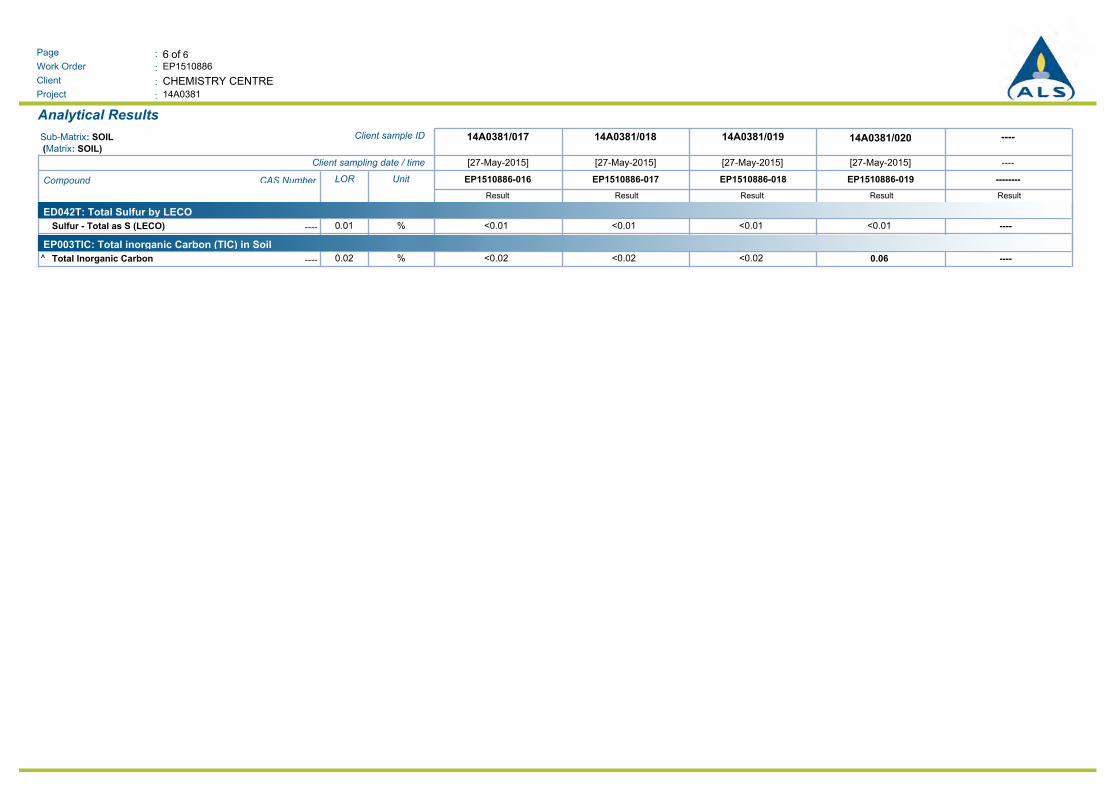
6 of 6:Page
Work Order :
:Client
EP1510886
14A0381:Project
CHEMISTRY CENTRE
Analytical Results
----14A0381/02014A0381/01914A0381/01814A0381/017Client sample IDSub-Matrix: SOIL
(Matrix: SOIL)
----[27-May-2015][27-May-2015][27-May-2015][27-May-2015]Client sampling date / time
--------EP1510886-019EP1510886-018EP1510886-017EP1510886-016UnitLORCAS NumberCompound
Result Result Result Result Result
ED042T: Total Sulfur by LECO
<0.01 <0.01 <0.01 <0.01 ----%0.01----Sulfur - Total as S (LECO)
EP003TIC: Total inorganic Carbon (TIC) in Soil
<0.02^ <0.02 <0.02 0.06 ----%0.02----Total Inorganic Carbon


![ENVIRONMENTAL & SOCIAL IMPACT ASSESSMENT ......ENVIRONMENTAL & SOCIAL IMPACT ASSESSMENT STUDY REPORT [2017] PROJECT PROPONENT The Managing Director, Kisumu Water and Sewerage Company](https://img.pdfslide.net/doc/110x75/5e96e013af2cd55e06301f8c/environmental-social-impact-assessment-environmental-social.jpg)