Embed Size (px)
DESCRIPTION
Depto. de Astronomía (UGto). Astronomía Extragaláctica y Cosmología Observacional. Lecture 9 Groups and Clusters of Galaxies – I (Galaxies). Definition – Richness Catalogs rich clusters groups compact groups pairs Morphology and Classification Radial Profiles Substructuring - PowerPoint PPT Presentation
Citation preview
Astronomía Extragaláctica y Cosmología ObservacionalDepto. de Astronomía (UGto)
Lecture 9 Groups and Clusters of Galaxies – I (Galaxies)
Definition – Richness
Catalogs rich clusters groups compact groups pairs
Morphology and Classification
Radial Profiles
Substructuring
Environmental Effects and Segregation cDs morphological segregation (morphology-density relation) Red Sequence and Butcher-Oemler effect ram pressure and galaxy harassment
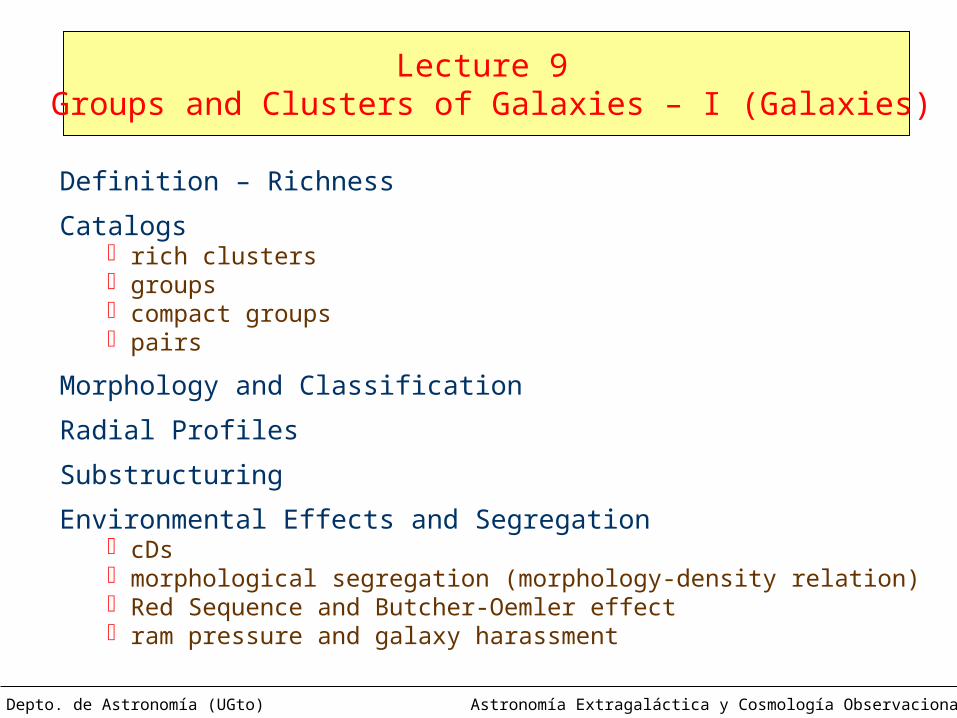
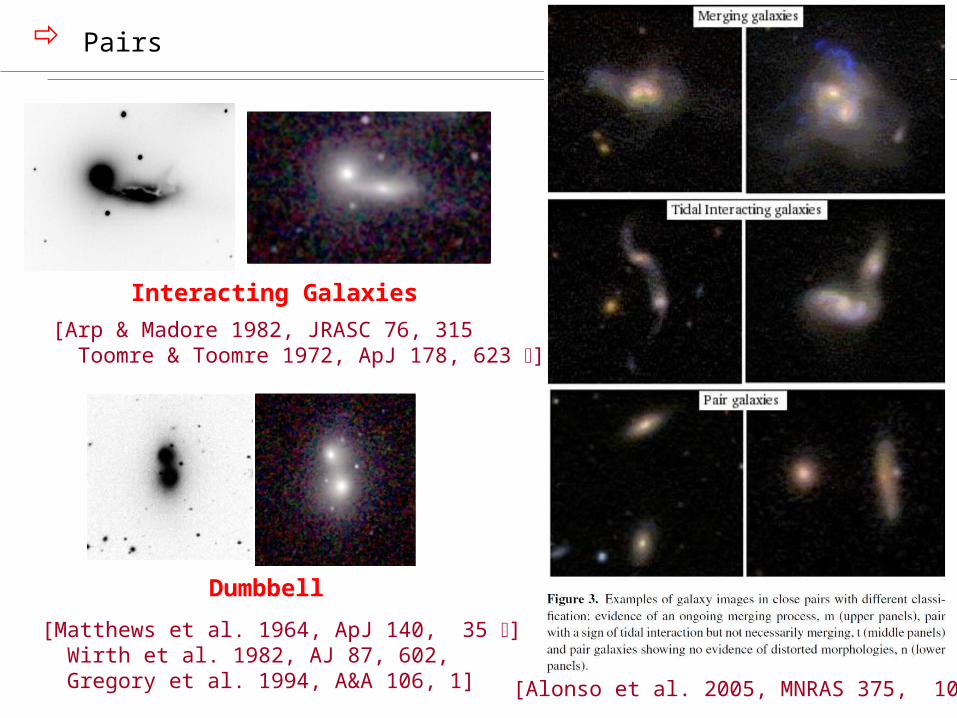
Definition: Richness
Pair → 2 galaxies (~ 1012 M)Group → ~ 10 galaxies (~ 1012-1013 M)Poor Cluster → ~ 100 galaxies (~ 1013-1014 M)Rich Cluster → ~ 1 000 galaxies (~ 1014-1015 M)Supercluster → ~ 10 000 galaxies (~ 1015-1016 M)
Hercules/A2151 (Cl)
M51 (GPair)
Stephan Quintet (CGr)
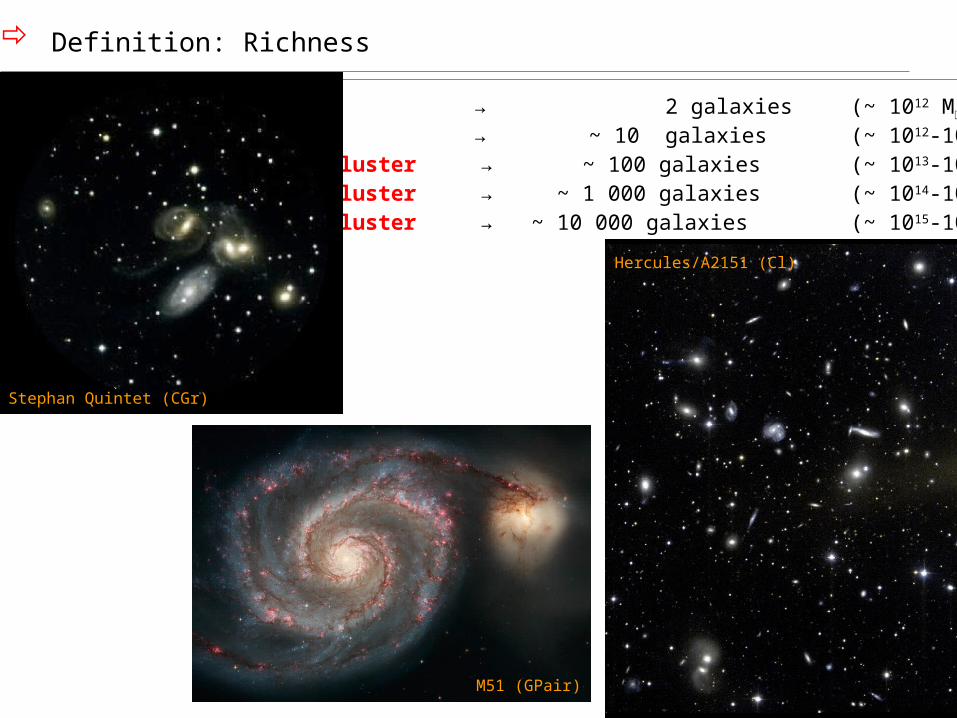
Pairs
[Alonso et al. 2005, MNRAS 375, 1017]
Dumbbell
[Matthews et al. 1964, ApJ 140, 35 ] Wirth et al. 1982, AJ 87, 602, Gregory et al. 1994, A&A 106, 1]
[Arp & Madore 1982, JRASC 76, 315 Toomre & Toomre 1972, ApJ 178, 623 ]
Interacting Galaxies
Catalogs: Abell-ACO
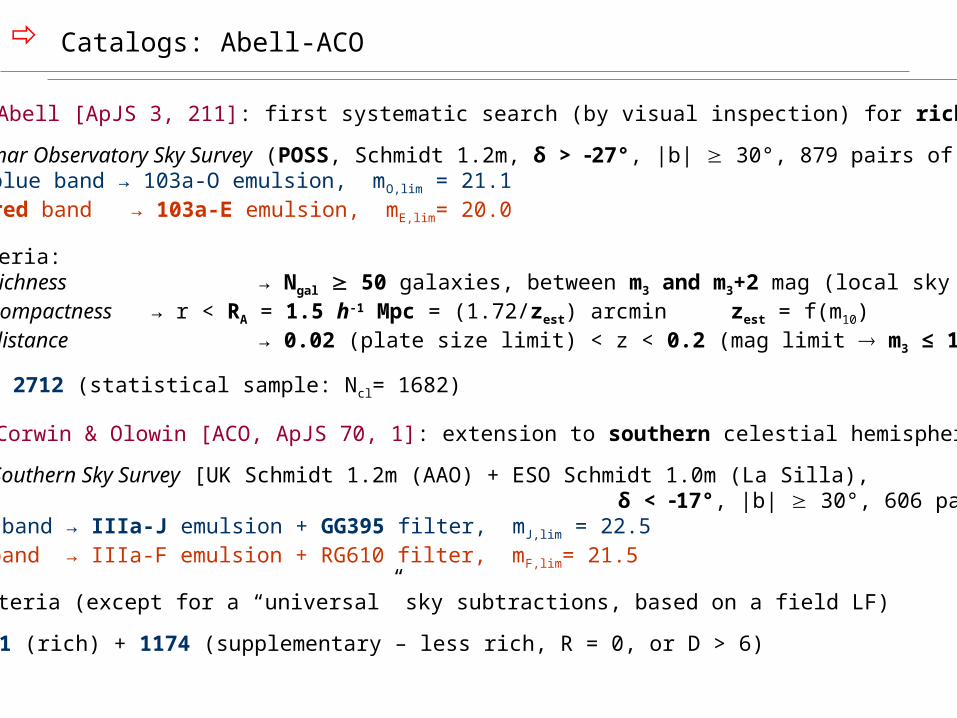
1958 – G. Abell [ApJS 3, 211]: first systematic search (by visual inspection) for rich clusters
Palomar Observatory Sky Survey (POSS, Schmidt 1.2m, δ > 27°, |b| 30°, 879 pairs of plates)• blue band → 103a-O emulsion, mO,lim = 21.1• red band → 103a-E emulsion, mE,lim= 20.0
criteria: • richness → Ngal 50 galaxies, between m3 and m3+2 mag (local sky subtraction)• compactness → r < RA = 1.5 h-1 Mpc = (1.72/zest) arcmin zest = f(m10)• distance → 0.02 (plate size limit) < z < 0.2 (mag limit m3 ≤ 17.5)
Ncl = 2712 (statistical sample: Ncl= 1682)
1989 – Abell, Corwin & Olowin [ACO, ApJS 70, 1]: extension to southern celestial hemisphere
ESO/SERC Southern Sky Survey [UK Schmidt 1.2m (AAO) + ESO Schmidt 1.0m (La Silla), δ < 17°, |b| 30°, 606 pairs of plates]
• blue band → IIIa-J emulsion + GG395 filter, mJ,lim = 22.5• red band → IIIa-F emulsion + RG610 filter, mF,lim= 21.5
same criteria (except for a “universal” sky subtractions, based on a field LF)
Ncl = 1361 (rich) + 1174 (supplementary – less rich, R = 0, or D > 6)
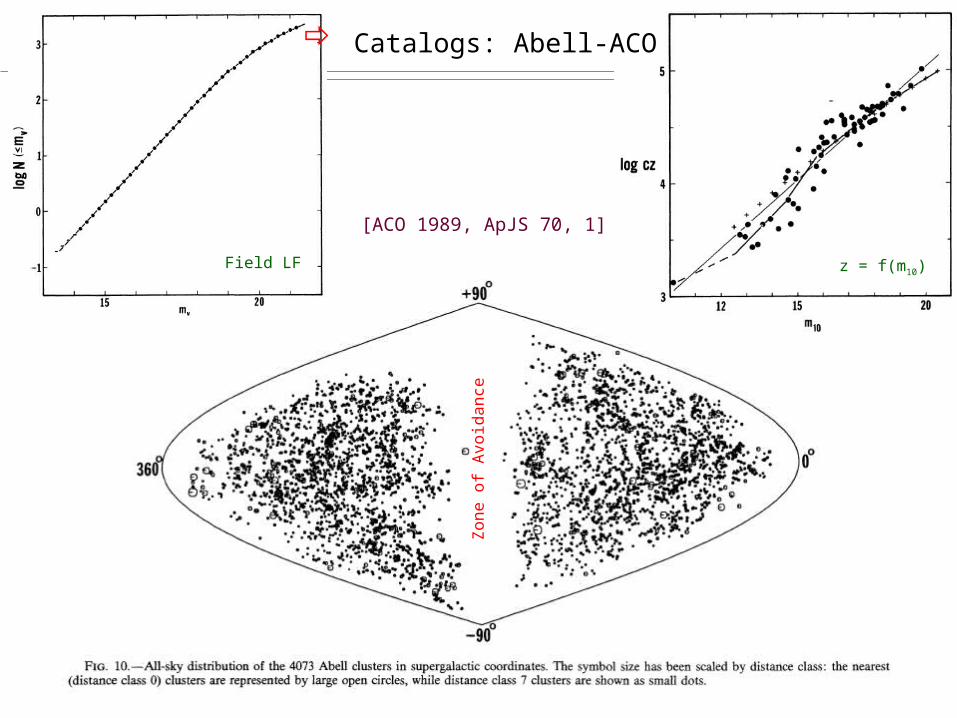
[ACO 1989, ApJS 70, 1]
Catalogs: Abell-ACO
Field LF z = f(m10)
Zone o
f A
void
ance
Catalogs: Abell-ACO
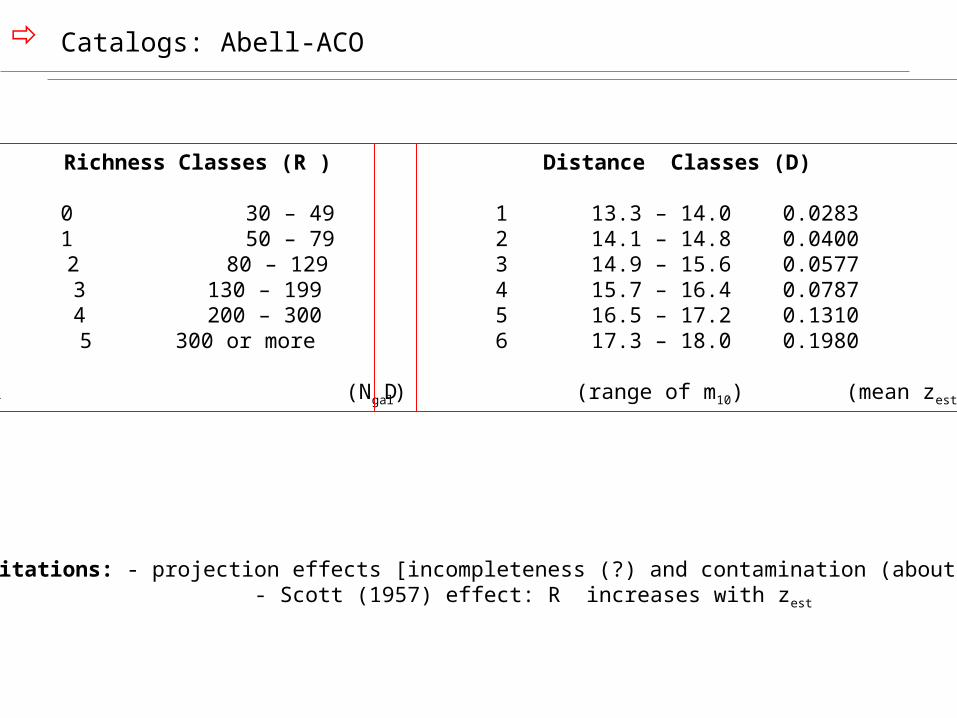
Richness Classes (R )
0 30 – 491 50 – 792 80 – 1293 130 – 1994 200 – 3005 300 or more
R (Ngal)
Distance Classes (D)
1 13.3 – 14.0 0.02832 14.1 – 14.8 0.04003 14.9 – 15.6 0.05774 15.7 – 16.4 0.07875 16.5 – 17.2 0.13106 17.3 – 18.0 0.1980
D (range of m10) (mean zest)
Limitations: - projection effects [incompleteness (?) and contamination (about 10%)] - Scott (1957) effect: R increases with zest
Catalogs: Abell-ACO
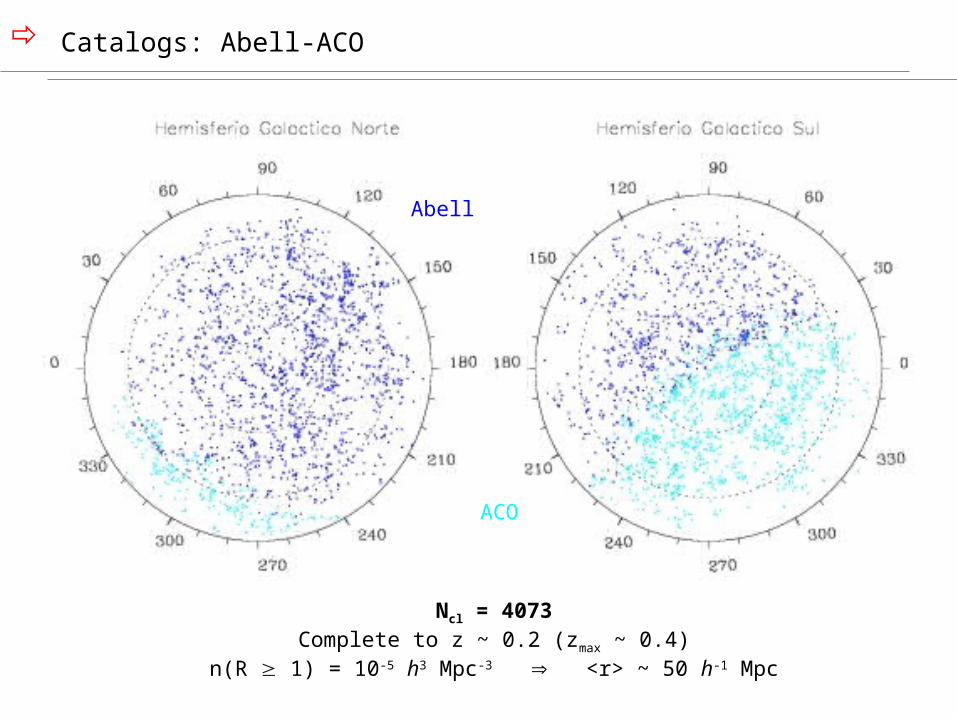
Ncl = 4073Complete to z ~ 0.2 (zmax ~ 0.4)
n(R 1) = 10-5 h3 Mpc-3 <r> ~ 50 h-1 Mpc
Abell
ACO
Catalogs: other classical cluster catalogs
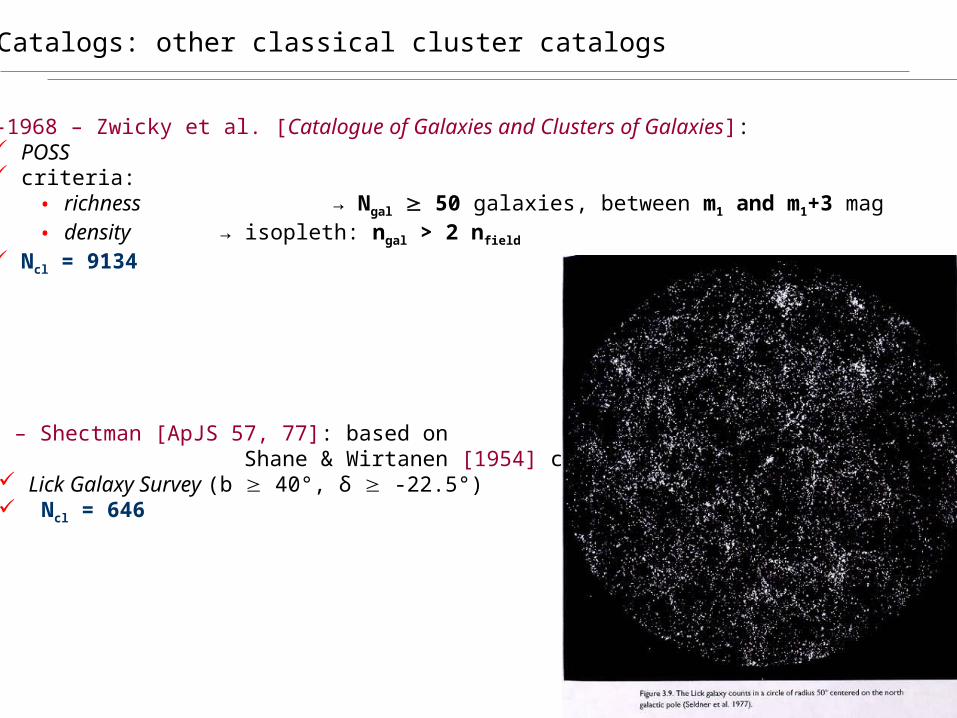
1961-1968 – Zwicky et al. [Catalogue of Galaxies and Clusters of Galaxies]: POSS criteria:
• richness → Ngal 50 galaxies, between m1 and m1+3 mag• density → isopleth: ngal > 2 nfield
Ncl = 9134
1985 – Shectman [ApJS 57, 77]: based on Shane & Wirtanen [1954] counts
Lick Galaxy Survey (b 40°, δ -22.5°) Ncl = 646
Catalogs: other classical cluster catalogs
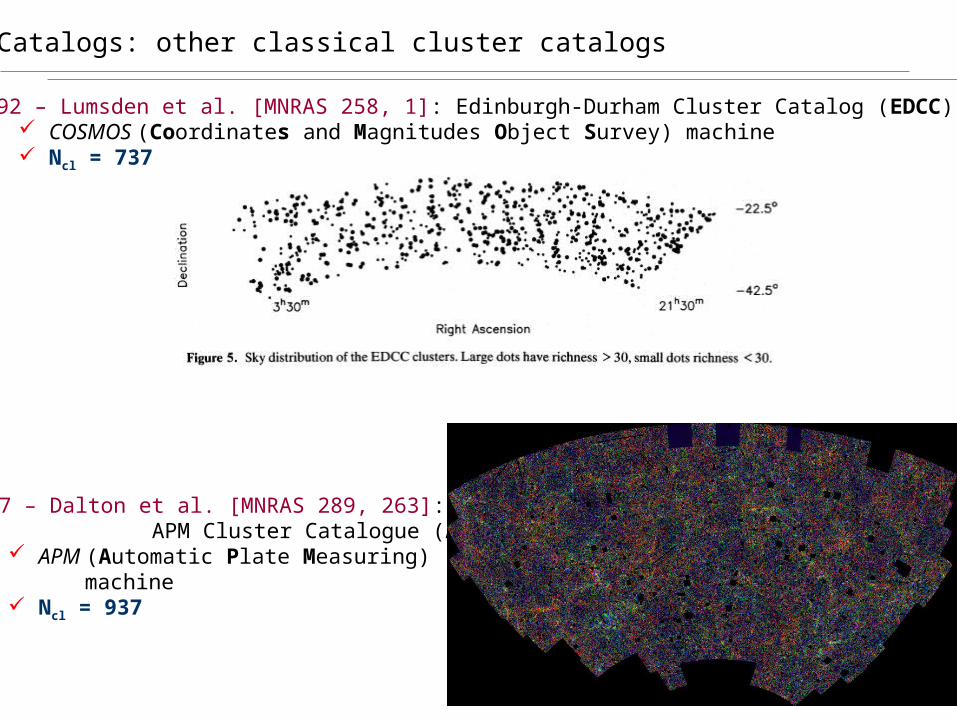
1992 – Lumsden et al. [MNRAS 258, 1]: Edinburgh-Durham Cluster Catalog (EDCC) COSMOS (Coordinates and Magnitudes Object Survey) machine Ncl = 737
1997 – Dalton et al. [MNRAS 289, 263]: APM Cluster Catalogue (APMCC)
APM (Automatic Plate Measuring) machine Ncl = 937
Catalogs: other cluster catalogs
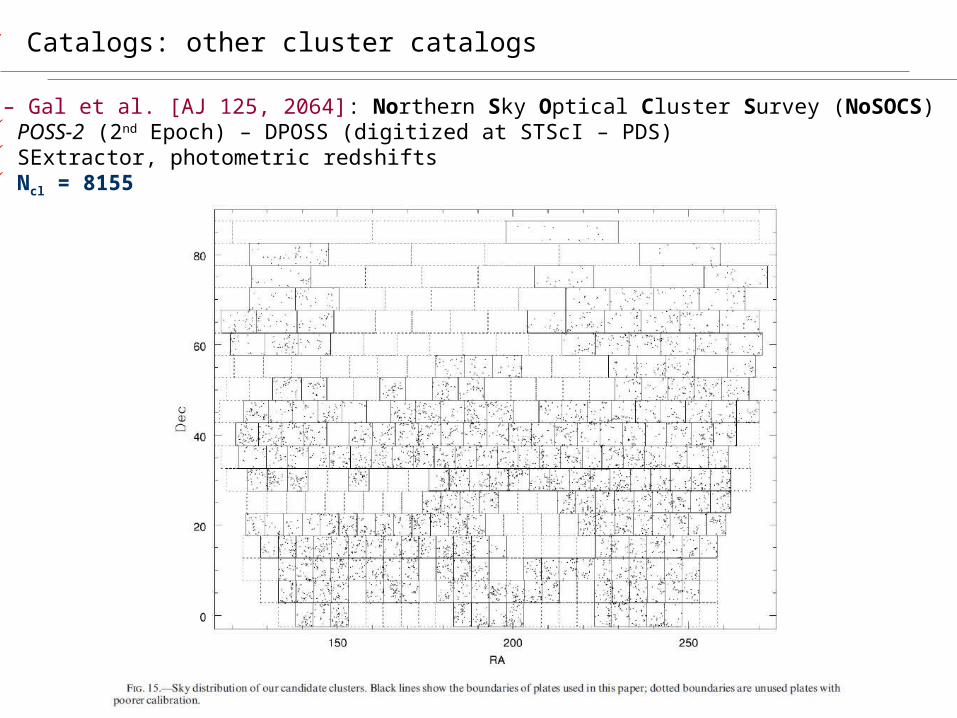
2003 – Gal et al. [AJ 125, 2064]: Northern Sky Optical Cluster Survey (NoSOCS) POSS-2 (2nd Epoch) – DPOSS (digitized at STScI – PDS) SExtractor, photometric redshifts Ncl = 8155
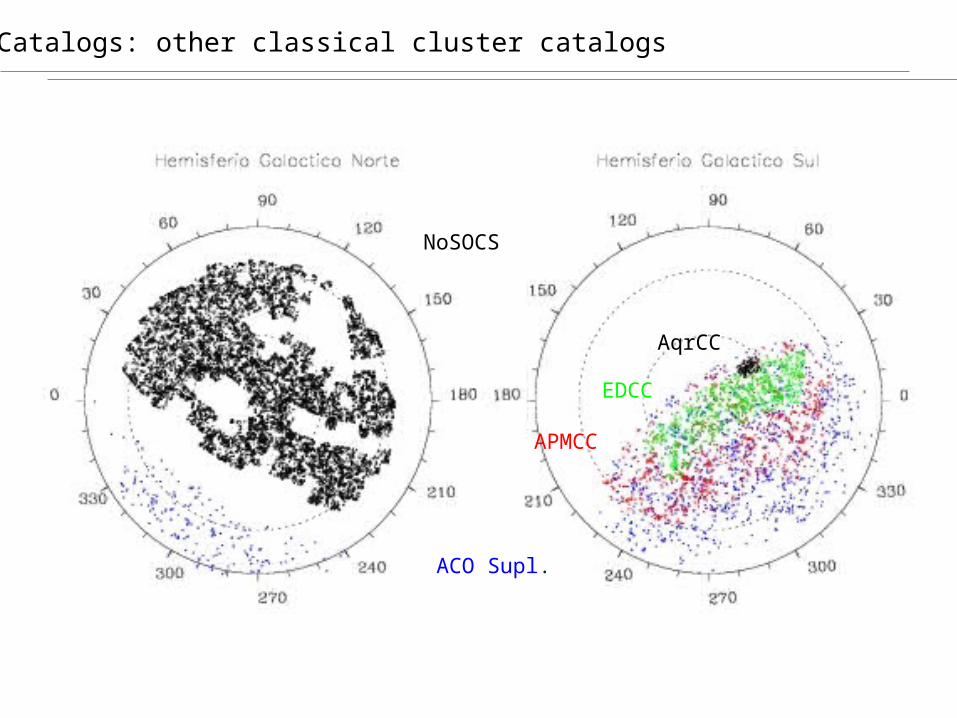
Catalogs: other classical cluster catalogs
NoSOCS
ACO Supl.
AqrCC
APMCC
EDCC
Catalogs: Groups
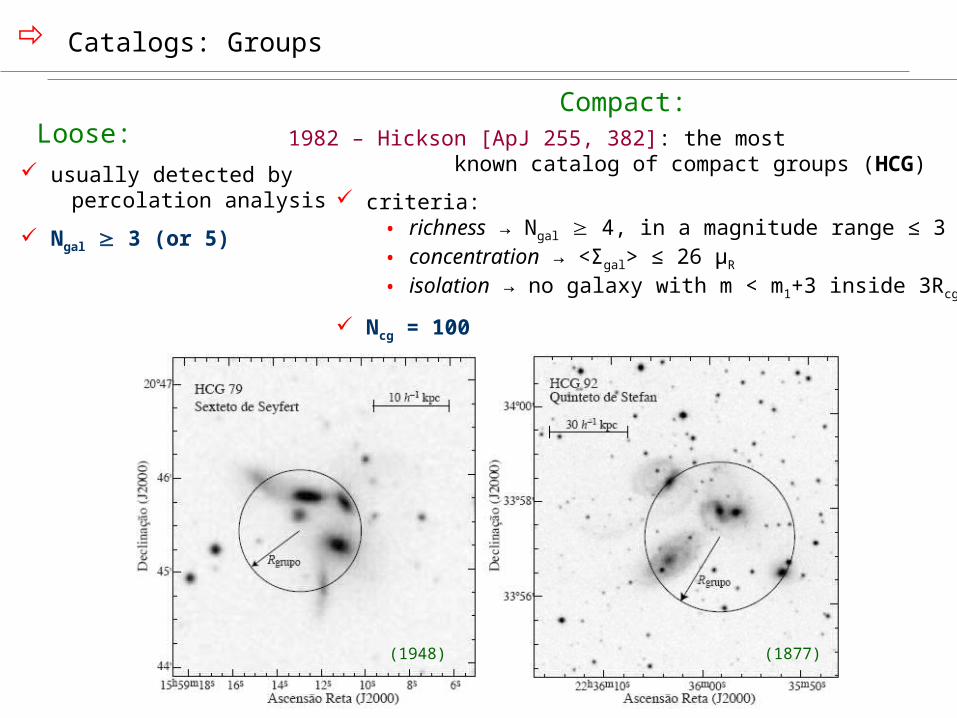
Compact: Loose: usually detected by percolation analysis
Ngal 3 (or 5)
1982 – Hickson [ApJ 255, 382]: the most known catalog of compact groups (HCG)
criteria:• richness → Ngal 4, in a magnitude range ≤ 3 mag• concentration → <Σgal> ≤ 26 μR
• isolation → no galaxy with m < m1+3 inside 3Rcg
Ncg = 100
(1877)(1948)
Catalogs: Groups
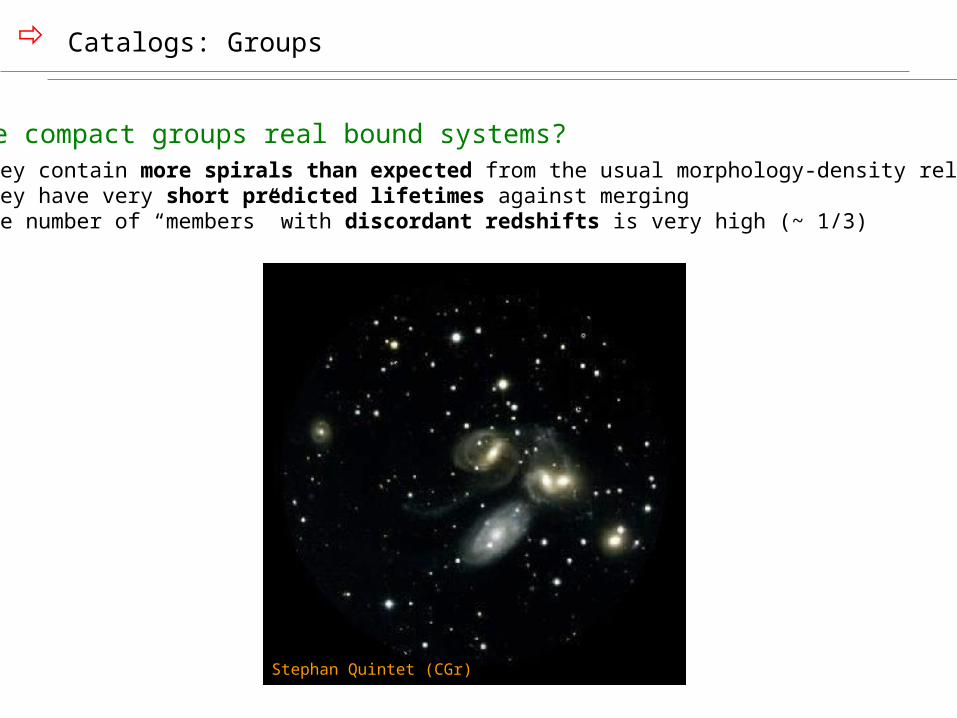
Are compact groups real bound systems? they contain more spirals than expected from the usual morphology-density relation they have very short predicted lifetimes against merging the number of “members” with discordant redshifts is very high (~ 1/3)
Stephan Quintet (CGr)
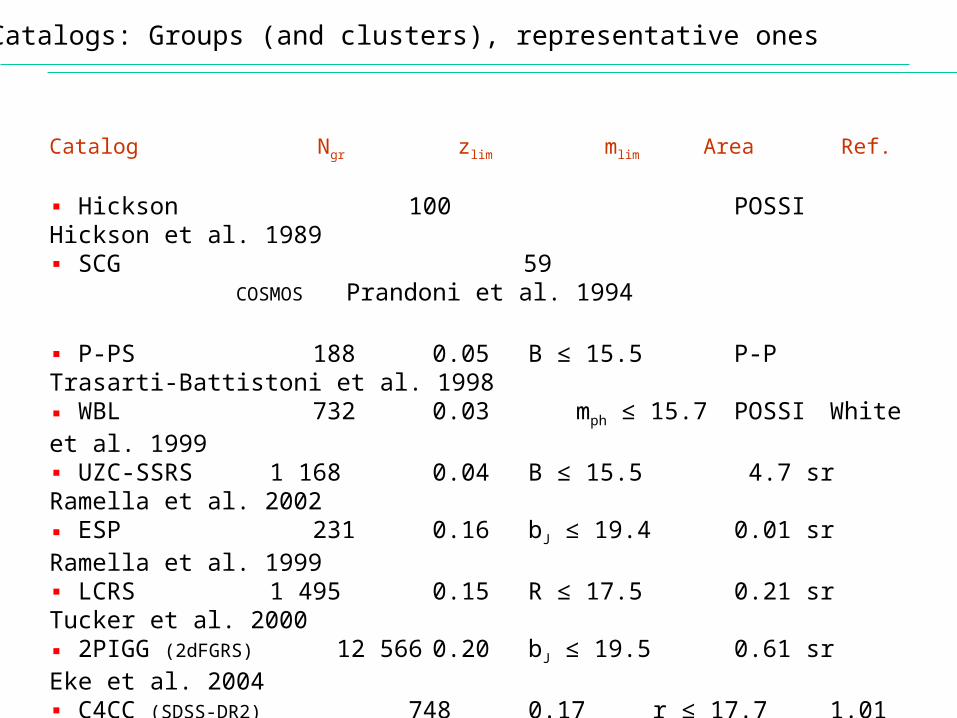
Catalogs: Groups (and clusters), representative ones
Catalog Ngr zlim mlim Area Ref.
▪ Hickson 100 POSSI Hickson et al. 1989▪ SCG 59 COSMOS Prandoni et al. 1994
▪ P-PS 188 0.05 B ≤ 15.5 P-P Trasarti-Battistoni et al. 1998▪ WBL 732 0.03 mph ≤ 15.7 POSSI White et al. 1999▪ UZC-SSRS 1 168 0.04 B ≤ 15.5 4.7 sr Ramella et al. 2002▪ ESP 231 0.16 bJ ≤ 19.4 0.01 sr Ramella et al. 1999▪ LCRS 1 495 0.15 R ≤ 17.5 0.21 sr Tucker et al. 2000▪ 2PIGG (2dFGRS) 12 566 0.20 bJ ≤ 19.5 0.61 sr Eke et al. 2004▪ C4CC (SDSS-DR2) 748 0.17 r ≤ 17.7 1.01 sr Miller et al. 2005▪ 2MGrC (2MASS) ~ 1 500 0.05 Ks ≤ 11.3 all-sky Crook et al. 2007
▪ Abell/ACO 4 073 0.20 mph ≤ 20.0 ~8.2 sr Abell 1958, ACO 1989▪ EDCC 737 0.19 bJ ≤ 20.5 0.5 sr Lumsden et al. 1992▪ APMCC 937 0.13 bJ ≤ 20.5 1.31 sr Dalton et al. 1997▪ NoSOCs 16 546 0.25 rF ≤ 19.5 3.35 sr Gal et al. 2008
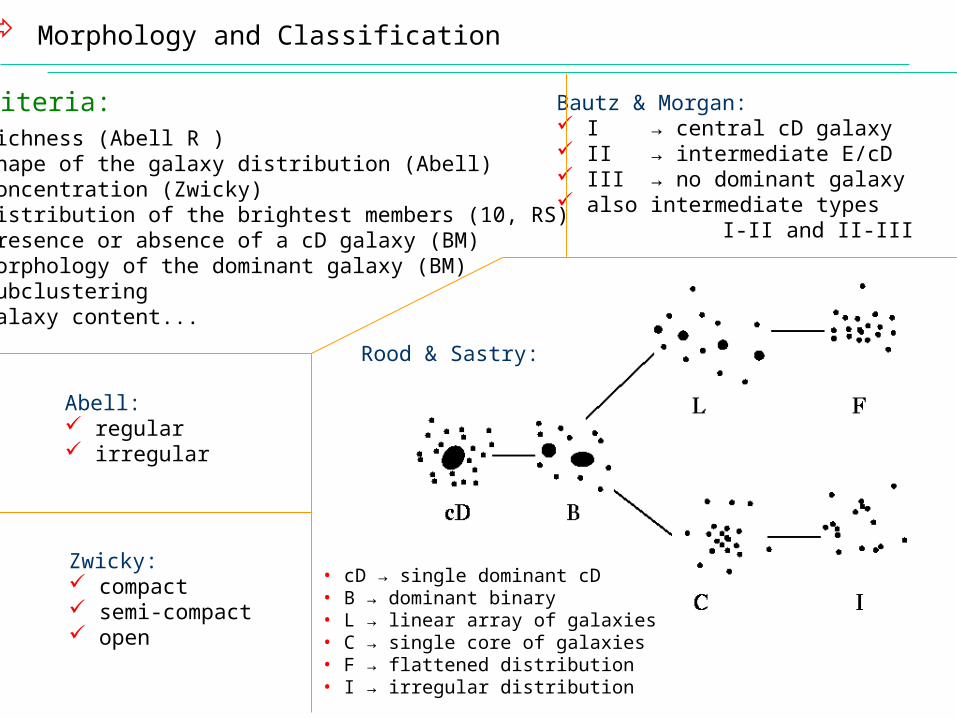
Morphology and Classification
Abell: regular irregular
Zwicky: compact semi-compact open
Bautz & Morgan: I → central cD galaxy II → intermediate E/cD III → no dominant galaxy also intermediate types I-II and II-III
Rood & Sastry:
• cD → single dominant cD• B → dominant binary• L → linear array of galaxies• C → single core of galaxies• F → flattened distribution• I → irregular distribution
Criteria: richness (Abell R ) shape of the galaxy distribution (Abell) concentration (Zwicky) distribution of the brightest members (10, RS) presence or absence of a cD galaxy (BM) morphology of the dominant galaxy (BM) subclustering galaxy content...
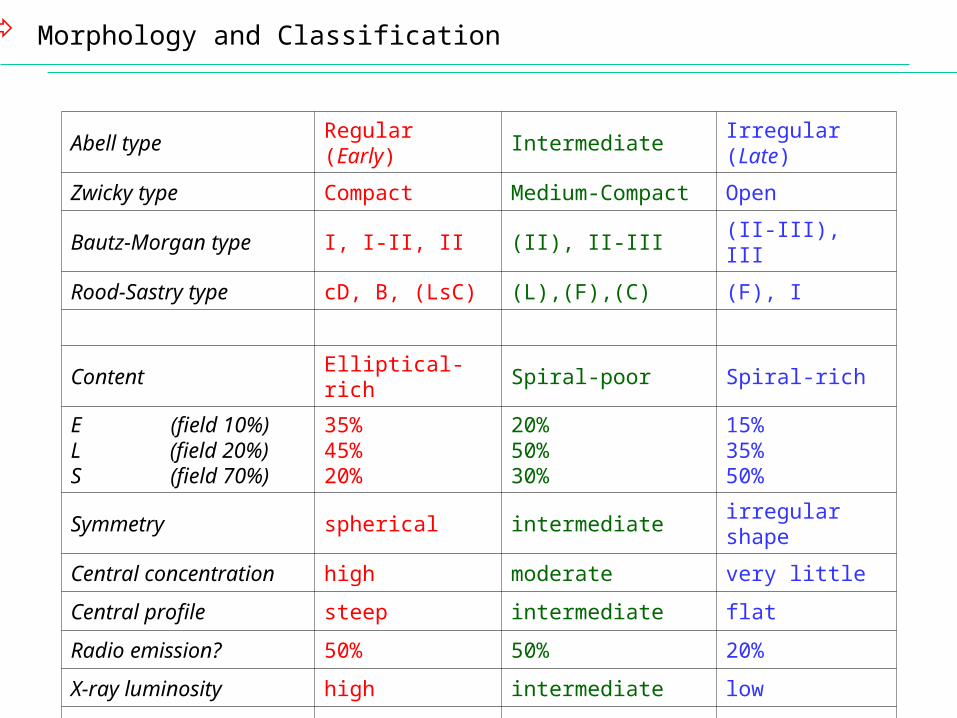
Morphology and Classification
Abell type Regular (Early) Intermediate Irregular (Late)
Zwicky type Compact Medium-Compact Open
Bautz-Morgan type I, I-II, II (II), II-III (II-III), III
Rood-Sastry type cD, B, (LsC) (L),(F),(C) (F), I
Content Elliptical-rich Spiral-poor Spiral-rich
E (field 10%)L (field 20%)S (field 70%)
35%45%20%
20%50%30%
15%35%50%
Symmetry spherical intermediate irregular shape
Central concentration high moderate very little
Central profile steep intermediate flat
Radio emission? 50% 50% 20%
X-ray luminosity high intermediate low
Examples A2199, Coma A194, A539 Virgo, A1228
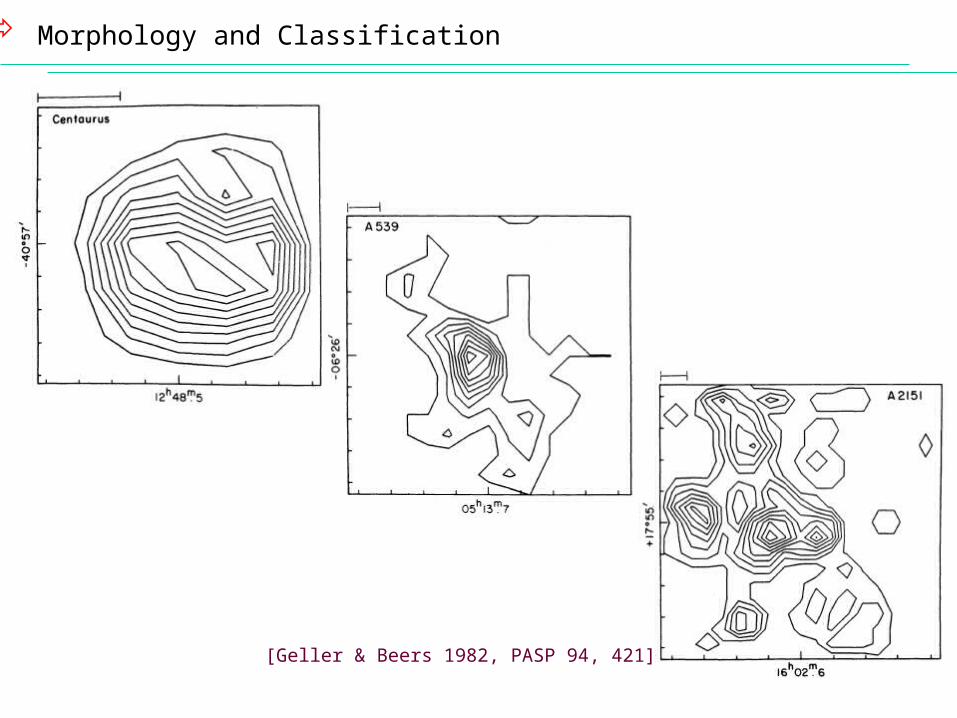
Morphology and Classification
[Geller & Beers 1982, PASP 94, 421]
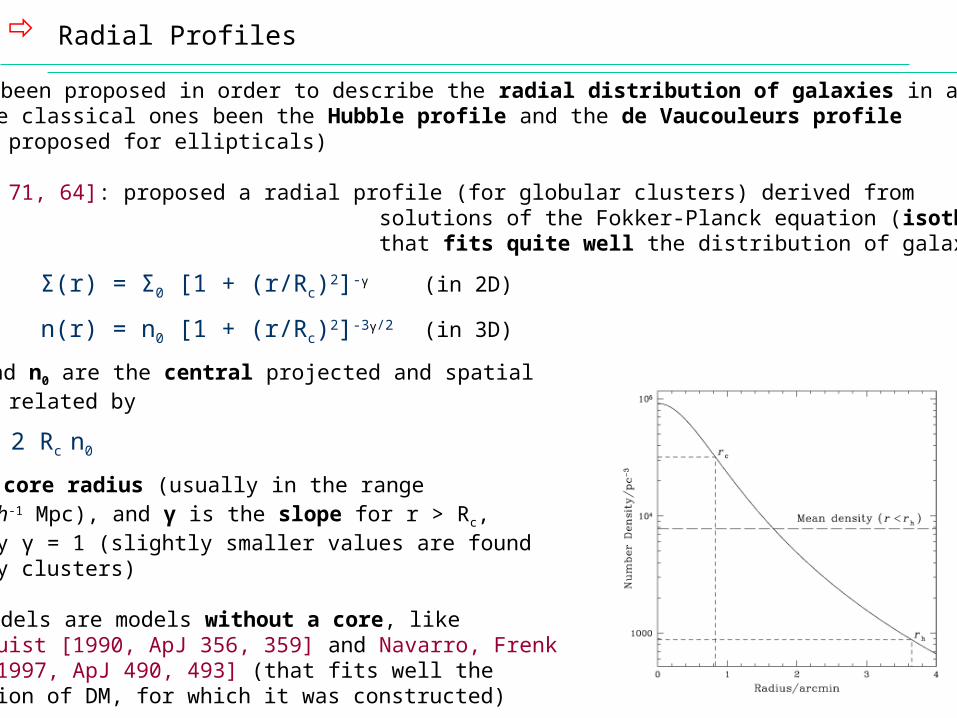
Radial Profiles
Many models have been proposed in order to describe the radial distribution of galaxies in a cluster, the classical ones been the Hubble profile and the de Vaucouleurs profile (originally proposed for ellipticals) 1962 – I. King [AJ 71, 64]: proposed a radial profile (for globular clusters) derived from solutions of the Fokker-Planck equation (isothermal sphere), that fits quite well the distribution of galaxies in a cluster:
Σ(r) = Σ0 [1 + (r/Rc)2]-γ (in 2D)
n(r) = n0 [1 + (r/Rc)2]-3γ/2 (in 3D)
where Σ0 and n0 are the central projected and spatial densities, related by
Σ0 = 2 Rc n0
Rc is the core radius (usually in the range 0.1–0.25 h-1 Mpc), and γ is the slope for r > Rc, originally γ = 1 (slightly smaller values are found for galaxy clusters) Other proposed models are models without a core, like the Hernquist [1990, ApJ 356, 359] and Navarro, Frenk & White [1997, ApJ 490, 493] (that fits well the distribution of DM, for which it was constructed)
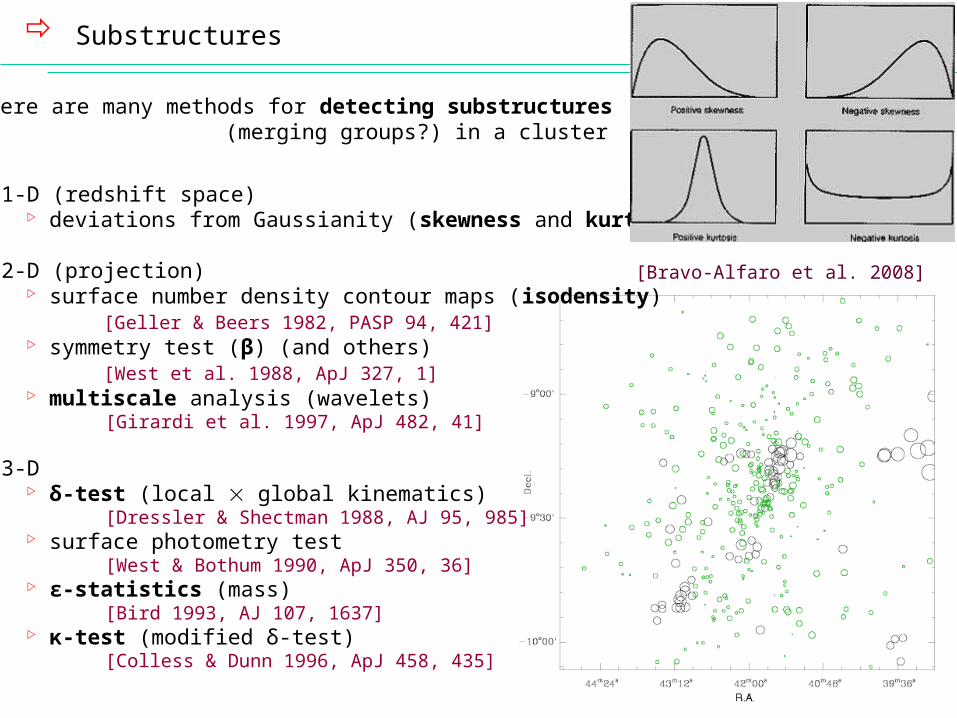
Substructures
[Bravo-Alfaro et al. 2008]
1-D (redshift space) deviations from Gaussianity (skewness and kurtosis)
2-D (projection) surface number density contour maps (isodensity) [Geller & Beers 1982, PASP 94, 421] symmetry test (β) (and others) [West et al. 1988, ApJ 327, 1] multiscale analysis (wavelets) [Girardi et al. 1997, ApJ 482, 41]
3-D δ-test (local global kinematics) [Dressler & Shectman 1988, AJ 95, 985] surface photometry test [West & Bothum 1990, ApJ 350, 36] ε-statistics (mass) [Bird 1993, AJ 107, 1637] κ-test (modified δ-test) [Colless & Dunn 1996, ApJ 458, 435]
There are many methods for detecting substructures (merging groups?) in a cluster
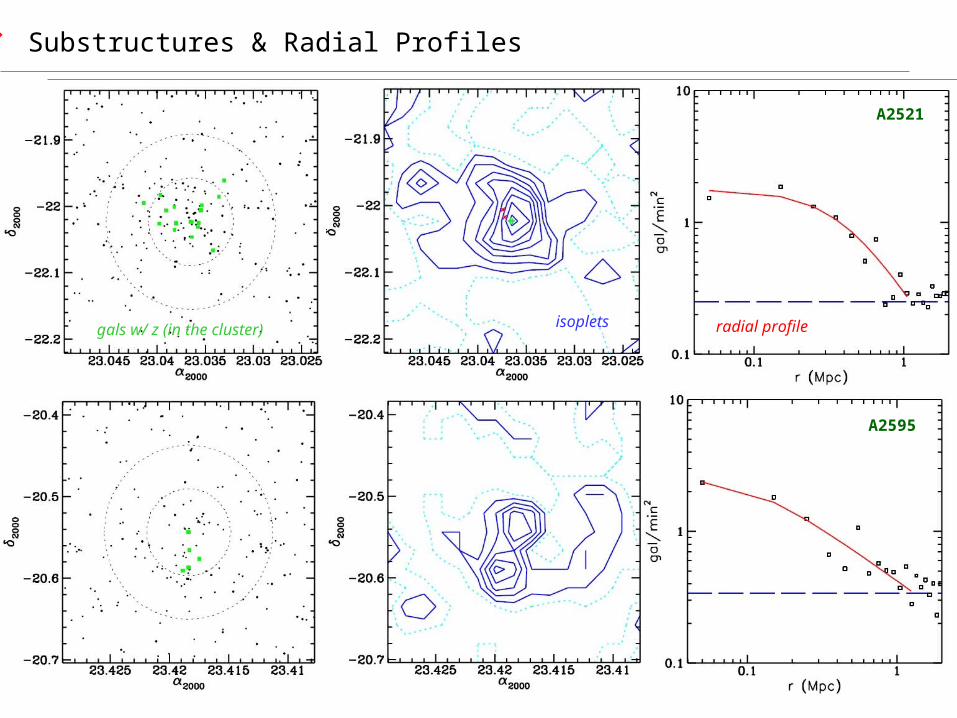
Substructures & Radial Profiles
A2521
A2595
isoplets radial profilegals w/ z (in the cluster)
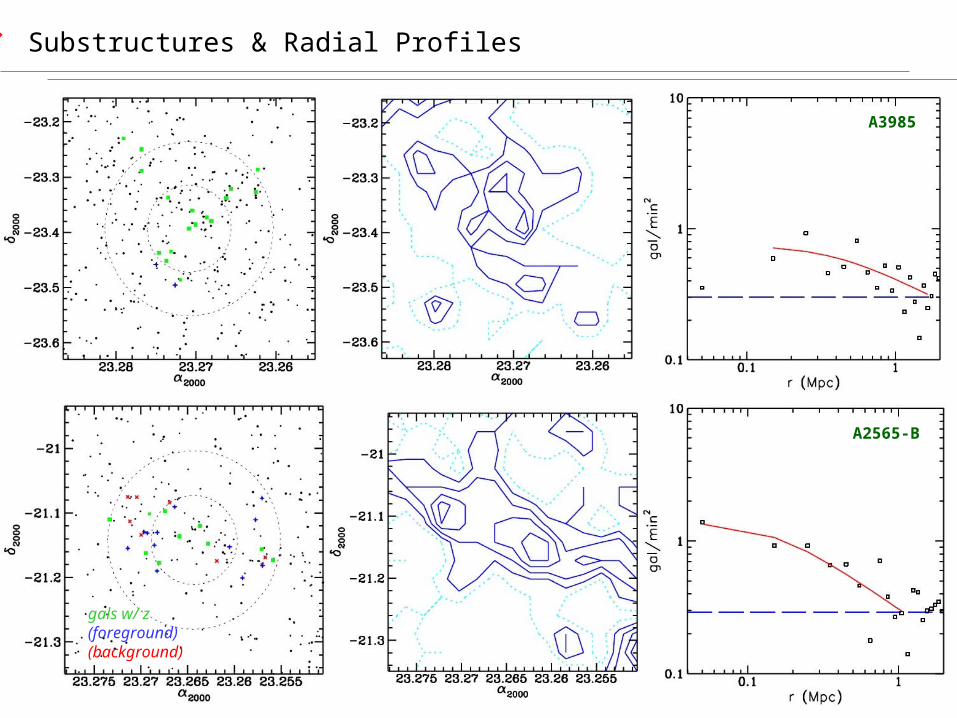
Substructures & Radial Profiles
A3985
A2565-B
gals w/ z (foreground)(background)
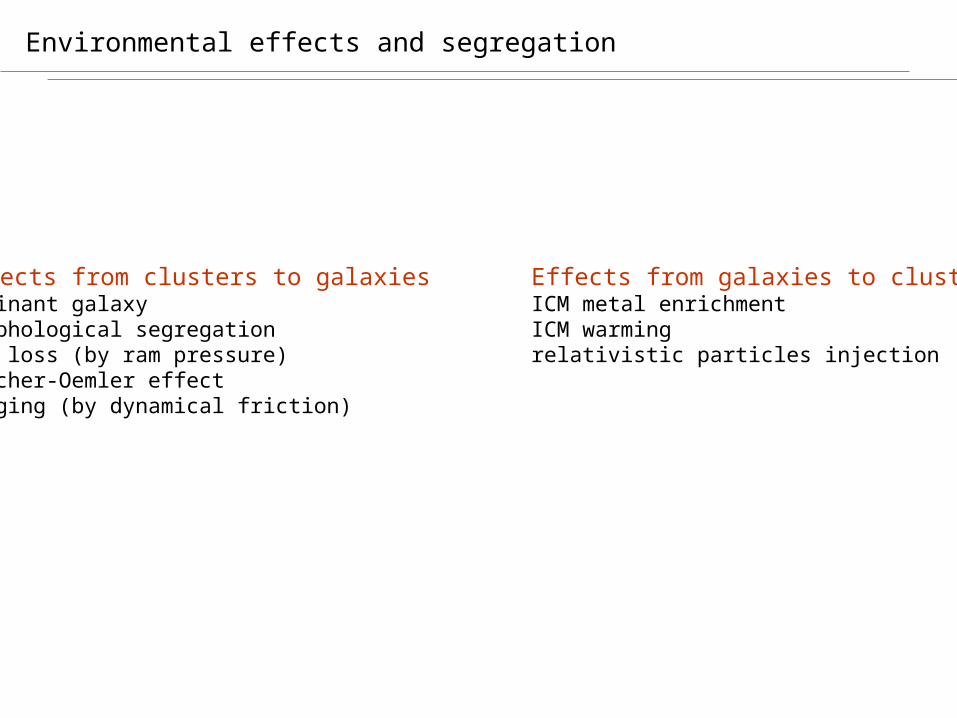
Environmental effects and segregation
Effects from clusters to galaxies Effects from galaxies to clustersdominant galaxy ICM metal enrichmentmorphological segregation ICM warminggas loss (by ram pressure) relativistic particles injectionButcher-Oemler effectmerging (by dynamical friction)
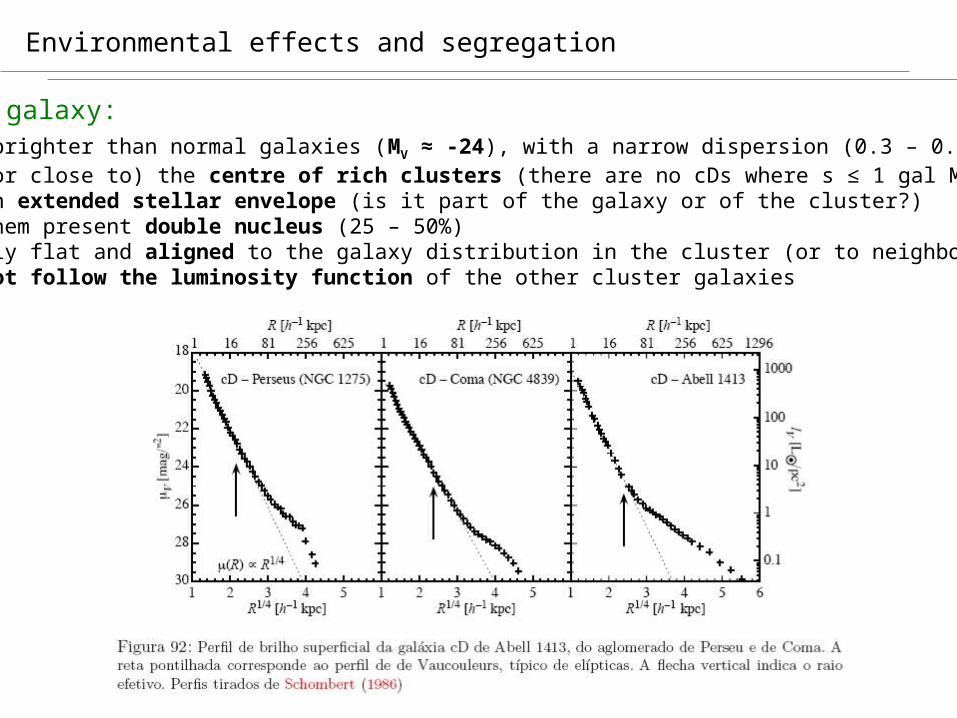
Environmental effects and segregation
Dominant galaxy: galaxies brighter than normal galaxies (MV ≈ -24), with a narrow dispersion (0.3 – 0.35 mag) rest at (or close to) the centre of rich clusters (there are no cDs where s ≤ 1 gal Mpc-3) present an extended stellar envelope (is it part of the galaxy or of the cluster?) most of them present double nucleus (25 – 50%) are usually flat and aligned to the galaxy distribution in the cluster (or to neighbor clusters) they do not follow the luminosity function of the other cluster galaxies

Environmental effects and segregation
Proposed formation scenarios: merger of bright galaxies or accretion of small ones by dynamical friction (galactic cannibalism) [Ostrike & Tremaine 1975, Dubinski 1998], but high large times, also peculiar velocities
accumulation of loose stars that fall in the cluster potential, taken off galaxies by tidal effects [Merritt 1984], but colors and metallicities …
accumulation of gas in the cluster potential by cooling flows [Mushotzky et al. 1981], but not observed …
formation in groups [Merritt 1985, Coziol et al 2008]
primordial formation (before clusters), but how?
Hydra Cluster cD
A496 Cluster cD
Perseus Cluster cD
Environmental effects and segregation
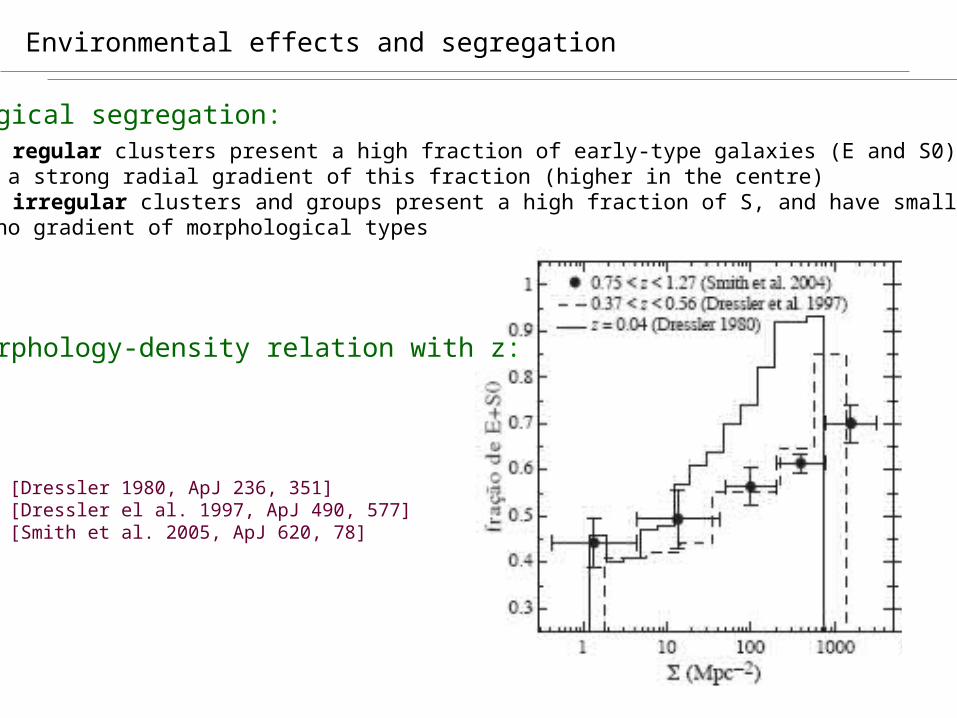
Morphological segregation: rich and regular clusters present a high fraction of early-type galaxies (E and S0), and a strong radial gradient of this fraction (higher in the centre) poor and irregular clusters and groups present a high fraction of S, and have small or no gradient of morphological types
[Dressler 1980, ApJ 236, 351][Dressler el al. 1997, ApJ 490, 577][Smith et al. 2005, ApJ 620, 78]
Morphology-density relation with z:
Environmental effects and segregation
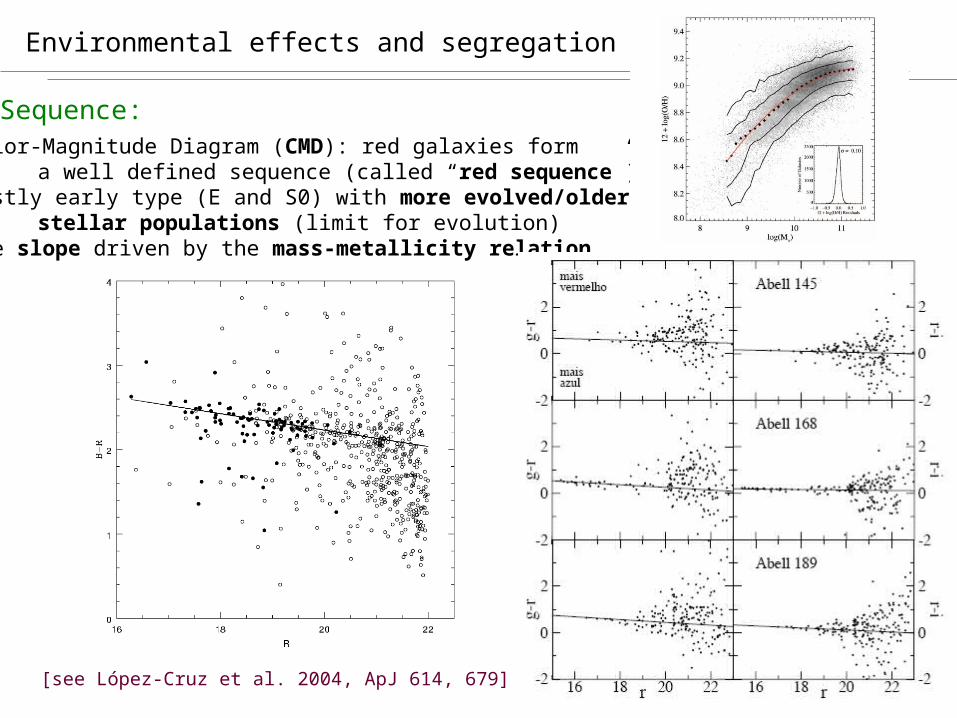
Red Sequence: Color-Magnitude Diagram (CMD): red galaxies form a well defined sequence (called “red sequence”) mostly early type (E and S0) with more evolved/older stellar populations (limit for evolution) the slope driven by the mass-metallicity relation
[see López-Cruz et al. 2004, ApJ 614, 679]
Environmental effects and segregation
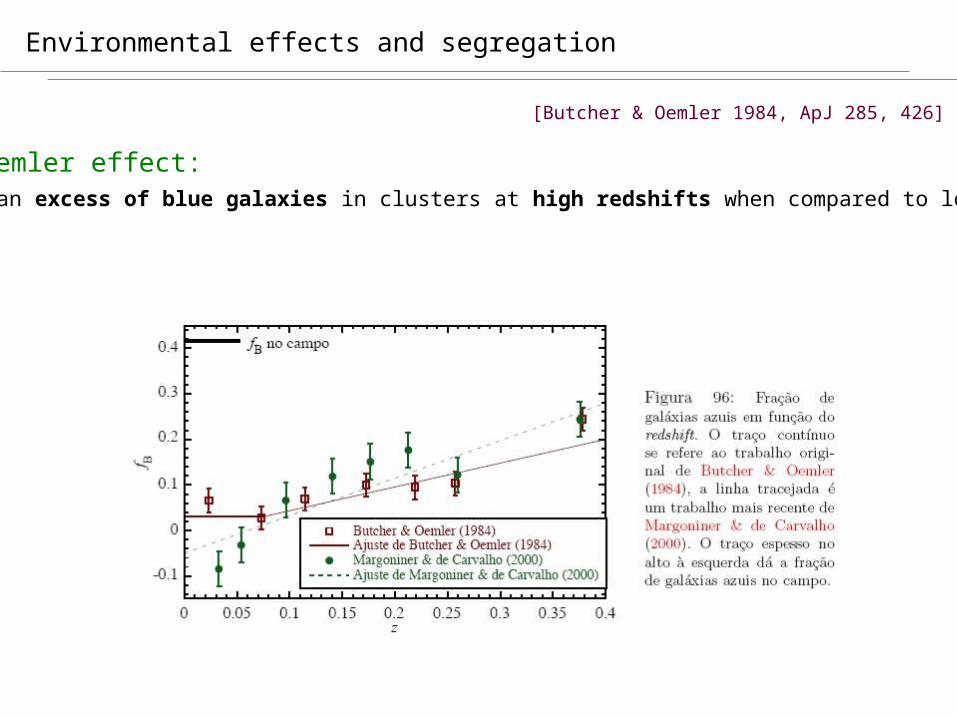
Butcher-Oemler effect: there is an excess of blue galaxies in clusters at high redshifts when compared to local clusters
[Butcher & Oemler 1984, ApJ 285, 426]
Environmental effects and segregation
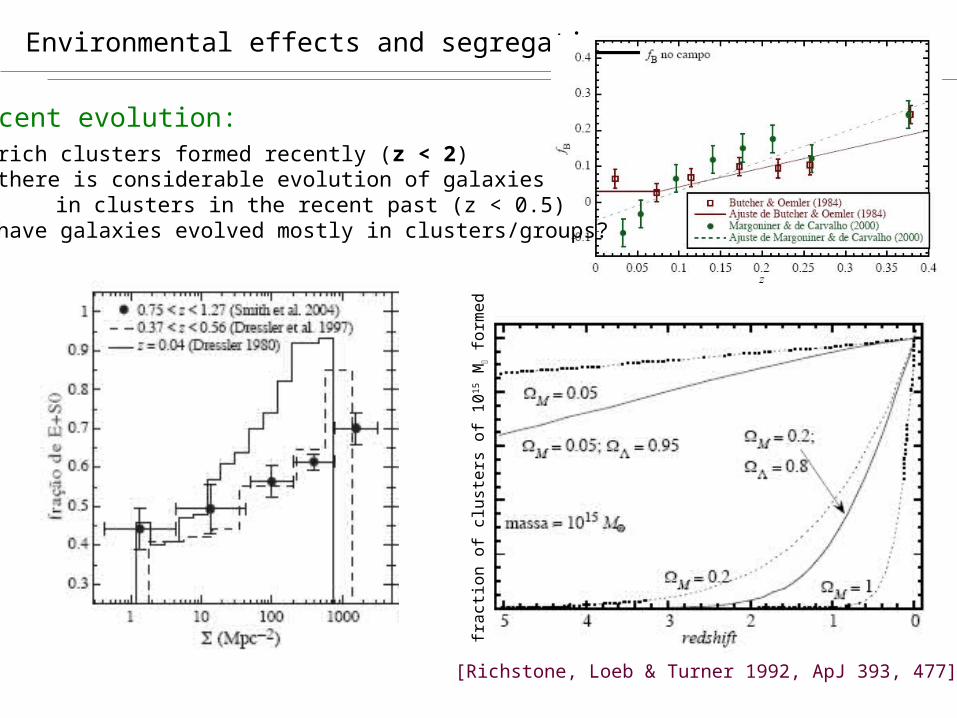
Recent evolution: rich clusters formed recently (z < 2) there is considerable evolution of galaxies in clusters in the recent past (z < 0.5) have galaxies evolved mostly in clusters/groups?
[Richstone, Loeb & Turner 1992, ApJ 393, 477]
fra
ctio
n o
f cl
ust
ers
of
10
15 M
fo
rme
d
Environmental effects and segregation
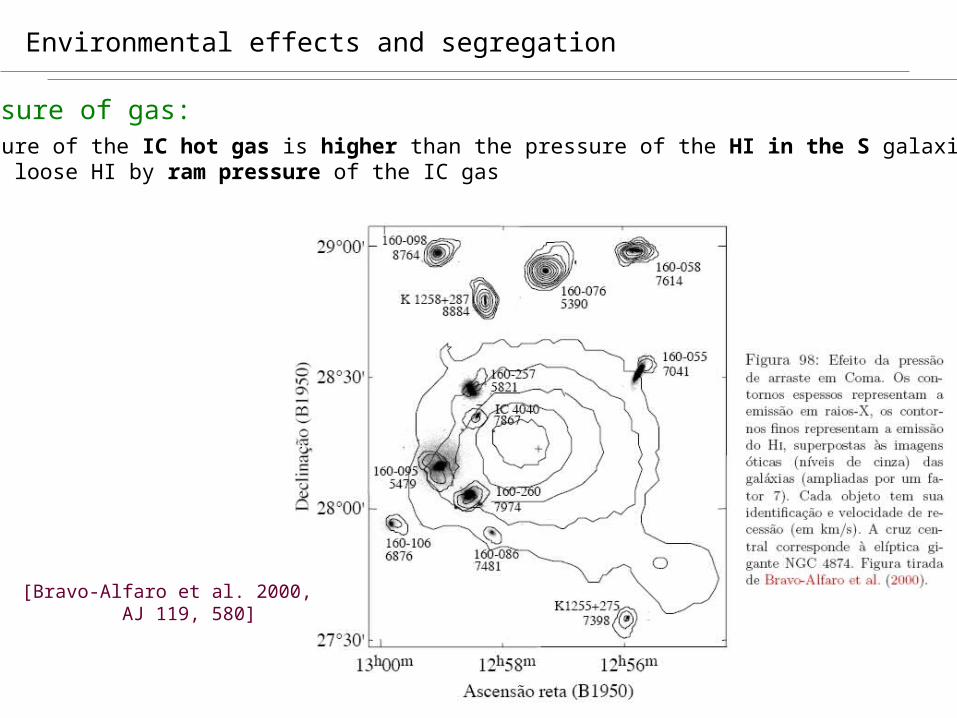
Ram pressure of gas: the pressure of the IC hot gas is higher than the pressure of the HI in the S galaxies so, S can loose HI by ram pressure of the IC gas
[Bravo-Alfaro et al. 2000, AJ 119, 580]
References
Papers: Bautz & Morgan 1970, ApJ 162, L149 Rood & Sastry 1971, PASP 83, 313 Ostriker & Tremaine 1975, ApJ 202, L113 Mushotzky et al. 1981, ApJ 244, L47 Hickson 1982, ApJ 255, 382 Merritt 1984, ApJ 276, 26 Merritt 1985, ApJ 289, 18 Prandoni, Iovino & MacGillivray 1994, AJ 107, 1235 Trasarti-Battistoni 1998, A&AS 130, 341 White et al. 1999, AJ 118, 2014 Ramella et al. 1999, A&A 342, 1 Tucker et al. 2000, ApJS 130, 237 Ramella et al. 2002, AJ 123, 2976 Eke et al. 2004, MNRAS 348, 866 Miller et al. 2005, AJ 130, 968 Crook et al. 2007, ApJ 655, 790 Coziol et al. 2008, submitted to AJ Bravo-Alfaro et al. 2008, in preparation