Embed Size (px)
Citation preview
ASX Announcement 2015 First Half Results 25 August 2015
Highlights
Six months to 30 June 2015 2014 % change
Total production (mmboe) 14.32 5.37 +167%
Total sales (mmboe) 14.45 4.74 +205%
Total revenue (US$m) 863.8 510.0 +69%
Net profit after tax (US$m) 227.5 152.5 +49%
Operating cash flow (US$m) 516.8 255.4 +102%
Interim dividend (US cents/share) 6.0 2.0 +200%
• Net profit after tax for the first half of 2015 was US$227.5 million, 49% higher than in the first half of 2014 and the highest half-year profit in the Company’s history, despite materially weaker oil and gas prices.
• Total revenue increased 69% to US$863.8 million, driven by a more than three-fold increase in oil, condensate, gas and LNG sales, from 4.7 million barrels of oil equivalent (mmboe) to 14.5 mmboe, reflecting a full period of production and sales from the PNG LNG Project.
• Higher sales volumes were partly offset by sharply lower realised prices, of US$56.64 per barrel for oil and condensate compared to US$111.57 per barrel in the first half of 2014 and US$10.19 per mmBtu for LNG and gas compared to US$14.20 per mmBtu.
• Unit production costs fell 43%, from US$15.49 per boe to US$8.90 per boe, reflecting a higher proportion of low cost PNG LNG Project production, which operated at full capacity during the period and successful cost reduction initiatives in our operated oil operations. The cash operating margin remained strong, at 75%, which compares favourably to the Company’s peers.
• Net operating cash flow more than doubled to US$516.8 million, driven by the lift in sales revenues, with operating cash flow of US$35.76 per boe among the highest in the region.
• At 30 June 2015, the Company had total liquidity of US$1,593.0 million, comprising US$843 million in cash and US$750 million in undrawn corporate debt facilities.
• A 2015 interim unfranked dividend of six US cents per share was announced, compared to two US cents per share for the first half of 2014, payable on 29 September 2015.
Oil Search Limited Incorporated in Papua New Guinea ARBN 055 079 868
• During the first half, Oil Search embarked on a Business Optimisation Programme, which has identified a range of initiatives to further recalibrate the Company’s cost base and organisational structure, improving operating efficiencies and productivity across the business. These initiatives, along with other business improvement processes, will be rolled out over the second half of 2015. Oil Search will continue to pursue its attractive long-term growth projects to deliver superior returns, even in a sustained low oil price environment, utilising its platform of high quality assets and strong balance sheet.
Commenting on the 2015 first half results, Oil Search Managing Director, Peter Botten, said:
“Oil Search achieved a strong operational and financial start to 2015, reporting a near three-fold increase in production, a 69% increase in sales revenue and a 49% increase in net profit after tax, which was achieved despite significantly lower global oil and LNG prices in the first half of 2015. The Company is well placed to manage the current low oil price cycle, with close to US$1.6 billion of liquidity, a cash operating margin of 75%, very competitive production costs and a focused optimisation process underway, designed to drive costs down further and deliver greater efficiencies across our business.”
Excellent performance from PNG LNG Project
“The PNG LNG Project performed ahead of expectations during the first half, producing LNG at an annualised rate of approximately 7.1 MTPA, above the nameplate capacity of 6.9 MTPA. As well as high levels of uptime at the LNG plant, this result was supported by strong upstream deliverability, with an excellent performance from the Hides wells, the Associated Gas fields and the Hides Gas Conditioning Plant.
To date, 119 cargoes of LNG have been loaded since the Project commenced production in the first half of 2014. All four of our contract customers are taking their full contractual volumes, as well as more than 85% of available spot cargoes, highlighting the strong acceptance that has been achieved by the Project in the marketplace.
A key focus by the operator is to continue to optimise production activities and review potential debottlenecking opportunities. Recent performance indicates that LNG production could increase further, which would be highly value-accretive for Oil Search and our co-venturers.”
Progress on LNG expansion opportunities in PNG
“Key events for Oil Search during the first half included the early appraisal results from the Antelope drilling campaign and agreement by the PRL 15 Joint Venture, with endorsement from the PNG State and Gulf Province governments, of the site locations for the proposed Papua LNG project development, which will be underpinned by the Elk-Antelope gas fields. Initial appraisal and testing activities have been encouraging and though further appraisal work remains, should the forthcoming drilling programme prove successful, we hope to enter Front End Engineering and Design on this globally competitive project during 2016.
In addition, a major step forward was made on the potential expansion of the PNG LNG Project, with the signing of a Memorandum of Understanding between ExxonMobil PNG Limited and the PNG Government early in the year. This agreement sets out a schedule for the proposed development of the P’nyang gas field, to support the provision of gas for domestic use and for PNG LNG Project expansion, including a potential
Oil Search 2015 First Half Results – 25 August 2015 www.oilsearch.com 2
third train. Preparatory works for the P’nyang South 2 appraisal well, in the south-east of the structure, are currently underway. The well, which is targeted to spud in the first half of 2016, is designed to help further constrain the 1C and 2C resources in the field, to support financing and marketing discussions. Engagement with the PNG Government on the formal award of a Petroleum Development Licence (PDL) is presently underway. Once the PDL has been awarded, the intention is to integrate P’nyang into the PNG LNG Project.
We support ExxonMobil’s view, expressed in its recent second quarter 2015 earnings call, that an expansion of the PNG LNG Project is “very well positioned to compete” in the current global environment. A potential third train would benefit from the foundation Project’s successful delivery and strong operating performance to date, a competitive cost structure plus stable and transparent fiscal terms. In addition, the operator has captured a range of learnings from the foundation development that will help maximise future returns.”
Interim dividend payment in line with pay-out ratio guidance range
“The Board has approved the payment of an interim unfranked dividend of six US cents per share, compared to the 2014 interim dividend of two US cents per share. This represents a dividend payout ratio of 40%, consistent with the Board’s dividend policy of distributing between 35% and 50% of core profit, with remaining earnings being reinvested into our high-returning production activities and attractive growth projects.
See Appendix 3A.1 – Notification of Dividend/Distribution announcement for more information on the dividend payment.
Safety performance
“Safety continues to be a key priority for Oil Search across all operations.
During the first half of 2015, Oil Search recorded a Total Recordable Incident Rate (TRIR) of 1.94 per million hours worked. This was a slight improvement on our 2014 TRIR of 1.97 per million hours worked, which ranked Oil Search fifth best among the ASX 100 companies in 20141. The Company incurred no lost time injuries during the first half.
The Company’s High Potential Incident Frequency, defined as the number of incidents or near misses per million hours worked that could have potentially resulted in one or more fatalities, has also significantly improved, declining from 0.63 in 2014 to 0.32 per million hours worked in the first half of 2015.
Implementation of a multi-year Process Safety Improvement Plan continued during the first half of 2015, which has resulted in a significant improvement in the stability of operations achieved at the Central Processing Facility at Kutubu.”
Looking forward to the second half of 2015 and beyond, Mr Botten said:
“We have now been operating for some nine months in the new, lower oil and gas price environment. While there are varying views in the market on how long lower prices will prevail, we continue to believe it is prudent to plan for an extended period of oil prices at or around current levels. Oil Search is fortunate to be well placed financially, having production assets that are highly profitable at these oil and gas price levels and a strong balance sheet and liquidity. Nonetheless, we have an ongoing focus on careful capital management, to ensure our current commitments and growth opportunities can be funded.”
1 Safety Spotlight: ASX 100 Companies & More, Citi, 13 July 2015 Oil Search 2015 First Half Results – 25 August 2015 www.oilsearch.com 3
2015 Business Optimisation Programme Outcomes
“In May, we commenced a Business Optimisation Programme, an holistic review of all aspects of our business, aimed at ensuring the Company can continue to deliver superior returns to its shareholders in the current oil price environment, in a socially responsible way. The review has looked at how we can improve our internal processes, make better use of our resources and take advantage of the present business climate to recalibrate our cost base. In addition, we are seeking to improve our production performance and ensure we have appropriate resourcing in place to continue to pursue our growth initiatives. This can be done without compromising our safety performance. Specific areas of focus have included the following:
• Production: Enhancing production performance by reducing unplanned downtime, improving our planning processes and productivity.
• Right-sizing: Ensuring that Oil Search has the correct organisational structure and skill sets to deliver our priority projects and that our corporate cost base is suitable for the current oil price environment.
• Operating efficiency: Improving efficiencies across all areas, including optimising our supply chain and procurement activities and improving drilling performance, through new technologies and innovation in rig and partnering strategies.
• Capital discipline: Prioritising work programmes, with a focus on value-adding activities that will provide acceptable returns at the current oil price.
A range of initiatives identified by the review will be progressively rolled out over the second half of 2015 and into 2016. Some areas of our business, such as investment in LNG growth and PNG exploration, which we regard as priority activities to drive long-term growth, will be bolstered, while other areas will see a reduced focus. At the same time, recognising that our highest return growth opportunities are within PNG, we have used this opportunity to make further progress on Oil Search’s localisation and diversity objectives. We will continue to build the capability of our PNG workforce and will maintain our work, in partnership with the PNG Government, on projects that benefit all PNG citizens and help promote a stable operating environment.
The initiatives are targeting a 15 – 20% reduction in our controllable operating and capital unit costs from 2016 onwards. We are aiming for savings of between US$2.50 and US$3.50 per boe for Oil Search-operated oil and gas production, which were just under US$16 per boe in the first half of 2015. Good progress towards this target is already being made – negotiations with our major suppliers have resulted in unit cost reductions of between 10% and 25%, with more to come over the second half. In addition, through improved planning and reduced downtime, we are targeting to increase our high-margin operated oil production by approximately 5% over current forecasts in 2016/2017 onwards. Restructuring costs of approximately US$10 million in 2015 are captured within our existing 2015 cost guidance.
Implementation of these identified initiatives will make Oil Search a much leaner and more efficient organisation, enhance value-adding capacity in the Company, allow us to continue to pursue our key growth opportunities and deliver superior returns, even in a sustained low oil price environment. Our programme of driving further efficiencies and innovation will continue into 2016.”
Revitalised exploration acreage and drilling programmes
“Oil Search recognises that it is essential to continue to invest in exploration through the oil price cycle, to ensure an ongoing pipeline of future growth opportunities. A component of the Business Optimisation studies has focused on maximising the financial returns from our exploration and appraisal activities, through the use of new technology and different drilling rig and partnering strategies. Oil Search is presently in the process of optimising its exploration portfolio and programmes. Follow-up work from the 2014 Strategic Review has
Oil Search 2015 First Half Results – 25 August 2015 www.oilsearch.com 4
confirmed that PNG is highly prospective for further major gas accumulations, in both established fairways and in new, frontier areas. A systematic exploration and appraisal programme is planned over the next 18 months, which will target 6-7tcf of mean gross prospective resources.”
Guidance for the 2015 full year
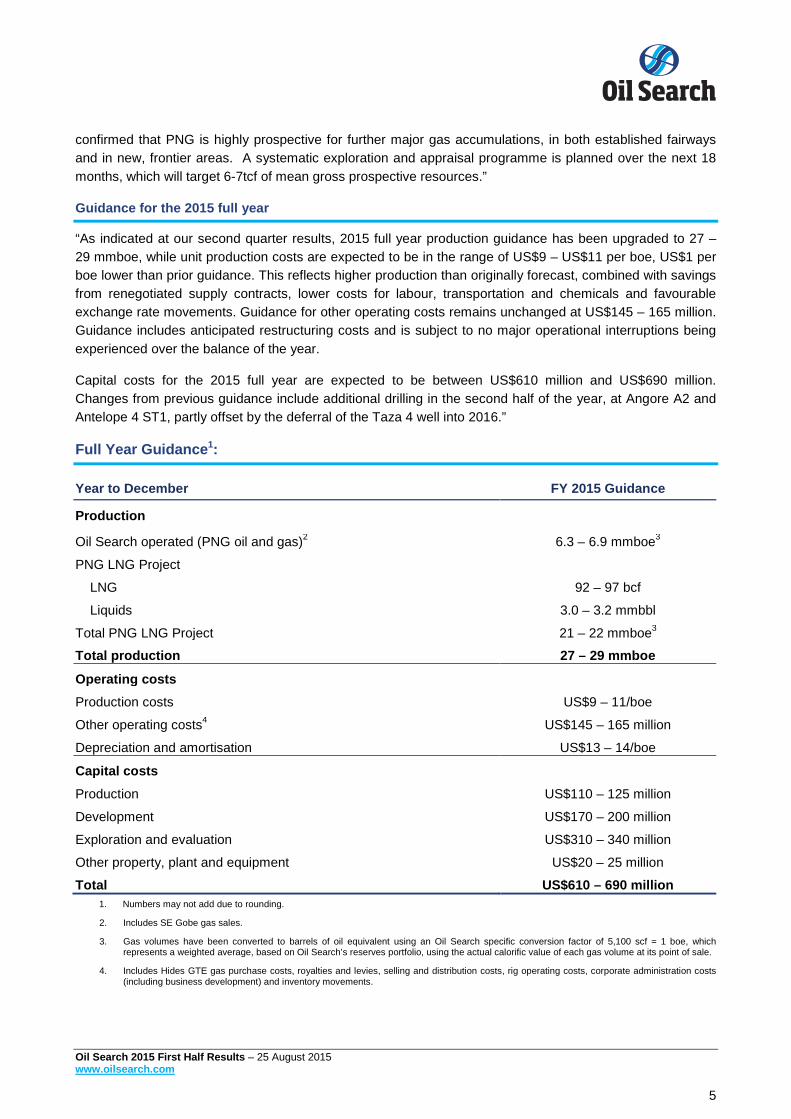
“As indicated at our second quarter results, 2015 full year production guidance has been upgraded to 27 – 29 mmboe, while unit production costs are expected to be in the range of US$9 – US$11 per boe, US$1 per boe lower than prior guidance. This reflects higher production than originally forecast, combined with savings from renegotiated supply contracts, lower costs for labour, transportation and chemicals and favourable exchange rate movements. Guidance for other operating costs remains unchanged at US$145 – 165 million. Guidance includes anticipated restructuring costs and is subject to no major operational interruptions being experienced over the balance of the year.
Capital costs for the 2015 full year are expected to be between US$610 million and US$690 million. Changes from previous guidance include additional drilling in the second half of the year, at Angore A2 and Antelope 4 ST1, partly offset by the deferral of the Taza 4 well into 2016.”
Full Year Guidance1:
Year to December FY 2015 Guidance
Production
Oil Search operated (PNG oil and gas)2 6.3 – 6.9 mmboe3
PNG LNG Project
LNG 92 – 97 bcf
Liquids 3.0 – 3.2 mmbbl
Total PNG LNG Project 21 – 22 mmboe3
Total production 27 – 29 mmboe
Operating costs
Production costs US$9 – 11/boe
Other operating costs4 US$145 – 165 million Depreciation and amortisation US$13 – 14/boe
Capital costs
Production US$110 – 125 million
Development US$170 – 200 million
Exploration and evaluation US$310 – 340 million
Other property, plant and equipment US$20 – 25 million
Total US$610 – 690 million 1. Numbers may not add due to rounding.
2. Includes SE Gobe gas sales.
3. Gas volumes have been converted to barrels of oil equivalent using an Oil Search specific conversion factor of 5,100 scf = 1 boe, which represents a weighted average, based on Oil Search’s reserves portfolio, using the actual calorific value of each gas volume at its point of sale.
4. Includes Hides GTE gas purchase costs, royalties and levies, selling and distribution costs, rig operating costs, corporate administration costs (including business development) and inventory movements.
Oil Search 2015 First Half Results – 25 August 2015 www.oilsearch.com 5
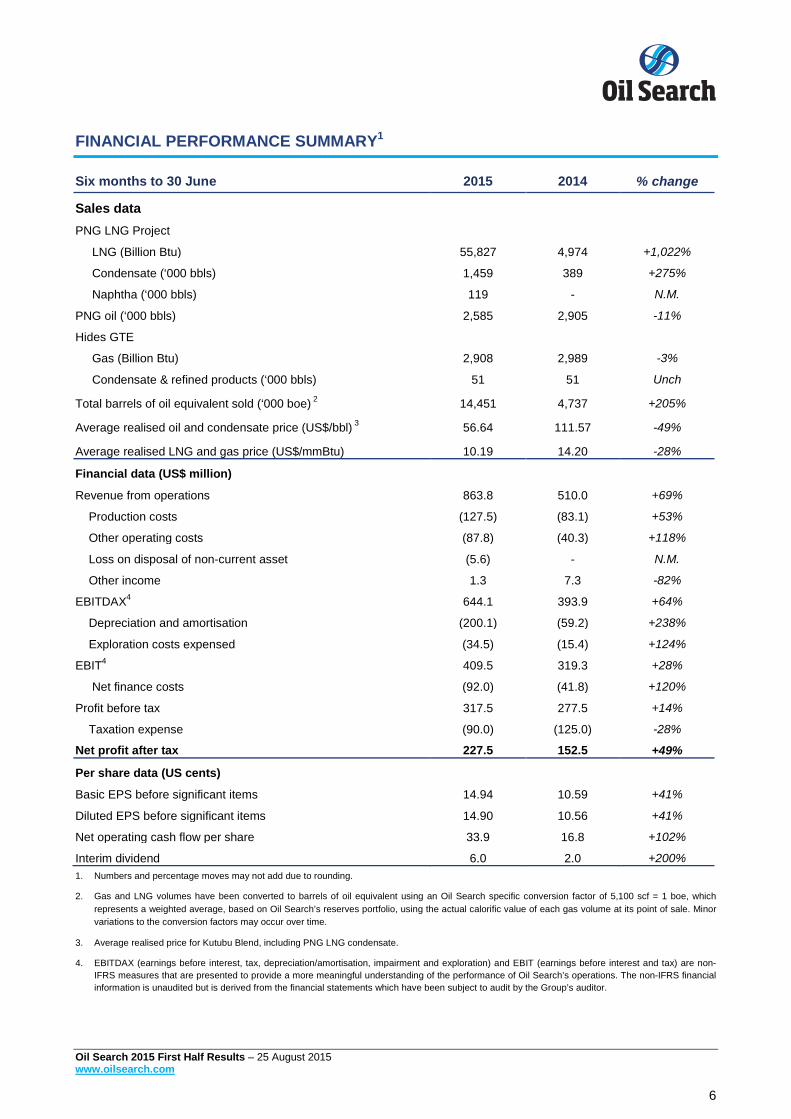
FINANCIAL PERFORMANCE SUMMARY1
Six months to 30 June 2015 2014 % change
Sales data PNG LNG Project
LNG (Billion Btu) 55,827 4,974 +1,022%
Condensate (‘000 bbls) 1,459 389 +275%
Naphtha (‘000 bbls) 119 - N.M.
PNG oil (‘000 bbls) 2,585 2,905 -11%
Hides GTE
Gas (Billion Btu) 2,908 2,989 -3%
Condensate & refined products (‘000 bbls) 51 51 Unch
Total barrels of oil equivalent sold (‘000 boe) 2 14,451 4,737 +205%
Average realised oil and condensate price (US$/bbl) 3 56.64 111.57 -49%
Average realised LNG and gas price (US$/mmBtu) 10.19 14.20 -28%
Financial data (US$ million)
Revenue from operations 863.8 510.0 +69%
Production costs (127.5) (83.1) +53%
Other operating costs (87.8) (40.3) +118%
Loss on disposal of non-current asset (5.6) - N.M.
Other income 1.3 7.3 -82%
EBITDAX4 644.1 393.9 +64%
Depreciation and amortisation (200.1) (59.2) +238%
Exploration costs expensed (34.5) (15.4) +124%
EBIT4 409.5 319.3 +28%
Net finance costs (92.0) (41.8) +120%
Profit before tax 317.5 277.5 +14%
Taxation expense (90.0) (125.0) -28%
Net profit after tax 227.5 152.5 +49%
Per share data (US cents)
Basic EPS before significant items 14.94 10.59 +41%
Diluted EPS before significant items 14.90 10.56 +41%
Net operating cash flow per share 33.9 16.8 +102%
Interim dividend 6.0 2.0 +200% 1. Numbers and percentage moves may not add due to rounding.
2. Gas and LNG volumes have been converted to barrels of oil equivalent using an Oil Search specific conversion factor of 5,100 scf = 1 boe, which represents a weighted average, based on Oil Search’s reserves portfolio, using the actual calorific value of each gas volume at its point of sale. Minor variations to the conversion factors may occur over time.
3. Average realised price for Kutubu Blend, including PNG LNG condensate.
4. EBITDAX (earnings before interest, tax, depreciation/amortisation, impairment and exploration) and EBIT (earnings before interest and tax) are non-IFRS measures that are presented to provide a more meaningful understanding of the performance of Oil Search’s operations. The non-IFRS financial information is unaudited but is derived from the financial statements which have been subject to audit by the Group’s auditor.
Oil Search 2015 First Half Results – 25 August 2015 www.oilsearch.com 6
Oil and gas production and sales
Total production in the first half of 2015 was 14.32 million barrels of oil equivalent (mmboe), almost triple the production of 5.37 mmboe in the previous corresponding period and the highest half year production in the Company’s history. The increase was driven by the PNG LNG Project, which consistently performed at or above nameplate capacity during the period, contributing 10.94 mmboe (47.7 bcf LNG and 1.59 mmboe liquids), compared to 1.87 mmboe (7.5 bcf LNG and 0.40 mmboe liquids) in the first half of 2014 during the Project’s ramp-up phase. Operated oil and gas production in PNG totalled 3.38 mmboe (3.50 mmboe in the previous corresponding period), underpinned by strong contributions from the Kutubu and Moran fields.
Total sales volumes for the six months to 30 June 2015 were 14.45 mmboe, with 52 cargoes of LNG and 15.5 cargoes of Kutubu Blend sold in the first half of 2015 compared to 5 cargoes of LNG and 8.5 cargoes of Kutubu Blend in the same period of 2014.
Realised prices
Oil Search realised an average oil and condensate price of US$56.64 per barrel in the first half of 2015, 49% lower than the price achieved in the first half of 2014 of US$111.57 per barrel, reflecting the global downturn in oil prices. The average realised LNG and gas price during the period was US$10.19 per mmBtu compared to US$14.20 per mmBtu in the same period of 2014. No hedging was undertaken during the half.
Operating revenue
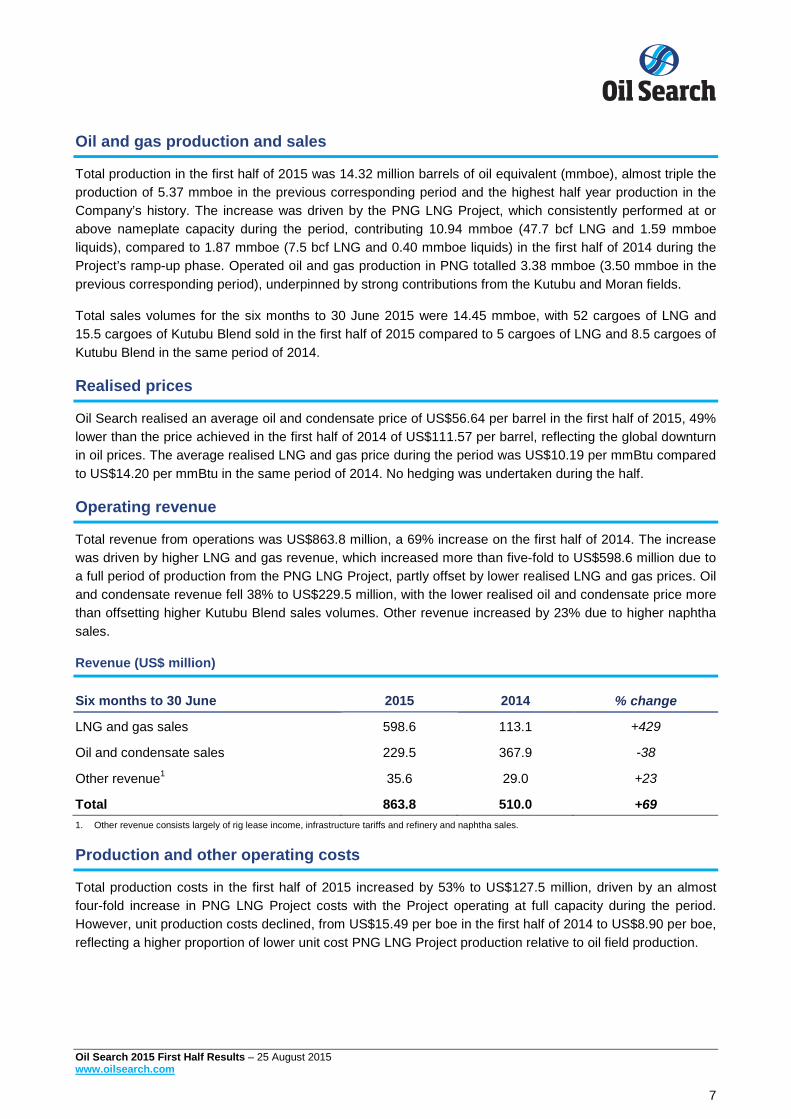
Total revenue from operations was US$863.8 million, a 69% increase on the first half of 2014. The increase was driven by higher LNG and gas revenue, which increased more than five-fold to US$598.6 million due to a full period of production from the PNG LNG Project, partly offset by lower realised LNG and gas prices. Oil and condensate revenue fell 38% to US$229.5 million, with the lower realised oil and condensate price more than offsetting higher Kutubu Blend sales volumes. Other revenue increased by 23% due to higher naphtha sales.
Revenue (US$ million)
Six months to 30 June 2015 2014 % change
LNG and gas sales 598.6 113.1 +429
Oil and condensate sales 229.5 367.9 -38
Other revenue1 35.6 29.0 +23
Total 863.8 510.0 +69 1. Other revenue consists largely of rig lease income, infrastructure tariffs and refinery and naphtha sales.
Production and other operating costs
Total production costs in the first half of 2015 increased by 53% to US$127.5 million, driven by an almost four-fold increase in PNG LNG Project costs with the Project operating at full capacity during the period. However, unit production costs declined, from US$15.49 per boe in the first half of 2014 to US$8.90 per boe, reflecting a higher proportion of lower unit cost PNG LNG Project production relative to oil field production.
Oil Search 2015 First Half Results – 25 August 2015 www.oilsearch.com 7
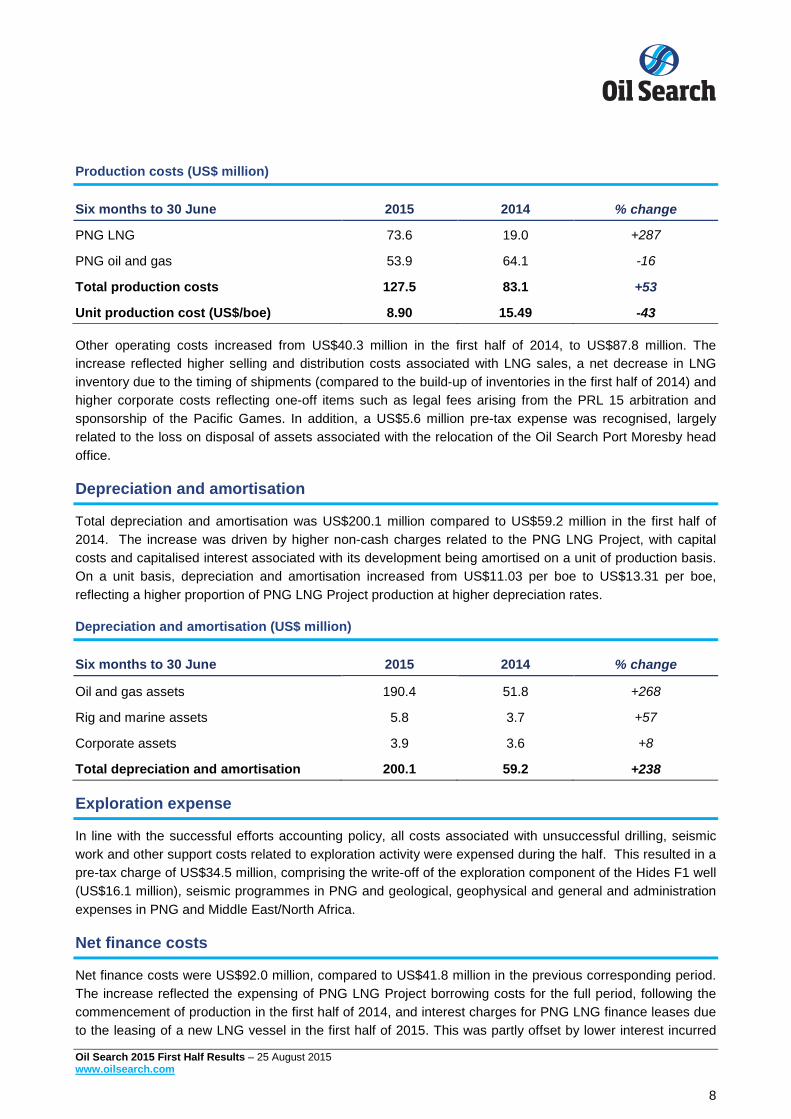
Production costs (US$ million)
Six months to 30 June 2015 2014 % change
PNG LNG 73.6 19.0 +287
PNG oil and gas 53.9 64.1 -16
Total production costs 127.5 83.1 +53
Unit production cost (US$/boe) 8.90 15.49 -43
Other operating costs increased from US$40.3 million in the first half of 2014, to US$87.8 million. The increase reflected higher selling and distribution costs associated with LNG sales, a net decrease in LNG inventory due to the timing of shipments (compared to the build-up of inventories in the first half of 2014) and higher corporate costs reflecting one-off items such as legal fees arising from the PRL 15 arbitration and sponsorship of the Pacific Games. In addition, a US$5.6 million pre-tax expense was recognised, largely related to the loss on disposal of assets associated with the relocation of the Oil Search Port Moresby head office.
Depreciation and amortisation
Total depreciation and amortisation was US$200.1 million compared to US$59.2 million in the first half of 2014. The increase was driven by higher non-cash charges related to the PNG LNG Project, with capital costs and capitalised interest associated with its development being amortised on a unit of production basis. On a unit basis, depreciation and amortisation increased from US$11.03 per boe to US$13.31 per boe, reflecting a higher proportion of PNG LNG Project production at higher depreciation rates.
Depreciation and amortisation (US$ million)
Six months to 30 June 2015 2014 % change
Oil and gas assets 190.4 51.8 +268
Rig and marine assets 5.8 3.7 +57
Corporate assets 3.9 3.6 +8
Total depreciation and amortisation 200.1 59.2 +238
Exploration expense
In line with the successful efforts accounting policy, all costs associated with unsuccessful drilling, seismic work and other support costs related to exploration activity were expensed during the half. This resulted in a pre-tax charge of US$34.5 million, comprising the write-off of the exploration component of the Hides F1 well (US$16.1 million), seismic programmes in PNG and geological, geophysical and general and administration expenses in PNG and Middle East/North Africa.
Net finance costs
Net finance costs were US$92.0 million, compared to US$41.8 million in the previous corresponding period. The increase reflected the expensing of PNG LNG Project borrowing costs for the full period, following the commencement of production in the first half of 2014, and interest charges for PNG LNG finance leases due to the leasing of a new LNG vessel in the first half of 2015. This was partly offset by lower interest incurred
Oil Search 2015 First Half Results – 25 August 2015 www.oilsearch.com 8
on the corporate facilities, with reduced debt outstanding during the period and higher interest income reflecting an increase in cash invested.
Taxation expense
Tax expense on statutory profit was US$90.0 million, compared to US$125.0 million in the first half of 2014. The decrease in tax expense reflected a higher proportion of Company revenue derived from LNG, which is taxed at 30%, compared to the statutory tax rate for oil earnings in PNG of 50%. Further, the conversion of the Kutubu and Gobe Main fields to a gas designation effective from 30 June 2014 and 30 September 2014, respectively, resulted in the income from those projects being taxed at 30%.
The effective tax rate on statutory profit was 28.3% (45.1% in the first half of 2014), lower than the 30% statutory tax rate for gas in PNG, due to one-off adjustments.
Cash flows
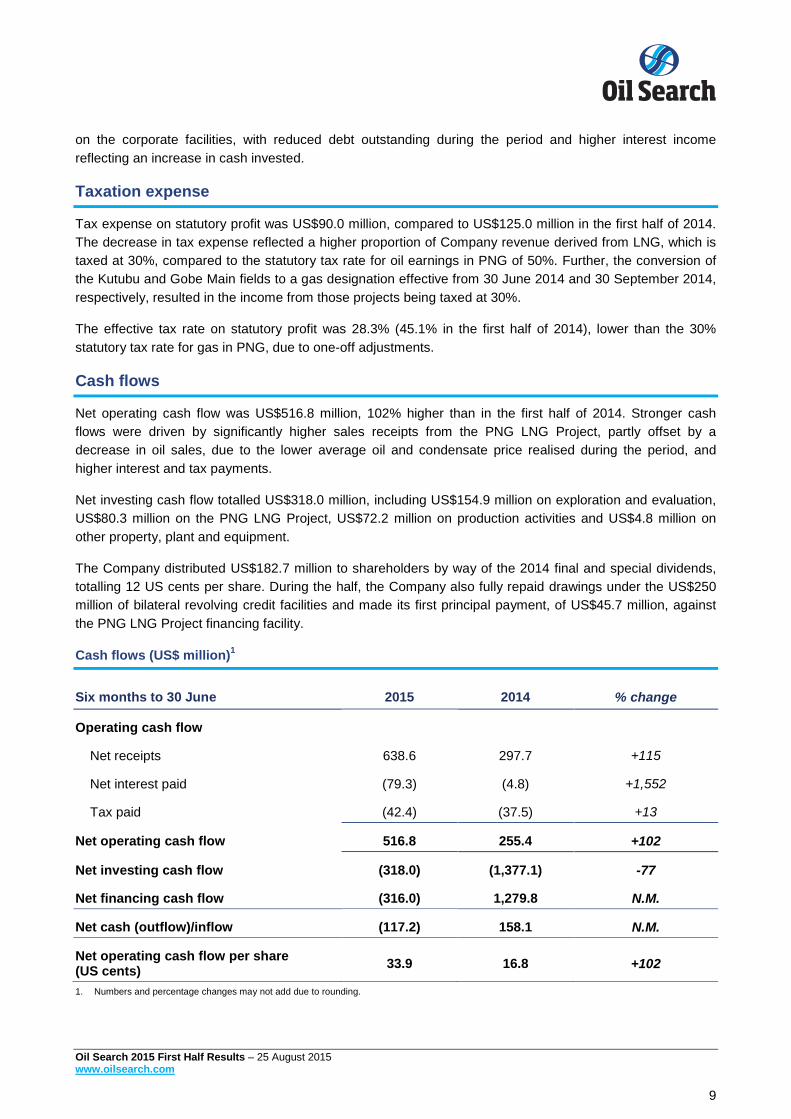
Net operating cash flow was US$516.8 million, 102% higher than in the first half of 2014. Stronger cash flows were driven by significantly higher sales receipts from the PNG LNG Project, partly offset by a decrease in oil sales, due to the lower average oil and condensate price realised during the period, and higher interest and tax payments.
Net investing cash flow totalled US$318.0 million, including US$154.9 million on exploration and evaluation, US$80.3 million on the PNG LNG Project, US$72.2 million on production activities and US$4.8 million on other property, plant and equipment.
The Company distributed US$182.7 million to shareholders by way of the 2014 final and special dividends, totalling 12 US cents per share. During the half, the Company also fully repaid drawings under the US$250 million of bilateral revolving credit facilities and made its first principal payment, of US$45.7 million, against the PNG LNG Project financing facility.
Cash flows (US$ million)1
Six months to 30 June 2015 2014 % change
Operating cash flow
Net receipts 638.6 297.7 +115
Net interest paid (79.3) (4.8) +1,552
Tax paid (42.4) (37.5) +13
Net operating cash flow 516.8 255.4 +102
Net investing cash flow (318.0) (1,377.1) -77
Net financing cash flow (316.0) 1,279.8 N.M.
Net cash (outflow)/inflow (117.2) 158.1 N.M.
Net operating cash flow per share (US cents) 33.9 16.8 +102
1. Numbers and percentage changes may not add due to rounding.
Oil Search 2015 First Half Results – 25 August 2015 www.oilsearch.com 9
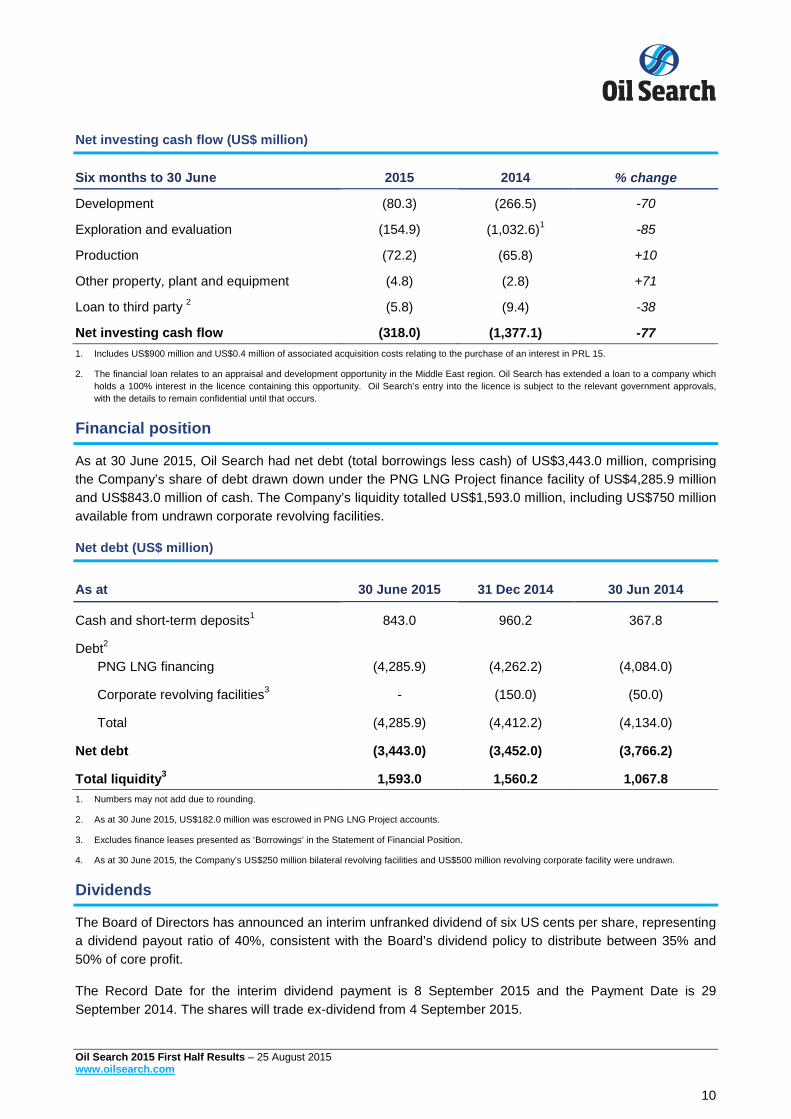
Net investing cash flow (US$ million)
Six months to 30 June 2015 2014 % change
Development (80.3) (266.5) -70
Exploration and evaluation (154.9) (1,032.6)1 -85
Production (72.2) (65.8) +10
Other property, plant and equipment (4.8) (2.8) +71
Loan to third party 2 (5.8) (9.4) -38
Net investing cash flow (318.0) (1,377.1) -77 1. Includes US$900 million and US$0.4 million of associated acquisition costs relating to the purchase of an interest in PRL 15.
2. The financial loan relates to an appraisal and development opportunity in the Middle East region. Oil Search has extended a loan to a company which holds a 100% interest in the licence containing this opportunity. Oil Search’s entry into the licence is subject to the relevant government approvals, with the details to remain confidential until that occurs.
Financial position
As at 30 June 2015, Oil Search had net debt (total borrowings less cash) of US$3,443.0 million, comprising the Company’s share of debt drawn down under the PNG LNG Project finance facility of US$4,285.9 million and US$843.0 million of cash. The Company’s liquidity totalled US$1,593.0 million, including US$750 million available from undrawn corporate revolving facilities.
Net debt (US$ million)
As at 30 June 2015 31 Dec 2014 30 Jun 2014
Cash and short-term deposits1 843.0 960.2 367.8
Debt2 PNG LNG financing
(4,285.9)
(4,262.2)
(4,084.0)
Corporate revolving facilities3 - (150.0) (50.0)
Total (4,285.9) (4,412.2) (4,134.0)
Net debt (3,443.0) (3,452.0) (3,766.2)
Total liquidity3 1,593.0 1,560.2 1,067.8 1. Numbers may not add due to rounding.
2. As at 30 June 2015, US$182.0 million was escrowed in PNG LNG Project accounts.
3. Excludes finance leases presented as ‘Borrowings’ in the Statement of Financial Position.
4. As at 30 June 2015, the Company’s US$250 million bilateral revolving facilities and US$500 million revolving corporate facility were undrawn.
Dividends
The Board of Directors has announced an interim unfranked dividend of six US cents per share, representing a dividend payout ratio of 40%, consistent with the Board’s dividend policy to distribute between 35% and 50% of core profit.
The Record Date for the interim dividend payment is 8 September 2015 and the Payment Date is 29 September 2014. The shares will trade ex-dividend from 4 September 2015.
Oil Search 2015 First Half Results – 25 August 2015 www.oilsearch.com 10
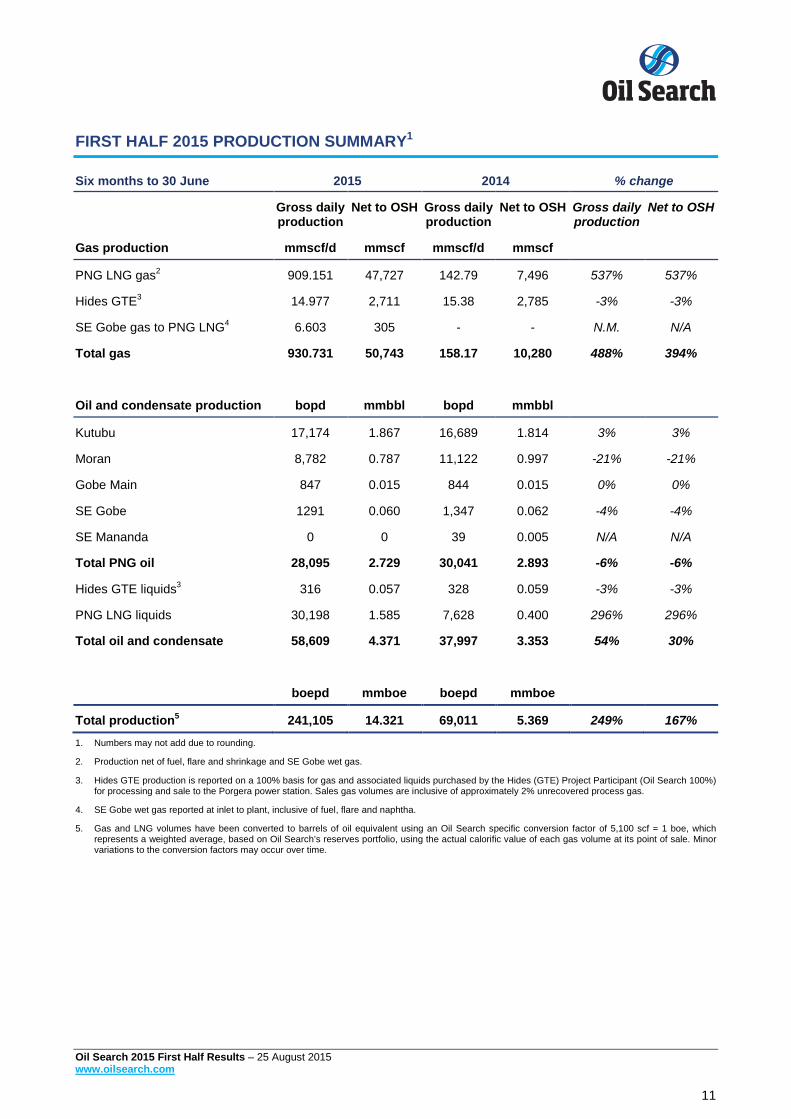
FIRST HALF 2015 PRODUCTION SUMMARY1
Six months to 30 June 2015 2014 % change
Gross daily production
Net to OSH Gross daily production
Net to OSH Gross daily production
Net to OSH
Gas production mmscf/d mmscf mmscf/d mmscf
PNG LNG gas2 909.151 47,727 142.79 7,496 537% 537%
Hides GTE3 14.977 2,711 15.38 2,785 -3% -3%
SE Gobe gas to PNG LNG4 6.603 305 - - N.M. N/A
Total gas 930.731 50,743 158.17 10,280 488% 394%
Oil and condensate production bopd mmbbl bopd mmbbl
Kutubu 17,174 1.867 16,689 1.814 3% 3%
Moran 8,782 0.787 11,122 0.997 -21% -21%
Gobe Main 847 0.015 844 0.015 0% 0%
SE Gobe 1291 0.060 1,347 0.062 -4% -4%
SE Mananda 0 0 39 0.005 N/A N/A
Total PNG oil 28,095 2.729 30,041 2.893 -6% -6%
Hides GTE liquids3 316 0.057 328 0.059 -3% -3%
PNG LNG liquids 30,198 1.585 7,628 0.400 296% 296%
Total oil and condensate 58,609 4.371 37,997 3.353 54% 30%
boepd mmboe boepd mmboe
Total production5 241,105 14.321 69,011 5.369 249% 167% 1. Numbers may not add due to rounding.
2. Production net of fuel, flare and shrinkage and SE Gobe wet gas.
3. Hides GTE production is reported on a 100% basis for gas and associated liquids purchased by the Hides (GTE) Project Participant (Oil Search 100%) for processing and sale to the Porgera power station. Sales gas volumes are inclusive of approximately 2% unrecovered process gas.
4. SE Gobe wet gas reported at inlet to plant, inclusive of fuel, flare and naphtha.
5. Gas and LNG volumes have been converted to barrels of oil equivalent using an Oil Search specific conversion factor of 5,100 scf = 1 boe, which represents a weighted average, based on Oil Search’s reserves portfolio, using the actual calorific value of each gas volume at its point of sale. Minor variations to the conversion factors may occur over time.
Oil Search 2015 First Half Results – 25 August 2015 www.oilsearch.com 11

Gas/LNG Glossary and Conversion Factors Used
Mmscf Million (106) standard cubic feet mmBtu Million (106) British thermal units Billion Btu Billion (109) British thermal units MTPA (LNG) Million tonnes per annum Boe Barrel of oil equivalent
1 mmscf LNG Approximately 1.13 billion Btu 1 boe Approximately 5,100 standard cubic feet 1 tonne LNG Approximately 52 mmBtu Note: Minor variations in conversion factors may occur over time, due to changes in gas composition.
PETER BOTTEN, CBE Managing Director 25 August 2015
For more information regarding this report, please contact:
Investors and Media Investors Ms Ann Diamant Ms Stephanie Chu Group Manager, Investor Relations Senior Investor Relations Advisor Tel: +612 8207 8440 Tel: +612 8207 8542 Mob: +61 407 483 128 Mob: +61 481 038 179
Presentation and Webcast
Oil Search will be holding a presentation for analysts and fund managers at 11.00 am AEDT today, 25 August 2015. The presentation will be webcast live over Oil Search’s website. To listen to the webcast, please log on to www.oilsearch.com. If you experience any technical difficulties, please call: +61 2 8280 6000.
The webcast will be available in archive form on the Oil Search website 2 – 3 hours after the completion of the presentation.
DISCLAIMER
This report contains some forward-looking statements which are subject to particular risks associated with the oil and gas industry. Actual outcomes could differ materially due to a range of operational, cost and revenue factors and uncertainties including oil and gas prices, changes in market demand for oil and gas, currency fluctuations, drilling results, field performance, the timing of well workovers and field development, reserves depletion and fiscal and other government issues and approvals.
Oil Search 2015 First Half Results – 25 August 2015 www.oilsearch.com 12
Oil Search Limited and its subsidiaries ARBN 055 079 868
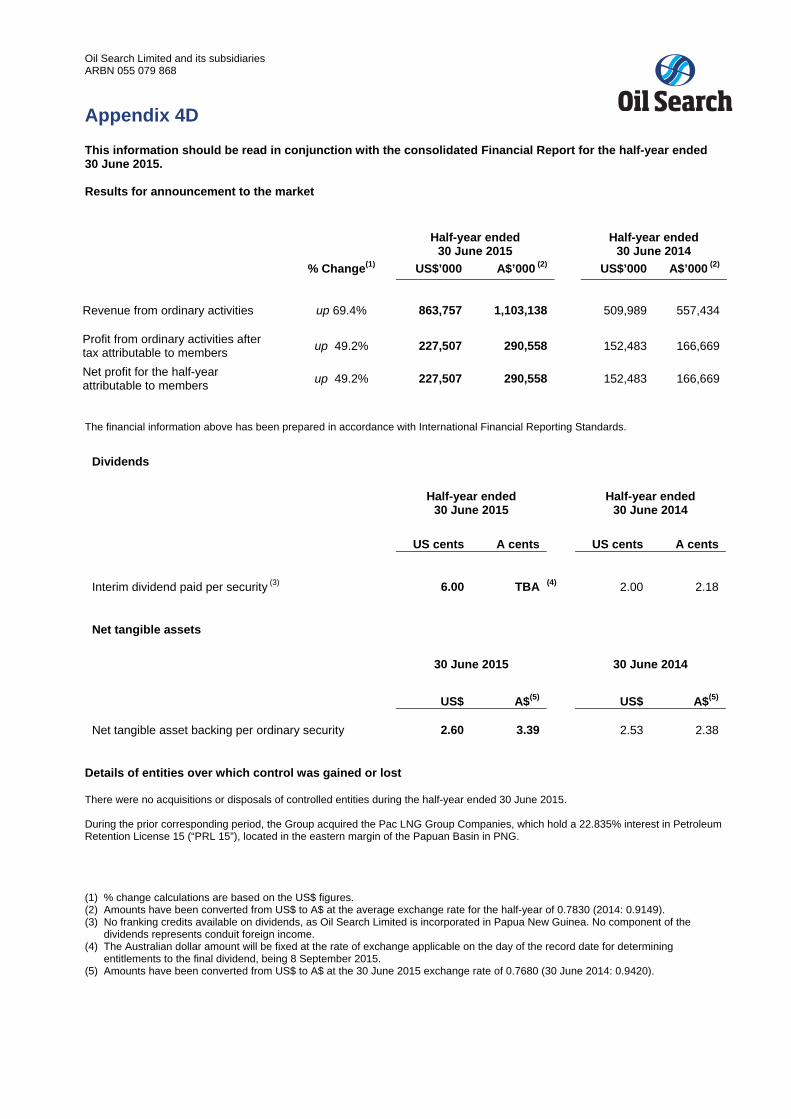
Appendix 4D
This information should be read in conjunction with the consolidated Financial Report for the half-year ended 30 June 2015. Results for announcement to the market
Half-year ended 30 June 2015 Half-year ended
30 June 2014 % Change(1) US$’000 A$’000 (2) US$’000 A$’000 (2)
Revenue from ordinary activities up 69.4% 863,757 1,103,138 509,989 557,434
Profit from ordinary activities after tax attributable to members up 49.2% 227,507 290,558 152,483 166,669
Net profit for the half-year attributable to members up 49.2% 227,507 290,558 152,483 166,669
The financial information above has been prepared in accordance with International Financial Reporting Standards.
Dividends
Half-year ended 30 June 2015
Half-year ended 30 June 2014
US cents A cents US cents A cents
Interim dividend paid per security (3) 6.00 TBA (4) 2.00 2.18
Net tangible assets
30 June 2015
30 June 2014
US$ A$(5) US$ A$(5)
Net tangible asset backing per ordinary security 2.60 3.39 2.53 2.38 Details of entities over which control was gained or lost There were no acquisitions or disposals of controlled entities during the half-year ended 30 June 2015. During the prior corresponding period, the Group acquired the Pac LNG Group Companies, which hold a 22.835% interest in Petroleum Retention License 15 (“PRL 15”), located in the eastern margin of the Papuan Basin in PNG. (1) % change calculations are based on the US$ figures. (2) Amounts have been converted from US$ to A$ at the average exchange rate for the half-year of 0.7830 (2014: 0.9149). (3) No franking credits available on dividends, as Oil Search Limited is incorporated in Papua New Guinea. No component of the
dividends represents conduit foreign income. (4) The Australian dollar amount will be fixed at the rate of exchange applicable on the day of the record date for determining
entitlements to the final dividend, being 8 September 2015. (5) Amounts have been converted from US$ to A$ at the 30 June 2015 exchange rate of 0.7680 (30 June 2014: 0.9420).
Oil Search Limited and its subsidiaries ARBN 055 079 868
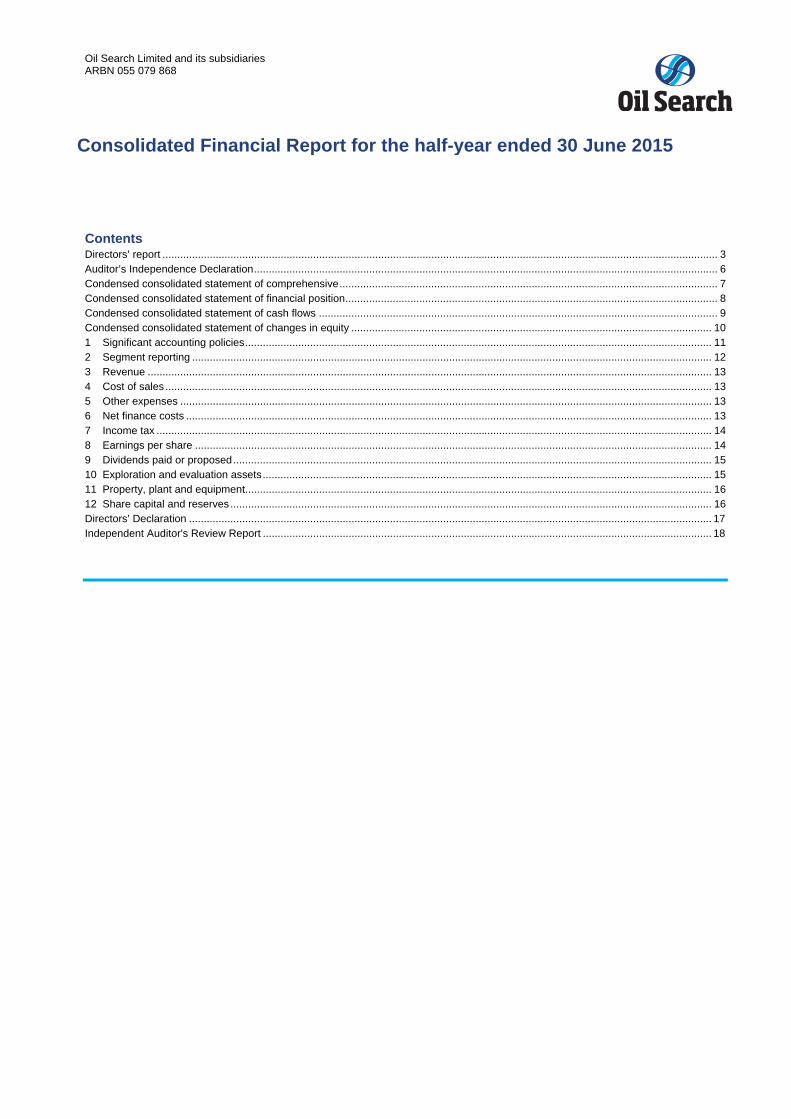
Contents Directors’ report ............................................................................................................................................................................................ 3 Auditor’s Independence Declaration ............................................................................................................................................................. 6 Condensed consolidated statement of comprehensive ................................................................................................................................ 7 Condensed consolidated statement of financial position .............................................................................................................................. 8 Condensed consolidated statement of cash flows ....................................................................................................................................... 9 Condensed consolidated statement of changes in equity .......................................................................................................................... 10 1 Significant accounting policies .............................................................................................................................................................. 11 2 Segment reporting ................................................................................................................................................................................ 12 3 Revenue ............................................................................................................................................................................................... 13 4 Cost of sales ......................................................................................................................................................................................... 13 5 Other expenses .................................................................................................................................................................................... 13 6 Net finance costs .................................................................................................................................................................................. 13 7 Income tax ............................................................................................................................................................................................ 14 8 Earnings per share ............................................................................................................................................................................... 14 9 Dividends paid or proposed .................................................................................................................................................................. 15 10 Exploration and evaluation assets ........................................................................................................................................................ 15 11 Property, plant and equipment.............................................................................................................................................................. 16 12 Share capital and reserves ................................................................................................................................................................... 16 Directors’ Declaration ................................................................................................................................................................................. 17 Independent Auditor's Review Report ........................................................................................................................................................ 18
Consolidated Financial Report for the half-year ended 30 June 2015
Oil Search Limited and its subsidiaries ARBN 055 079 868
3
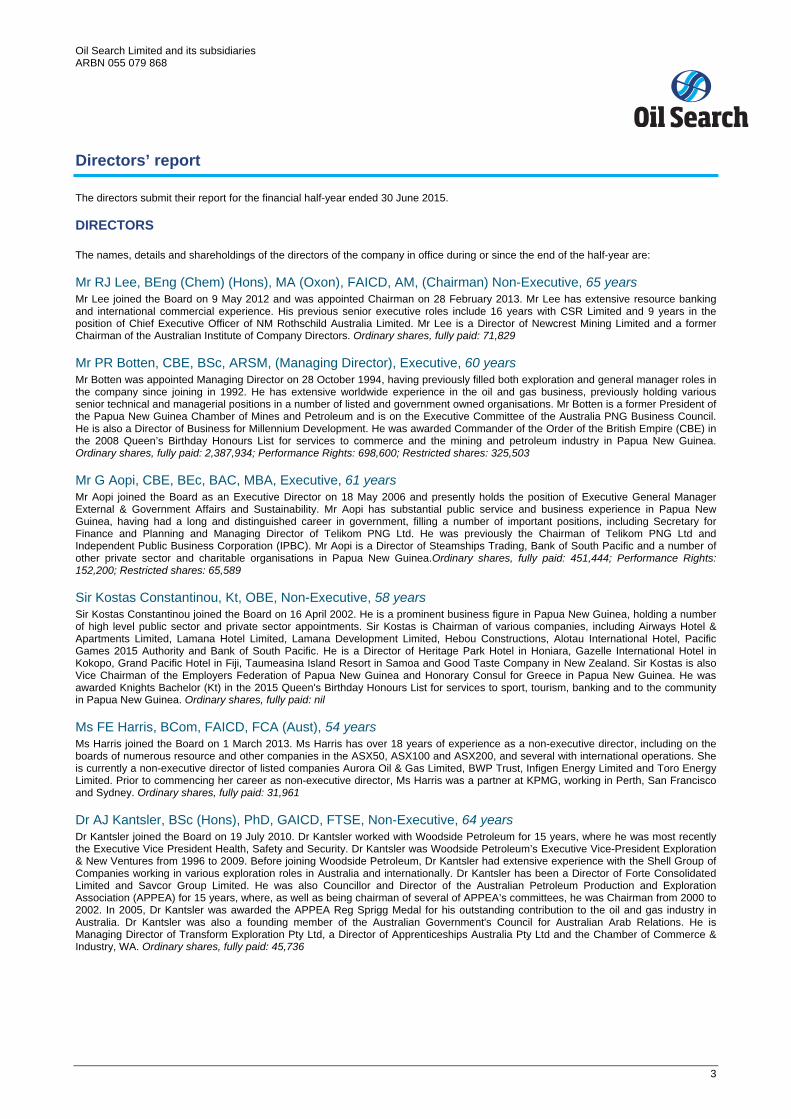
Directors’ report The directors submit their report for the financial half-year ended 30 June 2015.
DIRECTORS
The names, details and shareholdings of the directors of the company in office during or since the end of the half-year are:
Mr RJ Lee, BEng (Chem) (Hons), MA (Oxon), FAICD, AM, (Chairman) Non-Executive, 65 years Mr Lee joined the Board on 9 May 2012 and was appointed Chairman on 28 February 2013. Mr Lee has extensive resource banking and international commercial experience. His previous senior executive roles include 16 years with CSR Limited and 9 years in the position of Chief Executive Officer of NM Rothschild Australia Limited. Mr Lee is a Director of Newcrest Mining Limited and a former Chairman of the Australian Institute of Company Directors. Ordinary shares, fully paid: 71,829
Mr PR Botten, CBE, BSc, ARSM, (Managing Director), Executive, 60 years Mr Botten was appointed Managing Director on 28 October 1994, having previously filled both exploration and general manager roles in the company since joining in 1992. He has extensive worldwide experience in the oil and gas business, previously holding various senior technical and managerial positions in a number of listed and government owned organisations. Mr Botten is a former President of the Papua New Guinea Chamber of Mines and Petroleum and is on the Executive Committee of the Australia PNG Business Council. He is also a Director of Business for Millennium Development. He was awarded Commander of the Order of the British Empire (CBE) in the 2008 Queen’s Birthday Honours List for services to commerce and the mining and petroleum industry in Papua New Guinea. Ordinary shares, fully paid: 2,387,934; Performance Rights: 698,600; Restricted shares: 325,503
Mr G Aopi, CBE, BEc, BAC, MBA, Executive, 61 years Mr Aopi joined the Board as an Executive Director on 18 May 2006 and presently holds the position of Executive General Manager External & Government Affairs and Sustainability. Mr Aopi has substantial public service and business experience in Papua New Guinea, having had a long and distinguished career in government, filling a number of important positions, including Secretary for Finance and Planning and Managing Director of Telikom PNG Ltd. He was previously the Chairman of Telikom PNG Ltd and Independent Public Business Corporation (IPBC). Mr Aopi is a Director of Steamships Trading, Bank of South Pacific and a number of other private sector and charitable organisations in Papua New Guinea.Ordinary shares, fully paid: 451,444; Performance Rights: 152,200; Restricted shares: 65,589
Sir Kostas Constantinou, Kt, OBE, Non-Executive, 58 years Sir Kostas Constantinou joined the Board on 16 April 2002. He is a prominent business figure in Papua New Guinea, holding a number of high level public sector and private sector appointments. Sir Kostas is Chairman of various companies, including Airways Hotel & Apartments Limited, Lamana Hotel Limited, Lamana Development Limited, Hebou Constructions, Alotau International Hotel, Pacific Games 2015 Authority and Bank of South Pacific. He is a Director of Heritage Park Hotel in Honiara, Gazelle International Hotel in Kokopo, Grand Pacific Hotel in Fiji, Taumeasina Island Resort in Samoa and Good Taste Company in New Zealand. Sir Kostas is also Vice Chairman of the Employers Federation of Papua New Guinea and Honorary Consul for Greece in Papua New Guinea. He was awarded Knights Bachelor (Kt) in the 2015 Queen's Birthday Honours List for services to sport, tourism, banking and to the community in Papua New Guinea. Ordinary shares, fully paid: nil
Ms FE Harris, BCom, FAICD, FCA (Aust), 54 years Ms Harris joined the Board on 1 March 2013. Ms Harris has over 18 years of experience as a non-executive director, including on the boards of numerous resource and other companies in the ASX50, ASX100 and ASX200, and several with international operations. She is currently a non-executive director of listed companies Aurora Oil & Gas Limited, BWP Trust, Infigen Energy Limited and Toro Energy Limited. Prior to commencing her career as non-executive director, Ms Harris was a partner at KPMG, working in Perth, San Francisco and Sydney. Ordinary shares, fully paid: 31,961
Dr AJ Kantsler, BSc (Hons), PhD, GAICD, FTSE, Non-Executive, 64 years Dr Kantsler joined the Board on 19 July 2010. Dr Kantsler worked with Woodside Petroleum for 15 years, where he was most recently the Executive Vice President Health, Safety and Security. Dr Kantsler was Woodside Petroleum’s Executive Vice-President Exploration & New Ventures from 1996 to 2009. Before joining Woodside Petroleum, Dr Kantsler had extensive experience with the Shell Group of Companies working in various exploration roles in Australia and internationally. Dr Kantsler has been a Director of Forte Consolidated Limited and Savcor Group Limited. He was also Councillor and Director of the Australian Petroleum Production and Exploration Association (APPEA) for 15 years, where, as well as being chairman of several of APPEA’s committees, he was Chairman from 2000 to 2002. In 2005, Dr Kantsler was awarded the APPEA Reg Sprigg Medal for his outstanding contribution to the oil and gas industry in Australia. Dr Kantsler was also a founding member of the Australian Government's Council for Australian Arab Relations. He is Managing Director of Transform Exploration Pty Ltd, a Director of Apprenticeships Australia Pty Ltd and the Chamber of Commerce & Industry, WA. Ordinary shares, fully paid: 45,736
Oil Search Limited and its subsidiaries ARBN 055 079 868
4
Mr B Philemon, Non-Executive, 70 years Mr Philemon joined the Board on 5 November 2012. Mr Philemon is acknowledged as one of Papua New Guinea’s most influential leaders, with distinguished careers in both business and public service. Mr Philemon’s career highlights include serving as Chairman of Air Nuigini and holding a number of ministerial posts in PNG Government, including Minister of Foreign Affairs and Minister for Finance and Treasury. Mr Philemon served as the member for Lae Open in Government from 1992 until the 2012 elections. Mr Philemon is a Director of Highlands Pacific Limited and the Bank of Papua New Guinea. Ordinary shares, fully paid: 7,241
Mr KW Spence, BSc (Geophysics) (Hons), Non-Executive, 61 years Mr Spence joined the Board on 9 May 2012. Mr Spence brings over thirty years of oil and gas experience to the Board, having served in senior executive positions with Woodside Petroleum Limited, including Chief Operating Officer and Acting Chief Executive. Mr Spence was with Shell for 18 years prior to Woodside. Mr Spence is Chairman of Geodynamics Limited and Base Resources Limited and a Director of Independence Group. He chairs a number of other bodies, including the National Offshore Petroleum Safety and Environmental Management Authority Board. Ordinary shares, fully paid: 25,000
Dr ZE Switkowski, AO, BSc (Hons), PhD, FAICD, FTSE, Non-Executive, 67 years Dr Switkowski joined the Board on 22 November 2010. Dr Switkowski’s career highlights include serving as Chief Executive Officer and Managing Director of Telstra, Chief Executive Officer of Optus and Chairman and Managing Director of Kodak (Australasia). Dr Switkowski is Chairman of Suncorp Group and NBN Co and a Director of Tabcorp Limited. He is also Chancellor of the Royal Melbourne Institute of Technology (RMIT University). Dr Switkowski is a former Chairman of the Australian Nuclear Science and Technology Organisation and Opera Australia. He holds a PhD in nuclear physics from the University of Melbourne. Dr Switkowski was awarded Officer in the General Division (AO) in the 2014 Queen's Birthday Honous List for distinguished service to the community, in particular to tertiary education, scientific organisations and the telecommunications sector, to business and, to the arts. Ordinary shares, fully paid: 201,829
GROUP SECRETARY
Mr SW Gardiner, BEc (Hons), CPA, 57 years Mr Gardiner joined Oil Search Limited in 2004, after a twenty year career in corporate finance at two of Australia's largest multinational construction materials companies and a major Australian telecoms company. Mr Gardiner’s roles at Oil Search have covered senior corporate finance and corporate services responsibilities. In November 2012 Mr Gardiner was appointed to the position of Chief Financial Officer of Oil Search. Mr Gardiner is also the Group Secretary of Oil Search, a role he has held since May 2009. Ordinary shares, fully paid: 330,990; Performance Rights: 118,494; Restricted shares: 69,947
RESULTS AND REVIEW OF OPERATIONS Financial During the period, the consolidated entity made a net profit after tax of US$227.5 million (June 2014: US$152.5 million). The net profit was after providing for income tax of US$90.0 million (June 2014: US$125.0 million).
Operations Total production for the first half of 2015 was 14.321 million barrels of oil equivalent (mmboe), or 166.7% higher than in the first half of 2014 (5.369 mmboe). Costs of production were US$60.1 million higher at US$156.4 million, compared to US$96.3 million in the previous corresponding period.
Revenue for the first half of 2015 was US$863.8 million, 69.4% higher than the first half 2014 outcome of US$510.0 million. Total sales volumes in the first half of 2015 was 14.5 million barrels of oil equivalent (mmboe), 205% higher than the first half of 2014. The average realised oil and condensate price for the first half of 2015 was US$56.64 per barrel, or US$54.93 lower than the US$111.57 per barrel realised in the first half of 2014. The average realised LNG and gas price for the first half of 2015 was US$10.19 per mmBtu, or US$4.01 lower than the US$14.20 per mmBtu realised in the first half of 2014. The Company did not establish any oil hedges during the period and remains unhedged to oil price movements.
Amortisation and depreciation charges increased by 238.0%, or US$140.9 million, from US$59.2 million to US$200.1 million, primarily due to a full six months of depreciation of the PNG LNG Project assets.
Exploration and evaluation costs expensed in the first half of 2015 totalled US$34.5 million, compared to US$15.4 million in the previous corresponding period, due to increased seismic, geological, geophysical and general and administration activity, and the expensing of the exploration component of Hides Deep well, compared to the prior first half. As at 30 June 2015, carried forward exploration costs totalled US$1,712.7 million (December 2014: US$1,576.7 million), which includes the PRL 15 licence interest acquired in March 2014.
Income tax expense decreased to US$90.0 million in the first half of 2015 compared to US$125.0 million in the prior corresponding period, representing an effective tax rate of 28% (June 2014: 45%). During the half-year ended 30 June 2015, the PNG LNG Project achieved financial completion, resulting in the initial release to the Company of more than US$850 million in cash previously escrowed in PNG LNG Project related accounts. The completion guarantee provided to the Project’s lenders was also terminated.
Operating cash flow of US$516.8 million (June 2014: US$255.4 million) was generated during the half-year, an increase of 102.3% on the corresponding period in 2014. At 30 June 2015, the Company held cash of US$843.0 million (December 2014: US$960.2 million). Borrowings totalled US$4,360.5 million (December 2014: US$4,421.1 million), comprising the PNG LNG Project finance facility borrowings and finance leases.
Oil Search Limited and its subsidiaries ARBN 055 079 868
5
DIVIDENDS Subsequent to balance date, the directors approved the payment of an interim unfranked dividend of US 6 cents per ordinary share (2014: US 2 cents interim dividend) to ordinary shareholders in respect of the half-year ended 30 June 2015. The due date for payment is 29 September 2015 to all holders of ordinary shares on the Register of Members on 8 September 2015. The Company’s dividend reinvestment plan will remain suspended for the interim dividend. Dividends paid and declared during the year are recorded in note 9 to the financial statements.
ROUNDING The majority of amounts included in this report are rounded to the nearest US$1,000 (where rounding is applicable).
AUDITOR INDEPENDENCE AND NON-AUDIT SERVICES Deloitte Touche Tohmatsu's Independence Declaration, which forms part of this report, is attached on page 6.
Signed in accordance with a resolution of the directors.
………………………………………………
RJ LEE
Chairman
………………………………………………
PR BOTTEN
Managing Director
Sydney, 24 August 2015
Liability limited by a scheme approved under Professional Standards Legislation.
Member of Deloitte Touche Tohmatsu Limited.
6
Dear Directors,
Oil Search Limited
I am pleased to provide the following declaration of independence to the directors of Oil Search Limited.
As lead audit partner for the review of the financial statements of Oil Search Limited for the period ended
30 June 2015, I declare that to the best of my knowledge and belief, there have been no contraventions of
the auditor independence requirements of the Code of Ethics for Professional Accountants, issued by the
International Ethics Standards Board for Accountants (IESBA) in relation to the review.
Yours sincerely
DELOITTE TOUCHE TOHMATSU
Matthew Donaldson
Partner
Chartered Accountant
The Board Directors
Oil Search Limited
Ground Floor, Credit House
Cuthbertson Street, Port Moresby
Papua New Guinea
24 August 2015
Deloitte Touche Tohmatsu
A.B.N. 74 490 121 060
Grosvenor Place
225 George Street
Sydney NSW 2000
PO Box N250 Grosvenor Place
Sydney NSW 1220 Australia
DX 10307SSE
Tel: +61 (0) 2 9322 7000
Fax: +61 (0) 2 9322 7001
www.deloitte.com.au
Oil Search Limited and its subsidiaries ARBN 055 079 868
7
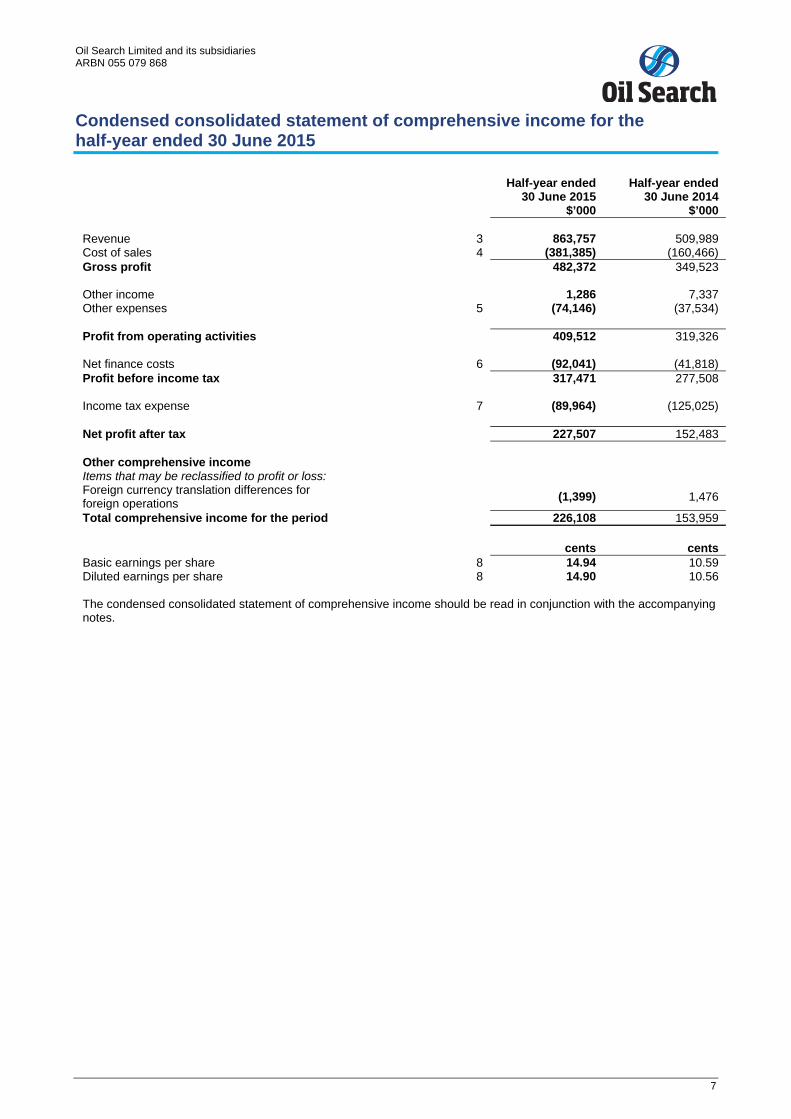
Condensed consolidated statement of comprehensive income for the half-year ended 30 June 2015
Half-year ended
30 June 2015 Half-year ended
30 June 2014 $’000 $’000
Revenue 3 863,757 509,989 Cost of sales 4 (381,385) (160,466) Gross profit 482,372 349,523 Other income 1,286 7,337 Other expenses 5 (74,146) (37,534) Profit from operating activities 409,512 319,326 Net finance costs 6 (92,041) (41,818) Profit before income tax 317,471 277,508 Income tax expense 7 (89,964) (125,025) Net profit after tax 227,507 152,483 Other comprehensive income Items that may be reclassified to profit or loss: Foreign currency translation differences for foreign operations (1,399) 1,476
Total comprehensive income for the period 226,108 153,959 cents centsBasic earnings per share 8 14.94 10.59 Diluted earnings per share 8 14.90 10.56 The condensed consolidated statement of comprehensive income should be read in conjunction with the accompanying notes.
Oil Search Limited and its subsidiaries ARBN 055 079 868
8
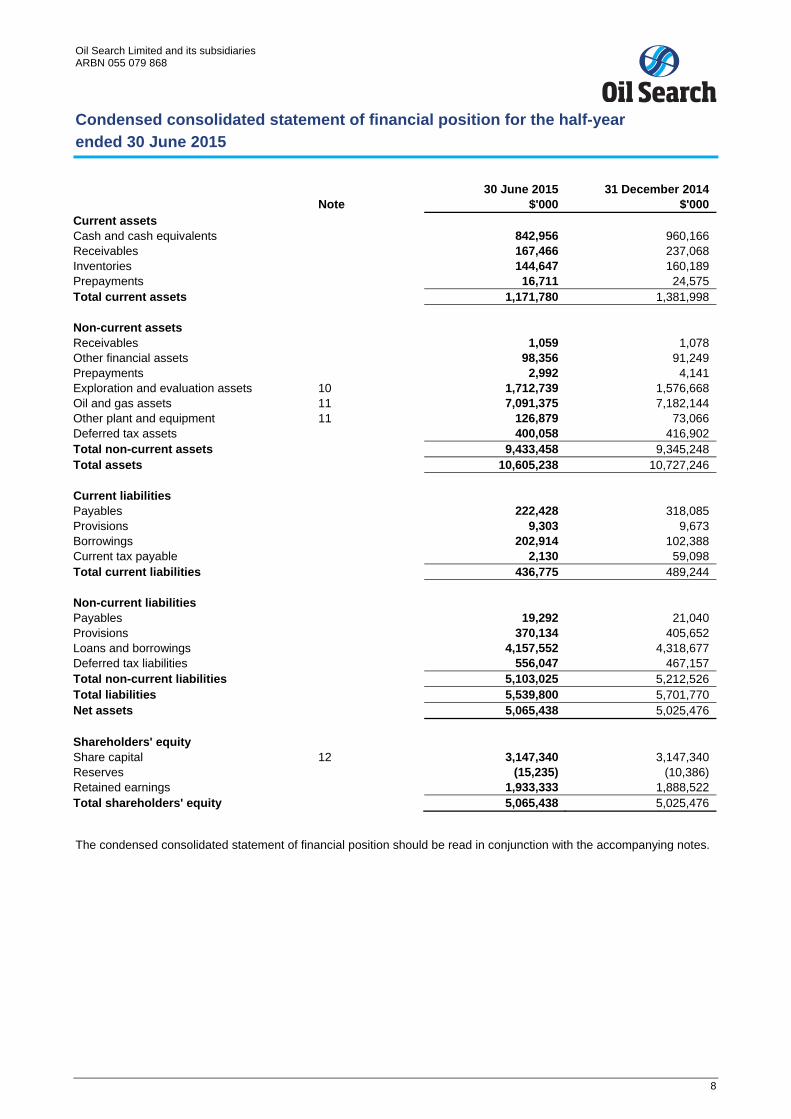
Condensed consolidated statement of financial position for the half-year ended 30 June 2015
30 June 2015 31 December 2014
Note $'000 $'000 Current assets Cash and cash equivalents 842,956 960,166 Receivables 167,466 237,068 Inventories 144,647 160,189 Prepayments 16,711 24,575 Total current assets 1,171,780 1,381,998
Non-current assets Receivables 1,059 1,078 Other financial assets 98,356 91,249 Prepayments 2,992 4,141 Exploration and evaluation assets 10 1,712,739 1,576,668 Oil and gas assets 11 7,091,375 7,182,144 Other plant and equipment 11 126,879 73,066 Deferred tax assets 400,058 416,902 Total non-current assets 9,433,458 9,345,248 Total assets 10,605,238 10,727,246
Current liabilities Payables 222,428 318,085 Provisions 9,303 9,673 Borrowings 202,914 102,388 Current tax payable 2,130 59,098 Total current liabilities 436,775 489,244
Non-current liabilities Payables 19,292 21,040 Provisions 370,134 405,652 Loans and borrowings 4,157,552 4,318,677 Deferred tax liabilities 556,047 467,157 Total non-current liabilities 5,103,025 5,212,526 Total liabilities 5,539,800 5,701,770 Net assets 5,065,438 5,025,476
Shareholders' equity Share capital 12 3,147,340 3,147,340 Reserves (15,235) (10,386) Retained earnings 1,933,333 1,888,522 Total shareholders' equity 5,065,438 5,025,476
The condensed consolidated statement of financial position should be read in conjunction with the accompanying notes.
Oil Search Limited and its subsidiaries ARBN 055 079 868
9
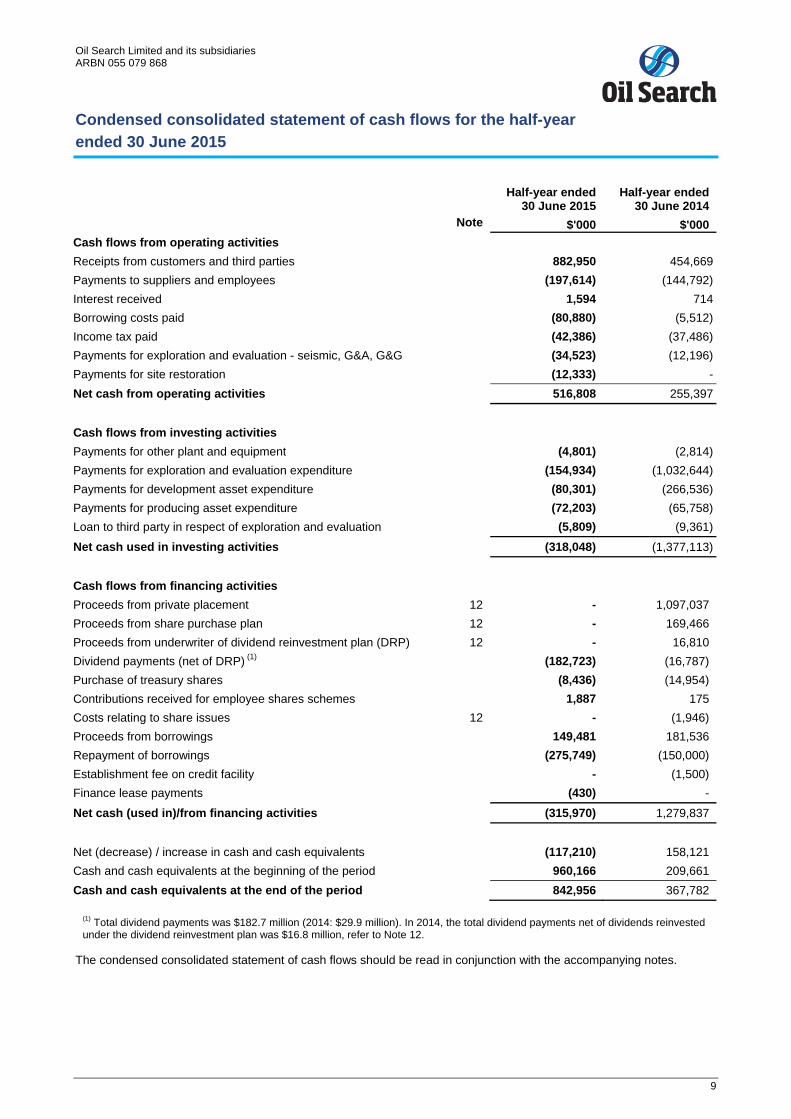
Condensed consolidated statement of cash flows for the half-year ended 30 June 2015
Half-year ended
30 June 2015 Half-year ended
30 June 2014 Note $'000 $'000 Cash flows from operating activities Receipts from customers and third parties 882,950 454,669Payments to suppliers and employees (197,614) (144,792)Interest received 1,594 714Borrowing costs paid (80,880) (5,512)Income tax paid (42,386) (37,486)Payments for exploration and evaluation - seismic, G&A, G&G (34,523) (12,196)Payments for site restoration (12,333) -Net cash from operating activities 516,808 255,397
Cash flows from investing activities Payments for other plant and equipment (4,801) (2,814)Payments for exploration and evaluation expenditure (154,934) (1,032,644)Payments for development asset expenditure (80,301) (266,536)Payments for producing asset expenditure (72,203) (65,758)Loan to third party in respect of exploration and evaluation (5,809) (9,361)
Net cash used in investing activities (318,048) (1,377,113)
Cash flows from financing activities Proceeds from private placement 12 - 1,097,037 Proceeds from share purchase plan 12 - 169,466 Proceeds from underwriter of dividend reinvestment plan (DRP) 12 - 16,810 Dividend payments (net of DRP) (1) (182,723) (16,787) Purchase of treasury shares (8,436) (14,954) Contributions received for employee shares schemes 1,887 175 Costs relating to share issues 12 - (1,946) Proceeds from borrowings 149,481 181,536 Repayment of borrowings (275,749) (150,000) Establishment fee on credit facility - (1,500) Finance lease payments (430) -
Net cash (used in)/from financing activities (315,970) 1,279,837
Net (decrease) / increase in cash and cash equivalents (117,210) 158,121 Cash and cash equivalents at the beginning of the period 960,166 209,661 Cash and cash equivalents at the end of the period 842,956 367,782
(1) Total dividend payments was $182.7 million (2014: $29.9 million). In 2014, the total dividend payments net of dividends reinvested under the dividend reinvestment plan was $16.8 million, refer to Note 12.
The condensed consolidated statement of cash flows should be read in conjunction with the accompanying notes.
Oil Search Limited and its subsidiaries ARBN 055 079 868
10
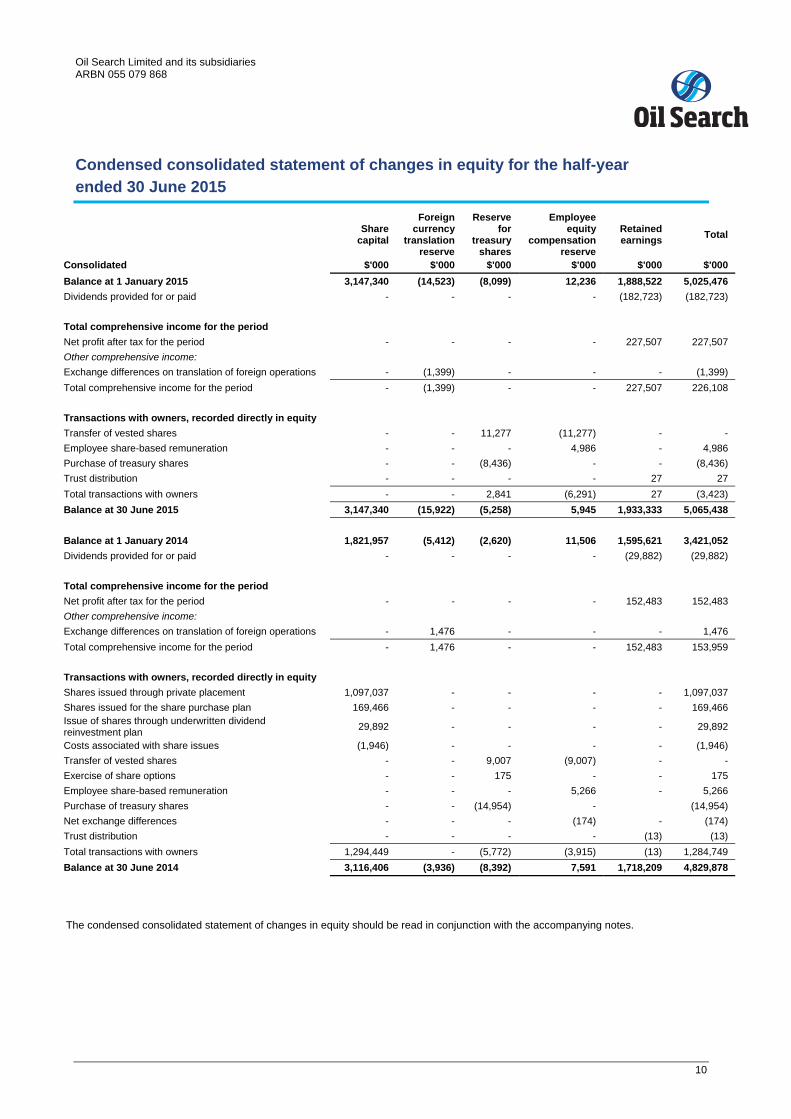
Condensed consolidated statement of changes in equity for the half-year ended 30 June 2015
Share capital
Foreign currency
translation reserve
Reserve for
treasury shares
Employee equity
compensation reserve
Retained earnings Total
Consolidated $'000 $'000 $'000 $'000 $'000 $'000 Balance at 1 January 2015 3,147,340 (14,523) (8,099) 12,236 1,888,522 5,025,476 Dividends provided for or paid - - - - (182,723) (182,723) Total comprehensive income for the period Net profit after tax for the period - - - - 227,507 227,507 Other comprehensive income: Exchange differences on translation of foreign operations - (1,399) - - - (1,399) Total comprehensive income for the period - (1,399) - - 227,507 226,108 Transactions with owners, recorded directly in equity Transfer of vested shares - - 11,277 (11,277) - - Employee share-based remuneration - - - 4,986 - 4,986 Purchase of treasury shares - - (8,436) - - (8,436) Trust distribution - - - - 27 27 Total transactions with owners - - 2,841 (6,291) 27 (3,423) Balance at 30 June 2015 3,147,340 (15,922) (5,258) 5,945 1,933,333 5,065,438 Balance at 1 January 2014 1,821,957 (5,412) (2,620) 11,506 1,595,621 3,421,052 Dividends provided for or paid - - - - (29,882) (29,882)
Total comprehensive income for the period Net profit after tax for the period - - - - 152,483 152,483 Other comprehensive income:
Exchange differences on translation of foreign operations - 1,476 - - - 1,476 Total comprehensive income for the period - 1,476 - - 152,483 153,959
Transactions with owners, recorded directly in equity Shares issued through private placement 1,097,037 - - - - 1,097,037 Shares issued for the share purchase plan 169,466 - - - - 169,466 Issue of shares through underwritten dividend reinvestment plan 29,892 - - - - 29,892
Costs associated with share issues (1,946) - - - - (1,946) Transfer of vested shares - - 9,007 (9,007) - - Exercise of share options - - 175 - - 175 Employee share-based remuneration - - - 5,266 - 5,266 Purchase of treasury shares - - (14,954) - (14,954) Net exchange differences - - - (174) - (174) Trust distribution - - - - (13) (13) Total transactions with owners 1,294,449 - (5,772) (3,915) (13) 1,284,749 Balance at 30 June 2014 3,116,406 (3,936) (8,392) 7,591 1,718,209 4,829,878
The condensed consolidated statement of changes in equity should be read in conjunction with the accompanying notes.
Oil Search Limited and its subsidiaries ARBN 055 079 868
11
1 Significant accounting policies Oil Search Limited (the 'Company') is incorporated in Papua New Guinea (PNG). The condensed consolidated interim financial report for the half-year ended 30 June 2015 comprises Oil Search Limited and its controlled entities (together, 'the Group').
The condensed consolidated interim financial report was authorised for issue by the Board of Directors on 24 August 2015.
(a) Basis of preparation
This condensed consolidated interim financial report for the half-year reporting period ended 30 June 2015 has been prepared in accordance with Accounting Standard IAS 34 Interim Financial Reporting.
This condensed consolidated interim financial report does not include all the notes of the type normally included in an annual financial report. Accordingly, this report is to be read in conjunction with the annual report for the year ended 31 December 2014 and any public announcements made by the Company during the interim reporting period in accordance with the continuous disclosure requirements of the ASX Listing Rules.
The majority of amounts included in this report are rounded to the nearest US$1,000 (where rounding is applicable).
The accounting policies adopted are consistent with those of the previous financial year and corresponding interim reporting period.
Oil Search Limited and its subsidiaries ARBN 055 079 868
12
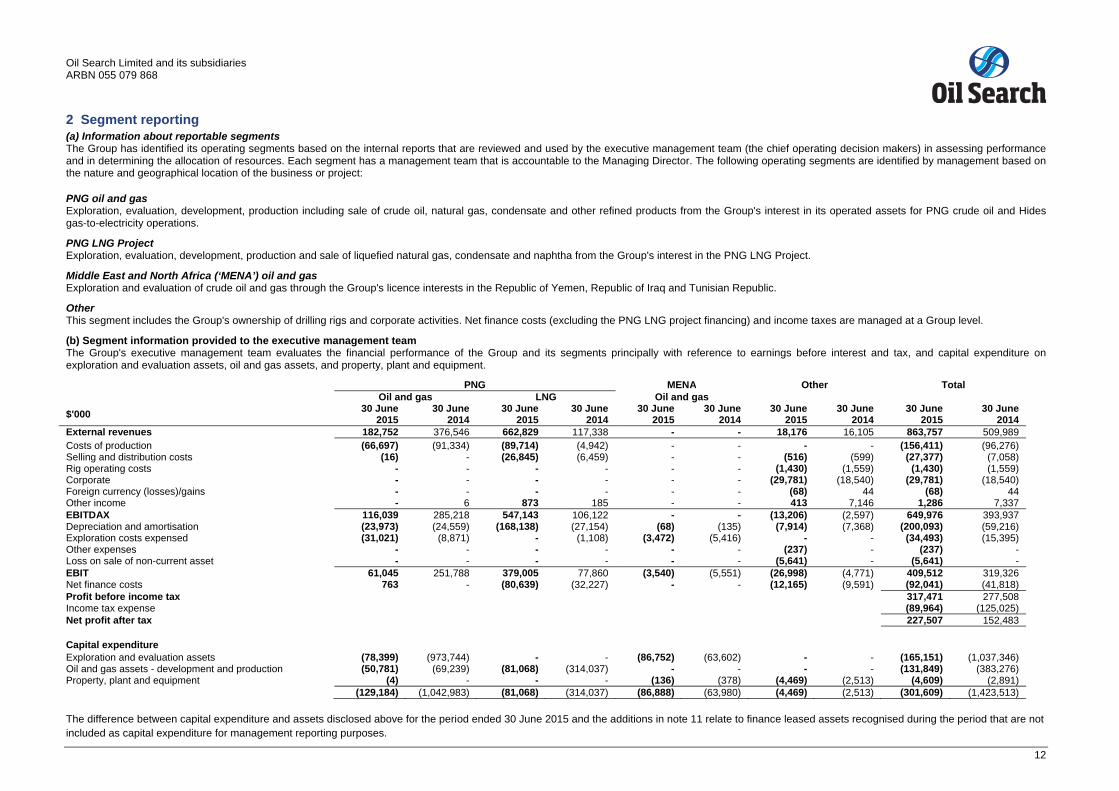
2 Segment reporting (a) Information about reportable segments The Group has identified its operating segments based on the internal reports that are reviewed and used by the executive management team (the chief operating decision makers) in assessing performance and in determining the allocation of resources. Each segment has a management team that is accountable to the Managing Director. The following operating segments are identified by management based on the nature and geographical location of the business or project:
PNG oil and gas Exploration, evaluation, development, production including sale of crude oil, natural gas, condensate and other refined products from the Group's interest in its operated assets for PNG crude oil and Hides gas-to-electricity operations.
PNG LNG Project Exploration, evaluation, development, production and sale of liquefied natural gas, condensate and naphtha from the Group's interest in the PNG LNG Project.
Middle East and North Africa (‘MENA’) oil and gas Exploration and evaluation of crude oil and gas through the Group's licence interests in the Republic of Yemen, Republic of Iraq and Tunisian Republic.
Other This segment includes the Group's ownership of drilling rigs and corporate activities. Net finance costs (excluding the PNG LNG project financing) and income taxes are managed at a Group level.
(b) Segment information provided to the executive management team The Group's executive management team evaluates the financial performance of the Group and its segments principally with reference to earnings before interest and tax, and capital expenditure on exploration and evaluation assets, oil and gas assets, and property, plant and equipment.
PNG MENA Other TotalOil and gas LNG Oil and gas
$'000 30 June 2015
30 June 2014
30 June 2015
30 June 2014
30 June 2015
30 June 2014
30 June 2015
30 June 2014
30 June 2015
30 June 2014
External revenues 182,752 376,546 662,829 117,338 - - 18,176 16,105 863,757 509,989 Costs of production (66,697) (91,334) (89,714) (4,942) - - - - (156,411) (96,276) Selling and distribution costs (16) - (26,845) (6,459) - - (516) (599) (27,377) (7,058) Rig operating costs - - - - - - (1,430) (1,559) (1,430) (1,559) Corporate - - - - - - (29,781) (18,540) (29,781) (18,540) Foreign currency (losses)/gains - - - - - - (68) 44 (68) 44 Other income - 6 873 185 - - 413 7,146 1,286 7,337 EBITDAX 116,039 285,218 547,143 106,122 - - (13,206) (2,597) 649,976 393,937 Depreciation and amortisation (23,973) (24,559) (168,138) (27,154) (68) (135) (7,914) (7,368) (200,093) (59,216) Exploration costs expensed (31,021) (8,871) - (1,108) (3,472) (5,416) - - (34,493) (15,395) Other expenses - - - - - - (237) - (237) - Loss on sale of non-current asset - - - - - - (5,641) - (5,641) - EBIT 61,045 251,788 379,005 77,860 (3,540) (5,551) (26,998) (4,771) 409,512 319,326 Net finance costs 763 - (80,639) (32,227) - - (12,165) (9,591) (92,041) (41,818) Profit before income tax 317,471 277,508 Income tax expense (89,964) (125,025) Net profit after tax 227,507 152,483 Capital expenditure Exploration and evaluation assets (78,399) (973,744) - - (86,752) (63,602) - - (165,151) (1,037,346) Oil and gas assets - development and production (50,781) (69,239) (81,068) (314,037) - - - - (131,849) (383,276) Property, plant and equipment (4) - - - (136) (378) (4,469) (2,513) (4,609) (2,891) (129,184) (1,042,983) (81,068) (314,037) (86,888) (63,980) (4,469) (2,513) (301,609) (1,423,513) The difference between capital expenditure and assets disclosed above for the period ended 30 June 2015 and the additions in note 11 relate to finance leased assets recognised during the period that are not included as capital expenditure for management reporting purposes.
Oil Search Limited and its subsidiaries ARBN 055 079 868
13
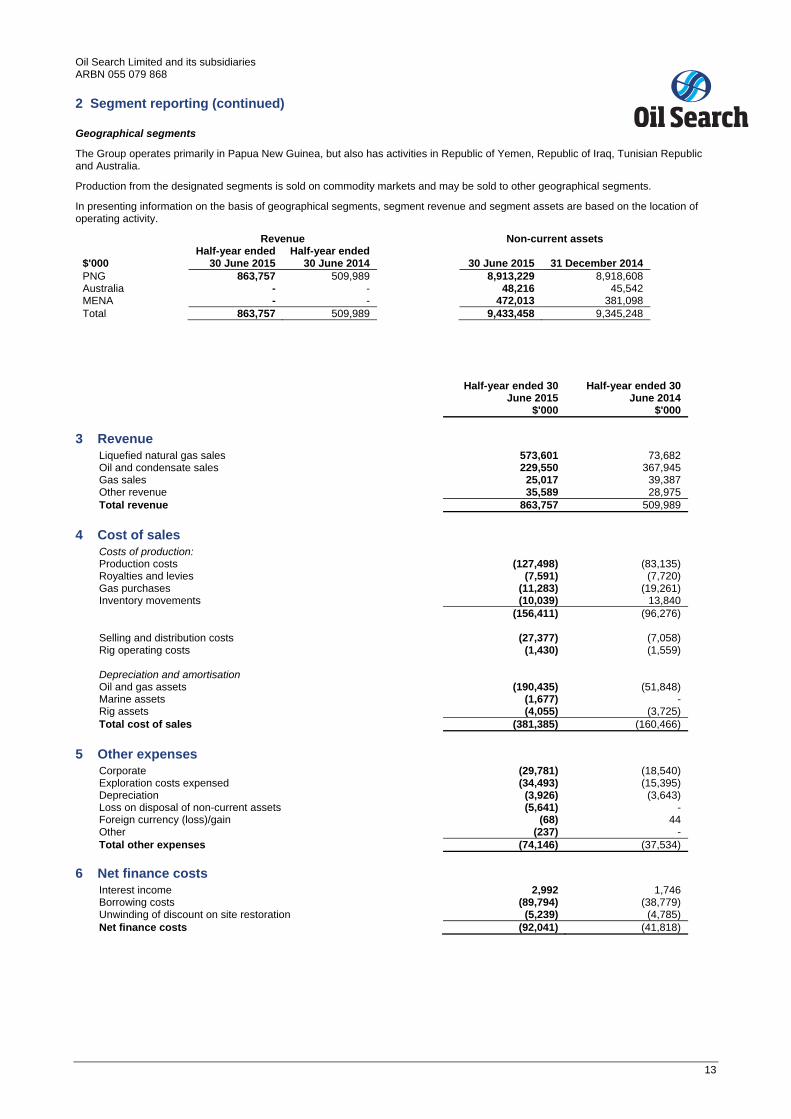
2 Segment reporting (continued)
Geographical segments
The Group operates primarily in Papua New Guinea, but also has activities in Republic of Yemen, Republic of Iraq, Tunisian Republic and Australia.
Production from the designated segments is sold on commodity markets and may be sold to other geographical segments.
In presenting information on the basis of geographical segments, segment revenue and segment assets are based on the location of operating activity.
Revenue Non-current assets
$'000 Half-year ended
30 June 2015 Half-year ended
30 June 2014 30 June 2015 31 December 2014 PNG 863,757 509,989 8,913,229 8,918,608 Australia - - 48,216 45,542 MENA - - 472,013 381,098 Total 863,757 509,989 9,433,458 9,345,248
Half-year ended 30
June 2015 Half-year ended 30
June 2014 $'000 $'000
3 Revenue Liquefied natural gas sales 573,601 73,682
Oil and condensate sales 229,550 367,945 Gas sales 25,017 39,387 Other revenue 35,589 28,975
Total revenue 863,757 509,989
4 Cost of sales Costs of production: Production costs (127,498) (83,135) Royalties and levies (7,591) (7,720) Gas purchases (11,283) (19,261) Inventory movements (10,039) 13,840 (156,411) (96,276)
Selling and distribution costs (27,377) (7,058)
Rig operating costs (1,430) (1,559) Depreciation and amortisation
Oil and gas assets (190,435) (51,848) Marine assets (1,677) -
Rig assets (4,055) (3,725) Total cost of sales (381,385) (160,466)
5 Other expenses Corporate (29,781) (18,540)
Exploration costs expensed (34,493) (15,395) Depreciation (3,926) (3,643)
Loss on disposal of non-current assets (5,641) - Foreign currency (loss)/gain (68) 44
Other (237) - Total other expenses (74,146) (37,534)
6 Net finance costs Interest income 2,992 1,746
Borrowing costs (89,794) (38,779) Unwinding of discount on site restoration (5,239) (4,785)
Net finance costs (92,041) (41,818)
Oil Search Limited and its subsidiaries ARBN 055 079 868
14
Half-year ended
30 June 2015 Half-year ended
30 June 2014 cents cents
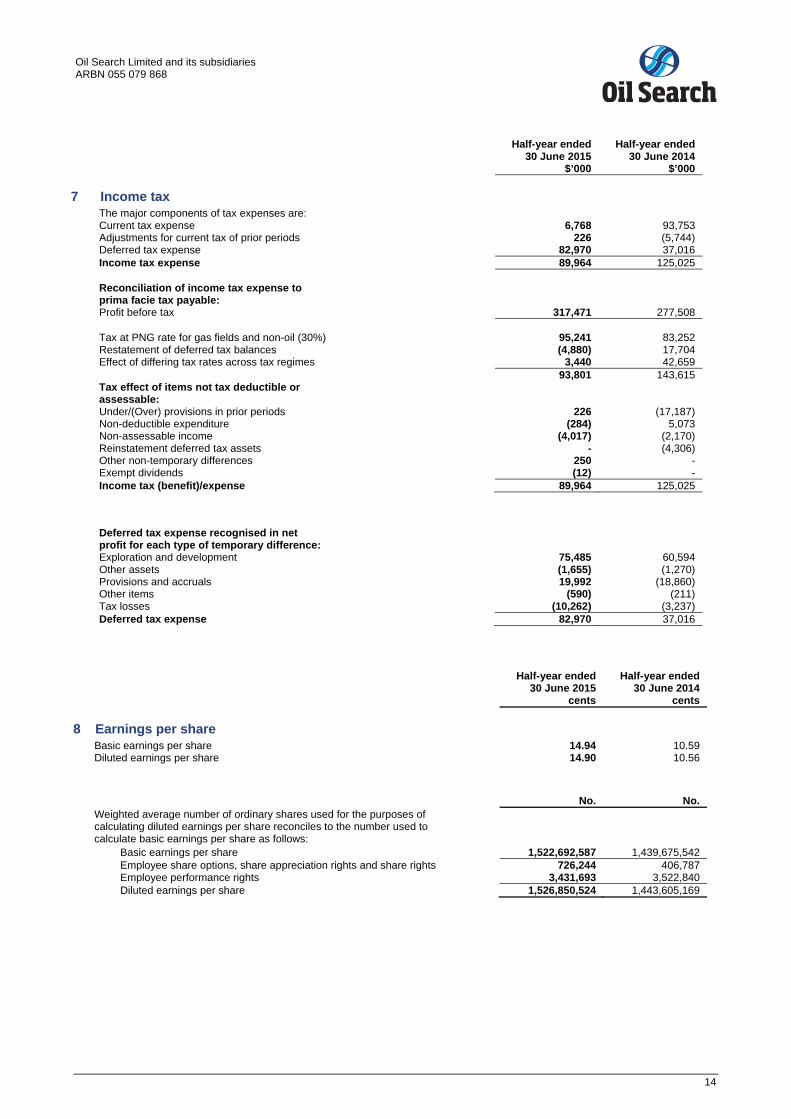
8 Earnings per share Basic earnings per share 14.94 10.59 Diluted earnings per share 14.90 10.56
No. No. Weighted average number of ordinary shares used for the purposes of calculating diluted earnings per share reconciles to the number used to calculate basic earnings per share as follows:
Basic earnings per share 1,522,692,587 1,439,675,542 Employee share options, share appreciation rights and share rights 726,244 406,787 Employee performance rights 3,431,693 3,522,840 Diluted earnings per share 1,526,850,524 1,443,605,169
Half-year ended
30 June 2015 Half-year ended
30 June 2014 $’000 $’000
7 Income tax
The major components of tax expenses are: Current tax expense 6,768 93,753 Adjustments for current tax of prior periods 226 (5,744) Deferred tax expense 82,970 37,016 Income tax expense 89,964 125,025
Reconciliation of income tax expense to prima facie tax payable:
Profit before tax 317,471 277,508
Tax at PNG rate for gas fields and non-oil (30%) 95,241 83,252 Restatement of deferred tax balances (4,880) 17,704 Effect of differing tax rates across tax regimes 3,440 42,659 93,801 143,615
Tax effect of items not tax deductible or assessable:
Under/(Over) provisions in prior periods 226 (17,187) Non-deductible expenditure (284) 5,073 Non-assessable income (4,017) (2,170) Reinstatement deferred tax assets - (4,306) Other non-temporary differences 250 - Exempt dividends (12) - Income tax (benefit)/expense 89,964 125,025
Deferred tax expense recognised in net profit for each type of temporary difference:
Exploration and development 75,485 60,594 Other assets (1,655) (1,270) Provisions and accruals 19,992 (18,860) Other items (590) (211) Tax losses (10,262) (3,237) Deferred tax expense 82,970 37,016
Oil Search Limited and its subsidiaries ARBN 055 079 868
15
Half-year ended 30 June 2015
Half-year ended 30 June 2014
$'000 $'000
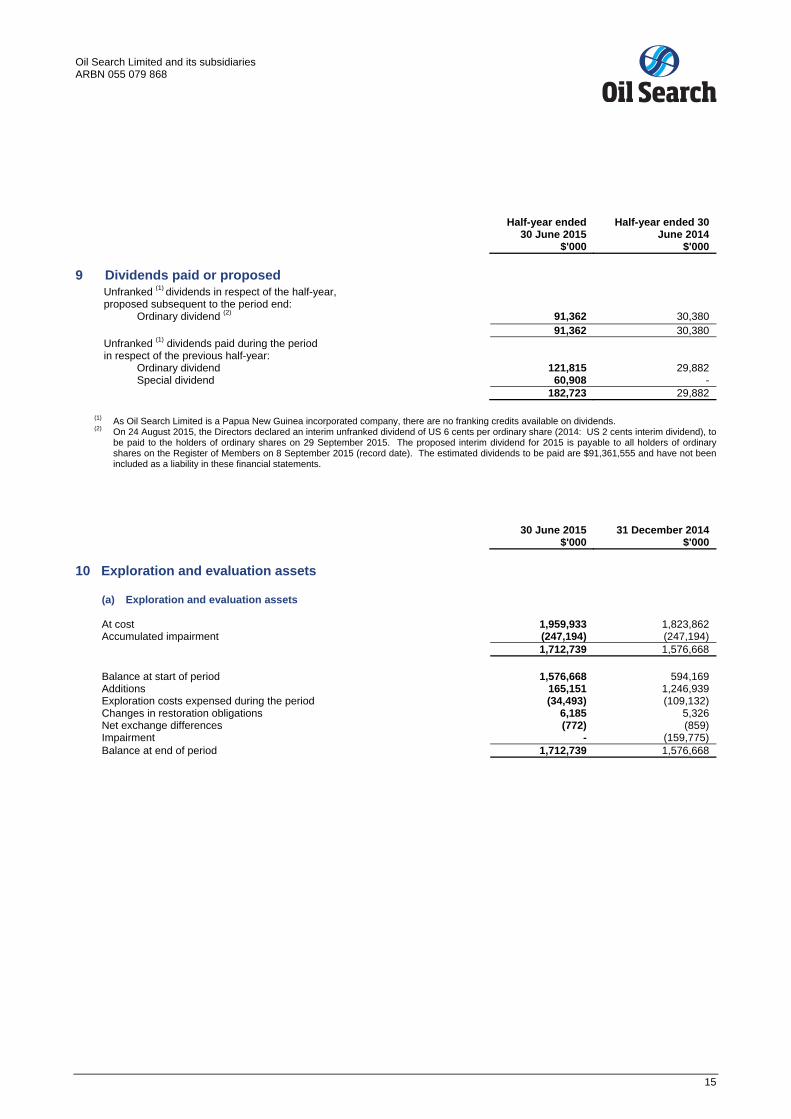
9 Dividends paid or proposed Unfranked (1) dividends in respect of the half-year, proposed subsequent to the period end:
Ordinary dividend (2) 91,362 30,380 91,362 30,380
Unfranked (1) dividends paid during the period in respect of the previous half-year:
Ordinary dividend 121,815 29,882 Special dividend 60,908 -
182,723 29,882
(1) As Oil Search Limited is a Papua New Guinea incorporated company, there are no franking credits available on dividends. (2) On 24 August 2015, the Directors declared an interim unfranked dividend of US 6 cents per ordinary share (2014: US 2 cents interim dividend), to
be paid to the holders of ordinary shares on 29 September 2015. The proposed interim dividend for 2015 is payable to all holders of ordinary shares on the Register of Members on 8 September 2015 (record date). The estimated dividends to be paid are $91,361,555 and have not been included as a liability in these financial statements.
30 June 2015 31 December 2014 $'000 $'000
10 Exploration and evaluation assets (a) Exploration and evaluation assets
At cost 1,959,933 1,823,862 Accumulated impairment (247,194) (247,194)
1,712,739 1,576,668
Balance at start of period
1,576,668
594,169
Additions 165,151 1,246,939 Exploration costs expensed during the period (34,493) (109,132) Changes in restoration obligations 6,185 5,326 Net exchange differences (772) (859)
Impairment - (159,775) Balance at end of period 1,712,739 1,576,668
Oil Search Limited and its subsidiaries ARBN 055 079 868
16
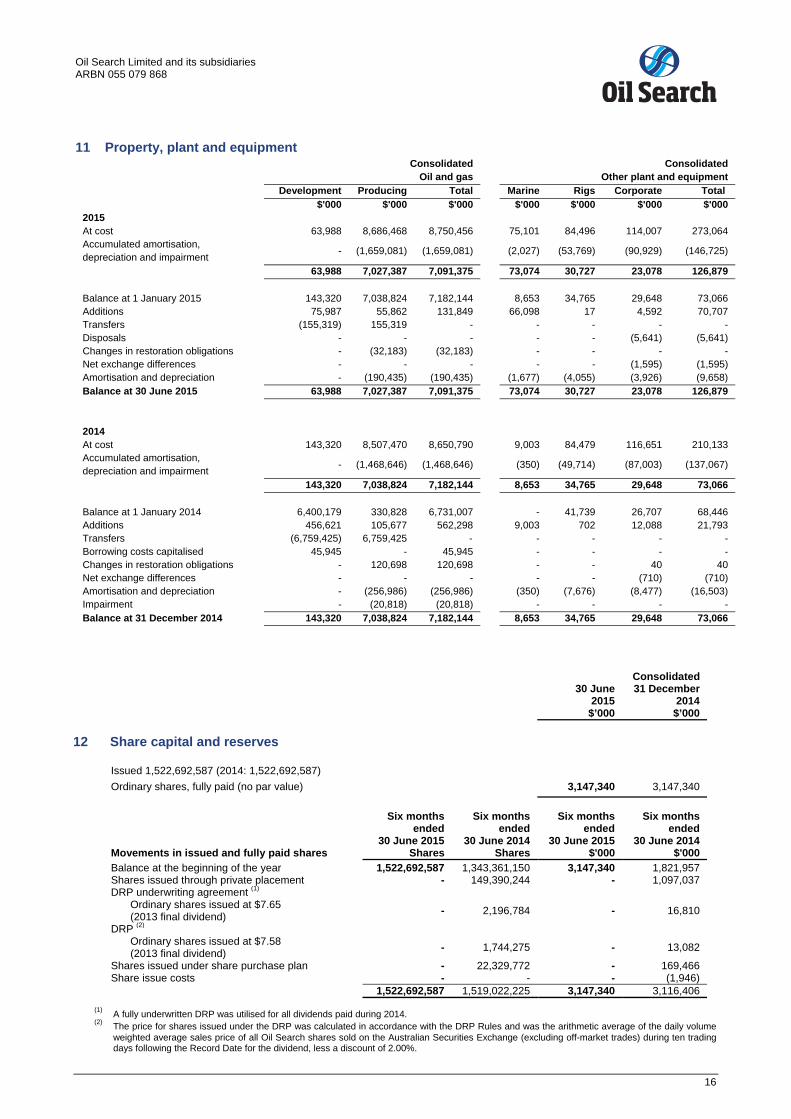
11 Property, plant and equipment Consolidated Consolidated Oil and gas Other plant and equipment Development Producing Total Marine Rigs Corporate Total $'000 $'000 $'000 $'000 $'000 $'000 $'0002015 At cost 63,988 8,686,468 8,750,456 75,101 84,496 114,007 273,064 Accumulated amortisation, depreciation and impairment - (1,659,081) (1,659,081) (2,027) (53,769) (90,929) (146,725)
63,988 7,027,387 7,091,375 73,074 30,727 23,078 126,879 Balance at 1 January 2015 143,320 7,038,824 7,182,144 8,653 34,765 29,648 73,066 Additions 75,987 55,862 131,849 66,098 17 4,592 70,707 Transfers (155,319) 155,319 - - - - - Disposals - - - - - (5,641) (5,641) Changes in restoration obligations - (32,183) (32,183) - - - - Net exchange differences - - - - - (1,595) (1,595) Amortisation and depreciation - (190,435) (190,435) (1,677) (4,055) (3,926) (9,658) Balance at 30 June 2015 63,988 7,027,387 7,091,375 73,074 30,727 23,078 126,879 2014 At cost 143,320 8,507,470 8,650,790 9,003 84,479 116,651 210,133 Accumulated amortisation, depreciation and impairment - (1,468,646) (1,468,646) (350) (49,714) (87,003) (137,067)
143,320 7,038,824 7,182,144 8,653 34,765 29,648 73,066 Balance at 1 January 2014 6,400,179 330,828 6,731,007 - 41,739 26,707 68,446 Additions 456,621 105,677 562,298 9,003 702 12,088 21,793 Transfers (6,759,425) 6,759,425 - - - - - Borrowing costs capitalised 45,945 - 45,945 - - - - Changes in restoration obligations - 120,698 120,698 - - 40 40 Net exchange differences - - - - - (710) (710) Amortisation and depreciation - (256,986) (256,986) (350) (7,676) (8,477) (16,503) Impairment - (20,818) (20,818) - - - - Balance at 31 December 2014 143,320 7,038,824 7,182,144 8,653 34,765 29,648 73,066
Consolidated
30 June 2015
31 December 2014
$’000 $’000
12 Share capital and reserves Issued 1,522,692,587 (2014: 1,522,692,587)
Ordinary shares, fully paid (no par value) 3,147,340 3,147,340
Six months
ended 30 June 2015
Six months
ended 30 June 2014
Six months
ended 30 June 2015
Six months
ended 30 June 2014
Movements in issued and fully paid shares Shares Shares $'000 $'000 Balance at the beginning of the year 1,522,692,587 1,343,361,150 3,147,340 1,821,957
Shares issued through private placement - 149,390,244 - 1,097,037 DRP underwriting agreement (1)
Ordinary shares issued at $7.65 (2013 final dividend) - 2,196,784 - 16,810
DRP (2)
Ordinary shares issued at $7.58 (2013 final dividend) - 1,744,275 - 13,082
Shares issued under share purchase plan - 22,329,772 - 169,466 Share issue costs - - - (1,946)
1,522,692,587 1,519,022,225 3,147,340 3,116,406 (1) A fully underwritten DRP was utilised for all dividends paid during 2014. (2) The price for shares issued under the DRP was calculated in accordance with the DRP Rules and was the arithmetic average of the daily volume
weighted average sales price of all Oil Search shares sold on the Australian Securities Exchange (excluding off-market trades) during ten trading days following the Record Date for the dividend, less a discount of 2.00%.
Oil Search Limited and its subsidiaries ARBN 055 079 868
17
Directors’ Declaration In accordance with a resolution of the Directors of Oil Search Limited, the Directors declare that:
(a) the attached financial statements and notes thereto of the consolidated entity:
(i) give a true and fair view of the consolidated entity's financial position as at 30 June 2015, and its performance for the half-year ended on that date; and
(ii) comply with International Financial Reporting Standards; and (iii) the attached financial statements and notes thereto comply with the reporting requirements of the
Australian Securities Exchange Listing Rules; and
(b) in the opinion of the Directors, there are reasonable grounds to believe that the company will be able to pay its debts as and when they become due or payable.
This declaration has been made after receiving unqualified declarations from the Managing Director and the Chief Financial Officer, that are consistent with requirements under section 295A of the Australian Corporations Act 2001, for the half-year ended 30 June 2015. Signed in accordance with a resolution of the Directors. On behalf of the Directors
..........................................................
RJ LEE
Chairman
..........................................................
PR BOTTEN
Managing Director
Sydney, 24 August 2015