Embed Size (px)
Citation preview
Vortices in turbulent curved pipe flow—
rocking, rolling and pulsating motions
by
Athanasia Kalpakli Vester
May 2014Technical Reports from
Royal Institute of TechnologyKTH Mechanics
SE–100 44 Stockholm, Sweden

Akademisk avhandling som med tillstånd av Kungliga Tekniska Högskolan iStockholm framlägges till offentlig granskning för avläggande av teknologiedoktorsexamen den 13 juni 2014 kl 10.15 i sal E2, Lindstedtsvägen 3, KungligaTekniska Högskolan, Stockholm.
©Athanasia Kalpakli Vester 2014
Universitetsservice US–AB, Stockholm 2014

To Johan and Christo
iii

iv
Athanasia Kalpakli Vester 2014, Vortices in turbulent curved pipe flow—rocking, rolling and pulsating motions
CCGEx & Linné Flow Centre, KTH Mechanics,Royal Institute of Technology, SE–100 44 Stockholm, Sweden
Abstract
This thesis is motivated by the necessity to understand the flow structure of tur-bulent flows in bends encountered in many technical applications such as heatexchangers, nuclear reactors and internal combustion engines. Flows in bendsare characterised by strong secondary motions in terms of counter-rotatingvortices (Dean cells) set up by a centrifugal instability. Specifically the thesisdeals with turbulent flows in 90◦ curved pipes of circular cross-section with andwithout an additional motion, swirling or pulsatile, superposed on the primaryflow. The aim of the present thesis is to study these complex flows in detail byusing time-resolved stereoscopic particle image velocimetry to obtain the three-dimensional velocity field, with complementary hot-wire anemometry and laserDoppler velocimetry measurements.
In order to analyse the vortical flow field proper orthogonal decomposition(POD) is used. The so called “swirl-switching” is identified and it is shownthat the vortices instantaneously, “rock” between three states, viz. a pair ofsymmetric vortices or a dominant clockwise or counter-clockwise Dean cell. Themost energetic mode exhibits a single cell spanning the whole cross-section and“rolling” (counter-)clockwise in time. However, when a honeycomb is mountedat the inlet of the bend, the Dean vortices break down and there is strongindication that the “swirl-switching” is hindered.
When a swirling motion is superimposed on the incoming flow, the Deanvortices show a tendency to merge into a single cell with increasing swirl inten-sity. POD analysis show vortices which closely resemble the Dean cells, indicat-ing that these structures co-exist with the swirling motion. In highly pulsatingturbulent flow at the exit of a curved pipe, the vortical pattern is diminished oreven eliminated during the acceleration phase and then re-established duringthe deceleration.
In order to investigate the effect of pulsations and curvature on the per-formance of a turbocharger turbine, highly pulsating turbulent flow througha sharp bend is fed into the turbine. Time-resolved pressure and mass-flowrate measurements show that the hysteresis loop in the pressure-ratio-mass-flow plane, may differ significantly between straight and curved inlets, howeverthe mean operating point is only slightly affected.
Descriptors: Turbulence, curved pipes, swirling flow, pulsatile flow, time-resolved stereoscopic particle image velocimetry, hot-wire anemometry, properorthogonal decomposition, turbocharger
v
Athanasia Kalpakli Vester 2014, Virvlar i turbulent flöde i rörkrök—“rocking, rolling” och pulserande rörelser
CCGEx & Linné Flow Centre, KTH Mekanik,Kungliga Tekniska Högskolan, SE–100 44 Stockholm, Sverige
Sammanfattning
Motivet bakom avhandlingen är en önskan att bättre förstå de större struk-turer som uppträder i turbulent strömning i krökta rör något som förekommerfrekvent i olika tekniska sammanhang såsom i t.ex. värmeväxlare, reaktorer ochförbränningsmotorer. Strömningen i en krökt rör karakteriseras av en mer ellermindre stark sekundär strömning i form av sekundära virvlar s.k. Deanvirvlardrivna av tryckfältet kopplade till de krökta strömlijerna. Arbetet fokuserar påturbulent strömning genom cirkulära 90◦ rörkrökar med olika krökningsradieroch strömning som både är stationär, pulserande och har olika grad av swirl iinloppet. Målet med avhandlingen är att analysera strömningen i detalj genomatt använda tidsupplöst stereoskopisk “particle image velocimetry” (PIV) föratt bestämma det tredimensionella hastighetsfältet. Hastighetsfältet bestämsockså i vissa försök m.h.a. varmtrådsanemometri och “laser-Doppler velocime-try” (LDV). För att analysera hastighetsfältet används “proper orthogonal de-composition” (POD). Arbetet beskriver fenomenet “swirl-switching” och detvisas att virvlarna växlar mellan tre olika konfigurationer: två symmetriskaDeanvirvlar, en dominerande medurs-virvel och en dominerande moturs-virvel.Konfigurationen med medurs- eller moturs-virvel som växlar i tid och som spän-ner över hela rör-tvärsnittet är den mest energirika. När inloppet till rörkrökenförses med en strömningsriktare (hexagonstruktur) undertrycks virvelstruk-turen och det finns en stark indikation att “swirl-switching” upphör.
När inloppsströmningen har ett rotationsbidrag kring strömningsaxeln än-dras Deanvirvelstrukturen till en enda förstärkt virvel. POD visar virvlar somär mycket lika Deanvirvlar vilket indikerar att dessa strukturer samexisterarmed den pålagda roterande strömningen. Vid kraftigt pulserande turbulentströmning minskar virvelintensiteten i rörkrökens utlopp. Under accelerations-fasen elimineras virvlarna helt för att under decelerationsfasen återuppstå.
För att undersöka hur en rörkrök och pulserande strömning påverkar funk-tionen hos en turbin monterades en 90◦ rörkrök framför inloppet till tur-binen och systemet matades med ett pulserande turbulent flöde. Tidsupplöstamassflödes- och tryckmätningar visar kurvor med hysteres i tryck-massflödes-planet vilka kan skilja sig markant mellan raka och krökta inlopp medan medel-värdet bara påverkas nämnvärt.
Nyckelord: Turbulens, rörkrök, roterande flöde, pulserande flöde, tidsupplöststereoskopisk particle image velocimetry, varmtrådsanemometri, proper orthog-onal decomposition, turboladdare
vi
Preface
This doctoral thesis in fluid mechanics deals with turbulent flows in curvedpipes with special emphasis on the gas-exchange system of the internal com-bustion engine. The results in this thesis are from experimental work. Thethesis is divided into two parts, with Part I including an introduction to thefield and a literature review as well as a section where the experimental setupsand techniques used in the present work are presented. Part I ends with asection where the results and conclusions from this study are summarised anda section where the respondent’s contributions to the results are stated. Pleasenote that the respondent changed name during this doctoral project, therefore“Kalpakli” and “Kalpakli Vester” refer to the same person. Part II consists ofsix papers, three of which are published but have been adjusted to comply withthe present thesis’ format for consistency. Their content, however, is unchangedexcept from minor corrections. This research project was initiated by Prof. P.Henrik Alfredsson who has acted as main supervisor, whereas Dr. Ramis Örlüand Dr. Nils Tillmark were co-advisors.
May 2014, StockholmAthanasia Kalpakli Vester
Related publications and presentations
Below is a list of related work that has been partially performed by the authorduring the PhD study, but it is not included in this thesis.
Kalpakli, A., Örlü, R., Tillmark, N. and P. H. Alfredsson 2011 Pul-satile turbulent flow through pipe bends at high Dean and Womersley numbers.J. Phys.: Conf. Ser. 318, 092023.
Pastuhoff, M., Kalpakli, A. and P. H. Alfredsson 2013 Pressure andvelocity field measurements of pulsating flow in a square channel y-junction.Bull. Am. Phys. Soc. 54, N18, pp. 161–162.
Sattazardeh, S. S., Kalpakli, A. and Örlü, R. 2013 Hot-wire calibra-tion at low velocities: Revisiting the vortex shedding method. Advances Mech.Eng. 2013, 241726.
Schlatter, P., Noorani, A., Kalpakli, A. and Örlü, R. 2013 Coher-ent motions in turbulent flows through curved pipes. Proc. 14th EuropeanTurbulence Conf., 1–4 Sept. 2013, Lyon, France.
vii

viii

Contents
Abstract v
Sammanfattning vi
Preface vii
Part I. Overview and summary
Chapter 1. Introduction 11.1. Towards increased engine efficiency:
can fundamental research help? 31.2. Layout of thesis 4
Chapter 2. Turbulent flows in curved pipes 52.1. “Learn from yesterday ...” 52.2. “... never stop questioning” 92.3. Swirling flow in curved pipes 172.4. Pulsating motions in turbulent curved pipe flows ... 20
Chapter 3. Experimental setups and techniques 243.1. The rotating-pipe facility 243.2. The CICERO rig 273.3. Time-resolved stereoscopic particle image velocimetry 293.4. Hot-wire anemometry 333.5. Laser-Doppler Velocimetry 34
Chapter 4. Main contribution and conclusions 35
Chapter 5. Papers and authors contributions 40
ix

Acknowledgements 45
References 47
Part II. Papers
Paper 1. High Womersley number pulsatile turbulent flow pasta straight and bent pipe 59
Paper 2. Dean vortices in turbulent flow:rocking or rolling? 79
Paper 3. Turbulent pipe flow downstream a 90◦ pipe bend withand without superimposed swirl 85
Paper 4. Turbulent pipe flow past a pipe bend: effects ofupstream conditions and curvature ratio 109
Paper 5. Vortical patterns in turbulent flow downstream a 90◦
curved pipe at high Womersley numbers 139
Paper 6. Some observations of pulsating, curved pipe flow andits influence on turbine maps 161
x

Part I
Overview and summary

CHAPTER 1
Introduction
“The water just rushes out against the outer bank of the river atthe bend and so washes the bank away [...] it allows depositionto occur at the inner bank [...] The question arose to me: Whydoes not the inner bank wear away more than the outer one?”
James Thomson (1822–1892)
Indeed, many of us might have observed a similar behaviour of the waterflowing in a river when sitting close to a river bank, as described by Thomson(1876). The water rushes against the outer bank of the river whereas at theinner bank the velocity of water is much slower, allowing deposition of, forexample granular material. This is a real situation that researchers and engi-neers have to face often, even nowadays1, when for example bank erosion inmeandering rivers causes failure in constructions which are built near an outerriver bank.
This is a common example from nature which marks the striking effectsof streamline curvature on the motion of fluids. However, curved geometries—either open ones such as rivers or confined such as conduits2—do not onlyexist in nature. Almost everything surrounding us is curved and how could itbe otherwise, with the limited space we have been given to live in. From thecirculatory systems of humans and other mammals that consist of curved veins,arteries and capillaries to technical applications such as the internal combustionengine with its branches and conduits, curved geometries are greatly involvedin our everyday life.
On the other hand, the greek saying “τα πάντα ρέει”3, meaning that every-thing is constantly in κίνησης (kinesis) could not be more true. From the air
1For example, geologists and engineers in Farmington, Franklin County, Maine, USA are stillmaking major efforts to stop the erosion caused by the outer bank of the Sandy river by using“root wads”. The erosion is causing failures on one part of the Whittier road placed at theouter river bank. Source: personal communication with Prof. Thomas Eastler, Univerisityof Maine, Farmington, Franklin County, Maine, USA.2A clear distinction needs to be made between those since the effects of curvature are morestriking in open channels.3Heraclitus of Ephesus (c. 535–c. 475 BCE).
1
2 1. INTRODUCTION
around an aeroplane to the water in a river and air and fuel mixtures in en-gines, everything is flowing. To be able to understand fluid flows, is not alwaysstraightforward but gaining insight into the fluid dynamics of a flow is often ofvital technological importance.
The present thesis, focuses on the dynamics of turbulent flow in curvedpipes which is encountered in a number of technical applications such as heatexchangers, nuclear reactors, gas pipelines, internal combustion engines etc.Flows through bends are associated with strong secondary flow created dueto unbalanced centrifugal forces, whereas turbulent flow has been describedas unsteady, irregular, chaotic and unpredictable, which are the most difficultconcepts in fluid dynamics. Statistical and modelling tools have been devel-oped in order to predict and describe some of the aspects of turbulence but acomplete description of turbulence is not possible, at least to date. A fact thatmakes this problem even more complex, is that sometimes turbulence mightco-exist with a motion superimposed on the main flow. This can for examplebe a swirling motion (hydraulic plants, combustion chambers) or a pulsatilemotion (internal combustion engine, blood flow). Those superimposed motionsbear their own dynamical characteristics and together with the peculiarities ofturbulence and flows in bends, lead to complex flow phenomena. As statedin literature: “[...] unsteady flows in curved conduits are considerably morecomplex than those in straight conduits and exhibit phenomena not yet fullyunderstood” (Hamakiotes & Berger 1988), “[...] pulsatile flow through a curvedtube can induce complicated secondary flow with flow reversals and is verydifficult to analyse” (Kundu et al. 2012).
Within the present work, highly pulsatile and swirling turbulent flows thro-ugh curved pipes are studied experimentally. Studying such flows numericallyhas been proven in the past to be problematic due to lack of accurate turbu-lence models and sensitivity to grid resolution (Pruvost et al. 2004; Hellström2010). Numerical approaches—sometimes even direct numerical simulations—need validation against experiments (for example see the large-eddy simulationsperformed in Rütten et al. 2005; Fjällman et al. 2013). Therefore, the moti-vation of this study, is to gain a better understanding of the fluid dynamicsof turbulent flows in curved pipes which are prevalent in almost any industrialprocess involving fluid motion and to provide a quality experimental databaseto the CFD community.
1.1. TOWARDS INCREASED ENGINE EFFICIENCY 3
1.1. Towards increased engine efficiency:can fundamental research help?
The Internal Combustion (IC) engine is still the most common source for pow-ering both light- and heavy-duty road vehicles. With the increasing cost anddecreasing availability of fossil fuels as well as increasing concerns of green-housegases on the climate, focus has recently been set on increasing the efficiency ofthe IC engine without sacrificing performance. Similar concerns are relevantalso for engines running on alternative fuels.
The gas-exchange system has a prominent role in the development towardsmore efficient engines, where downsizing is, at least for light-duty vehicles,the name of the game. The gas-exchange system should efficiently providethe intake of fresh air to the engine as well as utilising the energy (heat) inthe exhaust gases, where an important, if not crucial, component is the tur-bocharger. However, the gas-exchange system is always a compromise betweenperformance and what is possible from a packaging viewpoint, e.g. the pipingsystem cannot be designed with straight pipes, the manifolds have complexgeometry resulting in non-ideal flow profiles etc. The design of such systems isusually made with the aid of one-dimensional models although it is known apriori that such models cannot give an accurate description of the flow dynam-ics. Testing in engine test benches together with empirical knowledge, ratherthan scientifically based experimentation, are also used to a large extent fordeveloping the design. Although one should not downgrade the importance ofthe experienced engineer, the following statement is clearly valid: “The chal-lenge of internal combustion require a broad collection of research discoveriesto make the transition from hardware intensive, experienced based fuel develop-ment and engine design to simulation intensive, science-based design” (Manleyet al. 2008).
In the present work certain aspects of the gas-exchange system are ap-proached from a basic scientific, rather than an engine application, viewpoint.Three specific aspects have been addressed, namely the turbulent flow throughcurved pipes, swirling turbulent curved pipe flow as well as highly pulsatingflow through bends, all features that are apparent within the gas-exchange sys-tem. As already mentioned in the previous section, such aspects on flows inpiping systems are not only dominant in internal combustion engines, but alsoin a number of other flow systems, and quite some efforts have been done ear-lier, but with other motivations, to investigate such conditions. On the otherhand the parameter ranges for the IC engine flows are quite specific and itis therefore necessary to make studies for the relevant values of the parame-ters. The present studies have been performed through idealised experiments,and the fact that the quote from Manley et al. (2008) above states that oneshould strive towards simulation intensive methods, such methods also need
4 1. INTRODUCTION
qualified boundary data and verification through quantitative scientific exper-iments. The aim of the present study is therefore to allow the reader mainlyinterested in IC engines per se to realise that it is both important and rewardingto go outside the immediate neighbourhood of the engine aspects to get a betterunderstanding of the physical processes important for engine performance.
1.2. Layout of thesis
The thesis is organised as follows: Part I continues with chapter 2 where aliterature review is presented for flows in curved pipes with special focus onturbulent flow with and without superimposed pulsatile and swirling motion.Thereafter, in chapter 3, the experimental setups and techniques which wereused during this project are described while in chapter 4 a summary of the mostimportant results and authors’ contributions is made. Part I ends with a listof publications and conferences where some of the results have been presentedas well as a comprehensive reference list. Part II of the thesis, contains themain results organised in the form of six papers. Two of them (of which one isa short paper) deal with turbulent curved pipe flow without any superimposedmotion whereas one of them deals with swirling and two with pulsatile turbulentflow in curved pipes. The last paper is presenting results from measurementsperformed in a turbocharger rig with and without a pipe bend mounted at theinlet of the turbine.
CHAPTER 2
Turbulent flows in curved pipes
“Learn from yesterday, live for today, hope for tomorrow. Theimportant thing is not to stop questioning.”
Albert Einstein (1879–1955)
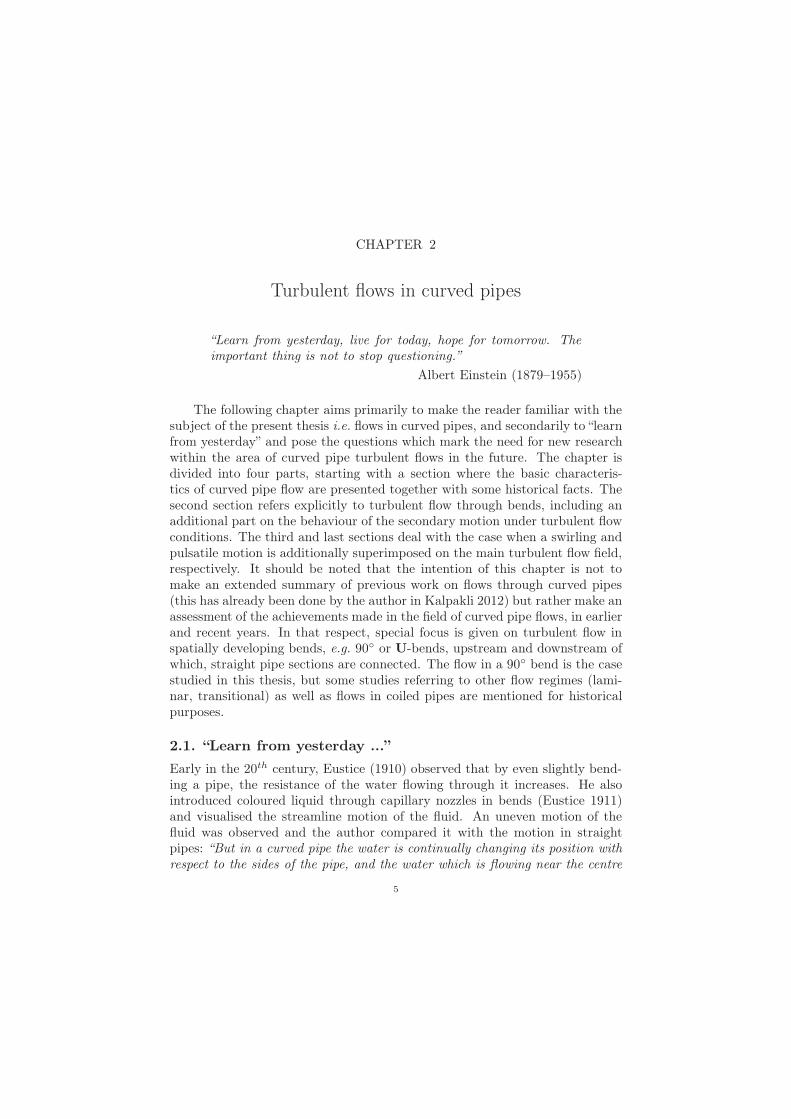
The following chapter aims primarily to make the reader familiar with thesubject of the present thesis i.e. flows in curved pipes, and secondarily to “learnfrom yesterday” and pose the questions which mark the need for new researchwithin the area of curved pipe turbulent flows in the future. The chapter isdivided into four parts, starting with a section where the basic characteris-tics of curved pipe flow are presented together with some historical facts. Thesecond section refers explicitly to turbulent flow through bends, including anadditional part on the behaviour of the secondary motion under turbulent flowconditions. The third and last sections deal with the case when a swirling andpulsatile motion is additionally superimposed on the main turbulent flow field,respectively. It should be noted that the intention of this chapter is not tomake an extended summary of previous work on flows through curved pipes(this has already been done by the author in Kalpakli 2012) but rather make anassessment of the achievements made in the field of curved pipe flows, in earlierand recent years. In that respect, special focus is given on turbulent flow inspatially developing bends, e.g. 90◦ or U-bends, upstream and downstream ofwhich, straight pipe sections are connected. The flow in a 90◦ bend is the casestudied in this thesis, but some studies referring to other flow regimes (lami-nar, transitional) as well as flows in coiled pipes are mentioned for historicalpurposes.
2.1. “Learn from yesterday ...”
Early in the 20th century, Eustice (1910) observed that by even slightly bend-ing a pipe, the resistance of the water flowing through it increases. He alsointroduced coloured liquid through capillary nozzles in bends (Eustice 1911)and visualised the streamline motion of the fluid. An uneven motion of thefluid was observed and the author compared it with the motion in straightpipes: “But in a curved pipe the water is continually changing its position withrespect to the sides of the pipe, and the water which is flowing near the centre
5
6 2. TURBULENT FLOWS IN CURVED PIPES
at one part approaches the sides as it moves through the pipe and flowing nearthe sides it exerts a ‘scouring’ action on the pipe wall”.
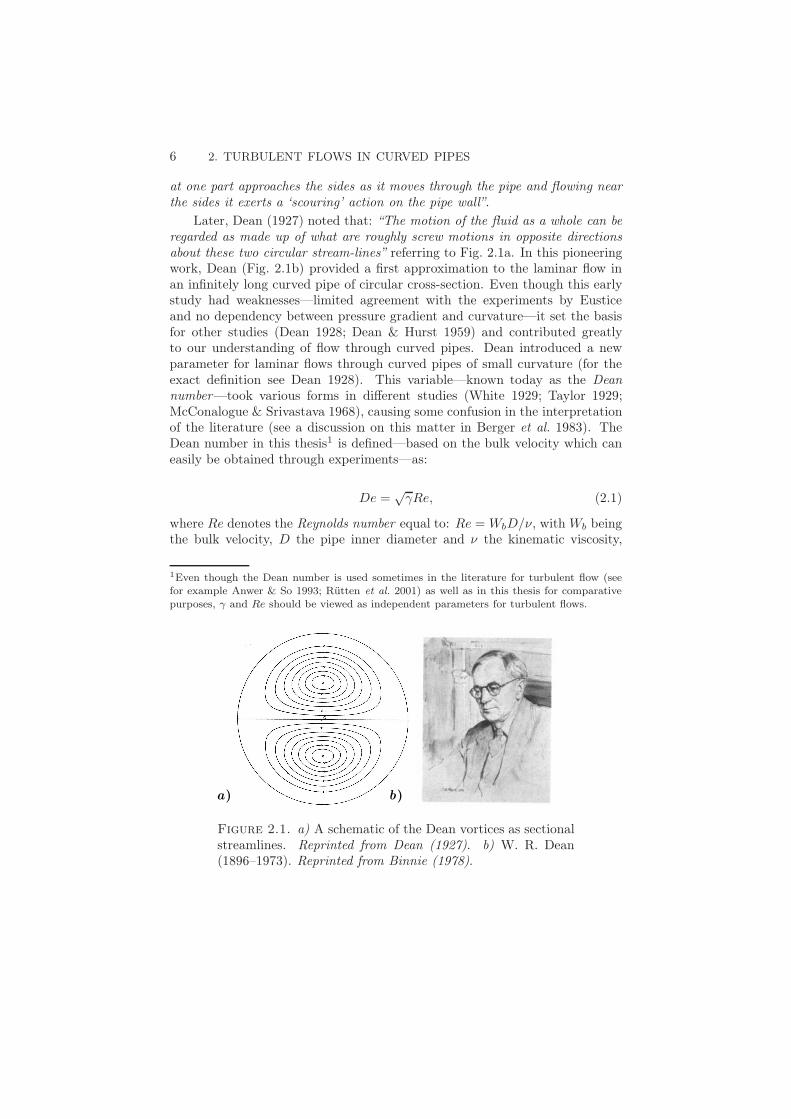
Later, Dean (1927) noted that: “The motion of the fluid as a whole can beregarded as made up of what are roughly screw motions in opposite directionsabout these two circular stream-lines” referring to Fig. 2.1a. In this pioneeringwork, Dean (Fig. 2.1b) provided a first approximation to the laminar flow inan infinitely long curved pipe of circular cross-section. Even though this earlystudy had weaknesses—limited agreement with the experiments by Eusticeand no dependency between pressure gradient and curvature—it set the basisfor other studies (Dean 1928; Dean & Hurst 1959) and contributed greatlyto our understanding of flow through curved pipes. Dean introduced a newparameter for laminar flows through curved pipes of small curvature (for theexact definition see Dean 1928). This variable—known today as the Deannumber—took various forms in different studies (White 1929; Taylor 1929;McConalogue & Srivastava 1968), causing some confusion in the interpretationof the literature (see a discussion on this matter in Berger et al. 1983). TheDean number in this thesis1 is defined—based on the bulk velocity which caneasily be obtained through experiments—as:
De =√γRe, (2.1)
where Re denotes the Reynolds number equal to: Re = WbD/ν, with Wb beingthe bulk velocity, D the pipe inner diameter and ν the kinematic viscosity,
1Even though the Dean number is used sometimes in the literature for turbulent flow (seefor example Anwer & So 1993; Rütten et al. 2001) as well as in this thesis for comparativepurposes, γ and Re should be viewed as independent parameters for turbulent flows.
a) b)
Figure 2.1. a) A schematic of the Dean vortices as sectionalstreamlines. Reprinted from Dean (1927). b) W. R. Dean(1896–1973). Reprinted from Binnie (1978).
2.1. “LEARN FROM YESTERDAY ...” 7
whereas the curvature ratio is γ = R/Rc with R the pipe radius (= D/2) andRc the radius of curvature of the centreline.
From an early stage (White 1929; Taylor 1929; McConalogue & Srivastava1968; Greenspan 1973) it was appreciated that the flow through curved pipesis significantly more complex than the flow through straight pipes. If a fluidis moving along a pipe which is initially straight but after some point becomescurved, the bend will force the fluid particles to change their main directionof motion. The flow motion will not be parallel to the pipe axis anymore butsecondary flow must be present, such as the one described by Dean (1927).A lateral force (∼ W 2/Rc) is experienced by the fluid particles as they movewith a velocity W along the curved path with radius Rc. The particles closeto the pipe walls are moving with the lowest velocity due to no-slip condition,whereas the particles close to the pipe centreline move with the highest velocityand thus are subjected to the largest centrifugal force. This will cause the fastermoving fluid near the centre to be swept towards the outer wall of the bend.This kind of flow cannot be regarded as a linear superposition of two separatemotions but rather as an interaction between the streamwise and transversevelocity components which makes the study of such flows complicated.
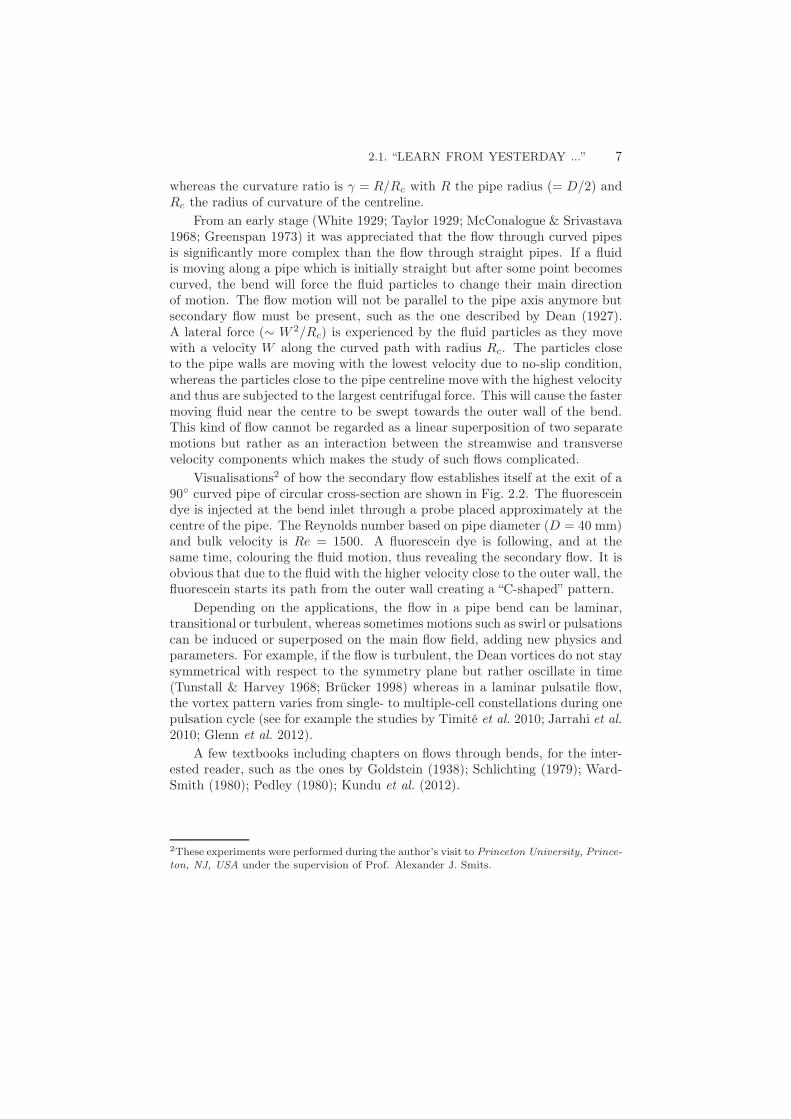
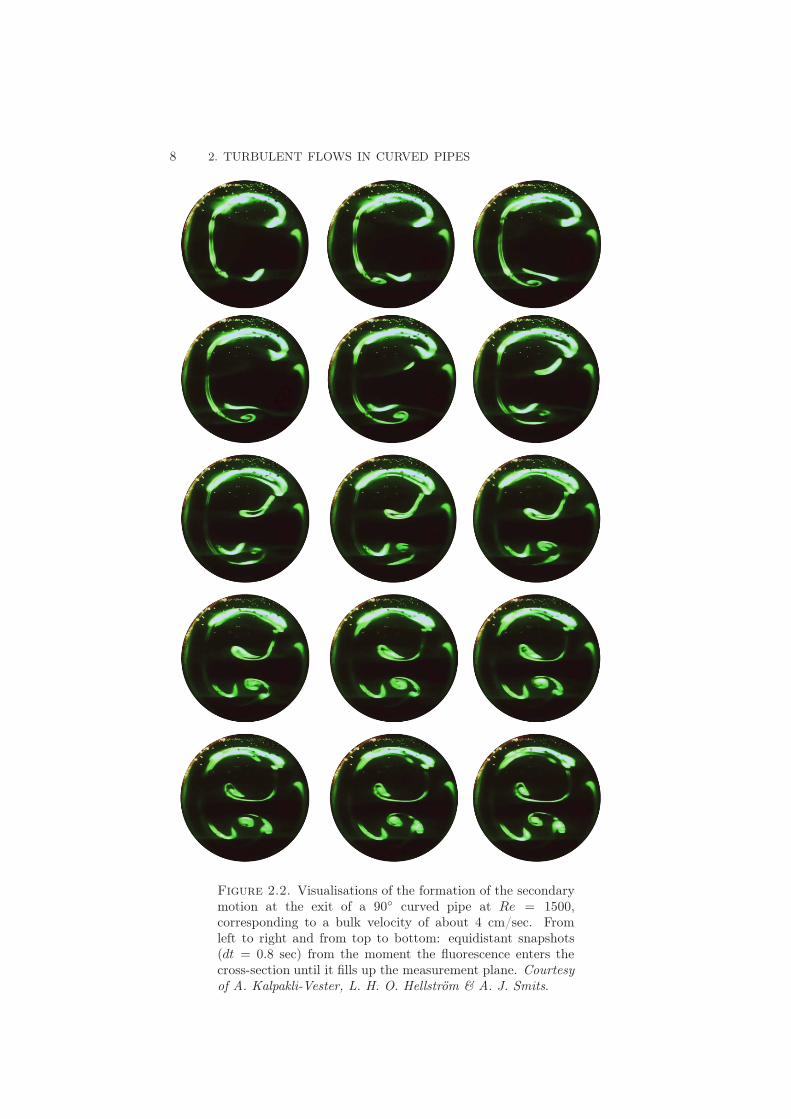
Visualisations2 of how the secondary flow establishes itself at the exit of a90◦ curved pipe of circular cross-section are shown in Fig. 2.2. The fluoresceindye is injected at the bend inlet through a probe placed approximately at thecentre of the pipe. The Reynolds number based on pipe diameter (D = 40 mm)and bulk velocity is Re = 1500. A fluorescein dye is following, and at thesame time, colouring the fluid motion, thus revealing the secondary flow. It isobvious that due to the fluid with the higher velocity close to the outer wall, thefluorescein starts its path from the outer wall creating a “C-shaped” pattern.
Depending on the applications, the flow in a pipe bend can be laminar,transitional or turbulent, whereas sometimes motions such as swirl or pulsationscan be induced or superposed on the main flow field, adding new physics andparameters. For example, if the flow is turbulent, the Dean vortices do not staysymmetrical with respect to the symmetry plane but rather oscillate in time(Tunstall & Harvey 1968; Brücker 1998) whereas in a laminar pulsatile flow,the vortex pattern varies from single- to multiple-cell constellations during onepulsation cycle (see for example the studies by Timité et al. 2010; Jarrahi et al.2010; Glenn et al. 2012).
A few textbooks including chapters on flows through bends, for the inter-ested reader, such as the ones by Goldstein (1938); Schlichting (1979); Ward-Smith (1980); Pedley (1980); Kundu et al. (2012).
2These experiments were performed during the author’s visit to Princeton University, Prince-
ton, NJ, USA under the supervision of Prof. Alexander J. Smits.
8 2. TURBULENT FLOWS IN CURVED PIPES
Figure 2.2. Visualisations of the formation of the secondarymotion at the exit of a 90◦ curved pipe at Re = 1500,corresponding to a bulk velocity of about 4 cm/sec. Fromleft to right and from top to bottom: equidistant snapshots(dt = 0.8 sec) from the moment the fluorescence enters thecross-section until it fills up the measurement plane. Courtesyof A. Kalpakli-Vester, L. H. O. Hellström & A. J. Smits.
2.2. “... NEVER STOP QUESTIONING” 9
2.2. “... never stop questioning”
“I am an old man now, and when I die and go to heaven there aretwo matters on which I hope for enlightenment. One is quantumelectrodynamics, and the other is the turbulent motion of fluids.And about the former I am rather optimistic.”
Horace Lamb (1849–1934)
Turbulence has been characterised from chaotic and random to a flow con-dition that “drives engineers nuts” (Vergano 2006). That is, as Vergano pointsout: “[...] because turbulence disrupts and drags air, gas and liquids that flowin and on everything from pipelines to airplane wings to artificial heart valves[...] in ways both costly and unpredictable.”
Even though it is rather obvious that in most engineering equipment in-volving fluid flow, turbulence co-exists with streamline curvature, much of theinterest of scientists has long been focussed on turbulence in straight conduits.Turbulent curved pipe flow is encountered in many technical applications rang-ing from nuclear reactors (Ono et al. 2010) to reciprocating engines. Despitetheir direct practical relevance (Vashisth et al. 2008), such flows have not beeninvestigated within the fluid dynamics community as much as turbulent flowsin straight pipes—which of course are also of great importance. One of the dif-ficulties that an experimentalist has to face when performing measurements incurved pipe flows is that all velocity components need to be obtained since thesecondary flow might contaminate the data e.g. obtained with a single hot-wire.On the other hand, even though numerical work might be favoured, direct nu-merical simulations are computationally expensive and usually restricted to lowReynolds numbers, whereas turbulence models (including Reynolds-averagedNavier-Stokes) as well as large-eddy simulations are sensitive to grid resolutionand have been found problematic in capturing the secondary flow in the past(see for example Hellström 2010; Fjällman et al. 2013), thus validation throughcomparison with experimental data is necessary.
2.2.1. The characteristics of turbulence in curved pipes?
The transition to turbulence is known to occur at higher Reynolds numbers ina curved pipe, compared to a straight one, as shown early by Taylor (1929).However, no universal critical Reynolds number for curved pipes has been foundso far, as it exists for straight pipes. Some relations for the critical Reynoldsnumber for curved pipes proposed by different studies can be found in Ward-Smith (1980) and Spedding & Benard (2004), whereas a more recent one canbe found in Piazza & Ciofalo (2011). Much effort has also been done on de-termining the relation between wall friction and flow rate in turbulent curvedpipe flows. One of the most well-known studies on this matter is the one by
10 2. TURBULENT FLOWS IN CURVED PIPES
Ito (1959) where the correlation between the friction factor and flow rate wasdeduced through a series of experiments.
Between the early 70’s and late 90’s, a series of studies were performedon mean quantities (velocity, pressure) and turbulence statistics along bends.Rowe (1970) measured the total pressure variation along a 180◦ bend withRe = 2.36 × 10⁵ and γ = 0.042. It was shown that the secondary motionis strongest 30◦ from the bend inlet, whereas for larger angles it reduced instrength until it reached a steady value at 90◦. However, this work providedonly information on the mean flow behaviour and nothing on the turbulencecharacteristics. Later, Patankar et al. (1975) used the k − ǫ model to simulatethe experiments by Rowe and concluded that “[...] the turbulence modellingrequires improvement”. This would not be the only time when turbulencemodels provided unsatisfactory agreement with experimental data for curvedpipe flows (see e.g. Pruvost et al. 2004; Hellström 2010). Enayet et al. (1982)studied the mean streamwise velocity and corresponding turbulence intensityas well as static-pressure variation across a 90◦ bend by means of laser Dopplervelocimetry (LDV) for γ = 0.17 and Reynolds numbers up to Re = 4.3 × 10⁴.The secondary flow was found to strongly depend on Re. Azzola et al. (1986)investigated the flow through a U-bend for Re = 5.74 × 10⁴ and 11 × 104
and γ = 0.15. The three velocity components were measured by means ofLDV and the experimental results were compared with results from simulations(eddy-viscosity model). As the flow passes through the bend, the r.m.s of thelongitudinal and circumferential velocities was found to increase due to theadditional mean strain associated with the turning of the primary flow and thesecondary-flow velocity gradients created. The agreement between numericaland experimental data was found to be somewhat acceptable by the authors.The largest disagreement between experimental and numerical data was foundfor the flow field downstream of the bend, even though secondary velocities aregradually decreasing in strength as the flow recovers from the bend.
In a straight duct with non-circular cross-section, it is known that stream-wise vortices are formed due to local variation in Reynolds stresses and areknown as Prandtl’s secondary flow of the second kind or “turbulence-driven”secondary flow (Bradshaw 1987)—whereas the secondary flow of first kind isinduced by skewing of the mean flow in curved channels. For curved pipes, theexistence of turbulence-driven secondary flow has been investigated to someextent. Experimental and numerical studies investigated the existence of aturbulence-driven cell, appearing within the bend, in conjunction with the Deancells and a separation cell at the inner bend (Anwer et al. 1989; Azzola et al.1986; Lai et al. 1991). For example, Lai et al. (1991) performed computationsusing a Reynolds stress model and showed the existence of three vortex pairswithin a U-bend at Re = 5× 10⁴ and γ = 0.077. The primary vortex pair wasthe Dean vortices which is driven by the centrifugal forces and is always presentin a curved pipe. A second pair existed near the pipe core as a consequence
2.2. “... NEVER STOP QUESTIONING” 11
of local imbalance between the centrifugal force and the pressure gradient andlast, a third pair of vortices was found near the outer bend embedded in theDean vortices. This pair of vortices started to appear around 60◦ from thebend entrance, reached a maximum strength at the bend exit and disappearedat about 7D downstream distance from the bend. This additional pair or vor-tices was not found for developing laminar curved-pipe flows. Therefore, itwas believed that this is a secondary flow driven due to the anisotropy of theturbulent normal stresses and their gradients. Those results agreed qualitativewith experiments (Anwer et al. 1989; Azzola et al. 1986) but no quantitativecomparison was made by the authors.
Hot-wire measurements of the three velocity components in a 90◦ bendat Re = 6 × 10⁴ and γ = 0.5 were performed by Sudo et al. (1998). Theyshowed that at the inlet part up to 30◦ bend angle the high flow velocitywas shifted towards the inner wall, and at 30◦ bend angle the Dean vorticeswere formed. Due to the action of the Dean vortices the high velocity fluidwas moved towards the outer wall. Finally at the exit of the 90◦ bend, themain flow was non-uniform with the high velocity towards the outer wall andthe low velocity towards the inner wall. The distribution of the streamwisevelocity became smoother as the distance from the bend increased whereas theDean vortices started to break down. However, the influence of the bend onthe flow persisted even at 10D distance from the bend exit. The turbulenceintensity increased in the outer part of the cross section between 0◦ and 30◦,in response to an increase of the longitudinal velocity gradients in the radialdirection. However, high values of turbulence intensity were found at the innerpipe wall at 60◦. At 90◦ bend angle, the maxima of the turbulence intensity—avalue of approximately 18%—was settled at the inner bend.
This section—although focussing on spatially developing bends—would beincomplete without mentioning some selected studies on infinitely long bends,including some recent efforts to study turbulent curved pipe flows by directnumerical simulations (DNS). However, the differences between the two ge-ometries i.e. 90◦ bends and torus as well as the possibility that those mightaffect turbulence differently, should be kept in mind.
A first effort to employ large-eddy simulations (LES) considering an infin-itely long bent pipe using periodic boundary conditions was done by Boersma& Nieuwstadt (1996). The authors motivated the study by the fact that upto that point, mainly data from single-point measurements were available withexception of some numerical studies, which however were restricted to smallcurvature ratios (Patankar et al. 1975; Lai et al. 1991). Results for the meanflow as well as r.m.s. fluctuations were presented for γ = 0.01 and 0.05. Thesimulations showed that the r.m.s. is enhanced at the outside of the bend andsuppressed at the inside, whereas in contrast to straight pipe flow, the Reynoldsstresses were found to be large at the centre of the pipe. However, this work
12 2. TURBULENT FLOWS IN CURVED PIPES
could only be validated against experiments regarding the mean axial velocityprofile, since no data to validate turbulence statistics were available.
A similar study was performed by Hüttl & Friedrich (2001) where turbulentstatistics in an infinitely long bent pipe were studied by DNS. The Reynoldsnumber based on the bulk velocity was given as Re = 5.632 × 10³ and thecurvature ratio was γ = 0.1. The main conclusion from that work was thatthe turbulence intensity in a curved pipe is lower compared to a straight pipe.Fully developed turbulent flow in straight and curved pipes (γ = 0.01 and 0.1)at moderate Reynolds numbers (Re = 5.3× 10³ and 11.7× 10³) was studied inNoorani et al. (2013) using DNS. The local axial wall shear stress was foundto be significantly higher at the outer wall compared to the inner side. For thehighest Re and γ case studied, the wall shear showed a plateau at the innerwall indicating relaminarisation, whereas distinct oscillations were found nearthe outer wall. The Dean vortices were observed for γ = 0.01 but for the highercurvature ratio case, the core of the vortices moved towards the side walls anda distinct bulge region appeared in the pipe centre. More recently, Di Libertoet al. (2013) investigated the turbulent flow in curved pipes for γ = 0.1 and0.3 and for Re = 1.5 × 10⁴ and 1.2 × 10⁴, respectively, also by DNS. Theoverall turbulence levels decreased for a curved pipe compared to the straightone, whereas increasing the curvature ratio led to a further reduction of theturbulence levels.
The aforementioned studies provided mainly mean velocity profiles and tur-bulence statistics. Even though they reveal some interesting flow phenomena incurved pipes, they address the need for more detailed data which will expandour understanding on how the instantaneous secondary flow is affected by dif-ferent conditions i.e. curvature ratio, Reynolds number, upstream conditionsetc.
2.2.2. “Swirl-switching” — rocking or rolling?
As it has already been mentioned in § 2.1, if the flow in the bend is turbulent,the Dean vortices are symmetric with respect to the symmetry plane onlyin a time-averaged sense, whereas instantaneously they exhibit an oscillatorycharacter. Tunstall & Harvey (1968) (in the following referred to as TH68)were the first to show that the turbulent flow through sharp bends differs fromthe classical vortex pattern existing for laminar curved pipe flow. At first, theyperformed a series of flow visualisations in an elbow (γ → ∞) and showedthe existence of a separated region at the inner corner of the bend which wasnot symmetrical but displaced to either side of the plane of symmetry. At thesame time a single vortex was switching (counter)clockwise in the azimuthaldirection with a frequency corresponding to a Strouhal number (defined as:St = fD/Wb, where f the frequency) of 0.002. A flag placed between golden-plated contacts was additionally mounted where the switching of the vortex wasdetected earlier. The output from a transducer placed somewhat upstream of
2.2. “... NEVER STOP QUESTIONING” 13
the flag also showed that the flow was dominated by two distinct states, ananti-clockwise and a clockwise state. Spectra of the axial velocity componentand wall-pressure close to the outer and at the inner pipe wall showed theexistence of two peaks at frequencies of 65 Hz and 120 Hz, corresponding toStrouhal numbers equal to 0.189 and 0.35, respectively. The mean frequencyof the switching was found to correspond to St = 0.002, agreeing with thevisualisations. It was suggested that this flow is bi-stable and the cause for thismotion is the separation bubble at the inner bend which can change positionalong the pipe circumference and thus biasing the main flow in one half of thepipe. Furthermore, it was suggested that the origin of the switching is relatedto the turbulence of the flow upstream of the bend and that a sufficiently largeperturbation is needed in order for the flow to switch. To account for Reynoldsand curvature ratio effects, a series of measurements were performed for γ upto unity and a Reynolds number range between Re = 4×10⁴ and 22×104. Theswitching occurred for all cases with the switching frequency increasing withthe Reynolds number. The Strouhal numbers corresponding to the switchingfrequencies for the aforementioned Re range, were between below 0.001 and0.004.
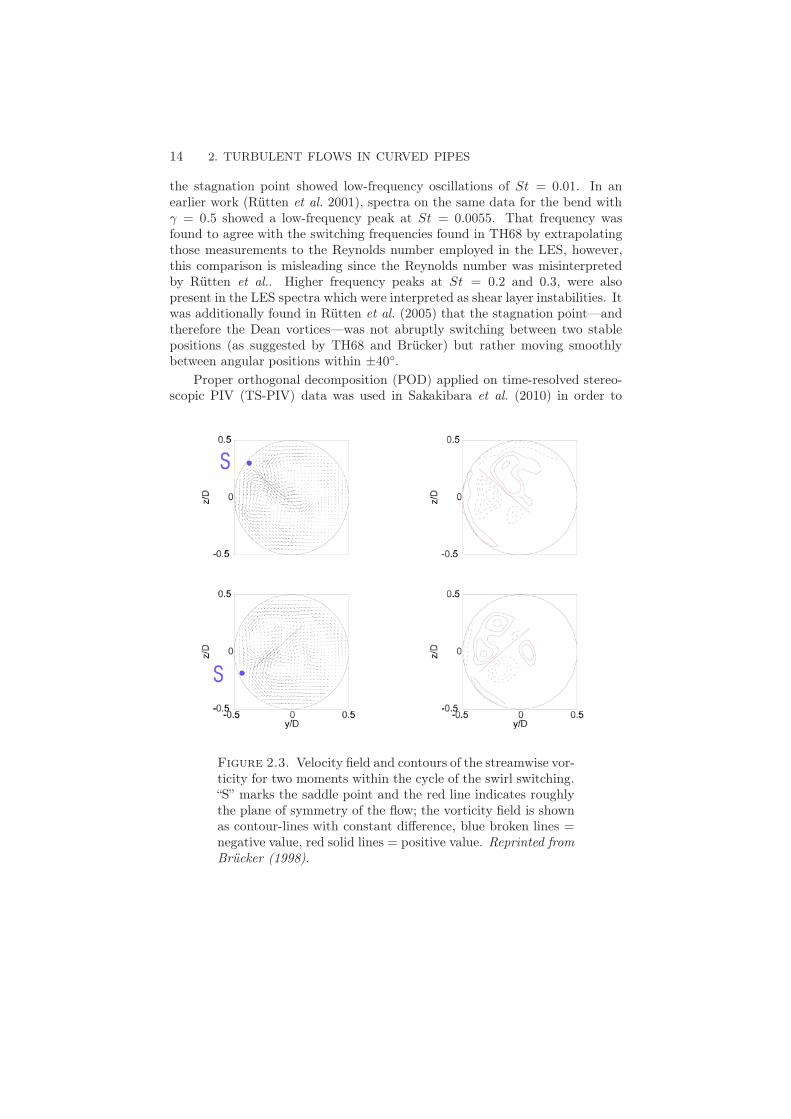
In Brücker (1998), two-dimensional, two-component (2D2C) particle imagevelocimetry (PIV) measurements were performed in a sharp bend (γ = 0.5) forRe = 2 × 10³ and 5 × 10³. For the lowest Reynolds number the switching ofthe secondary flow as described by TH68 was not observed. However, for thehigher Reynolds number case, at which the flow is expected to be turbulent,the Dean vortices were found to “rock” with respect to the plane of symmetry(Fig. 2.3) with a frequency corresponding to St = 0.12. Spectral peaks at lower(St = 0.03) and higher (St = 0.2) frequencies were also present. This supportedthat such oscillatory motion exists only for turbulent flows as suggested inTH68.
In more recent years, the interest in the behaviour of the Dean vorticesin turbulent flows has increased successively, in the fluid dynamic commu-nity. Until the beginning of the 21st century, only the two aforementionedstudies were available on the matter and the swirl-switching—with the one byBrücker (1998) being the only one providing quantitative visualisations of thephenomenon—was thought to be an abrupt domination of one of the two Deanvortices and to be related to the inner-corner separation region.
LES by Rütten et al. (2005) in a sharp (γ = 0.5) and mild bend (γ =0.17) at Re = 2.7 × 10⁴ showed that the swirl-switching is not caused by theseparation at the inner bend corner. Spectra of the forces onto the pipe wallsshowed distinct peaks for both bends even though separation was not observedfor the mildly curved pipe. Spectral analysis was also performed on the timeseries of the position of the stagnation point to check whether a correlationexists between the forces on the walls, the stagnation point movement and thealternating domination of the Dean vortices. Both spectra from the forces and
14 2. TURBULENT FLOWS IN CURVED PIPES
the stagnation point showed low-frequency oscillations of St = 0.01. In anearlier work (Rütten et al. 2001), spectra on the same data for the bend withγ = 0.5 showed a low-frequency peak at St = 0.0055. That frequency wasfound to agree with the switching frequencies found in TH68 by extrapolatingthose measurements to the Reynolds number employed in the LES, however,this comparison is misleading since the Reynolds number was misinterpretedby Rütten et al.. Higher frequency peaks at St = 0.2 and 0.3, were alsopresent in the LES spectra which were interpreted as shear layer instabilities. Itwas additionally found in Rütten et al. (2005) that the stagnation point—andtherefore the Dean vortices—was not abruptly switching between two stablepositions (as suggested by TH68 and Brücker) but rather moving smoothlybetween angular positions within ±40◦.
Proper orthogonal decomposition (POD) applied on time-resolved stereo-scopic PIV (TS-PIV) data was used in Sakakibara et al. (2010) in order to
Figure 2.3. Velocity field and contours of the streamwise vor-ticity for two moments within the cycle of the swirl switching.“S” marks the saddle point and the red line indicates roughlythe plane of symmetry of the flow; the vorticity field is shownas contour-lines with constant difference, blue broken lines =negative value, red solid lines = positive value. Reprinted fromBrücker (1998).
2.2. “... NEVER STOP QUESTIONING” 15
identify the switching motion of the Dean vortices. Data were acquired at 2D-15D distances downstream the bend exit for Re = 12× 104 and γ = 0.75. Theswirl switching was reconstructed using the most energetic modes, that are themode representing the mean and the first two modes related to the fluctuatingpart of the flow. It was shown that the most energetic mode related to thefluctuations in the flow at the 2D station, resembles the switching motion asdescribed in TH68 i.e. a single vortex switching direction alternatively fromanti-clockwise to clockwise rotation. However, this mode decayed as the flowevolved from 2D further downstream and became weaker than the mode whichwas the second most energetic at 2D. This second mode was found to be re-sponsible for a rotation of the plane of symmetry of the Dean cells as describedin Brücker (1998). Furthermore, spectra of the second temporal mode at 2Dshowed a peak at St = 0.07.
In a follow-up paper, Sakakibara & Machida (2012) addressed the con-nection between upstream conditions and the swirl switching mechanism forRe = 2.7 × 10⁴ and γ = 0.5. The azimuthal displacement of the stagnationpoint was found to be correlated to streaks existing upstream of the bend withlengths of 7–8D. Those streaks were thought to be related to the very large-scale motions (VLSM, see for example Guala et al. 2006), though being muchshorter in length. The authors concluded that the streaks are responsible forthe oscillatory motion of the vortices, which opened new possibilities for ex-plaining the origin of the swirl switching.
A similar effort as the one made in Sakakibara et al. (2010) i.e. to identifythe origin of the swirl switching through POD analysis, was done in Hellströmet al. (2013). The Reynolds number in this study was Re = 2.5× 10⁴, whereasthe curvature ratio was 0.5. Flow fields at three downstream distances fromthe bend exit (5D, 12D and 18D) were acquired by means of TS-PIV. In thatcase the reconstruction of the swirl switching was done considering only themost energetic modes related to the fluctuating part of the flow i.e. the moderepresenting the mean was not included. This was based on the fact that inan earlier work (Hellström et al. 2011) the Dean vortices were seen only inthe mean vorticity maps and not in the instantaneous ones. Therefore, theauthors concluded that the Dean vortices are a very weak feature in the flowfield and they were, therefore, not considered in the reconstruction process inHellström et al. (2013). Additionally, the Dean vortices in the mean vorticitymap were not symmetrical and as the authors remarked: “the mean vorticity[...] shows the tilted Dean motion as mentioned by Brücker (1998). The meanflow structures are, however, not evident among the much higher levels ofinstantaneous vorticity” (Hellström et al. 2013). It should, however be keptin mind, that in any turbulent flow the levels of instantaneous vorticity willalways be higher than in the mean. Furthermore, small turbulent scales whichcannot be resolved due to the limited spatial resolution of the PIV, will appearas noise in the instantaneous vorticity maps. Therefore in order to obtain a
16 2. TURBULENT FLOWS IN CURVED PIPES
meaningful representation of the flow field, appropriate filtering of the data, inorder to suppress the smalls scales, is important.
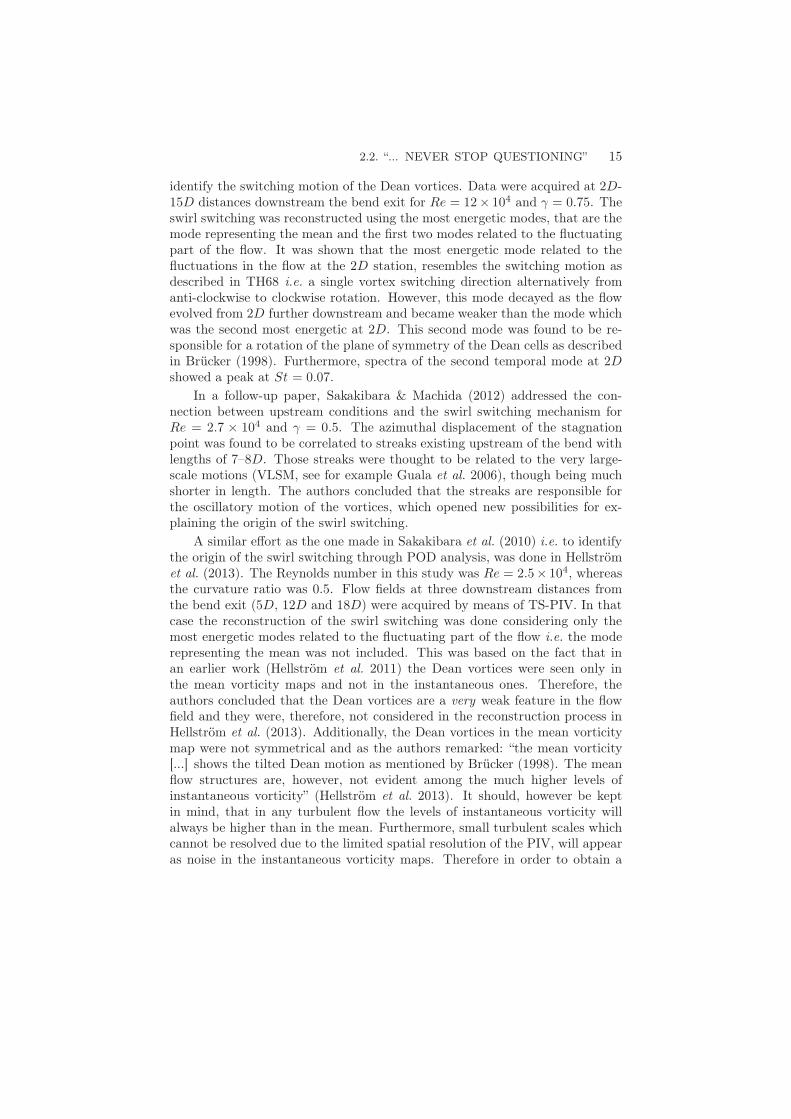
The first POD mode at all downstream stations, depicted a single vor-tex spanning the entire cross-section and rotating in the clockwise and anti-clockwise direction as the flow evolved downstream the bend (Fig. 2.4). Thismode was found to be associated with St = 0.33 through spectra of its tem-poral counterpart. The second and third mode depicted two Dean cells tiltedwith respect to the plane of symmetry with one of the cells being considerablysuppressed. The second mode was associated with St = 0.16. The authorsconclude that the tilting of the Dean cells is a transitional state between twostates of the swirl switching, during which one of the cells is being suppressedresulting in a single vortex (shown as mode 1 in the POD analysis). The timescale of those transitions corresponded to structures of length 0.25–2.5D. Fi-nally, it was surmised that the suppression of one of the Dean cells was relatedto the shear flow region at the inner bend corner which is in return sensitive toupstream conditions, supporting the findings by Sakakibara & Machida (2012).
Figure 2.4. First three POD modes for Re = 2.5×10⁴, (a, d,g) 5D, (b, e, h) 12D and (c, f, i) 18D; (a-c) Mode 1, (d-f) Mode2 and (g-i) Mode 3. The inner and outer stagnation point isindicated with open and filler circles, respectively. Reprintedfrom Hellström et al. (2013).
2.3. SWIRLING FLOW IN CURVED PIPES 17
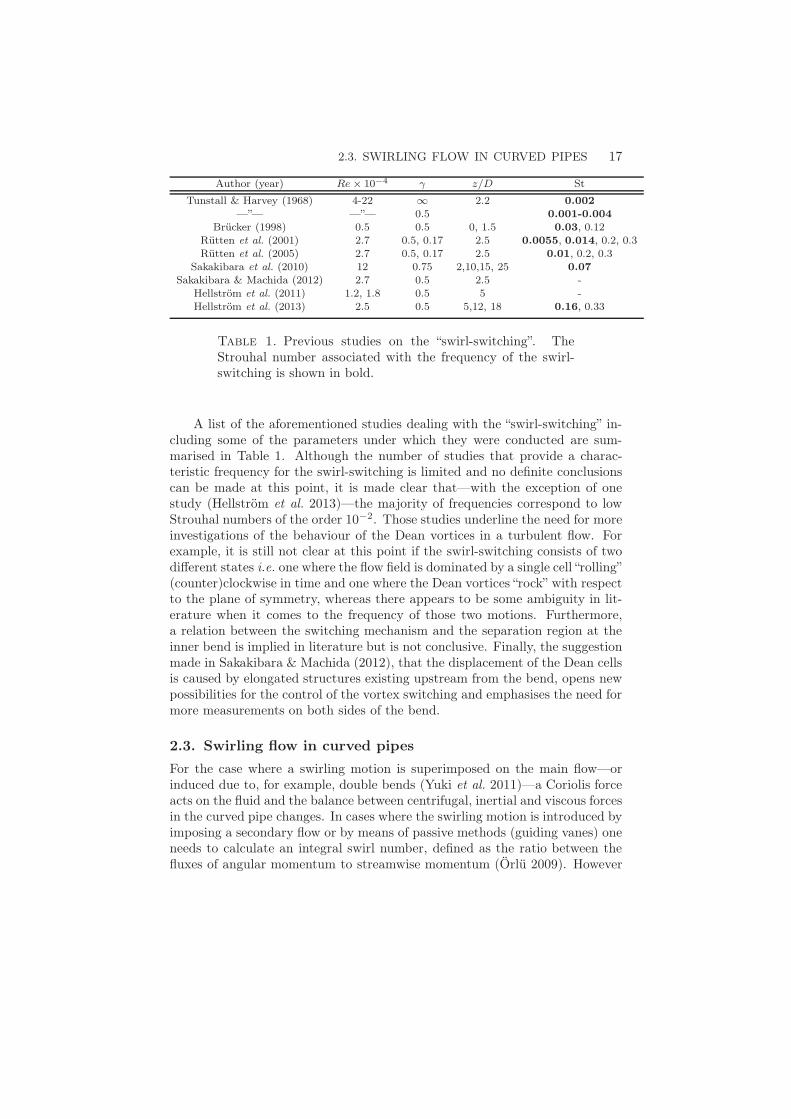
Author (year) Re× 10−4 γ z/D St
Tunstall & Harvey (1968) 4-22 ∞ 2.2 0.002
—”— —”— 0.5 0.001-0.004
Brücker (1998) 0.5 0.5 0, 1.5 0.03, 0.12Rütten et al. (2001) 2.7 0.5, 0.17 2.5 0.0055, 0.014, 0.2, 0.3Rütten et al. (2005) 2.7 0.5, 0.17 2.5 0.01, 0.2, 0.3
Sakakibara et al. (2010) 12 0.75 2,10,15, 25 0.07
Sakakibara & Machida (2012) 2.7 0.5 2.5 -Hellström et al. (2011) 1.2, 1.8 0.5 5 -Hellström et al. (2013) 2.5 0.5 5,12, 18 0.16, 0.33
Table 1. Previous studies on the “swirl-switching”. TheStrouhal number associated with the frequency of the swirl-switching is shown in bold.
A list of the aforementioned studies dealing with the “swirl-switching” in-cluding some of the parameters under which they were conducted are sum-marised in Table 1. Although the number of studies that provide a charac-teristic frequency for the swirl-switching is limited and no definite conclusionscan be made at this point, it is made clear that—with the exception of onestudy (Hellström et al. 2013)—the majority of frequencies correspond to lowStrouhal numbers of the order 10−2. Those studies underline the need for moreinvestigations of the behaviour of the Dean vortices in a turbulent flow. Forexample, it is still not clear at this point if the swirl-switching consists of twodifferent states i.e. one where the flow field is dominated by a single cell “rolling”(counter)clockwise in time and one where the Dean vortices “rock” with respectto the plane of symmetry, whereas there appears to be some ambiguity in lit-erature when it comes to the frequency of those two motions. Furthermore,a relation between the switching mechanism and the separation region at theinner bend is implied in literature but is not conclusive. Finally, the suggestionmade in Sakakibara & Machida (2012), that the displacement of the Dean cellsis caused by elongated structures existing upstream from the bend, opens newpossibilities for the control of the vortex switching and emphasises the need formore measurements on both sides of the bend.
2.3. Swirling flow in curved pipes
For the case where a swirling motion is superimposed on the main flow—orinduced due to, for example, double bends (Yuki et al. 2011)—a Coriolis forceacts on the fluid and the balance between centrifugal, inertial and viscous forcesin the curved pipe changes. In cases where the swirling motion is introduced byimposing a secondary flow or by means of passive methods (guiding vanes) oneneeds to calculate an integral swirl number, defined as the ratio between thefluxes of angular momentum to streamwise momentum (Örlü 2009). However
18 2. TURBULENT FLOWS IN CURVED PIPES
in the present work the mean velocity both in axial and tangential directionare well defined by rotating the whole pipe around its streamwise axis (see§ 3). The intensity of the imposed swirling motion can then be expressed bythe swirl number which is defined as:
S =Vw
Wb
, (2.2)
where Vw is the rotational speed of the pipe wall.The case of a turbulent swirling flow through a 180◦ curved pipe with
γ = 0.077 and Re = 5 × 10⁴ was examined experimentally in Anwer & So(1993). The effects of swirl of intensity S = 1 on the secondary flow wereexamined through a comparison with non-swirling flow data acquired in thesame setup. Wall-static pressure distributions between the swirling and non-swirling cases showed opposite results in the two cases: the static pressureat the outer bend was found to be lower than the inner for the swirling flowwhereas the opposite was found for the non-swirling case. The total wall shearfor S = 1 did not show differences between the outer and inner wall whereasfor S = 0 there was a significant difference between the shear at the inner andouter wall due to the existence of the Dean cells in that case. From the meanvelocity profiles along the horizontal planes, it was shown that the velocitydistribution is more uniform and symmetric for the swirling flow case. Theaforementioned observations suggested that a single dominating cell exists forS = 1 and that the curved-pipe flow becomes fully dominated by the imposed“solid-body” rotation3. An increase in turbulence production by the imposedswirling motion, resulted in more uniform distributions of the normal stressesin the radial and tangential directions. As a consequence, the radial and cir-cumferential gradients of these stresses are reduced and do not provide enoughvorticity, a fact which explains why the secondary flow created by the bend cannot be sustained.
The follow-up work by So & Anwer (1993) showed that in swirling flow,the distance needed for the flow to become fully developed is shorter than thatneeded in the case of a straight pipe. Furthermore it was found that the bendaccelerates the decay of the swirl compared to swirling flow in a straight pipe.
Pruvost et al. (2004) studied numerically the same flow case as in Anwer &So (1993) but extended the investigation for a range of swirl numbers betweenS = 0 and 4. An additional case for S = 5 was also studied but no experimentaldata were available for validation. Different numerical approaches were testedand the results were compared to the experimental data by Anwer & So both forthe swirling and non-swirling case. However, all models gave poor agreement
3Note that a solid-body rotation can only be obtained in laminar flow. For fully-developedturbulent flow, it has been shown, that the azimuthal velocity lags behind a velocity distribu-tion corresponding to solid body rotation due to the influence of the cross-stream Reynoldsstress (Facciolo et al. 2007).
2.3. SWIRLING FLOW IN CURVED PIPES 19
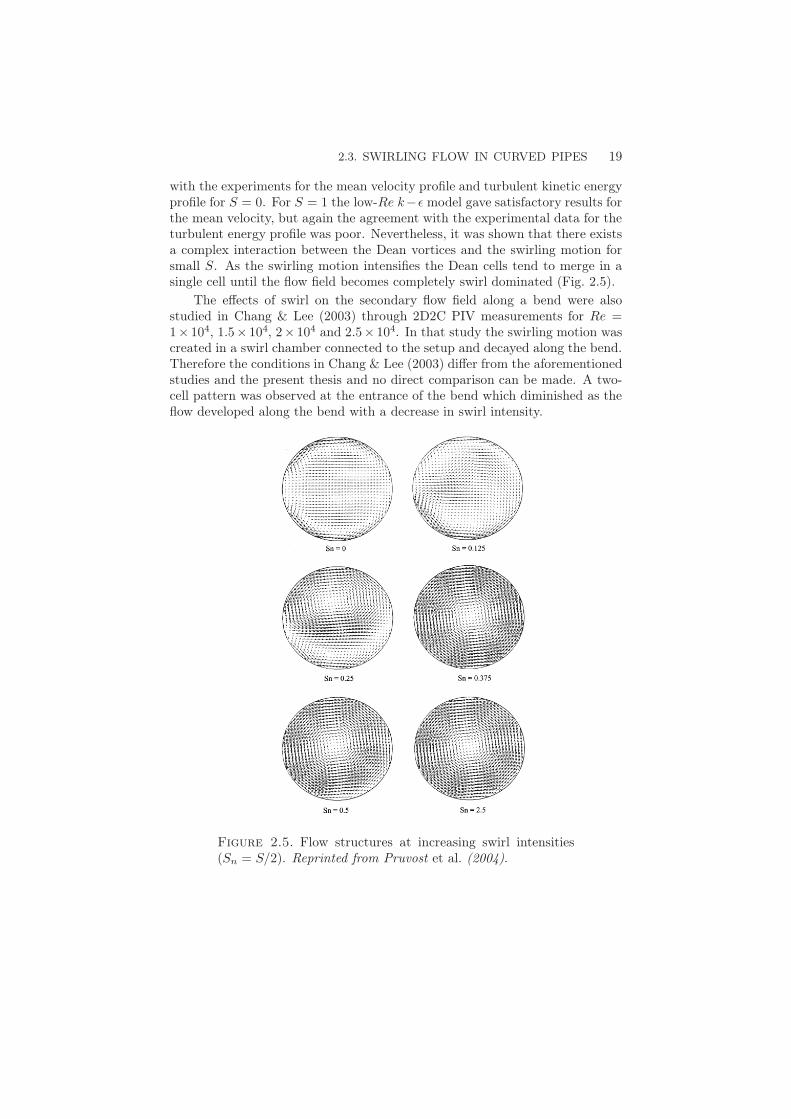
with the experiments for the mean velocity profile and turbulent kinetic energyprofile for S = 0. For S = 1 the low-Re k−ǫ model gave satisfactory results forthe mean velocity, but again the agreement with the experimental data for theturbulent energy profile was poor. Nevertheless, it was shown that there existsa complex interaction between the Dean vortices and the swirling motion forsmall S. As the swirling motion intensifies the Dean cells tend to merge in asingle cell until the flow field becomes completely swirl dominated (Fig. 2.5).
The effects of swirl on the secondary flow field along a bend were alsostudied in Chang & Lee (2003) through 2D2C PIV measurements for Re =1× 10⁴, 1.5× 10⁴, 2× 10⁴ and 2.5× 10⁴. In that study the swirling motion wascreated in a swirl chamber connected to the setup and decayed along the bend.Therefore the conditions in Chang & Lee (2003) differ from the aforementionedstudies and the present thesis and no direct comparison can be made. A two-cell pattern was observed at the entrance of the bend which diminished as theflow developed along the bend with a decrease in swirl intensity.
Figure 2.5. Flow structures at increasing swirl intensities(Sn = S/2). Reprinted from Pruvost et al. (2004).
20 2. TURBULENT FLOWS IN CURVED PIPES
As apparent from the aforementioned studies, the effects of a superimposedswirling motion on turbulent curved pipe flow has been studied only to a limitedextent. Turbulent swirling flow is, however, encountered in many industrialapplications such as in hydraulic plants, combustion chambers and any machinethat involves a turbine or fan or a combination of bends e.g. double bends, andit is important to understand the physics underlying such mechanisms.
2.4. Pulsating motions in turbulent curved pipe flows ...
Pulsating (or pulsatile) flow, i.e. the unsteady flow4 composed of a periodicand a steady component, is typical in biological flows such as the respiratoryand cardiovascular system. For instance, the heart is probably the most well-known pump in nature, distributing the blood to the whole body with a distinctfrequency rate (of the order of 1 Hz). Therefore, the main body of unsteady flowresearch has been related to physiological flows (McDonald 1955; Chandran &Yearwood 1981; Glenn et al. 2012). However, pulsatile flow occurs in and playsa major role in the performance of mechanical systems such as the internalcombustion engine. For a pulsating flow, transient inertial forces counteractthe viscous forces. This is expressed by the Womersley number (Womersley1957), which needs to be taken into account in pulsatile curved pipe flow,apart from the effect of curvature. The Womersley number is defined as:
α = R
√
ω
ν, (2.3)
where ω is the angular frequency of the pulsations equal to ω = 2πf with fdenoting the frequency of pulsations. As can be seen from eq. (2.3), α is acomposition of the Reynolds number and the Strouhal number. The latter canbe seen as a ratio between the time scale inherent to the flow motion (D/Wb)and the time scale of oscillations (ω−1) as:
St =ωD
Wb
. (2.4)
For physiological flows, the Womersley number is small (of order one) as isthe Reynolds numbers whereas in technical applications (e.g. internal combus-tion engine) those numbers can be of the order of 102, 105, respectively. Ac-cording to Carpinlioglu & Gündogdu (2001), for Womersley numbers smallerthan approximately one, the flow can be considered quasi-steady since the tur-bulent structures have time to accommodate to the slowly varying flow rate.For 1 < α < 30 the flow is intermediate (passage between steady and pulsatileflow) whereas for α > 30 the frequency of the pulsatile motion is high enough
4It should be noted that unsteady flows are divided into two categories: pulsating flowwhen the periodically time-averaged velocity is non-zero and oscillating flow in which theperiodically time-averaged velocity is zero.
2.4. PULSATING MOTIONS IN TURBULENT CURVED PIPE FLOWS ... 21
for turbulence not to be able to respond to the rapid changes in the flow andthe flow becomes inertia dominated. Hence, turbulence becomes independentof the phase angle of the pulsations. This can be explained also with the aidof boundary-layer approximation, see for example the review in He & Jackson(2009) where the effects of high pulsations on turbulence are described as: “[...] the shear waves propagating into the fluid from the wall [due to fact thathigher vorticity needs to be generated to satisfy no-slip condition] [...] will bestrongly attenuated and mainly confined to the viscous sub-layer region [...] themodulation of the velocity field varies across the region where the shear stress isbeing attenuated but becomes uniform in the region further out. [...] the innerand outer layers are completely decoupled [...]. Such a flow can be viewed asone in which the turbulence is ‘frozen’ ”.
Even though the above provide a general description of the effects of pulsa-tions on turbulence, there are—to the author’s knowledge—no studies dealingwith the effects of high pulsatile (α > 30) flow on turbulent curved pipe flowwith regard to the secondary flow evolution. As already mentioned in § 2.1,studies in laminar, low-frequency pulsatile flow showed that under one cycle,the secondary flow patterns vary due to competition between the centrifugal,inertial and viscous forces (e.g. Timité et al. 2010; Jarrahi et al. 2010; Glennet al. 2012). There is no information, how these patterns would be affectedif the flow is turbulent and highly pulsatile, as it is for example in the flowenvironment of the internal combustion engine.
2.4.1. ... and their effect on the turbocharger performance
With passenger cars contributing today to 12% of the total european emissionsof carbon dioxide, EU emission legislations are gradually becoming stricter5
and engine manufacturers are called to develop technological solutions in orderto reduce pollutant emissions and enhance fuel economy.
Different methods to increase the efficiency of automotive engines and reachthe EU requirements for reducing toxic emissions, have been developed throughthe years such as exhaust gas recirculation (EGR) (Millo et al. 2008; Reifarth2014) and turbocharging (Hellström & Fuchs 2008). The working principle ofa turbocharger is that energy of the exhaust gas is extracted by expanding itthrough the turbine and the inlet air is compressed so that more air enters thecylinders during the intake stroke. Whereas turbocharging is not a new con-cept6, the use of it together with new technologies such as downsizing—i.e. the
5Emission limits are set that a fleet average of 130 grams of CO2 per kilometre is achievedby 2015 and 95 grams of CO2 per kilometre by 2021. Source: European Commission, http ://ec.europa.eu/clima/policies/transport/vehicles/cars/index_en.htm.6The invention of the turbocharger is credited to Alfred Büchi, a Swiss engineer who receiveda patent in 1905 for using a compressor driven by exhaust gasses to force air into an internalcombustion engine to increase power output.
22 2. TURBULENT FLOWS IN CURVED PIPES
implementation of smaller engines providing the same power as larger engines—is, with regard to EU emission legislations, as stated in Marelli et al. (2014):“[...] turbocharging technique in conjunction with the downsizing concept seemsto be the most promising way to achieve this target.”
Highly pulsating turbulent flow is created by the movement of the cylinderpistons and it is the flow condition in the intake and exhaust circuit of engines.The frequency of pulsations depends on the number of cylinders and rotationalspeed of the engine and can typically exceed 100 Hz (Olczyk 2009). As men-tioned in § 2.4, for such high pulsatile frequencies—and therefore Womersleynumbers—the flow can not be regarded as quasi-steady. Furthermore, as re-marked in Hellström & Fuchs (2008): “In addition to effects of the pulsatile flowthere is also a cross-sectional motion added to the axial flow velocity componentat the inlet to the turbine. This secondary motion may consist of swirl, Deanvortices and other non-axial velocity components”. That is because, most—ifnot all—of the pipes comprising the gas intake and exhaust system are sig-nificantly curved. As already mentioned in the previous sections, such flow iscomplicated involving flow phenomena such as oscillating vortices, reverse flowand non-uniform velocity distributions. It is thus essential that such flows areinvestigated in detail for real-engine-operating conditions. However, as it hasbeen described earlier in this chapter, the three-dimensionality of such flowsas well as reverse flow, temperature variations during a pulse cycle and otherpeculiarities make the investigation of such flows difficult not only experimen-tally (see for example, Nabavi & Siddiqui 2010) but also numerically. On theother hand, there is more need for studies on generic geometries relevant tothe engine flow environment, since on-engine tests not only limit the results inspecific engine models but they also hinder the use of sophisticated and deli-cate experimental techniques (such as particle image velocimetry), which arenecessary if detailed information on the flow is desired.
Under inlet pulsating flow conditions, the turbine is known to yield a “hys-teresis” type performance characteristic, i.e. the mass-flow versus pressure-ratiocurve follows a so-called “hysteresis” loop surrounding the steady state curve(see e.g. Capobianco & Marelli 2009). Turbine maps supplied by the manu-facturers are, however, based on steady flow conditions covering, at the sametime, only a small area of operational points. Furthermore, it is common prac-tise that turbine performance is modelled under pulsating flow conditions using1-D simulations (Chen et al. 1996; Piscaglia et al. 2007; Tabatabaei et al. 2012;De Bellis et al. 2014; Chiong et al. 2014). However those have been proven to beinsufficient and experimental data are needed for their improvement (Chionget al. 2012), whereas if simulations need to be performed, 3D unsteady flowsimulations are necessary (Tabatabaei et al. 2012)—even though computation-ally expensive—in order to model three-dimensional phenomena at the inletof the turbine. As remarked in Baines (2009): “[...] A more rigorous engine
2.4. PULSATING MOTIONS IN TURBULENT CURVED PIPE FLOWS ... 23
simulation will require a dynamic approach to turbine modelling, in place ofcurrent steady-state map interpolation and extrapolation.”
Szymko et al. (2005) introduced a modified Strouhal number, that incorpo-rated also the pulse length, and based on that, three regimes in the mass-flowversus pressure-ratio-map were identified: quasi-steady, steady encapsulatedhysteresis and fully unsteady. That could be useful as a rule of thumb whenthe quasi-steady-assumption for modelling is valid. The velocity field withinthe turbine was found—through 3D unsteady flow simulations—to be highlydistorted by the pulsations at the inlet in Palfreyman & Martinez-Botas (2005),leading to substantial fluctuation to the incidence angle indicating poor flowguidance throughout the pulse period. A reduction of turbine efficiency fora pulsating inlet flow was found in Marelli & Capobianco (2011), through in-stantaneous pressure and mass-flow measurements, supporting that the steadyflow characteristic curves do not represent realistically the turbine behaviour.Also a quasi-steady approach appeared inadequate to predict the unsteady flowoperation of the turbine. Tabatabaei et al. (2012) performed experiments and3D unsteady simulations on the inlet conditions of an SI-engine turbochargerturbine and found a difference of almost 10% in pressure ratio in turbine mapsproduced under steady and unsteady operating conditions, obtaining higherpressure ratios for the steady flow case. The “hysteresis loop” was found towiden and shift away from the quasi-steady operation with increase in pul-satile frequency in Copeland et al. (2012). Padzillah et al. (2014) showed thatthere is a potential loss of information on the turbine efficiency if the per-formance parameters, such as the incidence angle at the leading edge of theturbine rotor, are averaged without considering the instantaneous effects.
The aforementioned studies constitute an important database for engineflows and provide useful information on the effect of pulsations on turbineperformance, with results induced mainly from simulations and single-pointmeasurements. There is, however lack of a detailed description of the flow fieldentering the turbine, that is taking into account not only the effect of pulsationsbut also streamline curvature. That means that single-point experimental tech-niques are not ideal for such studies, since the flow field entering the turbineis three-dimensional and all velocity components need to be measured, thuswhole field measurement methods need to be implemented. A study whichcombines a detailed description of the three-dimensional flow field and the ef-fects of bends on turbine performance is—to the author’s knowledge—missingfrom the literature. If the target is to reach emission legislation requirementsby increasing the performance of the turbocharger and enhancing fuel econ-omy, it is very important that, first, a better understanding of the performanceof the turbocharger is established. In order to succeed that, flow phenomenaoccurring at the inlet of the turbine, such as the ones described in § 2.1–2.4,need to be fully integrated into the design stage so that correct performancemaps can be obtained.
CHAPTER 3
Experimental setups and techniques
“A scientist in his laboratory is not a mere technician: he isalso a child confronting natural phenomena that impress him asthough they were fairytales.”
Marie Curie (1867–1955)
In the following chapter the experimental setups and techniques that havebeen used for the purposes of the current study are presented. Two experimen-tal setups have been used. The first one is part of the rotating-pipe facility atKTH Mechanics and consists of a long axially rotating-pipe to create a swirlingmotion before the flow is fed into a pipe bend. The second one, is located in theCICERO laboratory at KTH CCGEx (Competence Centre for Gas Exchange),where pulsatile flow can be created through a rotating valve located upstreamof the pipe test section.
Due to the complexity of turbulent curved pipe flow, different techniqueshad to be used in order to fully investigate the flow field both in terms of statisti-cal quantities and large-scale structures. Therefore, time-resolved stereoscopicparticle image velocimetry (TS-PIV) was employed with the aim to both vi-sualise and quantify the coherent structures existing at the exit of the bend,whereas hot-wire anemometry (HWA) was employed due to its high frequencyresponse and temporal resolution in order statistically analyse the flow field.Finally, laser-Doppler velocimetry (LDV) has been applied for further inves-tigation of some of the results from the two aforementioned techniques. Theprinciples of the three techniques and how they have been applied in the presentstudy are explained in detail in the following sections.
3.1. The rotating-pipe facility
The turbulent flow field downstream a curved pipe with and without a super-imposed swirling motion was studied by means of TS-PIV measurements atthe rotating-pipe facility in the Fluid Physics Laboratory at KTH Mechanics(see papers 2 & 3). In the following paragraphs, some basic information aboutthe facility will be provided. For a more detailed description of the apparatusthe reader is referred to Facciolo (2006).
24
3.1. THE ROTATING-PIPE FACILITY 25
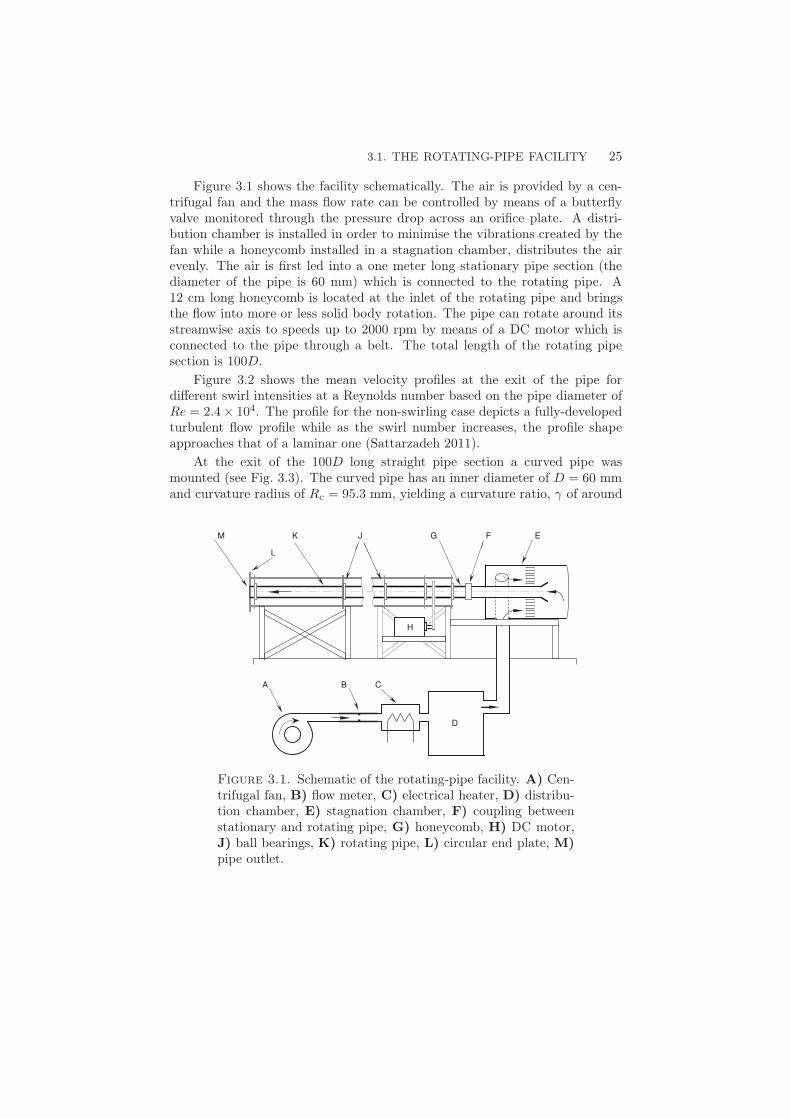
Figure 3.1 shows the facility schematically. The air is provided by a cen-trifugal fan and the mass flow rate can be controlled by means of a butterflyvalve monitored through the pressure drop across an orifice plate. A distri-bution chamber is installed in order to minimise the vibrations created by thefan while a honeycomb installed in a stagnation chamber, distributes the airevenly. The air is first led into a one meter long stationary pipe section (thediameter of the pipe is 60 mm) which is connected to the rotating pipe. A12 cm long honeycomb is located at the inlet of the rotating pipe and bringsthe flow into more or less solid body rotation. The pipe can rotate around itsstreamwise axis to speeds up to 2000 rpm by means of a DC motor which isconnected to the pipe through a belt. The total length of the rotating pipesection is 100D.
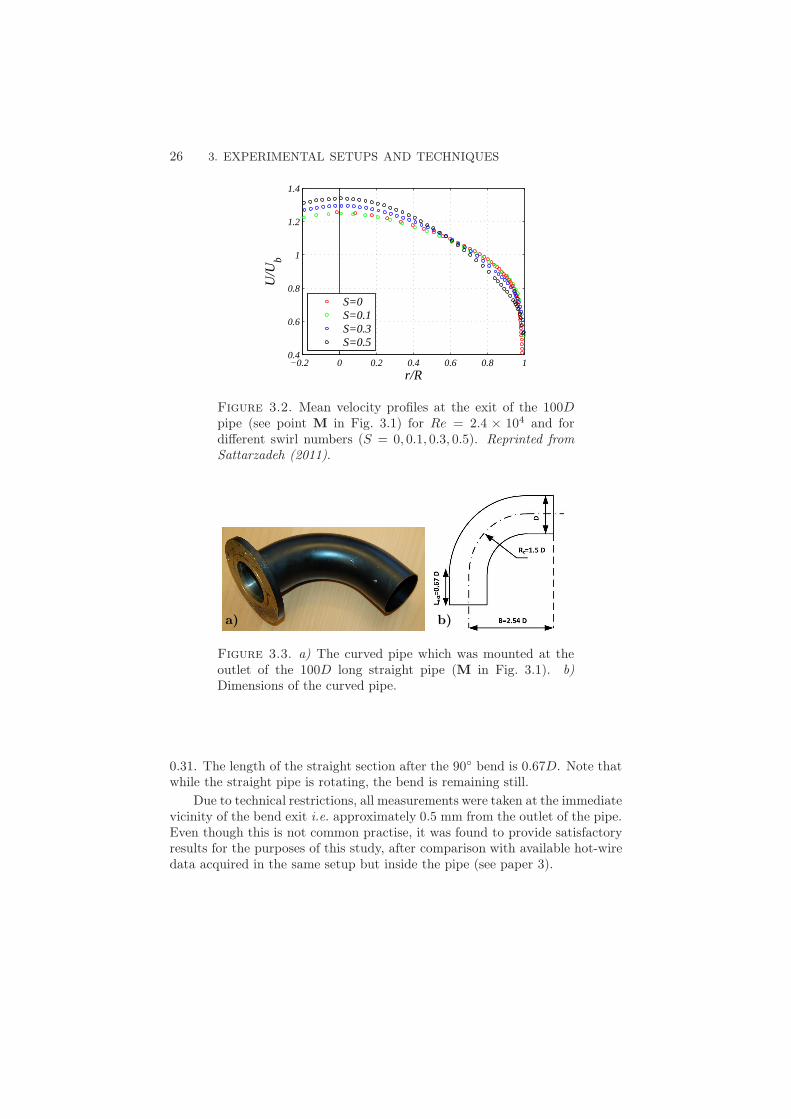
Figure 3.2 shows the mean velocity profiles at the exit of the pipe fordifferent swirl intensities at a Reynolds number based on the pipe diameter ofRe = 2.4× 10⁴. The profile for the non-swirling case depicts a fully-developedturbulent flow profile while as the swirl number increases, the profile shapeapproaches that of a laminar one (Sattarzadeh 2011).
At the exit of the 100D long straight pipe section a curved pipe wasmounted (see Fig. 3.3). The curved pipe has an inner diameter of D = 60 mmand curvature radius of Rc = 95.3 mm, yielding a curvature ratio, γ of around
C A B
D
M K
L
J G E F
H
Figure 3.1. Schematic of the rotating-pipe facility. A) Cen-trifugal fan, B) flow meter, C) electrical heater, D) distribu-tion chamber, E) stagnation chamber, F) coupling betweenstationary and rotating pipe, G) honeycomb, H) DC motor,J) ball bearings, K) rotating pipe, L) circular end plate, M)pipe outlet.
26 3. EXPERIMENTAL SETUPS AND TECHNIQUES
−0.2 0 0.2 0.4 0.6 0.8 10.4
0.6
0.8
1
1.2
1.4
r/R
U/U
b
S=0S=0.1S=0.3S=0.5
Figure 3.2. Mean velocity profiles at the exit of the 100Dpipe (see point M in Fig. 3.1) for Re = 2.4 × 10⁴ and fordifferent swirl numbers (S = 0, 0.1, 0.3, 0.5). Reprinted fromSattarzadeh (2011).
a) b)
Figure 3.3. a) The curved pipe which was mounted at theoutlet of the 100D long straight pipe (M in Fig. 3.1). b)Dimensions of the curved pipe.
0.31. The length of the straight section after the 90◦ bend is 0.67D. Note thatwhile the straight pipe is rotating, the bend is remaining still.
Due to technical restrictions, all measurements were taken at the immediatevicinity of the bend exit i.e. approximately 0.5 mm from the outlet of the pipe.Even though this is not common practise, it was found to provide satisfactoryresults for the purposes of this study, after comparison with available hot-wiredata acquired in the same setup but inside the pipe (see paper 3).
3.2. THE CICERO RIG 27
3.2. The CICERO rig
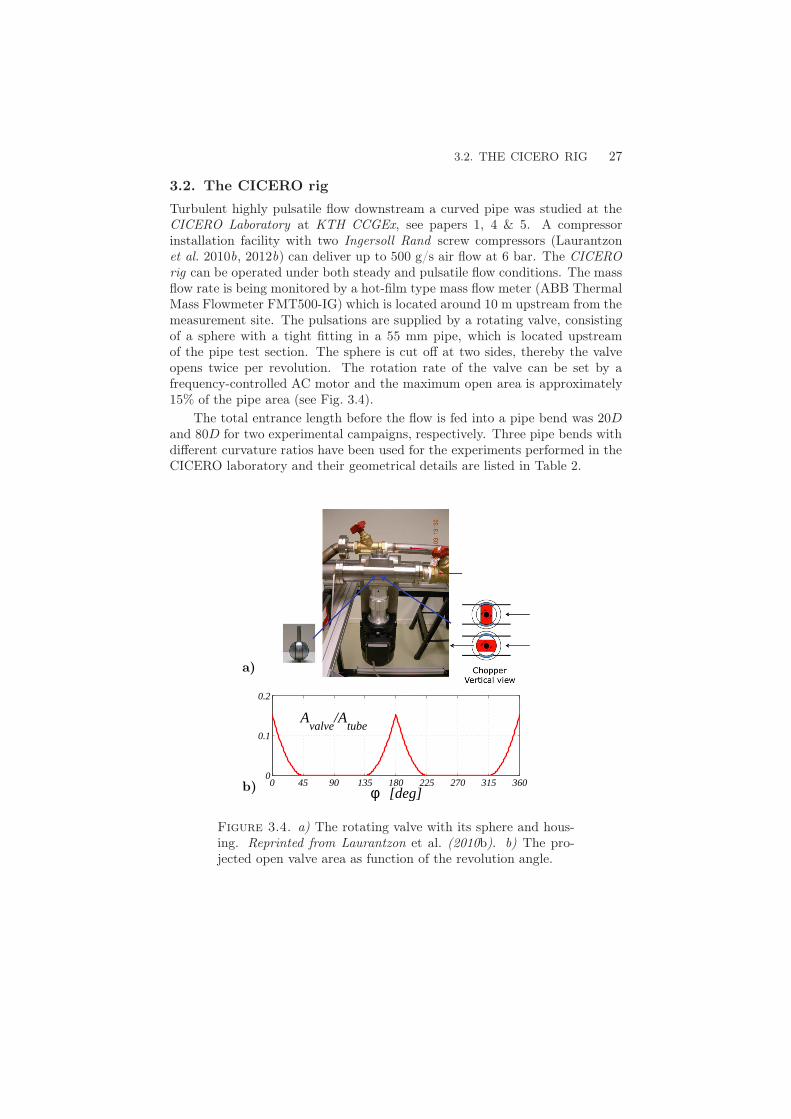
Turbulent highly pulsatile flow downstream a curved pipe was studied at theCICERO Laboratory at KTH CCGEx, see papers 1, 4 & 5. A compressorinstallation facility with two Ingersoll Rand screw compressors (Laurantzonet al. 2010b, 2012b) can deliver up to 500 g/s air flow at 6 bar. The CICEROrig can be operated under both steady and pulsatile flow conditions. The massflow rate is being monitored by a hot-film type mass flow meter (ABB ThermalMass Flowmeter FMT500-IG) which is located around 10 m upstream from themeasurement site. The pulsations are supplied by a rotating valve, consistingof a sphere with a tight fitting in a 55 mm pipe, which is located upstreamof the pipe test section. The sphere is cut off at two sides, thereby the valveopens twice per revolution. The rotation rate of the valve can be set by afrequency-controlled AC motor and the maximum open area is approximately15% of the pipe area (see Fig. 3.4).
The total entrance length before the flow is fed into a pipe bend was 20Dand 80D for two experimental campaigns, respectively. Three pipe bends withdifferent curvature ratios have been used for the experiments performed in theCICERO laboratory and their geometrical details are listed in Table 2.
0 45 90 135 180 225 270 315 3600
0.1
0.2
φ [deg]
Avalve
/Atube
a)
b)
Figure 3.4. a) The rotating valve with its sphere and hous-ing. Reprinted from Laurantzon et al. (2010b). b) The pro-jected open valve area as function of the revolution angle.
28 3. EXPERIMENTAL SETUPS AND TECHNIQUES
Table 2. Geometrical details of the pipe bends used in theCicero Laboratory. The diameter of the pipe (D), the curva-ture radius to the pipe diameter (Rc/D) and the downstreamdistance from the bend exit to the pipe diameter (z/D) areshown.
D [mm] Rc/D z/D
Bend I 39 1.17 0.8Bend II 40.5 1.3 0.2, 1, 2, 3Bend III 40.5 3.6 1,2,3
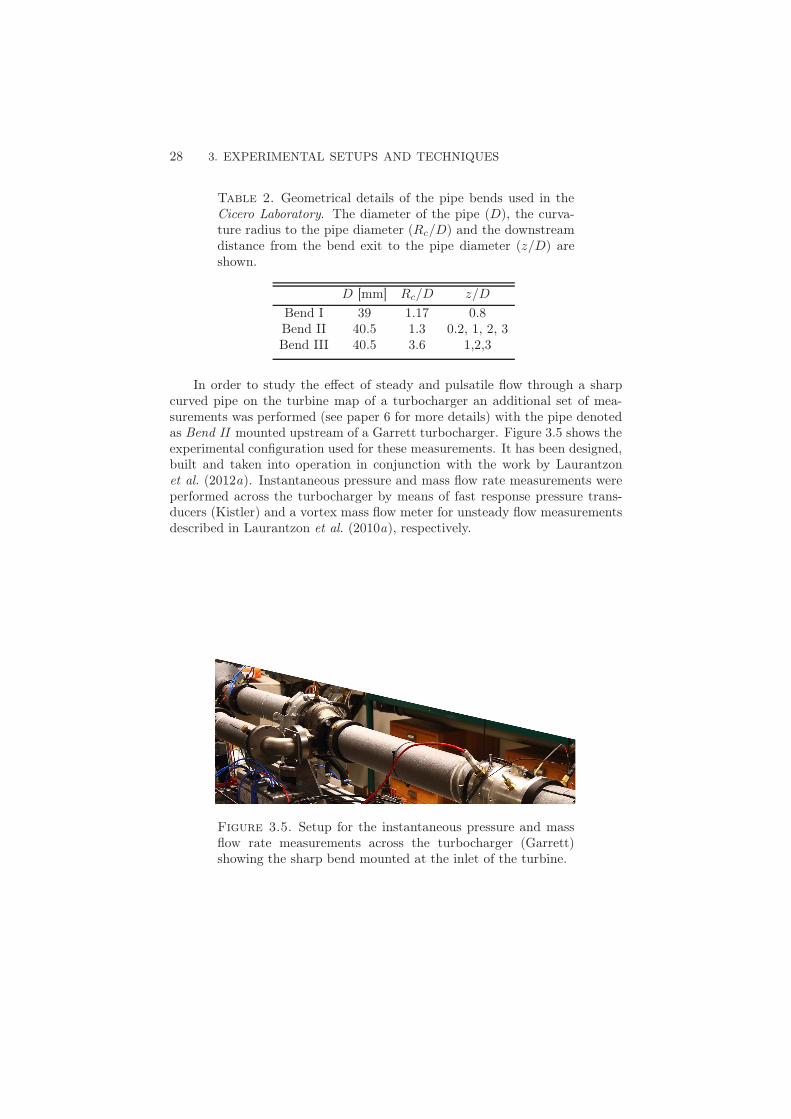
In order to study the effect of steady and pulsatile flow through a sharpcurved pipe on the turbine map of a turbocharger an additional set of mea-surements was performed (see paper 6 for more details) with the pipe denotedas Bend II mounted upstream of a Garrett turbocharger. Figure 3.5 shows theexperimental configuration used for these measurements. It has been designed,built and taken into operation in conjunction with the work by Laurantzonet al. (2012a). Instantaneous pressure and mass flow rate measurements wereperformed across the turbocharger by means of fast response pressure trans-ducers (Kistler) and a vortex mass flow meter for unsteady flow measurementsdescribed in Laurantzon et al. (2010a), respectively.
Figure 3.5. Setup for the instantaneous pressure and massflow rate measurements across the turbocharger (Garrett)showing the sharp bend mounted at the inlet of the turbine.
3.3. TIME-RESOLVED STEREOSCOPIC PARTICLE IMAGE VELOCIMETRY 29
3.3. Time-resolved stereoscopic particle image velocimetry
“A man is not a dog to smell out each individual track, he is aman to see, and seeing, to analyse. He is a sight tracker witheach of the other senses in adjunctive roles. Further, man is ascanner, not a mere looker. A single point has little meaningunless taken with other points and many points at different timesare little better. He needs the whole field, the wide view.”
Prof. F. M. N. Brown, University of Notre Dame
The measurement technique that has been used in order to obtain themain part of the results presented in this thesis is time-resolved stereoscopicparticle image velocimetry (TS-PIV). It was chosen as the main experimentaltechnique to investigate the three-dimensional turbulent flow field downstreampipe bends. PIV is capable of providing simultaneously the three-dimensionalflow field with a reasonable temporal and spatial resolution (sufficient for thepurposes of the present study i.e. resolve and track in time the large-scalestructures in the flow field), it is non-intrusive and it is quite robust whichis important when measurements in harsh flow environments (such as highpulsations) take place. It would therefore be time consuming, complicated andalso restricting the results to statistical information and integral quantities ifa single-point technique was used instead.
The principle of particle image velocimetry is rather simple. The flow isseeded with particles which should follow the flow as realistically as possible.The relaxation time of the particles is given by: τs = D2
p(ρp/18µ), wheresubscript p denotes particle quantities, whereas ρ is the density and µ thedynamic viscosity of the fluid, respectively. The Stokes number, Sk gives anestimate of the tracking ability of the particles and is the ratio of the relaxationtime of the particle to the flow time scale (see for example Samimy & Lele 1991).Ideally, Sk < 0.1, in order for the particles to follow the flow closely.
The measurement plane is illuminated twice using a double-pulsed laser1
in a short time interval and the light scattered by the particles is recorded ondouble-frame2 via a camera which is focussed on measurement plane. If all threevelocity components are to be measured, as in the flow case described in thepresent thesis, two cameras need to be employed in a stereoscopic configuration.In that way, distinct off-axis views of the same region can provide the out-of-plane motion of the particles through a reconstruction scheme (Prasad 2000).Finally, the acquired images are divided into small areas (Interrogation Areas,
1For example Nd:YAG or Nd:YLF lasers are broadly used nowadays with repetition rates ofthe order O(10) & O(103) Hz, respectively.2Here we describe only the method used within the context of this work which is the double-frame/single-exposure technique which preserves the temporal order of the PIV recordingsand is usually preferred if the appropriate equipment is available.
30 3. EXPERIMENTAL SETUPS AND TECHNIQUES
IA) and the local displacement of the particles in the IA is determined by meansof cross-correlation, i.e. the peak of the cross-correlation is used to determinethe average particle displacement from one frame to the other. For more detailson the fundamentals of PIV the reader is referred to the text books by Raffelet al. (2007) and Adrian & Westerweel (2010).
The TS-PIV system used for the purposes of this study was supplied byLaVision GmbH and consists of two high-speed CMOS cameras (Fastcam APXRS, Photron, 3 kHz at full resolution of 1024 × 1024 pixel, 10 bit dynamicrange) and a Nd:YLF laser with 10 kHz repetition rate (Pegasus laser, NewWave Research). The cameras were usually positioned at angles between 70-90degrees between their viewing axis at forward-backward scatter mode. Thelenses mounted on the cameras were Nikon Nikkor lenses with 105 mm focallength and aperture range from f/1.8 to f/22. For each camera a Scheimpflugadapter was employed in such a way that the image, lens and object planeintersect in a common line (Prasad & Jensen 1995). Before each new recording,dark images with the lenses covered were acquired from both cameras in orderto subtract the dark noise (or dark current) of the CMOS cameras which isusually in the order of a few counts and increases with time.
The calibration of the cameras was done using either a two-level calibrationplate provided by LaVision GmbH or a home-made calibration target resem-bling the one shown in van Doornel & Westerweel (2007). The latter was trans-lated 0.5 mm in the streamwise direction using an accurately machined ringin order to provide images at two different planes for the reconstruction of theout-of-plane velocity component. To eliminate the errors arising from any mis-alignment between the light sheet and the calibration plate, a self-calibrationscheme was applied on the recordings as described in Wieneke (2005). The flowwas seeded using either standard olive oil or a water-based solution (Jem Prosmoke Super ZR-Mix) atomised through a high volume liquid seeding generator(10F03 seeding generator, Dantec Dynamics).
Depending on the quality of the particle images (which depends to a greatextent on the kind of flow being measured, setup and technical specifications),different post-processing schemes need to be applied on the acquired snapshotsin order to obtain meaningful and accurate vector fields. Sources that willintroduce errors are typically large velocity gradients in the flow field or par-ticles which move outside the IA between two consequent frames. A generalrule exists in order to avoid the latter, i.e. choose the time between the twoilluminations such that the particle displacement is between the accuracy ofthe system and 1/4 of the IA. The flow field studied at the exit of a curvedpipe, is non-uniform and it is characterised by high velocities towards the outerpipe wall and low velocities towards the inner wall. The difference between thehighest and lowest mean velocity in the flow field is typically 0.9Wb, where Wb
is the bulk velocity. Therefore the time between the two illuminations (dt) hadto be chosen carefully in order to obtain a good signal-to-noise ratio (S/N) of
3.3. TIME-RESOLVED STEREOSCOPIC PARTICLE IMAGE VELOCIMETRY 31
the correlation peak. The dt for each measurement was typically of the order offew microseconds and it was set after trial-and-error until a good S/N ratio ofthe correlation peak was obtained. The acquisition and evaluation of the parti-cle images were performed via a commercial software, DaVis 7.2 from LaVisionGmbH. An “online”, i.e. at the time of the image acquisition, evaluation ofthe particle images’ quality as well as the vector fields is offered by the spe-cific software which has been used in order to select the optimal measurementsettings.
The quality of the “raw” images was good since no optical or other kind ofobstacle existed between the object and image plane and no reflections werepresent. However, unfocussed particles due to the much higher velocities closeto the outer pipe wall (compared to the inner wall) were unavoidable and thisresulted in small intensity fluctuations across the images. In order to improvethe quality of the results, a particle intensity correction was applied on theoriginal snapshots by means of a min/max filter with a 5× 5 px window size.
The spatial resolution and accuracy of the obtained vector-field dependon a number of parameters such as the size of the IA, the thickness of thelight sheet, the resolution of the camera sensor, the correlation scheme etc. Itis common practise to repeat the correlation process for decreasing IA sizesand deforming windows (Scarano 2002) in order to maintain a good spatialresolution but also high accuracy. Here, an iterative cross-correlation procedurewas applied with decreasing and deforming interrogation windows with 50%overlap, after which the vector fields were smoothed with a 3 × 3 averagingfilter. The final smallest IA size was chosen based on the mean statistics ofthe obtained velocity fields after different IA sizes (ranging from 64× 64 px to8 × 8 px) were tested during the cross-correlation procedure. Whereas no bigdifferences were seen for the mean velocity field when comparing vector fieldsobtained with different IA sizes, with 32× 32 px giving the same results with16× 16 px, the root-mean-square (RMS) of the streamwise velocity componentwas very sensitive in the selection of the IA size. The so-called bias error “peak-locking” (see for example Angele & Muhammad-Klingmann 2005), which wasshown in Christensen (2004) to affect statistical moments such as the RMS,was not found to be an issue in the present data. Following the guidelines inOvermars et al. (2010) the degree of peak-locking in the data was in all casesless than 0.3 (with a value of 1 and a value of 0 denoting strong or no peak-locking, respectively). It should be noted that Reynolds number effects werenot studied with respect to higher order moments and wherever RMS resultsare shown (see paper 4) it is only at the same Reynolds number and of coursesame spatial resolution. The resulting data resolution (around 2 vectors/mm2)was found sufficient in order to resolve large-scale structures (which is the aimof the present work) but the smallest dissipative scales (η ∼ 0.085 mm) werenot resolved (see for example paper 3).
32 3. EXPERIMENTAL SETUPS AND TECHNIQUES
Outliers, i.e. data deviating strongly from neighbouring data, were detectedand removed by means of a median test (Westerweel 1994). The percentageof accepted vectors was in all cases more than 90% and the spurious vectorscould be replaced through a linear interpolation scheme. It must be noted here,that data validation was performed before any post-processing on the imageswas applied, through a single-pass cross-correlation scheme with an IA size of32× 32 px.
3.3.1. Processing of instantaneous vector fields
One of the most challenging tasks for the user of PIV is to analyse the infor-mation obtained from PIV measurements. As noted in Raffel et al. (2007):“PIV being the first technique to offer information about complete instanta-neous velocity vector fields allows new insights in old and new problems of fluidmechanics”. The development of PIV revived the interest of fluid dynamicistsin existing analysis tools for the identification of turbulent coherent structures,such as proper orthogonal decomposition (POD, see for example Lumley 1971).Nowadays, POD is a standard analysis tool for PIV data being part of com-mercial PIV softwares (e.g. DaVis by LaVision GmbH & Dynamic Studio byDantec Dynamics).
Through POD the most significant structures in the flow field can be iden-tified and ranked by energy content (Holmes et al. 2012). It has been usedextensively for the analysis of vector fields within the context of the presentthesis in order to reveal the large-scale structures. For a detailed description onPOD, its mathematical background as well as its implementation in MATLABthe reader is referred to Chatterjee (2000). Other works on POD which havebeen used as guidelines in order to implement POD in the present work are theones by Meyer et al. (2007) and Semeraro et al. (2012), where a convergencetest of the POD modes is presented, among others. Here, a short descriptionon the theory of POD will be given as follows.
For an existing ensemble of velocity fields: u1,u2...uN, where uN the n-thsnapshot, all velocity components for each snapshot are reorganised in a matrixU with dimensions M ×N . The M dimension contains the spatial informationwhereas the temporal information is stored in N . The eigenvalue problem ofthe covariance matrix UTU is then considered. The eigenvalues are real andpositive and represent the energy contained in the corresponding eigenfunctionsor modes which are orthogonal and real-valued. Hence, if those are ranked indescending order, the first modes are the most important physically, with thefirst mode representing the mean field. In flow fields with dominating flowstructures, only few of the POD modes are needed to reconstruct and obtainan optimal representation of the initial data (Berkooz et al. 1993).
3.4. HOT-WIRE ANEMOMETRY 33
3.4. Hot-wire anemometry
Hot-wire anemometry (HWA) was implemented at the start of this study (pa-per 1) in order to obtain a good statistical representation of the flow underfocus due to its higher temporal resolution and frequency response comparedto TS-PIV. Hot-wire data by Sattarzadeh (2011) have also been used in or-der to compare and address the pros and cons from implementing HWA andTS-PIV in turbulent curved pipe flows (paper 3).
The use of a heated wire with temperature dependent resistance exposedin air flow to measure the fluid velocity is the basic principle of HWA. It is arelatively cheap, easy-to-use technique with high frequency response and hasgreatly contributed to our understanding of turbulence, probably more thanany other technique, taking into account the long time (almost 100 years) ithas been available for the measurement of turbulent flows.
The hot-wire is simply made by a probe which holds two metal cylinders,so-called prongs, on which the sensor element is soldered or welded. Typically,a wire element made of tungsten or platinum with a length-to-diameter ratioof 200 is used. In the present study, a tungsten wire with a diameter of 5 µmand a length of 1 mm was used. The probe was manufactured at the FluidPhysics Laboratory at KTH Mechanics at the available “hot-wire corner” (forthe reader who is interested on this facility, the fragile process of manufacturinga probe holder and soldering a hot-wire at KTH Mechanics, is documented inFerro 2012).
The hot-wire is connected to a Wheatstone bridge and for the purposes ofthis study it was operated in the constant temperature (CTA) mode, wherethe wire is kept, as the name implies, under constant temperature by means ofa servo amplifier. This keeps the bridge in balance by controlling the currentto the sensor and keeps the resistance constant, independent of the cooling ofthe wire element due to the fluid flow. The change in voltage gives a measureof the flow velocity through the heat transfer. The interested reader is referredto the textbooks by Perry (1982) and Bruun (1995) for more information onthe principles of HWA.
The single hot-wire used in this study, was operated by means of a DISA55M01 main frame with a 55M10 standard CTA channel. The calibration ofthe wire was done ex-situ in a calibration nozzle facility against a differentialpressure transducer (MPX2010DP, Freescale Semiconductor Inc., 0-10 kPa).Due to instantaneous velocities exceeding the range of the pressure transducer,a modified King’s law relation (Johansson & Alfredsson 1982) was preferred forthe calibration relation—instead of a polynomial calibration function—whichenables extrapolation beyond the calibration range. A thermocouple was in-corporated in order to measure possible temperature variations inside the stag-nation chamber of the calibration unit.
34 3. EXPERIMENTAL SETUPS AND TECHNIQUES
A known drawback of HWA is the so-called “forward-reverse” ambiguity(Bruun 1995) i.e. it cannot sense the direction of the velocity. This makesit a non-ideal experimental technique for the measurement of pulsatile flows(Berson et al. 2010), where reverse flow is a common feature. Additionally,the flow under pulsatile conditions is non-isothermal (Laurantzon et al. 2012b)and in order to obtain the temperature variations in the flow the wire (calledcold-wire in such case) needs to be operated in constant current mode. In sucha case the length-to-diameter ratio of the wire needs to be three times largercompared to a wire operated in CTA in order to achieve a good frequencyresponse. Therefore, the wire becomes even more fragile. Although one mustbe aware of these limitations of the hot-wire technique in pulsating flows, it isstill possible to obtain a representative description of the flow behaviour (e.g.paper 1).
Secondary flows in curved pipes are additionally present and contaminatethe hot-wire readings as well. However, based on the concept of effective veloc-ity, the secondary components will not assert a too strong effect on the readingsof a single hot-wire probe (Bruun 1995); see for example paper 3 where dataobtained by means of hot-wire and particle image velocimetry in a turbulentcurved pipe flow are compared and show a good agreement for the mean hori-zontal velocity profile.
3.5. Laser-Doppler Velocimetry
Laser-Doppler velocimetry (LDV) is a single-point, non-intrusive experimentaltechnique which, since its first appearance in the 60’s (Yeh & Cummins 1964),is often used to measure the flow velocity. For the interested reader, a textbookon LDV is the one by Albrecht et al. (2003).
Two beams—obtained by splitting a single beam—of monochromatic andcoherent laser light intersect at a point in the measurement volume. A trans-mitting optics focuses the beams at their waists where they interfere and createa fringe pattern. Particles which have been added in the flow, pass throughthe fringes and scatter light. This is then received by a photodetector. Thereflected light from each particle fluctuates in intensity and the frequency ofthose fluctuations is equivalent to the Doppler shift between the incident andscattered light, and is thus proportional to the velocity of the particle.
In the present study, LDV experiments were conducted as a complementto either hot-wire (see paper 1) or TS-PIV (see paper 4) data due to its abilityto sense backflow and obtain time series with higher temporal resolution thanPIV, respectively. The measurements were performed with a single componentDantec FlowLite system in conjunction to a BSA 60 processor. The emittinglight source is a 10 mW He-Ne laser with wavelength of 632.8 nm. The lensmounted on the laser has a focal length of 400 mm. The liquid used for seedingwas either olive oil or a Shell Ondina 27 oil.
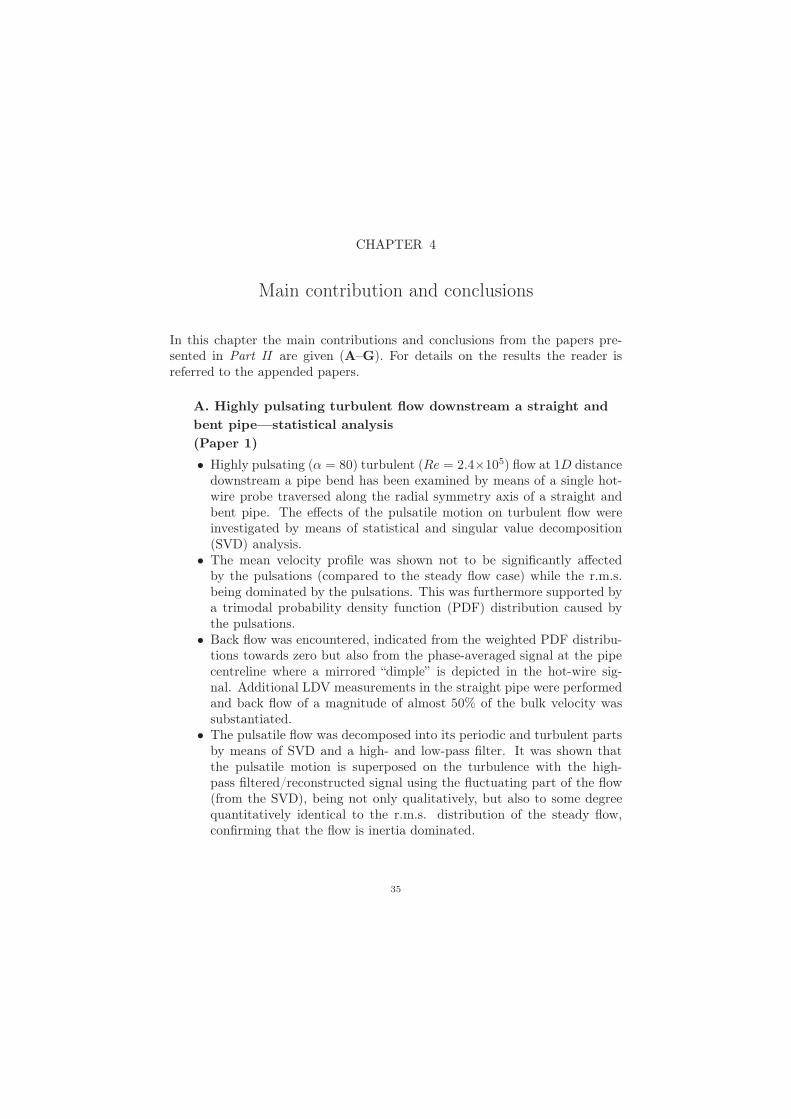
CHAPTER 4
Main contribution and conclusions
In this chapter the main contributions and conclusions from the papers pre-sented in Part II are given (A–G). For details on the results the reader isreferred to the appended papers.
A. Highly pulsating turbulent flow downstream a straight and
bent pipe—statistical analysis
(Paper 1)
• Highly pulsating (α = 80) turbulent (Re = 2.4×10⁵) flow at 1D distancedownstream a pipe bend has been examined by means of a single hot-wire probe traversed along the radial symmetry axis of a straight andbent pipe. The effects of the pulsatile motion on turbulent flow wereinvestigated by means of statistical and singular value decomposition(SVD) analysis.
• The mean velocity profile was shown not to be significantly affectedby the pulsations (compared to the steady flow case) while the r.m.s.being dominated by the pulsations. This was furthermore supported bya trimodal probability density function (PDF) distribution caused bythe pulsations.
• Back flow was encountered, indicated from the weighted PDF distribu-tions towards zero but also from the phase-averaged signal at the pipecentreline where a mirrored “dimple” is depicted in the hot-wire sig-nal. Additional LDV measurements in the straight pipe were performedand back flow of a magnitude of almost 50% of the bulk velocity wassubstantiated.
• The pulsatile flow was decomposed into its periodic and turbulent partsby means of SVD and a high- and low-pass filter. It was shown thatthe pulsatile motion is superposed on the turbulence with the high-pass filtered/reconstructed signal using the fluctuating part of the flow(from the SVD), being not only qualitatively, but also to some degreequantitatively identical to the r.m.s. distribution of the steady flow,confirming that the flow is inertia dominated.
35
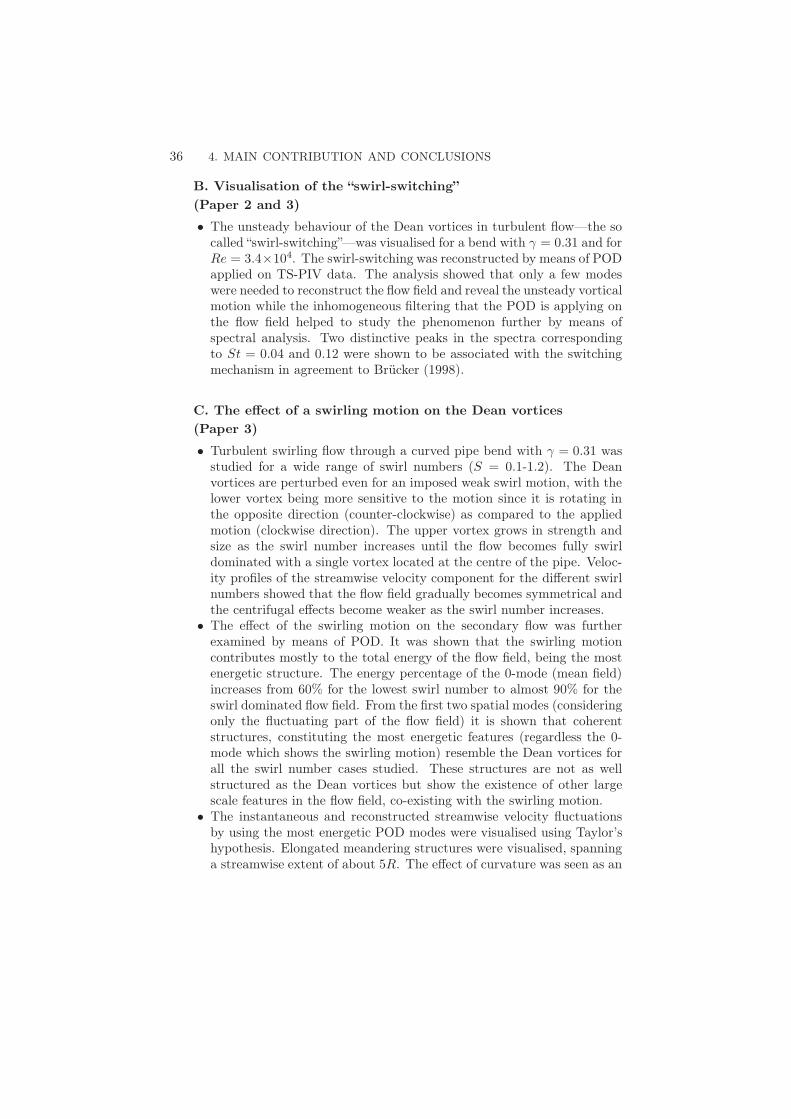
36 4. MAIN CONTRIBUTION AND CONCLUSIONS
B. Visualisation of the “swirl-switching”
(Paper 2 and 3)
• The unsteady behaviour of the Dean vortices in turbulent flow—the socalled “swirl-switching”—was visualised for a bend with γ = 0.31 and forRe = 3.4×10⁴. The swirl-switching was reconstructed by means of PODapplied on TS-PIV data. The analysis showed that only a few modeswere needed to reconstruct the flow field and reveal the unsteady vorticalmotion while the inhomogeneous filtering that the POD is applying onthe flow field helped to study the phenomenon further by means ofspectral analysis. Two distinctive peaks in the spectra correspondingto St = 0.04 and 0.12 were shown to be associated with the switchingmechanism in agreement to Brücker (1998).
C. The effect of a swirling motion on the Dean vortices
(Paper 3)
• Turbulent swirling flow through a curved pipe bend with γ = 0.31 wasstudied for a wide range of swirl numbers (S = 0.1-1.2). The Deanvortices are perturbed even for an imposed weak swirl motion, with thelower vortex being more sensitive to the motion since it is rotating inthe opposite direction (counter-clockwise) as compared to the appliedmotion (clockwise direction). The upper vortex grows in strength andsize as the swirl number increases until the flow becomes fully swirldominated with a single vortex located at the centre of the pipe. Veloc-ity profiles of the streamwise velocity component for the different swirlnumbers showed that the flow field gradually becomes symmetrical andthe centrifugal effects become weaker as the swirl number increases.
• The effect of the swirling motion on the secondary flow was furtherexamined by means of POD. It was shown that the swirling motioncontributes mostly to the total energy of the flow field, being the mostenergetic structure. The energy percentage of the 0-mode (mean field)increases from 60% for the lowest swirl number to almost 90% for theswirl dominated flow field. From the first two spatial modes (consideringonly the fluctuating part of the flow field) it is shown that coherentstructures, constituting the most energetic features (regardless the 0-mode which shows the swirling motion) resemble the Dean vortices forall the swirl number cases studied. These structures are not as wellstructured as the Dean vortices but show the existence of other largescale features in the flow field, co-existing with the swirling motion.
• The instantaneous and reconstructed streamwise velocity fluctuationsby using the most energetic POD modes were visualised using Taylor’shypothesis. Elongated meandering structures were visualised, spanninga streamwise extent of about 5R. The effect of curvature was seen as an
4. MAIN CONTRIBUTION AND CONCLUSIONS 37
inclination of the structures as compared to the case of a correspondingflow case in a straight pipe, considered in the literature. Moreover, in aswirling motion the structures are tilted due to the change in the meanflow direction while for the swirl dominated flow motion they are tearedup into shorter and wider structures.
D. Curvature ratio effects on turbulent curved pipe flow
(Paper 4)
• Turbulent flow (Re = 2.3 × 10⁴) at the exit of two curved pipes withcurvature ratios γ = 0.39 and 0.17, denoting a sharp and mild bend,respectively, was studied by means of TS-PIV. Complementary LDVmeasurements were also performed. Flow fields were obtained at dif-ferent stations downstream the two bends, at 1, 2 and 3D. Statisticalanalysis, vortex tracking and POD were performed on the data.
• Vortex tracking of the Dean vortices in the mean fields shows a tendencyof the vortices to successively move towards the centre of the pipe withdownstream distance from the exit of the bend. They also showed atendency to locate more towards the centre for the sharp bend comparedto the mild one.
• POD applied on the data revealed the existence of two separate motionsfor the case of the sharp bend for all downstream stations. Those werea single vortex dominating the entire cross-section in mode 1 and theDean vortices being tilted and rotated in opposite directions in modes 2and 3. Those modes resembled the ones in Hellström et al. (2013), whichwere associated with the switching mechanism. For the mild bend, thatmodal pattern was not so clear.
• LDV performed above the centreline in the vertical axis and along thehorizontal axis of the mild and sharp bend provided the PDF of thevertical velocity component. A clear bimodal behaviour of the PDFwas observed for the sharp bend whereas for the mild bend, only smallwiggles were visible. This indicated that the swirl-switching in that casemight not be as profound as for the sharp bend.
• Vortex tracking of the Dean vortices in time for both bends, showedthat there is a clear periodic motion of the vortices whereas the uppervortex was anti-correlated to the lower one. It was additionally foundthat each one of the Dean cells dominated the flow field alternativelyand equally in time. However, the vortices exhibited a more oscillatorycharacter for the sharp bend compared to the mild one.
38 4. MAIN CONTRIBUTION AND CONCLUSIONS
E. Effects of upstream conditions on turbulent curved pipe flow
(Paper 4)
• A honeycomb was placed just upstream the inlet of a sharp bend (γ =0.39) and the effects of such a setups on the flow field 1, 2 and 3Ddownstream the bend were studied by means of TS-PIV for Re = 2.3×10⁴.
• The existence of the honeycomb upstream the bend resulted in a signif-icant delay of the flow field development. This was shown by analysingthe mean streamwise velocity distribution at different stations down-stream the bend.
• The secondary flow became successively distorted with downstream dis-tance from the bend. The Dean vortices broke down in three cells at1D whereas at 3D, the upper vortex ceased and only a lower distortedvortex remained.
• The magnitude of the secondary flow was considerably damped when thehoneycomb was present with the maximum mean value reaching 0.2Wb
compared to 0.5Wb for the case without the honeycomb mounted.• The modal pattern when the honeycomb was mounted did not resemble
the one associated with the swirl-switching as described by Hellströmet al. (2013). It was indicated that the switching phenomenon couldbe eliminated by the honeycomb, however it is not clear at this stagewhether all oscillations were eliminated.
F. Secondary flow under pulsating turbulent flow
(Paper 5)
• Pulsating and steady turbulent flow for Womersley numbers α = 0, 30and 71 and Re = 2 × 10⁴ was measured by means of TS-PIV at 0.2Dand 2D distances downstream from a sharp pipe bend (γ = 0.39). Com-plementary LDV measurements were also performed and the agreementwith the PIV data was found to be good.
• The flow field at a pipe cross-section under steady conditions exhibitstwo vortices which on average appear symmetrical to each other in bothdownstream stations. However, at the 2D station the Dean vorticesexhibit an unsteady character in time, oscillating between three states,viz. a clockwise, an anti-clockwise and a symmetrical one. In contrast,at the 0.2D station the Dean vortices remain symmetrical in time as inthe mean. This behaviour was further substantiated through POD andvortex tracking analysis.
• POD reconstruction of the pulsating flow by using only the four mostenergetic modes shows that POD provides a better representation of theflow field, compared to phase-averaging, which is the most common wayof presenting turbulent pulsatile flows in the literature.
4. MAIN CONTRIBUTION AND CONCLUSIONS 39
• During high pulsations, the vortical pattern appears to depend highly onthe cycle phase, with no secondary motions during acceleration whilesymmetrical vortical structures are formed during deceleration and astrong back flow sets in.
G. The effect of curved pulsating flow on turbine performance
(Paper 6)
• Time- and phase-resolved mass flow and pressure measurements wereperformed in highly pulsating turbulent flow, by means of a vortex-shedding flow meter (Laurantzon et al. 2010a) and fast pressure trans-ducers, respectively. Turbine maps at high mass flow rates up to 105 g/sand at a pulsation frequency of 30 Hz are shown for the case when asharp bend (γ = 0.39) is mounted upstream the turbine in order toaccount for effects of the presence of curvature on the turbocharger per-formance. The hysteresis loop due to the filling and emptying of theturbine under a pulse period, was observed to expand to greater magni-tudes as the mass flow rate increased. A slight effect of the presence ofthe bend at the inlet of the turbine was shown on the average quantitiesbut a significant changes were observed in the instantaneous results.
CHAPTER 5
Papers and authors contributions
Paper 1Highly pulsatile turbulent flow past a straight and bent pipeA. Kalpakli Vester (AKV), R. Örlü (RÖ) & P. H. Alfredsson (HAL).Submitted.
This work deals with hot-wire measurements on pulsating turbulent flow down-stream a straight and bent pipe and focuses on the decomposition of the flowinto its coherent and incoherent parts. The experiments were performed byAKV under the supervision of RÖ. The data analysis and the writing was donejointly by AKV & RÖ and comments were provided by HAL. This paper hasbeen submitted for publication.
Part of this work has been published in:
Experimental investigation on the effect of pulsationson turbulent flow through a 90 degrees pipe bendA. Kalpakli, R. Örlü, N. Tillmark & P. H. Alfredsson.3rd Int. Conf. on Jets, Wakes and Separated Flows,27 – 30 September 2010, Cincinnati, OH, USA
Paper 2Dean vortices in turbulent flows: rocking or rolling?A. Kalpakli (AK), R. Örlü (RÖ) & P. H. Alfredsson (HAL).J. Vis., 15, 37-38, 2012
This work presents clear snapshots of the three-dimensional flow field at a cross-section downstream a curved pipe. The experiments were done by AK. Thedata analysis and the writing was done jointly by AK & RÖ with input fromHAL. This paper has been published in the Journal of Visualization.
40
5. PAPERS AND AUTHORS CONTRIBUTIONS 41
Part of this work has been presented and selected to appear online at:
Reynolds and swirl number effects on turbulent pipe flowin a 90 degree pipe bendA. Kalpakli, R. Örlü & P. H. Alfredsson.64th Annual Meeting APS DFD,20 – 22 November 2011, Baltimore, MD, USA
Dancing in the pipeA. Kalpakli, R. Örlü & P. H. Alfredsson.APS Gallery of fluid motion, Virtual Pressroomhttp://www.aps.org/units/dfd/pressroom/gallery/2011/kalpakli11.cfm.
Paper 3Turbulent pipe flow downstream a 90◦ pipe bend withand without superimposed swirlA. Kalpakli (AK) & R. Örlü (RÖ).Int. J. Heat Fluid Flow 41, 103-111, 2013
This work deals with swirling turbulent flow downstream a pipe bend. Theexperiments and the data analysis were done by AK. The writing was done byAK with input from RÖ. This work was initially presented at ETMM9 (seebelow) and was selected for publication in the International Journal of Heatand Fluid Flow.
Part of this work has been published in:
Experimental investigation on the secondary motion downstreama pipe bend with and without swirlA. Kalpakli, & R. Örlü9th International ERCOFTAC Symposium onEngineering Turbulence Modelling and Measurements,6 – 8 June 2012, Thessaloniki, Greece
42 5. PAPERS AND AUTHORS CONTRIBUTIONS
Paper 4Turbulent pipe flow past a 90◦ pipe bend:effects of upstream conditions and curvature ratioA. Kalpakli Vester (AKV).Internal Report
This work deals with turbulent flow downstream two pipe bends with differentcurvature ratios. The effect of upstream conditions on the turbulent flow fielddownstream a curved pipe is also examined.
Part of this work has been accepted for oral presentation in:
Turbulent pipe flow past a 90◦ pipe bend:effects of upstream conditions and curvature ratio.A. Kalpakli, R. Örlü & P. H. Alfredsson.10th International ERCOFTAC Symposium onEngineering Turbulence Modelling and Measurements,17 September – 19 September 2014, Marbella, Spain.
Paper 5Vortical patterns in turbulent flow downstream a 90◦ curved pipeat high Womersley numbersA. Kalpakli (AK), R. Örlü (RÖ) & P. H. Alfredsson (HAL).Int. J. Heat Fluid Flow 44, 692-699, 2013
This work deals with pulsating turbulent flow downstream a pipe bend. Theexperiments and the data analysis were done by AK. The writing was doneby AK with input from RÖ and HAL. This work has been published in theInternational Journal of Heat and Fluid Flow.
Part of this work has been published in:
The characteristics of turbulence in curved pipes under highlypulsatile flow conditionsA. Kalpakli, R. Örlü, N. Tillmark & P. H. Alfredsson.Progress in Turbulence V, Springer Proceedingsin Physics 149, 183–187, 2014iTi Conference in Turbulence,30 September – 3 October 2012, Bertinoro, Italy.
5. PAPERS AND AUTHORS CONTRIBUTIONS 43
Paper 6Some observations of pulsating, curved pipe flow and its influence on turbinemapsA. Kalpakli Vester (AKV), R. Örlü (RÖ), N. Tillmark (NT) & P. H. Alfredsson(HAL).Internal Report
This work examines the effect of a pipe bend mounted at the inlet of a tur-bocharger. The experiments were done by AKV whereas NT contributed tothe setup of the turbocharger rig1. The data analysis was done by AKV (PIVdata) & RÖ (turbine maps). The writing was done by AKV, RÖ and HAL.
Part of this work has been published in:
Experimental investigation on the effect of pulsations on exhaustmanifold-related flows aiming at improved efficiencyA. Kalpakli, R. Örlü, N. Tillmark & P. H. Alfredsson.10th Int. Conf. on Turbochargers and Turbocharging,15 –16 May 2012, London, UK, pp. 377–387
1Dr. Fredrik Laurantzon is acknowledged for his help on the setup of the turbocharger rigand for providing the LabView code for the turbocharger measurements

44
Acknowledgements
This research was started within the competence centre CICERO and is since2011 supported by its successor CCGEx (Competence Centre for Gas Ex-change). Both centres were/are supported by the Swedish Energy Agency,Swedish vehicle industry and KTH. The Linné FLOW Centre at KTH hasalso provided support through extensive use of their infrastructure in terms offlow instrumentation (HWA, LDV and PIV). The travel grants Erik Petersohnsminne, Björns foundation and Folke Odqvist stipend are greatly acknowledged.
First of all, I would like to thank my main supervisor, Prof. P. HenrikAlfredsson for not only accepting me as his student, but also for his alwaysfriendly attitude. Becoming a mother during the PhD studies and completingthis project would not had been easy without your help and support, thankyou Henrik.
I would like to express my sincere gratitude to my advisor Dr. Ramis Örlüfor always being available to help and discuss any kind of research related topicbut most of all for teaching me how a researcher should think and approachproblems. It has been a pleasure to work together and I am looking forwardfor more cooperations in the future. I would like to thank my advisor, Dr. NilsTillmark for keeping the CICERO lab up and running and for having a solutionfor any kind of technical matter whenever needed.
Dr. Jonas Holmborn is acknowledged for creating a nice and cooperativeenvironment within CCGEx.
I would like to thank Dr. Erik Lindborg for his constructive commentson this manuscript. Dr. Philipp Schlatter and Tekn. Lic. Azad Noorani arethanked for many constructive discussions on curved pipe flows.
Special thanks go to Prof. Alexander J. Smits for giving me the opportunityto spend three months at the Gas Dynamics Lab at Princeton University. LeoHellström, Yuyang Fan and Margit Vallikivi deserve many thanks for showingme around in the lab and for their hospitality.
Our skillfull toolmakers, Joakim Karlström and Göran Rådberg deservespecial thanks for being there whenever I had problems in the laboratory butalso for providing many times advice and guidance for the building of setups.
45
46 ACKNOWLEDGEMENTS
Many thanks go to Dr. Gabriele Bellani for helping me in my first PIVexperiments. MSc. Markus Pastuhoff deserves many thanks for creating sucha nice atmosphere in our office for the last 5 years but also for his willingnessto answer to my many questions :). Dr. Fredrik Laurantzon is acknowledgedfor his help with the turbocharger measurements and the vortex flowmeter aswell as for creating a nice atmosphere in the CICERO lab. Tekn. Lic. SohrabSattarzadeh is thanked for providing the hot-wire data for validation of thePIV data as well as for being a nice colleague. I would also like to thank Dr.Onofrio Semeraro for fruitful discussions on modal analysis.
Everyone at the Fluid Physics lab are thanked for creating a nice andcheerful working environment. Thank you all for the nice fika and lunches andhope that we will keep in touch!
I would like to devote a small part of this section and thank the people fromwhom I get support outside work. Miriam and Philippe, thank you for beingnice friends and for—among others—making my wedding day unforgettable.Rosalin and Despoina, even though the distance between us has increased thelast 5 years, our friendship remains strong. Thank you for being there for me,I am looking forward to the many nice summers to spend together in Greece!
All my love and thoughts go to the people without whom I wouldn’t behere. My mum and dad for always being by my side supporting me by anymeans and for letting me always choose my own path. My sister for all the loveand support and for her endless enthusiasm on arts.
Last, but definitely not least, all my love goes to my wonderful husband andto my little prince: Johan and Christo, σας αγαπώ πολύ!
References
Adrian, R. J. & Westerweel, J. 2010 Particle image velocimetry. CambridgeUniversity Press, USA.
Albrecht, H.-E., Borys, M., Damaschke, N. & Tropea, C. 2003 Laser Dopplerand Phase Doppler Measurement Techniques. Springer.
Angele, K. P. & Muhammad-Klingmann, B. 2005 A simple model for the effectof peak-locking on the accuracy of boundary layer turbulence statistics in digitalPIV. Exp. Fluids 38, 341–347.
Anwer, M. & So, R. M. C. 1993 Swirling turbulent flow through a curved pipe.Part 1: Effect of swirl and bend curvature. Exp. Fluids 14, 85–96.
Anwer, M., So, R. M. C. & Lai, Y. G. 1989 Perturbation by and recoveryfrom bend curvature of a fully developed turbulent pipe flow. Phys. Fluids A 1,1387–1397.
Azzola, J., Humprey, J. A. C., Iacovides, H. & Launder, B. E. 1986 De-veloping turbulent flow in a U-bend of circular cross-section: measurement andcomputation. J. Fluids Eng. 108, 214–221.
Baines, N. C. 2009 Turbocharger turbine pulse flow performance and modelling-25years on. 9th Int. Conf. on Turbochargers and Turbocharging (IMechE), UK , pp.347–362.
Berger, S. A., Talbot, L. & Yao, L. S. 1983 Flow in curved pipes. Annu. Rev.Fluid Mech. 15, 461–512.
Berkooz, G., Holmes, P. & Lumley, J. L. 1993 The proper orthogonal decom-position in the analysis of turbulent flows. Annu. Rev. Fluid Mech. 25, 539–575.
Berson, A., Blanc-Benon, P. & Comte-Bellot, G. 2010 On the use of hot-wireanemometry in pulsating flows. A comment on ’A critical review on advancedvelocity measurement techniques in pulsating flows’. Meas. Sci. Technol. 21,128001.
Binnie, A. M. 1978 Some notes on the study of fluid mechanics in Cambridge,England. Annu. Rev. Fluid Mech. 10, 1–11.
Boersma, B. J. & Nieuwstadt, F. T. M. 1996 Large-eddy simulation of turbulentflow in a curved pipe. J. Fluids Eng. 118, 248–254.
Bradshaw, P. 1987 Turbulent Secondary Flows. Annu. Rev. Fluid Mech. 19, 53–74.
Brücker, C. 1998 A time-recording DPIV-Study of the swirl switching effect in a
47
48 REFERENCES
90◦ bend flow. Proc. 8th Int. Symp. Flow Vis., 1-4 Sept., Sorrento (NA), Italypp. 171.1–171.6.
Bruun, H. 1995 Hot-wire anemometry: principles and signal analysis. Oxford Uni-versity Press, UK.
Capobianco, M. & Marelli, S. 2009 Experimental Investigation into the pulsatingflow performance of a turbocharger turbine in the closed and open waste-gateregion. 9th Int. Conf. on Turbochargers and Turbocharging (IMechE), UK , pp.373–389.
Carpinlioglu, M. Ö. & Gündogdu, M. Y. 2001 A critical review on pulsatilepipe flow studies directing towards future research topics. Flow Meas. Instrum.12, 163–174.
Chandran, K. B. & Yearwood, T. L. 1981 Experimental study of physiologicalpulsatile flow in a curved tube. J. Fluid Mech. 111, 59–85.
Chang, T. H. & Lee, H. S. 2003 An experimental study on swirling flow in a 90degree circular tube by using Particle Image Velocimetry. J. Vis. 6, 343–352.
Chatterjee, A. 2000 An introduction to the proper orthogonal decomposition. Curr.Sci. 78, 808–817.
Chen, H., Hakeem, I. & Martinez-Botas, R. F. 1996 Modelling of a turbochargerturbine under pulsating inlet conditions. J. Power Energy 210, 397–408.
Chiong, M. S., Rajoo, S., Martinez-Botas, R. F. & Costall, A. W. 2012Engine turbocharger performance prediction: One-dimensional modelling of atwin entry turbine. Energy Conv. Management 57, 68–78.
Chiong, M. S., Rajoo, S., Romagnoli, A., Costall, A. W. & Martinez-Botas, R. F. 2014 Integration of meanline and one-dimensional methods forprediction of pulsating performance of a turbocharger turbine. Energy Conv.Management 81, 270–281.
Christensen, K. T. 2004 The influence of peak-locking errors on turbulence statis-tics computed from PIV ensembles. Exp. Fluids 36, 484–497.
Copeland, C. D., Martinez-Botas, R. F. & Seiler, M. 2012 Unsteady Perfor-mance of a Double Entry Turbocharger Turbine With a Comparison to SteadyFlow Conditions. J. Turbomach. 134, 021022.
De Bellis, V., Marelli, S., Bozza, F. & Capobianco, M. 2014 1D simula-tion and experimental analysis of a turbocharger turbine for automotive enginesunder steady and unsteady flow conditions. Energy Procedia 45, 909–918.
Dean, W. R. 1927 Note on the motion of fluid in a curved pipe. Phil. Mag. 4,208–223.
Dean, W. R. 1928 The stream-line motion of fluid in a curved pipe. Phil. Mag. 5,671–695.
Dean, W. R. & Hurst, J. M. 1959 Note on the motion of fluid in a curved pipe.Mathematika 6, 77–85.
Di Liberto, M., Di Piazza, I. & Ciofalo, M. 2013 Turbulence structure andbudgets in curved pipes. Comp. Fluids 88, 452–472.
van Doornel, C. W. H. & Westerweel, J. 2007 Measurement of laminar, transi-tional and turbulent pipe flow using Stereoscopic-PIV. Exp. Fluids 42, 259–279.
REFERENCES 49
Enayet, M. M., Gibson, M. M., Taylor, A. & Yianneskis, M. 1982 Laser-doppler measurements of laminar and turbulent flow in a pipe bend. Int. J. HeatFluid Flow 3, 213–219.
Eustice, J. 1910 Flow of water in curved pipes. Proc. R. Soc. A 84, 107–118.
Eustice, J. 1911 Experiments on stream-line motion in curved pipes. Proc. R. Soc.A 85, 119–131.
Facciolo, L. 2006 A study on axially rotating pipe and swirling jet flows. PhD thesis,KTH Mechanics, Stockholm, Sweden.
Facciolo, L., Tillmark, N., Talamelli, A. & Alfredsson, P. H. 2007 A studyof swirling turbulent pipe and jet flows. Phys. Fluids 19, 035105.
Ferro, M. 2012 Experimental study on turbulent pipe flow. M.Sc. thesis, KTHMechanics, Stockholm, Sweden.
Fjällman, J., Mihaescu, M. & Fuchs, L. 2013 Analysis of secondary flow inducedby a 90◦ bend in a pipe using mode decomposition techniques. 4th Int. Conf.Jets, Wakes Separated Flows, 17-21 Sept. 2013, Nagoya, Japan.
Glenn, A. L., Bulusu, K., Shu, F. & Plesniak, M. W. 2012 Secondary flowstructures under stent-induced perturbations for cardiovascular flow in a curvedartery model. Int. J. Heat Fluid Flow 35, 76–83.
Goldstein, S. 1938 Modern developments in fluid mechanics. Oxford UniversityPress, UK.
Greenspan, D. 1973 Secondary flow in a curved tube. J. Fluid Mech. 57, 167–176.
Guala, M., Hommema, S. E. & Adrian, R. J. 2006 Large-scale and very-large-scale motions in turbulent pipe flow. J. Fluid Mech. 554, 521–542.
Hamakiotes, C. C. & Berger, S. A. 1988 Fully developed pulsatile flow in acurved pipe. J. Fluid Mech. 195, 23–55.
Tabatabaei, H. R. Boroomand, M. & Taeibi-Rahi, M. 2012 An investigationon turbocharger turbine performance parameters under inlet pulsating flow. J.Fluids Eng. 134, 081102.
He, S. & Jackson, J. D. 2009 An experimental study of pulsating turbulent flowin a pipe. Eur. J. Mech. B-Fluid 28, 309–320.
Hellström, F. 2010 Numerical computations of the unsteady flow in turbochargers.PhD thesis, KTH Mechanics, Sweden.
Hellström, F. & Fuchs, L. 2008 Numerical computations of pulsatile flow in aturbo-charger. AIAA paper, 2008-735.
Hellström, L. H. O., Zlatinov, M., Cao, G. & Smits, A. 2013 Turbulent pipeflow downstream of a bend. J. Fluid Mech. 735, R7.
Hellström, L. H. O., Zlatinov, M. & Smits, A. 2011 Turbulent pipe flow thro-ugh a 90◦ bend. 7th Int. Symp. on Turbulence and Shear Flow Phenomena,Canada.
Holmes, P., Lumley, J. L., Berkooz, G. & Rowley, C. W. 2012 Turbulence,coherent structures, dynamical systems and symmetry, 2nd ed. Cambridge Uni-versity Press.
Hüttl, T. J. & Friedrich, R. 2001 Direct numerical simulation of turbulent flowsin curved and helically coiled pipes. Comp. Fluids 30, 591–605.
50 REFERENCES
Ito, H. 1959 Friction factors for turbulent flow in curved pipes. J. Basic Eng. 82,123–134.
Jarrahi, M., Castelain, C. & Peerhossaini, H. 2010 Secondary flow patternsand mixing in laminar pulsating flow through a curved pipe. Exp. Fluids 50,1539–1558.
Johansson, A. V. & Alfredsson, P. H. 1982 On the structure of turbulent channelflow. J. Fluid Mech. 122, 295–314.
Kalpakli, A. 2012 Experimental study of turbulent flows through pipe bends. Li-centiate thesis, KTH Mechanics, Stockholm, Sweden.
Kundu, K. P., Cohen, M. I. & Dowling, R. D. 2012 Fluid mechanics, 5th ed.Elsevier Inc.
Lai, Y., So, R. M. C. & Zhang, H. S. 1991 Turbulence-driven secondary flowsin a curved pipe. Theoret. Comput. Fluid Dyn. 3, 163–180.
Laurantzon, F., Örlü, R., Segalini, A. & Alfredsson, P. H. 2010a Time-resolved measurements with a vortex flowmeter in a pulsating turbulent flowusing wavelet analysis. Meas. Sci. Technol. 21, 123001.
Laurantzon, F., Örlü, R., Segalini, A., Tillmark, N. & Alfredsson, P. H.2012a Experimental analysis of turbocharger interaction with a pulsatile flowthrough time-resolved flow measurements upstream and downstream the turbine.10th Int. Conf. on Turbochargers and Turbocharging (IMechE), UK , pp. 405–415.
Laurantzon, F., Tillmark, N. & Alfredsson, P. H. 2010b A pulsating flowrig for analyzing turbocharger performance. 9th Int. Conf. on Turbochargers andTurbocharging (IMechE), UK , pp. 363–372.
Laurantzon, F., Tillmark, N., Örlü, R. & Alfredsson, P. H. 2012b A flowfacility for the characterization of pulsatile flows. Flow Meas. Instrum. 26, 10–17.
Lumley, J. L. 1971 Stochastic tools in turbulence. Academic Press, New York, USA.
Manley, D. K., Mcllroy, A. & Taatjes, C. 2008 Research needs for futureinternal combustion engines. Phys. Today 11, 47–52.
Marelli, S. & Capobianco, M. 2011 Steady and pulsating flow efficiency of awaste-gated turbocharger radial flow turbine for automotive application. Energy36, 459–465.
Marelli, S., Carraro, C., Marmorato, G., Zamboni, G. & Capobianco, M.2014 Experimental analysis on the performance of a turbocharger compressor inthe unstable operating region and close to the surge limit. Exp. Thermal FluidSci. 53, 154–160.
McConalogue, D. J. & Srivastava, R. S. 1968 Motion of a fluid in a curvedtube. Proc. R. Soc. A 307, 37–53.
McDonald, D. A. 1955 The relation of pulsatile pressure to flow in arteries. J.Physiol. 127, 533–552.
Meyer, K., Pedersen, J. M. & Özcan, O. 2007 A turbulent jet in crossflowanalysed with proper orthogonal decomposition. J. Fluid Mech. 583, 199–227.
Millo, F., Pasero, P., Barbero, S. & Vennettilli, N. 2008 An experimentaland numerical study of an advanced EGR control system for automotive dieselengine. SAE Tech. paper , 2008-01-0208.
REFERENCES 51
Nabavi, M. & Siddiqui, K. 2010 A critical review on advanced velocity measure-ment techniques in pulsating flows. Meas. Sci. Technol. 21, 042002.
Noorani, A., El Khoury, G. K. & Schlatter, P. 2013 Evolution of turbulencecharacteristics from straight to curved pipes. Int. J. Heat Fluid Flow 41, 16–26.
Olczyk, A. 2009 Investigation of the specific mass flow rate distribution in pipessupplied with a pulsating flow. Int. J. Heat Fluid Flow 30, 637–646.
Ono, A., Kimura, N., Kamide, H. & Tobita, A. 2010 Influence of elbow curvatureon flow structure at elbow outlet under high Reynolds number condition. Nucl.Eng. Des. 241, 4409–4419.
Örlü, R. 2009 Experimental studies in jet flows and zero pressure-gradient turbulentboundary layers. PhD thesis, KTH Mechanics, Stockholm, Sweden.
Overmars, E. F. J., Warncke, N. G. W., Poelma, C. & Westerweel, J.2010 Bias errors in PIV: the pixel locking effect revisited. 15th Int. Symp. onapplications of laser techniques to fluid mechanics, Lisbon, Portugal, 2010 .
Padzillah, M. H., Rajoo, S. & Martinez-Botas, R. F. 2014 Influence of speedand frequency towards the automotive turbocharger turbine performance underpulsating flow conditions. Energy Conv. Management 80, 416–428.
Palfreyman, D. & Martinez-Botas, R. F. 2005 The pulsating flow field in amixed flow turbocharger turbine: an experimental and computational study. J.Turbomach. 127, 144–154.
Patankar, S. V., Pratap, V. S. & Spalding, D. B. 1975 Prediction of turbulentflow in curved pipes. J. Fluid Mech. 67, 583–595.
Pedley, T. J. 1980 The fluid mechanics of large blood vessels. Cambridge Univ.Press.
Perry, A. E. 1982 Hot-wire anemometry. Clarendon Press Oxford.
Piazza, I. D. & Ciofalo, M. 2011 Transition to turbulence in toroidal pipes. J.Fluid Mech. 687, 72–117.
Piscaglia, F., Onorati, A., Marelli, S. & Capobianco, M. 2007 Unsteadybehavior in turbocharger turbines: experimental analysis and numerical simula-tion. SAE Tech. paper 2007-24-0081, pp. 1–13.
Prasad, A. K. 2000 Stereoscopic particle image velocimetry. Exp. Fluids 29, 103–116.
Prasad, A. K. & Jensen, K. 1995 Scheimpflug stereocamera for particle imagevelocimetry in liquid flows. Appl. Optics 34, 7092–7099.
Pruvost, J., Legrand, J. & Legentilhomme, P. 2004 Numerical investigation ofbend and torus flows, part I: effect of swirl motion on flow structure in U-bend.Chem. Eng. Sc. 59, 3345–3357.
Raffel, M., Willert, C. E., Wereley, S. T. & Kompenhans, J. 2007 Particleimage velocimetry: a practical guide, 2nd ed. Springer.
Reifarth, S. 2014 Efficiency and mixing analysis of EGR-Systems for diesel engines.PhD thesis, KTH Mechanics, Stockholm, Sweden.
Rowe, M. 1970 Measurements and computations of flow in pipe bends. J. FluidMech. 43, 771–783.
Rütten, F., Meinke, M. & Schröder, W. 2001 Large-eddy simulations of 90 ◦
pipe bend flows. J. Turbul. 2, N3.
52 REFERENCES
Rütten, F., Schröder, W. & Meinke, M. 2005 Large-eddy simulation of lowfrequency oscillations of the Dean vortices in turbulent pipe bend flows. Phys.Fluids 17, 035107.
Sakakibara, J. & Machida, N. 2012 Measurement of turbulent flow upstream anddownstream of a circular pipe bend. Phys. Fluids 24, 041702.
Sakakibara, J., Sonobe, R., Goto, H., Tezuka, H., Tada, H. & Tezuka, K.2010 Stereo-PIV study of turbulent flow downstream of a bend in a round pipe.14th Int. Symp. Flow Vis., 21-24 June, EXCO Daegu, Korea.
Samimy, M. & Lele, S. K. 1991 Motion of particles with inertia in a compressiblefree shear layer. Phys. Fluids A 3, 1915–1923.
Sattarzadeh, S. S. 2011 Experimental study of complex pipe flows. M.Sc. thesis,KTH Mechanics, Stockholm, Sweden.
Scarano, F. 2002 Iterative image deformation methods in PIV. Meas. Sci. Technol.13, R1–R19.
Schlichting, H. 1979 Boundary-layer theory, 7th ed. McGraw-Hill.
Semeraro, O., Bellani, G. & Lundell, F. 2012 Analysis of time-resolved PIVmeasurements of a confined turbulent jet using POD and Koopman modes. Exp.Fluids 53, 1203–1220.
So, R. M. C. & Anwer, M. 1993 Swirling turbulent flow through a curved pipe.Part 2: Recovery from swirl and bend curvature. Exp. Fluids 14, 169–177.
Spedding, P. L. & Benard, E. 2004 Fluid flow through 90 degree bends. Dev.Chem. Eng. Mineral Process 12, 107–128.
Sudo, K., Sumida, M. & Hibara, H. 1998 Experimental investigation on turbulentflow in a circular-sectioned 90-degree bend. Exp. Fluids 25, 42–49.
Szymko, S., Martinez-Botas, R. F. & Pullen, K. R. 2005 Experimental evalua-tion of turbocharger turbine performance under pulsating flow conditions. Proc.GT2005: ASME TURBO EXPO, June 6–9, 2005, Reno-Tahoe, Nevada, USA.
Tabatabaei, H. R., Boroomand, M. & Taeibi-Rahi, M. 2012 Pulsating FlowAnalysis in a Small Turbocharger Turbine. Int. J. Sci. Eng. Invest. 1, 85–91.
Taylor, G. I. 1929 The criterion for turbulence in curved pipes. Proc. R. Soc. A124, 243–249.
Thomson, J. 1876 On the origin of windings of rivers in alluvial plains with remarkson the flow of water round bends in pipes. Proc. R. Soc. A 25, 5–8.
Timité, B., Castelain, C. & Peerhossaini, H. 2010 Pulsatile viscous flow in acurved pipe: Effects of pulsation on the development of secondary flow. Int. J.Heat Fluid Flow 31, 879–896.
Tunstall, M. J. & Harvey, J. K. 1968 On the effect of a sharp bend in a fullydeveloped turbulent pipe-flow. J. Fluid Mech. 34, 595–608.
Vashisth, S., Kumar, V. & Nigam, K. D. P. 2008 A review on the potentialapplications of curved geometries in process industry. Indust. Eng. Chem. Res.47, 3291–3337.
Vergano, D. 2006 Turbulence theory gets a bit choppy. USA Today, 2006-09-10 .
Ward-Smith, A. J. 1980 Internal fluid flow. The fluid dynamics of flow in pipesand ducts. Clarendon Press Oxford.
REFERENCES 53
Westerweel, J. 1994 Efficient detection of spurious vectors in particle image ve-locimetry data. Exp. Fluids 16, 236–247.
White, C. M. 1929 Streamline flow through curved pipes. Proc. R. Soc. A 123,645–663.
Wieneke, B. 2005 Stereo-PIV using self-calibration on particle images. Exp. Fluids39, 267–280.
Womersley, J. 1957 Oscillatory flow in arteries: the constrained elastic tube as amodel of arterial flow and pulse transmission. Phys. Medicine Biol. 2, 178–187.
Yeh, Y. & Cummins, H. Z. 1964 Localized fluid flow measurements with an HeNelaser spectrometer. Appl. Phys. Lett. 4, 176–178.
Yuki, K., Hasegawa, S., Sato, T., Hashizume, H., Aizawa, K. & Yamano, H.2011 Matched refractive-index PIV visualization of complex flow structure in athree-dimentionally connected dual elbow. Nucl. Eng. Design 241, 4544–4550.