Embed Size (px)
Citation preview
ICES Advice on fishing opportunities, catch, and effort Northeast Atlantic Published 5 May 2017 sal.27.neac DOI: Published 5 May 2017
ICES Advice 2017, Book 14 1
Atlantic salmon from the Northeast Atlantic Summary of advice for fishing seasons 2017/2018 to 2018/2019 In 2015, ICES advised that there were no mixed-stock fisheries options (i.e. no catch > 0) on the NEAC stock complexes at the Faroes for the fishing seasons 2015/2016 to 2017/2018 (ICES, 2015). After an assessment in 2016, ICES continued to advise that there were no mixed-stock fisheries catch options on the NEAC complexes at the Faroes for the fishing seasons 2016/2017 to 2018/2019 (ICES, 2016a). This was consistent with the earlier advice. NASCO subsequently agreed that the Decision adopted in 2015 (NASCO, 2015) would continue to apply to the fishery in 2016/17, and that it would also apply in 2017/2018 unless the application of the Framework of Indicators (FWI) shows that a re-assessment is warranted. The NASCO Framework of Indicators of Northeast Atlantic stocks for 2016 did not indicate the need for a revised analysis of catch options for 2017 and no new management advice for 2017 is provided. The assessment was updated to 2016 and the stock status is consistent with the previous years’ assessments and catch advice. NASCO 2.1 Describe the key events of the 2016 fisheries, including details of catch, gear, effort, composition and
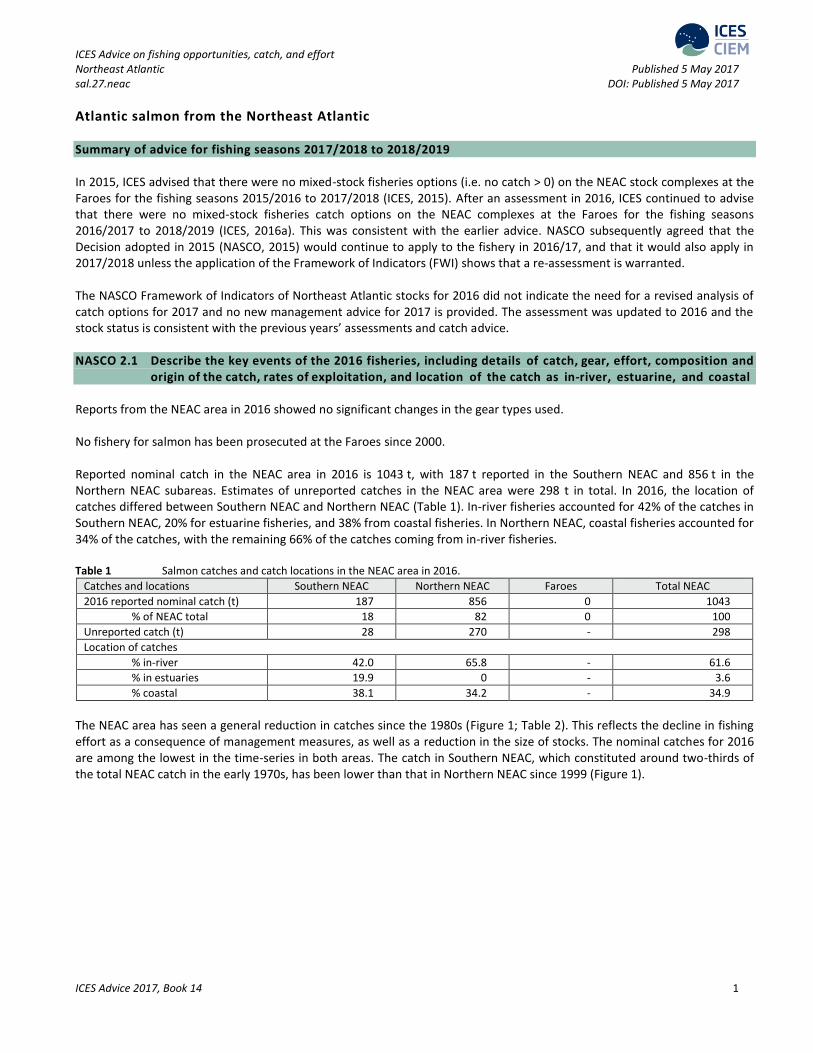
origin of the catch, rates of exploitation, and location of the catch as in-river, estuarine, and coastal Reports from the NEAC area in 2016 showed no significant changes in the gear types used. No fishery for salmon has been prosecuted at the Faroes since 2000. Reported nominal catch in the NEAC area in 2016 is 1043 t, with 187 t reported in the Southern NEAC and 856 t in the Northern NEAC subareas. Estimates of unreported catches in the NEAC area were 298 t in total. In 2016, the location of catches differed between Southern NEAC and Northern NEAC (Table 1). In-river fisheries accounted for 42% of the catches in Southern NEAC, 20% for estuarine fisheries, and 38% from coastal fisheries. In Northern NEAC, coastal fisheries accounted for 34% of the catches, with the remaining 66% of the catches coming from in-river fisheries. Table 1 Salmon catches and catch locations in the NEAC area in 2016.
Catches and locations Southern NEAC Northern NEAC Faroes Total NEAC
2016 reported nominal catch (t) 187 856 0 1043
% of NEAC total 18 82 0 100
Unreported catch (t) 28 270 - 298
Location of catches
% in-river 42.0 65.8 - 61.6
% in estuaries 19.9 0 - 3.6
% coastal 38.1 34.2 - 34.9
The NEAC area has seen a general reduction in catches since the 1980s (Figure 1; Table 2). This reflects the decline in fishing effort as a consequence of management measures, as well as a reduction in the size of stocks. The nominal catches for 2016 are among the lowest in the time-series in both areas. The catch in Southern NEAC, which constituted around two-thirds of the total NEAC catch in the early 1970s, has been lower than that in Northern NEAC since 1999 (Figure 1).
ICES Advice on fishing opportunities, catch, and effort Published 5 May 2017
ICES Advice 2017, Book 14 2
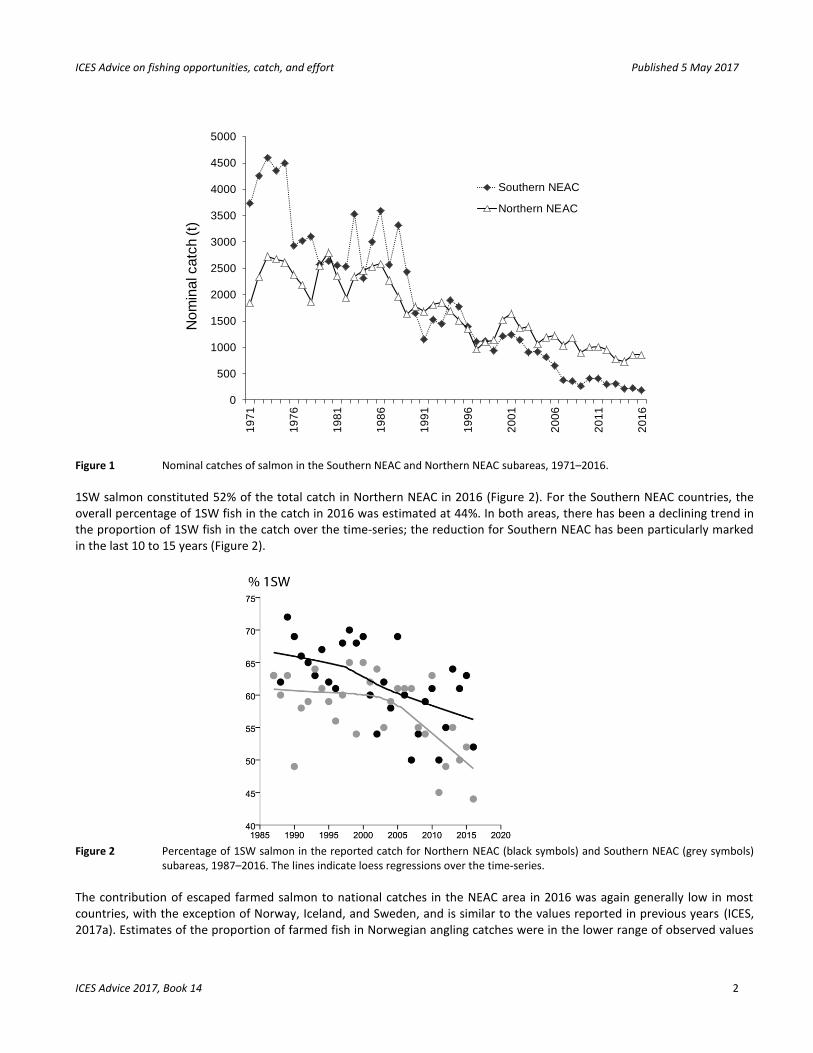
Figure 1 Nominal catches of salmon in the Southern NEAC and Northern NEAC subareas, 1971–2016.
1SW salmon constituted 52% of the total catch in Northern NEAC in 2016 (Figure 2). For the Southern NEAC countries, the overall percentage of 1SW fish in the catch in 2016 was estimated at 44%. In both areas, there has been a declining trend in the proportion of 1SW fish in the catch over the time-series; the reduction for Southern NEAC has been particularly marked in the last 10 to 15 years (Figure 2).
Figure 2 Percentage of 1SW salmon in the reported catch for Northern NEAC (black symbols) and Southern NEAC (grey symbols)
subareas, 1987–2016. The lines indicate loess regressions over the time-series.
The contribution of escaped farmed salmon to national catches in the NEAC area in 2016 was again generally low in most countries, with the exception of Norway, Iceland, and Sweden, and is similar to the values reported in previous years (ICES, 2017a). Estimates of the proportion of farmed fish in Norwegian angling catches were in the lower range of observed values
0
500
1000
1500
2000
2500
3000
3500
4000
4500
5000
19
71
19
76
19
81
19
86
19
91
19
96
20
01
20
06
20
11
20
16
Nom
inal catc
h (t)
Southern NEAC
Northern NEAC
ICES Advice on fishing opportunities, catch, and effort Published 5 May 2017
ICES Advice 2017, Book 14 3
in the time-series (4%), while the proportion estimated in Norwegian rivers in the autumn was the lowest in the time-series (7%). No current data are available for the proportion of farmed salmon in coastal fisheries.
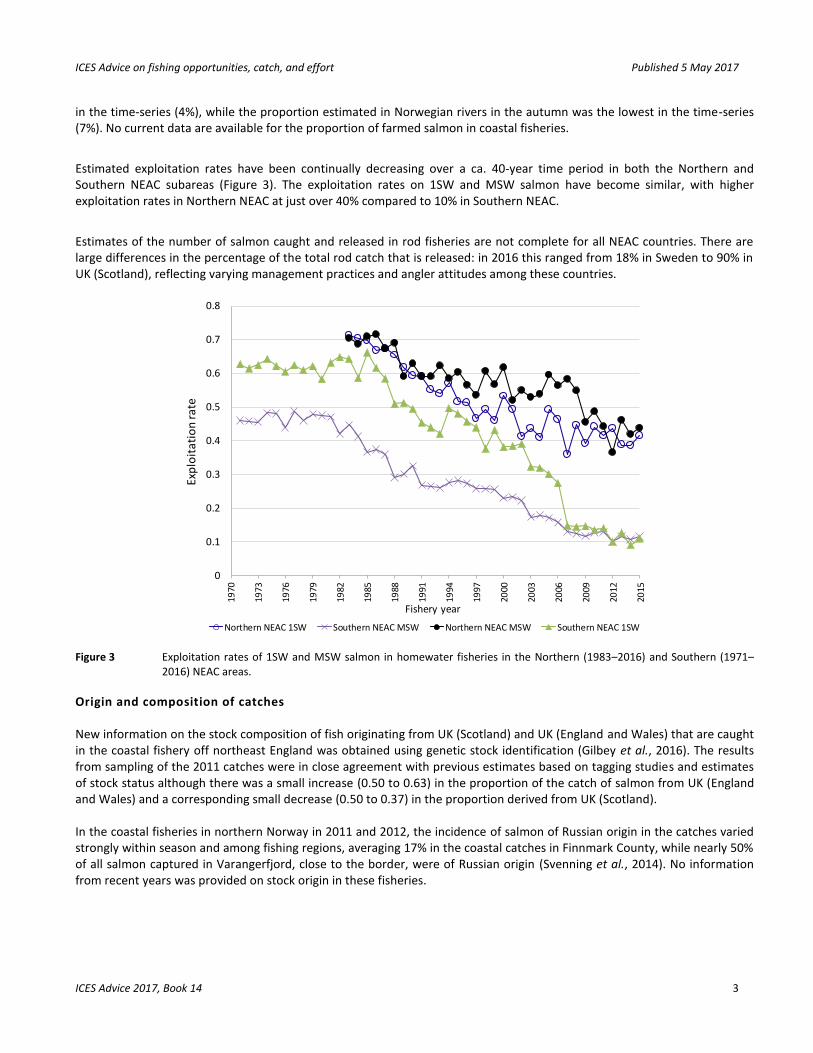
Estimated exploitation rates have been continually decreasing over a ca. 40-year time period in both the Northern and Southern NEAC subareas (Figure 3). The exploitation rates on 1SW and MSW salmon have become similar, with higher exploitation rates in Northern NEAC at just over 40% compared to 10% in Southern NEAC.
Estimates of the number of salmon caught and released in rod fisheries are not complete for all NEAC countries. There are large differences in the percentage of the total rod catch that is released: in 2016 this ranged from 18% in Sweden to 90% in UK (Scotland), reflecting varying management practices and angler attitudes among these countries.
Figure 3 Exploitation rates of 1SW and MSW salmon in homewater fisheries in the Northern (1983–2016) and Southern (1971–
2016) NEAC areas.
Origin and composition of catches New information on the stock composition of fish originating from UK (Scotland) and UK (England and Wales) that are caught in the coastal fishery off northeast England was obtained using genetic stock identification (Gilbey et al., 2016). The results from sampling of the 2011 catches were in close agreement with previous estimates based on tagging studies and estimates of stock status although there was a small increase (0.50 to 0.63) in the proportion of the catch of salmon from UK (England and Wales) and a corresponding small decrease (0.50 to 0.37) in the proportion derived from UK (Scotland). In the coastal fisheries in northern Norway in 2011 and 2012, the incidence of salmon of Russian origin in the catches varied strongly within season and among fishing regions, averaging 17% in the coastal catches in Finnmark County, while nearly 50% of all salmon captured in Varangerfjord, close to the border, were of Russian origin (Svenning et al., 2014). No information from recent years was provided on stock origin in these fisheries.
0
0.1
0.2
0.3
0.4
0.5
0.6
0.7
0.8
1970
1973
1976
1979
1982
1985
1988
1991
1994
1997
2000
2003
2006
2009
2012
2015
Exp
loit
atio
n r
ate
Fishery year
Northern NEAC 1SW Southern NEAC MSW Northern NEAC MSW Southern NEAC 1SW
ICES Advice on fishing opportunities, catch, and effort Published 5 May 2017
ICES Advice 2017, Book 14 4
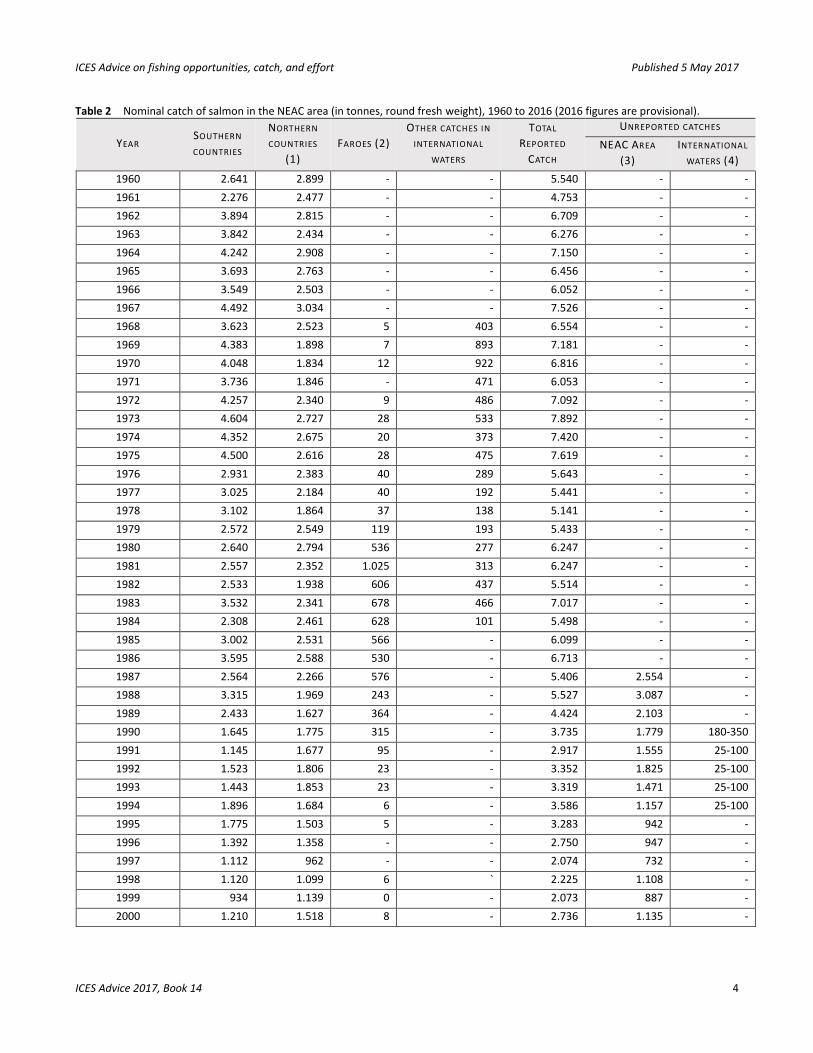
Table 2 Nominal catch of salmon in the NEAC area (in tonnes, round fresh weight), 1960 to 2016 (2016 figures are provisional).
YEAR SOUTHERN
COUNTRIES
NORTHERN
COUNTRIES
(1)
FAROES (2)
OTHER CATCHES IN
INTERNATIONAL
WATERS
TOTAL
REPORTED
CATCH
UNREPORTED CATCHES
NEAC AREA
(3)
INTERNATIONAL
WATERS (4)
1960 2.641 2.899 - - 5.540 - -
1961 2.276 2.477 - - 4.753 - -
1962 3.894 2.815 - - 6.709 - -
1963 3.842 2.434 - - 6.276 - -
1964 4.242 2.908 - - 7.150 - -
1965 3.693 2.763 - - 6.456 - -
1966 3.549 2.503 - - 6.052 - -
1967 4.492 3.034 - - 7.526 - -
1968 3.623 2.523 5 403 6.554 - -
1969 4.383 1.898 7 893 7.181 - -
1970 4.048 1.834 12 922 6.816 - -
1971 3.736 1.846 - 471 6.053 - -
1972 4.257 2.340 9 486 7.092 - -
1973 4.604 2.727 28 533 7.892 - -
1974 4.352 2.675 20 373 7.420 - -
1975 4.500 2.616 28 475 7.619 - -
1976 2.931 2.383 40 289 5.643 - -
1977 3.025 2.184 40 192 5.441 - -
1978 3.102 1.864 37 138 5.141 - -
1979 2.572 2.549 119 193 5.433 - -
1980 2.640 2.794 536 277 6.247 - -
1981 2.557 2.352 1.025 313 6.247 - -
1982 2.533 1.938 606 437 5.514 - -
1983 3.532 2.341 678 466 7.017 - -
1984 2.308 2.461 628 101 5.498 - -
1985 3.002 2.531 566 - 6.099 - -
1986 3.595 2.588 530 - 6.713 - -
1987 2.564 2.266 576 - 5.406 2.554 -
1988 3.315 1.969 243 - 5.527 3.087 -
1989 2.433 1.627 364 - 4.424 2.103 -
1990 1.645 1.775 315 - 3.735 1.779 180-350
1991 1.145 1.677 95 - 2.917 1.555 25-100
1992 1.523 1.806 23 - 3.352 1.825 25-100
1993 1.443 1.853 23 - 3.319 1.471 25-100
1994 1.896 1.684 6 - 3.586 1.157 25-100
1995 1.775 1.503 5 - 3.283 942 -
1996 1.392 1.358 - - 2.750 947 -
1997 1.112 962 - - 2.074 732 -
1998 1.120 1.099 6 ` 2.225 1.108 -
1999 934 1.139 0 - 2.073 887 -
2000 1.210 1.518 8 - 2.736 1.135 -
ICES Advice on fishing opportunities, catch, and effort Published 5 May 2017
ICES Advice 2017, Book 14 5
YEAR SOUTHERN
COUNTRIES
NORTHERN
COUNTRIES
(1)
FAROES (2)
OTHER CATCHES IN
INTERNATIONAL
WATERS
TOTAL
REPORTED
CATCH
UNREPORTED CATCHES
NEAC AREA
(3)
INTERNATIONAL
WATERS (4)
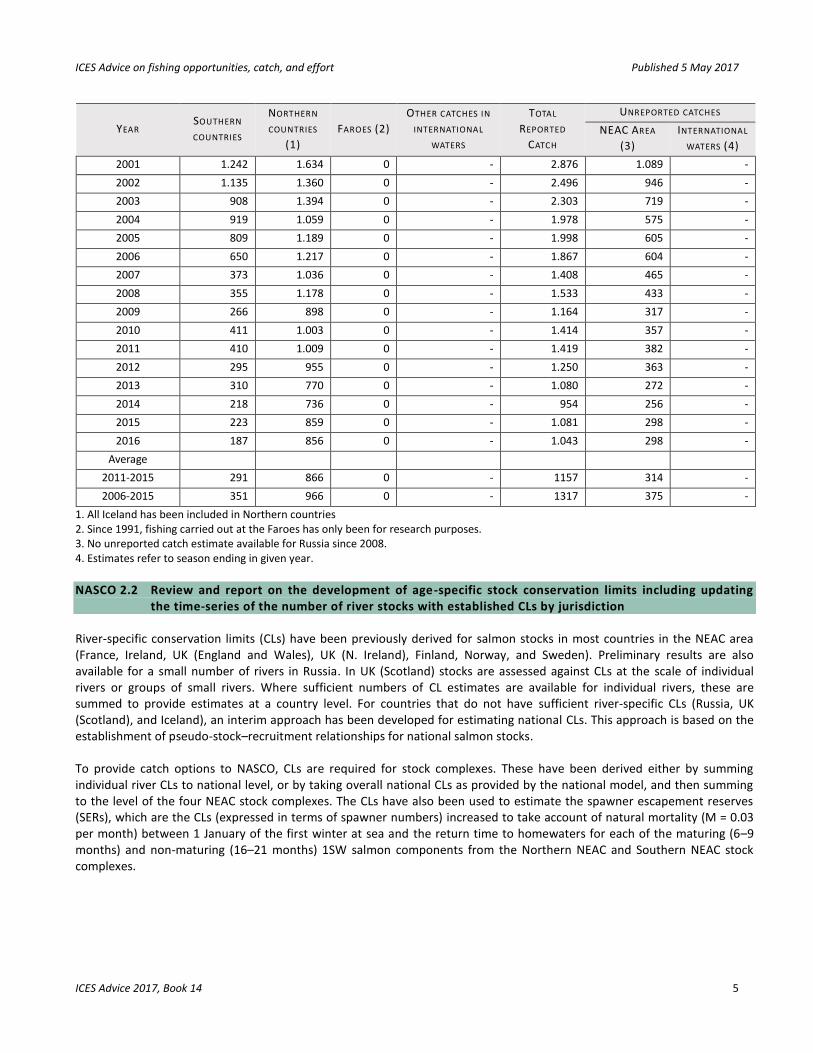
2001 1.242 1.634 0 - 2.876 1.089 -
2002 1.135 1.360 0 - 2.496 946 -
2003 908 1.394 0 - 2.303 719 -
2004 919 1.059 0 - 1.978 575 -
2005 809 1.189 0 - 1.998 605 -
2006 650 1.217 0 - 1.867 604 -
2007 373 1.036 0 - 1.408 465 -
2008 355 1.178 0 - 1.533 433 -
2009 266 898 0 - 1.164 317 -
2010 411 1.003 0 - 1.414 357 -
2011 410 1.009 0 - 1.419 382 -
2012 295 955 0 - 1.250 363 -
2013 310 770 0 - 1.080 272 -
2014 218 736 0 - 954 256 -
2015 223 859 0 - 1.081 298 -
2016 187 856 0 - 1.043 298 -
Average
2011-2015 291 866 0 - 1157 314 -
2006-2015 351 966 0 - 1317 375 -
1. All Iceland has been included in Northern countries 2. Since 1991, fishing carried out at the Faroes has only been for research purposes. 3. No unreported catch estimate available for Russia since 2008. 4. Estimates refer to season ending in given year.
NASCO 2.2 Review and report on the development of age-specific stock conservation limits including updating
the time-series of the number of river stocks with established CLs by jurisdiction River-specific conservation limits (CLs) have been previously derived for salmon stocks in most countries in the NEAC area (France, Ireland, UK (England and Wales), UK (N. Ireland), Finland, Norway, and Sweden). Preliminary results are also available for a small number of rivers in Russia. In UK (Scotland) stocks are assessed against CLs at the scale of individual rivers or groups of small rivers. Where sufficient numbers of CL estimates are available for individual rivers, these are summed to provide estimates at a country level. For countries that do not have sufficient river-specific CLs (Russia, UK (Scotland), and Iceland), an interim approach has been developed for estimating national CLs. This approach is based on the establishment of pseudo-stock–recruitment relationships for national salmon stocks. To provide catch options to NASCO, CLs are required for stock complexes. These have been derived either by summing individual river CLs to national level, or by taking overall national CLs as provided by the national model, and then summing to the level of the four NEAC stock complexes. The CLs have also been used to estimate the spawner escapement reserves (SERs), which are the CLs (expressed in terms of spawner numbers) increased to take account of natural mortality (M = 0.03 per month) between 1 January of the first winter at sea and the return time to homewaters for each of the maturing (6–9 months) and non-maturing (16–21 months) 1SW salmon components from the Northern NEAC and Southern NEAC stock complexes.
ICES Advice on fishing opportunities, catch, and effort Published 5 May 2017
ICES Advice 2017, Book 14 6
Table 3 Conservation limits (CL) and spawner escapement reserves (SER) for the salmon stock complexes in the NEAC area.
Stock complex Sea age group CL (number) SER (number)
Northern NEAC 1SW 145 590 184 055
MSW 121 075 206 742
Southern NEAC 1SW 577 107 731 946
MSW 269 153 456 480
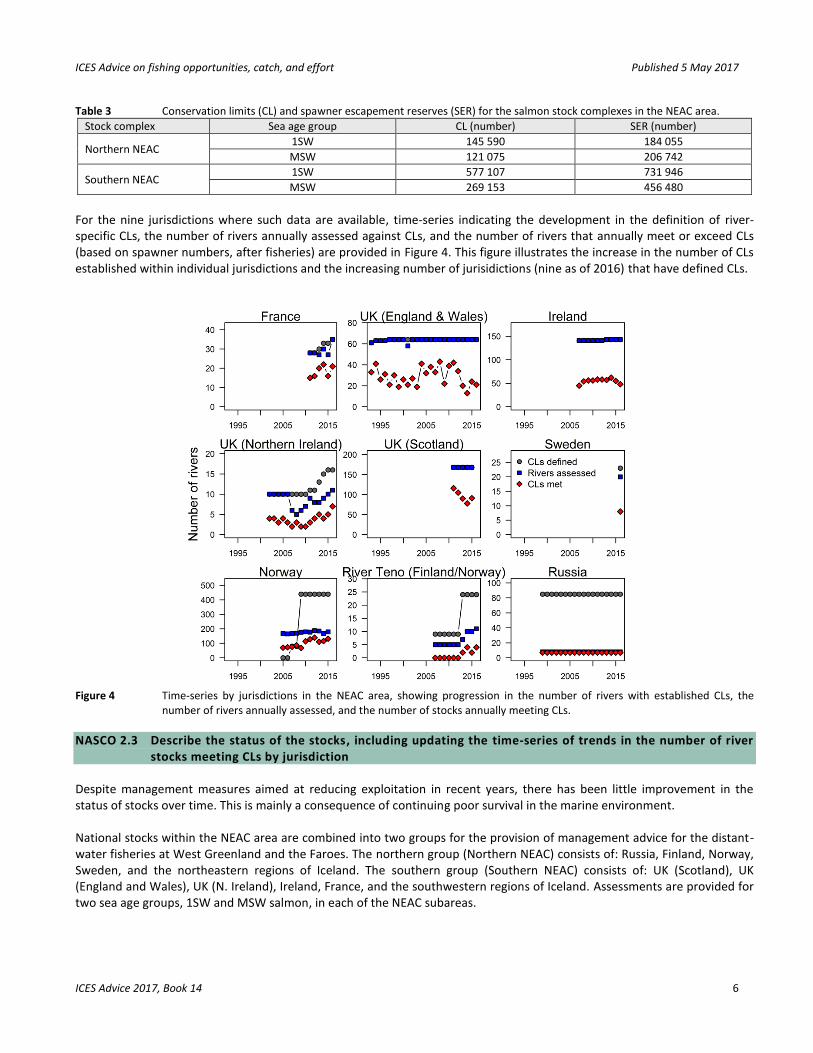
For the nine jurisdictions where such data are available, time-series indicating the development in the definition of river-specific CLs, the number of rivers annually assessed against CLs, and the number of rivers that annually meet or exceed CLs (based on spawner numbers, after fisheries) are provided in Figure 4. This figure illustrates the increase in the number of CLs established within individual jurisdictions and the increasing number of jurisidictions (nine as of 2016) that have defined CLs.
Figure 4 Time-series by jurisdictions in the NEAC area, showing progression in the number of rivers with established CLs, the
number of rivers annually assessed, and the number of stocks annually meeting CLs.
NASCO 2.3 Describe the status of the stocks, including updating the time-series of trends in the number of river stocks meeting CLs by jurisdiction
Despite management measures aimed at reducing exploitation in recent years, there has been little improvement in the status of stocks over time. This is mainly a consequence of continuing poor survival in the marine environment. National stocks within the NEAC area are combined into two groups for the provision of management advice for the distant-water fisheries at West Greenland and the Faroes. The northern group (Northern NEAC) consists of: Russia, Finland, Norway, Sweden, and the northeastern regions of Iceland. The southern group (Southern NEAC) consists of: UK (Scotland), UK (England and Wales), UK (N. Ireland), Ireland, France, and the southwestern regions of Iceland. Assessments are provided for two sea age groups, 1SW and MSW salmon, in each of the NEAC subareas.
ICES Advice on fishing opportunities, catch, and effort Published 5 May 2017
ICES Advice 2017, Book 14 7
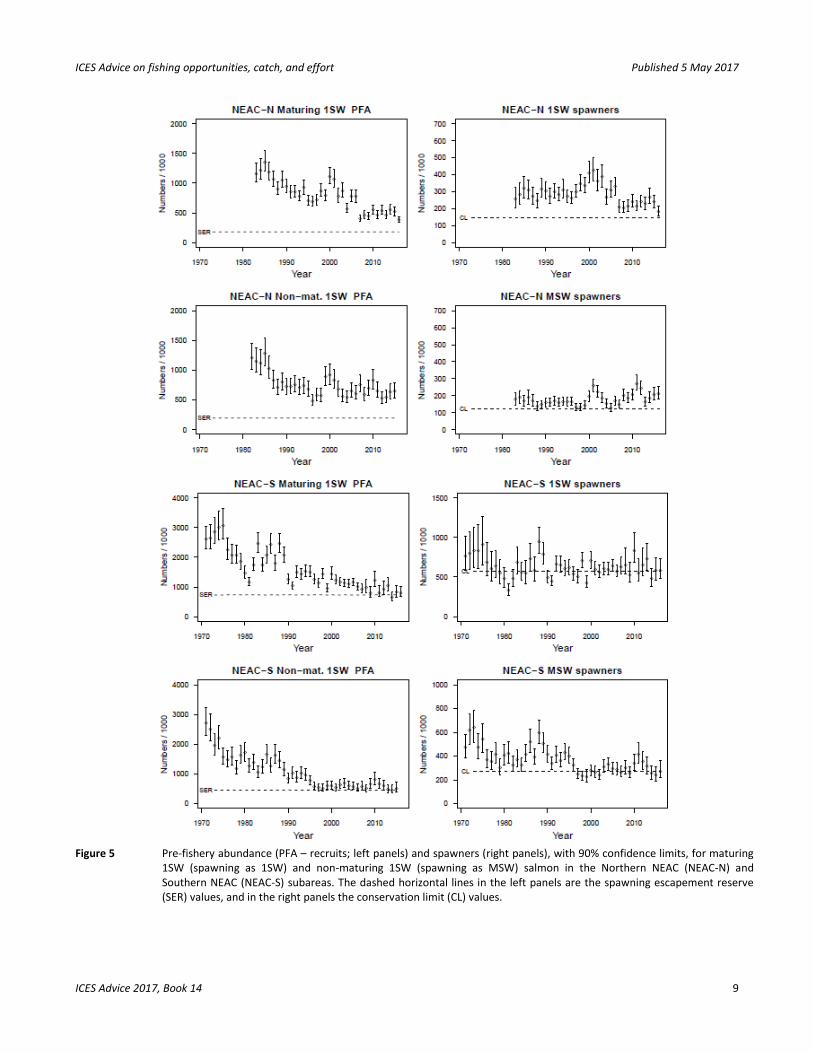
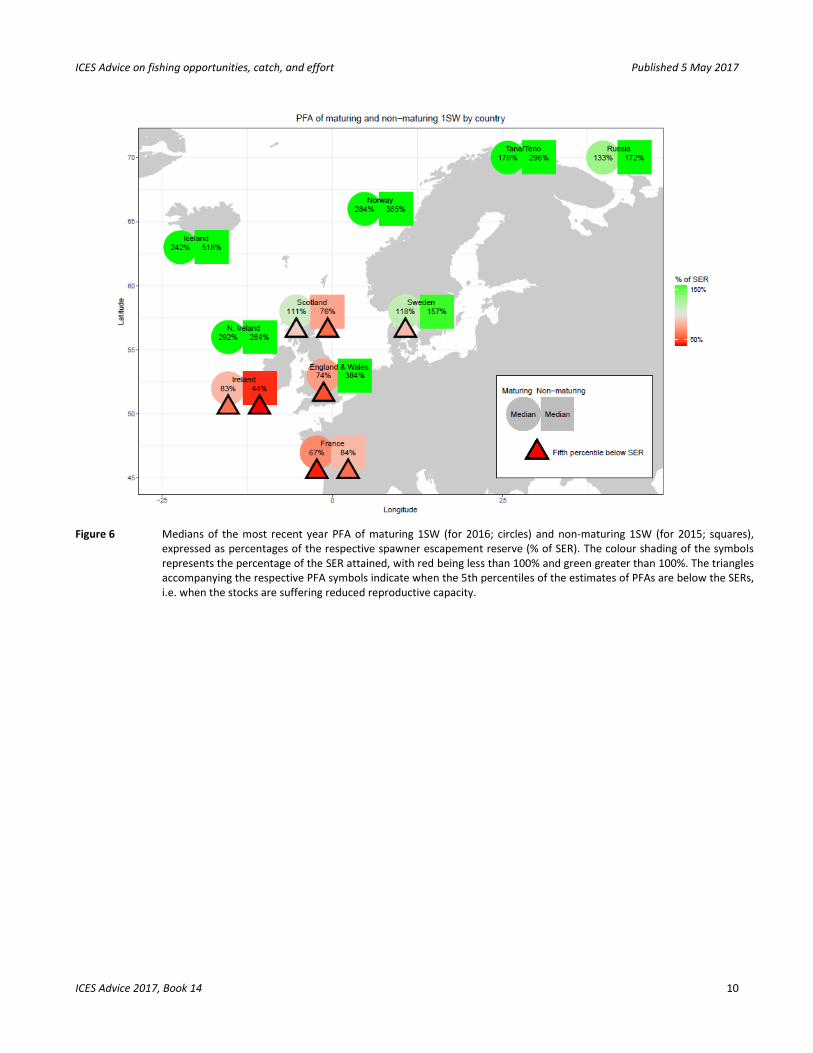
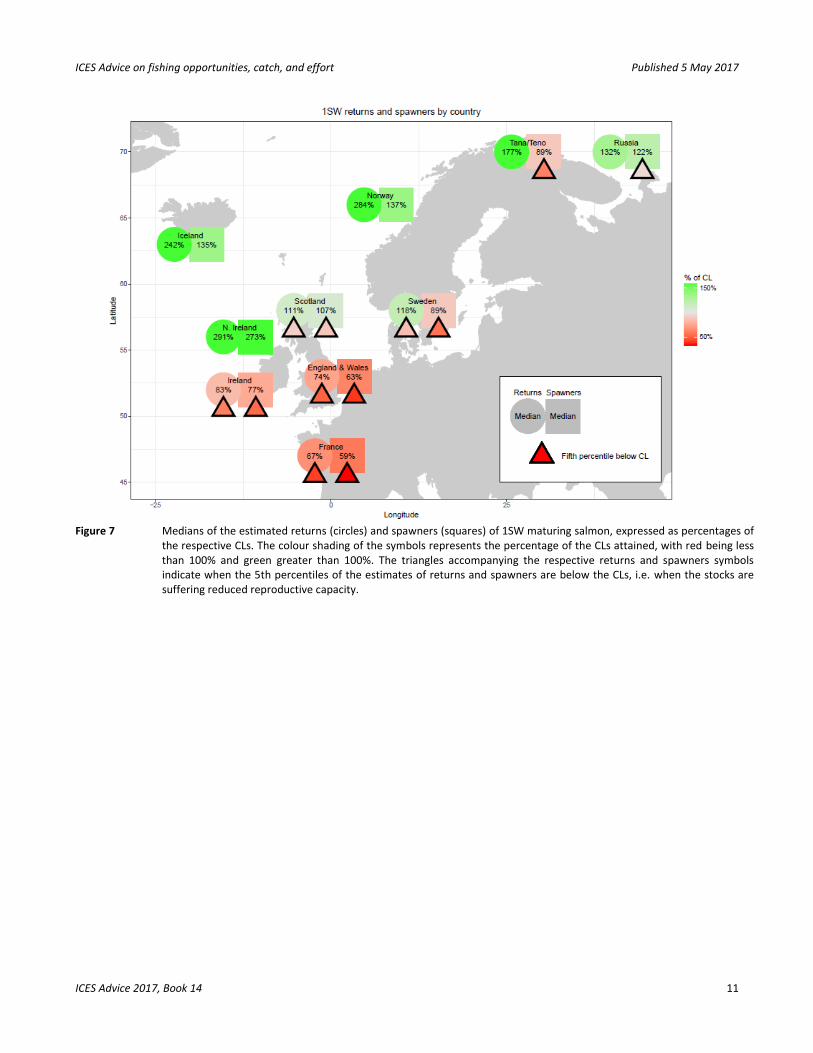
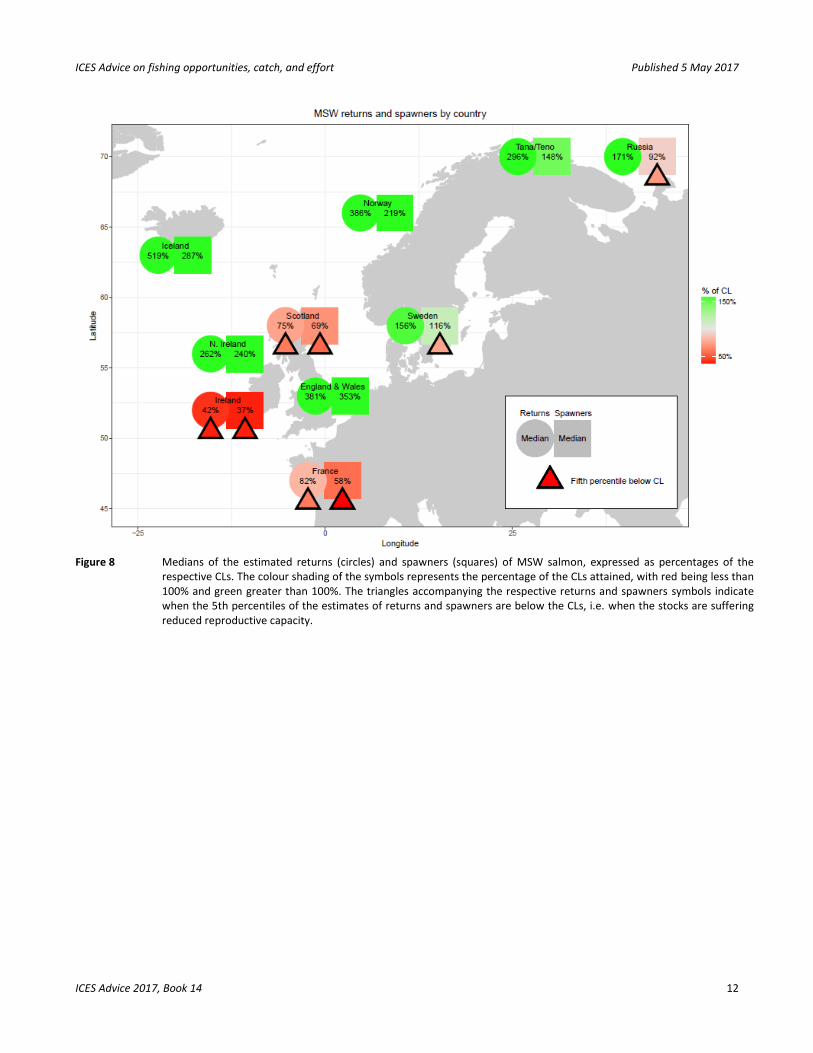
Recruitment, expressed as pre-fishery abundance (PFA) by sea age group (maturing 1SW and non-maturing 1SW (MSW) salmon) and at 1 January of the first winter at sea, is estimated by stock complex (Northern NEAC and Southern NEAC) and by individual country, and further interpreted relative to the spawner escapement reserve (SER) (Figures 5 and 6). The assessment of PFA against SER for the Northern NEAC and Southern NEAC complexes over the time-series is shown in Figure 5. The assessment of PFA against SER by countries for the most recent year is shown in Figure 6. The time-series of returns and spawners against CLs are shown by sea age groups for the Northern NEAC and Southern NEAC complexes (Figure 5) and for 2016 by individual countries for 1SW maturing (Figure 7) and MSW salmon (Figure 8). These assessments show the same broad contrasts between Northern (including Iceland) and Southern NEAC stocks that are seen in the stock complex data. PFA relative to SER PFAs of both maturing 1SW and non-maturing 1SW salmon for Northern NEAC show a general decline over the time period (since 1983), with the decline being more marked in the maturing 1SW stock (Figure 5). Both sea age complexes have, however, been at full reproductive capacity prior to the commencement of distant-water fisheries (i.e. meeting the SER with at least 95% probability) throughout the time-series. In the most recent year, both maturing 1SW and non-maturing 1SW salmon in all countries were at full reproductive capacity, with the exception of Sweden for which the maturing 1SW sea age component was at risk of suffering reduced reproductive capacity (Figure 6). The PFAs of maturing and non-maturing 1SW salmon for Southern NEAC demonstrate broadly similar declining trends over the time period (since 1971; Figure 5). Both sea age complexes were at full reproductive capacity prior to the commencement of distant-water fisheries throughout the early part of the time-series. However, in approximately 50% of the years since the mid-1990s, the non-maturing 1SW stock has been at risk of suffering reduced reproductive capacity before any fisheries took place. The maturing 1SW stock, on the other hand, was only assessed as being at risk of suffering reduced reproductive capacity in 2009; in the majority of years since then this stock has been at risk of suffering, or suffering reduced reproductive capacity. With the exception of UK (N. Ireland), the maturing 1SW components in all countries in the most recent year are at risk of suffering (UK (Scotland)), or suffering reduced reproductive capacity (Figure 6). For the non-maturing 1SW salmon, the stocks in UK (Scotland), France, and Ireland are all at risk of suffering reduced reproductive capacity, whereas stocks in UK (England and Wales) and UK (N. Ireland) are assessed to be at full reproductive capacity (Figure 6). Spawners relative to CLs In terms of spawners in the Northern NEAC stock complex, 1SW spawners have been at full reproductive capacity (i.e. meeting the CL with at least 95% probability) throughout the time-series, albeit at reduced levels since 2007 (Figure 5). MSW spawners, on the other hand, while generally remaining at full reproductive capacity, have spent limited periods at risk of suffering reduced reproductive capacity, most recently in 2007 (Figure 5). Since 2000, MSW spawners have generally been above values in the early part of the time-series. In the most recent year, 1SW spawners were at risk of suffering (Russia), or suffering reduced reproductive capacity (Sweden, Teno/Finland) (Figure 7), whereas MSW stock complexes were at full reproductive capacity in all countries with the exception of Russia, in which stocks are suffering reduced reproductive capacity (Figure 8). In the Southern NEAC stock complex, declines in spawner numbers are evident for both 1SW and MSW salmon (Figure 5). The 1SW spawning stock has been at risk of suffering, or suffering reduced reproductive capacity for most of the time-series. In contrast, the MSW stock was at full reproductive capacity for most of the time-series until 1996. After this point, however, the MSW stock has been either at risk of suffering, or suffering reduced reproductive capacity in almost every year (Figure 5). In the most recent year, 1SW spawners have been suffering reduced reproductive capacity with the exception of stocks in UK (N. Ireland) (Figure 7). For MSW spawners, stocks in UK (England and Wales) and UK (N. Ireland) in the most recent year were at full reproductive capacity, whereas stocks in France, Ireland, and UK (Scotland) were suffering reduced reproductive capacity (Figure 8).
ICES Advice on fishing opportunities, catch, and effort Published 5 May 2017
ICES Advice 2017, Book 14 8
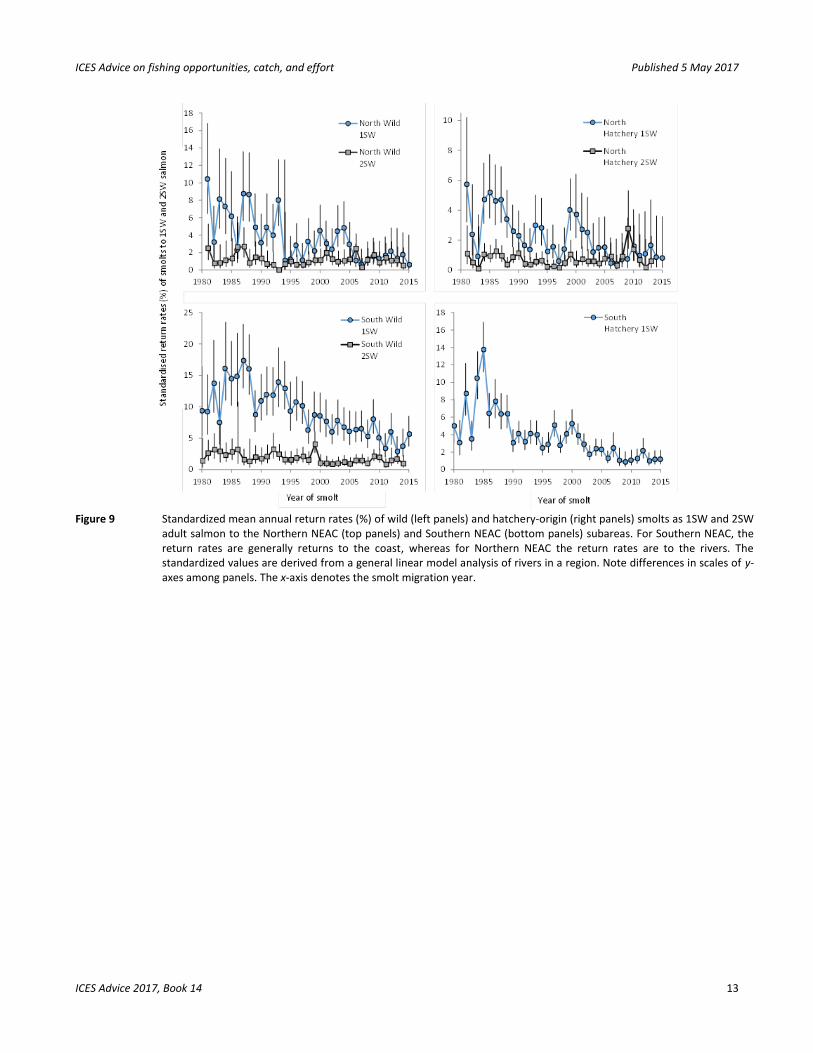
Trends in rivers meeting CLs In the NEAC area, nine jurisdictions currently assess salmon stocks using river-specific CLs (Figure 4). The attainment of CLs is assessed based on spawners, after fisheries. For River Teno (Finland/Norway), none of the assessed stocks met CLs prior to 2013; since 2014, between 20% and 40% of the assessed stocks met CLs. Norway has an overall increasing trend in CL attainment, increasing from 39% of the assessed stocks in 2009 to 74% in 2015. In Russia (Murmansk region), 88% of the assessed stocks have consistently met their CLs. In France, the percentage of stocks meeting CLs peaked in 2013 at 74%, declining to 60% in 2016. The mean percentage of stocks meeting CLs in Ireland was 34% over the time-series, with the highest attainment of 43% achieved in 2014 and with a progressive decline to 38% in 2015 and 34% in 2016. Since 1995, 46% of the rivers in UK (England and Wales) have met CLs, but with an evident downward trend from the 66% attained in 2011 to a low of 20% in 2014, showing the slightly higher values of 38% in 2015 and 33% in 2016. In UK (N. Ireland) a mean of 43% of the rivers have met their CLs over the presented time-series and an upward trend is evident from 2011, with 64% of the assessed stocks attaining CLs in 2016. UK (Scotland) established CLs for 168 individual rivers and groups of smaller neighbouring rivers in 2016. Retrospective assessment conducted up to 2011 indicated 57% mean attainment over the time-series. A progressive decline in meeting CLs was observed from 2011 (69%) to 2014 (46%), with a subsequent upturn to 54% evident in 2015. Return rates There has been an overall declining trend since 1980 in the return rates (marine survival) of both wild and hatchery-origin smolts to 1SW returns for both the Northern and Southern NEAC subareas (Figure 9). Results from these analyses are consistent with the information on estimated returns and spawners as derived from the PFA model, suggesting that returns are strongly influenced by factors in the marine environment. The declining trend is not evident for the 2SW wild components in either subarea, or for hatchery-origin smolts to 2SW in Northern NEAC (no data are available for hatchery-origin 2SW return rates for Southern NEAC).
ICES Advice on fishing opportunities, catch, and effort Published 5 May 2017
ICES Advice 2017, Book 14 9
Figure 5 Pre-fishery abundance (PFA – recruits; left panels) and spawners (right panels), with 90% confidence limits, for maturing
1SW (spawning as 1SW) and non-maturing 1SW (spawning as MSW) salmon in the Northern NEAC (NEAC-N) and Southern NEAC (NEAC-S) subareas. The dashed horizontal lines in the left panels are the spawning escapement reserve (SER) values, and in the right panels the conservation limit (CL) values.
ICES Advice on fishing opportunities, catch, and effort Published 5 May 2017
ICES Advice 2017, Book 14 10
Figure 6 Medians of the most recent year PFA of maturing 1SW (for 2016; circles) and non-maturing 1SW (for 2015; squares),
expressed as percentages of the respective spawner escapement reserve (% of SER). The colour shading of the symbols represents the percentage of the SER attained, with red being less than 100% and green greater than 100%. The triangles accompanying the respective PFA symbols indicate when the 5th percentiles of the estimates of PFAs are below the SERs, i.e. when the stocks are suffering reduced reproductive capacity.
ICES Advice on fishing opportunities, catch, and effort Published 5 May 2017
ICES Advice 2017, Book 14 11
Figure 7 Medians of the estimated returns (circles) and spawners (squares) of 1SW maturing salmon, expressed as percentages of
the respective CLs. The colour shading of the symbols represents the percentage of the CLs attained, with red being less than 100% and green greater than 100%. The triangles accompanying the respective returns and spawners symbols indicate when the 5th percentiles of the estimates of returns and spawners are below the CLs, i.e. when the stocks are suffering reduced reproductive capacity.
ICES Advice on fishing opportunities, catch, and effort Published 5 May 2017
ICES Advice 2017, Book 14 12
Figure 8 Medians of the estimated returns (circles) and spawners (squares) of MSW salmon, expressed as percentages of the
respective CLs. The colour shading of the symbols represents the percentage of the CLs attained, with red being less than 100% and green greater than 100%. The triangles accompanying the respective returns and spawners symbols indicate when the 5th percentiles of the estimates of returns and spawners are below the CLs, i.e. when the stocks are suffering reduced reproductive capacity.
ICES Advice on fishing opportunities, catch, and effort Published 5 May 2017
ICES Advice 2017, Book 14 13
Figure 9 Standardized mean annual return rates (%) of wild (left panels) and hatchery-origin (right panels) smolts as 1SW and 2SW
adult salmon to the Northern NEAC (top panels) and Southern NEAC (bottom panels) subareas. For Southern NEAC, the return rates are generally returns to the coast, whereas for Northern NEAC the return rates are to the rivers. The standardized values are derived from a general linear model analysis of rivers in a region. Note differences in scales of y-axes among panels. The x-axis denotes the smolt migration year.
ICES Advice on fishing opportunities, catch, and effort Published 5 May 2017
ICES Advice 2017, Book 14 14
NASCO 2.4 Provide information on the size, distribution and timing of the blue whiting fishery in the North East Atlantic area and any official observer information relating to bycatch which may indicate possible impact of this fishery on wild salmon
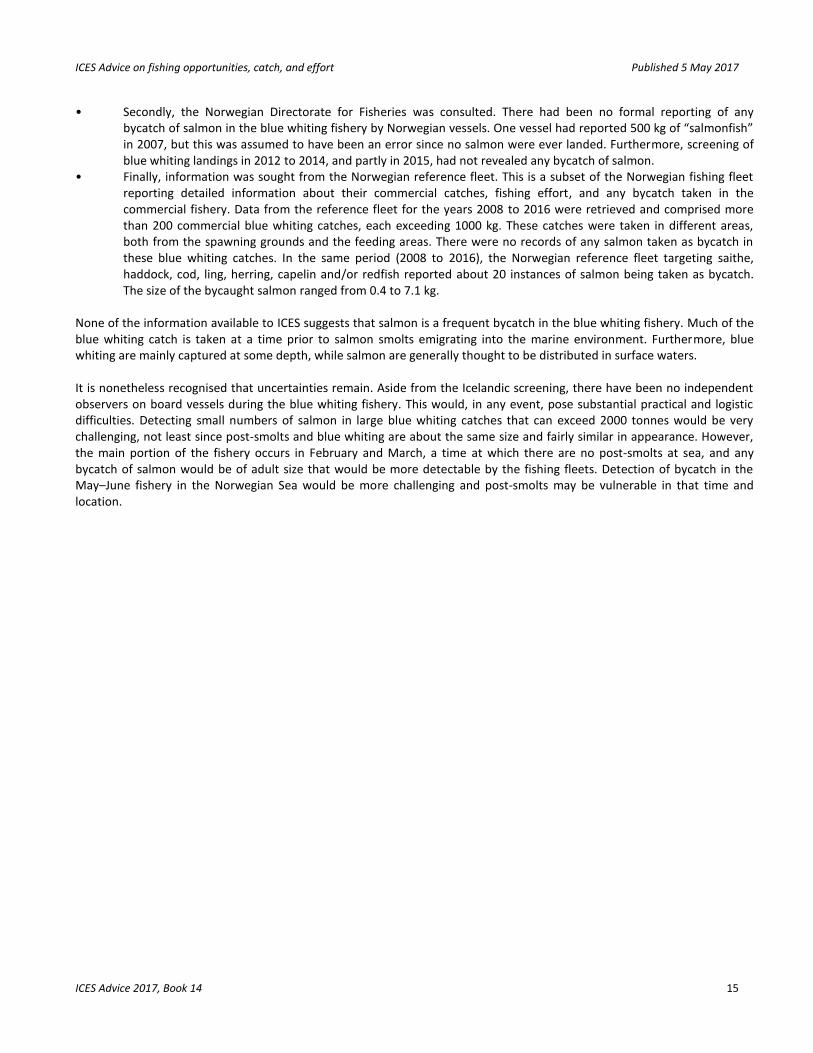
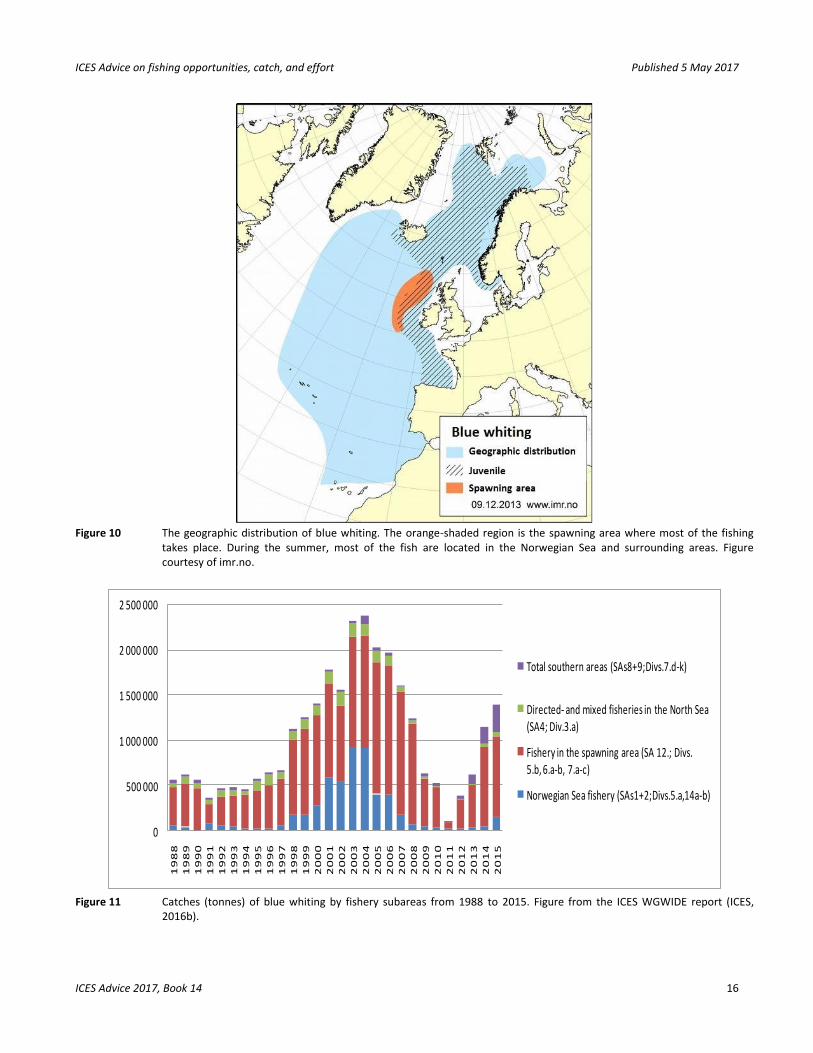
Background information – the blue whiting fishery Blue whiting (Micromesistius poutassou) is a small pelagic fish which spawns west of the British Isles in February and March. After spawning the fish disperse to feeding areas that cover a large part of the northeast Atlantic, but with most fish concentrated in the Norwegian Sea and the surrounding areas (Figure 10). The main fishery targeting this species occurs when the fish aggregate at the spawning grounds. The fishery starts in January southeast of the Faroes Islands, targeting fish migrating southwards towards the spawning areas. In February and March, the fishery moves to the west of Ireland and in April is located to the north and west of UK (Scotland). There is, however, some interannual variation in the areas fished depending on the geographic distribution of spawning fish. Nonetheless, the fishery on spawning blue whiting occurs prior to smolt migration from rivers and migration to the northeast Atlantic feeding areas. The vessels used in the blue whiting fishery are ocean-going trawlers capable of operating large pelagic trawls. The fleet concentrates fishing effort on large aggregations of fish, which are often found close to the continental slope and typically at depths of 250 to 600 m. The trawl is set around 3 nautical miles from the aggregations of fish to allow time for the trawl to be positioned at the correct depth before the gear reaches the fish. A single catch can be as much as 800 tonnes and each vessel can store around 2000 tonnes or more before returning to harbour to deliver the catch. Most of the blue whiting are used for fishmeal production, but occasionally some fish go for human consumption. Annual landings have fluctuated in recent decades. This mainly reflects natural fluctuations in stock biomass owing to variable levels of recruitment success. The largest landings were recorded in 2003 and 2004, with annual catches of more than 2 million tonnes (Figure 11). In 2015, total landings were close to 1.4 million tonnes. In years when coastal states have not agreed on a management plan, access to the spawning grounds has been restricted for vessels not belonging to the EU. A spring and summer fishery operated in these years, targeting blue whiting feeding in the Norwegian Sea. When this takes place, the fishery on feeding fish is similar to the one on the spawning grounds, deploying vessels with large pelagic trawls. However, during the feeding period the fish are more widely distributed and do not occur in the dense aggregations seen at the spawning grounds. This results in lower CPUE and longer trawling times. The fish are also higher in the water column during feeding, but nets are still typically fished at depths of 50 to 400 m. Information about the potential bycatch of salmon in the blue whiting fishery ICES Secretariat posed a query about potential bycatch of salmon to relevant ICES expert group members from the main countries participating in the blue whiting fishery (Norway, Netherlands, Germany, and the Faroe Islands). None of these representatives knew of any reports of bycatch of salmon in the fishery or had any data that might indicate that such bycatch had taken place. ICES was informed about screening programmes for blue whiting in the Icelandic EEZ. The catch of blue whiting in 2016 was 5905 t. Observers examined a portion of this catch as it was landed to check for bycatch. For each catch above 100 tonnes, five random samples were taken, with each sample weighing approximately 100 kg. In 2016, no Atlantic salmon were detected from these samples. In 2015, 5 kg of Atlantic salmon were recorded as bycatch. A number of additional investigations were conducted in Norway to gather information about the potential bycatch of salmon in the blue whiting fishery: • Fishers who collaborate with the Institute of Marine Research in Norway were contacted for their views. These
fishers responded that they had experienced some bycatch of salmon in the commercial fishery for mackerel and herring, but not in the fishery for blue whiting.
ICES Advice on fishing opportunities, catch, and effort Published 5 May 2017
ICES Advice 2017, Book 14 15
• Secondly, the Norwegian Directorate for Fisheries was consulted. There had been no formal reporting of any bycatch of salmon in the blue whiting fishery by Norwegian vessels. One vessel had reported 500 kg of “salmonfish” in 2007, but this was assumed to have been an error since no salmon were ever landed. Furthermore, screening of blue whiting landings in 2012 to 2014, and partly in 2015, had not revealed any bycatch of salmon.
• Finally, information was sought from the Norwegian reference fleet. This is a subset of the Norwegian fishing fleet reporting detailed information about their commercial catches, fishing effort, and any bycatch taken in the commercial fishery. Data from the reference fleet for the years 2008 to 2016 were retrieved and comprised more than 200 commercial blue whiting catches, each exceeding 1000 kg. These catches were taken in different areas, both from the spawning grounds and the feeding areas. There were no records of any salmon taken as bycatch in these blue whiting catches. In the same period (2008 to 2016), the Norwegian reference fleet targeting saithe, haddock, cod, ling, herring, capelin and/or redfish reported about 20 instances of salmon being taken as bycatch. The size of the bycaught salmon ranged from 0.4 to 7.1 kg.
None of the information available to ICES suggests that salmon is a frequent bycatch in the blue whiting fishery. Much of the blue whiting catch is taken at a time prior to salmon smolts emigrating into the marine environment. Furthermore, blue whiting are mainly captured at some depth, while salmon are generally thought to be distributed in surface waters. It is nonetheless recognised that uncertainties remain. Aside from the Icelandic screening, there have been no independent observers on board vessels during the blue whiting fishery. This would, in any event, pose substantial practical and logistic difficulties. Detecting small numbers of salmon in large blue whiting catches that can exceed 2000 tonnes would be very challenging, not least since post-smolts and blue whiting are about the same size and fairly similar in appearance. However, the main portion of the fishery occurs in February and March, a time at which there are no post-smolts at sea, and any bycatch of salmon would be of adult size that would be more detectable by the fishing fleets. Detection of bycatch in the May–June fishery in the Norwegian Sea would be more challenging and post-smolts may be vulnerable in that time and location.
ICES Advice on fishing opportunities, catch, and effort Published 5 May 2017
ICES Advice 2017, Book 14 16
Figure 10 The geographic distribution of blue whiting. The orange-shaded region is the spawning area where most of the fishing
takes place. During the summer, most of the fish are located in the Norwegian Sea and surrounding areas. Figure courtesy of imr.no.
0
500 000
1 000 000
1 500 000
2 000 000
2 500 000
19
88
19
89
19
90
19
91
19
92
19
93
19
94
19
95
19
96
19
97
19
98
19
99
20
00
20
01
20
02
20
03
20
04
20
05
20
06
20
07
20
08
20
09
20
10
20
11
20
12
20
13
20
14
20
15
Total southern areas (SAs8+9;Divs.7.d-k)
Directed- and mixed fisheries in the North Sea (SA4; Div.3.a)
Fishery in the spawning area (SA 12.; Divs. 5.b, 6.a-b, 7.a-c)
Norwegian Sea fishery (SAs1+2;Divs.5.a,14a-b)
Figure 11 Catches (tonnes) of blue whiting by fishery subareas from 1988 to 2015. Figure from the ICES WGWIDE report (ICES,
2016b).

ICES Advice on fishing opportunities, catch, and effort Published 5 May 2017
ICES Advice 2017, Book 14 17
NASCO 2.5 Identify relevant data deficiencies, monitoring needs, and research requirements The following data deficiencies, monitoring needs, and research requirements of relevance to the Northeast Atlantic Commission were identified:
1) The continuation and expansion of tracking programmes would be useful in the assessment of marine mortality on North Atlantic salmon stocks. These techniques have been proposed and are being implemented, both in the Northwest and the Northeast Atlantic (e.g. SALSEA Track), in line with the NASCO International Atlantic Salmon Research Board resolution (International Atlantic Salmon Research Board, 2014).
2) In order to fully consider a life cycle model as an improvement and alternative to the current assessment and forecast model used for providing catch advice, improvements to data inputs and the incorporation of a number of alternative life history dynamics need to occur well ahead of the 2018 ICES meeting. A workshop of jurisdictional experts should be convened to review current national input data in the light of reductions in fisheries, to incorporate improved data inputs and alternate population dynamic functions, to enable the running of the inference and forecast components, and to develop documentation related to the model.
References Gilbey, J., Cauwelier, E., Coulson, M. W., Stradmeyer, L., Sampayo, J. N., Armstrong, A., et al. 2016. Accuracy of assignment of Atlantic salmon (Salmo salar L.) to rivers and regions in Scotland and Northeast England based on single nucleotide polymorphism (SNP) markers. PLoS ONE, 11(10): e0164327. doi:10.1371/journal.pone.0164327.
ICES. 2015. Report of the Working Group on North Atlantic Salmon (WGNAS), 17–26 March 2015, Moncton, Canada. ICES CM 2015/ACOM:09. 461 pp.
ICES. 2016a. Report of the Working Group on North Atlantic Salmon (WGNAS), 30 March–8 April 2016, Copenhagen, Denmark. ICES CM 2016/ACOM:10. 323 pp.
ICES. 2016b. Report of the Working Group on Widely Distributed Stocks (WGWIDE). 31 August–6 September 2016, Copenhagen, Denmark. ICES CM 2016/ACOM:16. 604 pp.
ICES. 2016c. Advice basis. In Report of the ICES Advisory Committee, 2016. ICES Advice 2016, Book 1, Section 1.2.
ICES. 2017a. Report of the Working Group on North Atlantic Salmon (WGNAS), 29 March–7 April 2017, Copenhagen, Denmark. ICES CM 2017/ACOM:20. 294 pp.
ICES. 2017b. Atlantic salmon at West Greenland. In Report of the ICES Advisory Committee, 2017. ICES Advice 2017, sal.2127.wgc.
International Atlantic Salmon Research Board. 2014. Resolution of the International Atlantic Salmon Research Board (IASRB) on Research on Salmon at Sea. ICR(14)10. http://www.nasco.int/sas/pdf/archive/papers/2014/ICR_14_10.pdf.
NASCO. 2015. Decision regarding the salmon fishery in Faroese waters in 2015/16, 2016/17 and 2017/18. NEA(15)10. http://www.nasco.int/pdf/2015%20papers/NEA_15_10.pdf.
Svenning, M. A., Falkegård, M., Fauchald, P., Yoccoz, N., Niemelä, E., Vähä, J. P., et al. 2014. Region and stock specific catch and migration models of Barents Sea salmon. Project report Kolarctic ENPI CBC – Kolarctic Salmon project (KO197). 95 pp.
ICES Advice on fishing opportunities, catch, and effort Published 5 May 2017
ICES Advice 2017, Book 14 18
Annex 1 Glossary of acronyms and abbreviations 1SW (one-sea-winter). Maiden adult salmon that has spent one winter at sea. 2SW (two-sea-winter). Maiden adult salmon that has spent two winters at sea. CL (or CLs), i.e. Slim (conservation limit). Demarcation of undesirable stock levels or levels of fishing activity; the ultimate objective when managing stocks and regulating fisheries will be to ensure that there is a high probability that undesirable levels are avoided. FWI (Framework of Indicators). The FWI is a tool used to indicate if any significant change in the status of stocks used to inform the previously provided multi-annual management advice has occurred. ICES (International Council for the Exploration of the Sea). MSY (maximum sustainable yield). The largest average annual catch that may be taken from a stock continuously without affecting the catch of future years; a constant long-term MSY is not a reality in most fisheries, where stock sizes vary with the strength of year classes moving through the fishery. MSW (multi-sea-winter). A MSW salmon is an adult salmon which has spent two or more winters at sea and may be a repeat spawner. NASCO (North Atlantic Salmon Conservation Organization). NEAC (North-East Atlantic Commission). The commission within NASCO with responsibility for Atlantic salmon in the Northeast Atlantic. PFA (pre-fishery abundance). The numbers of salmon estimated to be alive in the ocean from a particular stock at a specified time. SER (spawning escapement reserve). The CL increased to take account of natural mortality between the recruitment date (assumed to be 1st January) and the date of return to home waters. TAC (total allowable catch). TAC is the quantity of fish that can be taken from each stock each year. UK (United Kingdom of Great Britain and Northern Ireland).
ICES Advice on fishing opportunities, catch, and effort Published 5 May 2017
ICES Advice 2017, Book 14 19
Annex 2 General considerations Management plans The North Atlantic Salmon Conservation Organization (NASCO) has adopted an Action Plan for Application of the Precautionary Approach which stipulates that management measures should be aimed at maintaining all stocks above their conservation limits (CLs) by the use of management targets. CLs for North Atlantic salmon stock complexes have been defined by ICES as the level of a stock (number of spawners) that will achieve long-term average maximum sustainable yield (MSY). NASCO has adopted the region-specific CLs as limit reference points (Slim); having populations fall below these limits should be avoided with high probability. Advice for the Faroes fishery (which takes both 1SW and MSW salmon) is currently based upon all NEAC area stocks, although NASCO has asked ICES to advise on options for taking account of recent genetic analyses which suggest there was a significant contribution of North American stocks to the historical mixed-stock fisheries in Faroese waters. The advice for the West Greenland fishery (ICES, 2017b) is based upon the Southern NEAC non-maturing 1SW stock and the non-maturing 1SW salmon from North America. A 75% risk level (probability) of achieving the management objectives simultaneously in the six North American regions and Southern NEAC has been agreed by NASCO for the provision of catch advice at West Greenland. No specific risk level has so far been agreed by NASCO for the provision of catch advice for the Faroes fishery; in the absence of this, ICES uses a 95% probability of meeting individual conservation limits, which can be applied at the level of the European stock complexes (two areas and two age classes) and the NEAC countries (ten countries and two age classes). A framework of indicators has been developed in support of the multi-annual catch options. Biology Atlantic salmon (Salmo salar) is an anadromous species found in rivers of countries bordering the North Atlantic. In the Northeast Atlantic area, their current distribution extends from northern Portugal to the Pechora River in Northwest Russia and Iceland. Juveniles emigrate to the ocean at ages of one to eight years (dependent on latitude) and generally return after one or two years at sea. Long-distance migrations to ocean feeding grounds are known to take place, with adult salmon from the Northeast Atlantic stocks being exploited at both West Greenland and the Faroes. Environmental influence on the stock Environmental conditions in both freshwater and marine environments have a marked effect on the status of salmon stocks. Across the North Atlantic, a range of problems in the freshwater environment play a significant role in explaining the poor status of stocks. In many cases, river damming and habitat deterioration have had a devastating effect on freshwater environmental conditions. In the marine environment, return rates of adult salmon have declined through the 1980s and, for some stocks, are now at their lowest levels in the time-series, even after closure of marine fisheries. Climatic factors modifying ecosystem conditions and the impact of predators of salmon at sea are considered to be the main contributory factors to lower productivity, which is expressed almost entirely in terms of lower marine survival. Effects of the fisheries on the ecosystem Salmon fisheries have no, or only minor, influence on the marine ecosystem. The exploitation of salmon in freshwater may affect the riverine ecosystem through changes in species composition. There is limited knowledge of the magnitude of these effects. Quality considerations Uncertainties in input variables to the stock status are incorporated in the assessment. Provisional catch data for 2015 were updated, where appropriate, and the assessment extended to include data for 2016.
ICES Advice on fishing opportunities, catch, and effort Published 5 May 2017
ICES Advice 2017, Book 14 20
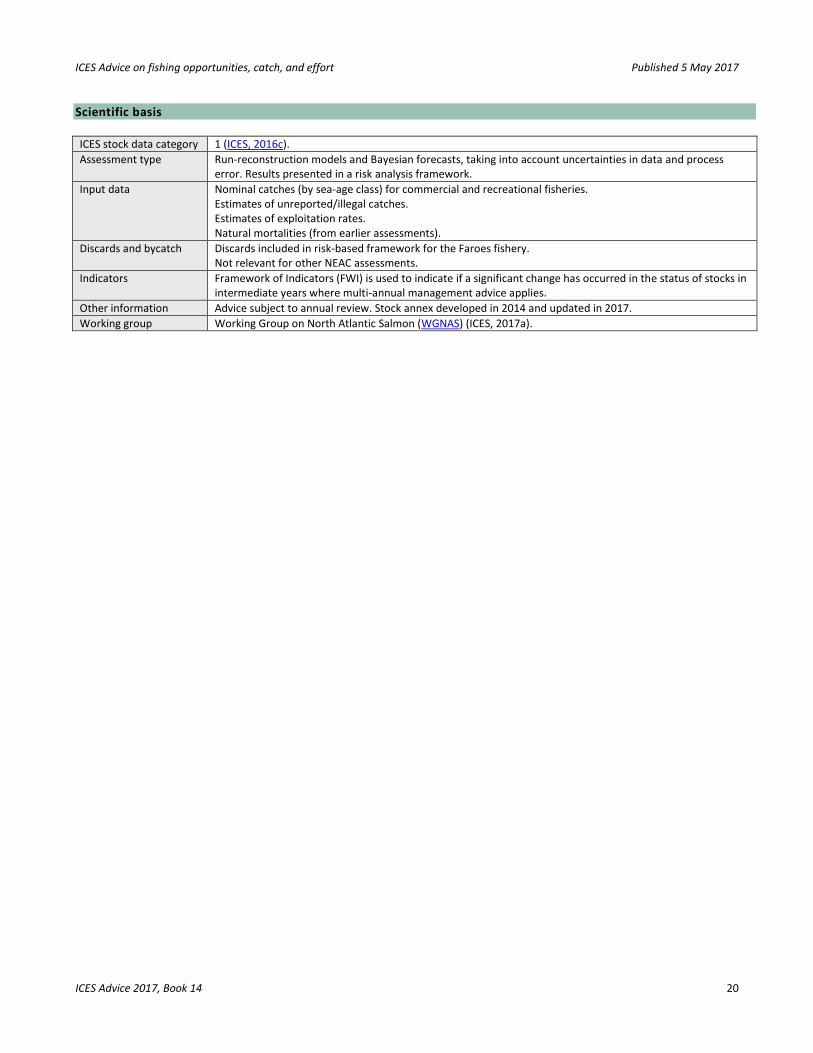
Scientific basis ICES stock data category 1 (ICES, 2016c).
Assessment type Run-reconstruction models and Bayesian forecasts, taking into account uncertainties in data and process error. Results presented in a risk analysis framework.
Input data Nominal catches (by sea-age class) for commercial and recreational fisheries. Estimates of unreported/illegal catches. Estimates of exploitation rates. Natural mortalities (from earlier assessments).
Discards and bycatch Discards included in risk-based framework for the Faroes fishery. Not relevant for other NEAC assessments.
Indicators Framework of Indicators (FWI) is used to indicate if a significant change has occurred in the status of stocks in intermediate years where multi-annual management advice applies.
Other information Advice subject to annual review. Stock annex developed in 2014 and updated in 2017.
Working group Working Group on North Atlantic Salmon (WGNAS) (ICES, 2017a).