Embed Size (px)
Citation preview
Seton Hall UniversityeRepository Seton HallSeton Hall University Dissertations and Theses(ETDs) Seton Hall University Dissertations and Theses
Summer 8-2011
Attenuated Total Reflection Infrared Spectroscopy(ATR-IR) as an In Situ Technique for DissolutionStudiesAbe S KassisSeton Hall University
Follow this and additional works at httpsscholarshipshuedudissertations
Part of the Biochemistry Commons
Recommended CitationKassis Abe S Attenuated Total Reflection Infrared Spectroscopy (ATR-IR) as an In Situ Technique for Dissolution Studies (2011)Seton Hall University Dissertations and Theses (ETDs) 1432httpsscholarshipshuedudissertations1432
Attenuated Total Reflection Infrared Spectroscopy (ATR-IR) as an In Situ Technique for Dissolution Studies
by
Abe S Kassis
PhD DISSERTATION
Submitted in partial fulfillment of the requirements for the degree of Doctor of Philosophy in
the Department of Chemistry and Biochemistry of Seton Hall University
Seton Hall University
Department of Chemistry and Biochemistry
400 South Orange Avenue
South Orange New Jersey 07079
August 2011
DISSERTATION COMMITTEE APPROVALS
We certify that we have read this thesis and that in our opinion it is sufficient in scientific
scope and quality as a dissertation for the degree of Doctor of Philosophy
APPROVED BY
Advisor Seton Hall University
Nicholas H Snow PhD
Member of Dissertation Committee Seton Hall University
Tarun ~el PhD
Member of Dissertation Committee Novartis Pharmaceuticals Corporation
QAbA lM~ en P KeIy PhD
Chair Department of Chemistry and Biochemistry Seton Hall University
[ii]
Although nature commences with reason and ends in experience it is necessary
for us to do the opposite that is to commence with experience and from this to
proceed to investigate the reason
-Leonardo da Vinci
[iii]
Abstract
Attenuated Total Reflection Infrared Spectroscopy (ATR-IR) as an in situ Technique for
Dissolution Studies
Dissolution studies are critical tests for measuring the performance or rate of release of a
drug product There are many variables that affect the dissolution rate of the drug Such
variables may include characteristics of the active pharmaceutical ingredient (API) (eg
particle size crystal form and bulk density) drug product composition (eg drug loading
and the identity type and levels of excipients) the drug product manufacturing process (eg
compreSSIon forces equipment) and the effects of stability storage conditions (eg
temperature humidity) Since dissolution has the ability to detect these variables the
regulatory agencies (ie FDA and EMEA) have placed great emphasis on the test Moreover
the regulatory agencies have increased the monitoring and auditing of the dissolution test
A novel technique using in situ attenuated total reflection-infrared spectroscopy (ATR-IR) to
monitor dissolutions of pharmaceutical drug products was developed The accuracy of this
technique is plusmn3 relative to HPLC Salicylic acid calibrator tablets were studied and two
over-the-counter (OTe) formulations containing acetaminophen andor acetylsalicylic acid
were tested during the research This novel approach was also used to analyze multiple
components in a single tablet For example dissolution of the individual components of
caffeine-free version of Excedrinreg tablets acetaminophen and acetylsalicylic acid were easily
distinguished
[iv]
Furthermore the system has the capability of monitoring the drug transformations during
dissolution For instance this technique was used to monitor the dissolution and hydrolysis of
aspirin to salicylic acid The ATR-IR system was found to have good sensitivity and can
analyze samples as low as 003 mgmL (2 x 10⁻⁴ M) based on the limit of detection (LOD)
studies This will be discussed in details in chapter four This technique allows deeper insight
into spectroscopy reaction analysis kinetics and dynamics of the dissolution of active
components in a pharmaceutical formulation
In addition this novel system was used to support research related to the BP oil spill that
occurred in the Gulf of Mexico during April 20th - June 3rd 2010 Specifically the system
was used to study dispersion of oil in the presence of dishwashing soaps as preliminary
models for commercial dispersants Dawnreg dishwashing soap was used because of its
powerful claim to clean wildlife affected by oil spills Dawnreg specifically uses anionic
surfactants such as alkyl dimethyl amine oxide to break down oil samples These surfactants
reduce the surface tension of water and can weaken the barrier that automatically forms
between oil and water allowing them to unnaturally mix
Furthermore in recognition of the potential of this technique to be widely used in the
pharmaceutical industry for drug dissolution studies an instrument was designed and the
design is presented as a chapter in this dissertation Overall this work has discovered and
validated the use of ATR-IR as a technique for monitoring to dissolution and
dissolutionhydrolysis reactions of pharmaceutical formulations It has excellent potential for
studies of the dissolution of tablets especially multi-component tablets and tablets with
ingredients that undergo subsequent hydrolysis
[v]
Acknowledgments
During my graduate career at Seton Hall University I have had the privilege and
opportunity to develop myself as a research scientist and strategic thinker This would not
have been possible without the support I received from my great employer Novartis
Pharmaceuticals Corporation for giving me the financial support and opportunity to obtain
my doctorate degree Moreover I would like to give special thanks to Cynthia Cetani Andre
Wyss Colleen Ruegger Steffen Lang Lynne Delisi and many others for their support and
mentorship Also I would like to give special thanks to my research advisor Dr John R
Sowa Jr for his valuable guidance expertise encouragement and his dear friendship Dr
Sowa inspires me to become a better scientist and individual
I would also like to acknowledge Dr Sowas research group as well as the faculty
members of the Department of Chemistry and Biochemistry at Seton Hall University
Specifically I would like to give special appreciation to Dr Snow for encouraging
motivating and supporting my research ambitions Dr Kazakevich for his great guidance and
teachings in HPLC Dr Kelty Dr Murphy Dr Fadeev and Dr Marzabadi I would also like
to acknowledge Dr Tarun Patel from the Novartis Pharmaceuticals Corporation for his
guidance and mentoring throughout my studies I will forever be indebted to those who have
supported me through the years in this endeavor It is with great appreciation that I offer my
gratitude to all
To my Dad and Mom Sam and Nina Kassis for opening the door to science and
motivating me to reach further in life To my dear sisters family and close friends
[vi]
Finally I want to thank my wife Cindy for her unwavering support Also I want to
thank my daughter Amber and my son Neil for their support and understanding Without them
none of this would have been possible
I would like to acknowledge Wes Walker and Jane Riley from Mettler-Toledo for
technical support for the iCIOIR Instrument
[vii]
2
Table of contents
Table of contents viii
List of figures xii
List of tables xviii
Introduction and Literature Overview 1
11 History 5
12 Infrared Spectroscopy 28
13 Literature background in situ ATR-IR and dissolution 32
Dissolution of salicylic acid acetylsalicylic acid and acetaminophen using In Situ
ATR-IR spectroscopy 35
21 Experimental section 38
211 Chemical and materials 38
212 Instrumentation 39
213 Buffered solutions 40
214 Dissolution experiments 40
215 HPLC analysis 41
216 ATR-IR analysis 42
22 Results and discussion 44
221 Single-component analysis 44
222 Dissolution results for salicylic acid using pH 74 phosphate buffer 47
[viii]
3
223 Multi-tablet analysis 50
224 Multi-component analysis 54
23 Chapter summary 60
Kinetics of drug hydrolysis of common over-the-counter (OTC) drugs via A TR-IR
spectroscopy 61
31 Background and history of Aspirin 62
32 Experimental section 64
321 Chemical and materials 64
322 Instrumentation 66
323 Buffered solutions 66
324 Hydrolysis Experiments 67
325 ATR-IR analysis 67
33 Results and discussion 71
331 Hydrolysis of aspirin to salicylic acid in test tubes 71
332 Hydrolysis of aspirin to salicylic acid using aspirin tablet as the
starting ingredient 74
333 Hydrolysis of aspirin to salicylic acid using aspirin powder as the
starting ingredient 77
334 Hydrolysis data comparison between tablet and powder
formulations 79
335 Kinetic rates observed during hydrolysis experimentation 84
[ix]
34 Chapter summary 87
4 Instrument Development Proposal Solv-IR as an In-Situ ATR-IR Instrument for
Solvation Chemistry 89
41 Background 89
42 Broader impacts from the proposed activities 92
43 Limit of detection (LOD) and limit of quantitation (LOQ) data 93
44 Instrument design 101
45 System components 104
451 Radiation source 104
452 Interferometer 104
453 Two Six-device Multiplexors 104
454 Six ATR Probes 104
455 Detector 105
456 Six Solvation Vessels 1 05
46 Instrument Control Acquisition Processing 109
47 Anticipated technical difficulties 109
48 Chapter summary 109
5 Analysis of the BP Gulf oil spill by Attenuated Total Reflection-Infrared
Spectroscopy and Dissolution 112
51 Research with React-IR 114
52 Experimental section 117
[x]
521 Chemical and materials 117
522 Instrumentation 121
523 Dispersant stock solution 123
524 Crude oil sample preparation 123
525 ATR-IR analysis 124
53 Results 124
531 Standards and expected absorption values 125
532 Venice oil samples dispersed using Joy soap 130
533 Venice oil samples dispersed using Dawnreg soap 133
534 Analysis by UV-Vis Spectroscopy 137
54 Chapter summary 142
6 Research conclusions 143
7 Appendix [A] In situ ATR-IR Spectroscopy and Dissolution Data 146
8 Appendix [B] Studying drug kinetics via ATR-IR Spectroscopy 163
9 Appendix [C] New Instrument Design (Solv-IR) attachments 167
10 Appendix [D] BP Gulf oil research attachments 168
[xi)
List of figures
Figure 1-1
Figure 1-2
Figure 1-3
Figure 1-4
Figure 1-5
Figure 1-6
Figure 1-7
Figure 1-9
Figure 2-1
Dissolution apparatus Noyes and Whitney (Ref 1) (Figure
reproduced from bottle figure in artic1e) 6
Dissolution process 13
Importance of sink conditions in dissolution dissolution of benzoic
acid at low concentrations Underwood and Cadwallader (Ref 8)
(Figure reproduced from figure-l in article) 16
Importance of sink conditions in dissolution dissolution of benzoic
acid at higher concentrations Underwood and Cadwallader (Ref 8)
(Figure reproduced from figure-3 in article) 17
Schematic illustration of Apparatus 1 and Apparatus 2
(Reproduced from USP General Chapter on Dissolution lt711raquo 22
USP Apparatus 1 Specifications (Reproduced from USP General
Chapter on Dissolution lt711raquo 24
USP Apparatus 2 specifications (Reproduced from USP General
Chapter on Dissolution lt711raquo 25
FT -IR system schematic (Ref 23) 31
Salicylic acid spectra at different concentrations in pH 74
phosphate buffered solution 45
[xii]
Figure 2-2
Figure 2-4
Figure 2-5
Figure 2-6
Figure 2-7
Figure 3-1
Figure 3-2
Figure 3-3
Figure 3-4
Figure 3-5
Figure 3-6
Figure 3-7
Figure 3-8
Comparison of in situ ATR-IR and HPLC methods for dissolution
Figure 2-3
of a salicylic acid tablet 48
Calibration curves of acetaminophen standards at pH 58 UVNis
absorbance at 296 nm and IR peak intensity at 1246 cmI 51
Simultaneous dissolution of acetaminophen and salicylic acid
tablets in situ ATRmiddotIR vs HPLC 53
ATRmiddotIR spectra of Excedrinreg caplets at different timemiddotpoints
during dissolution in pH 74 phosphate buffered solution 55
Dissolution of acetylsalicylic acid and acetaminophen in
Excedrinreg caplets in situ A TRmiddot IR VS HPLC 56
Compounds studiedof interest for future work 59
Structures of acety Isalicy lie acid (aspirin) 62
Synthesis of aspirinmiddotlate 1800s 63
Chemical structures studied 65
Ferric chloride color testmiddot control samples 72
Waterfall plot of aspirin tablet dissolution 75
Hydrolysis of Aspirin Tablets (325 mg) in pH 12 SGF Solution
(n=2) 76
Ferric chloride color test for salicylic acid (tablet dissolution) 76
Hydrolysis of acetylsalicylic acid powder to salicylic acid
hydrosylate in pH 12 solution 78
[xiii]
Figure 3-9
Figure 3-11
Figure 3-12
Figure 3-13
Figure 4-1
Figure 4-2
Figure 4-3
Figure 4-4
Figure 4-5
Figure 4-6
Figure 4-7
Figure 4-8
Figure 5-1
Figure 5-2
Release profile of Salicylic Acid (SA) during hydrolysis in SGF
Figure 3-10
(pHl2) powder vs tablet 81
Release profile of acetylsalicylic acid (aspirin) during hydrolysis
LODLOQ Sample Calculation Sheet- Flow Cell Probe Results-1 l00
Diagram of proposed Solv-IR Instrument l 03
Sketch of A TR crystal embedded in the side wall of the 1 L glass
vessel The area directly under the stir shaft is known to have poor
powder vs tablet 82
Release profile of acetylsalicylic acid (aspirin) and salicylic acid
hydrosylate during hydrolysis powder vs tablet 83
Typical calculation plot of rate from dissolution 86
Rate of dissolution for Aspirin (based on slope of dissolution plot) 86
Limit of detection of ATR-IR system 95
Fiber optic probes specifications (ref 56) 96
Calculated LOD and LOQ values 97
LODLOQ Sample Calculation Sheet- DiComp Probe Results-1 98
mixing and as indicated by the term dead zone 106
Top plate of constant rpm stirring assembly showing motor main
gear and minor gears which drive the stir shafts in each vessel 108
Photo of oil rig similar to Deepwater Horizon 113
Aerial view location of BP Gulf oil samples 118
[xiv]
Figure 5-3
Figure 5-5
Figure 5-6
Figure 5-7
Figure 5-8
Figure 5-9
Figure 5-10
Figure 5-11
Figure 5-12
Figure 5-13
Figure 5-14
Figure 5-15
Figure 5-16
Figure 7-1
Zoom view location of BP Gulf oil samples [Both samples were
Figure 5-4
collected near the UNO site] 119
Ocean depth diagram showing location of BP Gulf oil samples
(reproduced and modified from Ref71) 120
Instrument photo ATR-IR and dissolution apparatus 121
Gulf oil vs blank (ocean water) standard spectra 127
Baseline corrected ATR-IR scans ofBP oil and Ocean Water
samples 128
Photo of vessels at different time points during the dispersion
experiments 129
ATR-IR scans of Venice oil and 50 mL of Joy soap 131
ATR-IR scans of 50 mL of Joy soap only (Blank solution) 132
ATR-IR scans of Venice oil and 50 mL of Dawnreg soap 134
ATR-IR scans of 50 mL of Dawnreg soap only (Blank solution) 135
Visible spectra of chlorophyll a and b 139
Chemical structure of chlorophyll a ( Chern Draw) 140
Chemical structure of chlorophyll b (Chern Draw) 140
UVVis spectra ofBP oil samples in different solvents 1 mm cell
spectrophotometer fully covered from outside lighting 141
Linearity of salicylic acid in pH 74 phosphate buffer (corresponds
to Figure 2-1 in Chapter 2) 153
[xv]
Figure 7-2 Linear regression chart for saliyclic acid 154
Figure 7-3
Figure 7-4
Figure 7-5
Figure 7-6
Figure 7-7
Figure 7-8
Figure 7-9
Figure 7-10
Figure 7-11
Figure 8-1
Figure 8-2
Figure 8-3
Figure 9-1
Figure 10-1
Figure 10-2
Figure 10-3
Dissolution results for salicylic acid in pH 74 phosphate buffer
HPLC vs IR data (corresponds to Figure 2-2 in Chapter 2) 155
ATR-IR System photo 156
Mettler Toledo A TR-IRI Dissolution Systems 157
Flow Cell Fiber Optic Probe 158
K4 Fiber Optic Probe 159
HPLC analysis for Salicylic Acid calibrator tablets 160
HPLC Method Parameters Single Component and Multi
Component Experiments 161
Typical Excedrinreg experiment spectra 162
Excedrinreg HPLC Data 162
Salicylic Acid standard spectra 163
Acety lsalicy lic Acid standard spectra 164
Rate Order Formulas and Equations (Reproduced from Wikipedia
website on Rate Order) 166
ATR-IR Technique Diagram (courtesy of Jian Wang PhD
Mettler Toledo) 167
Detergents used during BP Gulf oil research 168
IR Spectra of Gulf Oil from Riser Pre- April 20 2010 169
Thermo Nicolet 4700 Transmittance of OIL samples 171
[xvi]
Figure 10-4 Thermo Nicolet 4700 Absorbance of OIL samples 172
[xvii]
List of tables
Table 1-1
Table 1-2
Table 2-1
Table 2-2
Table 2-3
Table 2-4
Table 2-5
Table 2-6
Table 2-7
Table 3-1
Table 3-2
Dissolution apparatus in the pharmaceutical industry 20
Absorption bands (Ref 21) (Reproduced from table of frequencies
found on CSU Website link) 29
Phosphate buffer preparations as per United States Pharmacopeia
(USP) 40
Method development summary for Salicylic Acid (Linearity and
Dissolution results) 46
Dissolved of salicylic acid Absolute dissolved difference
between ATR-IR and HPLC results 49
Dissolution of acetylsalicylic acid (aspirin) and acetaminophen in
Excedrinreg caplets ATR-IR raw data 57
Dissolution of acetylsalicylic acid (aspirin) and acetaminophen in
Excedrinreg caplets HPLC raw data 58
Dissolved of acetaminophen Difference between ATR-IR and
HPLC results 58
Dissolved acetylsalicylic acid (aspirin) analysis Difference
between A TR-IR and HPLC results 58
Hydrochloric acid buffer preparations as per United States
Pharmacopeia (USP) 67
Ferric chloride color test concentrations 73
[xviii]
Table 3-3
Table 3-4
Table 4-1
Table 5-1
Table 5-2
Table 5-3
Table 5-4
Table 5-5
Table 5-6
Table 8-1
Table 10-1
Ferric chloride color test observations [added 2mg Iml Fe (III)
solution] 73
Kinetic rates for hydrolysis of aspirin in acidic medium 85
LODLOQ Sample Calculation Sheet- DiComp Probe Result-2 99
Chemicals used in commercial dispersants (COREXIT 9500 and
9527) 116
Experimental details and sample information 122
Expected FT -IR stretching values for crude oil and sulfonated
soaps 126
Amount of Dawnreg in solution 136
Amount of BP oil in solution 136
Dispersant calculated 136
Aspirin FT -IR Frequencies of Interest 165
Amount of Dawnreg dishwashing detergent added 170
[xix]
Abbreviations
ATR
ATR-IR
API
ASA
BA
BE
Disso
EPA
FDA
GI
HCI
HPLC
HPMC
IR
LOD
LOQ
MDL
MCT
NSF
OTC
PEG
RPM
SA
SGF
TFA
USP
UV
Vis
Attenuated Total Reflection
Attenuated Total Reflection-Infrared Spectroscopy
Active Pharmaceutical Ingredient
Acetylsalicylic acid
B ioavailability
Bioequivalence
Dissolution
Environmental Protection Agency
Food and Drug Administration
Gastrointestinal
Hydrochloric Acid
High Performance Liquid Chromatography
Hydroxypropylmethylcellulose
Infrared Spectroscopy
Limit of Detection
Limit of Quantitation
Method Detection Limit
Mercury-Cadmium-Telluride
National Science Foundation
Over the Counter
Poly (ethylene glycol)
Revolutions per Minute
Salicylic acid
Simulated Gastric Fluid
Trifluoroacetic acid
United States Pharmacopeia
Ultra-Violet
Visible
[xx]
1
Seton Hall University
Introduction and Literature Overview
Dissolution is a critical test for measuring the performance of a pharmaceutical formulation
The overall performance of the drug pertains to the rate of release of the drug There are many
variables that affect the dissolution rate of the drug Recently the importance of the
dissolution test has increased substantially as indicated by the high level of regulations
imposed on the industry by the various health agencies around the world Dissolution testing
plays several important roles in the pharmaceutical industry First the test is a quality control
tool that measures change in composition of the formulation Some of the relevant changes
the dissolution test is able to detect include changes caused by temperature humidity and
photosensitivity Second the test is also important for formulation development During
development of a drug product the formulators use the dissolution test to distinguish between
different variations of the drug product Such variations may include characteristics of the
active pharmaceutical ingredient (API) (eg particle size crystal form and bulk density)
drug product composition (eg drug loading and the identity type and levels of excipients)
and the drug product manufacturing process (eg compression forces equipment) In the
pharmaceutical industry it is important to produce several variations of the drug product since
these are needed to access the drugs performance in clinical trials From the clinical trials
the efficacy of the variants are distinguished and obtained Third once in vivo (clinical trials)
data has been established for the drug product a correlation between in vivo (human blood
data)in vitro (lab dissolution results) is made using the dissolution studies
[1 ]
Seton Hall University
Dissolution as per the IUPAC is defined as the mixing of two phases with the formation of
one new homogeneous (Le the solution) phase and is pharmaceutically defined as the rate of
mass transfer from a solid surface into the dissolution medium or solvent under standardized
conditions of liquidsolid interface temperature and solvent composition 1 It is a dynamic
property that changes with time and explains the process by which a homogenous mixture of a
solid or a liquid can be obtained in a solvent It happens to chemically occur by the crystal
break down into individual ions atoms or molecules and their transport into the solvent2
Dissolution is controlled by the affinity between the solid substance and the solvent
Moreover the dissolution rate plays an important role in the understanding the chemistry of
solvation The dissolution rate is defined as the amount of drug substance that goes into
solution per unit time under standardized conditions of liquidsolid interface temperature and
solvent composition
In order for drug molecules to be transported into solution they must detach from the solid
surface and form solvated molecules This phenomenon is known as solvation Regardless of
whether a solid is crystalline or amorphous neighboring molecules are closely associated
with each other though intermolecular forces The dissolution process involves two main
steps the first step is the interaction between the solid and solvent molecules (solvation) The
second step is the mass transport of solvated molecules to the bulk solution Solubility
controls the first step while transport controls the second The first step of dissolution is
considered a physico-chemical reaction The solvation process is reversible and solubility is
I IUPAC Compendium of Chemical Terminology 2nd ed (the Gold Book) (1997) Online corrected version (2006-) dissolution 2 Dressman J J Kramer J K Eds Pharmaceutical Dissolution Testing Taylor and Francis Florida 2005
[2]
Seton Hall University
reached when the reaction reaches equilibrium The dissolution process can also be described
by the Gibbs free energy equation shown below
(Equation 1)
IG IH - TIS
This reaction involves the breaking and formation of new intermolecular interactions The net
entropy is usually positive in dissolution since dissolution favors disorder Moreover the net
enthalpy plays a crucial role in this equation Dissolution is usually determined by the net
enthalpy change If the net enthalpy is less than or equal to zero then the reaction will occur
until all solid particles are dissolved However if the net enthalpy is positive the reaction will
occur until equilibrium is reached In addition the reaction rates in dissolution could be
described kinetically by the following equations
(Equation 2)
V KdDrug][Solvent]
(Equation 3)
Where V is the reaction rate Ea is the activation energy R is a constant and T is temperature
The rate of dissolution is governed by the slower step of the twp step process mentioned
earlier Therefore at room temperature the rate of solvation is so fast that equilibrium is
[3]
Seton Hall University
typically instantaneous The mass transport step is usually much slower and becomes the rate
limiting step in the dissolution process 3
Next this chapter of the thesis will focus the describing the history of dissolution testing
which has led to many types of pharmaceutical dosage forms as well as different types of
apparatus systems Even though there is increased interest in this area the techniques used for
studying dissolution rates remain fairly constant In fact there are only a handful of
instruments used to analyze and understand the dissolution rates of drugs This chapter will
also discuss the current techniques used for dissolution testing
Last but not least a thorough literature search into the use of A TR-IR spectroscopy as a
dissolution technique was made and will be discussed in this chapter The research has found
that FTIR imaging and NIR spectroscopy have been used to study dissolution testing
Although FTIR imaging utilizes the same spectroscopic region as the proposed research it is
more of qualitative test than a quantitative one Furthermore NIR was used to study
dissolving reactions The major weakness of the NIR region is that the absorption bands
occurring there are the overtones of the fundamental bands residing in the mid-IR region As a
result they are relatively weak and not clearly delineated This makes quantitative
calculations complex and calibration procedures quite laborious and not transferable from one
instrument to another This research focuses on the mid-IR region The mid-IR spectral region
is where most of the fundamental structural information is produced Also because molecules
differ from each other by having different combinations of functional groups their mid-IR
spectra can be used to identify them and characterize their structure
3 Hanson R Gray V Handbook of Dissolution Testing 3rd ed Dissolution Technologies Delaware 2004 [4]
Seton Hall University
11 History
The earliest theories of the dissolution were based on physicochemical properties The earliest
reference to dissolution dates back to 1897 when Noyes and Whitney published an article
entitled The Rate of Solution of Solid Substances in Their Own Solution4 Noyes and
Whitney investigated the phenomenon of dissolution by using two slightly soluble substances
benzoic acid and lead chloride They developed a rotating bottle technique coupled with a
titration method to determine the dissolution rates of these two active drugs Refer to Figure
1-1 for a schematic diagram of the first dissolution apparatus
4 Noyes Arthur A Whitney Willis R The rate of solution of solid substances in their own solutions Journal of the American Chemical Society 189719(12)930-934
[5]
- - - - - -
Seton Hall University
Figure 1-1 Dissolution apparatus Noyes and Whitney (Ref 1) (Figure reproduced from bottle figure in article)
- - ~ - _ ~ - -- ~~~--~- shy~ ~ ~ ~
100 ml Distilled Water
Bottle
Cork Sticks Active Drug
BOTTLE INSERTED IN THERMOSTATED BATH
[6J
Seton Hall University
Noyes and Whitney determined that the velocity of the solution is proportional to the
difference between the concentration of the saturated solution and that of the solution present
at the moment in question They determined the following dissolution rate equation as shown
in the equation 4 below
(Equation 4) dx
C (5 - x)dt
where S represents the solubility of the substance (mgmL) x the concentration (usually mg
or mmol) at the expiration of the time t (seconds) and C is a constant Integration of the
equation above gives equation 5
(Equation 5) 1 5
C T loge (5 - x)
In order to obtain values for C in the equation the solubility or S of the substance must be
known In addition Noyes and Whitney found that the dissolution rate is controlled by a thin
layer of saturated solution that forms instantly around a solid particle Also the rate at which
a solid substance dissolves in its own solution is proportional to the difference between the
concentration of the solution and the concentration of the saturated solution
In 1904 Nemst and Brunner modified the Noyes-Whitney equation by applying Ficks law of
diffusion5 They were able to show a relationship between the dissolution rate constant and
5 Nemst W Brunner E Velocity of Reaction in Non-Homogeneous System Physical Chemistry 1904 47 56shy102
[7)
Seton Hall University
the diffusion coefficient Refer to equation 6 The equation for Ficks law of diffusion is
shown below
(Equation 6) DS
k - Vh
where D represents the diffusion coefficient (cm2s) S is surface area (cm2) of the diffusion
layer V the solution volume (mL) and h is the diffusion layer thickness (Jlm) By applying
Ficks law equation 7 was derived as shown below where k is the intrinsic dissolution rate
constant
(Eq uation 7)
dx (DS)- =k - (Cs-Ct)dt Vh
Based on the equations discussed earlier it is evident that certain properties of the drug are
important when determining dissolution These properties include the solubility physical
form media and pH of the media
In the 1950 s the emphasis shifted from studying the effects of physicochemical properties of
drugs on dissolution to correlation of dissolution to bioavailability (BA) of dosage forms Oral
bioavailability is a key pre-requisite for any orally administered drug to be systemically
effective The United States Food and Drug Administration (FDA) defines bioavailability
according to 21 CFR 320 (sect 3201) 6 as the rate and extent to which the active ingredient or
active moiety is absorbed from a drug product and becomes available at the site of action
For drug products that are not intended to be absorbed into the bloodstream bioavailability
6 Bioavailability and Bioequivalence Requirements Code of Federal Regulations Part 320 Title 21 2003 [8]
Seton Hall University
may be assessed by measurements intended to reflect the rate and extent to which the active
ingredient or active moiety becomes available at the site of action This definition focuses on
the processes by which the active ingredients or moieties are released from an oral dosage
form and move to the site of action7 The definition above focuses on the process by which
the active drugs or ingredients are released from an oral dosage form and move to the site of
action in the human body As noted in the guidance document bioavailability is documented
by developing a systemic exposure profile This profile can be achieved by measuring the
concentration of active ingredients and its active metabolites over time in samples collected
from the systemic circulation Systemic circulation describes the part of the cardiovascular
system within the human body which carries oxygenated blood away from the heart and
returns deoxygenated blood back to the hearts Bioequivalence (BE) also plays an important
role when considering dissolution As per the FDA bioequivalence is defined in sect 3201 as
the absence of a significant difference in the rate and extent to which the active ingredient or
active moiety in pharmaceutical equivalents or pharmaceutical alternatives becomes available
at the site of drug action when administered at the same molar dose under similar conditions
in an appropriately designed study Both bioequivalence and bioavailability focus on the
release of a drug substance from a drug product and subsequent absorption in the system
circulation Moreover this is the basis for pharmacokinetics
Pharmacokinetics may be simply defined as what the body does to the drug It attempts to
study the mechanisms of absorption and distribution of the administered drug the rate at
7 Guidance for Industry Bioavailability and Bioequivalence Studies for Orally Administered Drug ProductsshyGeneral Considerations 2003 US Department of Health and Human Services FDA [Online] httpwwwfdagovcderguidanceindexhtm (accessed May 12011)
[9]
Seton Hall University
which the drug begins and duration of the effect Bioavailability and bioequivalence rely on
pharmacokinetics measurements such as AVC and Cmax that reflect the systemic exposure
AVC is the area under the plasmalserumlblood concentration-time curve from time zero to
time t where t is the last time point with measurable concentration for individual formulation
Cmax measures the peak exposure by measuring the peak drug concentration obtained
directly from the data without interpolation 9
In the 1950s the scientific community focused its interests on dissolution as the rate process
for controlling the absorption of active drugs into the bloodstream In 1951 Ll Edwards
suggested that the analgesic activity of aspirin tablets can be manipulated by its rate of
dissolution within the GI tract lO Edwards studied the kinetics of the dissolution of aspirin in
water at different pHs but over the same temperature range The solubilities of aspirin were
measured and diffusion rates were recorded at several concentrations He determined that the
diffusion coefficients are not independent of the concentration Edwards suggested that the
dissolution of an aspirin tablet in the stomach and intestine is the rate process controlling the
absorption of the aspirin into the bloodstream
In 1960 Levy and Hayes used a beaker and a three blade stirrer to demonstrate that the
incidence of GI irritation of different brands of aspirin is dependent on the dissolution rates of
8 Wilding I Bioequivalence testing for locally acting gastrointestinal products what role for gamma scintigraphy Journal ojClintcal Pharmacology 200242(11) 1200-1210 9 Guidance for Industry Bioavailability and Bioequivalence Studies for Orally Administered Drug ProductsshyGeneral Considerations 2003 US Department of Health and Human Services FDA [Online] httpwwwfdagovcderguidanceindexhtm (accessed May 1 2011) 10 Edwards L J Solution and diffusion of aspirin in aqueous media Transactions ojthe Faraday Society 1951 471191-1210
[10J
Seton Hall University
the dosage forms In other words the dissolution rates were critical for the release of aspirin
into the body and causing irritation Thus if the release profile is controlled then the irritation
levels are controlled During this period it was recognized that although disintegration was a
critical process de-aggregation was also essential for bioavailability Disintegration is the
process by which an object breaks down or loses it cohesive ability De-aggregation J2 is the
dispersion of particles and dislodgment of the granules Usually surfactant in solution helps
in the de-aggregation process Figure -2 is an illustration of where disintegration and de-
aggregation occur in the dissolution process The dissolution process occurs in three phases
In Phase I the rate of dissolution is very slow as during this process solvent diffuses into the
solid material (eg the pill) via a process called wetting The initial period is called
mechanical lag Also during this phase the solid particles undergo disintegration and
deaggregation In Phase II the solid particles are well dispersed into the solvent and the rate
of dissolution is more rapid This rate follows a zero order kinetics profile (rate = dxldt=k)
This is followed by Phase III in which 1-2 of the active ingredient is dissolved at a much
slower rate The slower rate is caused by particles that have not been properly wetted and
have not been de-aggregated In this simulated diagram approximately 5 of the active
ingredient does not dissolve While this level of incomplete dissolution is unlikely to occur in
a well formulated pill this section of the diagram nicely represents a process by which some
of the active ingredient never dissolves Two primary factors preventing complete dissolution
are occlusion and saturation In occlusion the active ingredient is so well aggregated that it is
11 Levy G Hayes B A Physiochemical basis of the buffered acetylsalicylic acid controversy New England JournalofAledicine 1960211053-1058 12 Liu J Stewart P J Deaggregation during the dissolution ofbenzodiazepines in interactive mixtures Journal ofPharmaceutical Sciences 1998 87(12)1632-1638
[11]
Seton Hall University
poorly wetted that dissolution is not accomplished during the time of the experiment
Alternatively saturation may have occurred whereby the active ingredient has reached its
thermodynamic limit of solubility which prevents complete dissolution Equilibrium suggests
that complete dissolution is difficult to achieve Equilibrium is the condition of the system in
which competing influences are balanced
[12]
--
--
Seton Hall University
Figure 1-2 Dissolution process
100 ~------------------------------------~~
Occlusion
IIICU gt c-o en tilII-en
tile oMechanical Lag at -s c e offt ~
---- Deaggregation
000 L~==_D~is~in~t=eg~r~a~ti~o~n_________ Time
[13]
Seton Hall University
In 1978 Underwood and Cadwallader13 modified the Noyes-Whitney equation to take into
consideration sink conditions They showed that solubility plays an important role in
dissolution Sink conditions exist when the volume of the dissolution medium is three to ten
times larger than the volume required to make a saturated solution of the solute Thus sink
conditions exist when the concentration (C) of active drug in the medium at time t is much
smaller than the saturation concentration (Cs) They revised the Noyes Whitney equation
accordingly M represents the mass of substance remaining to be dissolved A represents
the surface area of the drug exposed to the dissolution medium and k represents the intrinsic
dissolution rate constant (dissolution constant)
(Equation 8)
dM - = -kA (Cs - C)dt
Moreover as the concentration of the solution increases the equation predicts that dMdt
decreases When the concentration of the saturated solution is much larger than the
concentration of the drug (Csraquo C) in the solvent at time t then equation 9 is obtained
(Equation 9)
dM - = -kACsdt
Underwood and Cadwallader concluded that the overall dissolution rate increases with
increasing dissolution rate constant (k) increased surface area (A) and increased solubility
13 Underwood F L Cadwallader D E Automated potentiometric procedure for studying dissolution kinetics of acidic drugs under sink conditions Journal ofPharmaceutical Sciences 1978 67(8) 1163-1167
[14]
Seton Hall University
(Cs) Therefore by maintaining A and Cs as constants the dissolution rate constant can be
conveniently measured
Furthermore they stated that the dissolution rate of a drug from a constant surface area under
sink conditions should follow zero-order kinetics For zero-order kinetics a linear plot of
[drug concentration] vs time can be used to determine the rate (k) This value can be
interpolated from the slope However when there is a much higher level of a solute such as of
benzoic acid in solution the dissolution rate decreased slightly as shown in Figure 1-3 and
Figure 1-4 below Underwood and Cadwallader document that a possible reason for this
decrease is that the concentration of the buffering compounds in the dissolution medium could
retard the dissolution of the solute ie benzoic acid As the concentration of benzoic acid in
solution increases there is competition for solvent Also the buffer pH decreased slightly as
the benzoic acid dissolves which could have decreased the pH of the diffusion layer adjacent
to the solid benzoic acid particles and caused a decrease in the dissolution rate
[15]
Seton Hall University
Figure 1-3 Importance of sink conditions in dissolution dissolution of benzoic acid at low concentrations Underwood and Cadwallader (Ref 8) (Figure reproduced from figure-1 in article)
1200 Q w ~ i s I shyZ 100)
i If(
Linear at low conc
16 32 M(NUTES
-DiQOlution of noic acid from nondiintratint dUll in dislillH ttlr (pH-lal 62) at ~ GJHIIOO rTJIL
[16]
Seton Hall University
Figure 1-4 Importance of sink conditions in dissolution dissolution of benzoic acid at higher concentrations Underwood and Cadwallader (Ref 8) (Figure reproduced from figure-3 in article)
1100
1200
300
Non-Linear at higher cone -------
eo 0 120 150 MINUTES
-Dillmueion 01 HMoie acid from a nonduit~ti did in buff (pH 62) CIl rrw 100 rpm
[171
Seton Hall University
As a consequence of the research that had occurred from late 1800 s to mid 1900 s in 1970
the first official dissolution test appeared in USP XVIII The United States Pharmacopeia or
USP14 is a non-governmental official public standards-setting authority for prescription and
over-the-counter medicines and other healthcare products manufactured or sold in the United
States USP also sets widely recognized standards for food ingredients and dietary
supplements They set standards for the quality purity strength and consistency of these
products which are critical to the public health
Increased interest in dissolution regulations continue to grow well into the 1970s In fact in
1978 the FDA published the document entitled Guidelines for Dissolution Testing15 The
intention behind this publication was to combine and streamline the systems and processes of
different laboratories This was due to the fact that dissolution results were observed to have
high variability and minor changes in the equipment parameters increased variability The
FDA realized that they needed more controls on the tolerances of the dissolution equipment
so that results are more reproducible Additionally the FDA and USP introduced the idea of
calibrator tablets In 1978 the USP launched three calibrator tablets Prednisone Salicylic
Acid and Nitrofurantoin These calibrator tablets were used during the calibration of the
instrument to validate that the dissolution bath is working as indicated The calibrator tablets
have known specification limits and the calibrations of the instruments have to be within
14 United States Pharmacopeia Home Page hplwwwusporg (accessed May 12011) 15 Guidance for Industry Dissolution Testing oflmmediate Release Solid Oral Dosage Forms 1997 US Department of Health and Human Services FDA [Online] hplwwwfdagovcderguidanceindexhtm (accessed May 12011)
[18]
Seton Hall University
those limits To gam an appreciation of the complexity of the dissolution system and
equipment parameters an overview of the technology will be given in the next section
In 1995 the USP assigned unique numbers to the different dissolution apparatus that were
available to the scientific community Specifically there are seven different types of
dissolution equipment generally used These are listed below in Table 1-1
[19]
i
Seton Hall University
Table 1-1 Dissolution apparatus in the pharmaceutical industry
Dissolution Apparatus Number Dissolution Apparatus Name
Apparatus 1 Basket
Apparatus 2 IPaddle
Apparatus 3 IReciprocating Cylinder
Apparatus 4 I Flow Through Cell
Apparatus 5 Paddle over Disk
Apparatus 6
[20]
Seton Hall University
Apparatus 1 and 2 are most widely used in the pharmaceutical industry As shown above the
first instrument uses baskets method while the second one uses paddles Figure -5 is a
schematic illustration of these two apparatuses The apparatuses are comprised of a covered
vessel a metallic drive shaft a motor to spin the shaft a cylindrical basket (Apparatus 1) or a
paddle (Apparatus 2) and a water bath or heated jacket capable of maintaining the
temperature of the vessels at 37deg plusmn 05degC
[21]
Seton Hall University
Figure 1middot5 Schematic illustration of Apparatus 1 and Apparatus 2 (Reproduced from USP General Chapter on Dissolution lt711raquo
----11-- SllNDU --1---shyDISSOLUTION
ISm
[22]
Seton Hall University
Although the figures above appear simple in design there are strict regulations for the
specifications of each component of the apparatus and tolerances for each component are
specified by USP lt711gt16 Refer to Figure 1-6 and Figure 1-7 for schematic diagrams of the
specifications set by the USP for Apparatus 1 and Apparatus 2 respectively
As a result of these regulations of the past fifty years the number of USP monographs
including dissolution monographs has exponentially increased As shown in Figure 1-8 in
1970 there were only twelve monographs In May of 2011 there were 740 dissolution USP
monographs 17 18 19
16 US Pharmacopoeia amp National Formulary- USP General Chapter lt711gt Dissolution USP [Online] httpwwwusporg (accessed May 12011) 17 Cohen J Hubert B Leeson L Rhodes C Robinson J Roseman T Shefier E The Devlopment of USP Dissolution and Drug Release Standards Pharmaceutical Research 1990 7(10) 983-987 18 Dokoumetzidis A Macheras P A century of dissolution research From Noyes and Whitney to the Biopharmaceutics Classification System International Journal ofPharmaceutics 2006321 I-II 19 US Pharmacopoeia amp National Formulary- USP Monographs including dissolution (2011 summary) httpwwwusporg (accessed May 12011)
[23]
Seton Hall University
Figure 1-6 USP Apparatus 1 Specifications (Reproduced from USP General Chapter on Dissolution lt711raquo
13 to 15 or 9Uo 101 mm
Vlntholl
20 05 mm diameter
Retention spring with 3 tang on 13)6 centers 51 to5mm
Clear opening 2O2t10mm -r-
Screen DO 2Ui tDmm
Screen wllh welded seam 025-031 mm wire diameter with wire openings of 036-044 mm INote-After welding the screen may be slightly altered]A
Note-Maximum allowable runout at U AN is t 10 mm when the part is rotated on center line axis with basket mounted
310 30mm
202 IDmm 250 t 30 mm
[24]
Seton Hall University
Figure 1-7 USP Apparatus 2 specifications (Reproduced from USP General Chapter on Dissolution lt711raquo
~Z~IMI 1 0 it10 i
1----1I 8 l-r 7110 IMJ Iraquo 7$D IMfI -I
NOTESshy(1) Aand Bdimensions
not to ry more thin 05 MIn when part is roIated on eeneer line axis
(2) Tolerancel nt t 10 mmun ~ I4Ited
415 mm radiJI
I
I I shyI
I I
f
[25]
Seton Hall University
Figure 1-8 Monographs including dissolution in the United States Pharmacopeia (USP)
800
700
600
(J) 500pound c (0 L OJ 4000 c 0 2 300 I
200
100
0 1970 1980 1990 2000
Time (year)
2004 2006 2011
[26]
Seton Hall University
As a result of the high regulations and increased number of USP monographs including
dissolution this research will improve dissolution testing Conventional ways of testing have
been used for many years by the industry Specifically the UVNis and HPLC systems have
gone through several stages of evolution but continue to be used as the standards This
research and technique will attempt to improve dissolution testing in several ways First this
technique will allow for in-situ analysis which is very important when dealing with sensitive
drug formulations These sensitive formulations are susceptible to more sampling error when
samples are withdrawn from the dissolution vessel Second FTIR spectroscopy can be
advantageous to dissolution testing Unlike UVNis spectroscopy which gives a single peak
per active drug FTIR spectroscopy can be sued to monitor drug release via monitoring of
numerous functional groups Moreover FTIR spectroscopy can be used to track chemical
transformations within the vessel This will be discussed in chapter three ofthis thesis Lastly
FTIR can be used to study multi-component drug formulations
[27]
Seton Hall University
12 Infrared Spectroscopy
A brief overview is warranted Infrared spectroscopy is the spectroscopy that deals with the
infrared region 14000 cm- (714 nm) to 10 cm- (lxl06 nm) of the electromagnetic spectrum
Moreover the IR portion of the electromagnetic spectrum is divided into three regions near-
infrared mid-infrared and far-infrared The near-infrared20 energy approximately in the
region between 14000-4000 cm- can excite overtone or harmonic vibrations The midshy
infrared2 energy approximately in the region between 4000 cm- (2500 nm) to 400 cm-
(25000 nm) can be used to study the fundamental vibrations of structures The far-infrared
region approximately in the region between 400-10 cm- l can be used to study to rotations of
structures With IR spectroscopy different functional groups adsorb at different IR bands or
regions as shown in Table 1-222 Thus this technique can help identify and even quantify
organic and inorganic molecules
20 J Workman Jr Interpretive spectroscopy for near-infrared The Handbook ofOrganic Compounds Academic Press California 2001 pp 143-182 21 Heise H M Kupper L Butvina L N Attenuated total reflection mid-infrared spectroscopy for clinical chemistry applications using silver halide fibers Sensors and Actuators B Chemical1998 51 (1-3) 84-91 22 Images and frequencies obtained from httpwwwchemcsustanedututoriaisinfraredhtm (accessed May 1 2011)
[28J
Seton Hall University
Table 1-2 Absorption bands (Ref 22) (Reproduced from table of frequencies found on CSU Website link)
Bond Compound Type frequency range cm1
CmiddotH Alkanes 2960-2850s) stretch 1470-1350(v scissoring and bending
CH3 Umbrella Deformation 1380m-w - Doubletmiddot isopropyl (middotbutyl
CmiddotH Alkenes 3080middot3020(m) stretch 1000-675(s) bend
CmiddotH Aromatic Rings 3100middot3000(m) stretch
Phenyl Ring Substitution Bands 870-675(s) bend Phenyl Ring Substitution Overtones 2000-1600(w) shy fingerprint region
CmiddotH Alkynes 3333-3267(s) stretch
700middot61 O(b) bend C=C Alkenes 16BO1640(mw) stretch
CsC Alkynes 2260-2100(wsh) stretch
C=C Aromatic Rings 1600 15OO(w) stretch CoO Alcohols Ethers Carboxylic acids Esters 1260-1000(5) stretch C-O Aldehydes Ketones Carboxylic acids Esters 1760-1670(5) stretch
OmiddotH Monomeric -- Alcohols Phenols 3640-3160Sbr) stretch
Hydrogen-bonded - Alcohols Phenols 3600-32oo(b) stretch Carboxylic acids 3000-25OO(b) stretch
NmiddotH Amines 3500-3300(m) stretch 1650middot15BO (m) bend
CoN Amines 1340-1 020(m) stretch
C=N Nitriles 2260-2220(v) stretch
NOl Nitro Compounds 1660-15OO(s asymmetrical stretch 1390middot1260(s symmetric al stretch
[29]
Seton Hall University
The infrared spectrum of a sample can be obtained by passing a beam of infrared light through
the sample A Fourier transform instrument23 can be used to measure how much energy was
absorbed by the sample over the entire wavelength range The interferometer is a
fundamentally different piece of equipment than a monochromater The light passes through
a beamsplitter which sends the light in two directions at right angles One beam goes to a
stationary mirror then back to the beamsplitter The other goes to a moving mirror The
motion of the mirror makes the total path length variable versus that taken by the stationary-
mirror beam When the two meet up again at the beamsplitter they recombine but the
difference in path lengths creates constructive and destructive interference an interferogram
A mathematical function called a Fourier transform converts an intensity-vs-time spectrum
into an intensity-vs-frequency spectrum Refer to equation 10 A (r) and X (k) are the
frequency domain and time domain points respectively for a spectrum ofN points
(Equation 10)
irkACr) = L XCk)expC-2n IV)
The FT -IR system can produce both transmittance and absorbance spectrum Refer to Figure
1-9 for an illustration of the FT -IR system24 The interferogram represents the light output as a
function of mirror position The FT-IR raw data is processed to give the actual spectrum of
light output as a function of wavenumber
23 Smith BC Fundamentals of Fourier Transform Infrared Spectroscopy CRC Press London 1996 Chapter 4 24 Image obtained from httpmmrccaItecheduiFTIRlFTIRintropdf (accessed July 1 2011)
[30]
Seton Hall University
Figure 1-9 FT-IR system schematic (Ref 24)
IR Source c-ftI A
Mirror
Sample Compartment ___------
[311
Seton Hall University
13 Literature background in situ ATR-IR and dissolution
In the pharmaceutical industry there are two main oral dosage forms tablets and capsules
These are immersed in an aqueous solution and the concentration of the active ingredient is
monitored as a function of timeS Unfortunately dissolution testing provides limited
information on chemical processes that take place within a dissolution vessel This is due to
the limited capabilities of the techniques that are used during dissolution For instance most
dissolution analysis is carried out using Ultraviolet (UV) Visible (Vis) spectroscopy which
only gives concentration as a function of time HPLC is used to separate multi-component
drugs but still utilizes UVNis detectors as the backbone One of the challenges the industry is
faced with is to increase an understanding of the mechanisms governing dissolution The
current approach relies heavily on a data-driven approach The health authorities have
challenged the pharmaceutical industry to understand dissolution and make the dissolution
test more biologically relevant2627 To have a better understanding of dissolution dissolution
chemists need to explore other instruments and experiments that could give insight into what
is happening inside of the vessel Our research focuses on using A TR mid-infrared
spectroscopy as an in situ technique to monitor and study the dissolution of pharmaceutical
tablets Moreover this research will give more insight into the science behind dissolution
Specifically this research will attempt to not only monitor dissolution profiles using FTIR but
25 a) Dressman J J Kramer J K Eds Pharmaceutical Dissolution Testing Taylor and Francis Florida 2005 b) Hanson R Gray V Handbook of Dissolution Testing 3rd ed Dissolution Technologies Delaware 2004 26 Tong C DSouza SS Parker Mirza T Commentary on AAPS workshop - Dissolution testing for the twenty-first century Linking critical quality attributes and critical process parameters to clinically relevant dissolution Pharmaceutical Research 2007 24 1603-1607 27 Tong c Lozano R Mao Y Mirza T Ldbenberg R )ickerson 8 Gray V Wang Q The value of in Vitro dissolution in drug development A position paper from the AAPS in Vitro release and dissolution focus group Pharmaceutical Technology 20093352-64
[32]
Seton Hall University
also try to explain certain reactions (ie transformation of a drug from one form to another-
hydrolysis) that are otherwise missed with UV Vis spectroscopy Literature research on this
topic shows that attempts have been made to study dissolution using near-infrared
spectroscopy and infrared imaging
Attempts have been made to improve the characterization of the controlled release
formulations by FT-IR imaging in ATR-IR mode28 Van der Weerd and colleagues described
the design and implementation of a new cell which allows the study of drug release from
tablets by macro-FT-IR ATR imaging with a diamond ATR accessory The tablet formulation
can be compacted directly on the A TR crystal The authors explain that various components
in the tablet can be determined FT-IR imaging The described cell was applied to study a
model tablet consisting of hydroxy propyl methylcellulose (HPMC) and caffeine The study by
Van der Weerd and co-workers demonstrate that the amount of drug rapidly decreases due to
diffusion Direct observation of this well know phenomenon is unattainable by dissolution
techniques but FT-IR imaging in ATR mode provides a means to achieve this
Moreover Van der Weerd and Kazarian explored FT-IR imaging as a useful application for
studying the distribution of different components in the tablet eg drug polymer and water
as a function of time It was shown that the release profile obtained by FT-IR imaging is
comparable to that obtained by the flow-through dissolution test with UV spectroscopic
28 a)Van der Weerd 1 Kazarian S G Combined approach ofFTIR imaging and conventional dissolution tests applied to drug release Journal Controlled Release 200498295-305 b) Van der Weerd 1 Chan K L A Kazarian SG An innovative design of compaction cell for in situ FT-IR imaging of tablet dissolution Vibrational Spectroscopy 200435(1-2)9-13
[33]
1
Seton Hall University
detection In addition FT -IR imaging was also used to investigate the release of a poorly
soluble drug from pharmaceutical tablets9
Blanc030 and co-workers investigated the use of near-infrared as a tool to study the dissolution
profiles in pharmaceutical tablets Their determination was based on the application of Partial
Least-Squares 2 (PLS2) multivariate calibration models to NIR spectra for individual tablets
Marcelo and his colleagues documented that the proposed NIR method provides accurate
predictions of dissolution profiles In fact the coefficient of correlation between the
dissolution profiles obtained with it and a reference method exceeded 099 (r) in all cases and
calibration and prediction errors fell within acceptable ranges (6-7) They conclude that the
method allows the entire dissolution profile of intact pharmaceutical tablets to be determined
in a simple clean expeditious manner without the need to use any reagents or solvents or the
production of any waste
In addition Chan3l and co-workers investigated the use of FT-IR imaging as a tool to study
formulations of ibuprofen in poly(ethylene glycol) (PEG) enabled characterization of the
distribution of both polymer and drug in the tablet The authors attempted to study the
mechanism of dissolution and drug release for two tablet preparation methods mechanical
mixing and melt extrusion The mechanisms of dissolution were compared using this
spectroscopic imaging approach and found it to be very informative
29 a)Van der Weerd J Kazarian S G Release of poorly soluble drugs from HPMC tablets studied by FTIR imaging and flow-through dissolution tests Journal ofPharmaceutical Science 2005 94 2096-2109 b) Vander Weerd J Kazarian SG Validation of macroscopic attenuated total reflection-Fourier transform infrared imaging to study dissolution of swelling pharmaceutical tablets Applied Spectroscopy 200458(12) 1413-1419 30 Blanco M Alcala M Gonzalez J M Torras E Determination ofdissolution profiles in intact pharmaceutical tablets by NIR spectroscopy The Journal ofProcess Analytical Technology 20063(5)25-29 31 Chan K L A Kazarian SG Dissolution of solid dispersions of ibuprofen studied by Fourier Transform infrared imaging Polymeric Drug Delivery 2006 203-214
[34]
2
Seton Hall University
Dissolution of salicylic acid acetylsalicylic acid and acetaminophen using In Situ A TR-IR spectroscopy
This chapter focuses on describing the application of in situ attenuated total reflectance-
infrared spectroscopy (ATR-IR) as a technique for measuring and studying dissolution of
pharmaceutical formulations products The majority of the methods for monitoring
dissolutions utilize UV-Vis spectroscopy For example aliquots are manually withdrawn and
analyzed by UV-Vis spectroscopy or HPLC with UV-Vis detection However the sampling
process is disruptive to the dissolution profile since removal of aliquots from the vessel
disturbs the solution In addition there are instruments that allow real-time analysis using in
situ UV-Vis probes For example fiber optic dissolution testing is used in the industry to
monitor pharmaceutical drug product release Fiber optic dissolution is also used for
formulation development32 Formulators are using in situ UVNis systems to profile and
develop drugs faster Instead of relying on conventional techniques where dissolutions are
conducted manually and analyzed offline the advantage of the fiber optic system is that it
allows for real-time data analysis
There is interest in the development of new methods that do not require manual sampling
Also for multi-component formulations it is important to be able to observe the dissolution
profile of each active pharmaceutical ingredient (API) Thus there is also interest in the
development of new spectroscopic methods that enable observation of multiple components
The use ATR-IR for analyzing aqueous samples is limited by the relatively high concentration
32 Mirza T Liu Q Vivilecchia R Joshi Y Comprehensive validation scheme for in situ fiber optics dissolution method for pharmaceutical drug product testing Journal Pharmaceutical Science 2009 98 1086shy1094
[35]
Seton Hall University
of analyte required for detection33 Hence this research investigated the use of ATR-IR as a
technique for monitoring and understanding dissolution Limit of detection (LOD) and limit
of quantitation (LOQ) will play important roles in determining the sensitivity of the system
The LOD and LOQ values will be discussed in detail in chapter four of this thesis Refer to
equation II and 12 for the limit of detection and limit of quantitation calculations
(Equation 11)
LOD = 3x (S~)
(Equation 12)
LOQ = lOx (S~)
A TR spectroscopy is a sampling technique that is based on molecular vibration and the
curvature of light beams when passing through different mediums An A TR spectrum is
generated by transmitting radiation which can be IR (from 01 x 10-5 cm to 75 x 10-5 cm)
VIS (from 70 x 10-5 to 40 X 10-5 cm) or UV (from 40 x 10-5 cm to 22 x 10-5 cm) through an
optical crystal in contact with a sample and then determining what portion of the incident
radiation is attenuated by the sample at a particular wavelength
With A TR sampling the IR beam is directed into a crystal of relatively higher refractive
index The IR beam reflects from the internal surface of the crystal and creates an evanescent
wave which projects orthogonally into the sample in intimate contact with the A TR crystal
Some of the energy of the evanescent wave is absorbed by the sample and the reflected
33 Regan F Meaney M Yos J G Maccraith B D Walsh J E Determination of pesticides in water using [36]
Seton Hall University
radiation (some now absorbed by the sample) is returned to the detector The refractive
indices of the crystal and sample are important considerations in the ATR sampling technique
Refer to equation 13
(Equation 13)
where n2 is the refractive index of the sample n 1 is the refractive index of the crystal and 8c
is the critical angle ATR spectrometry is used extensively in clinical assays medical
diagnostics and laboratory testing34 Since the depth of penetration for the evanescent wave
in A TR spectrometry is shallow there is a low incidence of Fresnel Reflection Thus reliable
spectral analysis of murky semisolid turbid and optically dense solutions is possible with
ATR spectroscopy Moreover the A TR crystal is a relatively chemically resistant Zn-Se
crystal that can be coated with an additional chemically resistant material which enables IR
spectroscopy to be performed in aqueous solution
Therefore in situ A TR-IR spectroscopy has the unique potential to simultaneously address
problems associated with manual sampling and multi-component analysis discussed above
This is a potentially useful method for dissolution testing Modern infrared instruments can be
equipped with fiber optic probes containing A TR crystals that are chemically robust provide
excellent sensitivity and with respect to in situ UV-Vis are not affected by turbidity In
addition since IR is very sensitive to specific functional groups it has greater versatility in
ATR-FTIR spectroscopy on PVCchloroparaffin coatings Analytical Chimica Acta 1996 334 85-92 34 Bynum K Kassis A ATR Crystal Device US Patent 6841792 March 102002
[37]
Seton Hall University
differentiating components in a multi-component mixture than UV-Vis spectroscopy35 In this
chapter the successful development of dissolution tests using in situ ATR-IR spectroscopy to
analyze single and multi-component mixtures is described
Since dissolution testing has evolved into a highly regulated activity in the pharmaceutical
industry health agencies have placed a greater emphasis on regulating dissolution methods
The dissolution test is the only one that can give an in vitro snapshot of how the drug product
may behave in vivo Because ofthis function the number of dissolution methods in the United
States Pharmacopeia (USP) has grown substantially Furthermore the US Food and Drug
Administration (FDA) has placed greater importance on the dissolution test The FDA official
website is full of material related to dissolution testing from guidance documents to warning
letters36 Thus the potential impact of a new analytical technique that permits in situ analysis
of multiple active ingredients is large
21 Experimental section
211 Chemical and materials
Acetaminophen reference material (batch no 104KO154) was purchased from Sigma-Aldrich
(St Louis MO USA) Salicylic acid reference material (batch no 04708HE) was purchased
from Sigma-Aldrich (St Louis MO USA) Acetaminophen tablets (Tylenolreg batch no
SLA175) were purchased from a local pharmacy Excedrinreg Caplets (Back and Body Brand
Lot 10067371 Acetaminophen 250 mg Aspirin 250 mg) were purchased from a local
pharmacy Salicylic acid calibrator tablets (USP batch no QOD200) were purchased from the
35 Skoog D Holler 1 Crouch S Principles ofInstrumental Analysis 6th ed Thomson Books 2007 pp 455shy480 36 United States Food and Drug Administration Home Page httpwwwfdagov (accessed May 12011)
[38J
Seton Hall University
USP Methanol acetone and acetonitrile (HPLC grades) were purchased from Pharmacoshy
Aaper Sodium hydroxide (batch no 064214BH) used to prepare the pH buffered solutions
was purchased from Sigma-Aldrich (St Louis MO USA) These analytes were selected
because of their immediate release properties and high solubilities in phosphate buffers
Potassium phosphate monobasic (batch no 103K0060) used to prepare the pH buffered
solutions was purchased from Sigma-Aldrich Glacial acetic acid was purchased from Sigma
Aldrich (St Louis MO USA) All solutions were prepared using water treated by a Milli-Q
Millipore purification system All purified water aliquots have resistivity of not less than 18
MOhm-cm-1
212 Instrumentation
Samples were tested using Mettler Toledos iC10 FT-IR system using a fiber optic probe
equipped with a 1 mm diamond coated A TR probe The IR system was operated by Mettler
Toledos iC IR version 30 or 40 software pH determinations were carried out using a pH
meter from VWR (model no Symphony SB70P) HPLC analysis was carried out using two
systems Hewlett Packard 1 050 (operated by ChemStation) and Waters 2695 (operated by
Empower) All UV measurements were carried out using a Hewlett Packard UV instrument
(model no 8452A diode array) The UV instrument was operated using HPs Softer-Olis
Spectralworks All manual dissolutions were tested using a Vankel Dissolution Bath (model
no 700) All analytical weight measurements were carried out using Mettler Toledos
DeltaRange and AG204 DeltaRange top loading balance
[39]
Seton Hall University
213 Buffered solutions
The pH 58 (200 mM) and 74 (50 mM) phosphate buffered solutions were prepared with
monobasic potassium phosphate in accordance with the USP As described in the USP the
detailed procedure for preparing these buffers is shown below3738
Phosphate Buffered Solution
The volumes shown in the table are for 200 mL of buffer solution Note Where water is
specified for solution or dilution of test substances in pH determinations use carbon dioxide-
free water
bull Sodium Hydroxide Solution (02 M) - Dissolve 40 g of sodium hydroxide in water to make 100 mL
bull Monobasic Potassium Phosphate Solution (02 M) - Dissolve 2722 g of monobasic potassium phosphate (KH2P04) in water and dilute with water to 1000 mL
Table 2-1 Phosphate buffer preparations as per United States Pharmacopeia (USP)
Composition of Standard Buffer Solutions
Phosphate Buffer Place 50 ml of the monobasic potassIUm phosphate soluDon in a 200-ml volumetric ftask add the specified volume of the sodium hydroxide solution then add waterto voume
pH 58 60 62 64 66 68 70 72 74 76 78 80
02 IV NaOH mL 36 56 81 11 6 164 224 291 347 391 424 445 461
214 Dissolution experiments
Single component analysis 300 mg salicylic acid tablets were tested in pH 74 phosphate
buffered solutions Dissolution was conducted using a vessel volume of 500 mL and at
ambient temperature All dissolutions were conducted using USP Apparatus II (paddles) with
an agitation speed of 100 rpm The dissolution run time was seven hours and thirty minutes
37 US Pharmacopoeia amp National Formulary- USP Monograph Salicylic Acid Tablets USP [Online] httpwwwusporg (accessed May 12011)
[40]
Seton Hall University
Multi-tablet analysis 300 mg salicylic acid and 500 mg acetaminophen tablets were tested in
pH 58 phosphate buffered solutions Dissolution was conducted using a vessel volume of 500
mL and at ambient temperature All dissolutions were conducted using USP Apparatus II
(paddles) with an agitation speed of 50 rpm (a slower rpm was chosen to enable a slower rate
of dissolution to help distinguish the components) The dissolution run time was six hours
Multi-component analysis Three Excedrinreg tablets each composed of 250 mg aspirin
(acetylsalicylic acid) and 250 mg acetaminophen were tested in pH 74 phosphate buffered
solutions Dissolution was conducted using a vessel volume of 500 mL and at ambient
temperature All dissolutions were conducted using USP Apparatus II (paddles) with an
agitation speed of 100 rpm The dissolution run time was one hour and thirty minutes
215 HPLC analysis
The single-component analysis experiment was performed using the following HPLC
parameters HP 1050 HPLC Waters Symmetry 300 CI8 5 lm column (46 x 50 mm) mobile
phase was 60401 (water methanolglacial acetic acid) flow rate was 20 mLimin isocratic
mode injection volume was 5 lL and absorbance was set at 296 nm
The multi-tablet analysis experiment was analyzed using the following HPLC parameters
Waters 2695 Waters Symmetry Shied RP CI8 3 lm column (35 x 50 mm) mobile phase
was 70301 (water acetonitriletrifluoroacetic acid (TF Araquo flow rate was 15 mLimin
isocratic mode injection volume was 5 lL and absorbance was set at 296 nm
38 US Pharmacopoeia amp National Formulary- USP Monograph Acetaminophen Tablets USP [Online] -=---------==(accessed May 12011)
[41]
Seton Hall University
The multi-component analysis experiment was performed using the following HPLC
parameters HP 1050 HPLC Phenomenex Intersil ODS C 18 5 11m column (46 x 150 mm)
mobile phase was 60401 (methanol water trifluoroacetic acid (TF A)) flow rate was 10
mLimin isocratic mode injection volume was 25 ilL and absorbance was set at 280 nm
216 ATR-IR analysis
The ReactIRTM iC 10 FTIR instrument is composed of a Mercury-Cadmium-Telluride
(MCT) detector (liquid nitrogen cooled) and the FiberConduittrade When sample
measurements must be made at high speed or when IR throughput is low the highly sensitive
mercury cadmium telluride (MCT) detector provides the ability to scan faster than a DLaTGS
detector while maintaining a constant IR response The FiberConduittrade is comprised of
flexible IR transparent silver chloridesilver bromide optical fibers The fiber optic probe
interface (AgX 95 mm x 15 m Fiber (Silver Halide)) contains a diamond tip-DiComp ATR
crystal The resolution was set to 4 wavenumbers The optical range used by the system is
1900 cm1 to 650 cml The gain adjustment was set to normal (lx) and the apodization
method was set to Happ-Genzel The system uses compressed air (house air filtered and
dehumified) to purge the optics
For the single component testing data treatment was carried out using the following
methodology The data was first subjected to baseline correction An absorption band at 1388
cm- was selected for salicylic acid The height was calculated using a baseline band
correction set at 1370 cm- I The ATR-IR system was configured to collect spectra every five
minutes
[42]
Seton Hall University
For multi-tablet testing the data was first sUbjected to baseline correction An absorption
band at 1388 cm-1 and baseline band at 1370 cm-1 were selected to calculate the peak height
1for salicylic acid An absorption band at 1246 cm-1 and a baseline band of 1276 cm- were
selected to calculate the peak height for acetaminophen The ATR-IR system was configured
to collect spectra every five minutes
For mUlti-component testing the data was first subjected to baseline correction An absorption
band at 1388 cm-1 and a two-point baseline set at 1370 cm-1 and 1414 cm-1 were selected to
calculate the peak area for aspirin (acetylsalicylic acid) An absorption band at 1246 cm-1 and
a two-point baseline set at 1217 cm-1 and 1265 cm- l were selected to calculate the peak area
for acetaminophen The ATR-IR system was configured to collect spectra every three
minutes
For all ATR-IR experiments 256 scans were collected and co-added for each spectral point
On average every spectral point took about two-minutes to complete For all testing the
calculated peak response was subjected to mathematical smoothing using the ielO software
The data was compared to reference standards measurements collected prior to start of the
linearity and dissolution experiments Dissolution data was plotted vs time and all dissolution
experiments were allowed to equilibrate in the buffer for at least half an hour prior to the start
of a dissolution experiment
[43]
Seton Hall University
22 Results and discussion
221 Single-component analysis
2211 Linearity results for salicylic acid using pH 74 phosphate buffer
Salicylic acid was thoroughly studied in pH 74 phosphate buffered solution as recommended
by the USP Since salicylic acid has a pKa of 297 it is almost completely ionized at
physiologic pH 74 Thus the ratio of salicylic acid salicylate is approximately 1 25000
During the method development phase linear dilutions of salicylic acid reference standards
were prepared and analyzed using ATR-IR spectroscopy The linearity experiments served
two purposes 1) they determined whether IR spectroscopy provided a linear response to the
different concentrations of salicylic acid and 2) whether IR spectroscopy can be used for
very low concentration levels of salicylic acid Initially eight levels of salicylic acid standards
were prepared Based on the IR spectra obtained salicylic acid has an IR frequency of interest
at 1388 cm- I (Figure 2-1) The linearity experiments were further analyzed using linear
regression Based on the analysis it was determined that salicylic acid had excellent linear
correlation using IR spectroscopy with a 0997 correlation coefficient (r2) Linear regression
for salicylic acid was calculated using the IR absorption band at 1388 cm-1 and subtracting the
baseline absorption band at 1370 cm- I A chart of the digitized data is attached in Appendix
[A] Since the IR system resolution was set to four large data sets were obtained during the
analysis An example ofthe digitized data can be found in the appendix
[44]
Seton Hall University
Figure 2-1 Salicylic acid spectra at different concentrations in pH 74 phosphate buffered solution
0012
0011
001
0009
0008
~ 0007 c s 00065 ro
0005 CL
0004
0003
0002
0001
0
00321 M -tl-O0161 M +----------1+---------1 -tr-00107 M -00060 M
+---------+-+-+---------1 -00064 M -amp-00054 M 00046 M 00023 M
1330 1350 1370 1390 1410 1430 1450 1470 1490
Wavenumber (cm-1)
[45]
Seton Hall University
Table 2-2 Method development summary for Salicylic Acid (Linearity and Dissolution results)
i Method development parameter Typical Pharmaceutical Results Acceptance criteria
Accuracy (mean) i
- Difference between IR and HPLC Report value 21 I Linearity (n 2 6)
~0997- Correlation coefficient r 0990
- Range(Linearity experiment) Specify range 0016- 01130 mgml
i Limit of detection (LaD) Specify LaD 002 mgml
Limit of quantitation (LaO) Specify LaO 008 mgml
Precision (RSD) I Relative standard deviation 02 (n26) 20
[46]
Seton Hall University
222 Dissolution results for salicylic acid using pH 74 phosphate buffer
The next part of method development phase was to determine the accuracy of A TR-IR
spectroscopy as a technique for measuring dissolution rates of a drug This was determined by
comparing the IR spectroscopy results with HPLC results Although the USP methods
typically recommend vessel volumes of 900 mL the dissolution vessels were filled with 500
mL of pH 74 phosphate buffer in order to increase the signal-to-noise ratio The purpose of
this change was to detect very low concentrations (below 10) of the active drug Practically
the laboratory is not interested in seeing 10 levels but rather higher concentrations
Therefore in order to test the limits of the system the lower dissolution vessel volumes were
used Next the paddle was lowered to the USP recommended position (25 plusmn 2 mm from the
bottom of the vessel) and rotated at 100 rpm at ambient temperature To minimize
hydrodynamic effects the A TR probe was inserted approximately 5 mm below the surface of
the medium39 The first thirty-minutes were used to establish the spectral baseline the shaft
was momentarily stopped and one salicylic acid (300 mg) tablet was dropped into the vessel
Rotation was resumed and IR data were acquired every five minutes for a period of seven
hours During this time aliquot samples were removed and stored in HPLC vials for
subsequent analysis As shown in Figure 2-2 the results from the IR and HPLC systems
match extremely well and the relative accuracy is within plusmn 2
39 Mauger J W Physicochemical and fluid mechanical principles applied to dissolution testing Dissolution Technologies 199637-11
[47]
Seton Hall University
Figure 2-2 Comparison of in situ ATR-IR and HPLC methods for dissolution of a salicylic acid tablet
The dissolution plot below represents dissolved of salicylic acid vs time This particular experiment was carried out over seven hours The light blue diamond data points represent the A TR-IR results whereas the red squares represent the HPLC results Moreover as observed in the figure below the IR data at approximately seven hours appears to be noisy This is probably due to disturbance of the fiber optic probe during the HPLC sample collections at the seven-hour time points
100
90
0 80
(J)
l 700
In In
u E 60 (J)
~ (J) 50a (J) gt
ii 40 3 E 30J ()
20
10
0
-o-Dissolved (iC IR)
bull Dissolved (HPLC)
000 112 224 336 448 600 712 824
Time (hhmm)
[48]
i
Seton Hall University
Table 2-3 Dissolved of salicylic acid Absolute dissolved difference between ATR-IR and HPLC results
This data represents the dissolution results for salicylic acid from Figure 2-2 The ATR-IR data was compared to the HPLC data and the absolute difference between both methods was calculated The average difference was also calculated
Salicylic acid (HPLC) I Salicylic acid (ATR-IR)
Time (hmm) ( Dissolved) i ( Dissolved)
000 00 00 111030
--- 100 209
200 382
300 529
600 878
700 948
144
231
380
509
938
978
Average
Absolute Difference
()
00
33
22
-01
-20
60
30
21
[49]
Seton Hall University
223 Multi-tablet analysis
2231 Linearity results for salicylic acid and acetaminophen in pH 58 phosphate buffer
The USP monograph specifies pH 58 phosphate buffer as the medium of choice for
acetaminophen Thus acetaminophen and salicylic acid were thoroughly studied in pH 58
phosphate buffer As expected regression analysis for salicylic acid indicated an excellent
linear correlation (r = 0994) of IR peak intensity vs concentration For acetaminophen at
low concentrations (~ 011 mgml 07 mM) the relationship between absorbance and
concentration is effectively linear (r2= 0998) However to our surprise non-linear behavior
for both IR and UV -Vis methods was observed at higher concentrations As shown in Figure
2-3 both methods can be modeled using second-order polynomial equations4o
40 Dejaegher B Bloomfield MS Smeyers-Verbeke J Heyden Y Validation of a Fluorimetric Assay for 4shyAminophenol in Paracetamol Formulations Talanta 2008 75 258-265
[50]
Seton Hall University
-- ----------~-------------------------
Figure 2middot3 Calibration curves of acetaminophen standards at pH 58 UVNis absorbance at 296 nm and IR peak intensity at 1246 cm-1
Acetaminophen in pH 58 buffer is linear at the lower concentrations During the early stage
of dissolution the concentration (C) of the active drug is much lower than the saturation
concentration (Cs) However as time progresses the solution becomes saturated at which point the drug will compete for solution space Moreover as more molecules of acetaminophen are in solution more hydrogen bonding (between carbonyl and hydroxyl
groups) will occur between the molecules potentially causing dimerization in solution
0900 ---------------------~------- 00040
0800
0700
0600
i3 0500 c ro ~ 0400 VI 0 laquo 0300
0200
0100
y -13926x2 + 21527x + 00274 R2 09981
---___----------______shyy -00034x2 + 00071x + 00002
09985
Absorbance by UV (5-20 Range)
xAbsorbance by UV (5-120 Range)
ClIR Data Peak Response (1246 cm-1)
00035
00030
00025 0 CD
00020 a
CD
(J) 00015 ~
00010
00005
0000 +-----------r----------==================---+ 00000 0000 0100 0200 0300 0400 0500 0600 0700
Concentration (mgmLJ
[51]
j
Seton Hall University
2232 Dissolution results for salicylic acid and acetaminophen in pH 58 phosphate buffer
To demonstrate the ability of in situ ATR-IR to successfully monitor dissolution of two
different tablets the dissolution profile of salicylic acid and acetaminophen tablets was
determined by simultaneously adding one tablet of each and monitoring the dissolution rate of
both components over seven hours
Although salicylic acid is not used clinically it serves as an USP recommended standard for a
slowly eroding tablet and acetaminophen serves as an example of a tablet that disintegrates
As shown in the figure below the in situ ATR-IR method is clearly able to distinguish the
dissolution of each component For example the acetaminophen tablet disintegrates and
releases acetaminophen more rapidly than the salicylic acid tablet which slowly erodes over
time Thus in situ ATR-IR method is successful in determining the dissolution profile of a
two component system
To compare the in situ ATR-IR method with HPLC and UV-Vis methods aliquots
were taken throughout the experiment and analyzed The results from the in situ ATR-IR and
HPLC systems are overlaid in Figure 2-4 and an excellent correlation is observed between the
two methods In addition samples were analyzed using a UV Nis instrument Since both
salicylic acid and acetaminophen absorb at approximately 296 nm (PH 58) it will not be ideal
to monitor the dissolution of these two components using UV Nis alone Moreover extensive
mathematical equations will be required to solve simultaneous equations in order to
differentiate the two active drugs
[52]
Seton Hall University
Figure 2-4 Simultaneous dissolution of acetaminophen and salicylic acid tablets in situ A TR-IR vs HPLC
The dissolution plot below represents dissolved of individual salicylic acid and acetaminophen tablets vs time Moreover two separate tablets were inserted into a single vessel during the analysis The dissolution was carried out at pH 58 phosphate buffer as suggested by the USP This particular experiment was carried out over six hours The red squares and yellow diamonds represent the HPLC data As observed the ATR-IR and HPLC results are very similar at the specified time-points shown below Since acetaminophen tablets are designed to disintegrate rapidly the drug release quickly as observed in the plot Since salicylic acid is an eroding (slowly releasing) tablet the drug releases slower as observed in the plot In addition the dissolution was carried out using an agitation speed of RPM
100
90
80
70
tI ltI) 60 2 0 ltII ltII 50 is ltilt
40
30
20
10
0
0000
~---~gt---~------~----------~
Time (hhmm)
0030 0100 0130 0200 0230 0300 0330 0400 ()43O 0500 0531 0601
-ltgt- 0 of Acetaminophen (lR) bull 0 ofAcetaminophen (HPLC)
-E- 0 of Salicylic Acid (IR) ltgt 0 of Salicylic Acid (H PLC)
[53]
Seton Hall University
224 Multi-component analysis
2241 Dissolution results for Excedrinreg caplets (aspirin and acetaminophen) in pH 74 phosphate buffer
To demonstrate the ability of in situ ATR-IR to successfully monitor multiple components
within the same tablet dissolution testing was carried out on Excedrinreg caplets The label
claims for the Excedrinreg caplet are acetylsalicylic acid (250 mg) and acetaminophen (250
mg) actives The release profile was determined by simultaneously adding three Excedrinreg
caplets to a 500 mL vessel volume containing pH 74 phosphate buffer Three caplets were
necessary to ensure satisfactory signal to noise ratio Refer to Figure 2-5 for ATR-IR spectra
for Excedrinreg caplets The dissolution rates of both components were monitored over 15
hours Based on the data it was determined that acetylsalicylic acid and acetaminophen were
fully released within 15 hours as shown in Figure 2-6 In situ A TR-IR method is clearly able
to distinguish the dissolution the acetylsalicylic acid and acetaminophen components
To compare the in situ A TR-IR method with HPLC aliquots were taken throughout
the experiment and analyzed The results from the in situ ATR-IR and HPLC systems are
overlaid in Figure 2-6 and an excellent correlation is observed between the two methods
Refer to Table 2-4 to Table 2-7 for statistical values Overall this set of experiments indicates
the versatility of in situ A TR-IR for dissolution testing as it allows automated observation of a
multi-component system without manual sampling and by successfully tracking the
dissolution behavior of two of the major components
[54]
Seton Hall University
Figure 2-5 ATR-IR spectra of Excedrinreg caplets at different time-points during dissolution in pH 74 phosphate buffered solution
ATR-IR spectra for Excedrinreg caplet (acetaminophen and acetylsalicylic acid) in pH 74 phosphate buffer solution Acetaminophen was calculated using wavenumber 1246 cm- I and acetylsalicylic acid was calculated using 1388 cm- I
mmss Acetaminophen Peak --00600 -ltgt- 00900 ( -1246)
0012 _01200 -middotmiddot01501 -- 01800 -02100 --03000 --04200middot --05100 --05701
12100 --12700 ~ 0009 c OJ
E c (ll ~ 0006 e o en D laquo
0003
0+----- 1025 1075 1125 1175 1225 1275 1325 1375
Wavenmuber (em-)
[55]
t
1 1
Seton Hall University
Figure 2-6 Dissolution of acetylsalicylic acid and acetaminophen in Excedrinreg caplets in situ ATR-IR VS HPLC
The figure below represents a plot of Excedrinreg (acetaminophen and acetylsalicylic acid
dissolved) vs time The blue squares and yellow triangles represent the HPLC data points As
observed the two techniques (lR and HPLC) correlate very well Refer to Table 2-4 for more
details
100
90
80
70 0 (I)
~ 60
~ 50is ~ 0
40
30 -Acetaminophen (ATR-IR
20 bull Acetaminophen (HPLC)
--+-Aspirin (ATR-IR)10
6 Aspirin (HPLC)
0 000 010 020 030 040 050 100 1 1 0 120 130
Time(hhmm)
[56]
Seton Hall University
Table 2-4 Dissolution of acetylsalicylic acid (aspirin) and acetaminophen in Excedrinreg caplets ATR-IR raw data
Raw data results for the A TR-IR spectra of Excedrinreg caplets
Acetaminophen (A TR-IR) Aspirin (ATR-IR)
Time (hmmss) ( Dissolved) ( Dissolved)
00000 00 00
00300 48 49
00559 137 136
00859 265 259
01159 416 398
01500 573 525
01759 690 656
02059 792 767
02359 868 861
02700 921 920
02959 958 968 ~
03259 982 992
03559 1001 1006 03859 100A 1021
04159 993 1022 I
04459 990 1002
04800 992 999
05059 989 997 i
05359 993 995
I 05700 996 993
05959 1000 1000
I 10259 992 1000
10600 993 1001 10859 989 999
1 1200 98A 992
11459 976 989 1 1759 979 989 1 2059 981 988 12400 986 988 12659 980 992 13000 986 992
[57]
1
Seton Hall University
Table 2-5 Dissolution of acetylsalicylic acid (aspirin) and acetaminophen in Excedrinreg caplets HPLC raw data
1 pound Ed regRaw HPLCdata resu ts or xce rm caplets
I Time (hmmss)
00000
Acetaminophen (HPLC)
( Dissolv~d)
00
Aspirin (HPLC)
( Dissolved)
00
01100
03000
484 957
299
986 I
10000 980 1007 I
Table 2-6 Dissolved of acetaminophen Difference between ATR-IR and HPLC results
Time I Acetaminophen (HPLC) Acetaminophen (ATR-IR) (hmmss) I ( Dissolved) ( Dissolved) Absolute Difference
00000 I 00 00 00
01100 i 484 416 68
03000 I 957 958 -01
10000 I 980 1000 -20
Table 2-7 Dissolved acetylsalicylic acid (aspirin) analysis Difference between ATR-IR and HPLC results
Time I Aspirin (HPLC) Aspirin (ATR-IR)
(hmmss) ( Dissolved) ( Dissolved) Absolute Difference
00000 00 00 00 01100 299 398 -99
03000 986 9~8 18 10000 1007 I 1000 07
[58]
Seton Hall University
Figure 2-7 Compounds studiedof interest for future work (Chern Draw)
This figure represents some of the compounds studied during the research (ie acetaminophen aspirin) Also other compounds and combinations of these compounds will
be studied during future research These potential compounds include ibuprofen naproxen
and caffeine
Ibuprofen Naproxen HOOC
Acetmninopheuf Caffeine
Acetmnillopheni Aspirini Caffeine
[59]
Seton Hall University
23 Chapter summary
In situ infrared spectroscopy was found to be a viable alternative for measuring dissolution
profiles of pharmaceutical tablets The IR system was found to be impressive in its capability
of measuring very low concentrations The limit of detection was found to be 002 mgml per
IUPAC calculations The IR system was able to distinguish separate components of a mUltiple
component system without requiring manual sampling This versatility is demonstrated by
observing the simultaneous dissolution of acetaminophen and salicylic acid tablets In
contrast UV-Vis spectroscopy may require mathematical corrections to resolve the two active
drugs Furthermore HPLC must be used which requires laborious manual sampling or
purchase of a complicated automated instrument setup of dissolution with HPLC analysis
The in situ ATR-IR method has been validated by comparing dissolution profiles using UVshy
Vis and HPLC methods In addition an accuracy of plusmn 2 between IR and HPLC for the
salicylic acid results was established With the current configuration of the IR instrument this
analysis is limited by the sensitivity and wavelength range of the in situ fiber optic probe
However since this chapter successfully demonstrates the versatility of this novel application
of ATR-IR spectroscopy it is clear that the method has excellent potential to be improved by
modification of the IR instrument and selection of more sensitive probes
[60]
3
Seton Hall University
Kinetics of drug hydrolysis of common over-the-counter (OTC) drugs via ATR-IR spectroscopy
This chapter focuses on describing the hydrolysis of acetylsalicylic acid (aspirin) under acidic
conditions The hydrolysis of aspirin was tested and monitored using ATR-IR spectroscopy
In the presence of an acidic medium acetylsalicylic acid undergoes hydrolysis41 to form
salicylic acid by the following acid-catalyzed mechanism
41 Choudhury S Mitra AK Kinetics of aspirin hydrolysis and stabilization in the presence of 2shyhydroxypropyl-B-cyclodextrin Pharmaceutical Research 1993 10 (1) 156-159
[61]
31
Seton Hall University
Background and history of Aspirin
Aspirin is unique in its history and has many important roles in drug therapy Aspirin is
known to decrease pain It fights the pain and inflammation by blocking the action of an
enzyme called cyclooxygenase which inhibits the formation of prostaglandins42
Prostaglandins are chemicals that signal an injury and trigger pain Moreover aspirin is
mostly known for its ability to reduce strokes Since aspirin inhibits the formation
prostaglandins this results in the inhibition of blood clots which could cause a heart attack or
stroke
Figure 3-1 Structures of acetylsalicylic acid (aspirin)
Aspirin
2D 3D
421to Seiji Okuda Emiko Minami Toshiaki Central and peripheral roles of prostaglandins in pain and their interactions with novel neuropeptides nociceptin and nocistatin Neuroscience Research 2001 41(4) 299-332
[62]
Seton Hall University
The first synthesis of aspirin is credited to Gerhardt43 in 1853 Gerhardt was investigating
mixed organic acid anhydrides Felix Hoffman (1868-1946) used acetic anhydride 44 for
aspirins preparation Felix Hoffmann synthesized aspirin in the laboratories of
Farbenfabriken Bayer Elberfeld Germany in 189745 Legend has it that Hoffman wanted to
help his sick father who was suffering from rheumatism and was no longer able to tolerate
sodium salicylate then widely used for his fathers arthritis disease Salicylic acid however
has several bad flaws Its bad taste stomach irritation and other side effects spurred
researchers to look for other derivatives The intent was to keep salicylics efficacy without
the disadvantages it posed Acetylation of the hydroxyl group was one of the logical
modifications This logical thinking eventually led to the synthesis and discovery of aspirin
Refer to Figure 3-2 below for one of the synthesis pathways that were investigated back in the
late 1800s
Figure 3-2 Synthesis of aspirin-late 1800s (Chern Draw)
CH3COCI or
COOH COOH H3CCO catalyst o
+ 0 H3CCO
or O)lCHOH
H2C=C=O
43 C Gerhardt Annalen der Chemie 67 149(1853) 44 F Hoffmann US Patent C44077 of February 271900 45 Analytical Profiles of Drug Substances 8 Aspirin Klaus Florey (1979)
[63]
Seton Hall University
32 Experimental section
321 Chemical and materials
Acetylsalicylic acid (aspirin) reference material (batch no 016K0131) was purchased from
Sigma-Aldrich This same material was used as is for the powdered aspirin Salicylic acid
reference material (batch no 04708HE) was purchased from Sigma-Aldrich Acetylsalicylic
acid 325 mg tablets (Bayer batch no 219050N) were purchased from a local pharmacy
Methanol acetone and acetonitrile (HPLC grades) were purchased from Pharmaco-Aaper
Sodium chloride crystals (batch no 139602) used to prepare the Simulated Gastric Fluid
(SGF) reagent was purchased from Mallinckrodt Chemicals Cone hydrochloric acid (batch
no H44032) used to prepare the SGF reagent was purchased from JT Baker All solutions
were prepared using water treated by a Milli-Q Millipore purification system All purified
water aliquots have resistivity of not less than 18 MOhm-cml
[64]
Seton Hall University
Figure 3-3 Chemical structures studied (Chern Draw)
OH OH
OH
Acetylsalicylic acid SaUcylic Acid (aspirin)
[65]
Seton Hall University
322 Instrumentation
Samples were tested using Mettler Toledos iCI0 FT-IR system using a fiber optic probe
equipped with a 1 mm diamond coated A TR probe The IR system was operated by Mettler
Toledos iC IR version 30 or 40 software The pH determinations were carried out using a
Symphony pH meter (model no SB70P) All dissolution experiments were tested in Mettler
Toledo EasyMax 102 apparatus using iC Control 41 software All analytical weight
measurements were carried out using Mettler Toledos DeltaRange and AG204 DeltaRange
scale
323 Buffered solutions
The Simulated Gastric Fluid (SGF) pH 12 was prepared with sodium chloride and
aqueous hydrochloric acid in accordance with the USP46 The detailed procedure for
preparing this test solution is shown below
Hydrochloric Acid Solution (02M)
The volumes shown in the table are for 200 mL of buffer solution Note Where water is
specified for solution or dilution of test substances in pH determinations use carbon dioxide-
free water
bull Sodium Hydroxide (02 M) - Dissolve 40 g of sodium hydroxide in water to make 100 mL
bull Potassium Chloride (02 M) - Dissolve 1491 g of potassium chloride (KCI) in water and dilute with water to 1000 mL
46 US Phannacopoeia amp National Fonnulary- Gastric Fluid Simulated USP [Online] httpwwwusporg (accessed May 12011)
[66]
Seton Hall University
Table 3-1 Hydrochloric acid buffer preparations as per United States Pharmacopeia (USP)
Composition of Standard Buffer Solutions
Hydrochloric Acid Buffer Place 50 mL oftha potassium chloride solution in a 200-mL volumetric fiask add l1e specified volume of the hydrochloric acid solution then
add water to volume
pH 12 13 14 1 5 16 17 18 19 20 21 22
02MHCImL 850 672 532 414 324 260 204 162 130 102 78
324 Hydrolysis Experiments
HYDROLYSIS USING ASPIRIN TABLETS
Aspirin tablets 325 mg acetylsalicylic acid tablets were tested in pH 12 simulated gastric
fluid solutions Dissolutions were conducted using vessel volumes of 100 mL and at 37 0e
All dissolutions were conducted using an agitation speed of 100 rpm The dissolution run
times were set for 15 hours
HYDROLYSIS USING ASPIRIN POWDER
Aspirin powder acetylsalicylic acid powder samples were tested in pH 12 simulated gastric
fluid solutions Dissolutions were conducted using vessel volumes of 100 mL and at 37 ltIC
All dissolutions were conducted using an agitation speed of 100 rpm The dissolution run
times were set for 15 hours
325 ATRmiddotIR analysis
The ReactIRTM iC I 0 FTIR instrument is composed of an MCT detector (liquid nitrogen
cooled) and the FiberConduittrade The FiberConduittrade is comprised of flexible IR transparent
silver chloridesilver bromide optical fibers The fiber optic probe interface (AgX 95 mm x
15 m Fiber (Silver Halide)) contains a diamond tip-DiComp ATR crystal The resolution was
[67]
Seton Hall University
set to 8 wavenumbers The optical range used by the system is 1900 cm- I to 650 cm- I The
gain adjustment was set to normal (1 x) and the apodization method was set to Happ-Genzel47
The system uses compressed air (house air filtered and dehumified) to purge the optics
HYDROLYSIS USING ASPIRIN TABLETS
For the hydrolysis of aspirin tablet experiments data treatment was carried out using the
following methodology The data were first subjected to baseline correction An absorption
band at 1202 cm- l (1202-1198 cm- I) was selected for acetylsalicylic acid The peak area was
calculated using a two-point baseline correction set at 1180 cm- l and 1203 cm- I The ATR-IR
system was configured to collect spectra every two minutes
For this experiment data processing is critical to obtain well-resolved spectra Here is how
the data is processed First the peak of interest was identified (1202 cm- I) and the area was
calculated using a two-point baseline correction Next a trend analysis was performed using
the iCIR software on this peak This provided a plot of absorbance vs time This plot was
subjected to smoothing using a 25 point smoothing parameter After smoothing and while
still in the trend analysis the baseline correct routine was performed Then the data were
exported to Excel Further data processing in Excel involved the subtraction of solvent spectra
from reaction spectra To perform this a 30 min set of spectra at the beginning of the
experiment before aspirin pill was added was selected These spectra were subtracted from
the spectra taken after the pill was dropped to give the final set of data Within the final set of
data the area of the 1202 cm- I peak was calculated at each time point Then plot of area vs
47 Application Note Effect of resolution to vapor phase spectrum ofHCI in the Infrared Spectroscopy Shimadzu Co httpwww2shimadzucomapplicationsftirAppl FTIR HCI-vapor-phase 060 enpdf accessed 25 May 2011
[68]
Seton Hall University
time were performed to give rate information In addition using a calibration curve peak
areas were converted to concentration to provide concentration vs time plots
An absorption band at 1086 cm- (1080-1090 cm-) was selected for salicylic acid The peak
area was calculated using a two-point baseline correction set at 1078 cm- and 1101 cm- The
ATR-IR system was configured to collect spectra every two minutes
Preparation of salicylic acid standards 325 mg of standard salicylic acid was added to a 100
mL volumetric flask and 50 mL of SGF solution was added and the flask was sonicated for 1
min to ensure all solids were dissolved Finally the solution was diluted to 100 mL using
SGF
Preparation of acetylsalicyclic acid standards (in this case there are competing concerns
about the lower solubility of the compound and the need to limit the amount of hydrolysis of
the compound) To decrease time the IR was set-up and background spectra were taken prior
to preparing the standard solution Acetylsalicyclic acid (325 mg) was added to a 100 mL
volumetric followed by 75 mL of SGF The flask was sonicated for 10 - 15 to effect complete
dissolution of the solids diluted to 100 mL with SGF
HYDROLYSIS USING ASPIRIN POWDER
For the hydrolysis of aspirin powder experiments data treatment was carried out using the
procedure described above An absorption band at 1202 cm- (1202-1198 cm-) was selected
for acetylsalicylic acid The peak area was calculated using a two-point baseline correction
set at 1180 cm- and 1203 cm- The ATR-IR system was configured to collect spectra every
two minutes
[69]
Seton Hall University
An absorption band at 1086 cm- I (1080-1090 cm- I) was selected for salicylic acid The peak
area was calculated using a two-point baseline correction set at 1078 cm- I and 1101 cm- I The
ATR-IR system was configured to collect spectra every two minutes
For all ATR-IR experiments 256 scans were collected and co-added for each spectral point
On average every spectral point took about two-minutes to complete For all testing the
calculated peak response was subjected to mathematical smoothing using the ielO software
The data were compared to reference standards measurements collected prior to start of the
linearity and dissolution experiments
Preparation of salicylic acid standards 325 mg of standard salicylic acid was added to a 100
mL volumetric flask and 50 mL of SGF solution was added and the flask was sonicated for I
min to ensure all solids were dissolved Finally the solution was diluted to 100 mL using
SGF
Preparation of acetylsalicyclic acid standards (in this case there are competing concerns
about the lower solubility of the compound and the need to limit the amount of hydrolysis of
the compound) To decrease the preparation time the IR was set-up and background spectra
were taken prior to preparing the standard solution Acetylsalicyclic acid (325 mg) was added
to a 100 mL volumetric followed by 75 mL of SGF The flask was sonicated for 10 - 15 to
effect complete dissolution of the solids diluted to 100 mL with SGF
All dissolution experiments were allowed to equilibrate in the buffer for at least half an hour
prior to the start of a dissolution experiment Dissolution data were collected and plots of
percent () dissolved vs time were made
[70]
Seton Hall University
33 Results and discussion
331 Hydrolysis of aspirin to salicylic acid in test tubes
Prior to starting the hydrolysis experiments a qualitative measurement was investigated for
determining the presence of salicylic acid in solution As discussed earlier acetylsalicylic acid
hydrolyzes to salicylic acid in the presence of an acidic medium Ferric chloride was found to
be a good qualitative test for salicylic acid Ferric chloride or iron (III) chloride will not react
with aspirin It will however react with salicylic acid which is used to synthesize aspirin and
is also the hydrolysis product of aspirin Moreover the formation of an iron-phenol complex
will occur48 Thus adding an aqueous ferric chloride solution to a sample of aspirin is a good
way to see if there is any salicylic acid present and a purple color is an indication of salicylic
acid A sample of pure aspirin should not exhibit any color change The ferric chloride color
test is shown in Figure 3-4
48 Cha K Park K Determination of iron (III) with salicy lic acid by fluorescence quenching method Talanta 199846(6)1567-1571
[71]
Seton Hall University
Figure 3-4 Ferric chloride color test- control samples
Acetyl- Fe (III Conto pH aaUcytiC SalICyliC ChIonde
Prior to addition Acidof 1 Fe (III) 6A
aIotIde SoIudon AcetylsalICylIC IIe1d
1OmlnU1eS
CHJCOOH
Time 68 bull
SalICyliC IIIcId
2 minutes Formation of an iron-phenol complex ith Fe(III) gins a
definite purple color
12 SOF Acid IIe1Cl SOtuUon
[72]
Seton Hall University
Table 3-2 Ferric chloride color test concentrations
Experiment number Weight of Aspirin (mg) Weight of Salicylic Acid (mg)
1 321 334
2 339 337
3 317 351
Average weight (mg) 326 341
Volume offlask(s) (ml) 100 100
Average Concentration (mgml) 33 34 I
Table 3-3 Ferric chloride color test observations [added 2mg Iml Fe (III) solution]
Acetylsalicylic acid Time (min) CONTROL Sample (SGF) Sample Salicylic Acid Sample
r omin
1 min
Clear (~o color change)
Clear (no color change)
Clear (no color change)
Clear (no color change)
Dark purple
Dark purple
2 min Clear (no color change) Light purple Dark purple
5min L--------
Clear (no color change) Dar~ purple D(3rk purple
[73]
Seton Hall University
332 Hydrolysis of aspirin to salicylic acid using aspirin tablet as the starting ingredient
The hydrolysis of acetylsalicylic acid (aspirin) tablets was carried out in pH 12 SGF
solutions The solutions were preheated to body temperature 37degC and the ATR-IR fiber
optic probe collected baseline spectra (blank medium) for the first 30 minutes A single 325
mg Bayer aspirin tablet was dropped into the vessel containing 100 mL of pH 12 solution
Standard spectra of pure acetylsalicylic acid (aspirin) and salicylic acid were collected prior to
running the dissolutions These standards were used to identify the unique peaks of interests
for these active drugs and for calculating absorbance intensities to concentration As shown in
IFigure 3-5 aspirin has a unique band at ] 202 cm- I while salicylic acid has one at 1086 cm-
Dissolution plots for aspirin and salicylic acid hydrosylate were made Refer to Figure 3-6
which plots the concentration of acetylsalicylic acid vs time and salicylic acid hydrosylate vs
time This plot shows the formation and elimination of acetylsalicylic acid Moreover the
acetylsalicylic acid hydrolyzed completely to form salicylic acid as shown in the plot The
presence of salicylic acid is detected by the IR system and plotted on a secondary axis as
shown in Figure 3-6 In addition the ferric chloride color test was used to visually inspect the
presence or absence of salicylic acid The ferric chloride solution was added to the aspirin
tablet dissolution vessel after sixty minutes The solution within the vessel quickly turned to a
purple color as shown in Figure 3-7
[741
Seton Hall University
Figure 3-5 Waterfall plot of aspirin tablet dissolution
This is a waterfall plot for the dissolution of 325 mg aspirin tablet in SGF As seen in the figure there are two peaks of interest one at ~1086 cm-1 and one at ~1205 em-I These
represent salicylic acid and aspirin respectively The purple color in the figure represents higher intensities while the blue green represent lower intensities or concentrations As seen in the figure aspirin increases with time and then disappears while salicylic acid increases with time
1086 (Salicylk Acid
1205 [Acetylsalicylic Acid (Aspirin)]
Wavenumber lem-1
[75]
Seton Hall University
Figure 3-6 Hydrolysis of Aspirin Tablets (325 mg) in pH 12 SGF Solution (n=2)
l 24 (1lH n DiuDI_eeI)
l()
L 18 _ 14
16 i
e 12 14 II 10 12 bull0
010 11 CI
~ 8 8 ~
6 ------r~~~~--I i 6 i
4 4
2 ~-------------------------~~
I ~~----------__~~~2(0+) 0 0- 0 (0
00000 00546 01131 01717 02302 02848 03434 04019 04605 05150 05736 10322
11me (hmmss)
Figure 3-7 Ferric chloride color test for salicylic acid (tablet dissolution)
Dissolution Vessel Ferric Chloride Test Results
r======-------- -------=~~~~~-I -AcetylsalicylicAcid
_SalicyliC ACid
16
~-------~r---~----~~------------------------~
~------~r---------- ----------~~
Phenol PresentTime 0 minutes Time = 60 minutes
[76]
Seton Hall University
333 Hydrolysis of aspirin to salicylic acid using aspirin powder as the starting ingredient
It was equally important to understand the rate of hydrolysis of aspirin in powder form Since
the hydrolysis of aspirin in a tablet depends on the dissolution of aspirin into solution first the
rate of hydrolysis of pure aspirin powder should be relatively quicker because all particles are
immediate exposed to the dissolving medium In fact the rate limiting step in this case would
be the dissolution of the particles into the acidic medium As a result the hydrolysis of aspirin
to salicylic acid was monitored and measured using pure aspirin powder Known amounts
equivalent to the amount found in a tablet were placed in the dissolution vessels containing
an acid solution (PH 12 SOF) and the dissolution profiles were collected using A TR-IR
spectroscopy Figure 3-8 shows the dissolution profiles of aspirin and salicylic acid using
aspirin powder In addition the figure clearly shows the formation and then elimination of
acetylsalicylic acid in solution (black line) and the simultaneous formation of salicylic acid
hydrosylate in solution (red line)
[77]
Seton Hall University
Figure 3-8 Hydrolysis of acetylsalicylic acid powder to salicylic acid hydrosylate in pH 12 solution
240
220 ~
200 - ~
~Aspirin Powler [mM180
~ -5alicyli Acid Hydrosylatefrom Powder [mM160 Iri ~ 140e 120
~ ~ ~ j
100
~~ 80 shy Ll -r~
60
40 20
00 ~ ~
010 020 030 040 050 100 110 120 130 140
Time (hmm)
[78]
Seton Hall University
334 Hydrolysis data comparison between tablet and powder formulations
Figure 3-9 compares the IR dissolution profiles of the salicylic acid component in powder
and tablet form As expected the rate of dissolution and hence hydrolysis of salicylic acid is
faster in the powder form The tablet formulation has to undergo wetting disintegration and
deaggregation which take time Similarly Figure 3-10 compares the IR dissolution profiles of
the aspirin component in powder and tablet form As expected the rate of dissolution of
aspirin is faster in the powder form For the tablets in each case there is an initial
mechanical lag associate with the physical breakdown of the tablet However in the case of
the experiments with the powders there no mechanical lag and dissolution occurs
immediately However with powdered acetylsalicylic acid there is an interesting bimodal
behavior Initially an immediate fast dissolution is observed and a secondary process is also
observed at a slower rate as the dissolution occurs Refer to Figure 3-8 The initial rapid
dissolution likely occurs from particles that are well wetted in the initial exposure to the
dissolution medium However aggregation of the powder was also observed suggesting that
some of the acetylsalicylic acid particles were not wetted The dissolution of these aggregates
is associated with the slower dissolution process In addition the aspirin powder was used as
is from the reagent container therefore the powder was inhomogeneous consisting of differ
particle sizes with small and large crystal It is likely that the larger particles and crystals
contribute to the secondary dissolution process However that this process is not observed
with salicylic acid (see Figure 3-9) is reasonable first because salicylic acid is more
hydrophilic than acetylsalicylic acid and second because salicylic acid dissolves at a faster
rate leaving less time for aggregation to occur
[791
Seton Hall University
To develop an overall understanding of the dissolutionlhydrolysis processes that occur with
aspirin a composite plot was prepared (Figure 3-11) In this plot the dissolutions of aspirin
powder and tablet and the hydrolysis of aspirin powder and tablet to form the salicylic acid
hydrosylate are shown The solid blue-line (aspirin powder) and the dotted red-line (aspirin
tablet) compare the IR dissolution profiles of the aspirin component in powder and tablet form
respectively As expected the rate of dissolution of aspirin is faster in the powder form For
the tablets in each case there is an initial mechanical lag associate with the physical
breakdown of the tablet However in the case of the experiments with the powders there no
mechanical lag and dissolution occurs immediately This plot also compares the release
profiles of the salicylic acid hydrosylate in tablet (dotted green-line) and powder formulation
(solid black line) Again for the tablet there is an initial mechanical lag associated with the
physical breakdown of the tablet Also the hydrolysis of aspirin in the powder formulation
appears to be quite rapid Moreover the plot shows this phenomenon occurring prior to the
dissolution of the powder aspirin Currently the dissolution profiles were run at 100 rpm with
a collection rate of two-minutes A higher agitation speed and faster acquisition time (ie
every 1 minute) should synchronize the dissolution of the aspirin and then the release of the
salicylic acid hydrosylate in the powder formulation
[80)
Seton Hall University
Figure 3-9 Release profile of Salicylic Acid (SA) during hydrolysis in SGF (pH12) powder vs tablet
240
220
200
180
~ 160
140 g 120
~ 100
r I
lt 80
60
40
~ A -~~-f
J-f_~~
-L~f P
)1 J r
6 I
9 __Salicylic Acid Hyd rosylate from POlld e r [mMJ t-shy -0-Salicylic Acid Hydrosylate from Tablet [mM]
24
II
20
18
16
14
11
10
8
6
4
20
00
f-shy
(~ 2
0
i
ltaI 1i 2 lt I
000 010 020 030 040 050 100 110 120 130
lime (hmm)
[81]
Seton Hall University
Figure 3-10 Release profile of acetylsalicylic acid (aspirin) during hydrolysis powder vs tablet
Hydrolysis of Acetylsalicylic acid in SGF (pH 12) Release profile of Acetysalicylic Acid Powder VS Tablet
180 18
160 16
140 14
120 --Aspirin Powder [mM] ~ I 12yenC 100C _-cJ-__A~sp_irin~T_a_bl_et_[m_M_)-JI 10=
~
-i -
Il 80 -f----t---~~--~~~~~----------------~L 8 i= lshy 6 e -It 60
Q-lt 11
4 ltt40
20 ~~~---------------~~---------~------------~ 2
00
010 020 030 040 050 100 110 120 130 140
Time (hmm)
[82]
Seton Hall University
Figure 3-11 Release profile of acetylsalicylic acid (aspirin) and salicylic acid hydrosylate during hydrolysis powder vs tablet
240 -~---)
ii-- - --
-IJ--~ __ -Piin Powder [mM
~ - Saliylic Arid Hydrosvate from POW4f [mM
Ir ~ ~ - -lt__ Salicylic Acid HYmiddotdrosyltampfrom Tablet ImM
li -0- ~pirin tablot [m
O u~
24 220
II 200
20 180
18 160
16 ii i140 14 s b 120 12
c-= jI 100 10 ~r ~if -80 r 8- - ~60 6 ~ n 40 4f 20 2n4
-0---0- shy00 0~~ - ~
000 010 020 030 040 050 100 110 120 130 140
lime (hmm)
[831
Seton Hall University
335 Kinetic rates observed during hydrolysis experimentation
The kinetic rates were also determined for the experiments discussed earlier The rates were
determined using the slopes of the dissolution plots The rates were compared to literature
research49 and were found to be equivalent within experimental error In fact the literature
data shows the rate of hydrolysis of aspirin under acid medium varies from 091 min- to 174
min- I depending on the pH and temperature of the solution Refer to Table 3-4 for details
According to Habib and co-workers the hydrolysis rate of aspirin was found to be 091 min-
at pH 10 and 30degC Choudhury and co-workers reported the hydrolysis rate as 174 min-I at
pH 13 and 40degC If both literature studies are taken into account and a linear plot is
constructed with rate vs pHtemp the expected rate of hydrolysis at conditions similar to this
research should be 146 min-I Furthermore in this study the hydrolysis of aspirin to salicylic
acid using aTC aspirin tablets in pH 12 SGF and at 37degC was found to be 103 min-I The
hydrolysis of aspirin powder to salicylic acid was found to be 123 min-I
49 a) Habib M1 Rogers IA Kinetics of hydrolysis and stabilization of acetylsalicylic acid in liposome formulations International Journal aPharmaceutics 199844 235-241b) Choudhury S Mitra AK Kinetics of aspirin hydrolysis and stabilization in the presence of 2-hydroxypropyl-B-cyclodextrin Pharmaceutical Research 199310 (1)156-159
[84]
Seton Hall University
Table 3-4 Kinetic rates for hydrolysis of aspirin in acidic medium
Description Kinetics Rate (lIminmiddot1 )
(acetylsalicylic acid= 75 mM) Ref At pH 10 and 30 QC -shyRate of Hydrolys is 091
At pH 13 and 40 QC (acetylsalicylic
Rate of Hydrolysis
I At pH 12 and 37degC (acetylsalicylic acid= 18 mM) (this
work)
I Rate of Dissolution (Tablet) 1
Rate of Hydrolysis (Tablet)
Rate of Dissolution (Powder)
103
159 I
Rate of Hydrolysis (Powder) 123
The rates of the reactions were determined from the dissolution plots Refer to Figure 3- O In
order to calculate the rates using the plot the following procedure was implemented First a
plot of dissolved vs time is obtained Next a straight line is drawn over the area of the
dissolution curve where dissolution starts to occur (middle area in this case) Furthermore the
slope of the curve is obtained and from this the rate of hydrolysis is reported Refer to Figure
3-12 and Figure 3-13
[85]
Seton Hall University
Figure 3-12 Typical calculation plot of rate from dissolution
Below is a schematic diagram illustrating how to calculate the rate
10000 ~----------------------------------------------
0 cu gt0 en en is e
0 ~~~~_______________________________________
Time
Figure 3-13 Rate of dissolution for Aspirin (based on slope of dissolution plot)
Hydrolysis of Aspirin 20
18 2
16E I----------Iy= 16202x -13916
c 14-c W= 09571
-a 12Vi
4
100 c 0 8 to 6c (LI u
4c 0 u
2
0
0 5 10 15 20 25
Time (minutes)
[86]
Seton Hall University
34 Chapter summary
In this chapter it was demonstrated that in-situ infrared spectroscopy is a viable technique for
detecting and measuring the hydrolysis of acetylsalicylic acid (aspirin) in acidic media The
IR system was found to be impressive in its capability of measuring very low concentrations
and was able to distinguish separate components of a mUltiple component hydrolysis system
without requiring manual sampling This versatility is demonstrated by observing the
simultaneous dissolution and then conversion of the acetylsalicylic acid API to salicylic acid
In the tablet formulation the rate of dissolution was found to be 162 min- l based on the initial
slope of the dissolution profile Moreover the hydrolysis rate was found to be 103 min-I
based on the salicylic acid formation and dissolution profiles In the powder formulation the
rate of dissolution was 159 min-I The rate of hydrolysis was found to be 123 min-I As
expected this rate is slightly higher since tablets require an initial period of disintegration and
deaggregation Moreover the rate of hydrolysis of the powder formulation is closer to
Choudhurys finding In the tablet experiment the rate of hydrolysis of aspirin does not
exactly match the rate of hydrolysis from the powder experiment This could be explained by
several reasons First there is competing dissolution within the vessel The tablet has to
undergo disintegration and dissolution prior to hydrolysis occurring Second the stirring rate
was too slow In the powder formulation by the time the active drugs reaches the fiber optic
probe the hydrolysis has already begun This is especially important in the powder form
where there is not competing dissolution of tablet Refer to Figure 3-9 The salicylic acid
hydrosylate was observed before the acetylsalicylic acid from the powder Third the IR
[87]
Seton Hall University
system was allowed to collect spectra every two minutes This should be enhanced to collect
every one minute in order to detect the hydrolysis quicker
This research was possible because of the versatility of ATR-IR system Specifically the
unique fingerprint region of the lR spectra gave detailed information about the release profile
of the drug Conventional methods namely in-situ UV-Vis would only show the release
profile of one component However peak deconvolution software can be used to analyze
aspirin hydrolysis Moreover the hydrolysis and transformation of the drug from one form to
another may be missed with conventional techniques ATR-IR captures those minor details
and displays them in the fingerprint region as shown earlier in the results The unique feature
of this system is that it is able to detect several forms of the same drug In other words it was
able to detect the formation and elimination of a pharmaceutical drug (aspirin) while detecting
the formation of the hydrosylate of the aspirin (salicylic acid) in real-time In addition this
system could be used to study other potential transformations One example might be the
dimerization of acetaminophen as mentioned earlier The novelty with this particular system
is its capability to see drug transformations in solutions while conducting the experiment inshy
situ Since this chapter successfully demonstrates the versatility of this novel application of
ATR-IR spectroscopy indicating that that the method has excellent potential for detailed
studies of the dissolution and hydrolysis kinetics of pro-drug formulations and drugs which
hydrolyze under acidic conditions simulating stomach conditions
[881
Seton Hall University
4 Instrument Development Proposal Solv-IR as an In-Situ ATR-IR Instrument for Solvation Chemistry
This chapter focuses on describing the design and potential application of the Solv-IR
system The Solv-IR system is a new system that combines dissolution technology with
attenuated total reflectance-infrared spectroscopy (ATR-IR) A Major Research
Instrumentation (MRI) grant was recently submitted with the National Science Foundation for
funding of this project The details described below give an overview of the new system as
well describe the specific components of the proposed new system
41 Background
Solvation also sometimes called dissolution is the process of attraction and association of
molecules of a solvent with molecules or ions of a solute As ions dissolve in a solvent they
spread out and become surrounded by solvent molecules By an IUPAC definition solvation
is an interaction ofa solute with the solvent which leads to stabilization of the solute species
in the solution 50 Solvation is also a kinetic process with a thermodynamic conclusion5 Most
instrumentation used to investigate solvation focuses on the thermodynamic conclusion ie
the structure and concentration of the solvated species at equilibrium Dynamic study of
solvation either requires manual sampling or in situ UV-Vis detection which (in spite of
excellent curve fitting software) has limited capability for multi-component analysis and for
species that chemically transform The goal is to construct a new instrument that allows
50 IUPAC Compendium ofChemical Tenninology 2nd ed (the Gold Book) (1997) Online corrected version (2006-) solvation 51 Anslyn E V Dougherty D A Chapter 3 Solutions and Non-Covalent Binding Forces Modern Physical Organic Chemistry University Science California 2006
[89]
Seton Hall University
dynamic measurement of solvation of a chemical substance or chemical mixture with in situ
infrared detection Because of the large number of vibration modes available for many
molecules infrared spectroscopy is much more selective than UV -Vis In addition
characteristics of the IR band can provide information about the mechanism of dissolution
including hydrogen bonding interactions and aggregation of solute molecules52 As discussed
earlier infrared spectroscopy using attenuated total reflectance (A TR) probes is quantitative
thus providing precise measurement of solute concentrations The proposed name for the
instrument is Solv-IR which indicates that it uses infrared technology for investigation of
solution chemistry The target instrument will have several attractive features a) 10-6 M
sensitivity b) chemically robust c) conventional IR spectral range d) precise control of
reaction vessel temperature f) integrated stirring controls g) n=6 solvation vessels to provide
appropriate statistics f) software for instrument control data acquisition and processing The
Solv-IR will prove to be useful in the following scientific applications
bull Solvation of single component species such as homogeneous catalysts53 and substances
with different crystalline morphologies 54
bull Crystallization studies (the reverse of solvation)55
52 The Chemical Physics of Solvation Part B Spectroscopy of Solvation R R Dogonadze E Kalman A A Kornyshev J TJlstrup Eds Elsevier The Netherlands 1986 See Chapter I Spectroscopic approaches to the study of ionic solvation G Kabisch E Kalman Chapter 2 Interactions in and structures of ionic solutions and polyelectrolytes Infrared Results G Zundel J Fritsch Chapter 3 Infrared Spectrscopic results on solvate structures in crystals G Zundel J Fritsch 53 Studies of catalyst dissolution a) Sun YK Le Blond C R Wang J Blackmond D G Laquidara J Sowa J R Observation of a [RuCI2laquo(S )-( -)-tol-binap )]2aN(C2H5)3-Catalyzed Isomerization-Hydrogenation Network Journal American Chemical Society 1995 117 12647 b) Shaw J Chen YS Fulton J Linehan J Gutowska A Bitterwolf T Structural evolution of a recoverable rhodium hydrogenation catalyst Journal of Organometallic Chemistry 2008 693 2111-2118 54 a) Acquah c Karunanithi A T Cagnetta M Achenie S L Linear models for prediction of ibuprofen crystal morphology based on hydrogen bonding propensities Sub Fluid Phase Equilibria 2009 277(1) 73-80
[90]
Seton Hall University
bull Studies of chemical and mechanical parameters that effect solvation including
temperature agitation solvent-type pH shape and hardness of the solid56
bull Studies of tablet formulations including chemical effects of co-ingredients57
bull Monitoring of multi-component and controlled release formulations58
bull Solvation rates for components that chemically transform on the solvation time scale59
bull Environmental chemistry for study of dispersants (emulsifier surfactants) for treating
chemical (eg petroleum) spills and other anthropomorphic events60
bull Kinetics of micelle formation61
The above examples represent key applications of IR spectroscopy in the chemistry of
solution however there are many more examples62 Preliminary results have been obtained
b) Chieng N Rades T Aaltonen J An overview of recent studies on the analysis of pharmaceutical polymorphs Journal ofPharmaceutical and Biomedical Analysis In Press (2011) 55 Halasz I Biljan I Novak P Mestrovic E Plavec 1 Mali G Smrecki V Vancik H Crossshydimerization of nitrosobenzenes in solution and in solid state Journal ofMolecular Structure 2009 918( 1-3) 56 Vitha M Carr P W The chemical interpretation and practice of linear solvation energy relationships in chromatography Journal ofChromatography A 2006 1126( 1-2) 143-194 57 a) Van der Weerd 1 Chan K L A Kazarian S G An innovative design of compaction cell for in situ FTshylR imaging of tablet dissolution Vibrational Spectroscopy 200435(1-2)9-13 b) Chan KLA Elkhider N Kazarian SG Spectroscopic Imaging of Compacted Pharmaceutical Tablets Chemical Engineering Research and Design 200583(11) 1303-1310 c) Dressman J J Kramer 1 K Eds Pharmaceutical Dissolution Testing Taylor and Francis Florida 2005 d) Hanson R Gray V Handbook of Dissolution Testing 3rd ed Dissolution Technologies Delaware 2004 58 Van der Weerd J Kazarian SG Combined approach ofFTIR imaging and conventional dissolution tests applied to drug release Controlled Release 2004 98295-305 59 Kokot Burda K Simultaneous determination ofsalicyJic acid and acetylsalicylic acid in aspirin delayedshyrelease tablet formulations by second-derivative UV spectrophotometry Journal ofPharmaceutical and Biomedical Analysis 1998 18871-875 60 a) Fingas M Oil Spill Dispersants A Technical Summary Oil Spill Science and Technology 2011435-582 b) Brandvik J Daling S Optimising oil spill dispersants as a function ofoil type and weathering degree a multivariate approach using partial least squares (PLS) Chemometrics and Intelligent Laboratory Systems 1998 42(1-2)73-91 c) Regan F Meaney M Vos JG Maccraith BD Walsh lE Determination of Pesticides in water using ATR-FTIR spectroscopy on PVCchloroparaffin coatings Analytical Chimica Acta 1996 334 85-92 61 Ceraulo L Dormond E Mele A Turco Liveri V FT-IR and nuclear overhauser enhancement study ofthe state of urea confined in AOT-reversed micelles Colloids and Surfaces A Physicochemical and Engineering Aspects 2003 218(1-3)255-264
[91]
Seton Hall University
for the above examples with an asterisk () using a single probevessel prototype63 However
all of the above examples are important to chemists and the Solv-IR instrument will provide
fundamental and practical insight into these processes
42 Broader impacts from the proposed activities
The activities described in this project have several characteristics that are likely to have a
broad impact on our nations scientific infrastructure and perhaps provide economic
opportunities Thus the broader impacts from the proposed activities are described here
bull First there is substantial evidence that the proposed Solv-IR will be commercially viable
Investigation of solvation chemistry of single compounds or mixtures ensures that
compounds are accurately delivered or dispersed at desired concentration and time In the
US alone there are at least nine companies that sell solvation units (basic Hanson Varian
Sotax Logan Distek robotic Zymark UV-Vis monitoring Pion C-Technologies Leap
Technologies) and retail prices range from $20 K for basic units $100 K for UV-Vis
equipped units and $250 K for robotically controlled units The total market capital of this
industry is estimated to be $500 M USD
bull Second the Solv-IR is a potential driver to a field of research that is hungry for more
information about the chemistry that is occurring inside the reaction vessel
621 Workman Jr Review of Near-Infrared and Infrared Spectroscopy The Handbook ofOrganic Compounds Academic Press California 2001 pp 79-129 63 Kassis A Bhawtankar VM Sowa lR Attenuated total reflection infrared spectroscopy (ATR-IR) as an in situ technique for dissolution studies Journal ofPharmaceutical and Biomedical Analysis 201053269-273
[92]
Seton Hall University
43 Limit of detection (LaD) and limit of quantitation (LOQ) data
Before the instrument design is discussed an overview of limit of detection (LOD) and limit
of quantitation (LOQ) will be made64 The LOD and LOQ levels were calculated for the
existing ATR-IR system coupled with different types of fiber optic probes Three types of
fiber optic probes were tested DiComp probe Flow-Cell probe and K4 probe 65 Differences
between these probes will be discussed below
As per the IUPAC The limit of detection expressed as a concentration or quantity is derived
from the smallest measure that can be detected with reasonable certainty for a given analytical
procedure The limit of detection is the lowest concentration of an analyte that the analytical
process can reliably detect66 The LOD level is calculated from the average of the blank
standard deviation of the blank and a confidence factor67 The limit of quantification refers to
the smallest concentration or the mass which can be quantitatively analyzed with reasonable
reliability by a given procedure There are several techniques available to calculate detection
limits The limit of detection is estimated as three times the standard deviation of the blank
and the limit of quantitation is estimated as ten times the standard deviation of the blank Of
the three fiber optic probes mentioned earlier the DiComp probe is the most useful to
dissolution chemistry The DiComp probe is diamond coated to protect the Zn-Se ATR crystal
from attack by acidic medium Since a lot of the dissolutions are carried out in acidic medium
(pH 1-3) the A TR crystal needs the extra coating to ensure longevity of the probe Based on
64 Venkatasami G Sowa lR A Rapid Acetonitrile-Free HPLC Method for Determination of Melamine in Infant Formula Analytica Chimica Acta 2010665227-230 65 Fiber optic probe specification obtained from httpusmtcomusenhomehtml (accessed May 1 2011) 66 IUPAC Compendium of Chemical Terminology 2nd ed (the Gold Book) (1997) 67 MacDougall DC Warren B Guidelines for Data Acquisition and Data Quality Evaluation in Environmental Chemistry Analytical Chemistry 1980 522242-49
[931
Seton Hall University
the research it was detennined that the LOD and LOQ levels for the DiComp probe were
found to be 17x 10-4 M and 57 x 10-4 M respectively This implies that the LOD level is
002 mgml Refer to Figure 4-l Thus the optics of the ATR-IR system will need to be
enhanced in future research in order to achieve a lower limit of detection level The goal is to
increase the sensitivity so that the system is able to detect one mg of an active drug in a 500
ml vessel volume or 0002 mgml The ratio of placebo to active will play an important role in
the sensitivity and will need to be considered during the analysis
[94J
Seton Hall University
Figure 4-1 Limit of detection of ATR-IR system
Salicylic LOD_linearity for Salicylic Acid (Concentration vs Absorbance Band Intensity) Instrument LOI 002 mgfml Article claim OOlmgfml
00012 -r-------------------------- shy
0001
y- 000861 X + 000005 00008 Fi-O99695
-0 c
ro 00006 4) u c
-e ()
Ugt 00004 ~
00002
y = 00091 x+ 2E05 R2= 09684
o I bull
00000 00200 00400 00600 00800 01000 01200 Concentration (myenmI)
[95]
Seton Hall University
Figure 4-2 Fiber optic probes specifications (ref 65)
middot0I0mDnd ~ beIRMl 23OOcmmiddot 19IiOmt
AgX FlberCondull 16mm eomplll AlR K6 (63 and 95mm options) Condull (K6 Condull) SenHnef (K4 COnduit)
[96]
Seton Hall University
Figure 4-3 Calculated LOD and LOQ values
Description LOO and LOQ Results for iC10 IR System Probes
IR Probe K4 Probe Oi Comp Probe Flow Cell
SIN 2 13 23
LOO (mM) 063 mM 017 mM 010 mM
LOQ (mM) 211 mM 057 mM 033 mM
Probe Picture
[97]
Seton Hall University
Figure 4-4 LODLOQ Sample Calculation Sheet- DiComp Probe Results-1
Wavenumber (cm-1) Replicate 1 Replicate 2 Replicate 3 Replicate 4 Replicate 5 Replicate 6 Replicate 7 Replicate 8 13956576 0200564 0200921 0200813 0201180 0200994 0201616 0200948 0201662 13919259 0199833 0200161 0200107 0200800 0200230 0200833 0200502 0201184 138amp1942 0200339 0200243 0200627 0200778 0200673 0201268 0201548 0201443 13844625shy 0201886 0201437 0202093 0201718 0201690 0202646 0202697 0202794 13807308 0201399 0201482 0201690 0201366 0201696 0202087 0201709 0201777 13769991 0200419 0201039 0200280 O~ 0200860 0200998 0201240 0200636 13732674 0199646 0200064 0199234 0199986 0200016 0199902 0200461 0200062 13695357 0198177 0199447 0199049 0199630 0199701 0198879 0199716 0199766
AREA CALCULATION Wavenumber (cm-1) Replicate 1 Replicate 2 Replicate 3 Replicate 4 Rep~cate 5 Replicate 6 Replicate 7 Replicate 8
13956576 07472 07483 07481 07500 07486 07509 07490 07516 13919259 07468 07471 07475 07493 07478 07503 07502 075012 13881942 0750S 07495 07512 07510 07504 07535 07543 07542 13844625 07525 07518 07534 07Emiddot21 07523 07550 07-46 07-49 13807308 07497 07510 07500 07497 07Emiddot09 07521 07518 07-07 13769991 07463 07484 07454 07472 07480 07480 07495 07474 13732674 07432 07454 07431 07454 07458 07441 07467 07460
AREA 5middot2361 5middot2415 52388 52447 52438 52-38 52561 525131
DiComp Fiber Optic Probe LODLOQ using Salicylic Acid 02100 -Replicate 1
-Replicate 2
bull 02050 -Replicate 3
IS
I 02000
- s-shy -Replicate 4
-ReplicateS- -Replicate 6
01950 -Replicate 7
1365 1370 1375 1380 1385 1390 1395 1400 Replicate 8 Wavenumber (em-l)
[98]
Seton Hall University
Table 4-1 LODLoa Sample Calculation Sheet- DiComp Probe Result-2
Title LODLOQ Calculations Row Number Column A Column B
1 Analyte Salicylic Acid 2 Method LODLOQ 3 Date Nov 27 2010 4 Instrument TiC10 Di Comp Probe 5 Spike 001594 6 Units mglmL 7 Replicate 1 523610 8 Replicate 2 52415 9 Replicate 3 52388 10 Replicate 4 52447 11 Replicate 5 52438 12 Replicate 6 52538 13 Replicate 7 52561 14 Replicate 8 52561 15 Mean 52464 16 Std Dev 00079 17 LOD i 002 mgmL 18 LOQ 008 mgmL
[99]
Seton Hall University
Figure 4-5 LODLOQ Sample Calculation Sheet- Flow Cell Probe Results-1
Wavenumber (cm-1 RepWcate 1 Replicate 2 Replicate 3 Replicate 4 Replicate = Replicate 6 Replicate 7 Replicate 8 12575846 0245674 0245473 0245643 0245271 0245642 0245345 0245116 0245111 12538529 0246221 0245960 0246132 0245975 0246288 0245932 0245688 0245637 12501212 0247103 0246963 0246949 0246986 0247071 0246917 0246626 0246566 12463894 0247688 0247507 0247560 0247482 0247503 0247522 0247236 0247133 12426577 0247831 0247655 0248021 0247722 0247698 0247743 0247524 0247418 1238926 0247866 0247663 0247965 0247818 0247578 0247656 0247371 0247329 12351943 0247832 0247736 0247683 0247606 0247415 0247474 0247249 0247160 12314626 0247600 0247500 0247507 0247469 0247191 0247384 0247184 0246936
AREA CALCULATION Wavenumber (cm-1) Replicate 1 Replicate 2 Replicate 3 Replicate 4 Replicate Replicate 6 Replicate 7 Replicate 8
12575846 09178 09169 09176 09166 09179 09167 09158 09157 12538529 0920~ 09197 09200 09198 09205 09197 09186 09184 12501212 09230 09226 09227 09226 09228 09226 09215 09212 12463894 09244 09239 09247 09240 09240 09241 09231 09228 12426577 09249 09242 09254 09242 09241 09242 09234 09231 1238926 09249 09243 09248 09238 09236 09237 09229 09226
12351943 09244 09240 09240 09235 09229 09233 09225 09220 AREA 64599 64558 64592 64546 64558 64542 64478 64458
FlowCell Probe LOOLOQ using Acetaminophen -Replicate 1
02500 -Replicate 2
-BIe__ -- -Replicate 3~ II 02450 - -Replicate 4i
-Replicate 5
- Replicate 6
1230 1235 1240 1245 1250 1255 1260 -Replicate 7
Replicate 8
02400
Wavenumber (emmiddotl)
[100]
Seton Hall University
44 Instrument design
The proposed instrument is illustrated in Figure 4-7 It has ten overall features which are
grouped into the following units I) Optical Path which includes the source fiber optic cables
A TR crystal and detector II) Six Solvation Vessels including the overhead stirrers reaction
vessels and temperature control and III) Instrumentation Control and data
acquisitionprocessing software The choice of six solvation vessels comes from a statistical
requirement that is frequently found encountered in complicated experiments where
agreement of n=6 experiments is considered to provide a statistically robust analysis68
Although chemists are frequently satisfied with one reproducible yield or agreement of three
measurements of a rate constant applied applications of chemistry frequently require more
rigorous statistics
Some regulatory agencies require statistical agreement of six simultaneous solvation studies
Thus to make the instrument more statistically rigorous and competitive with related
instruments on the market it is important that we use n=6 reaction vessels Also note that a
circular arrangement of the solvation vessels is proposed as this design is takes up less space
relative to a linear or block arrangement
We will assemble our new instrument from commercially available components Thus our
main role will be to select the most appropriate components to make sure that they properly
communicate and have reliable computer software for instrument control data acquisition and
processing Our target specifications are
68 a) Wilson E B An Introduction to Scientific Research Dover Press New Jersey 1991 b) Dumont M L Berry M R Nickerson B Probability of passing dissolution acceptance criteria for an immediate release tablet Journal ofPharmaceutical and Biomedical Analysis 2007 44(1) 79-84
[101]
Seton Hall University
1) Sensitivity (as defined as limit of detection where signal noise ratio = 3 1) lt 10-6 M
2) Sample time lt 1 min per solvation vessel
3) Wavelength range 4000 - 500 cm- I
4) Temperature control lt +- 050 C and range -20 to 1000 C
5) Chemical stability aqueous solvent conditions (pH 1 - 12) common organic solvents
and tested for safe use of volatile organic solvents such as diethyl ether when used in a
fume hood
6) Although this is a scientific proposal we desire that the instrument will be marketable
thus we will aim for a retail cost of $200 K
[102]
Seton Hall University
Figure 4-6 Diagram of proposed Solv-IR Instrument
A diagram of the proposed instrument is shown below
DissolU1lon 88th New Circular oslgn co ensure conslll8nC
heating
Input multiplelCOr
Separation plate Dissolution Bath yens
IR System
ATR Cryllal
Outputb8am
Input beam
Detector
[103]
Seton Hall University
45 System components
451 Radiation source
This is an encased source for IR radiation consisting of an IR element and Zn-Se lens A
suitable unit is available from Oriel Apex Infrared Source Model 66471 (7 H x 12 W x 10
D)
452 Interferometer
This is necessary to modify the source IR light to a broad range of frequencies
Interferometers provide for rapid acquisition and signal averaging Potential vendors include
BrukerOptics However an interesting alternative for initial investigations will be to salvage
components from a surplus IR (we have two units in disrepair in our department with
interferometers)
453 Two Six-device Multiplexors
These devices channel the light from the source so that the maximum amount of light passes
through each vessel and then directs the absorbed light to the detector They are sequential
devices such that inputoutput light spends a defined amount of time at each vessel
454 Six A TR Probes
Each probe consists of an input fiber optic cable an A TR crystal and an output fiber optic
cable The cables are chalcogenide fibers that perform well in the mid-IR range and are
sufficiently flexible so they can be arranged within the instrument and connected to the A TR
[104]
Seton Hall University
crystal Potential suppliers are also RoMack Corp and Hellma Scientific The A TR crystal is
a Zn-Se crystal will provide the desired spectral window (4000 500 cm-) however since
Zn-Se is sensitive to acids and easily abrased we will identify a suitable coating So far the
best choice is a diamond coated Zn-Se crystal which provides excellent chemical stability
The narrower spectral range 1900 - 600 cm- is a satisfactory compromise because the
fingerprint region frequently provides an excellent array of absorption bands Pike
Technologies provides an excellent selection of A TR and coated A TR crystals
455 Detector
The goal is to obtain a single detector sensitive to 10-6 M Currently the most sensitive
detectors are liquid nitrogen-cooled HgCdTe (MCT) detectors However if technology
advances we hope to incorporate a sensitive ambient temperature detector such as Peltiershy
stabilized DTGS (deuterated triglycine sulfate) detector Commercial vendors include
BrukerOptics
456 Six Solvation Vessels
Preliminary work can be performed on glass 1 L vessels that we have in stock We will need
to hire a glass blower (ChemGlass Vineland NJ) to modify each vessel with a rectangular
fitting capable of holding rhombohedral ATR crystal as shown in Figure 4-7
[105]
Seton Hall University
Figure 4-7 Sketch of ATR crystal embedded in the side wall of the 1 L glass vessel The area directly under the stir shaft is known to have poor mixing and as indicated by the term dead zone
------------shy
I
I - _--------
Solvent ~~ Glass-metallevel connection
crystal~ATR
dead-zone
[106]
Seton Hall University
Alternatively polyethylene and fluoropolymer vessels are available which will be easier to
modify especially in prototypes Quality Lab Accessories (QLA) provides an excellent
catalog of glass and polymer vessels caps and stir shafts Controlled overhead stirring is
performed by a simple gear assembly (Figure 4-8)
Temperature control will be provided by assembling a water bath around the solvation
vessels However and ideal alternative is provide a thermally-conductive jacket around each
vessel with which temperature is controlled (for example see Disteks Evolution 6100
Bathless apparatus69
69 Evolution 6100 Distek Bathless Dissolution Testing Equipment Distek Home Page [Online] htlpiwwwdistekinccomlproductsdissolutionevolution6100htm (accessed on January 262011)
[107]
Seton Hall University
Figure 4-8 Top plate of constant rpm stirring assembly showing motor main gear and minor gears which drive the stir shafts in each vessel
Controlled rpm Motor
Minor gear drives stir shaft
4f-----j---- Main gear driven by motor
[108]
Seton Hall University
46 Instrument Controll Acquisitionl Processing
Software packages to perform these operations have been well-designed by a number of
vendors we will seek an opportunity to license their software and hire a consultant to modify
the software package
47 Anticipated technical difficulties
1 It may be difficult to match items from different vendors Solution try to use one or
two primary vendors For example BrukerOptics has MATRIX and TENSOR IR
spectrophotometers which allow multiple A TR probe attachments If either of these meet
sensitivity requirements then it would be best to build the Solv-IR from one of these units A
quote for the MATRIX-MF instrument including spectrophotometer ATR-probes and
software has been obtained to support this approach
ii It may be difficult to achieve sensitivity within a reasonable time frame if all six
vessels are to be measured with one spectrophotometer Solution assemble an apparatus with
two or three spectrophotometers
111 It may be difficult to achieve sensitivity with a vessels are to be measured with one
spectrophotometer Solution assemble an apparatus with two or three spectrophotometers
48 Chapter summary
The preliminary studies in Chapters 2 and 3 indicate great potential for use of the Solv-IR
instrument in pharmaceutical chemistry especially to study dissolution of pharmaceutical
formulations Chapter 5 will address a potential application of this instrument in the study of
the chemistry behind oil spills [109]
Seton Hall University
This instrument development proposal aims to construct a new type of instrument that will
allow the study of solvation of solutes in aqueous and organic systems The main feature of
the instrument design is the use of infrared (IR) spectroscopy to study this dynamic behavior
Traditionally IR is not considered to be a quantitative technique However using A TR
crystals ensures that the technique is most certainly quantitative Also IR is traditionally not
considered to be a sensitive method however our preliminary results indicate detection limits
of 10-4 M Employing better optics and detection will improve sensitivity to our target value
of 10-6 M The instrument has an additional feature which may seem strange to most chemists
as it will have six reaction vessels This feature is important for statistical reasons and for
marketing reasons Solvation is a chemically and mechanically complex process To ensure
accurate studies of the solvation process it is important to have a large array of data such that
statistically significant interpretations can be made In addition competing instruments that
use UV-Vis technology have six reaction vessels so they conform to certain regulatory
requirements
We propose to assemble the instrument using commercially available components We will
build to spectroscopic part of the instrument starting with this unit In addition we feel that
we work with their data acquisition software to incorporate instrument control and data
processing Finally we will construct the reaction vessels stirring function and thermal
control and integrate this unit with the spectroscopy unit to have a fully functioning integrated
Solv-IR instrument
Students working on this project will obtain valuable experience on working with electrical
optical and mechanical parts and tools which is quite rare for a chemistry student However
[110]
Seton Hall University
since this is all focused on discovering new ways to study the fundamental and practical
aspects of solvation chemistry this will be an exciting and worthwhile challenge While
assembling the instrument students will be able to investigate chemical phenomenon in a way
that has been previously inaccessible
[111]
Seton Hall University
5 Analysis of the BP Gulf oil spill by Attenuated Total Reflection-Infrared Spectroscopy and Dissolution
This chapter focuses on describing the scientific research that was conducted on the recent BP
oil spill in the Gulf of Mexico Moreover this research was accomplished using the React-IRI
dissolution system Although the BP oil spill occurred outside of New Orleans Seton Hall
University employed its faculty members students and research facilities toward
understanding this environmental disaster
A general background on the BP oil spill will be provided to gain more understanding of the
subject matter which will be useful when discussing the results later in the chapter The BP
oil spill (also referred to as the Deepwater Horizon oil spill Gulf of Mexico oil spill or
Macondo blowout) is the largest accidental marine oil spill in the history of the industry The
Deepwater Horizon was a nine-year drilling unit that was floating in the Gulf of Mexico
Refer to Figure 5-1 for a photo of Deepwater Horizon before the accident occurred The spill
occurred on April 20 2010 due to an explosion of the Deepwater Horizon This led to a loss
of 49 million barrels of crude oil to the ocean As a result the spill caused extensive damage
to the fishing and tourism industries around the Gulf of Mexico
I 1 j
[112]
Seton Hall University
Figure 5-1 Photo of oil rig similar to Deepwater Horizon70
70 Photo obtained from Lauren Michael Ridley during her NOAA trip to Gulf (obtained July 2011) [113]
Seton Hall University
PETROLEUM AND CRUDE OIL
Both crude oil and natural gas are mostly made up of hydrocarbons The lighter hydrocarbons
which include methane ethane propane and butane occur as gases while the heavier
hydrocarbons (Le pentane and higher) occur in the form of liquids or solids The
hydrocarbons in crude oil are mostly alkanes cycloalkanes and several aromatic
hydrocarbons Moreover other organic compounds contain nitrogen oxygen and sulfur and
trace amounts of metals such as iron nickel copper and vanadium
51 Research with React-IR
As part of the multidisciplinary project to understand the effect of the oil spill the React-IR
system coupled to a dissolution system was used to study the dispersion effect of dispersants
on crude oil Dispersants were used to break up the Deepwater Horizon oil spill before it
reached the shore The dispersants are designed to break down the crude oil into tiny drops
which can be mechanically dispersed or consumed by bacteria The aim is to lessen the
impact of giant plumes of crude oil washing onto oyster beds and birds nests and on the
sandy beaches The dispersants or chemicals used in the BP oil spill could also do more
damage than good in the long run The dispersants are toxic in nature and could have
devastating effects on future generations of marine life The financial cost of using these
dispersants could run into the millions Some of the chemicals used in commercial
dispersants71 are shown in Table 5- This information was obtained from the EPA website
71 Environmental Protection Agency Home Page httpwwwepagovbpspilldispersants-qandahtmllist (accessed May 12011)
[114]
Seton Hall University
Specifically the system was used to study dispersion of oil in the presence of dishwashing
soaps as preliminary models for commercial dispersants From these preliminary experiments
the research was able to measure the effect of dispersants on petroleum oil In addition these
preliminary experiments were able to determine the feasibility of the technique in order to
move forward with the project at a larger scale This would include purchasing commercial
dispersants Furthermore Dawnreg dishwashing soap was used because of its powerful claim
to clean wildlife affected by oil spills Dawnreg specifically uses anionic surfactants such as
alkyl dimethyl amine oxide to break down oil samples These surfactants reduce the surface
tension of water and can weaken the barrier that automatically forms between oil and water
allowing them to unnaturally mix
[115]
---__------
Seton Hall University
Table 5-1 Chemicals used in commercial dispersants (COREXIT 9500 and 9527)
CAS Registry Number ~
Chemical Name
57-55-6 12-PvcJiol I
bull 111-76-2 Ethanol 2-butoxy-
577-11-7 Butanedioic acid 2-sulfo- 14-bis(2-ethylhexyl) ester sodium salt (1 1)
1338-43-8 Sorbitan mono-(9Z)-9-octadecenoate
9005-65-6 I
Sorbitan mono-(9Z)-9-octadecenoate poly(oxy-1 2-ethanediyl) derivs
9005-70-3 Sorbitan tri-(9Z)-9-octadecenoate poly(oxy-1 2-ethanediyl) derivs
29911-28-2
64742-47-8
2-Propanol 1-(2-butoxy-1-methylethoxy)shy
Distillates (petroleum) hydrotreated light
This ingredient is present in 9527 but is eliminated in 9500
[116]
Seton Hall University
52 Experimental section
521 Chemical and materials
Crude oil samples were collected by Dr John Sowa and University of New Orleans scientists
from a location near the city of Venice Louisiana Refer to the figures below showing the
locations where the oil samples were collected The University of New Orleans faculty
collected samples from the Gulf of Mexico The location of the samples collected was
determined by GPS at the following location 28deg 53412N 89deg 08780W Methanol
acetone and acetonitrile (HPLC grades) were purchased from Pharmaco-Aaper Dawnreg
Antibacterial and Ultra Joyreg (lemon scent) dishwashing detergent soaps were used as the
dispersants for this research All solutions were prepared using water treated by a MiIli-Q
Millipore purification system All purified water aliquots have resistivity of not less than 18
MOhm-cm-1bull
[117]
Seton Hall University
Figure 5-2 Aerial view72 location of BP Gulf oil samples
72 GoogJe Maps httpmapsgoogiecommapshl=enamptab=wl (accessed May 12011) [118]
Seton Hall University
Figure 5-3 Zoom view location of BP Gulf oil samples [Both samples were
collected near the UNO site]
[119]
c~t-~~middotmiddot=~middot~middotmiddot=-=gt~~~f plume-
- bull bull
bull bull bull bull
bullbull bull bull
bull -----------shy
gas dissolution into water hydrate decompositioo
Seton Hall University
Figure 5-4 Ocean depth diagram73 showing location of BP Gulf oil samples (reproduced and modified from Ref 73)
sea surface bull oil droplets
bull
-neutral buoyancy level
jet
bottom sediment near-field far-field II
73 Figure obtained from httpwwwcrrcunhedufinallYapa2003finallfigure Ijpg (accessed May 2011) [120]
Seton Hall University
522 Instrumentation
Samples were tested using Mettler Toledos iCIO FT-IR system using a fiber optic probe
equipped with a 1 mm diamond coated A TR probe The IR system was operated by Mettler
Toledos iC IR version 30 or 40 software All dissolution experiments were tested using a
Vankel Dissolution Bath (model no 700) All UVNisible testing was carried out using HP
8453 spectrophotometer All analytical weight measurements were carried out using Mettler
Toledos DeltaRange and AG204 DeitaRange
Figure 5-5 Instrument photo A TR-IR and dissolution apparatus
[121]
Seton Hall University
Table 5-2 Experimental details and sample information
No
1 Vessel I
2 Medium Distilled water 1
13 Agitation speed 100 rpm
4 Temperature 25degC
5 Dawnreg Joyreg Dishwashing detergents 02 solutions
6 Dissolution bath VanKel VK700 i
7 ATR-IR Mettler Toledo iC 10
[122]
Seton Hall University
523 Dispersant stock solution
A 02 solution of Dawnreg dishwashing solution was made up (02 mL was added to
approximately 120 mL of distilled water) A 02 solution of Joy dishwashing solution was
made up (2 mL into 1000 mL of distilled water)
5231 Dawnreg ingredients
Water Sodium Lauryl Sulfate Sodium Pareth-23 Sulfate C-12-14-16 Dimethyl Amine
Oxide SD Alcohol Undeceth-9 Propylene Glycol Cyclohexandiamine Polyacetate
Protease Fragrance FDampC blue no phosphate
5232 Joy ingredients
Water Sodium Lauryl Sulfate Sodium Pareth-23 C 12-14-16 Dimethyl Amine Oxide SD
Alcohol 40-B Undeceth-9 PPG-26 Sodium Chloride Cyclohexanediamine Polyacetate
Fragrance FDampC Yellow 5 DampC Red No 33
524 Crude oil sample preparation
The dispersion experiments were carried out by adding different amounts of Dawnreg
dishwashing detergent in vessels containing 900 mL of distilled water and five (5) grams of
semi-solid oil sample Photographs of the oil dispersion studies were collected at different
time points throughout the runs The dispersion experiments were carried out over two hours
[123]
Seton Hall University
525 ATR-IR analysis
The ReactIRTM iC I 0 FTIR instrument is composed of an MCT detector (liquid nitrogen
cooled) and the FiberConduittrade The FiberConduittrade is comprised of flexible IR transparent
silver chloridesilver bromide optical fibers The fiber optic probe interface (AgX 95 mm x
15 m Fiber (Silver Halide)) contains a diamond tip-DiComp ATR crystal The resolution was
set to 8 wavenumbers The optical range used by the system is 1900 cm- I to 650 cm- I The
gain adjustment was set to normal (l x) and the apodization method was set to Happ-Genzel
The system uses compressed air (house air filtered and de-humified) to purge the optics
53 Results
The experiments in this chapter demonstrate how ATR-IR may be used in the study of
treatments of oil spills During the BP oil spill the use of dispersants at the well-head and on
the ocean surface was extremely controversial Thus this research was interested in finding
ways to evaluate this treatment process Although the commercial dispersants were not used
in this research dishwashing soaps were used as preliminary models The results show that it
takes considerable time for the oil to be broken down by the dishwashing soaps Controlled
dissolution experiments were carried out in an attempt to simulate the dispersion of oil as it
occurred during the oil spill The dissolution experiments were tested over the course of
several hours and were held under elevated agitation conditions and at 25degC These
parameters were used in order to simulate the conditions of the ocean water in the Gulf of
Mexico In all of the dispersion experiments a known amount of crude oil was added to the
dissolution vessel Dispersants were then added and the experiments were monitored over
several hours During this time several photos were taken to compare and record the size of
I [1241
Seton Hall University
the crude oil samples Moreover the ATR-IR probe was placed in the vessel as a way to
monitor the release of oil within the vessel as a consequence of dispersant in solution
531 Standards and expected absorption values
Standard spectra of crude petroleum oil were obtained during this phase of the research
Crude oil is expected to have prominent IR bands at 1375 cm- l (due to methyl groups) and
1465 ern-I (due to methylene groups) Refer to Table 5-3 Also blank ocean solutions were
tested to confirm there was no interference at these two FTIR bands As shown in Figure 5-6
below the crude oil samples obtained by Dr Sowa and the faculty of University of New
Orleans show prominent peaks at 1375 and 1465 ern-I Moreover ocean samples obtained
from regions under the surface oil did not show these two bands
[125]
Seton Hall University
Table 5middot3 Expected FTmiddotIR stretching values for crude oil and sulfonated soaps
I Functional
group
I CHz
Absorption (cmi)
1465 cmshyi
Description
Methylene groups have a characteristic bending _
CH3 ~
1375 cmshy1 Methyl groups have a characteristic bending
S0 2
1150-1165 cmshy1 Symmetric stretch
1342-1352 cmshy1 Asymmetric stretch
[126]
I
Seton Hall University
Figure 5middot6 Gulf oil vs blank (ocean water) standard spectra
uo
015
031)
01$
OtO
OtIS
~1466cm1
tl~ II
I ~1376cm1 - __506
-Sullle-~SVi_
-U_lhotlllt
- 5_0
-~----1II1II 710 1101 16S) 11m I 9lO I~ 1400 13iO HOI 12511 12m mil 1100 1050 1000 _ shy
[127]
Seton Hall University
Figure 5-7 Baseline corrected ATR-IR scans of BP oil and Ocean Water samples
09
08
07
-RefSurface OIL -RefVenice OIL 06 rl 05 ~ 04I
03
02
01
0 i
500 800 1100 1400 1700 2000 2300
Wavenumber cm-l
[128]
Seton Hall University
Figure 5-8 Photo of vessels at different time points during the dispersion experiments
Time-10 minutes Time 30 minutes Time- 2 hours
Large clumps formed Large clumps dispersed slightly Smaller clumps observed
[129]
1
Seton Hall University
532 Venice oil samples dispersed using Joy soap
During the first phase of experimentation Joy was used to simulate dispersant
Approximately 50 mL of the Joy stock dispersive solutions were added to different vessels
containing 900 mL of distilled water and five (5) grams of crude oil collected near Venice
Louisiana The final dispersant concentrations compared to the concentration of commercial
dispersants used in the ocean are expected to be higher The temperature was held constant
at 25degC The agitation speed was set to 100 rpm Unfortunately the Joy dispersant solution
contained interference peaks at 1465cm-1 as shown in Figure 5-9 due to the presence of S02
groups in the soap
[130]
Seton Hall University
Figure 5-9 ATR-IR scans of Venice oil and 50 mL of Joy soap
This figure displays A TR-IR spectra of a solution containing distilled water Joy dispersant solution and crude oil collected from Venice LA As seen in the figure there are several peaks observed between 1000 cm- and 1500 cm- These peaks moreover increase with time As discussed earlier the peaks at 1375 cm- and 1465 cm-] are indicative of crude oil These peaks represent the methyl and methylene groups respectively The other peaks at 1050 cm- 1205 cm- and 1254 cm-] were found in the blank solution and were attributed to the
phosphates in Joy
i 1bull
n2lo
inLm III
5 ja
-tntamp53
- tnl53
- oolQ53
- 002144
- 0021153
ooJl53
- tn3453
-tnl53
ooll53
tn41153
1511 1amp1) 1470 1a 1410 1B1 l1Q 1320 lBJ 1260 1211 1200 1170 1140 1110 1181 1(6) VlMUIOer (aliI I
[131J
Seton Hall University
Figure 5-10 ATR-IR scans of 50 mL of Joy soap only (Blank solution)
This figure displays A TR-IR spectra of a solution containing distilled water and Joy
dispersant solution but no crude oil As seen in the figure there are several peaks observed between 1000 em-I and 1500 em-I These peaks moreover increase with time_ The peaks observed at 1050 em-I 1205 em- l and 1254 em-I were attributed to the phosphates in Joy
-ml252
0240 - m1~52 Same peaks observed in the blank
solution 1900 ml distilled water +50 ml -mI452 i of Joy Dispersive solution) - 001652So
-m2252t0
02iD If)
002952
- m46521 II
- m4amp520200 ~ - 00n52
- 01~52
1BJ 1511 1~ 1470 1440 1410 1]1) 1350 1320 12Q 1250 12ll laIl 1170 1140 1110 Hll) H51 1(120 Wmnnt[an-ll
[132]
Seton Hall University
533 Venice oil samples dispersed using Dawnreg soap
Dawnreg dishwashing solution was used during the second phase of the research
Approximately 50 mL of stock dispersive solutions were added to vessels containing 900 mL
of distilled water and 5 grams of Venice oil The final dispersant concentrations compared to
the concentration of commercial dispersants used in the ocean were expected to be higher
This preliminary model although not an exact model of the commercial setting was
considered a worst case scenarIo It was considered worst case because of the higher
concentration of dispersant used in the controlled 900 ml volume setting The temperature
was held constant at 25degC The agitation speed was set to 100 rpm Dawnreg dispersant
solutions did not give interference peaks at 1465cm-1 or extra sulfonate peaks at ~1200cm-l
Therefore Dawnreg dishwashing detergent soap was ultimately used to simulate the properties
of the dispersant
[133]
Seton Hall University
Figure 5-11 ATR-IR scans of Venice oil and 50 mL of Dawnreg soap
This figure displays ATR-IR spectra of a solution containing distilled water Dawnreg dispersant solution and crude oil collected from Venice LA As seen in the figure there are several peaks observed between 1140 cm-I and 1520 em-I These peaks moreover increase with time As discussed earlier the peaks at 1375 cm-I and 1465 cm-I are indicative of crude oil These peaks represent the methyl and methylene groups respectively
[111)
10 min
AbIorbance Peak obaerved around
1465cmmiddot1
Absorbance Peak obIerved around
1376cmmiddot1
121 1~ 1481 lfi1 1440 1aJ 10 1BJ 1l1 1340 1m 1m 12l1 13lJ 1240 123) 1m 1111) llli1J 1140 IIa111U11l1latli
[134]
Seton Hall University
Figure 5-12 ATR-IR scans of 50 mL of Dawnreg soap only (Blank solution)
This figure displays ATR-IR spectra of a solution containing distilled water and Dawnreg dispersant solution but no crude oil
02laquo1
No PHkI as WlS obslfVed with Dawn Dlsptrslv Solution
-mllt52
-ml~52
- 022n52
- 022253
15111) 15Jl lOJ 1470 1440 1410 18) IE lD 129) 1260 1m 1200 1170 1140 1110 1(8) lisJ lit) WIteIIIIUt(cm-ll
[135]
I
Seton Hall University
5331 Percent () dispersant used
An example of the percent of dispersants used during the research is shown in Table 5-4 Table 5-5 and Table 5-6 First the ratio of Dawnreg sample to the vessel volume is displayed in Table 5-4 This is represented as (A) Next the ratio of oil to the vessel volume is displayed This is represented by (B) Last the ratio of (A) to (B) is shown in Table 5-6 which represents the percent dispersant calculated
Table 5-4 Amount of Dawnreg in solution
I Description I Amount
Amount of Dawnreg sample in solution bull 00017
I Total Volume of Dawnreg Solution Added (mL) 54 I
954bull Total Volume in Vessel (mL)
I Ratio of Dawnreg sample vs Volume in Vessel (A) 00001
I
bull Approximately 02 ml of Oawnreg Solution was added to approximately 120 ml of distilled water
Table 5-5 Amount of BP oil in solution
Description Amount
Amount of Oil (Venice Samples) added (grams) 5
Total Volume in Vessel (mL) 954
bull Ratio of Oil Sample vs Volume in Vessel (8) 00052
Table 5-6 Dispersant calculated
Description Amount
Ratio of Dawnreg sample vs Volume in Vessel (A) 00001
Ratio of Oil Sample vs Volume in Vessel (8) I
00052
Dispersant calculated (A 8) 18
[136]
Seton Hall University
Common dishwashing detergent was found to have little affect on the dispersion of crude oil
As discussed earlier dissolution experiments configured with IR spectroscopy were carried
out whereby aliquots of crude oil were subjected to different brands of dishwashing detergent
in order to measure and determine dispersion effect Moreover the dissolution experiments
were carried out under controlled conditions in an attempt to simulate the Gulf waters Also
the type of dispersant used played a major role As shown in the figures earlier Joy and
Dawnreg dishwashing detergents were used during this phase of the research The Joy blanks
solutions (did not contain crude oil) however showed interference peaks at 1170-1270 cml
and 1465 cml These bands were associated to the sulfonate functional groups and methylene
groups respectively Dawnreg blank solutions however did not give interference peaks at
1465cmI or extra sulfonate peaks at -1200 cml Therefore Dawnreg dishwashing detergent
soap was ultimately used to simulate the properties of the dispersant The dispersion results
clearly show that dispersion of crude oil took at least 30 minutes and up to 2 hours
534 Analysis by UV-Vis Spectroscopy
In addition the BP Oil samples were tested by UVNis spectroscopy The objective of this
part of the research was to determine the amount of porphyrins if any in crude oil74
Porphyrins are structurally similar to both chlorophyll and hemoglobin molecules and are
destroyed by oxygen and heat Porphyrins are heterocyclic macromolecules composed of four
modified pyrrole subunits interconnected at their alpha carbon via methine bridges These
molecules are aromatic and highly conjugated systems Porphyrins have very intense
[137]
Seton Hall University
absorption bands in the visible region Porphyrins can also contribute to the formation of
stable oil-in-water emulsions75 which will aid in the dispersion process Chlorophyll for
example contains several intense absorbance maximums in the region between 453 nm and
665 nm Refer to Figure 5-13 for a UVNis spectrum76 of chlorophyll a and b Also refer to
Figure 5-14 and Figure 5-15 for chemical structures of chlorophyll a and b
74 Hsu C S Drinkwater D Gas Chromatography Mass Spectrometry in the Petroleum Industry in Current Practice of Gas Chromatography - Mass Spectrometry W M A Niessen Ed Chromatographic Science Series Vol 86 Dekker New York 2001 Chapter 3 pp 55 - 94 7S Lee Richard Agents which promote and stabilize water-in-oil emulsions Spill Science and Technology Bulletin 1999 5(2) 117-126 76 Figure obtained from Wikipedia [Online] httpenwikipediaorgwikiFileChlorophyll ab spectra2PNG (accessed May 1 2011)
[138]
Seton Hall University
Figure 5-13 Visible spectra of chlorophy a and b77
chlorophyll b chlorophy a
400 500 600 700 Wavelength [nm]
77 Figure obtained from httpenwikipediaorgwikiFileChlorophyll ab spectra2PNG (accessed May 2011) [139]
Seton Hall University
Figure 5-14 Chemical structure of chlorophyll a (Chern Draw)
o
Figure 5-15 Chemical structure of chlorophyll b (Chern Draw)
r M92+-~ II--- N N
o
o I
-
)_N Nshy
~ ~ I p
[140]
Seton Hall University
Figure 5-16 UVNis spectra of BP oil samples in different solvents 1 mm cell spectrophotometer fully covered from outside lighting
No porphyrin peaks were observed for the oil samples collected The only absorbance peaks that were detected were associated to interference from the trees and outside light Refer to the figure below
0012
0009
Interference from outdoor light
0006
6 0
ebull 0003
j 0
4
-0003
-0006
-HPLCWater
-Sottle Water + LID (Repeat)
-Bottled Water + LID
bull- bullbull HPLC Water
0 420 440 460 480 500 520 540 560 5S0
WiMlength (nm)
-Acetone NO lid
-Bottle Water LID (Repeat)
-HPLC Water + Lid
-Acetone + Lid
-Bottle Water LID
-HPLCWater+ LID
-Riser OIL in HPLC Water
[141]
Seton Hall University
54 Chapter summary
A TR-IR has been used to simulate the effects of dispersants used to treat a petroleum spill In
response to concerns about the use of dispersants to fight the petroleum spill in the Gulf of
Mexico this past summer we used ATR-IR to investigate how dispersants work Sample of
the BP oil were exposed to 2 wt of commercial dishwashing soap The studies indicate that
the hydrocarbon components (CH2 bend at 1466 cm- I and CH3 rock at 1345 cm- I) of the
petroleum can be detected in the presence of the soap However it took more than 30 min for
it to take effect This is probably due to time and concentration factors to allow micelles to
form Moreover this is a creative application of the React-IR concept to study the dynamic
behavior of dispersants Millions of dollars were spent on dispersants to alleviate and
eliminate the spread of the BP oil to the natural coast lines The dispersion experiments
demonstrated that even in a controlled and accelerated laboratory environment it still took
several hours for the oil samples to be dispersed Thus one begs to question the effectiveness
if any of the dispersants on the uncontrolled oil spill in the Gulf of Mexico
Efforts to observe the presence of chlorophyll molecules that are potentially present in the
crude oil by UV -Vis spectroscopy were unsuccessful At this time the status of this
investigation is inconclusive as the presence of these molecules in crude oil is well
documented It is possible that concentrations were below detection limits or the chlorophyll
derivatives were insufficiently soluble Although inconclusive these investigations provide a
foundation for future studies
[142]
6
Seton Hall University
Research conclusions
Dissolution studies are critical tests for measuring the performance of a drug product In this
dissertation a new technique in situ attenuated total reflection-infrared spectroscopy (ATRshy
IR) has been developed to monitor dissolutions of pharmaceutical drug formulations Two
over-the-counter (OTC) active drugs (acetaminophen and acetylsalicylic acid) and one
calibrator tablet (salicylic acid) were tested during the research Moreover both single
component and multi-component drug formulations were tested and the individual
components were identified by IR spectroscopy For example individual components of
acetaminophen and acetylsalicylic acid in a caffeine-free formulation of Excedrinreg tablets
were easily distinguished The ATR-IR system was found to have very good sensitivity and
can analyze samples as low as 003 mgmL (2 x 10⁻⁴ M)
In addition the IR system was able to distinguish separate components of a multiple
component system without requiring manual sampling This versatility was also demonstrated
by observing the simultaneous dissolution of acetaminophen and salicylic acid tablets In
contrast UV -Vis spectroscopy may require mathematical corrections to resolve the two active
drugs Furthermore HPLC must be used which requires laborious manual sampling or
purchase of a complicated automated instrument setup of dissolution configured with HPLC
analysis The in situ A TR-IR method has been validated by comparing dissolution profiles
using UV -Vis and HPLC methods In addition an accuracy of plusmn 2 between IR and HPLC
for the salicylic acid results was established With the current configuration of the IR
instrument this analysis is limited by the sensitivity and wavelength range of the in situ fiber
[143]
Seton Hall University
optic probe However since this chapter successfully demonstrates the versatility ofthis novel
application of ATR-IR spectroscopy it is clear that the method has excellent potential to be
improved by modification of the IR instrument and selection of more sensitive probes
Next the system has the capability of monitoring drug transformations during dissolution For
instance the hydrolysis of aspirin to salicylic acid was studied using this technique The
instrument was able to monitor the simultaneous formation and elimination of aspirin while at
the same time monitor the formation of salicylic acid in solution This research was possible
because of the versatility of A TR-IR system Specifically the unique fingerprint region of the
IR spectra gave detailed information about the release profile of the drug Conventional
methods namely in-situ UV-Vis would only show the release profile of one component
However peak deconvolution software can be used to analyze aspirin hydrolysis Moreover
the hydrolysis and transformation of the drug from one form to another may be missed with
conventional techniques ATR-IR captures those minor details and displays them in the
fingerprint region as shown earlier in the results The unique feature of this system is that it is
able to detect several forms of the same drug In other words it was able to detect the
formation and elimination of a pharmaceutical drug (aspirin) while detecting the formation of
the hydrosylate of the aspirin (salicylic acid) in real4ime In addition this system could be
used to study other potential transformations One example might be the dimerization of
acetaminophen as mentioned earlier The novelty with this particular system is its capability
to see drug transformations in solutions while conducting the experiment in-situ
Also this system was used to support the research related to the BP oil spill The A TR-IR
system coupled with dissolution was able evaluate the effect of dishwashing soaps in the
[144]
Seton Hall University
dispersion of crude oil and the results call into question the efficacy of application of
dispersants in certain situations
Lastly a new instrument design was proposed and discussed in this thesis The proposed
system also known as the Solv-IR would be built at Seton Hall University An MRl NSF
grant was recently filed for this proposal The proposal to develop this instrument aims
construct a new type of detection technique that will allow the study of solvation of solutes in
aqueous and organic systems 787980 The proposed unit has great potential for use in studies of
dissolution of drugs and monitoring competing reactions such as hydrolysis of pro-drugs in
pharmaceutical development formulation and quality assurance The proposed instrument
also has application in environmental chemistry especially to study of the fundamental
chemistry and remediation of anthropomorphic events 81 82 83
7S Chen Zeng-Ping Morris Julian Borissova Antonia Khan Shahid Mahmud Tariq Penchev Rado Roberts Kevin On-line monitoring of batch cooling crystallization oforganic compounds using ATR-FTIR spectroscopy coupled with an advanced calibration method Chemometrics and Intelligent Laboratory Systems 20099649-58 79 Wartewig Siegfried Neubert Reinhard Pharmaceutical applications of Mid-IR and Raman spectroscopy Advanced Drug Delivery Reviews 2005 57 1144-1170 80 Kubicki JD Schroeter LM Itoh Ml Nguyem BN Apitz SE Attenuated total reflectance Fouriershytransform infrared spectroscopy of carboxylic acids adsorbed onto mineral surfaces Geochimica et Cosmochimica Acta 1999 63(18) 2709-2725 81 Mas Silvia Juan Anna de Tauler Roma Olivieri Alejandro Escandar Graciela Application of chemometric methods to environmental analysis of organic pollutants A review Talanta 201080 1052-1067 82Varela RF Rodriguez DS Carracedo MP Andrade JM Fernandez Muniategui S Prada D Screening the origin and weathering of oil slicks by attenuated total reflectance mid-IR spectrometry Talanta 200568116-125 83 Varela RF Carracedo MP Rivera PF Andrade JM Muniategui S Prada D Monitoring photooxidation of the Prestiges oil spill by attenuated total reflectance infrared spectroscopy Talanta 200669 409-417
[145]
7
Seton Hall University
Appendix [A] In situ ATR-IR Spectroscopy and Dissolution Data
The chart below is an example of the digitized data that is obtained for the calibration of
salicylic acid using A TR-IR The data corresponds to Figure 2-1 in Chapter 2
Salicylic Acid Linearity Raw Data
l M N 0 P Q R S WlMIflUmber (cm-1) Stdmiddot1 Sld-2 Stdmiddot3 Std-4 Std-5 Std-6 Std-7
2 18994378 0001186 0000446 0000116 0000126 0000327 0000332 -Q00013 3 shy 18957061
18919744 0000956 0001085
0000368 0000601
297E-Q5 0000275
636E-Q5 567E-Q5
-Qoool -HE-05
-28E-Q5 -QOOO21
-Q00048 -Q00061
5 18882427 000135 0000766 0000266 0000206 ~9E-Q5 -Q0001 -Q00035 6 1884511 0001409 0000702 0000398 874E-06 -Q00021 0000126 602E-Q5 7 18807793 0001273 0000655 0000511 717E-06 -Q00016 0000112 0000106 8 18n0476 0001176 0000475 0000361 0000187 385E-Q5 -91E-Q5 0000104 9 18733159 0000934 0000146 middot31E-Q5 -Q00017 528E-Q5 -000037 546E-Q5 10 18695842 0000714 000013 -Q00018 -Q00025 -Q00018 -Q00035 -Q00013 11 18658525 0000853 0000385 0000114 0000137 ~6E-05 -7E-Q5 -Q00018 12 18621208 0000974 0000557 000033 0000109 795E-Q5 -92E-Q5 -Q00014 13 18583891 0001009 0000404 0000217 -000014 -67E-05 -Q00033 -Q00025 14 18546574 0001254 0000447 0000337 0000101 0000163 -98E-Q5 -Q00016 15 18509256 0001315 0000639 000059 0000189 0000494 000038 0000282 16 18471939 0000906 0000532 0000408 0000194 000038 0000376 0000391 17 18434622 0000585 0000351 654E-Q5 0000176 -21E-05 -000017 -41E-Q5 18 18397305 0000589 0000239 759E-Q5 0000164 -Q00012 -Q00024 -Q00028 19 18359988 0000927 000026 00004 0000308 0000295 0000233 0000175 20 18322671 000112 0000365 0000567 0000381 0000366 0000376 0000426 21 18285354 0001019 0000457 0000329 0000243 0000125 0000229 0000222 22 18248037 0000767 0000366 000014 726E-06 594E-Q5 -000013 46E-Q5 23 1821072 0000492 00001 -5E-05 -Q00022 -Q0002 -000044 -Q00026 24 18173403 0000374 -Qoooll -000023 -Q00027 -000034 -000043 -00004 25 18136086 0000341 -46E-Q5 -QOOO19 -7 1E-Q5 -Q00019 -Q0002 -Q0002 26 18098769 0000349 -13E-05 -00002 ~E-06 -Q00023 -000015 -Q00024 27 18061452 0000152 -59E-05 -000019 -32E-Q5 -QOOOll -96E-05 -Q0002 28 18024135 0000112 middot17E-05 -000012 ~E-Q5 551E-Q5 167E-05 -61E-05 29 17986818 0000295 0000206 625E-Q5 522E-Q5 0000209 0000276 0000301 30 17949501 0000326 0000391 0000215 0000247 0000343 0000462 0000572 31 17912184 0000106 928E-Q5 669E-06 -55E-Q5 609E-Q5 569E-05 0000151 32 17874867 0000117 411E-06 -97E-05 -Q0002 -Q00013 -000017 -98E-Q5 33 1783755 0000426 0000234 000014 99E-05 259E-Q5 -5E-05 -22E-Q5 34 17800233 0000404 0000284 0000199 0000391 0000302 0000199 000021 35 17762915 0000371 0000486 0000451 0000764 0000605 0000895 0000987 36 17725598 0000245 0000244 0000312 0000401 0000523 0000637 0000742 37 17688281 388E-05 -74E-05 394E-06 -Q00012 0000101 000011 000013 38 17650964 -63E-05 -21E-05 921E-06 -Q00015 0000165 000013 0000171 39 17613647 -Q00016 -2Emiddot05 -23E-Q5 -95E-Q5 608E-Q5 612E-05 0000174 40 1757633 -Q00019 803E-05 582E-Q5 0000166 0000218 0000284 0000409 41 17539013 -Q00029 0000117 0000191 0000436 0000616 0000827 0000916 42 17501696 -Q00049 -Q00017 982E-06 982E-05 0000345 0000517 0000566 43 17464379 middot000056 -Q00027 -000012 -19E-05 000025 0000287 0000317
i 44 17427062 -Q00051 -86E-05 -35E-Q5 0000333 0000621 0000642 000077 45 17389745 -Q00046 000021 0000433 0000988 0001429 0001708 0002004 46 17352428 -QOOO63 0000101 0000445 0000915 0001478 0001787 0001949 47 17315111 -Q00103 -Q00055 -000038 -Q00015 0000226 000019 0000184 48 17271794 -00011 middot00006 middot000057 -Q00043 -Q0002 -Q0003 -Q00019 49 17240477 -Q00102 -Q00026 ~8E-06 0000193 0000553 000063 0000699 50 172031El -QOOO96 321E-05 0000646 000114 0001678 0002053 0002386 51 17165843 -000101 -Q00022 0000232 0000695 0001058 0001399 000156
[146]
Seton Hall University
Salicylic Acid Linearity Raw Data
87
56 57 56 59 60 61 62 63 64 65 66 67 68 69 70 71 72 73 74 75 76 77
78 79 80 81 82 83 84 85
186
90 91 92
93 94 95 96 97 98 99 100 101 102
l 17128526 17091209 17053892 17016574 16979257 1694194 16904623 16867306 16829989 16792672 16755355 16718036 16680721 16643404 16606087 1656877 16531453 16494136 16456819 16419502 16382185 16344868 16307551 16270234 16232916 16195599 16158282 16120965 16083648 16046331 16009014 15971697 1593438 15897063 15859746 15822429 15785112 15747795 15710478 15673161 15635844 15598527 1556121 15523893 15486575 15449258 15411941 15374624 15337307 1529999
15262673
M -(loo135 -000169 -000158 -000137 -0_00151 -000179 -000172 -000149 -000136 -0_00103 -000058 -000026 -000024 -18E-05 0000598 0001461 0002052 0002549 0002871 0003484 0004217 0004913 0005507 0005408 0005116 0004863 0004013 0003593 0003529 0003243 0003843 0004418 000446
0004379 0_004226 0004503 000481 0004666 0004259 0003809 0003742 0003015 0_002047 0001426 0000831 0000738 0000631 189E-05 -000042 -000041 -000028
N -000057 -000061 -000028 -64E-05 -000049 -000087 -000044 636E-05 -000022 -000018 0000105 000024
0000271 0000317 0000614 0001521 0001872 0002015 0001834 0001966 0002804 0003363 0003671 0003017 000253 0002607 0002211 0002006 0001883 0001683 0001906 0002021 0002019 0002145 0001989 0002447 0002972 0002667 000225 0002204 0002966 0002666 0001626 0000998 0000796 0001292 000126
0000407 -87E-05 16E-05
0000454
0 -000028 -00004
0000105 0000622 0000211 -000035 0000117 0000642 0000184 0000147 0000503 0000747 0000683 0000337 0000603 0001783 0001991 0001953 0001371 0001583 0002488 0002566 0002571 0002313 0002077 0002114 0001505 0001433 0001704 0001429 0001293 0001197 0001239 0001421 0001427 0002033 0002495 0002121 0001758 0001733 0002804 0002645 0001474 0000854 0000863 0001712 0001695 0000636 667E-05 0000245 0000897
P -84E-05 -89E-05 0000678 0001256 0000605 -00003
0000371 0001131 0000488 0000437 0_000868 0001202 0001076 0000815 0001152 0002499 0002544 0002269 0001695 0001557 0002059 0002168 0002323 00019
0001755 0002018 0001531 0001264 0001158 0000724 0000651 0000801 0000974 0001154 0001185 0001804 0002395 0001997 0001532 0001662 000323
0003158 0001614 0000824 000107 0002334 0002244 000103
0000373 0000508 0001294
Q R S 0000218 0000394 0000496 0000276 OJ)()0494 0000667 0001315 0001761 0002152 0002196 0002715 0003221 0001399 0001807 000208 0000253 000053 0000575 0001154 0001581 0001793 0002001 0002561 0002855 000093 0001237 0001419
0000719 0001093 00014 0001316 0001638 0001966 0001627 0001811 0001981 0001491 0001617 0001777 0001329 0001406 000168 0001739 0002054 000221 0003535 0004215 0004565 0003286 0003881 000432 0002765 0003057 0003508 0002215 0002284 000251 0001868 0001993 0002262 0002582 0002784 0003125 0002763 00025 000276 0002625 0002211 0002611 0002059 0001872 0002161 0002031 0001956 0002238
00023 0002298 0002563 0001478 0001332 0001496 000118 0001062 0001137 0001232 000126 0001033 0000871 0000978 000065 0000812 0000723 00006 0000832 0000642 0000628 0000834 0000778 0000709 0001034 0000973 0000692 0001046 0000976 0000783 0001956 0001973 0002109 0002826 0002929 0003247 000223 0002352 0002464 000166 0001823 0001755 000187 0002077 0002042 000381 0004369 0004606
0003769 0004346 0004669 0001894 000218 0002324 0000991 000114 0001238 0001416 0001524 0001795 0003066 0003471 0003976 0003061 0003621 0003955 0001535 0001916 0001958 0000723 0000964 0000992 0001002 0001193 0001353 0002015 0002362 0002688
[147]
------------- -
Seton Hall University
Salicylic Acid Linearity Raw Data
104 105 106 101 108 109 110 111 11
6 117 118 119 120 121 122
121 128 129 130 131 132 133 134 135 136 137 138 139 140 141 142 14
145 146 147 148 149 150 15 152 153
L N 0 P a R S 15225356 15188039 15150122 15113405 15016088 15038111 15001454 14964131 1492682 14889503 14852186 14814869 14777552 14740234 14702917 146656
14628283 14590966 14553649 14516332 14419015 14441698 14404381 14361064 14329147 1429243
14255113 14211796 14180479 14143162 14105845 14068528 14031211 13993894 13956576 13919259 13881942 13844625 13801308 13169991 13132614 13695357 1365804 13620723 13583406 13546089 13508112 13471455 13434138 13396821 13359504
-000061 -000012 -000043 -000021 -00001
0000916 0003351 0006785 0001163 0004093 0001505 0000584 0000399 0000651 0002111 0006014 0006588 0003853 0001528 0000208 -000029 -000025 -000035 middot000039 -000031 -000023 944E-05 0000413 0000783 0001229 0001582 000238 000411 000123
0010625 0011517 0009322 0006639 0004745 0003576 0002964 0002925 000319
0003132 0003297 0003966 0004446 0004486 0004391 0003976
11 -000012 -000024 0000349 0000441 0000149 0000788 0001924 0003629
00031 0001919 0000668 0000497 0000456 0000365 0001411 0003346 0003804 000205 000068 -000012 -000043 -000021 -000021 -00002
-000012 -56E-05 000021
0000187 0000316 0000692 0000908 0001332 000226
0003786 0005419 0005803 000456
0003193 0002303 0001644 000128
0001388 0001619 0001462 0001511 0002018 0002376 0002431 0002383 0002084
0()()08B3 0000213 0000111 0000883 0000962 0000393 0000863 0001548 0002652 0002682 0001384 0000422 0000561 0000678 0000351 0001032 000261
0003064 0001519 0000414 -000019 -000044 -7E-05
-39E-05 -000015 -53E-05 121E-05 0000361 0000263 0000287 0000593 0000738 0001071 0001145 0002654 0003111 0003926 0002895 0002056 0001541 0001055 000069 0000801 0001039 0000881 0000896 0001364 0001719 0001152 0001119 0001469
O 1 18 0000559 0000303 0001316 0001496 0000684 0000905 0001223 0002141 0002235 0001053 0000392 000091
0000891 0000312 0001008 0002558 0003025 0001511 0000513 -000013 -000056 -000018 --S2E-05 -4E-05
0000113 0000328 0000549 0000111 503E-05 0000356 0000409 0000714 0001243 0001951 000305
0003381 0002381 0001641 0001224
00001 0000491 0000181 0000891 0000669 0000839 0001218 0001276 0001346 000129
0000776
0001992 0002411 0002148 0001058 0001415 000154 0000164 0001019 0001165 0002082 0002589 0002924 0002189 0002101 000305 000106 0001374 0001435
0001411 0001686 0001733 0001588 0001689 0001733 0002244 0002175 0002169 0002164 0001911 0001924 0001048 0000952 0000819 000055 0000608 0000618
0001281 0001501 0001614 0001312 0001515 0001108 0000586 0000659 0000113 0001056 0001119 000106 000258 0002668 0002682
0003316 0003411 0003606 0001121 0001169 0001768 0000609 0000658 0000649 -74E-05 363E-05 182E-05 -000048 -000034 -000034 985E-05 0000275 0000414 0000156 0000341 0000446 578E-05 000016 0000119 0000152 0000237 0000254 0000428 0000585 0000652 0000894 0001073 0001228 0000443 0000471 0000569 0000194 0000178 0000115 0000466 0000553 0000449 0000584 0000648 000062 0000883 000092 0000919 0001327 0001341 0001324 0001154 0001637 0001532 0002591 0002352 0002151 0002882 0002586 0002351 0001961 0001106 0001443 0001377 000123 0000992 000108 0000948 0000799 000067 0000572 0000445
0000432 0000431 0000326 0000661 0000681 0000613 0000115 0000148 0000721 0000565 0000511 000045 0000104 0000643 0000525 0001046 0000987 000081 0001214 0001134 0001006 0001331 0001206 0001113 0001206 0001142 0001091 0000144 0000645 0000552
[1481
Seton Hall University
Salicylic Acid Linearity Raw Data
l M N 0 P Q R S 13322187 000338 0001653 0001025 0000664 0000468 0000352 0000257
155 1328487 0002996 0001477 0000908 0000941 0000618 0000534 0000424 156 13247553 0002511 000119 0000724 0000769 0000566 0000513 000043 157 13210235 0002244 0001047 0000652 000052 0000495 0000449 0000424 158 13172918 0002288 0001121 0000739 0000519 0000533 0000496 0000473 159 13135601 0002267 0001008 0000576 0000396 0000379 0000356 0000295 160 13098284 0002465 0001017 0000567 0000432 0000423 0000394 0000312 161 13060967 0002911 0001308 0000842 0000661 0000678 0000606 0000501 162 1302365 0003314 0001634 0001101 0000778 0000716 0000635 0000505 163 12986333 0003299 0001693 000116 0000854 0000696 0000622 0000489 164 12949016 0003022 0001543 0001068 0000843 0000789 0000736 0000598 165 12911699 0002832 0001469 0001037 0000822 0000878 0000635 0000737 166 12874382 0002753 0001452 0001042 0000799 000074 0000701 00006 167 12837065 0002886 0001571 0001151 0000807 0000676 000062 0000497 168 12799748 000303 0001679 000123 0000866 0000823 0000751 0000679 169 12762431 000309 0001643 0001152 0000976 0000917 000065 0000804 170 12725114 000324 0001658 00011 0000864 0000866 0000768 0000716 171 12687797 0003783 000191 0001298 0000783 0000866 0000731 000064 172 1265048 0004695 0002387 0001656 0001061 000095 0000795 0000701 173 12613163 0005823 0002982 0002023 0001436 0001121 0000989 0000863
1174 12575846 0006738 0003401 000223 0001667 0001343 0001195 000103 175 12538529 0006747 0003343 0002168 0001566 0001244 0001031 0000874 176 12501212 0005908 0002911 0001931 0001398 0001088 0000919 0000748 177 12463894 0004836 000232 0001482 0001029 0000816 0000698 0000495 178 12426577 0004405 0002154 0001394 0000901 0000741 0000629 000045 179 1238926 000419 0002078 0001404 0000894 0000771 000069 0000548 180 12351943 0003753 0001813 0001124 0000674 0000462 0000394 0000261 181 12314626 0003634 0001757 0001095 0000713 0000472 0000368 0000316 182 12277309 0003853 0001965 0001355 0001022 0000876 0000756 0000738 183 12239992 000387 0001951 0001356 0001098 0001005 0000925 0000854 184 12202675 0003658 0001736 000111 0000889 0000776 0000738 0000635 185 12165358 0003675 000178 0001127 0000979 0000626 0000745 0000679 186 12128041 0003753 0001899 0001217 0001156 0001025 0000878 0000802 187 12090724 0003834 0001958 0001254 0001085 0000959 0000814 0000702 188 12053407 0003864 0001879 0001173 0000842 0000791 0000667 000056 189 1201609 000397 000189 0001212 0000742 0000797 0000721 0000614 190 11978773 0004257 0002126 0001457 0000872 000093 0000873 0000745 191 11941456 0004628 0002425 0001697 0001134 0001031 0000931 000077 192 11904139 0004976 0002665 0001879 0001307 0001027 0000908 0000793 193 11866822 0005204 000272 0001878 0001212 0001006 0000914 0000827 194 11829505 0005668 0002891 0002031 0001388 0001294 0001153 0001049 195 11792188 0006234 0003232 0002276 0001674 00015 0001306 0001194 196 11754871 0006604 0003391 0002266 0001499 0001286 0001087 0000922 197 11717553 0006879 0003437 000217 0001422 0001196 0000999 0000803 198 11680236 0007416 0003675 000235 0001609 0001364 0001155 0000954 199 11642919 0008204 000413 0002754 000195 0001723 0001427 000124 200 11605602 0008411 0004226 0002832 0002038 0001825 0001501 0001325 201 11568285 0007971 0003972 0002644 0001869 0001626 000136 0001185 202 11530968 0007722 0003877 0002546 0001929 0001639 0001426 0001268 203 11493651 0007602 0003817 0002446 0001717 0001408 0001198 0001026 204 11456334 0006491 0003212 0002016 0001224 0000872 0000653 0000515
[149]
Seton Hall University
Salicylic Acid Linearity Raw Data
l M N 0 P a R s 11419017 0004839 0002328 0001445 0000891 0000551 0000403 0000323
113817 0003536 0001676 0001013 0000684 0000464 0000371 0000304 11344383 0002521 0001262 0000793 0000473 0000403 0000311 0000212
208 11301066 0001495 0000142 0000469 525E-05 944E-05 -2E-05 -19E-05 209 11269749 245E-05 -00002 -000031 -000054 -000044 -000054 -000052 210 11232432 -000118 -000018 -000068 -000059 -000044 -000044 -000041 21 11195115 -000226 -000121 -000089 -000069 -000053 -000043 -000039 212 11157198 -000371 -000194 -000142 -000106 -000092 -000079 -000015 213 11120481 -000512 -000253 -000174 -000144 -000118 -000098 -000095 214 11083164 -00066 -000314 -000199 -000193 -000147 -000121 -000104 215 11045847 middot000868 -000424 -000274 -000242 -00019 -000161 -000133 216 1100853 -00111 -000558 -000374 -000309 -000241 -000212 -000181 217 10971213 -001326 -000669 -000451 -000351 -000277 -000233 -000204 218 10933895 middot001488 -000162 -000519 -000399 -000321 -000268 -000232 219 10896518 -001538 -000803 -00055 -000442 -000361 -000308 -000269 220 10859261 -001451 -000162 -000525 -00044 -000348 -000299 -000261 221 10821944 -001219 -000618 -000468 -000383 -000291 -000256 -000122 122 10184627 -001176 -000634 -000441 -00035 -000274 -00024 -000207 223 1014131 -001193 -00064 -000445 -000348 -000268 -000229 -000198 224 10709993 -001221 -000643 -00044 -000335 -000253 -000214 -000188 225 10672616 -001213 -000631 -000438 -00034 -000266 -000229 -000205 226 10635359 middot001119 -000595 -000414 -000336 -000212 -000233 -000211 227 10598042 -000961 -000508 -000354 -00029 -000242 -000203 -000184 228 10560725 -000191 -000409 -000286 -000223 -000191 -000157 -000139 229 10523408 -00063 -000316 -000217 -000161 -000142 -000116 -000099 230 10486091 -000517 -000264 -000183 -000147 -000134 -000115 -000098 231 10448774 -000415 -000211 -000148 -000134 -000115 -000099 -000085 232 10411457 middot000293 -000138 -00009 -000086 -000057 -000048 -000038 233 1037414 middot000193 -000091 -000057 -00006 -000037 -000039 -000029 234 10336823 -000152 -000082 -000055 -000062 -000045 -00005 -00004 235 10299506 -000169 -000096 -00007 -00008 -000056 -000056 -00005 236 10262189 -000176 -000099 -000075 -000076 -000054 -00005 -000046 237 10224872 -000198 -000119 -000101 -000087 -000074 -000064 -000064 238 10187554 -000221 -000136 -000118 -000104 -000097 -000083 -000087 239 10150237 -000208 -000112 -00009 -000069 -000061 -00005 -000051 240 1011292 -000219 -00011 -000079 -000058 -000036 -00003 -000024 241 10075603 -00027 -000139 -000093 -000095 -000074 -000064 -000055 242 10038286 -000371 -000185 -000119 -000121 -00009 -000075 -000065 243 10000969 -000586 -000293 -000196 -000154 -000098 -000075 -000062 244 9963652 -00087 -00044 -000298 -000219 -000158 -000118 -000104 245 9926335 -001057 -00054 -000367 -000278 -000122 -000173 -000152 246 9889018 -000982 -000499 -000345 -000255 -000195 -000155 -00013 247 9851701 -000724 -000364 -00025 -00017 -000113 -000087 -000067 248 9814384 -000489 -000257 -000178 -000125 -000083 -000071 -000055 249 9777067 -000331 -00018 -000132 -000096 -000073 -000062 -000049 250 973975 -000208 -000108 -000079 -000048 -000036 -000021 -00001 25 9702433 -000118 -000063 -000049 -000039 -000019 -92E-05 -56E-05 252 9665116 -000044 -000028 -000026 -000024 -1E-05 742E-05 301E-05 253 9627799 0000815 0000539 000047 0000491 0000655 0000717 0000705 254 9590482 0002108 0001349 0001195 0001016 0001059 0001048 00011 255 9553165 0002958 0001739 0001411 0000919 0000847 0000858 000087
[150]
Seton Hall University
Salicylic Acid Linearity Raw Data
l M N 0 P Q R S 9515848 0003795 0002052 0001546 0000769 0000633 000059 0000539
257 9478531 0004571 000237 0001777 0001007 0000903 0000774 0000714 258 9441213 0004691 0002306 0001617 0001273 0001165 0001099 0000984 259 9403896 0004372 0002068 0001318 0001026 0000997 0000965 0000868 260 9366579 0004143 0002079 0001323 0000962 0000931 0000916 0000862 261 9329262 0003803 0002096 0001401 0001324 000126 0001301 0001234 262 9291945 0003135 0001903 0001382 0001508 0001561 0001594 0001528 263 9254628 0002265 000147 0001244 0001512 0001764 0001758 0001767 264 9217311 0001181 0000692 0000776 0001116 0001422 0001473 0001564 265 9179994 0000139 748E-05 0000247 0000604 0000756 0000895 0000993 266 9142677 -000066 -000037 -00001 000043 000058 000072 0000773 267 910536 -000111 -000055 -000018 0000233 0000703 0000826 0000854 268 9068043 -000145 -000048 -000016 0000153 0000723 0000877 0000917 269 9030726 -000203 -000074 -000027 0000119 0000555 0000717 0000854 210 8993409 -000255 -000114 -000047 633E-05 0000483 0000604 0000875 271 8956092 -000298 -000149 -000071 553E-05 0000489 0000728 0000813 272 8918775 -000341 -000167 -000085 -00003 0000225 0000674 0000554 273 8881458 -000366 -000178 -000088 -00005 0000303 0000795 0000705 214 8844141 -000371 -000176 -000093 -000054 000054 0001018 0000964 215 8806824 middot000388 -000205 -000119 -000095 271E-05 0000539 000056 216 8769507 -000393 -000226 -000116 -000079 -7E-05 0000362 0000589 277 873219 -000433 -000239 -000119 -000055 0000101 000032 0000496 218 8694872 -000487 -000264 -000157 -00008 -SE-05 0000167 0000311 219 8657555 -000509 -000283 -000172 -000128 -00004 -000018 0000181
8620238 -000537 -000265 -000138 -000101 -000023 0000242 0000488 8582921 -000619 -000314 -000166 -000095 -000016 0000614 0000697 8545604 -000725 -000408 -000256 -000151 -000072 -000019 0000125 8508287 -000788 -000415 -000262 -000135 -000058 -00001 0000241
284 847097 -000796 -00037 -000195 -00009 000016 0000811 0000701 285 8433653 -000754 -000338 -000168 -000072 0000331 0000964 0001029 286 8396336 -00077 -000362 -000202 -000133 -000016 000029 0000708 287 8359019 -000812 -000387 -000244 -000186 -000039 925E-05 0000235 288 8321702 -000763 -000413 -000235 -000145 114E-05 0000779 0000564 289 8284385 -000704 -000427 -000174 -000094 0000403 0001395 0001235
8247068 -00077 -000418 -000212 -000147 0000107 0000949 0000877 8209751 -00082 -000388 -000268 -000202 -000054 -00003 -000029 8172434 -000781 -000401 -000245 -000199 -000124 -000118 -000075 8135117 -000678 -000338 -000158 -00009 -000054 0000213 0000371
80978 -000636 -000321 -000153 -000048 34E-05 000109 0000918 8060483 -000736 -000368 -000201 -000164 -00004 0000307 0000387 8023166 -000797 -000406 -000254 -000259 -000083 -000051 0000109 7985849 -000819 -000484 -000311 -000241 -000122 -000087 294E-05 7948532 -00082 -00049 -000359 -000217 -000133 -000064 -44E-05 7911214 -000786 -000405 -000322 -000221 -000135 -18E-05 0000357 7873897 -000714 -000339 -000148 -000058 162E-05 0000994 0001373
301 783658 -000734 -000333 -0001 0000207 0000315 0001158 00018 302 7799263 -000693 -000292 -000114 -000023 -1E-04 0000946 0001363 303 7761946 -000613 -000272 -000141 -000076 0000415 0001108 0001337 304 7724629 -000777 -000383 -000335 -000201 -75E-05 0000259 0000769 305 7687312 -000763 -000403 -000417 -000264 -000036 -000019 000045 306 7649995 -000575 -000161 -00015 -000051 -65E-05 0001896 000175
[1511
Seton Hall University
Salicylic Acid Linearity Raw Data
L M N 0 P a R S 7612678 -000503 -000106 -000032 0001092 523E-05 000358 0001615
308 7575361 -000629 -000331 -00015 -000044 -000015 0003362 0001435 309 7538044 -000683 -000424 -00015 -000113 0000211 0002343 0003148 310 7500727 -000725 -000467 -000072 -000203 0000186 0000415 0003189 311 746341 -000736 -000409 -000072 -000209 0000299 0000565 0001658 312 7426093 -000727 -00023 -000152 -000068 0000539 000208 0001731 313 7388776 -000746 -000387 -000284 -00003 0000658 0002007 0001217 314 7351459 -000653 -000268 -000376 0000387 0001801 0002261 0002028 315 7314142 -000631 -000243 -000418 0000465 0001284 0001984 0002449 316 7276825 -000448 -00036 -000271 0000659 379E-05 0003612 0002328 317 7239508 -000609 -000211 -00007 0002337 0001633 0004503 0002582 318 7202191 -000823 -00018 -00018 0003083 0003483 0001606 -65E-05 319 7164873 -001052 -000518 -000618 -000112 -000192 -000196 -000296 320 7127556 -0009 -000408 -000503 -000335 -000193 0000819 0002041 321 7090239 -000263 0002016 846E-05 0000322 0006467 000659 0008253 322 7052922 0000411 000198 0000152 0000988 0008183 0007496 0007357 323 7015605 -000433 -000022 -000489 0000451 0001238 0008372 0003532 324 6978288 -000972 0001882 -000648 -00021 -000287 0006825 0000633 325 6940971 -001283 0001633 -000345 -000274 0004553 0003136 0005014 326 6903654 -000477 -000307 0001101 000155 0015475 0008684 0007746 327 6866337 0002714 0004069 0008987 0017488 0023048 0017339 000774 328 682902 0002344 0008319 00125 0019268 0012339 0021648 0014214 329 6791703 001973 0009579 0014092 0022671 0006015 0020514 0020884 330 6754386 0022907 0027308 0011454 0008652 0013533 000993 0018337
67U069 0040395 0047424 004506 0017746 003161 -000108 0038309 6679752 003742 0034306 -00015 0211175 0041259 -000308 0041487 6642435 -003673 0031214 -010889 0176551 -001099 -001847 -001638 6605118 -001329 005025 -007151 0057809 0006968 0009254 -000372 6567801 0045812 0024709 0032092 0047795 0042077 0073839 00306 6530484 -004397 0004264 0035975 -003612 -001248 0056891 -002779 6493167 -00637 000249 -0C1432 -005065 000042 0118745 0020689
[152J
Seton Hall University
Figure 7-1 Linearity of salicylic acid in pH 74 phosphate buffer (corresponds to Figure 2-1 in Chapter 2)
The table below contains the raw data collected during the salicylic acid linearity experiment Eight serial dilutions of salicylic acid reference standards were used during the linearity study The molar concentrations are displayed in the table Standard 1 represents about 21 mg of salicylic acid per 900 ml of buffer while Standard 8 represents about 300 mg of salicylic acid per 900 ml of buffer Since a large salicylic acid peak was observed at 1388 em-I a singleshypoint baseline correction at 1370 em-I was used to correct the data
Description Flask Volume (L) Concentration (M) 1388nm 1388-1370 Std-1 0050 003215 001152 000855 Std-2 0100 001607 OO51=i 000452 Std-3 0150 001072 O00039 000324 Std-4 0200 000804 00033 000290 Std-5 0250 000643 000288 000245 Std-6 0300 000536 000259 000215 Std-7 0350 000459 000235 000203 Std-8 0700 000230 000103 000118
NoteConc ~1oo of300mg tablet In actual vessel (900ml) dIssolutIOn
[153]
Seton Hall University
Figure 7middot2 Linear regression chart for saliyclic acid
The figure below is a linear regression plot for the serial dilutions of salicylic acid reference standards Since a large salicylic acid peak was observed at 1388 cm-1
a single-point baseline correction at 1370 cm-1 was used to correct the data
Linear Regression for Serial Dilutions of Salicylic Acid Reference Standards 1388-1370cm-1
000900
000800
000700
000600 gt
U)c Q)
000500 y = 02362x + 000091
gtlt R2 = 09975 C1I 000400 Q)
Cl
000300
000200
000100
000000 00000 00050 00100 00150 00200 00250 00300 00350(
1 Concentration (M)
I [154]
I
Seton Hall University
Figure 7-3 Dissolution results for salicylic acid in pH 74 phosphate buffer HPLC vs IR data (corresponds to Figure 2-2 in Chapter 2)
The table below corresponds to the percent () dissolved data obtained from the salicylic acid dissolution experiment The table compares ATR-IR to HPLC percent dissolved results HPLC samples were collected after 30 min 1 hour 2 hour 3 hour 65 hours and finally after 7 hours Moreover the samples were analyzed using an Agilent HPLC system As shown in the table below the maximum absolute difference observed between the IR and HPLC data was found to be 3
Time (hhmm) Dissolved (HPlq Dissolved by(lR) Difference 0000 00 00 0 0030 111 144 -3 0100 209 231 -2 0200 382 380 0 0300 529 509 2 0630 878 883 -1 0700 948 978 -3
[155]
Seton Hall University
Figure 7-4 ATR-IR System photo
The figure below shows a photo of the Mettler Toledo ATR-IR system coupled with a DiComp fiber optic probe The photo shows the DiComp probe inserted into a standard dissolution vessel An external electric stirrer was used to control the agitation speed (RPMs)
[156]
I
Seton Hall University
Figure 7-5 Mettler Toledo ATR-IRI Dissolution Systems
The figure below shows a photo of the Mettler Toledo ATR-IR system coupled with a DiComp fiber optic probe The photo shows the DiComp probe inserted into a standard dissolution vessel The Vankel six-vessel dissolution system was used for during testing
[157]
Seton Hall University
Figure 7-6 Flow Cell Fiber Optic Probe
The figure below shows a photo of the Mettler Toledo ATR-IR system coupled with a Flow Cell fiber optic probe Plumbing from the Flow Cell was attached to an Agilent six-port valve pump Also plumbing from a dissolution vessel was attached to the pump Thus a close-loop system was created whereby dissolution samples were drawn to the flow cell via the pump and back to the dissolution vessel Homogeneous mixing within the dissolution vessel was achieved using a stir plate and magnetic stir bar
[158]
Seton Hall University
Figure 7-7 K4 Fiber Optic Probe
The figure below shows a photo of the Mettler Toledo A TR-IR system coupled with a K4 Conduit fiber optic probe The photo also shows a dissolution vessel attached to the K4 probe The dissolution vessel was produced out of a methanol bottle A valve was attached to the vessel in order to empty the vessel contents during dissolution runs and cleaning
[159]
Seton Hall University
Figure 7-8 HPLC analysis for Salicylic Acid calibrator tablets
Salicylic Acid Tablets (HPLC Analysis) Batch No Salicylic Acid calibrator tablets Lot Q00200
Sample Name Vial No Injection RT Area Result 10 Standard 1 1 1 2533 07 4252948
30min 2 1 2534 07 472913 1 hour 3 1 2535 07 891091
12 hour 4 2536 07 1629150 3 hour 15 2537 07 2259379
65 hour 076 3764607 7 hour 077 2539 4064077
Standard 1 1 ~ 1 2533 07 4252948
Standard-1 Weight (mg) 6001 Standard-1 Avg Area 4252948 Standard Declared Content () 1000 Std-1WtlStd-1PA 1411E-05
Vessel Volume (mL) 5000 Potency (mg) 3000
Standard Volume (mL) 100 0 Sample (mL) 15
I
I
Time (hour) Vessel Volume 05 5000 1 4985 2 4970 3 4955
65 4940 7 4925
Time (hour) Dissolved (HPLC) 05 11 1 21 2 38 3 53
65 88 7 95
[160]
Seton Hall University
Figure 7-9 HPLC Method Parameters Single Component and Multi Component
Experiments
HPLC Parameters (HP1050)
bull Symmetry 300 C18 5 m column (46mm x50 mm)
bull Mobile phase 60401 (watermethanolglacial acetic acid)
bull Flow rate 20 mllmin isocratic mode Injection volume = 5 IJL
UV detector was set at 296 nm
HPLC Parameters (Waters 26951
Symmetry Shied RP C18 3IJm column (35mmx50 mm)
Mobile phase 70301 (wateracetonitriletrifluoroacetic acid (TFAraquo
bull Flow rate 15 mllmin isocratic mode injection volume was 51J1 UV detection was set at 296 nm
HPLC Parameters (HP10501
bull Phenomenex Intersil ODS C18 5IJm column (46mmx150 mm)
bull Mobile phase 60401 (methanoVwatertrifluoroacetic acid (TFAraquo
bull Flow rate 10 mVmin isocratic mode injection volume 251J1
UV detection was set at 280 nm
[161]
Seton Hall University
Figure 7-10 Typical Excedrinreg experiment spectra
FTIR spedra for Excedrin Caplets
- 00459 middotmiddotmiddot--middot01000 0014 +--------------------------1
-01500 -02000 --02500 -03000
03459 - 04500 i0012 +---- -----~- -------------- shy
05459 -10000
1__________________________~===1=4=5=00~========j~ 001 + c B c
~ 0008 +-------------~------------~-----___i (Il
i0006+----------------~~~-------~~---~ o
~ 0OO4~~~~-------~~-~--~-~~~~==~~~~~~~~~
0OO2~~~~~--~~~----------~~-------c----~~~
O+---~--~~--__--_r---~--~---~--~---~
1000 1050 1100 1150 1200 1250 1300 1350 1400 1450 Wavenumber (emmiddot)
Figure 7-11 Excedrinreg HPLC Data
Ret time (min) Area Acetaminophen 2033 190158
AcetylSalicylic Acid 3585 90043
Acetaminophen Acetylsalicylic Acid 10 min 158561 86841 20 min 161448 88486 30 min 183010 92246 1 hour 188684 93413
Acetaminophen Acetylsalicylic Acid 0 0 0
10 834 964 20 841 973 30 943 1004 60 962 1006
[162]
8
Seton Hall University
Appendix [8] Studying drug kinetics via ATR-IR Spectroscopy
Figure 8-1 Salicylic Acid standard spectra
ATRmiddotIR Spectra of Salicylic Acid Standard (l25 meIOO mL SGF)
1
1 l
~~1
QQ()9
MOB
(IOJ7
(I(x)6
OGOS
000
0003
(1002
0001 -Salicylic Acid
1060 1070 1080 100 1100 1110 lZ() 1130 1140 1150 ll60 1170 l1SO 19() 1200 220 220 1230 1240 1250 1260 1270 1280 1290 1300 1310
Wnumbe (em-ll
[163]
Seton Hall University
Figure 8-2 Acetylsalicylic Acid standard spectra
ATR-IR Spectra of Acetylsalicylic Acid Standard (325 me1OO mL SGF)
001
0009
0008
0007
0006
f i 0005
l -
0004
0003
0002
0001
0
Acetylsalicylic Acid Peak not shyin salicylic acid
standard r
J --- shy ~ r- I
-- V
-Acetylsalicylic Acid
A V ~
1060 1070 1080 1090 1100 1110 ll20 1130 1140 1150 1160 1170 1180 1190 1200 1210 1220 230 1240 1250 1260 1270 1280 1290 BOO
W_number laquomll
[164]
Seton Hall University
Table 8-1 Aspirin FT-IR Frequencies of Interest
i Wavelength (c-m-) Assignment
I 2300-2500 carboxylOH i 1760 vinyl ester C=O bull 1690 aromatic acid C=O
1610 aromatic acid C=O 1580 aromatic C=C stretch 1490 aromatic C=C stretch 1220 =C-O (acid and ester) 1190 =C-O (acid and ester) 760 ortho substituted phenyl C-H bending
[165]
Seton Half University
Figure 8-3 Rate Order Formulas and Equations (Reproduced from Wikipedia website on Rate Order)
Zeroorder Secondorder lIihorder
_ d[A] = k _ d[A]middotmiddot~ k[41~4Jd[4]Rate Law k[4]ftdt -Ttdt
Flntorder
_drA) = k[4] dt
1 Ii
In([4]) VB t
In(2) tl2 = -k-
[4]0n-l + (n - l)kt 1 1
Integrated Rate Law [A] [Alo-
M 1 1Units of Rate Constant (k)
bull SMs 1
1 VB t Lnear Plot to determine ilt [A] VB t [4] VB t
(Exoept first ofde~
[4]0 _ ~41 (n _ 1)k[4]on 1Half-life t I2 - k[4]0t1 2 = 2k [Except filSt order)
[166]
9
Seton Hall University
Appendix [C] New Instrument Design (Solv-IR) attachments
Figure 9-1 ATR-IR Technique Diagram (courtesy of Jian Wang PhD Mettler Toledo)
[167]
10
Seton Hall University
~---~-------~~~--~~
Appendix [0] BP Gulf oil research attachments
Figure 10-1 Detergents used during BP Gulf oil research
[168]
100
Seton Hall University
Figure 10-2 IR Spectra of Gulf Oil from Riser Pre- April 20 2010
-DIStiIedWltIter
- Rl$erOlL_Pe~20
1800 1700 1600 1500 1400 1200 1100 1000 800 700
MpoundlnER TOLEPO
[169]
Seton Hall University
Table 10middot1 Amount of Dawnreg dishwashing detergent added
Time (hmm) Volume added (ml) Total volume in vessel (ml)
001 1 1
004 1 2
006 1 3
008 3 6
010 3 9
013 3 12
014 3 15
017 3 18
019 3 21
020 3 24
022 3 27
024 3 30
026 3 33
026 3 36
028 3 39
034 3 42
039 3 45
041 3 48
148 3 51
206 3 54
[170]
Seton Hall University
Figure 10-3 Thermo Nicolet 4700 Transmittance of OIL samples
Minimal Sheen
i I ~
Slmiddot
1m Sea Water under oil m ~ 11ll)t
~~~---~-- ~--~---- -~-- shy
AIJXJ University of New Orleans OIL SamplesI w
lIDshy
II t------~ ~ v~v ___ v ~-- __ __ ~__ ___ _~_tv-_
1500AIJXJ ill lO)
t
00 Venigtce OIL Samples (colleded by I)r Sows) I III ~_~cl
[1711
Seton Hall University
Figure 10-4 Thermo Nicolet 4700 Absorbance of OIL samples
Minimal Sheen
i U 0( CO
C6~ Surface Sheen
I~______--J
S University of New Orleans OIL Samples II ~
~ 2i Q
0( O~
Venice OIL Samples (collected by Dr Sowa)
Imiddot
IIlX1
[172]
2
Table of contents
Table of contents viii
List of figures xii
List of tables xviii
Introduction and Literature Overview 1
11 History 5
12 Infrared Spectroscopy 28
13 Literature background in situ ATR-IR and dissolution 32
Dissolution of salicylic acid acetylsalicylic acid and acetaminophen using In Situ
ATR-IR spectroscopy 35
21 Experimental section 38
211 Chemical and materials 38
212 Instrumentation 39
213 Buffered solutions 40
214 Dissolution experiments 40
215 HPLC analysis 41
216 ATR-IR analysis 42
22 Results and discussion 44
221 Single-component analysis 44
222 Dissolution results for salicylic acid using pH 74 phosphate buffer 47
[viii]
3
223 Multi-tablet analysis 50
224 Multi-component analysis 54
23 Chapter summary 60
Kinetics of drug hydrolysis of common over-the-counter (OTC) drugs via A TR-IR
spectroscopy 61
31 Background and history of Aspirin 62
32 Experimental section 64
321 Chemical and materials 64
322 Instrumentation 66
323 Buffered solutions 66
324 Hydrolysis Experiments 67
325 ATR-IR analysis 67
33 Results and discussion 71
331 Hydrolysis of aspirin to salicylic acid in test tubes 71
332 Hydrolysis of aspirin to salicylic acid using aspirin tablet as the
starting ingredient 74
333 Hydrolysis of aspirin to salicylic acid using aspirin powder as the
starting ingredient 77
334 Hydrolysis data comparison between tablet and powder
formulations 79
335 Kinetic rates observed during hydrolysis experimentation 84
[ix]
34 Chapter summary 87
4 Instrument Development Proposal Solv-IR as an In-Situ ATR-IR Instrument for
Solvation Chemistry 89
41 Background 89
42 Broader impacts from the proposed activities 92
43 Limit of detection (LOD) and limit of quantitation (LOQ) data 93
44 Instrument design 101
45 System components 104
451 Radiation source 104
452 Interferometer 104
453 Two Six-device Multiplexors 104
454 Six ATR Probes 104
455 Detector 105
456 Six Solvation Vessels 1 05
46 Instrument Control Acquisition Processing 109
47 Anticipated technical difficulties 109
48 Chapter summary 109
5 Analysis of the BP Gulf oil spill by Attenuated Total Reflection-Infrared
Spectroscopy and Dissolution 112
51 Research with React-IR 114
52 Experimental section 117
[x]
521 Chemical and materials 117
522 Instrumentation 121
523 Dispersant stock solution 123
524 Crude oil sample preparation 123
525 ATR-IR analysis 124
53 Results 124
531 Standards and expected absorption values 125
532 Venice oil samples dispersed using Joy soap 130
533 Venice oil samples dispersed using Dawnreg soap 133
534 Analysis by UV-Vis Spectroscopy 137
54 Chapter summary 142
6 Research conclusions 143
7 Appendix [A] In situ ATR-IR Spectroscopy and Dissolution Data 146
8 Appendix [B] Studying drug kinetics via ATR-IR Spectroscopy 163
9 Appendix [C] New Instrument Design (Solv-IR) attachments 167
10 Appendix [D] BP Gulf oil research attachments 168
[xi)
List of figures
Figure 1-1
Figure 1-2
Figure 1-3
Figure 1-4
Figure 1-5
Figure 1-6
Figure 1-7
Figure 1-9
Figure 2-1
Dissolution apparatus Noyes and Whitney (Ref 1) (Figure
reproduced from bottle figure in artic1e) 6
Dissolution process 13
Importance of sink conditions in dissolution dissolution of benzoic
acid at low concentrations Underwood and Cadwallader (Ref 8)
(Figure reproduced from figure-l in article) 16
Importance of sink conditions in dissolution dissolution of benzoic
acid at higher concentrations Underwood and Cadwallader (Ref 8)
(Figure reproduced from figure-3 in article) 17
Schematic illustration of Apparatus 1 and Apparatus 2
(Reproduced from USP General Chapter on Dissolution lt711raquo 22
USP Apparatus 1 Specifications (Reproduced from USP General
Chapter on Dissolution lt711raquo 24
USP Apparatus 2 specifications (Reproduced from USP General
Chapter on Dissolution lt711raquo 25
FT -IR system schematic (Ref 23) 31
Salicylic acid spectra at different concentrations in pH 74
phosphate buffered solution 45
[xii]
Figure 2-2
Figure 2-4
Figure 2-5
Figure 2-6
Figure 2-7
Figure 3-1
Figure 3-2
Figure 3-3
Figure 3-4
Figure 3-5
Figure 3-6
Figure 3-7
Figure 3-8
Comparison of in situ ATR-IR and HPLC methods for dissolution
Figure 2-3
of a salicylic acid tablet 48
Calibration curves of acetaminophen standards at pH 58 UVNis
absorbance at 296 nm and IR peak intensity at 1246 cmI 51
Simultaneous dissolution of acetaminophen and salicylic acid
tablets in situ ATRmiddotIR vs HPLC 53
ATRmiddotIR spectra of Excedrinreg caplets at different timemiddotpoints
during dissolution in pH 74 phosphate buffered solution 55
Dissolution of acetylsalicylic acid and acetaminophen in
Excedrinreg caplets in situ A TRmiddot IR VS HPLC 56
Compounds studiedof interest for future work 59
Structures of acety Isalicy lie acid (aspirin) 62
Synthesis of aspirinmiddotlate 1800s 63
Chemical structures studied 65
Ferric chloride color testmiddot control samples 72
Waterfall plot of aspirin tablet dissolution 75
Hydrolysis of Aspirin Tablets (325 mg) in pH 12 SGF Solution
(n=2) 76
Ferric chloride color test for salicylic acid (tablet dissolution) 76
Hydrolysis of acetylsalicylic acid powder to salicylic acid
hydrosylate in pH 12 solution 78
[xiii]
Figure 3-9
Figure 3-11
Figure 3-12
Figure 3-13
Figure 4-1
Figure 4-2
Figure 4-3
Figure 4-4
Figure 4-5
Figure 4-6
Figure 4-7
Figure 4-8
Figure 5-1
Figure 5-2
Release profile of Salicylic Acid (SA) during hydrolysis in SGF
Figure 3-10
(pHl2) powder vs tablet 81
Release profile of acetylsalicylic acid (aspirin) during hydrolysis
LODLOQ Sample Calculation Sheet- Flow Cell Probe Results-1 l00
Diagram of proposed Solv-IR Instrument l 03
Sketch of A TR crystal embedded in the side wall of the 1 L glass
vessel The area directly under the stir shaft is known to have poor
powder vs tablet 82
Release profile of acetylsalicylic acid (aspirin) and salicylic acid
hydrosylate during hydrolysis powder vs tablet 83
Typical calculation plot of rate from dissolution 86
Rate of dissolution for Aspirin (based on slope of dissolution plot) 86
Limit of detection of ATR-IR system 95
Fiber optic probes specifications (ref 56) 96
Calculated LOD and LOQ values 97
LODLOQ Sample Calculation Sheet- DiComp Probe Results-1 98
mixing and as indicated by the term dead zone 106
Top plate of constant rpm stirring assembly showing motor main
gear and minor gears which drive the stir shafts in each vessel 108
Photo of oil rig similar to Deepwater Horizon 113
Aerial view location of BP Gulf oil samples 118
[xiv]
Figure 5-3
Figure 5-5
Figure 5-6
Figure 5-7
Figure 5-8
Figure 5-9
Figure 5-10
Figure 5-11
Figure 5-12
Figure 5-13
Figure 5-14
Figure 5-15
Figure 5-16
Figure 7-1
Zoom view location of BP Gulf oil samples [Both samples were
Figure 5-4
collected near the UNO site] 119
Ocean depth diagram showing location of BP Gulf oil samples
(reproduced and modified from Ref71) 120
Instrument photo ATR-IR and dissolution apparatus 121
Gulf oil vs blank (ocean water) standard spectra 127
Baseline corrected ATR-IR scans ofBP oil and Ocean Water
samples 128
Photo of vessels at different time points during the dispersion
experiments 129
ATR-IR scans of Venice oil and 50 mL of Joy soap 131
ATR-IR scans of 50 mL of Joy soap only (Blank solution) 132
ATR-IR scans of Venice oil and 50 mL of Dawnreg soap 134
ATR-IR scans of 50 mL of Dawnreg soap only (Blank solution) 135
Visible spectra of chlorophyll a and b 139
Chemical structure of chlorophyll a ( Chern Draw) 140
Chemical structure of chlorophyll b (Chern Draw) 140
UVVis spectra ofBP oil samples in different solvents 1 mm cell
spectrophotometer fully covered from outside lighting 141
Linearity of salicylic acid in pH 74 phosphate buffer (corresponds
to Figure 2-1 in Chapter 2) 153
[xv]
Figure 7-2 Linear regression chart for saliyclic acid 154
Figure 7-3
Figure 7-4
Figure 7-5
Figure 7-6
Figure 7-7
Figure 7-8
Figure 7-9
Figure 7-10
Figure 7-11
Figure 8-1
Figure 8-2
Figure 8-3
Figure 9-1
Figure 10-1
Figure 10-2
Figure 10-3
Dissolution results for salicylic acid in pH 74 phosphate buffer
HPLC vs IR data (corresponds to Figure 2-2 in Chapter 2) 155
ATR-IR System photo 156
Mettler Toledo A TR-IRI Dissolution Systems 157
Flow Cell Fiber Optic Probe 158
K4 Fiber Optic Probe 159
HPLC analysis for Salicylic Acid calibrator tablets 160
HPLC Method Parameters Single Component and Multi
Component Experiments 161
Typical Excedrinreg experiment spectra 162
Excedrinreg HPLC Data 162
Salicylic Acid standard spectra 163
Acety lsalicy lic Acid standard spectra 164
Rate Order Formulas and Equations (Reproduced from Wikipedia
website on Rate Order) 166
ATR-IR Technique Diagram (courtesy of Jian Wang PhD
Mettler Toledo) 167
Detergents used during BP Gulf oil research 168
IR Spectra of Gulf Oil from Riser Pre- April 20 2010 169
Thermo Nicolet 4700 Transmittance of OIL samples 171
[xvi]
Figure 10-4 Thermo Nicolet 4700 Absorbance of OIL samples 172
[xvii]
List of tables
Table 1-1
Table 1-2
Table 2-1
Table 2-2
Table 2-3
Table 2-4
Table 2-5
Table 2-6
Table 2-7
Table 3-1
Table 3-2
Dissolution apparatus in the pharmaceutical industry 20
Absorption bands (Ref 21) (Reproduced from table of frequencies
found on CSU Website link) 29
Phosphate buffer preparations as per United States Pharmacopeia
(USP) 40
Method development summary for Salicylic Acid (Linearity and
Dissolution results) 46
Dissolved of salicylic acid Absolute dissolved difference
between ATR-IR and HPLC results 49
Dissolution of acetylsalicylic acid (aspirin) and acetaminophen in
Excedrinreg caplets ATR-IR raw data 57
Dissolution of acetylsalicylic acid (aspirin) and acetaminophen in
Excedrinreg caplets HPLC raw data 58
Dissolved of acetaminophen Difference between ATR-IR and
HPLC results 58
Dissolved acetylsalicylic acid (aspirin) analysis Difference
between A TR-IR and HPLC results 58
Hydrochloric acid buffer preparations as per United States
Pharmacopeia (USP) 67
Ferric chloride color test concentrations 73
[xviii]
Table 3-3
Table 3-4
Table 4-1
Table 5-1
Table 5-2
Table 5-3
Table 5-4
Table 5-5
Table 5-6
Table 8-1
Table 10-1
Ferric chloride color test observations [added 2mg Iml Fe (III)
solution] 73
Kinetic rates for hydrolysis of aspirin in acidic medium 85
LODLOQ Sample Calculation Sheet- DiComp Probe Result-2 99
Chemicals used in commercial dispersants (COREXIT 9500 and
9527) 116
Experimental details and sample information 122
Expected FT -IR stretching values for crude oil and sulfonated
soaps 126
Amount of Dawnreg in solution 136
Amount of BP oil in solution 136
Dispersant calculated 136
Aspirin FT -IR Frequencies of Interest 165
Amount of Dawnreg dishwashing detergent added 170
[xix]
Abbreviations
ATR
ATR-IR
API
ASA
BA
BE
Disso
EPA
FDA
GI
HCI
HPLC
HPMC
IR
LOD
LOQ
MDL
MCT
NSF
OTC
PEG
RPM
SA
SGF
TFA
USP
UV
Vis
Attenuated Total Reflection
Attenuated Total Reflection-Infrared Spectroscopy
Active Pharmaceutical Ingredient
Acetylsalicylic acid
B ioavailability
Bioequivalence
Dissolution
Environmental Protection Agency
Food and Drug Administration
Gastrointestinal
Hydrochloric Acid
High Performance Liquid Chromatography
Hydroxypropylmethylcellulose
Infrared Spectroscopy
Limit of Detection
Limit of Quantitation
Method Detection Limit
Mercury-Cadmium-Telluride
National Science Foundation
Over the Counter
Poly (ethylene glycol)
Revolutions per Minute
Salicylic acid
Simulated Gastric Fluid
Trifluoroacetic acid
United States Pharmacopeia
Ultra-Violet
Visible
[xx]
1
Seton Hall University
Introduction and Literature Overview
Dissolution is a critical test for measuring the performance of a pharmaceutical formulation
The overall performance of the drug pertains to the rate of release of the drug There are many
variables that affect the dissolution rate of the drug Recently the importance of the
dissolution test has increased substantially as indicated by the high level of regulations
imposed on the industry by the various health agencies around the world Dissolution testing
plays several important roles in the pharmaceutical industry First the test is a quality control
tool that measures change in composition of the formulation Some of the relevant changes
the dissolution test is able to detect include changes caused by temperature humidity and
photosensitivity Second the test is also important for formulation development During
development of a drug product the formulators use the dissolution test to distinguish between
different variations of the drug product Such variations may include characteristics of the
active pharmaceutical ingredient (API) (eg particle size crystal form and bulk density)
drug product composition (eg drug loading and the identity type and levels of excipients)
and the drug product manufacturing process (eg compression forces equipment) In the
pharmaceutical industry it is important to produce several variations of the drug product since
these are needed to access the drugs performance in clinical trials From the clinical trials
the efficacy of the variants are distinguished and obtained Third once in vivo (clinical trials)
data has been established for the drug product a correlation between in vivo (human blood
data)in vitro (lab dissolution results) is made using the dissolution studies
[1 ]
Seton Hall University
Dissolution as per the IUPAC is defined as the mixing of two phases with the formation of
one new homogeneous (Le the solution) phase and is pharmaceutically defined as the rate of
mass transfer from a solid surface into the dissolution medium or solvent under standardized
conditions of liquidsolid interface temperature and solvent composition 1 It is a dynamic
property that changes with time and explains the process by which a homogenous mixture of a
solid or a liquid can be obtained in a solvent It happens to chemically occur by the crystal
break down into individual ions atoms or molecules and their transport into the solvent2
Dissolution is controlled by the affinity between the solid substance and the solvent
Moreover the dissolution rate plays an important role in the understanding the chemistry of
solvation The dissolution rate is defined as the amount of drug substance that goes into
solution per unit time under standardized conditions of liquidsolid interface temperature and
solvent composition
In order for drug molecules to be transported into solution they must detach from the solid
surface and form solvated molecules This phenomenon is known as solvation Regardless of
whether a solid is crystalline or amorphous neighboring molecules are closely associated
with each other though intermolecular forces The dissolution process involves two main
steps the first step is the interaction between the solid and solvent molecules (solvation) The
second step is the mass transport of solvated molecules to the bulk solution Solubility
controls the first step while transport controls the second The first step of dissolution is
considered a physico-chemical reaction The solvation process is reversible and solubility is
I IUPAC Compendium of Chemical Terminology 2nd ed (the Gold Book) (1997) Online corrected version (2006-) dissolution 2 Dressman J J Kramer J K Eds Pharmaceutical Dissolution Testing Taylor and Francis Florida 2005
[2]
Seton Hall University
reached when the reaction reaches equilibrium The dissolution process can also be described
by the Gibbs free energy equation shown below
(Equation 1)
IG IH - TIS
This reaction involves the breaking and formation of new intermolecular interactions The net
entropy is usually positive in dissolution since dissolution favors disorder Moreover the net
enthalpy plays a crucial role in this equation Dissolution is usually determined by the net
enthalpy change If the net enthalpy is less than or equal to zero then the reaction will occur
until all solid particles are dissolved However if the net enthalpy is positive the reaction will
occur until equilibrium is reached In addition the reaction rates in dissolution could be
described kinetically by the following equations
(Equation 2)
V KdDrug][Solvent]
(Equation 3)
Where V is the reaction rate Ea is the activation energy R is a constant and T is temperature
The rate of dissolution is governed by the slower step of the twp step process mentioned
earlier Therefore at room temperature the rate of solvation is so fast that equilibrium is
[3]
Seton Hall University
typically instantaneous The mass transport step is usually much slower and becomes the rate
limiting step in the dissolution process 3
Next this chapter of the thesis will focus the describing the history of dissolution testing
which has led to many types of pharmaceutical dosage forms as well as different types of
apparatus systems Even though there is increased interest in this area the techniques used for
studying dissolution rates remain fairly constant In fact there are only a handful of
instruments used to analyze and understand the dissolution rates of drugs This chapter will
also discuss the current techniques used for dissolution testing
Last but not least a thorough literature search into the use of A TR-IR spectroscopy as a
dissolution technique was made and will be discussed in this chapter The research has found
that FTIR imaging and NIR spectroscopy have been used to study dissolution testing
Although FTIR imaging utilizes the same spectroscopic region as the proposed research it is
more of qualitative test than a quantitative one Furthermore NIR was used to study
dissolving reactions The major weakness of the NIR region is that the absorption bands
occurring there are the overtones of the fundamental bands residing in the mid-IR region As a
result they are relatively weak and not clearly delineated This makes quantitative
calculations complex and calibration procedures quite laborious and not transferable from one
instrument to another This research focuses on the mid-IR region The mid-IR spectral region
is where most of the fundamental structural information is produced Also because molecules
differ from each other by having different combinations of functional groups their mid-IR
spectra can be used to identify them and characterize their structure
3 Hanson R Gray V Handbook of Dissolution Testing 3rd ed Dissolution Technologies Delaware 2004 [4]
Seton Hall University
11 History
The earliest theories of the dissolution were based on physicochemical properties The earliest
reference to dissolution dates back to 1897 when Noyes and Whitney published an article
entitled The Rate of Solution of Solid Substances in Their Own Solution4 Noyes and
Whitney investigated the phenomenon of dissolution by using two slightly soluble substances
benzoic acid and lead chloride They developed a rotating bottle technique coupled with a
titration method to determine the dissolution rates of these two active drugs Refer to Figure
1-1 for a schematic diagram of the first dissolution apparatus
4 Noyes Arthur A Whitney Willis R The rate of solution of solid substances in their own solutions Journal of the American Chemical Society 189719(12)930-934
[5]
- - - - - -
Seton Hall University
Figure 1-1 Dissolution apparatus Noyes and Whitney (Ref 1) (Figure reproduced from bottle figure in article)
- - ~ - _ ~ - -- ~~~--~- shy~ ~ ~ ~
100 ml Distilled Water
Bottle
Cork Sticks Active Drug
BOTTLE INSERTED IN THERMOSTATED BATH
[6J
Seton Hall University
Noyes and Whitney determined that the velocity of the solution is proportional to the
difference between the concentration of the saturated solution and that of the solution present
at the moment in question They determined the following dissolution rate equation as shown
in the equation 4 below
(Equation 4) dx
C (5 - x)dt
where S represents the solubility of the substance (mgmL) x the concentration (usually mg
or mmol) at the expiration of the time t (seconds) and C is a constant Integration of the
equation above gives equation 5
(Equation 5) 1 5
C T loge (5 - x)
In order to obtain values for C in the equation the solubility or S of the substance must be
known In addition Noyes and Whitney found that the dissolution rate is controlled by a thin
layer of saturated solution that forms instantly around a solid particle Also the rate at which
a solid substance dissolves in its own solution is proportional to the difference between the
concentration of the solution and the concentration of the saturated solution
In 1904 Nemst and Brunner modified the Noyes-Whitney equation by applying Ficks law of
diffusion5 They were able to show a relationship between the dissolution rate constant and
5 Nemst W Brunner E Velocity of Reaction in Non-Homogeneous System Physical Chemistry 1904 47 56shy102
[7)
Seton Hall University
the diffusion coefficient Refer to equation 6 The equation for Ficks law of diffusion is
shown below
(Equation 6) DS
k - Vh
where D represents the diffusion coefficient (cm2s) S is surface area (cm2) of the diffusion
layer V the solution volume (mL) and h is the diffusion layer thickness (Jlm) By applying
Ficks law equation 7 was derived as shown below where k is the intrinsic dissolution rate
constant
(Eq uation 7)
dx (DS)- =k - (Cs-Ct)dt Vh
Based on the equations discussed earlier it is evident that certain properties of the drug are
important when determining dissolution These properties include the solubility physical
form media and pH of the media
In the 1950 s the emphasis shifted from studying the effects of physicochemical properties of
drugs on dissolution to correlation of dissolution to bioavailability (BA) of dosage forms Oral
bioavailability is a key pre-requisite for any orally administered drug to be systemically
effective The United States Food and Drug Administration (FDA) defines bioavailability
according to 21 CFR 320 (sect 3201) 6 as the rate and extent to which the active ingredient or
active moiety is absorbed from a drug product and becomes available at the site of action
For drug products that are not intended to be absorbed into the bloodstream bioavailability
6 Bioavailability and Bioequivalence Requirements Code of Federal Regulations Part 320 Title 21 2003 [8]
Seton Hall University
may be assessed by measurements intended to reflect the rate and extent to which the active
ingredient or active moiety becomes available at the site of action This definition focuses on
the processes by which the active ingredients or moieties are released from an oral dosage
form and move to the site of action7 The definition above focuses on the process by which
the active drugs or ingredients are released from an oral dosage form and move to the site of
action in the human body As noted in the guidance document bioavailability is documented
by developing a systemic exposure profile This profile can be achieved by measuring the
concentration of active ingredients and its active metabolites over time in samples collected
from the systemic circulation Systemic circulation describes the part of the cardiovascular
system within the human body which carries oxygenated blood away from the heart and
returns deoxygenated blood back to the hearts Bioequivalence (BE) also plays an important
role when considering dissolution As per the FDA bioequivalence is defined in sect 3201 as
the absence of a significant difference in the rate and extent to which the active ingredient or
active moiety in pharmaceutical equivalents or pharmaceutical alternatives becomes available
at the site of drug action when administered at the same molar dose under similar conditions
in an appropriately designed study Both bioequivalence and bioavailability focus on the
release of a drug substance from a drug product and subsequent absorption in the system
circulation Moreover this is the basis for pharmacokinetics
Pharmacokinetics may be simply defined as what the body does to the drug It attempts to
study the mechanisms of absorption and distribution of the administered drug the rate at
7 Guidance for Industry Bioavailability and Bioequivalence Studies for Orally Administered Drug ProductsshyGeneral Considerations 2003 US Department of Health and Human Services FDA [Online] httpwwwfdagovcderguidanceindexhtm (accessed May 12011)
[9]
Seton Hall University
which the drug begins and duration of the effect Bioavailability and bioequivalence rely on
pharmacokinetics measurements such as AVC and Cmax that reflect the systemic exposure
AVC is the area under the plasmalserumlblood concentration-time curve from time zero to
time t where t is the last time point with measurable concentration for individual formulation
Cmax measures the peak exposure by measuring the peak drug concentration obtained
directly from the data without interpolation 9
In the 1950s the scientific community focused its interests on dissolution as the rate process
for controlling the absorption of active drugs into the bloodstream In 1951 Ll Edwards
suggested that the analgesic activity of aspirin tablets can be manipulated by its rate of
dissolution within the GI tract lO Edwards studied the kinetics of the dissolution of aspirin in
water at different pHs but over the same temperature range The solubilities of aspirin were
measured and diffusion rates were recorded at several concentrations He determined that the
diffusion coefficients are not independent of the concentration Edwards suggested that the
dissolution of an aspirin tablet in the stomach and intestine is the rate process controlling the
absorption of the aspirin into the bloodstream
In 1960 Levy and Hayes used a beaker and a three blade stirrer to demonstrate that the
incidence of GI irritation of different brands of aspirin is dependent on the dissolution rates of
8 Wilding I Bioequivalence testing for locally acting gastrointestinal products what role for gamma scintigraphy Journal ojClintcal Pharmacology 200242(11) 1200-1210 9 Guidance for Industry Bioavailability and Bioequivalence Studies for Orally Administered Drug ProductsshyGeneral Considerations 2003 US Department of Health and Human Services FDA [Online] httpwwwfdagovcderguidanceindexhtm (accessed May 1 2011) 10 Edwards L J Solution and diffusion of aspirin in aqueous media Transactions ojthe Faraday Society 1951 471191-1210
[10J
Seton Hall University
the dosage forms In other words the dissolution rates were critical for the release of aspirin
into the body and causing irritation Thus if the release profile is controlled then the irritation
levels are controlled During this period it was recognized that although disintegration was a
critical process de-aggregation was also essential for bioavailability Disintegration is the
process by which an object breaks down or loses it cohesive ability De-aggregation J2 is the
dispersion of particles and dislodgment of the granules Usually surfactant in solution helps
in the de-aggregation process Figure -2 is an illustration of where disintegration and de-
aggregation occur in the dissolution process The dissolution process occurs in three phases
In Phase I the rate of dissolution is very slow as during this process solvent diffuses into the
solid material (eg the pill) via a process called wetting The initial period is called
mechanical lag Also during this phase the solid particles undergo disintegration and
deaggregation In Phase II the solid particles are well dispersed into the solvent and the rate
of dissolution is more rapid This rate follows a zero order kinetics profile (rate = dxldt=k)
This is followed by Phase III in which 1-2 of the active ingredient is dissolved at a much
slower rate The slower rate is caused by particles that have not been properly wetted and
have not been de-aggregated In this simulated diagram approximately 5 of the active
ingredient does not dissolve While this level of incomplete dissolution is unlikely to occur in
a well formulated pill this section of the diagram nicely represents a process by which some
of the active ingredient never dissolves Two primary factors preventing complete dissolution
are occlusion and saturation In occlusion the active ingredient is so well aggregated that it is
11 Levy G Hayes B A Physiochemical basis of the buffered acetylsalicylic acid controversy New England JournalofAledicine 1960211053-1058 12 Liu J Stewart P J Deaggregation during the dissolution ofbenzodiazepines in interactive mixtures Journal ofPharmaceutical Sciences 1998 87(12)1632-1638
[11]
Seton Hall University
poorly wetted that dissolution is not accomplished during the time of the experiment
Alternatively saturation may have occurred whereby the active ingredient has reached its
thermodynamic limit of solubility which prevents complete dissolution Equilibrium suggests
that complete dissolution is difficult to achieve Equilibrium is the condition of the system in
which competing influences are balanced
[12]
--
--
Seton Hall University
Figure 1-2 Dissolution process
100 ~------------------------------------~~
Occlusion
IIICU gt c-o en tilII-en
tile oMechanical Lag at -s c e offt ~
---- Deaggregation
000 L~==_D~is~in~t=eg~r~a~ti~o~n_________ Time
[13]
Seton Hall University
In 1978 Underwood and Cadwallader13 modified the Noyes-Whitney equation to take into
consideration sink conditions They showed that solubility plays an important role in
dissolution Sink conditions exist when the volume of the dissolution medium is three to ten
times larger than the volume required to make a saturated solution of the solute Thus sink
conditions exist when the concentration (C) of active drug in the medium at time t is much
smaller than the saturation concentration (Cs) They revised the Noyes Whitney equation
accordingly M represents the mass of substance remaining to be dissolved A represents
the surface area of the drug exposed to the dissolution medium and k represents the intrinsic
dissolution rate constant (dissolution constant)
(Equation 8)
dM - = -kA (Cs - C)dt
Moreover as the concentration of the solution increases the equation predicts that dMdt
decreases When the concentration of the saturated solution is much larger than the
concentration of the drug (Csraquo C) in the solvent at time t then equation 9 is obtained
(Equation 9)
dM - = -kACsdt
Underwood and Cadwallader concluded that the overall dissolution rate increases with
increasing dissolution rate constant (k) increased surface area (A) and increased solubility
13 Underwood F L Cadwallader D E Automated potentiometric procedure for studying dissolution kinetics of acidic drugs under sink conditions Journal ofPharmaceutical Sciences 1978 67(8) 1163-1167
[14]
Seton Hall University
(Cs) Therefore by maintaining A and Cs as constants the dissolution rate constant can be
conveniently measured
Furthermore they stated that the dissolution rate of a drug from a constant surface area under
sink conditions should follow zero-order kinetics For zero-order kinetics a linear plot of
[drug concentration] vs time can be used to determine the rate (k) This value can be
interpolated from the slope However when there is a much higher level of a solute such as of
benzoic acid in solution the dissolution rate decreased slightly as shown in Figure 1-3 and
Figure 1-4 below Underwood and Cadwallader document that a possible reason for this
decrease is that the concentration of the buffering compounds in the dissolution medium could
retard the dissolution of the solute ie benzoic acid As the concentration of benzoic acid in
solution increases there is competition for solvent Also the buffer pH decreased slightly as
the benzoic acid dissolves which could have decreased the pH of the diffusion layer adjacent
to the solid benzoic acid particles and caused a decrease in the dissolution rate
[15]
Seton Hall University
Figure 1-3 Importance of sink conditions in dissolution dissolution of benzoic acid at low concentrations Underwood and Cadwallader (Ref 8) (Figure reproduced from figure-1 in article)
1200 Q w ~ i s I shyZ 100)
i If(
Linear at low conc
16 32 M(NUTES
-DiQOlution of noic acid from nondiintratint dUll in dislillH ttlr (pH-lal 62) at ~ GJHIIOO rTJIL
[16]
Seton Hall University
Figure 1-4 Importance of sink conditions in dissolution dissolution of benzoic acid at higher concentrations Underwood and Cadwallader (Ref 8) (Figure reproduced from figure-3 in article)
1100
1200
300
Non-Linear at higher cone -------
eo 0 120 150 MINUTES
-Dillmueion 01 HMoie acid from a nonduit~ti did in buff (pH 62) CIl rrw 100 rpm
[171
Seton Hall University
As a consequence of the research that had occurred from late 1800 s to mid 1900 s in 1970
the first official dissolution test appeared in USP XVIII The United States Pharmacopeia or
USP14 is a non-governmental official public standards-setting authority for prescription and
over-the-counter medicines and other healthcare products manufactured or sold in the United
States USP also sets widely recognized standards for food ingredients and dietary
supplements They set standards for the quality purity strength and consistency of these
products which are critical to the public health
Increased interest in dissolution regulations continue to grow well into the 1970s In fact in
1978 the FDA published the document entitled Guidelines for Dissolution Testing15 The
intention behind this publication was to combine and streamline the systems and processes of
different laboratories This was due to the fact that dissolution results were observed to have
high variability and minor changes in the equipment parameters increased variability The
FDA realized that they needed more controls on the tolerances of the dissolution equipment
so that results are more reproducible Additionally the FDA and USP introduced the idea of
calibrator tablets In 1978 the USP launched three calibrator tablets Prednisone Salicylic
Acid and Nitrofurantoin These calibrator tablets were used during the calibration of the
instrument to validate that the dissolution bath is working as indicated The calibrator tablets
have known specification limits and the calibrations of the instruments have to be within
14 United States Pharmacopeia Home Page hplwwwusporg (accessed May 12011) 15 Guidance for Industry Dissolution Testing oflmmediate Release Solid Oral Dosage Forms 1997 US Department of Health and Human Services FDA [Online] hplwwwfdagovcderguidanceindexhtm (accessed May 12011)
[18]
Seton Hall University
those limits To gam an appreciation of the complexity of the dissolution system and
equipment parameters an overview of the technology will be given in the next section
In 1995 the USP assigned unique numbers to the different dissolution apparatus that were
available to the scientific community Specifically there are seven different types of
dissolution equipment generally used These are listed below in Table 1-1
[19]
i
Seton Hall University
Table 1-1 Dissolution apparatus in the pharmaceutical industry
Dissolution Apparatus Number Dissolution Apparatus Name
Apparatus 1 Basket
Apparatus 2 IPaddle
Apparatus 3 IReciprocating Cylinder
Apparatus 4 I Flow Through Cell
Apparatus 5 Paddle over Disk
Apparatus 6
[20]
Seton Hall University
Apparatus 1 and 2 are most widely used in the pharmaceutical industry As shown above the
first instrument uses baskets method while the second one uses paddles Figure -5 is a
schematic illustration of these two apparatuses The apparatuses are comprised of a covered
vessel a metallic drive shaft a motor to spin the shaft a cylindrical basket (Apparatus 1) or a
paddle (Apparatus 2) and a water bath or heated jacket capable of maintaining the
temperature of the vessels at 37deg plusmn 05degC
[21]
Seton Hall University
Figure 1middot5 Schematic illustration of Apparatus 1 and Apparatus 2 (Reproduced from USP General Chapter on Dissolution lt711raquo
----11-- SllNDU --1---shyDISSOLUTION
ISm
[22]
Seton Hall University
Although the figures above appear simple in design there are strict regulations for the
specifications of each component of the apparatus and tolerances for each component are
specified by USP lt711gt16 Refer to Figure 1-6 and Figure 1-7 for schematic diagrams of the
specifications set by the USP for Apparatus 1 and Apparatus 2 respectively
As a result of these regulations of the past fifty years the number of USP monographs
including dissolution monographs has exponentially increased As shown in Figure 1-8 in
1970 there were only twelve monographs In May of 2011 there were 740 dissolution USP
monographs 17 18 19
16 US Pharmacopoeia amp National Formulary- USP General Chapter lt711gt Dissolution USP [Online] httpwwwusporg (accessed May 12011) 17 Cohen J Hubert B Leeson L Rhodes C Robinson J Roseman T Shefier E The Devlopment of USP Dissolution and Drug Release Standards Pharmaceutical Research 1990 7(10) 983-987 18 Dokoumetzidis A Macheras P A century of dissolution research From Noyes and Whitney to the Biopharmaceutics Classification System International Journal ofPharmaceutics 2006321 I-II 19 US Pharmacopoeia amp National Formulary- USP Monographs including dissolution (2011 summary) httpwwwusporg (accessed May 12011)
[23]
Seton Hall University
Figure 1-6 USP Apparatus 1 Specifications (Reproduced from USP General Chapter on Dissolution lt711raquo
13 to 15 or 9Uo 101 mm
Vlntholl
20 05 mm diameter
Retention spring with 3 tang on 13)6 centers 51 to5mm
Clear opening 2O2t10mm -r-
Screen DO 2Ui tDmm
Screen wllh welded seam 025-031 mm wire diameter with wire openings of 036-044 mm INote-After welding the screen may be slightly altered]A
Note-Maximum allowable runout at U AN is t 10 mm when the part is rotated on center line axis with basket mounted
310 30mm
202 IDmm 250 t 30 mm
[24]
Seton Hall University
Figure 1-7 USP Apparatus 2 specifications (Reproduced from USP General Chapter on Dissolution lt711raquo
~Z~IMI 1 0 it10 i
1----1I 8 l-r 7110 IMJ Iraquo 7$D IMfI -I
NOTESshy(1) Aand Bdimensions
not to ry more thin 05 MIn when part is roIated on eeneer line axis
(2) Tolerancel nt t 10 mmun ~ I4Ited
415 mm radiJI
I
I I shyI
I I
f
[25]
Seton Hall University
Figure 1-8 Monographs including dissolution in the United States Pharmacopeia (USP)
800
700
600
(J) 500pound c (0 L OJ 4000 c 0 2 300 I
200
100
0 1970 1980 1990 2000
Time (year)
2004 2006 2011
[26]
Seton Hall University
As a result of the high regulations and increased number of USP monographs including
dissolution this research will improve dissolution testing Conventional ways of testing have
been used for many years by the industry Specifically the UVNis and HPLC systems have
gone through several stages of evolution but continue to be used as the standards This
research and technique will attempt to improve dissolution testing in several ways First this
technique will allow for in-situ analysis which is very important when dealing with sensitive
drug formulations These sensitive formulations are susceptible to more sampling error when
samples are withdrawn from the dissolution vessel Second FTIR spectroscopy can be
advantageous to dissolution testing Unlike UVNis spectroscopy which gives a single peak
per active drug FTIR spectroscopy can be sued to monitor drug release via monitoring of
numerous functional groups Moreover FTIR spectroscopy can be used to track chemical
transformations within the vessel This will be discussed in chapter three ofthis thesis Lastly
FTIR can be used to study multi-component drug formulations
[27]
Seton Hall University
12 Infrared Spectroscopy
A brief overview is warranted Infrared spectroscopy is the spectroscopy that deals with the
infrared region 14000 cm- (714 nm) to 10 cm- (lxl06 nm) of the electromagnetic spectrum
Moreover the IR portion of the electromagnetic spectrum is divided into three regions near-
infrared mid-infrared and far-infrared The near-infrared20 energy approximately in the
region between 14000-4000 cm- can excite overtone or harmonic vibrations The midshy
infrared2 energy approximately in the region between 4000 cm- (2500 nm) to 400 cm-
(25000 nm) can be used to study the fundamental vibrations of structures The far-infrared
region approximately in the region between 400-10 cm- l can be used to study to rotations of
structures With IR spectroscopy different functional groups adsorb at different IR bands or
regions as shown in Table 1-222 Thus this technique can help identify and even quantify
organic and inorganic molecules
20 J Workman Jr Interpretive spectroscopy for near-infrared The Handbook ofOrganic Compounds Academic Press California 2001 pp 143-182 21 Heise H M Kupper L Butvina L N Attenuated total reflection mid-infrared spectroscopy for clinical chemistry applications using silver halide fibers Sensors and Actuators B Chemical1998 51 (1-3) 84-91 22 Images and frequencies obtained from httpwwwchemcsustanedututoriaisinfraredhtm (accessed May 1 2011)
[28J
Seton Hall University
Table 1-2 Absorption bands (Ref 22) (Reproduced from table of frequencies found on CSU Website link)
Bond Compound Type frequency range cm1
CmiddotH Alkanes 2960-2850s) stretch 1470-1350(v scissoring and bending
CH3 Umbrella Deformation 1380m-w - Doubletmiddot isopropyl (middotbutyl
CmiddotH Alkenes 3080middot3020(m) stretch 1000-675(s) bend
CmiddotH Aromatic Rings 3100middot3000(m) stretch
Phenyl Ring Substitution Bands 870-675(s) bend Phenyl Ring Substitution Overtones 2000-1600(w) shy fingerprint region
CmiddotH Alkynes 3333-3267(s) stretch
700middot61 O(b) bend C=C Alkenes 16BO1640(mw) stretch
CsC Alkynes 2260-2100(wsh) stretch
C=C Aromatic Rings 1600 15OO(w) stretch CoO Alcohols Ethers Carboxylic acids Esters 1260-1000(5) stretch C-O Aldehydes Ketones Carboxylic acids Esters 1760-1670(5) stretch
OmiddotH Monomeric -- Alcohols Phenols 3640-3160Sbr) stretch
Hydrogen-bonded - Alcohols Phenols 3600-32oo(b) stretch Carboxylic acids 3000-25OO(b) stretch
NmiddotH Amines 3500-3300(m) stretch 1650middot15BO (m) bend
CoN Amines 1340-1 020(m) stretch
C=N Nitriles 2260-2220(v) stretch
NOl Nitro Compounds 1660-15OO(s asymmetrical stretch 1390middot1260(s symmetric al stretch
[29]
Seton Hall University
The infrared spectrum of a sample can be obtained by passing a beam of infrared light through
the sample A Fourier transform instrument23 can be used to measure how much energy was
absorbed by the sample over the entire wavelength range The interferometer is a
fundamentally different piece of equipment than a monochromater The light passes through
a beamsplitter which sends the light in two directions at right angles One beam goes to a
stationary mirror then back to the beamsplitter The other goes to a moving mirror The
motion of the mirror makes the total path length variable versus that taken by the stationary-
mirror beam When the two meet up again at the beamsplitter they recombine but the
difference in path lengths creates constructive and destructive interference an interferogram
A mathematical function called a Fourier transform converts an intensity-vs-time spectrum
into an intensity-vs-frequency spectrum Refer to equation 10 A (r) and X (k) are the
frequency domain and time domain points respectively for a spectrum ofN points
(Equation 10)
irkACr) = L XCk)expC-2n IV)
The FT -IR system can produce both transmittance and absorbance spectrum Refer to Figure
1-9 for an illustration of the FT -IR system24 The interferogram represents the light output as a
function of mirror position The FT-IR raw data is processed to give the actual spectrum of
light output as a function of wavenumber
23 Smith BC Fundamentals of Fourier Transform Infrared Spectroscopy CRC Press London 1996 Chapter 4 24 Image obtained from httpmmrccaItecheduiFTIRlFTIRintropdf (accessed July 1 2011)
[30]
Seton Hall University
Figure 1-9 FT-IR system schematic (Ref 24)
IR Source c-ftI A
Mirror
Sample Compartment ___------
[311
Seton Hall University
13 Literature background in situ ATR-IR and dissolution
In the pharmaceutical industry there are two main oral dosage forms tablets and capsules
These are immersed in an aqueous solution and the concentration of the active ingredient is
monitored as a function of timeS Unfortunately dissolution testing provides limited
information on chemical processes that take place within a dissolution vessel This is due to
the limited capabilities of the techniques that are used during dissolution For instance most
dissolution analysis is carried out using Ultraviolet (UV) Visible (Vis) spectroscopy which
only gives concentration as a function of time HPLC is used to separate multi-component
drugs but still utilizes UVNis detectors as the backbone One of the challenges the industry is
faced with is to increase an understanding of the mechanisms governing dissolution The
current approach relies heavily on a data-driven approach The health authorities have
challenged the pharmaceutical industry to understand dissolution and make the dissolution
test more biologically relevant2627 To have a better understanding of dissolution dissolution
chemists need to explore other instruments and experiments that could give insight into what
is happening inside of the vessel Our research focuses on using A TR mid-infrared
spectroscopy as an in situ technique to monitor and study the dissolution of pharmaceutical
tablets Moreover this research will give more insight into the science behind dissolution
Specifically this research will attempt to not only monitor dissolution profiles using FTIR but
25 a) Dressman J J Kramer J K Eds Pharmaceutical Dissolution Testing Taylor and Francis Florida 2005 b) Hanson R Gray V Handbook of Dissolution Testing 3rd ed Dissolution Technologies Delaware 2004 26 Tong C DSouza SS Parker Mirza T Commentary on AAPS workshop - Dissolution testing for the twenty-first century Linking critical quality attributes and critical process parameters to clinically relevant dissolution Pharmaceutical Research 2007 24 1603-1607 27 Tong c Lozano R Mao Y Mirza T Ldbenberg R )ickerson 8 Gray V Wang Q The value of in Vitro dissolution in drug development A position paper from the AAPS in Vitro release and dissolution focus group Pharmaceutical Technology 20093352-64
[32]
Seton Hall University
also try to explain certain reactions (ie transformation of a drug from one form to another-
hydrolysis) that are otherwise missed with UV Vis spectroscopy Literature research on this
topic shows that attempts have been made to study dissolution using near-infrared
spectroscopy and infrared imaging
Attempts have been made to improve the characterization of the controlled release
formulations by FT-IR imaging in ATR-IR mode28 Van der Weerd and colleagues described
the design and implementation of a new cell which allows the study of drug release from
tablets by macro-FT-IR ATR imaging with a diamond ATR accessory The tablet formulation
can be compacted directly on the A TR crystal The authors explain that various components
in the tablet can be determined FT-IR imaging The described cell was applied to study a
model tablet consisting of hydroxy propyl methylcellulose (HPMC) and caffeine The study by
Van der Weerd and co-workers demonstrate that the amount of drug rapidly decreases due to
diffusion Direct observation of this well know phenomenon is unattainable by dissolution
techniques but FT-IR imaging in ATR mode provides a means to achieve this
Moreover Van der Weerd and Kazarian explored FT-IR imaging as a useful application for
studying the distribution of different components in the tablet eg drug polymer and water
as a function of time It was shown that the release profile obtained by FT-IR imaging is
comparable to that obtained by the flow-through dissolution test with UV spectroscopic
28 a)Van der Weerd 1 Kazarian S G Combined approach ofFTIR imaging and conventional dissolution tests applied to drug release Journal Controlled Release 200498295-305 b) Van der Weerd 1 Chan K L A Kazarian SG An innovative design of compaction cell for in situ FT-IR imaging of tablet dissolution Vibrational Spectroscopy 200435(1-2)9-13
[33]
1
Seton Hall University
detection In addition FT -IR imaging was also used to investigate the release of a poorly
soluble drug from pharmaceutical tablets9
Blanc030 and co-workers investigated the use of near-infrared as a tool to study the dissolution
profiles in pharmaceutical tablets Their determination was based on the application of Partial
Least-Squares 2 (PLS2) multivariate calibration models to NIR spectra for individual tablets
Marcelo and his colleagues documented that the proposed NIR method provides accurate
predictions of dissolution profiles In fact the coefficient of correlation between the
dissolution profiles obtained with it and a reference method exceeded 099 (r) in all cases and
calibration and prediction errors fell within acceptable ranges (6-7) They conclude that the
method allows the entire dissolution profile of intact pharmaceutical tablets to be determined
in a simple clean expeditious manner without the need to use any reagents or solvents or the
production of any waste
In addition Chan3l and co-workers investigated the use of FT-IR imaging as a tool to study
formulations of ibuprofen in poly(ethylene glycol) (PEG) enabled characterization of the
distribution of both polymer and drug in the tablet The authors attempted to study the
mechanism of dissolution and drug release for two tablet preparation methods mechanical
mixing and melt extrusion The mechanisms of dissolution were compared using this
spectroscopic imaging approach and found it to be very informative
29 a)Van der Weerd J Kazarian S G Release of poorly soluble drugs from HPMC tablets studied by FTIR imaging and flow-through dissolution tests Journal ofPharmaceutical Science 2005 94 2096-2109 b) Vander Weerd J Kazarian SG Validation of macroscopic attenuated total reflection-Fourier transform infrared imaging to study dissolution of swelling pharmaceutical tablets Applied Spectroscopy 200458(12) 1413-1419 30 Blanco M Alcala M Gonzalez J M Torras E Determination ofdissolution profiles in intact pharmaceutical tablets by NIR spectroscopy The Journal ofProcess Analytical Technology 20063(5)25-29 31 Chan K L A Kazarian SG Dissolution of solid dispersions of ibuprofen studied by Fourier Transform infrared imaging Polymeric Drug Delivery 2006 203-214
[34]
2
Seton Hall University
Dissolution of salicylic acid acetylsalicylic acid and acetaminophen using In Situ A TR-IR spectroscopy
This chapter focuses on describing the application of in situ attenuated total reflectance-
infrared spectroscopy (ATR-IR) as a technique for measuring and studying dissolution of
pharmaceutical formulations products The majority of the methods for monitoring
dissolutions utilize UV-Vis spectroscopy For example aliquots are manually withdrawn and
analyzed by UV-Vis spectroscopy or HPLC with UV-Vis detection However the sampling
process is disruptive to the dissolution profile since removal of aliquots from the vessel
disturbs the solution In addition there are instruments that allow real-time analysis using in
situ UV-Vis probes For example fiber optic dissolution testing is used in the industry to
monitor pharmaceutical drug product release Fiber optic dissolution is also used for
formulation development32 Formulators are using in situ UVNis systems to profile and
develop drugs faster Instead of relying on conventional techniques where dissolutions are
conducted manually and analyzed offline the advantage of the fiber optic system is that it
allows for real-time data analysis
There is interest in the development of new methods that do not require manual sampling
Also for multi-component formulations it is important to be able to observe the dissolution
profile of each active pharmaceutical ingredient (API) Thus there is also interest in the
development of new spectroscopic methods that enable observation of multiple components
The use ATR-IR for analyzing aqueous samples is limited by the relatively high concentration
32 Mirza T Liu Q Vivilecchia R Joshi Y Comprehensive validation scheme for in situ fiber optics dissolution method for pharmaceutical drug product testing Journal Pharmaceutical Science 2009 98 1086shy1094
[35]
Seton Hall University
of analyte required for detection33 Hence this research investigated the use of ATR-IR as a
technique for monitoring and understanding dissolution Limit of detection (LOD) and limit
of quantitation (LOQ) will play important roles in determining the sensitivity of the system
The LOD and LOQ values will be discussed in detail in chapter four of this thesis Refer to
equation II and 12 for the limit of detection and limit of quantitation calculations
(Equation 11)
LOD = 3x (S~)
(Equation 12)
LOQ = lOx (S~)
A TR spectroscopy is a sampling technique that is based on molecular vibration and the
curvature of light beams when passing through different mediums An A TR spectrum is
generated by transmitting radiation which can be IR (from 01 x 10-5 cm to 75 x 10-5 cm)
VIS (from 70 x 10-5 to 40 X 10-5 cm) or UV (from 40 x 10-5 cm to 22 x 10-5 cm) through an
optical crystal in contact with a sample and then determining what portion of the incident
radiation is attenuated by the sample at a particular wavelength
With A TR sampling the IR beam is directed into a crystal of relatively higher refractive
index The IR beam reflects from the internal surface of the crystal and creates an evanescent
wave which projects orthogonally into the sample in intimate contact with the A TR crystal
Some of the energy of the evanescent wave is absorbed by the sample and the reflected
33 Regan F Meaney M Yos J G Maccraith B D Walsh J E Determination of pesticides in water using [36]
Seton Hall University
radiation (some now absorbed by the sample) is returned to the detector The refractive
indices of the crystal and sample are important considerations in the ATR sampling technique
Refer to equation 13
(Equation 13)
where n2 is the refractive index of the sample n 1 is the refractive index of the crystal and 8c
is the critical angle ATR spectrometry is used extensively in clinical assays medical
diagnostics and laboratory testing34 Since the depth of penetration for the evanescent wave
in A TR spectrometry is shallow there is a low incidence of Fresnel Reflection Thus reliable
spectral analysis of murky semisolid turbid and optically dense solutions is possible with
ATR spectroscopy Moreover the A TR crystal is a relatively chemically resistant Zn-Se
crystal that can be coated with an additional chemically resistant material which enables IR
spectroscopy to be performed in aqueous solution
Therefore in situ A TR-IR spectroscopy has the unique potential to simultaneously address
problems associated with manual sampling and multi-component analysis discussed above
This is a potentially useful method for dissolution testing Modern infrared instruments can be
equipped with fiber optic probes containing A TR crystals that are chemically robust provide
excellent sensitivity and with respect to in situ UV-Vis are not affected by turbidity In
addition since IR is very sensitive to specific functional groups it has greater versatility in
ATR-FTIR spectroscopy on PVCchloroparaffin coatings Analytical Chimica Acta 1996 334 85-92 34 Bynum K Kassis A ATR Crystal Device US Patent 6841792 March 102002
[37]
Seton Hall University
differentiating components in a multi-component mixture than UV-Vis spectroscopy35 In this
chapter the successful development of dissolution tests using in situ ATR-IR spectroscopy to
analyze single and multi-component mixtures is described
Since dissolution testing has evolved into a highly regulated activity in the pharmaceutical
industry health agencies have placed a greater emphasis on regulating dissolution methods
The dissolution test is the only one that can give an in vitro snapshot of how the drug product
may behave in vivo Because ofthis function the number of dissolution methods in the United
States Pharmacopeia (USP) has grown substantially Furthermore the US Food and Drug
Administration (FDA) has placed greater importance on the dissolution test The FDA official
website is full of material related to dissolution testing from guidance documents to warning
letters36 Thus the potential impact of a new analytical technique that permits in situ analysis
of multiple active ingredients is large
21 Experimental section
211 Chemical and materials
Acetaminophen reference material (batch no 104KO154) was purchased from Sigma-Aldrich
(St Louis MO USA) Salicylic acid reference material (batch no 04708HE) was purchased
from Sigma-Aldrich (St Louis MO USA) Acetaminophen tablets (Tylenolreg batch no
SLA175) were purchased from a local pharmacy Excedrinreg Caplets (Back and Body Brand
Lot 10067371 Acetaminophen 250 mg Aspirin 250 mg) were purchased from a local
pharmacy Salicylic acid calibrator tablets (USP batch no QOD200) were purchased from the
35 Skoog D Holler 1 Crouch S Principles ofInstrumental Analysis 6th ed Thomson Books 2007 pp 455shy480 36 United States Food and Drug Administration Home Page httpwwwfdagov (accessed May 12011)
[38J
Seton Hall University
USP Methanol acetone and acetonitrile (HPLC grades) were purchased from Pharmacoshy
Aaper Sodium hydroxide (batch no 064214BH) used to prepare the pH buffered solutions
was purchased from Sigma-Aldrich (St Louis MO USA) These analytes were selected
because of their immediate release properties and high solubilities in phosphate buffers
Potassium phosphate monobasic (batch no 103K0060) used to prepare the pH buffered
solutions was purchased from Sigma-Aldrich Glacial acetic acid was purchased from Sigma
Aldrich (St Louis MO USA) All solutions were prepared using water treated by a Milli-Q
Millipore purification system All purified water aliquots have resistivity of not less than 18
MOhm-cm-1
212 Instrumentation
Samples were tested using Mettler Toledos iC10 FT-IR system using a fiber optic probe
equipped with a 1 mm diamond coated A TR probe The IR system was operated by Mettler
Toledos iC IR version 30 or 40 software pH determinations were carried out using a pH
meter from VWR (model no Symphony SB70P) HPLC analysis was carried out using two
systems Hewlett Packard 1 050 (operated by ChemStation) and Waters 2695 (operated by
Empower) All UV measurements were carried out using a Hewlett Packard UV instrument
(model no 8452A diode array) The UV instrument was operated using HPs Softer-Olis
Spectralworks All manual dissolutions were tested using a Vankel Dissolution Bath (model
no 700) All analytical weight measurements were carried out using Mettler Toledos
DeltaRange and AG204 DeltaRange top loading balance
[39]
Seton Hall University
213 Buffered solutions
The pH 58 (200 mM) and 74 (50 mM) phosphate buffered solutions were prepared with
monobasic potassium phosphate in accordance with the USP As described in the USP the
detailed procedure for preparing these buffers is shown below3738
Phosphate Buffered Solution
The volumes shown in the table are for 200 mL of buffer solution Note Where water is
specified for solution or dilution of test substances in pH determinations use carbon dioxide-
free water
bull Sodium Hydroxide Solution (02 M) - Dissolve 40 g of sodium hydroxide in water to make 100 mL
bull Monobasic Potassium Phosphate Solution (02 M) - Dissolve 2722 g of monobasic potassium phosphate (KH2P04) in water and dilute with water to 1000 mL
Table 2-1 Phosphate buffer preparations as per United States Pharmacopeia (USP)
Composition of Standard Buffer Solutions
Phosphate Buffer Place 50 ml of the monobasic potassIUm phosphate soluDon in a 200-ml volumetric ftask add the specified volume of the sodium hydroxide solution then add waterto voume
pH 58 60 62 64 66 68 70 72 74 76 78 80
02 IV NaOH mL 36 56 81 11 6 164 224 291 347 391 424 445 461
214 Dissolution experiments
Single component analysis 300 mg salicylic acid tablets were tested in pH 74 phosphate
buffered solutions Dissolution was conducted using a vessel volume of 500 mL and at
ambient temperature All dissolutions were conducted using USP Apparatus II (paddles) with
an agitation speed of 100 rpm The dissolution run time was seven hours and thirty minutes
37 US Pharmacopoeia amp National Formulary- USP Monograph Salicylic Acid Tablets USP [Online] httpwwwusporg (accessed May 12011)
[40]
Seton Hall University
Multi-tablet analysis 300 mg salicylic acid and 500 mg acetaminophen tablets were tested in
pH 58 phosphate buffered solutions Dissolution was conducted using a vessel volume of 500
mL and at ambient temperature All dissolutions were conducted using USP Apparatus II
(paddles) with an agitation speed of 50 rpm (a slower rpm was chosen to enable a slower rate
of dissolution to help distinguish the components) The dissolution run time was six hours
Multi-component analysis Three Excedrinreg tablets each composed of 250 mg aspirin
(acetylsalicylic acid) and 250 mg acetaminophen were tested in pH 74 phosphate buffered
solutions Dissolution was conducted using a vessel volume of 500 mL and at ambient
temperature All dissolutions were conducted using USP Apparatus II (paddles) with an
agitation speed of 100 rpm The dissolution run time was one hour and thirty minutes
215 HPLC analysis
The single-component analysis experiment was performed using the following HPLC
parameters HP 1050 HPLC Waters Symmetry 300 CI8 5 lm column (46 x 50 mm) mobile
phase was 60401 (water methanolglacial acetic acid) flow rate was 20 mLimin isocratic
mode injection volume was 5 lL and absorbance was set at 296 nm
The multi-tablet analysis experiment was analyzed using the following HPLC parameters
Waters 2695 Waters Symmetry Shied RP CI8 3 lm column (35 x 50 mm) mobile phase
was 70301 (water acetonitriletrifluoroacetic acid (TF Araquo flow rate was 15 mLimin
isocratic mode injection volume was 5 lL and absorbance was set at 296 nm
38 US Pharmacopoeia amp National Formulary- USP Monograph Acetaminophen Tablets USP [Online] -=---------==(accessed May 12011)
[41]
Seton Hall University
The multi-component analysis experiment was performed using the following HPLC
parameters HP 1050 HPLC Phenomenex Intersil ODS C 18 5 11m column (46 x 150 mm)
mobile phase was 60401 (methanol water trifluoroacetic acid (TF A)) flow rate was 10
mLimin isocratic mode injection volume was 25 ilL and absorbance was set at 280 nm
216 ATR-IR analysis
The ReactIRTM iC 10 FTIR instrument is composed of a Mercury-Cadmium-Telluride
(MCT) detector (liquid nitrogen cooled) and the FiberConduittrade When sample
measurements must be made at high speed or when IR throughput is low the highly sensitive
mercury cadmium telluride (MCT) detector provides the ability to scan faster than a DLaTGS
detector while maintaining a constant IR response The FiberConduittrade is comprised of
flexible IR transparent silver chloridesilver bromide optical fibers The fiber optic probe
interface (AgX 95 mm x 15 m Fiber (Silver Halide)) contains a diamond tip-DiComp ATR
crystal The resolution was set to 4 wavenumbers The optical range used by the system is
1900 cm1 to 650 cml The gain adjustment was set to normal (lx) and the apodization
method was set to Happ-Genzel The system uses compressed air (house air filtered and
dehumified) to purge the optics
For the single component testing data treatment was carried out using the following
methodology The data was first subjected to baseline correction An absorption band at 1388
cm- was selected for salicylic acid The height was calculated using a baseline band
correction set at 1370 cm- I The ATR-IR system was configured to collect spectra every five
minutes
[42]
Seton Hall University
For multi-tablet testing the data was first sUbjected to baseline correction An absorption
band at 1388 cm-1 and baseline band at 1370 cm-1 were selected to calculate the peak height
1for salicylic acid An absorption band at 1246 cm-1 and a baseline band of 1276 cm- were
selected to calculate the peak height for acetaminophen The ATR-IR system was configured
to collect spectra every five minutes
For mUlti-component testing the data was first subjected to baseline correction An absorption
band at 1388 cm-1 and a two-point baseline set at 1370 cm-1 and 1414 cm-1 were selected to
calculate the peak area for aspirin (acetylsalicylic acid) An absorption band at 1246 cm-1 and
a two-point baseline set at 1217 cm-1 and 1265 cm- l were selected to calculate the peak area
for acetaminophen The ATR-IR system was configured to collect spectra every three
minutes
For all ATR-IR experiments 256 scans were collected and co-added for each spectral point
On average every spectral point took about two-minutes to complete For all testing the
calculated peak response was subjected to mathematical smoothing using the ielO software
The data was compared to reference standards measurements collected prior to start of the
linearity and dissolution experiments Dissolution data was plotted vs time and all dissolution
experiments were allowed to equilibrate in the buffer for at least half an hour prior to the start
of a dissolution experiment
[43]
Seton Hall University
22 Results and discussion
221 Single-component analysis
2211 Linearity results for salicylic acid using pH 74 phosphate buffer
Salicylic acid was thoroughly studied in pH 74 phosphate buffered solution as recommended
by the USP Since salicylic acid has a pKa of 297 it is almost completely ionized at
physiologic pH 74 Thus the ratio of salicylic acid salicylate is approximately 1 25000
During the method development phase linear dilutions of salicylic acid reference standards
were prepared and analyzed using ATR-IR spectroscopy The linearity experiments served
two purposes 1) they determined whether IR spectroscopy provided a linear response to the
different concentrations of salicylic acid and 2) whether IR spectroscopy can be used for
very low concentration levels of salicylic acid Initially eight levels of salicylic acid standards
were prepared Based on the IR spectra obtained salicylic acid has an IR frequency of interest
at 1388 cm- I (Figure 2-1) The linearity experiments were further analyzed using linear
regression Based on the analysis it was determined that salicylic acid had excellent linear
correlation using IR spectroscopy with a 0997 correlation coefficient (r2) Linear regression
for salicylic acid was calculated using the IR absorption band at 1388 cm-1 and subtracting the
baseline absorption band at 1370 cm- I A chart of the digitized data is attached in Appendix
[A] Since the IR system resolution was set to four large data sets were obtained during the
analysis An example ofthe digitized data can be found in the appendix
[44]
Seton Hall University
Figure 2-1 Salicylic acid spectra at different concentrations in pH 74 phosphate buffered solution
0012
0011
001
0009
0008
~ 0007 c s 00065 ro
0005 CL
0004
0003
0002
0001
0
00321 M -tl-O0161 M +----------1+---------1 -tr-00107 M -00060 M
+---------+-+-+---------1 -00064 M -amp-00054 M 00046 M 00023 M
1330 1350 1370 1390 1410 1430 1450 1470 1490
Wavenumber (cm-1)
[45]
Seton Hall University
Table 2-2 Method development summary for Salicylic Acid (Linearity and Dissolution results)
i Method development parameter Typical Pharmaceutical Results Acceptance criteria
Accuracy (mean) i
- Difference between IR and HPLC Report value 21 I Linearity (n 2 6)
~0997- Correlation coefficient r 0990
- Range(Linearity experiment) Specify range 0016- 01130 mgml
i Limit of detection (LaD) Specify LaD 002 mgml
Limit of quantitation (LaO) Specify LaO 008 mgml
Precision (RSD) I Relative standard deviation 02 (n26) 20
[46]
Seton Hall University
222 Dissolution results for salicylic acid using pH 74 phosphate buffer
The next part of method development phase was to determine the accuracy of A TR-IR
spectroscopy as a technique for measuring dissolution rates of a drug This was determined by
comparing the IR spectroscopy results with HPLC results Although the USP methods
typically recommend vessel volumes of 900 mL the dissolution vessels were filled with 500
mL of pH 74 phosphate buffer in order to increase the signal-to-noise ratio The purpose of
this change was to detect very low concentrations (below 10) of the active drug Practically
the laboratory is not interested in seeing 10 levels but rather higher concentrations
Therefore in order to test the limits of the system the lower dissolution vessel volumes were
used Next the paddle was lowered to the USP recommended position (25 plusmn 2 mm from the
bottom of the vessel) and rotated at 100 rpm at ambient temperature To minimize
hydrodynamic effects the A TR probe was inserted approximately 5 mm below the surface of
the medium39 The first thirty-minutes were used to establish the spectral baseline the shaft
was momentarily stopped and one salicylic acid (300 mg) tablet was dropped into the vessel
Rotation was resumed and IR data were acquired every five minutes for a period of seven
hours During this time aliquot samples were removed and stored in HPLC vials for
subsequent analysis As shown in Figure 2-2 the results from the IR and HPLC systems
match extremely well and the relative accuracy is within plusmn 2
39 Mauger J W Physicochemical and fluid mechanical principles applied to dissolution testing Dissolution Technologies 199637-11
[47]
Seton Hall University
Figure 2-2 Comparison of in situ ATR-IR and HPLC methods for dissolution of a salicylic acid tablet
The dissolution plot below represents dissolved of salicylic acid vs time This particular experiment was carried out over seven hours The light blue diamond data points represent the A TR-IR results whereas the red squares represent the HPLC results Moreover as observed in the figure below the IR data at approximately seven hours appears to be noisy This is probably due to disturbance of the fiber optic probe during the HPLC sample collections at the seven-hour time points
100
90
0 80
(J)
l 700
In In
u E 60 (J)
~ (J) 50a (J) gt
ii 40 3 E 30J ()
20
10
0
-o-Dissolved (iC IR)
bull Dissolved (HPLC)
000 112 224 336 448 600 712 824
Time (hhmm)
[48]
i
Seton Hall University
Table 2-3 Dissolved of salicylic acid Absolute dissolved difference between ATR-IR and HPLC results
This data represents the dissolution results for salicylic acid from Figure 2-2 The ATR-IR data was compared to the HPLC data and the absolute difference between both methods was calculated The average difference was also calculated
Salicylic acid (HPLC) I Salicylic acid (ATR-IR)
Time (hmm) ( Dissolved) i ( Dissolved)
000 00 00 111030
--- 100 209
200 382
300 529
600 878
700 948
144
231
380
509
938
978
Average
Absolute Difference
()
00
33
22
-01
-20
60
30
21
[49]
Seton Hall University
223 Multi-tablet analysis
2231 Linearity results for salicylic acid and acetaminophen in pH 58 phosphate buffer
The USP monograph specifies pH 58 phosphate buffer as the medium of choice for
acetaminophen Thus acetaminophen and salicylic acid were thoroughly studied in pH 58
phosphate buffer As expected regression analysis for salicylic acid indicated an excellent
linear correlation (r = 0994) of IR peak intensity vs concentration For acetaminophen at
low concentrations (~ 011 mgml 07 mM) the relationship between absorbance and
concentration is effectively linear (r2= 0998) However to our surprise non-linear behavior
for both IR and UV -Vis methods was observed at higher concentrations As shown in Figure
2-3 both methods can be modeled using second-order polynomial equations4o
40 Dejaegher B Bloomfield MS Smeyers-Verbeke J Heyden Y Validation of a Fluorimetric Assay for 4shyAminophenol in Paracetamol Formulations Talanta 2008 75 258-265
[50]
Seton Hall University
-- ----------~-------------------------
Figure 2middot3 Calibration curves of acetaminophen standards at pH 58 UVNis absorbance at 296 nm and IR peak intensity at 1246 cm-1
Acetaminophen in pH 58 buffer is linear at the lower concentrations During the early stage
of dissolution the concentration (C) of the active drug is much lower than the saturation
concentration (Cs) However as time progresses the solution becomes saturated at which point the drug will compete for solution space Moreover as more molecules of acetaminophen are in solution more hydrogen bonding (between carbonyl and hydroxyl
groups) will occur between the molecules potentially causing dimerization in solution
0900 ---------------------~------- 00040
0800
0700
0600
i3 0500 c ro ~ 0400 VI 0 laquo 0300
0200
0100
y -13926x2 + 21527x + 00274 R2 09981
---___----------______shyy -00034x2 + 00071x + 00002
09985
Absorbance by UV (5-20 Range)
xAbsorbance by UV (5-120 Range)
ClIR Data Peak Response (1246 cm-1)
00035
00030
00025 0 CD
00020 a
CD
(J) 00015 ~
00010
00005
0000 +-----------r----------==================---+ 00000 0000 0100 0200 0300 0400 0500 0600 0700
Concentration (mgmLJ
[51]
j
Seton Hall University
2232 Dissolution results for salicylic acid and acetaminophen in pH 58 phosphate buffer
To demonstrate the ability of in situ ATR-IR to successfully monitor dissolution of two
different tablets the dissolution profile of salicylic acid and acetaminophen tablets was
determined by simultaneously adding one tablet of each and monitoring the dissolution rate of
both components over seven hours
Although salicylic acid is not used clinically it serves as an USP recommended standard for a
slowly eroding tablet and acetaminophen serves as an example of a tablet that disintegrates
As shown in the figure below the in situ ATR-IR method is clearly able to distinguish the
dissolution of each component For example the acetaminophen tablet disintegrates and
releases acetaminophen more rapidly than the salicylic acid tablet which slowly erodes over
time Thus in situ ATR-IR method is successful in determining the dissolution profile of a
two component system
To compare the in situ ATR-IR method with HPLC and UV-Vis methods aliquots
were taken throughout the experiment and analyzed The results from the in situ ATR-IR and
HPLC systems are overlaid in Figure 2-4 and an excellent correlation is observed between the
two methods In addition samples were analyzed using a UV Nis instrument Since both
salicylic acid and acetaminophen absorb at approximately 296 nm (PH 58) it will not be ideal
to monitor the dissolution of these two components using UV Nis alone Moreover extensive
mathematical equations will be required to solve simultaneous equations in order to
differentiate the two active drugs
[52]
Seton Hall University
Figure 2-4 Simultaneous dissolution of acetaminophen and salicylic acid tablets in situ A TR-IR vs HPLC
The dissolution plot below represents dissolved of individual salicylic acid and acetaminophen tablets vs time Moreover two separate tablets were inserted into a single vessel during the analysis The dissolution was carried out at pH 58 phosphate buffer as suggested by the USP This particular experiment was carried out over six hours The red squares and yellow diamonds represent the HPLC data As observed the ATR-IR and HPLC results are very similar at the specified time-points shown below Since acetaminophen tablets are designed to disintegrate rapidly the drug release quickly as observed in the plot Since salicylic acid is an eroding (slowly releasing) tablet the drug releases slower as observed in the plot In addition the dissolution was carried out using an agitation speed of RPM
100
90
80
70
tI ltI) 60 2 0 ltII ltII 50 is ltilt
40
30
20
10
0
0000
~---~gt---~------~----------~
Time (hhmm)
0030 0100 0130 0200 0230 0300 0330 0400 ()43O 0500 0531 0601
-ltgt- 0 of Acetaminophen (lR) bull 0 ofAcetaminophen (HPLC)
-E- 0 of Salicylic Acid (IR) ltgt 0 of Salicylic Acid (H PLC)
[53]
Seton Hall University
224 Multi-component analysis
2241 Dissolution results for Excedrinreg caplets (aspirin and acetaminophen) in pH 74 phosphate buffer
To demonstrate the ability of in situ ATR-IR to successfully monitor multiple components
within the same tablet dissolution testing was carried out on Excedrinreg caplets The label
claims for the Excedrinreg caplet are acetylsalicylic acid (250 mg) and acetaminophen (250
mg) actives The release profile was determined by simultaneously adding three Excedrinreg
caplets to a 500 mL vessel volume containing pH 74 phosphate buffer Three caplets were
necessary to ensure satisfactory signal to noise ratio Refer to Figure 2-5 for ATR-IR spectra
for Excedrinreg caplets The dissolution rates of both components were monitored over 15
hours Based on the data it was determined that acetylsalicylic acid and acetaminophen were
fully released within 15 hours as shown in Figure 2-6 In situ A TR-IR method is clearly able
to distinguish the dissolution the acetylsalicylic acid and acetaminophen components
To compare the in situ A TR-IR method with HPLC aliquots were taken throughout
the experiment and analyzed The results from the in situ ATR-IR and HPLC systems are
overlaid in Figure 2-6 and an excellent correlation is observed between the two methods
Refer to Table 2-4 to Table 2-7 for statistical values Overall this set of experiments indicates
the versatility of in situ A TR-IR for dissolution testing as it allows automated observation of a
multi-component system without manual sampling and by successfully tracking the
dissolution behavior of two of the major components
[54]
Seton Hall University
Figure 2-5 ATR-IR spectra of Excedrinreg caplets at different time-points during dissolution in pH 74 phosphate buffered solution
ATR-IR spectra for Excedrinreg caplet (acetaminophen and acetylsalicylic acid) in pH 74 phosphate buffer solution Acetaminophen was calculated using wavenumber 1246 cm- I and acetylsalicylic acid was calculated using 1388 cm- I
mmss Acetaminophen Peak --00600 -ltgt- 00900 ( -1246)
0012 _01200 -middotmiddot01501 -- 01800 -02100 --03000 --04200middot --05100 --05701
12100 --12700 ~ 0009 c OJ
E c (ll ~ 0006 e o en D laquo
0003
0+----- 1025 1075 1125 1175 1225 1275 1325 1375
Wavenmuber (em-)
[55]
t
1 1
Seton Hall University
Figure 2-6 Dissolution of acetylsalicylic acid and acetaminophen in Excedrinreg caplets in situ ATR-IR VS HPLC
The figure below represents a plot of Excedrinreg (acetaminophen and acetylsalicylic acid
dissolved) vs time The blue squares and yellow triangles represent the HPLC data points As
observed the two techniques (lR and HPLC) correlate very well Refer to Table 2-4 for more
details
100
90
80
70 0 (I)
~ 60
~ 50is ~ 0
40
30 -Acetaminophen (ATR-IR
20 bull Acetaminophen (HPLC)
--+-Aspirin (ATR-IR)10
6 Aspirin (HPLC)
0 000 010 020 030 040 050 100 1 1 0 120 130
Time(hhmm)
[56]
Seton Hall University
Table 2-4 Dissolution of acetylsalicylic acid (aspirin) and acetaminophen in Excedrinreg caplets ATR-IR raw data
Raw data results for the A TR-IR spectra of Excedrinreg caplets
Acetaminophen (A TR-IR) Aspirin (ATR-IR)
Time (hmmss) ( Dissolved) ( Dissolved)
00000 00 00
00300 48 49
00559 137 136
00859 265 259
01159 416 398
01500 573 525
01759 690 656
02059 792 767
02359 868 861
02700 921 920
02959 958 968 ~
03259 982 992
03559 1001 1006 03859 100A 1021
04159 993 1022 I
04459 990 1002
04800 992 999
05059 989 997 i
05359 993 995
I 05700 996 993
05959 1000 1000
I 10259 992 1000
10600 993 1001 10859 989 999
1 1200 98A 992
11459 976 989 1 1759 979 989 1 2059 981 988 12400 986 988 12659 980 992 13000 986 992
[57]
1
Seton Hall University
Table 2-5 Dissolution of acetylsalicylic acid (aspirin) and acetaminophen in Excedrinreg caplets HPLC raw data
1 pound Ed regRaw HPLCdata resu ts or xce rm caplets
I Time (hmmss)
00000
Acetaminophen (HPLC)
( Dissolv~d)
00
Aspirin (HPLC)
( Dissolved)
00
01100
03000
484 957
299
986 I
10000 980 1007 I
Table 2-6 Dissolved of acetaminophen Difference between ATR-IR and HPLC results
Time I Acetaminophen (HPLC) Acetaminophen (ATR-IR) (hmmss) I ( Dissolved) ( Dissolved) Absolute Difference
00000 I 00 00 00
01100 i 484 416 68
03000 I 957 958 -01
10000 I 980 1000 -20
Table 2-7 Dissolved acetylsalicylic acid (aspirin) analysis Difference between ATR-IR and HPLC results
Time I Aspirin (HPLC) Aspirin (ATR-IR)
(hmmss) ( Dissolved) ( Dissolved) Absolute Difference
00000 00 00 00 01100 299 398 -99
03000 986 9~8 18 10000 1007 I 1000 07
[58]
Seton Hall University
Figure 2-7 Compounds studiedof interest for future work (Chern Draw)
This figure represents some of the compounds studied during the research (ie acetaminophen aspirin) Also other compounds and combinations of these compounds will
be studied during future research These potential compounds include ibuprofen naproxen
and caffeine
Ibuprofen Naproxen HOOC
Acetmninopheuf Caffeine
Acetmnillopheni Aspirini Caffeine
[59]
Seton Hall University
23 Chapter summary
In situ infrared spectroscopy was found to be a viable alternative for measuring dissolution
profiles of pharmaceutical tablets The IR system was found to be impressive in its capability
of measuring very low concentrations The limit of detection was found to be 002 mgml per
IUPAC calculations The IR system was able to distinguish separate components of a mUltiple
component system without requiring manual sampling This versatility is demonstrated by
observing the simultaneous dissolution of acetaminophen and salicylic acid tablets In
contrast UV-Vis spectroscopy may require mathematical corrections to resolve the two active
drugs Furthermore HPLC must be used which requires laborious manual sampling or
purchase of a complicated automated instrument setup of dissolution with HPLC analysis
The in situ ATR-IR method has been validated by comparing dissolution profiles using UVshy
Vis and HPLC methods In addition an accuracy of plusmn 2 between IR and HPLC for the
salicylic acid results was established With the current configuration of the IR instrument this
analysis is limited by the sensitivity and wavelength range of the in situ fiber optic probe
However since this chapter successfully demonstrates the versatility of this novel application
of ATR-IR spectroscopy it is clear that the method has excellent potential to be improved by
modification of the IR instrument and selection of more sensitive probes
[60]
3
Seton Hall University
Kinetics of drug hydrolysis of common over-the-counter (OTC) drugs via ATR-IR spectroscopy
This chapter focuses on describing the hydrolysis of acetylsalicylic acid (aspirin) under acidic
conditions The hydrolysis of aspirin was tested and monitored using ATR-IR spectroscopy
In the presence of an acidic medium acetylsalicylic acid undergoes hydrolysis41 to form
salicylic acid by the following acid-catalyzed mechanism
41 Choudhury S Mitra AK Kinetics of aspirin hydrolysis and stabilization in the presence of 2shyhydroxypropyl-B-cyclodextrin Pharmaceutical Research 1993 10 (1) 156-159
[61]
31
Seton Hall University
Background and history of Aspirin
Aspirin is unique in its history and has many important roles in drug therapy Aspirin is
known to decrease pain It fights the pain and inflammation by blocking the action of an
enzyme called cyclooxygenase which inhibits the formation of prostaglandins42
Prostaglandins are chemicals that signal an injury and trigger pain Moreover aspirin is
mostly known for its ability to reduce strokes Since aspirin inhibits the formation
prostaglandins this results in the inhibition of blood clots which could cause a heart attack or
stroke
Figure 3-1 Structures of acetylsalicylic acid (aspirin)
Aspirin
2D 3D
421to Seiji Okuda Emiko Minami Toshiaki Central and peripheral roles of prostaglandins in pain and their interactions with novel neuropeptides nociceptin and nocistatin Neuroscience Research 2001 41(4) 299-332
[62]
Seton Hall University
The first synthesis of aspirin is credited to Gerhardt43 in 1853 Gerhardt was investigating
mixed organic acid anhydrides Felix Hoffman (1868-1946) used acetic anhydride 44 for
aspirins preparation Felix Hoffmann synthesized aspirin in the laboratories of
Farbenfabriken Bayer Elberfeld Germany in 189745 Legend has it that Hoffman wanted to
help his sick father who was suffering from rheumatism and was no longer able to tolerate
sodium salicylate then widely used for his fathers arthritis disease Salicylic acid however
has several bad flaws Its bad taste stomach irritation and other side effects spurred
researchers to look for other derivatives The intent was to keep salicylics efficacy without
the disadvantages it posed Acetylation of the hydroxyl group was one of the logical
modifications This logical thinking eventually led to the synthesis and discovery of aspirin
Refer to Figure 3-2 below for one of the synthesis pathways that were investigated back in the
late 1800s
Figure 3-2 Synthesis of aspirin-late 1800s (Chern Draw)
CH3COCI or
COOH COOH H3CCO catalyst o
+ 0 H3CCO
or O)lCHOH
H2C=C=O
43 C Gerhardt Annalen der Chemie 67 149(1853) 44 F Hoffmann US Patent C44077 of February 271900 45 Analytical Profiles of Drug Substances 8 Aspirin Klaus Florey (1979)
[63]
Seton Hall University
32 Experimental section
321 Chemical and materials
Acetylsalicylic acid (aspirin) reference material (batch no 016K0131) was purchased from
Sigma-Aldrich This same material was used as is for the powdered aspirin Salicylic acid
reference material (batch no 04708HE) was purchased from Sigma-Aldrich Acetylsalicylic
acid 325 mg tablets (Bayer batch no 219050N) were purchased from a local pharmacy
Methanol acetone and acetonitrile (HPLC grades) were purchased from Pharmaco-Aaper
Sodium chloride crystals (batch no 139602) used to prepare the Simulated Gastric Fluid
(SGF) reagent was purchased from Mallinckrodt Chemicals Cone hydrochloric acid (batch
no H44032) used to prepare the SGF reagent was purchased from JT Baker All solutions
were prepared using water treated by a Milli-Q Millipore purification system All purified
water aliquots have resistivity of not less than 18 MOhm-cml
[64]
Seton Hall University
Figure 3-3 Chemical structures studied (Chern Draw)
OH OH
OH
Acetylsalicylic acid SaUcylic Acid (aspirin)
[65]
Seton Hall University
322 Instrumentation
Samples were tested using Mettler Toledos iCI0 FT-IR system using a fiber optic probe
equipped with a 1 mm diamond coated A TR probe The IR system was operated by Mettler
Toledos iC IR version 30 or 40 software The pH determinations were carried out using a
Symphony pH meter (model no SB70P) All dissolution experiments were tested in Mettler
Toledo EasyMax 102 apparatus using iC Control 41 software All analytical weight
measurements were carried out using Mettler Toledos DeltaRange and AG204 DeltaRange
scale
323 Buffered solutions
The Simulated Gastric Fluid (SGF) pH 12 was prepared with sodium chloride and
aqueous hydrochloric acid in accordance with the USP46 The detailed procedure for
preparing this test solution is shown below
Hydrochloric Acid Solution (02M)
The volumes shown in the table are for 200 mL of buffer solution Note Where water is
specified for solution or dilution of test substances in pH determinations use carbon dioxide-
free water
bull Sodium Hydroxide (02 M) - Dissolve 40 g of sodium hydroxide in water to make 100 mL
bull Potassium Chloride (02 M) - Dissolve 1491 g of potassium chloride (KCI) in water and dilute with water to 1000 mL
46 US Phannacopoeia amp National Fonnulary- Gastric Fluid Simulated USP [Online] httpwwwusporg (accessed May 12011)
[66]
Seton Hall University
Table 3-1 Hydrochloric acid buffer preparations as per United States Pharmacopeia (USP)
Composition of Standard Buffer Solutions
Hydrochloric Acid Buffer Place 50 mL oftha potassium chloride solution in a 200-mL volumetric fiask add l1e specified volume of the hydrochloric acid solution then
add water to volume
pH 12 13 14 1 5 16 17 18 19 20 21 22
02MHCImL 850 672 532 414 324 260 204 162 130 102 78
324 Hydrolysis Experiments
HYDROLYSIS USING ASPIRIN TABLETS
Aspirin tablets 325 mg acetylsalicylic acid tablets were tested in pH 12 simulated gastric
fluid solutions Dissolutions were conducted using vessel volumes of 100 mL and at 37 0e
All dissolutions were conducted using an agitation speed of 100 rpm The dissolution run
times were set for 15 hours
HYDROLYSIS USING ASPIRIN POWDER
Aspirin powder acetylsalicylic acid powder samples were tested in pH 12 simulated gastric
fluid solutions Dissolutions were conducted using vessel volumes of 100 mL and at 37 ltIC
All dissolutions were conducted using an agitation speed of 100 rpm The dissolution run
times were set for 15 hours
325 ATRmiddotIR analysis
The ReactIRTM iC I 0 FTIR instrument is composed of an MCT detector (liquid nitrogen
cooled) and the FiberConduittrade The FiberConduittrade is comprised of flexible IR transparent
silver chloridesilver bromide optical fibers The fiber optic probe interface (AgX 95 mm x
15 m Fiber (Silver Halide)) contains a diamond tip-DiComp ATR crystal The resolution was
[67]
Seton Hall University
set to 8 wavenumbers The optical range used by the system is 1900 cm- I to 650 cm- I The
gain adjustment was set to normal (1 x) and the apodization method was set to Happ-Genzel47
The system uses compressed air (house air filtered and dehumified) to purge the optics
HYDROLYSIS USING ASPIRIN TABLETS
For the hydrolysis of aspirin tablet experiments data treatment was carried out using the
following methodology The data were first subjected to baseline correction An absorption
band at 1202 cm- l (1202-1198 cm- I) was selected for acetylsalicylic acid The peak area was
calculated using a two-point baseline correction set at 1180 cm- l and 1203 cm- I The ATR-IR
system was configured to collect spectra every two minutes
For this experiment data processing is critical to obtain well-resolved spectra Here is how
the data is processed First the peak of interest was identified (1202 cm- I) and the area was
calculated using a two-point baseline correction Next a trend analysis was performed using
the iCIR software on this peak This provided a plot of absorbance vs time This plot was
subjected to smoothing using a 25 point smoothing parameter After smoothing and while
still in the trend analysis the baseline correct routine was performed Then the data were
exported to Excel Further data processing in Excel involved the subtraction of solvent spectra
from reaction spectra To perform this a 30 min set of spectra at the beginning of the
experiment before aspirin pill was added was selected These spectra were subtracted from
the spectra taken after the pill was dropped to give the final set of data Within the final set of
data the area of the 1202 cm- I peak was calculated at each time point Then plot of area vs
47 Application Note Effect of resolution to vapor phase spectrum ofHCI in the Infrared Spectroscopy Shimadzu Co httpwww2shimadzucomapplicationsftirAppl FTIR HCI-vapor-phase 060 enpdf accessed 25 May 2011
[68]
Seton Hall University
time were performed to give rate information In addition using a calibration curve peak
areas were converted to concentration to provide concentration vs time plots
An absorption band at 1086 cm- (1080-1090 cm-) was selected for salicylic acid The peak
area was calculated using a two-point baseline correction set at 1078 cm- and 1101 cm- The
ATR-IR system was configured to collect spectra every two minutes
Preparation of salicylic acid standards 325 mg of standard salicylic acid was added to a 100
mL volumetric flask and 50 mL of SGF solution was added and the flask was sonicated for 1
min to ensure all solids were dissolved Finally the solution was diluted to 100 mL using
SGF
Preparation of acetylsalicyclic acid standards (in this case there are competing concerns
about the lower solubility of the compound and the need to limit the amount of hydrolysis of
the compound) To decrease time the IR was set-up and background spectra were taken prior
to preparing the standard solution Acetylsalicyclic acid (325 mg) was added to a 100 mL
volumetric followed by 75 mL of SGF The flask was sonicated for 10 - 15 to effect complete
dissolution of the solids diluted to 100 mL with SGF
HYDROLYSIS USING ASPIRIN POWDER
For the hydrolysis of aspirin powder experiments data treatment was carried out using the
procedure described above An absorption band at 1202 cm- (1202-1198 cm-) was selected
for acetylsalicylic acid The peak area was calculated using a two-point baseline correction
set at 1180 cm- and 1203 cm- The ATR-IR system was configured to collect spectra every
two minutes
[69]
Seton Hall University
An absorption band at 1086 cm- I (1080-1090 cm- I) was selected for salicylic acid The peak
area was calculated using a two-point baseline correction set at 1078 cm- I and 1101 cm- I The
ATR-IR system was configured to collect spectra every two minutes
For all ATR-IR experiments 256 scans were collected and co-added for each spectral point
On average every spectral point took about two-minutes to complete For all testing the
calculated peak response was subjected to mathematical smoothing using the ielO software
The data were compared to reference standards measurements collected prior to start of the
linearity and dissolution experiments
Preparation of salicylic acid standards 325 mg of standard salicylic acid was added to a 100
mL volumetric flask and 50 mL of SGF solution was added and the flask was sonicated for I
min to ensure all solids were dissolved Finally the solution was diluted to 100 mL using
SGF
Preparation of acetylsalicyclic acid standards (in this case there are competing concerns
about the lower solubility of the compound and the need to limit the amount of hydrolysis of
the compound) To decrease the preparation time the IR was set-up and background spectra
were taken prior to preparing the standard solution Acetylsalicyclic acid (325 mg) was added
to a 100 mL volumetric followed by 75 mL of SGF The flask was sonicated for 10 - 15 to
effect complete dissolution of the solids diluted to 100 mL with SGF
All dissolution experiments were allowed to equilibrate in the buffer for at least half an hour
prior to the start of a dissolution experiment Dissolution data were collected and plots of
percent () dissolved vs time were made
[70]
Seton Hall University
33 Results and discussion
331 Hydrolysis of aspirin to salicylic acid in test tubes
Prior to starting the hydrolysis experiments a qualitative measurement was investigated for
determining the presence of salicylic acid in solution As discussed earlier acetylsalicylic acid
hydrolyzes to salicylic acid in the presence of an acidic medium Ferric chloride was found to
be a good qualitative test for salicylic acid Ferric chloride or iron (III) chloride will not react
with aspirin It will however react with salicylic acid which is used to synthesize aspirin and
is also the hydrolysis product of aspirin Moreover the formation of an iron-phenol complex
will occur48 Thus adding an aqueous ferric chloride solution to a sample of aspirin is a good
way to see if there is any salicylic acid present and a purple color is an indication of salicylic
acid A sample of pure aspirin should not exhibit any color change The ferric chloride color
test is shown in Figure 3-4
48 Cha K Park K Determination of iron (III) with salicy lic acid by fluorescence quenching method Talanta 199846(6)1567-1571
[71]
Seton Hall University
Figure 3-4 Ferric chloride color test- control samples
Acetyl- Fe (III Conto pH aaUcytiC SalICyliC ChIonde
Prior to addition Acidof 1 Fe (III) 6A
aIotIde SoIudon AcetylsalICylIC IIe1d
1OmlnU1eS
CHJCOOH
Time 68 bull
SalICyliC IIIcId
2 minutes Formation of an iron-phenol complex ith Fe(III) gins a
definite purple color
12 SOF Acid IIe1Cl SOtuUon
[72]
Seton Hall University
Table 3-2 Ferric chloride color test concentrations
Experiment number Weight of Aspirin (mg) Weight of Salicylic Acid (mg)
1 321 334
2 339 337
3 317 351
Average weight (mg) 326 341
Volume offlask(s) (ml) 100 100
Average Concentration (mgml) 33 34 I
Table 3-3 Ferric chloride color test observations [added 2mg Iml Fe (III) solution]
Acetylsalicylic acid Time (min) CONTROL Sample (SGF) Sample Salicylic Acid Sample
r omin
1 min
Clear (~o color change)
Clear (no color change)
Clear (no color change)
Clear (no color change)
Dark purple
Dark purple
2 min Clear (no color change) Light purple Dark purple
5min L--------
Clear (no color change) Dar~ purple D(3rk purple
[73]
Seton Hall University
332 Hydrolysis of aspirin to salicylic acid using aspirin tablet as the starting ingredient
The hydrolysis of acetylsalicylic acid (aspirin) tablets was carried out in pH 12 SGF
solutions The solutions were preheated to body temperature 37degC and the ATR-IR fiber
optic probe collected baseline spectra (blank medium) for the first 30 minutes A single 325
mg Bayer aspirin tablet was dropped into the vessel containing 100 mL of pH 12 solution
Standard spectra of pure acetylsalicylic acid (aspirin) and salicylic acid were collected prior to
running the dissolutions These standards were used to identify the unique peaks of interests
for these active drugs and for calculating absorbance intensities to concentration As shown in
IFigure 3-5 aspirin has a unique band at ] 202 cm- I while salicylic acid has one at 1086 cm-
Dissolution plots for aspirin and salicylic acid hydrosylate were made Refer to Figure 3-6
which plots the concentration of acetylsalicylic acid vs time and salicylic acid hydrosylate vs
time This plot shows the formation and elimination of acetylsalicylic acid Moreover the
acetylsalicylic acid hydrolyzed completely to form salicylic acid as shown in the plot The
presence of salicylic acid is detected by the IR system and plotted on a secondary axis as
shown in Figure 3-6 In addition the ferric chloride color test was used to visually inspect the
presence or absence of salicylic acid The ferric chloride solution was added to the aspirin
tablet dissolution vessel after sixty minutes The solution within the vessel quickly turned to a
purple color as shown in Figure 3-7
[741
Seton Hall University
Figure 3-5 Waterfall plot of aspirin tablet dissolution
This is a waterfall plot for the dissolution of 325 mg aspirin tablet in SGF As seen in the figure there are two peaks of interest one at ~1086 cm-1 and one at ~1205 em-I These
represent salicylic acid and aspirin respectively The purple color in the figure represents higher intensities while the blue green represent lower intensities or concentrations As seen in the figure aspirin increases with time and then disappears while salicylic acid increases with time
1086 (Salicylk Acid
1205 [Acetylsalicylic Acid (Aspirin)]
Wavenumber lem-1
[75]
Seton Hall University
Figure 3-6 Hydrolysis of Aspirin Tablets (325 mg) in pH 12 SGF Solution (n=2)
l 24 (1lH n DiuDI_eeI)
l()
L 18 _ 14
16 i
e 12 14 II 10 12 bull0
010 11 CI
~ 8 8 ~
6 ------r~~~~--I i 6 i
4 4
2 ~-------------------------~~
I ~~----------__~~~2(0+) 0 0- 0 (0
00000 00546 01131 01717 02302 02848 03434 04019 04605 05150 05736 10322
11me (hmmss)
Figure 3-7 Ferric chloride color test for salicylic acid (tablet dissolution)
Dissolution Vessel Ferric Chloride Test Results
r======-------- -------=~~~~~-I -AcetylsalicylicAcid
_SalicyliC ACid
16
~-------~r---~----~~------------------------~
~------~r---------- ----------~~
Phenol PresentTime 0 minutes Time = 60 minutes
[76]
Seton Hall University
333 Hydrolysis of aspirin to salicylic acid using aspirin powder as the starting ingredient
It was equally important to understand the rate of hydrolysis of aspirin in powder form Since
the hydrolysis of aspirin in a tablet depends on the dissolution of aspirin into solution first the
rate of hydrolysis of pure aspirin powder should be relatively quicker because all particles are
immediate exposed to the dissolving medium In fact the rate limiting step in this case would
be the dissolution of the particles into the acidic medium As a result the hydrolysis of aspirin
to salicylic acid was monitored and measured using pure aspirin powder Known amounts
equivalent to the amount found in a tablet were placed in the dissolution vessels containing
an acid solution (PH 12 SOF) and the dissolution profiles were collected using A TR-IR
spectroscopy Figure 3-8 shows the dissolution profiles of aspirin and salicylic acid using
aspirin powder In addition the figure clearly shows the formation and then elimination of
acetylsalicylic acid in solution (black line) and the simultaneous formation of salicylic acid
hydrosylate in solution (red line)
[77]
Seton Hall University
Figure 3-8 Hydrolysis of acetylsalicylic acid powder to salicylic acid hydrosylate in pH 12 solution
240
220 ~
200 - ~
~Aspirin Powler [mM180
~ -5alicyli Acid Hydrosylatefrom Powder [mM160 Iri ~ 140e 120
~ ~ ~ j
100
~~ 80 shy Ll -r~
60
40 20
00 ~ ~
010 020 030 040 050 100 110 120 130 140
Time (hmm)
[78]
Seton Hall University
334 Hydrolysis data comparison between tablet and powder formulations
Figure 3-9 compares the IR dissolution profiles of the salicylic acid component in powder
and tablet form As expected the rate of dissolution and hence hydrolysis of salicylic acid is
faster in the powder form The tablet formulation has to undergo wetting disintegration and
deaggregation which take time Similarly Figure 3-10 compares the IR dissolution profiles of
the aspirin component in powder and tablet form As expected the rate of dissolution of
aspirin is faster in the powder form For the tablets in each case there is an initial
mechanical lag associate with the physical breakdown of the tablet However in the case of
the experiments with the powders there no mechanical lag and dissolution occurs
immediately However with powdered acetylsalicylic acid there is an interesting bimodal
behavior Initially an immediate fast dissolution is observed and a secondary process is also
observed at a slower rate as the dissolution occurs Refer to Figure 3-8 The initial rapid
dissolution likely occurs from particles that are well wetted in the initial exposure to the
dissolution medium However aggregation of the powder was also observed suggesting that
some of the acetylsalicylic acid particles were not wetted The dissolution of these aggregates
is associated with the slower dissolution process In addition the aspirin powder was used as
is from the reagent container therefore the powder was inhomogeneous consisting of differ
particle sizes with small and large crystal It is likely that the larger particles and crystals
contribute to the secondary dissolution process However that this process is not observed
with salicylic acid (see Figure 3-9) is reasonable first because salicylic acid is more
hydrophilic than acetylsalicylic acid and second because salicylic acid dissolves at a faster
rate leaving less time for aggregation to occur
[791
Seton Hall University
To develop an overall understanding of the dissolutionlhydrolysis processes that occur with
aspirin a composite plot was prepared (Figure 3-11) In this plot the dissolutions of aspirin
powder and tablet and the hydrolysis of aspirin powder and tablet to form the salicylic acid
hydrosylate are shown The solid blue-line (aspirin powder) and the dotted red-line (aspirin
tablet) compare the IR dissolution profiles of the aspirin component in powder and tablet form
respectively As expected the rate of dissolution of aspirin is faster in the powder form For
the tablets in each case there is an initial mechanical lag associate with the physical
breakdown of the tablet However in the case of the experiments with the powders there no
mechanical lag and dissolution occurs immediately This plot also compares the release
profiles of the salicylic acid hydrosylate in tablet (dotted green-line) and powder formulation
(solid black line) Again for the tablet there is an initial mechanical lag associated with the
physical breakdown of the tablet Also the hydrolysis of aspirin in the powder formulation
appears to be quite rapid Moreover the plot shows this phenomenon occurring prior to the
dissolution of the powder aspirin Currently the dissolution profiles were run at 100 rpm with
a collection rate of two-minutes A higher agitation speed and faster acquisition time (ie
every 1 minute) should synchronize the dissolution of the aspirin and then the release of the
salicylic acid hydrosylate in the powder formulation
[80)
Seton Hall University
Figure 3-9 Release profile of Salicylic Acid (SA) during hydrolysis in SGF (pH12) powder vs tablet
240
220
200
180
~ 160
140 g 120
~ 100
r I
lt 80
60
40
~ A -~~-f
J-f_~~
-L~f P
)1 J r
6 I
9 __Salicylic Acid Hyd rosylate from POlld e r [mMJ t-shy -0-Salicylic Acid Hydrosylate from Tablet [mM]
24
II
20
18
16
14
11
10
8
6
4
20
00
f-shy
(~ 2
0
i
ltaI 1i 2 lt I
000 010 020 030 040 050 100 110 120 130
lime (hmm)
[81]
Seton Hall University
Figure 3-10 Release profile of acetylsalicylic acid (aspirin) during hydrolysis powder vs tablet
Hydrolysis of Acetylsalicylic acid in SGF (pH 12) Release profile of Acetysalicylic Acid Powder VS Tablet
180 18
160 16
140 14
120 --Aspirin Powder [mM] ~ I 12yenC 100C _-cJ-__A~sp_irin~T_a_bl_et_[m_M_)-JI 10=
~
-i -
Il 80 -f----t---~~--~~~~~----------------~L 8 i= lshy 6 e -It 60
Q-lt 11
4 ltt40
20 ~~~---------------~~---------~------------~ 2
00
010 020 030 040 050 100 110 120 130 140
Time (hmm)
[82]
Seton Hall University
Figure 3-11 Release profile of acetylsalicylic acid (aspirin) and salicylic acid hydrosylate during hydrolysis powder vs tablet
240 -~---)
ii-- - --
-IJ--~ __ -Piin Powder [mM
~ - Saliylic Arid Hydrosvate from POW4f [mM
Ir ~ ~ - -lt__ Salicylic Acid HYmiddotdrosyltampfrom Tablet ImM
li -0- ~pirin tablot [m
O u~
24 220
II 200
20 180
18 160
16 ii i140 14 s b 120 12
c-= jI 100 10 ~r ~if -80 r 8- - ~60 6 ~ n 40 4f 20 2n4
-0---0- shy00 0~~ - ~
000 010 020 030 040 050 100 110 120 130 140
lime (hmm)
[831
Seton Hall University
335 Kinetic rates observed during hydrolysis experimentation
The kinetic rates were also determined for the experiments discussed earlier The rates were
determined using the slopes of the dissolution plots The rates were compared to literature
research49 and were found to be equivalent within experimental error In fact the literature
data shows the rate of hydrolysis of aspirin under acid medium varies from 091 min- to 174
min- I depending on the pH and temperature of the solution Refer to Table 3-4 for details
According to Habib and co-workers the hydrolysis rate of aspirin was found to be 091 min-
at pH 10 and 30degC Choudhury and co-workers reported the hydrolysis rate as 174 min-I at
pH 13 and 40degC If both literature studies are taken into account and a linear plot is
constructed with rate vs pHtemp the expected rate of hydrolysis at conditions similar to this
research should be 146 min-I Furthermore in this study the hydrolysis of aspirin to salicylic
acid using aTC aspirin tablets in pH 12 SGF and at 37degC was found to be 103 min-I The
hydrolysis of aspirin powder to salicylic acid was found to be 123 min-I
49 a) Habib M1 Rogers IA Kinetics of hydrolysis and stabilization of acetylsalicylic acid in liposome formulations International Journal aPharmaceutics 199844 235-241b) Choudhury S Mitra AK Kinetics of aspirin hydrolysis and stabilization in the presence of 2-hydroxypropyl-B-cyclodextrin Pharmaceutical Research 199310 (1)156-159
[84]
Seton Hall University
Table 3-4 Kinetic rates for hydrolysis of aspirin in acidic medium
Description Kinetics Rate (lIminmiddot1 )
(acetylsalicylic acid= 75 mM) Ref At pH 10 and 30 QC -shyRate of Hydrolys is 091
At pH 13 and 40 QC (acetylsalicylic
Rate of Hydrolysis
I At pH 12 and 37degC (acetylsalicylic acid= 18 mM) (this
work)
I Rate of Dissolution (Tablet) 1
Rate of Hydrolysis (Tablet)
Rate of Dissolution (Powder)
103
159 I
Rate of Hydrolysis (Powder) 123
The rates of the reactions were determined from the dissolution plots Refer to Figure 3- O In
order to calculate the rates using the plot the following procedure was implemented First a
plot of dissolved vs time is obtained Next a straight line is drawn over the area of the
dissolution curve where dissolution starts to occur (middle area in this case) Furthermore the
slope of the curve is obtained and from this the rate of hydrolysis is reported Refer to Figure
3-12 and Figure 3-13
[85]
Seton Hall University
Figure 3-12 Typical calculation plot of rate from dissolution
Below is a schematic diagram illustrating how to calculate the rate
10000 ~----------------------------------------------
0 cu gt0 en en is e
0 ~~~~_______________________________________
Time
Figure 3-13 Rate of dissolution for Aspirin (based on slope of dissolution plot)
Hydrolysis of Aspirin 20
18 2
16E I----------Iy= 16202x -13916
c 14-c W= 09571
-a 12Vi
4
100 c 0 8 to 6c (LI u
4c 0 u
2
0
0 5 10 15 20 25
Time (minutes)
[86]
Seton Hall University
34 Chapter summary
In this chapter it was demonstrated that in-situ infrared spectroscopy is a viable technique for
detecting and measuring the hydrolysis of acetylsalicylic acid (aspirin) in acidic media The
IR system was found to be impressive in its capability of measuring very low concentrations
and was able to distinguish separate components of a mUltiple component hydrolysis system
without requiring manual sampling This versatility is demonstrated by observing the
simultaneous dissolution and then conversion of the acetylsalicylic acid API to salicylic acid
In the tablet formulation the rate of dissolution was found to be 162 min- l based on the initial
slope of the dissolution profile Moreover the hydrolysis rate was found to be 103 min-I
based on the salicylic acid formation and dissolution profiles In the powder formulation the
rate of dissolution was 159 min-I The rate of hydrolysis was found to be 123 min-I As
expected this rate is slightly higher since tablets require an initial period of disintegration and
deaggregation Moreover the rate of hydrolysis of the powder formulation is closer to
Choudhurys finding In the tablet experiment the rate of hydrolysis of aspirin does not
exactly match the rate of hydrolysis from the powder experiment This could be explained by
several reasons First there is competing dissolution within the vessel The tablet has to
undergo disintegration and dissolution prior to hydrolysis occurring Second the stirring rate
was too slow In the powder formulation by the time the active drugs reaches the fiber optic
probe the hydrolysis has already begun This is especially important in the powder form
where there is not competing dissolution of tablet Refer to Figure 3-9 The salicylic acid
hydrosylate was observed before the acetylsalicylic acid from the powder Third the IR
[87]
Seton Hall University
system was allowed to collect spectra every two minutes This should be enhanced to collect
every one minute in order to detect the hydrolysis quicker
This research was possible because of the versatility of ATR-IR system Specifically the
unique fingerprint region of the lR spectra gave detailed information about the release profile
of the drug Conventional methods namely in-situ UV-Vis would only show the release
profile of one component However peak deconvolution software can be used to analyze
aspirin hydrolysis Moreover the hydrolysis and transformation of the drug from one form to
another may be missed with conventional techniques ATR-IR captures those minor details
and displays them in the fingerprint region as shown earlier in the results The unique feature
of this system is that it is able to detect several forms of the same drug In other words it was
able to detect the formation and elimination of a pharmaceutical drug (aspirin) while detecting
the formation of the hydrosylate of the aspirin (salicylic acid) in real-time In addition this
system could be used to study other potential transformations One example might be the
dimerization of acetaminophen as mentioned earlier The novelty with this particular system
is its capability to see drug transformations in solutions while conducting the experiment inshy
situ Since this chapter successfully demonstrates the versatility of this novel application of
ATR-IR spectroscopy indicating that that the method has excellent potential for detailed
studies of the dissolution and hydrolysis kinetics of pro-drug formulations and drugs which
hydrolyze under acidic conditions simulating stomach conditions
[881
Seton Hall University
4 Instrument Development Proposal Solv-IR as an In-Situ ATR-IR Instrument for Solvation Chemistry
This chapter focuses on describing the design and potential application of the Solv-IR
system The Solv-IR system is a new system that combines dissolution technology with
attenuated total reflectance-infrared spectroscopy (ATR-IR) A Major Research
Instrumentation (MRI) grant was recently submitted with the National Science Foundation for
funding of this project The details described below give an overview of the new system as
well describe the specific components of the proposed new system
41 Background
Solvation also sometimes called dissolution is the process of attraction and association of
molecules of a solvent with molecules or ions of a solute As ions dissolve in a solvent they
spread out and become surrounded by solvent molecules By an IUPAC definition solvation
is an interaction ofa solute with the solvent which leads to stabilization of the solute species
in the solution 50 Solvation is also a kinetic process with a thermodynamic conclusion5 Most
instrumentation used to investigate solvation focuses on the thermodynamic conclusion ie
the structure and concentration of the solvated species at equilibrium Dynamic study of
solvation either requires manual sampling or in situ UV-Vis detection which (in spite of
excellent curve fitting software) has limited capability for multi-component analysis and for
species that chemically transform The goal is to construct a new instrument that allows
50 IUPAC Compendium ofChemical Tenninology 2nd ed (the Gold Book) (1997) Online corrected version (2006-) solvation 51 Anslyn E V Dougherty D A Chapter 3 Solutions and Non-Covalent Binding Forces Modern Physical Organic Chemistry University Science California 2006
[89]
Seton Hall University
dynamic measurement of solvation of a chemical substance or chemical mixture with in situ
infrared detection Because of the large number of vibration modes available for many
molecules infrared spectroscopy is much more selective than UV -Vis In addition
characteristics of the IR band can provide information about the mechanism of dissolution
including hydrogen bonding interactions and aggregation of solute molecules52 As discussed
earlier infrared spectroscopy using attenuated total reflectance (A TR) probes is quantitative
thus providing precise measurement of solute concentrations The proposed name for the
instrument is Solv-IR which indicates that it uses infrared technology for investigation of
solution chemistry The target instrument will have several attractive features a) 10-6 M
sensitivity b) chemically robust c) conventional IR spectral range d) precise control of
reaction vessel temperature f) integrated stirring controls g) n=6 solvation vessels to provide
appropriate statistics f) software for instrument control data acquisition and processing The
Solv-IR will prove to be useful in the following scientific applications
bull Solvation of single component species such as homogeneous catalysts53 and substances
with different crystalline morphologies 54
bull Crystallization studies (the reverse of solvation)55
52 The Chemical Physics of Solvation Part B Spectroscopy of Solvation R R Dogonadze E Kalman A A Kornyshev J TJlstrup Eds Elsevier The Netherlands 1986 See Chapter I Spectroscopic approaches to the study of ionic solvation G Kabisch E Kalman Chapter 2 Interactions in and structures of ionic solutions and polyelectrolytes Infrared Results G Zundel J Fritsch Chapter 3 Infrared Spectrscopic results on solvate structures in crystals G Zundel J Fritsch 53 Studies of catalyst dissolution a) Sun YK Le Blond C R Wang J Blackmond D G Laquidara J Sowa J R Observation of a [RuCI2laquo(S )-( -)-tol-binap )]2aN(C2H5)3-Catalyzed Isomerization-Hydrogenation Network Journal American Chemical Society 1995 117 12647 b) Shaw J Chen YS Fulton J Linehan J Gutowska A Bitterwolf T Structural evolution of a recoverable rhodium hydrogenation catalyst Journal of Organometallic Chemistry 2008 693 2111-2118 54 a) Acquah c Karunanithi A T Cagnetta M Achenie S L Linear models for prediction of ibuprofen crystal morphology based on hydrogen bonding propensities Sub Fluid Phase Equilibria 2009 277(1) 73-80
[90]
Seton Hall University
bull Studies of chemical and mechanical parameters that effect solvation including
temperature agitation solvent-type pH shape and hardness of the solid56
bull Studies of tablet formulations including chemical effects of co-ingredients57
bull Monitoring of multi-component and controlled release formulations58
bull Solvation rates for components that chemically transform on the solvation time scale59
bull Environmental chemistry for study of dispersants (emulsifier surfactants) for treating
chemical (eg petroleum) spills and other anthropomorphic events60
bull Kinetics of micelle formation61
The above examples represent key applications of IR spectroscopy in the chemistry of
solution however there are many more examples62 Preliminary results have been obtained
b) Chieng N Rades T Aaltonen J An overview of recent studies on the analysis of pharmaceutical polymorphs Journal ofPharmaceutical and Biomedical Analysis In Press (2011) 55 Halasz I Biljan I Novak P Mestrovic E Plavec 1 Mali G Smrecki V Vancik H Crossshydimerization of nitrosobenzenes in solution and in solid state Journal ofMolecular Structure 2009 918( 1-3) 56 Vitha M Carr P W The chemical interpretation and practice of linear solvation energy relationships in chromatography Journal ofChromatography A 2006 1126( 1-2) 143-194 57 a) Van der Weerd 1 Chan K L A Kazarian S G An innovative design of compaction cell for in situ FTshylR imaging of tablet dissolution Vibrational Spectroscopy 200435(1-2)9-13 b) Chan KLA Elkhider N Kazarian SG Spectroscopic Imaging of Compacted Pharmaceutical Tablets Chemical Engineering Research and Design 200583(11) 1303-1310 c) Dressman J J Kramer 1 K Eds Pharmaceutical Dissolution Testing Taylor and Francis Florida 2005 d) Hanson R Gray V Handbook of Dissolution Testing 3rd ed Dissolution Technologies Delaware 2004 58 Van der Weerd J Kazarian SG Combined approach ofFTIR imaging and conventional dissolution tests applied to drug release Controlled Release 2004 98295-305 59 Kokot Burda K Simultaneous determination ofsalicyJic acid and acetylsalicylic acid in aspirin delayedshyrelease tablet formulations by second-derivative UV spectrophotometry Journal ofPharmaceutical and Biomedical Analysis 1998 18871-875 60 a) Fingas M Oil Spill Dispersants A Technical Summary Oil Spill Science and Technology 2011435-582 b) Brandvik J Daling S Optimising oil spill dispersants as a function ofoil type and weathering degree a multivariate approach using partial least squares (PLS) Chemometrics and Intelligent Laboratory Systems 1998 42(1-2)73-91 c) Regan F Meaney M Vos JG Maccraith BD Walsh lE Determination of Pesticides in water using ATR-FTIR spectroscopy on PVCchloroparaffin coatings Analytical Chimica Acta 1996 334 85-92 61 Ceraulo L Dormond E Mele A Turco Liveri V FT-IR and nuclear overhauser enhancement study ofthe state of urea confined in AOT-reversed micelles Colloids and Surfaces A Physicochemical and Engineering Aspects 2003 218(1-3)255-264
[91]
Seton Hall University
for the above examples with an asterisk () using a single probevessel prototype63 However
all of the above examples are important to chemists and the Solv-IR instrument will provide
fundamental and practical insight into these processes
42 Broader impacts from the proposed activities
The activities described in this project have several characteristics that are likely to have a
broad impact on our nations scientific infrastructure and perhaps provide economic
opportunities Thus the broader impacts from the proposed activities are described here
bull First there is substantial evidence that the proposed Solv-IR will be commercially viable
Investigation of solvation chemistry of single compounds or mixtures ensures that
compounds are accurately delivered or dispersed at desired concentration and time In the
US alone there are at least nine companies that sell solvation units (basic Hanson Varian
Sotax Logan Distek robotic Zymark UV-Vis monitoring Pion C-Technologies Leap
Technologies) and retail prices range from $20 K for basic units $100 K for UV-Vis
equipped units and $250 K for robotically controlled units The total market capital of this
industry is estimated to be $500 M USD
bull Second the Solv-IR is a potential driver to a field of research that is hungry for more
information about the chemistry that is occurring inside the reaction vessel
621 Workman Jr Review of Near-Infrared and Infrared Spectroscopy The Handbook ofOrganic Compounds Academic Press California 2001 pp 79-129 63 Kassis A Bhawtankar VM Sowa lR Attenuated total reflection infrared spectroscopy (ATR-IR) as an in situ technique for dissolution studies Journal ofPharmaceutical and Biomedical Analysis 201053269-273
[92]
Seton Hall University
43 Limit of detection (LaD) and limit of quantitation (LOQ) data
Before the instrument design is discussed an overview of limit of detection (LOD) and limit
of quantitation (LOQ) will be made64 The LOD and LOQ levels were calculated for the
existing ATR-IR system coupled with different types of fiber optic probes Three types of
fiber optic probes were tested DiComp probe Flow-Cell probe and K4 probe 65 Differences
between these probes will be discussed below
As per the IUPAC The limit of detection expressed as a concentration or quantity is derived
from the smallest measure that can be detected with reasonable certainty for a given analytical
procedure The limit of detection is the lowest concentration of an analyte that the analytical
process can reliably detect66 The LOD level is calculated from the average of the blank
standard deviation of the blank and a confidence factor67 The limit of quantification refers to
the smallest concentration or the mass which can be quantitatively analyzed with reasonable
reliability by a given procedure There are several techniques available to calculate detection
limits The limit of detection is estimated as three times the standard deviation of the blank
and the limit of quantitation is estimated as ten times the standard deviation of the blank Of
the three fiber optic probes mentioned earlier the DiComp probe is the most useful to
dissolution chemistry The DiComp probe is diamond coated to protect the Zn-Se ATR crystal
from attack by acidic medium Since a lot of the dissolutions are carried out in acidic medium
(pH 1-3) the A TR crystal needs the extra coating to ensure longevity of the probe Based on
64 Venkatasami G Sowa lR A Rapid Acetonitrile-Free HPLC Method for Determination of Melamine in Infant Formula Analytica Chimica Acta 2010665227-230 65 Fiber optic probe specification obtained from httpusmtcomusenhomehtml (accessed May 1 2011) 66 IUPAC Compendium of Chemical Terminology 2nd ed (the Gold Book) (1997) 67 MacDougall DC Warren B Guidelines for Data Acquisition and Data Quality Evaluation in Environmental Chemistry Analytical Chemistry 1980 522242-49
[931
Seton Hall University
the research it was detennined that the LOD and LOQ levels for the DiComp probe were
found to be 17x 10-4 M and 57 x 10-4 M respectively This implies that the LOD level is
002 mgml Refer to Figure 4-l Thus the optics of the ATR-IR system will need to be
enhanced in future research in order to achieve a lower limit of detection level The goal is to
increase the sensitivity so that the system is able to detect one mg of an active drug in a 500
ml vessel volume or 0002 mgml The ratio of placebo to active will play an important role in
the sensitivity and will need to be considered during the analysis
[94J
Seton Hall University
Figure 4-1 Limit of detection of ATR-IR system
Salicylic LOD_linearity for Salicylic Acid (Concentration vs Absorbance Band Intensity) Instrument LOI 002 mgfml Article claim OOlmgfml
00012 -r-------------------------- shy
0001
y- 000861 X + 000005 00008 Fi-O99695
-0 c
ro 00006 4) u c
-e ()
Ugt 00004 ~
00002
y = 00091 x+ 2E05 R2= 09684
o I bull
00000 00200 00400 00600 00800 01000 01200 Concentration (myenmI)
[95]
Seton Hall University
Figure 4-2 Fiber optic probes specifications (ref 65)
middot0I0mDnd ~ beIRMl 23OOcmmiddot 19IiOmt
AgX FlberCondull 16mm eomplll AlR K6 (63 and 95mm options) Condull (K6 Condull) SenHnef (K4 COnduit)
[96]
Seton Hall University
Figure 4-3 Calculated LOD and LOQ values
Description LOO and LOQ Results for iC10 IR System Probes
IR Probe K4 Probe Oi Comp Probe Flow Cell
SIN 2 13 23
LOO (mM) 063 mM 017 mM 010 mM
LOQ (mM) 211 mM 057 mM 033 mM
Probe Picture
[97]
Seton Hall University
Figure 4-4 LODLOQ Sample Calculation Sheet- DiComp Probe Results-1
Wavenumber (cm-1) Replicate 1 Replicate 2 Replicate 3 Replicate 4 Replicate 5 Replicate 6 Replicate 7 Replicate 8 13956576 0200564 0200921 0200813 0201180 0200994 0201616 0200948 0201662 13919259 0199833 0200161 0200107 0200800 0200230 0200833 0200502 0201184 138amp1942 0200339 0200243 0200627 0200778 0200673 0201268 0201548 0201443 13844625shy 0201886 0201437 0202093 0201718 0201690 0202646 0202697 0202794 13807308 0201399 0201482 0201690 0201366 0201696 0202087 0201709 0201777 13769991 0200419 0201039 0200280 O~ 0200860 0200998 0201240 0200636 13732674 0199646 0200064 0199234 0199986 0200016 0199902 0200461 0200062 13695357 0198177 0199447 0199049 0199630 0199701 0198879 0199716 0199766
AREA CALCULATION Wavenumber (cm-1) Replicate 1 Replicate 2 Replicate 3 Replicate 4 Rep~cate 5 Replicate 6 Replicate 7 Replicate 8
13956576 07472 07483 07481 07500 07486 07509 07490 07516 13919259 07468 07471 07475 07493 07478 07503 07502 075012 13881942 0750S 07495 07512 07510 07504 07535 07543 07542 13844625 07525 07518 07534 07Emiddot21 07523 07550 07-46 07-49 13807308 07497 07510 07500 07497 07Emiddot09 07521 07518 07-07 13769991 07463 07484 07454 07472 07480 07480 07495 07474 13732674 07432 07454 07431 07454 07458 07441 07467 07460
AREA 5middot2361 5middot2415 52388 52447 52438 52-38 52561 525131
DiComp Fiber Optic Probe LODLOQ using Salicylic Acid 02100 -Replicate 1
-Replicate 2
bull 02050 -Replicate 3
IS
I 02000
- s-shy -Replicate 4
-ReplicateS- -Replicate 6
01950 -Replicate 7
1365 1370 1375 1380 1385 1390 1395 1400 Replicate 8 Wavenumber (em-l)
[98]
Seton Hall University
Table 4-1 LODLoa Sample Calculation Sheet- DiComp Probe Result-2
Title LODLOQ Calculations Row Number Column A Column B
1 Analyte Salicylic Acid 2 Method LODLOQ 3 Date Nov 27 2010 4 Instrument TiC10 Di Comp Probe 5 Spike 001594 6 Units mglmL 7 Replicate 1 523610 8 Replicate 2 52415 9 Replicate 3 52388 10 Replicate 4 52447 11 Replicate 5 52438 12 Replicate 6 52538 13 Replicate 7 52561 14 Replicate 8 52561 15 Mean 52464 16 Std Dev 00079 17 LOD i 002 mgmL 18 LOQ 008 mgmL
[99]
Seton Hall University
Figure 4-5 LODLOQ Sample Calculation Sheet- Flow Cell Probe Results-1
Wavenumber (cm-1 RepWcate 1 Replicate 2 Replicate 3 Replicate 4 Replicate = Replicate 6 Replicate 7 Replicate 8 12575846 0245674 0245473 0245643 0245271 0245642 0245345 0245116 0245111 12538529 0246221 0245960 0246132 0245975 0246288 0245932 0245688 0245637 12501212 0247103 0246963 0246949 0246986 0247071 0246917 0246626 0246566 12463894 0247688 0247507 0247560 0247482 0247503 0247522 0247236 0247133 12426577 0247831 0247655 0248021 0247722 0247698 0247743 0247524 0247418 1238926 0247866 0247663 0247965 0247818 0247578 0247656 0247371 0247329 12351943 0247832 0247736 0247683 0247606 0247415 0247474 0247249 0247160 12314626 0247600 0247500 0247507 0247469 0247191 0247384 0247184 0246936
AREA CALCULATION Wavenumber (cm-1) Replicate 1 Replicate 2 Replicate 3 Replicate 4 Replicate Replicate 6 Replicate 7 Replicate 8
12575846 09178 09169 09176 09166 09179 09167 09158 09157 12538529 0920~ 09197 09200 09198 09205 09197 09186 09184 12501212 09230 09226 09227 09226 09228 09226 09215 09212 12463894 09244 09239 09247 09240 09240 09241 09231 09228 12426577 09249 09242 09254 09242 09241 09242 09234 09231 1238926 09249 09243 09248 09238 09236 09237 09229 09226
12351943 09244 09240 09240 09235 09229 09233 09225 09220 AREA 64599 64558 64592 64546 64558 64542 64478 64458
FlowCell Probe LOOLOQ using Acetaminophen -Replicate 1
02500 -Replicate 2
-BIe__ -- -Replicate 3~ II 02450 - -Replicate 4i
-Replicate 5
- Replicate 6
1230 1235 1240 1245 1250 1255 1260 -Replicate 7
Replicate 8
02400
Wavenumber (emmiddotl)
[100]
Seton Hall University
44 Instrument design
The proposed instrument is illustrated in Figure 4-7 It has ten overall features which are
grouped into the following units I) Optical Path which includes the source fiber optic cables
A TR crystal and detector II) Six Solvation Vessels including the overhead stirrers reaction
vessels and temperature control and III) Instrumentation Control and data
acquisitionprocessing software The choice of six solvation vessels comes from a statistical
requirement that is frequently found encountered in complicated experiments where
agreement of n=6 experiments is considered to provide a statistically robust analysis68
Although chemists are frequently satisfied with one reproducible yield or agreement of three
measurements of a rate constant applied applications of chemistry frequently require more
rigorous statistics
Some regulatory agencies require statistical agreement of six simultaneous solvation studies
Thus to make the instrument more statistically rigorous and competitive with related
instruments on the market it is important that we use n=6 reaction vessels Also note that a
circular arrangement of the solvation vessels is proposed as this design is takes up less space
relative to a linear or block arrangement
We will assemble our new instrument from commercially available components Thus our
main role will be to select the most appropriate components to make sure that they properly
communicate and have reliable computer software for instrument control data acquisition and
processing Our target specifications are
68 a) Wilson E B An Introduction to Scientific Research Dover Press New Jersey 1991 b) Dumont M L Berry M R Nickerson B Probability of passing dissolution acceptance criteria for an immediate release tablet Journal ofPharmaceutical and Biomedical Analysis 2007 44(1) 79-84
[101]
Seton Hall University
1) Sensitivity (as defined as limit of detection where signal noise ratio = 3 1) lt 10-6 M
2) Sample time lt 1 min per solvation vessel
3) Wavelength range 4000 - 500 cm- I
4) Temperature control lt +- 050 C and range -20 to 1000 C
5) Chemical stability aqueous solvent conditions (pH 1 - 12) common organic solvents
and tested for safe use of volatile organic solvents such as diethyl ether when used in a
fume hood
6) Although this is a scientific proposal we desire that the instrument will be marketable
thus we will aim for a retail cost of $200 K
[102]
Seton Hall University
Figure 4-6 Diagram of proposed Solv-IR Instrument
A diagram of the proposed instrument is shown below
DissolU1lon 88th New Circular oslgn co ensure conslll8nC
heating
Input multiplelCOr
Separation plate Dissolution Bath yens
IR System
ATR Cryllal
Outputb8am
Input beam
Detector
[103]
Seton Hall University
45 System components
451 Radiation source
This is an encased source for IR radiation consisting of an IR element and Zn-Se lens A
suitable unit is available from Oriel Apex Infrared Source Model 66471 (7 H x 12 W x 10
D)
452 Interferometer
This is necessary to modify the source IR light to a broad range of frequencies
Interferometers provide for rapid acquisition and signal averaging Potential vendors include
BrukerOptics However an interesting alternative for initial investigations will be to salvage
components from a surplus IR (we have two units in disrepair in our department with
interferometers)
453 Two Six-device Multiplexors
These devices channel the light from the source so that the maximum amount of light passes
through each vessel and then directs the absorbed light to the detector They are sequential
devices such that inputoutput light spends a defined amount of time at each vessel
454 Six A TR Probes
Each probe consists of an input fiber optic cable an A TR crystal and an output fiber optic
cable The cables are chalcogenide fibers that perform well in the mid-IR range and are
sufficiently flexible so they can be arranged within the instrument and connected to the A TR
[104]
Seton Hall University
crystal Potential suppliers are also RoMack Corp and Hellma Scientific The A TR crystal is
a Zn-Se crystal will provide the desired spectral window (4000 500 cm-) however since
Zn-Se is sensitive to acids and easily abrased we will identify a suitable coating So far the
best choice is a diamond coated Zn-Se crystal which provides excellent chemical stability
The narrower spectral range 1900 - 600 cm- is a satisfactory compromise because the
fingerprint region frequently provides an excellent array of absorption bands Pike
Technologies provides an excellent selection of A TR and coated A TR crystals
455 Detector
The goal is to obtain a single detector sensitive to 10-6 M Currently the most sensitive
detectors are liquid nitrogen-cooled HgCdTe (MCT) detectors However if technology
advances we hope to incorporate a sensitive ambient temperature detector such as Peltiershy
stabilized DTGS (deuterated triglycine sulfate) detector Commercial vendors include
BrukerOptics
456 Six Solvation Vessels
Preliminary work can be performed on glass 1 L vessels that we have in stock We will need
to hire a glass blower (ChemGlass Vineland NJ) to modify each vessel with a rectangular
fitting capable of holding rhombohedral ATR crystal as shown in Figure 4-7
[105]
Seton Hall University
Figure 4-7 Sketch of ATR crystal embedded in the side wall of the 1 L glass vessel The area directly under the stir shaft is known to have poor mixing and as indicated by the term dead zone
------------shy
I
I - _--------
Solvent ~~ Glass-metallevel connection
crystal~ATR
dead-zone
[106]
Seton Hall University
Alternatively polyethylene and fluoropolymer vessels are available which will be easier to
modify especially in prototypes Quality Lab Accessories (QLA) provides an excellent
catalog of glass and polymer vessels caps and stir shafts Controlled overhead stirring is
performed by a simple gear assembly (Figure 4-8)
Temperature control will be provided by assembling a water bath around the solvation
vessels However and ideal alternative is provide a thermally-conductive jacket around each
vessel with which temperature is controlled (for example see Disteks Evolution 6100
Bathless apparatus69
69 Evolution 6100 Distek Bathless Dissolution Testing Equipment Distek Home Page [Online] htlpiwwwdistekinccomlproductsdissolutionevolution6100htm (accessed on January 262011)
[107]
Seton Hall University
Figure 4-8 Top plate of constant rpm stirring assembly showing motor main gear and minor gears which drive the stir shafts in each vessel
Controlled rpm Motor
Minor gear drives stir shaft
4f-----j---- Main gear driven by motor
[108]
Seton Hall University
46 Instrument Controll Acquisitionl Processing
Software packages to perform these operations have been well-designed by a number of
vendors we will seek an opportunity to license their software and hire a consultant to modify
the software package
47 Anticipated technical difficulties
1 It may be difficult to match items from different vendors Solution try to use one or
two primary vendors For example BrukerOptics has MATRIX and TENSOR IR
spectrophotometers which allow multiple A TR probe attachments If either of these meet
sensitivity requirements then it would be best to build the Solv-IR from one of these units A
quote for the MATRIX-MF instrument including spectrophotometer ATR-probes and
software has been obtained to support this approach
ii It may be difficult to achieve sensitivity within a reasonable time frame if all six
vessels are to be measured with one spectrophotometer Solution assemble an apparatus with
two or three spectrophotometers
111 It may be difficult to achieve sensitivity with a vessels are to be measured with one
spectrophotometer Solution assemble an apparatus with two or three spectrophotometers
48 Chapter summary
The preliminary studies in Chapters 2 and 3 indicate great potential for use of the Solv-IR
instrument in pharmaceutical chemistry especially to study dissolution of pharmaceutical
formulations Chapter 5 will address a potential application of this instrument in the study of
the chemistry behind oil spills [109]
Seton Hall University
This instrument development proposal aims to construct a new type of instrument that will
allow the study of solvation of solutes in aqueous and organic systems The main feature of
the instrument design is the use of infrared (IR) spectroscopy to study this dynamic behavior
Traditionally IR is not considered to be a quantitative technique However using A TR
crystals ensures that the technique is most certainly quantitative Also IR is traditionally not
considered to be a sensitive method however our preliminary results indicate detection limits
of 10-4 M Employing better optics and detection will improve sensitivity to our target value
of 10-6 M The instrument has an additional feature which may seem strange to most chemists
as it will have six reaction vessels This feature is important for statistical reasons and for
marketing reasons Solvation is a chemically and mechanically complex process To ensure
accurate studies of the solvation process it is important to have a large array of data such that
statistically significant interpretations can be made In addition competing instruments that
use UV-Vis technology have six reaction vessels so they conform to certain regulatory
requirements
We propose to assemble the instrument using commercially available components We will
build to spectroscopic part of the instrument starting with this unit In addition we feel that
we work with their data acquisition software to incorporate instrument control and data
processing Finally we will construct the reaction vessels stirring function and thermal
control and integrate this unit with the spectroscopy unit to have a fully functioning integrated
Solv-IR instrument
Students working on this project will obtain valuable experience on working with electrical
optical and mechanical parts and tools which is quite rare for a chemistry student However
[110]
Seton Hall University
since this is all focused on discovering new ways to study the fundamental and practical
aspects of solvation chemistry this will be an exciting and worthwhile challenge While
assembling the instrument students will be able to investigate chemical phenomenon in a way
that has been previously inaccessible
[111]
Seton Hall University
5 Analysis of the BP Gulf oil spill by Attenuated Total Reflection-Infrared Spectroscopy and Dissolution
This chapter focuses on describing the scientific research that was conducted on the recent BP
oil spill in the Gulf of Mexico Moreover this research was accomplished using the React-IRI
dissolution system Although the BP oil spill occurred outside of New Orleans Seton Hall
University employed its faculty members students and research facilities toward
understanding this environmental disaster
A general background on the BP oil spill will be provided to gain more understanding of the
subject matter which will be useful when discussing the results later in the chapter The BP
oil spill (also referred to as the Deepwater Horizon oil spill Gulf of Mexico oil spill or
Macondo blowout) is the largest accidental marine oil spill in the history of the industry The
Deepwater Horizon was a nine-year drilling unit that was floating in the Gulf of Mexico
Refer to Figure 5-1 for a photo of Deepwater Horizon before the accident occurred The spill
occurred on April 20 2010 due to an explosion of the Deepwater Horizon This led to a loss
of 49 million barrels of crude oil to the ocean As a result the spill caused extensive damage
to the fishing and tourism industries around the Gulf of Mexico
I 1 j
[112]
Seton Hall University
Figure 5-1 Photo of oil rig similar to Deepwater Horizon70
70 Photo obtained from Lauren Michael Ridley during her NOAA trip to Gulf (obtained July 2011) [113]
Seton Hall University
PETROLEUM AND CRUDE OIL
Both crude oil and natural gas are mostly made up of hydrocarbons The lighter hydrocarbons
which include methane ethane propane and butane occur as gases while the heavier
hydrocarbons (Le pentane and higher) occur in the form of liquids or solids The
hydrocarbons in crude oil are mostly alkanes cycloalkanes and several aromatic
hydrocarbons Moreover other organic compounds contain nitrogen oxygen and sulfur and
trace amounts of metals such as iron nickel copper and vanadium
51 Research with React-IR
As part of the multidisciplinary project to understand the effect of the oil spill the React-IR
system coupled to a dissolution system was used to study the dispersion effect of dispersants
on crude oil Dispersants were used to break up the Deepwater Horizon oil spill before it
reached the shore The dispersants are designed to break down the crude oil into tiny drops
which can be mechanically dispersed or consumed by bacteria The aim is to lessen the
impact of giant plumes of crude oil washing onto oyster beds and birds nests and on the
sandy beaches The dispersants or chemicals used in the BP oil spill could also do more
damage than good in the long run The dispersants are toxic in nature and could have
devastating effects on future generations of marine life The financial cost of using these
dispersants could run into the millions Some of the chemicals used in commercial
dispersants71 are shown in Table 5- This information was obtained from the EPA website
71 Environmental Protection Agency Home Page httpwwwepagovbpspilldispersants-qandahtmllist (accessed May 12011)
[114]
Seton Hall University
Specifically the system was used to study dispersion of oil in the presence of dishwashing
soaps as preliminary models for commercial dispersants From these preliminary experiments
the research was able to measure the effect of dispersants on petroleum oil In addition these
preliminary experiments were able to determine the feasibility of the technique in order to
move forward with the project at a larger scale This would include purchasing commercial
dispersants Furthermore Dawnreg dishwashing soap was used because of its powerful claim
to clean wildlife affected by oil spills Dawnreg specifically uses anionic surfactants such as
alkyl dimethyl amine oxide to break down oil samples These surfactants reduce the surface
tension of water and can weaken the barrier that automatically forms between oil and water
allowing them to unnaturally mix
[115]
---__------
Seton Hall University
Table 5-1 Chemicals used in commercial dispersants (COREXIT 9500 and 9527)
CAS Registry Number ~
Chemical Name
57-55-6 12-PvcJiol I
bull 111-76-2 Ethanol 2-butoxy-
577-11-7 Butanedioic acid 2-sulfo- 14-bis(2-ethylhexyl) ester sodium salt (1 1)
1338-43-8 Sorbitan mono-(9Z)-9-octadecenoate
9005-65-6 I
Sorbitan mono-(9Z)-9-octadecenoate poly(oxy-1 2-ethanediyl) derivs
9005-70-3 Sorbitan tri-(9Z)-9-octadecenoate poly(oxy-1 2-ethanediyl) derivs
29911-28-2
64742-47-8
2-Propanol 1-(2-butoxy-1-methylethoxy)shy
Distillates (petroleum) hydrotreated light
This ingredient is present in 9527 but is eliminated in 9500
[116]
Seton Hall University
52 Experimental section
521 Chemical and materials
Crude oil samples were collected by Dr John Sowa and University of New Orleans scientists
from a location near the city of Venice Louisiana Refer to the figures below showing the
locations where the oil samples were collected The University of New Orleans faculty
collected samples from the Gulf of Mexico The location of the samples collected was
determined by GPS at the following location 28deg 53412N 89deg 08780W Methanol
acetone and acetonitrile (HPLC grades) were purchased from Pharmaco-Aaper Dawnreg
Antibacterial and Ultra Joyreg (lemon scent) dishwashing detergent soaps were used as the
dispersants for this research All solutions were prepared using water treated by a MiIli-Q
Millipore purification system All purified water aliquots have resistivity of not less than 18
MOhm-cm-1bull
[117]
Seton Hall University
Figure 5-2 Aerial view72 location of BP Gulf oil samples
72 GoogJe Maps httpmapsgoogiecommapshl=enamptab=wl (accessed May 12011) [118]
Seton Hall University
Figure 5-3 Zoom view location of BP Gulf oil samples [Both samples were
collected near the UNO site]
[119]
c~t-~~middotmiddot=~middot~middotmiddot=-=gt~~~f plume-
- bull bull
bull bull bull bull
bullbull bull bull
bull -----------shy
gas dissolution into water hydrate decompositioo
Seton Hall University
Figure 5-4 Ocean depth diagram73 showing location of BP Gulf oil samples (reproduced and modified from Ref 73)
sea surface bull oil droplets
bull
-neutral buoyancy level
jet
bottom sediment near-field far-field II
73 Figure obtained from httpwwwcrrcunhedufinallYapa2003finallfigure Ijpg (accessed May 2011) [120]
Seton Hall University
522 Instrumentation
Samples were tested using Mettler Toledos iCIO FT-IR system using a fiber optic probe
equipped with a 1 mm diamond coated A TR probe The IR system was operated by Mettler
Toledos iC IR version 30 or 40 software All dissolution experiments were tested using a
Vankel Dissolution Bath (model no 700) All UVNisible testing was carried out using HP
8453 spectrophotometer All analytical weight measurements were carried out using Mettler
Toledos DeltaRange and AG204 DeitaRange
Figure 5-5 Instrument photo A TR-IR and dissolution apparatus
[121]
Seton Hall University
Table 5-2 Experimental details and sample information
No
1 Vessel I
2 Medium Distilled water 1
13 Agitation speed 100 rpm
4 Temperature 25degC
5 Dawnreg Joyreg Dishwashing detergents 02 solutions
6 Dissolution bath VanKel VK700 i
7 ATR-IR Mettler Toledo iC 10
[122]
Seton Hall University
523 Dispersant stock solution
A 02 solution of Dawnreg dishwashing solution was made up (02 mL was added to
approximately 120 mL of distilled water) A 02 solution of Joy dishwashing solution was
made up (2 mL into 1000 mL of distilled water)
5231 Dawnreg ingredients
Water Sodium Lauryl Sulfate Sodium Pareth-23 Sulfate C-12-14-16 Dimethyl Amine
Oxide SD Alcohol Undeceth-9 Propylene Glycol Cyclohexandiamine Polyacetate
Protease Fragrance FDampC blue no phosphate
5232 Joy ingredients
Water Sodium Lauryl Sulfate Sodium Pareth-23 C 12-14-16 Dimethyl Amine Oxide SD
Alcohol 40-B Undeceth-9 PPG-26 Sodium Chloride Cyclohexanediamine Polyacetate
Fragrance FDampC Yellow 5 DampC Red No 33
524 Crude oil sample preparation
The dispersion experiments were carried out by adding different amounts of Dawnreg
dishwashing detergent in vessels containing 900 mL of distilled water and five (5) grams of
semi-solid oil sample Photographs of the oil dispersion studies were collected at different
time points throughout the runs The dispersion experiments were carried out over two hours
[123]
Seton Hall University
525 ATR-IR analysis
The ReactIRTM iC I 0 FTIR instrument is composed of an MCT detector (liquid nitrogen
cooled) and the FiberConduittrade The FiberConduittrade is comprised of flexible IR transparent
silver chloridesilver bromide optical fibers The fiber optic probe interface (AgX 95 mm x
15 m Fiber (Silver Halide)) contains a diamond tip-DiComp ATR crystal The resolution was
set to 8 wavenumbers The optical range used by the system is 1900 cm- I to 650 cm- I The
gain adjustment was set to normal (l x) and the apodization method was set to Happ-Genzel
The system uses compressed air (house air filtered and de-humified) to purge the optics
53 Results
The experiments in this chapter demonstrate how ATR-IR may be used in the study of
treatments of oil spills During the BP oil spill the use of dispersants at the well-head and on
the ocean surface was extremely controversial Thus this research was interested in finding
ways to evaluate this treatment process Although the commercial dispersants were not used
in this research dishwashing soaps were used as preliminary models The results show that it
takes considerable time for the oil to be broken down by the dishwashing soaps Controlled
dissolution experiments were carried out in an attempt to simulate the dispersion of oil as it
occurred during the oil spill The dissolution experiments were tested over the course of
several hours and were held under elevated agitation conditions and at 25degC These
parameters were used in order to simulate the conditions of the ocean water in the Gulf of
Mexico In all of the dispersion experiments a known amount of crude oil was added to the
dissolution vessel Dispersants were then added and the experiments were monitored over
several hours During this time several photos were taken to compare and record the size of
I [1241
Seton Hall University
the crude oil samples Moreover the ATR-IR probe was placed in the vessel as a way to
monitor the release of oil within the vessel as a consequence of dispersant in solution
531 Standards and expected absorption values
Standard spectra of crude petroleum oil were obtained during this phase of the research
Crude oil is expected to have prominent IR bands at 1375 cm- l (due to methyl groups) and
1465 ern-I (due to methylene groups) Refer to Table 5-3 Also blank ocean solutions were
tested to confirm there was no interference at these two FTIR bands As shown in Figure 5-6
below the crude oil samples obtained by Dr Sowa and the faculty of University of New
Orleans show prominent peaks at 1375 and 1465 ern-I Moreover ocean samples obtained
from regions under the surface oil did not show these two bands
[125]
Seton Hall University
Table 5middot3 Expected FTmiddotIR stretching values for crude oil and sulfonated soaps
I Functional
group
I CHz
Absorption (cmi)
1465 cmshyi
Description
Methylene groups have a characteristic bending _
CH3 ~
1375 cmshy1 Methyl groups have a characteristic bending
S0 2
1150-1165 cmshy1 Symmetric stretch
1342-1352 cmshy1 Asymmetric stretch
[126]
I
Seton Hall University
Figure 5middot6 Gulf oil vs blank (ocean water) standard spectra
uo
015
031)
01$
OtO
OtIS
~1466cm1
tl~ II
I ~1376cm1 - __506
-Sullle-~SVi_
-U_lhotlllt
- 5_0
-~----1II1II 710 1101 16S) 11m I 9lO I~ 1400 13iO HOI 12511 12m mil 1100 1050 1000 _ shy
[127]
Seton Hall University
Figure 5-7 Baseline corrected ATR-IR scans of BP oil and Ocean Water samples
09
08
07
-RefSurface OIL -RefVenice OIL 06 rl 05 ~ 04I
03
02
01
0 i
500 800 1100 1400 1700 2000 2300
Wavenumber cm-l
[128]
Seton Hall University
Figure 5-8 Photo of vessels at different time points during the dispersion experiments
Time-10 minutes Time 30 minutes Time- 2 hours
Large clumps formed Large clumps dispersed slightly Smaller clumps observed
[129]
1
Seton Hall University
532 Venice oil samples dispersed using Joy soap
During the first phase of experimentation Joy was used to simulate dispersant
Approximately 50 mL of the Joy stock dispersive solutions were added to different vessels
containing 900 mL of distilled water and five (5) grams of crude oil collected near Venice
Louisiana The final dispersant concentrations compared to the concentration of commercial
dispersants used in the ocean are expected to be higher The temperature was held constant
at 25degC The agitation speed was set to 100 rpm Unfortunately the Joy dispersant solution
contained interference peaks at 1465cm-1 as shown in Figure 5-9 due to the presence of S02
groups in the soap
[130]
Seton Hall University
Figure 5-9 ATR-IR scans of Venice oil and 50 mL of Joy soap
This figure displays A TR-IR spectra of a solution containing distilled water Joy dispersant solution and crude oil collected from Venice LA As seen in the figure there are several peaks observed between 1000 cm- and 1500 cm- These peaks moreover increase with time As discussed earlier the peaks at 1375 cm- and 1465 cm-] are indicative of crude oil These peaks represent the methyl and methylene groups respectively The other peaks at 1050 cm- 1205 cm- and 1254 cm-] were found in the blank solution and were attributed to the
phosphates in Joy
i 1bull
n2lo
inLm III
5 ja
-tntamp53
- tnl53
- oolQ53
- 002144
- 0021153
ooJl53
- tn3453
-tnl53
ooll53
tn41153
1511 1amp1) 1470 1a 1410 1B1 l1Q 1320 lBJ 1260 1211 1200 1170 1140 1110 1181 1(6) VlMUIOer (aliI I
[131J
Seton Hall University
Figure 5-10 ATR-IR scans of 50 mL of Joy soap only (Blank solution)
This figure displays A TR-IR spectra of a solution containing distilled water and Joy
dispersant solution but no crude oil As seen in the figure there are several peaks observed between 1000 em-I and 1500 em-I These peaks moreover increase with time_ The peaks observed at 1050 em-I 1205 em- l and 1254 em-I were attributed to the phosphates in Joy
-ml252
0240 - m1~52 Same peaks observed in the blank
solution 1900 ml distilled water +50 ml -mI452 i of Joy Dispersive solution) - 001652So
-m2252t0
02iD If)
002952
- m46521 II
- m4amp520200 ~ - 00n52
- 01~52
1BJ 1511 1~ 1470 1440 1410 1]1) 1350 1320 12Q 1250 12ll laIl 1170 1140 1110 Hll) H51 1(120 Wmnnt[an-ll
[132]
Seton Hall University
533 Venice oil samples dispersed using Dawnreg soap
Dawnreg dishwashing solution was used during the second phase of the research
Approximately 50 mL of stock dispersive solutions were added to vessels containing 900 mL
of distilled water and 5 grams of Venice oil The final dispersant concentrations compared to
the concentration of commercial dispersants used in the ocean were expected to be higher
This preliminary model although not an exact model of the commercial setting was
considered a worst case scenarIo It was considered worst case because of the higher
concentration of dispersant used in the controlled 900 ml volume setting The temperature
was held constant at 25degC The agitation speed was set to 100 rpm Dawnreg dispersant
solutions did not give interference peaks at 1465cm-1 or extra sulfonate peaks at ~1200cm-l
Therefore Dawnreg dishwashing detergent soap was ultimately used to simulate the properties
of the dispersant
[133]
Seton Hall University
Figure 5-11 ATR-IR scans of Venice oil and 50 mL of Dawnreg soap
This figure displays ATR-IR spectra of a solution containing distilled water Dawnreg dispersant solution and crude oil collected from Venice LA As seen in the figure there are several peaks observed between 1140 cm-I and 1520 em-I These peaks moreover increase with time As discussed earlier the peaks at 1375 cm-I and 1465 cm-I are indicative of crude oil These peaks represent the methyl and methylene groups respectively
[111)
10 min
AbIorbance Peak obaerved around
1465cmmiddot1
Absorbance Peak obIerved around
1376cmmiddot1
121 1~ 1481 lfi1 1440 1aJ 10 1BJ 1l1 1340 1m 1m 12l1 13lJ 1240 123) 1m 1111) llli1J 1140 IIa111U11l1latli
[134]
Seton Hall University
Figure 5-12 ATR-IR scans of 50 mL of Dawnreg soap only (Blank solution)
This figure displays ATR-IR spectra of a solution containing distilled water and Dawnreg dispersant solution but no crude oil
02laquo1
No PHkI as WlS obslfVed with Dawn Dlsptrslv Solution
-mllt52
-ml~52
- 022n52
- 022253
15111) 15Jl lOJ 1470 1440 1410 18) IE lD 129) 1260 1m 1200 1170 1140 1110 1(8) lisJ lit) WIteIIIIUt(cm-ll
[135]
I
Seton Hall University
5331 Percent () dispersant used
An example of the percent of dispersants used during the research is shown in Table 5-4 Table 5-5 and Table 5-6 First the ratio of Dawnreg sample to the vessel volume is displayed in Table 5-4 This is represented as (A) Next the ratio of oil to the vessel volume is displayed This is represented by (B) Last the ratio of (A) to (B) is shown in Table 5-6 which represents the percent dispersant calculated
Table 5-4 Amount of Dawnreg in solution
I Description I Amount
Amount of Dawnreg sample in solution bull 00017
I Total Volume of Dawnreg Solution Added (mL) 54 I
954bull Total Volume in Vessel (mL)
I Ratio of Dawnreg sample vs Volume in Vessel (A) 00001
I
bull Approximately 02 ml of Oawnreg Solution was added to approximately 120 ml of distilled water
Table 5-5 Amount of BP oil in solution
Description Amount
Amount of Oil (Venice Samples) added (grams) 5
Total Volume in Vessel (mL) 954
bull Ratio of Oil Sample vs Volume in Vessel (8) 00052
Table 5-6 Dispersant calculated
Description Amount
Ratio of Dawnreg sample vs Volume in Vessel (A) 00001
Ratio of Oil Sample vs Volume in Vessel (8) I
00052
Dispersant calculated (A 8) 18
[136]
Seton Hall University
Common dishwashing detergent was found to have little affect on the dispersion of crude oil
As discussed earlier dissolution experiments configured with IR spectroscopy were carried
out whereby aliquots of crude oil were subjected to different brands of dishwashing detergent
in order to measure and determine dispersion effect Moreover the dissolution experiments
were carried out under controlled conditions in an attempt to simulate the Gulf waters Also
the type of dispersant used played a major role As shown in the figures earlier Joy and
Dawnreg dishwashing detergents were used during this phase of the research The Joy blanks
solutions (did not contain crude oil) however showed interference peaks at 1170-1270 cml
and 1465 cml These bands were associated to the sulfonate functional groups and methylene
groups respectively Dawnreg blank solutions however did not give interference peaks at
1465cmI or extra sulfonate peaks at -1200 cml Therefore Dawnreg dishwashing detergent
soap was ultimately used to simulate the properties of the dispersant The dispersion results
clearly show that dispersion of crude oil took at least 30 minutes and up to 2 hours
534 Analysis by UV-Vis Spectroscopy
In addition the BP Oil samples were tested by UVNis spectroscopy The objective of this
part of the research was to determine the amount of porphyrins if any in crude oil74
Porphyrins are structurally similar to both chlorophyll and hemoglobin molecules and are
destroyed by oxygen and heat Porphyrins are heterocyclic macromolecules composed of four
modified pyrrole subunits interconnected at their alpha carbon via methine bridges These
molecules are aromatic and highly conjugated systems Porphyrins have very intense
[137]
Seton Hall University
absorption bands in the visible region Porphyrins can also contribute to the formation of
stable oil-in-water emulsions75 which will aid in the dispersion process Chlorophyll for
example contains several intense absorbance maximums in the region between 453 nm and
665 nm Refer to Figure 5-13 for a UVNis spectrum76 of chlorophyll a and b Also refer to
Figure 5-14 and Figure 5-15 for chemical structures of chlorophyll a and b
74 Hsu C S Drinkwater D Gas Chromatography Mass Spectrometry in the Petroleum Industry in Current Practice of Gas Chromatography - Mass Spectrometry W M A Niessen Ed Chromatographic Science Series Vol 86 Dekker New York 2001 Chapter 3 pp 55 - 94 7S Lee Richard Agents which promote and stabilize water-in-oil emulsions Spill Science and Technology Bulletin 1999 5(2) 117-126 76 Figure obtained from Wikipedia [Online] httpenwikipediaorgwikiFileChlorophyll ab spectra2PNG (accessed May 1 2011)
[138]
Seton Hall University
Figure 5-13 Visible spectra of chlorophy a and b77
chlorophyll b chlorophy a
400 500 600 700 Wavelength [nm]
77 Figure obtained from httpenwikipediaorgwikiFileChlorophyll ab spectra2PNG (accessed May 2011) [139]
Seton Hall University
Figure 5-14 Chemical structure of chlorophyll a (Chern Draw)
o
Figure 5-15 Chemical structure of chlorophyll b (Chern Draw)
r M92+-~ II--- N N
o
o I
-
)_N Nshy
~ ~ I p
[140]
Seton Hall University
Figure 5-16 UVNis spectra of BP oil samples in different solvents 1 mm cell spectrophotometer fully covered from outside lighting
No porphyrin peaks were observed for the oil samples collected The only absorbance peaks that were detected were associated to interference from the trees and outside light Refer to the figure below
0012
0009
Interference from outdoor light
0006
6 0
ebull 0003
j 0
4
-0003
-0006
-HPLCWater
-Sottle Water + LID (Repeat)
-Bottled Water + LID
bull- bullbull HPLC Water
0 420 440 460 480 500 520 540 560 5S0
WiMlength (nm)
-Acetone NO lid
-Bottle Water LID (Repeat)
-HPLC Water + Lid
-Acetone + Lid
-Bottle Water LID
-HPLCWater+ LID
-Riser OIL in HPLC Water
[141]
Seton Hall University
54 Chapter summary
A TR-IR has been used to simulate the effects of dispersants used to treat a petroleum spill In
response to concerns about the use of dispersants to fight the petroleum spill in the Gulf of
Mexico this past summer we used ATR-IR to investigate how dispersants work Sample of
the BP oil were exposed to 2 wt of commercial dishwashing soap The studies indicate that
the hydrocarbon components (CH2 bend at 1466 cm- I and CH3 rock at 1345 cm- I) of the
petroleum can be detected in the presence of the soap However it took more than 30 min for
it to take effect This is probably due to time and concentration factors to allow micelles to
form Moreover this is a creative application of the React-IR concept to study the dynamic
behavior of dispersants Millions of dollars were spent on dispersants to alleviate and
eliminate the spread of the BP oil to the natural coast lines The dispersion experiments
demonstrated that even in a controlled and accelerated laboratory environment it still took
several hours for the oil samples to be dispersed Thus one begs to question the effectiveness
if any of the dispersants on the uncontrolled oil spill in the Gulf of Mexico
Efforts to observe the presence of chlorophyll molecules that are potentially present in the
crude oil by UV -Vis spectroscopy were unsuccessful At this time the status of this
investigation is inconclusive as the presence of these molecules in crude oil is well
documented It is possible that concentrations were below detection limits or the chlorophyll
derivatives were insufficiently soluble Although inconclusive these investigations provide a
foundation for future studies
[142]
6
Seton Hall University
Research conclusions
Dissolution studies are critical tests for measuring the performance of a drug product In this
dissertation a new technique in situ attenuated total reflection-infrared spectroscopy (ATRshy
IR) has been developed to monitor dissolutions of pharmaceutical drug formulations Two
over-the-counter (OTC) active drugs (acetaminophen and acetylsalicylic acid) and one
calibrator tablet (salicylic acid) were tested during the research Moreover both single
component and multi-component drug formulations were tested and the individual
components were identified by IR spectroscopy For example individual components of
acetaminophen and acetylsalicylic acid in a caffeine-free formulation of Excedrinreg tablets
were easily distinguished The ATR-IR system was found to have very good sensitivity and
can analyze samples as low as 003 mgmL (2 x 10⁻⁴ M)
In addition the IR system was able to distinguish separate components of a multiple
component system without requiring manual sampling This versatility was also demonstrated
by observing the simultaneous dissolution of acetaminophen and salicylic acid tablets In
contrast UV -Vis spectroscopy may require mathematical corrections to resolve the two active
drugs Furthermore HPLC must be used which requires laborious manual sampling or
purchase of a complicated automated instrument setup of dissolution configured with HPLC
analysis The in situ A TR-IR method has been validated by comparing dissolution profiles
using UV -Vis and HPLC methods In addition an accuracy of plusmn 2 between IR and HPLC
for the salicylic acid results was established With the current configuration of the IR
instrument this analysis is limited by the sensitivity and wavelength range of the in situ fiber
[143]
Seton Hall University
optic probe However since this chapter successfully demonstrates the versatility ofthis novel
application of ATR-IR spectroscopy it is clear that the method has excellent potential to be
improved by modification of the IR instrument and selection of more sensitive probes
Next the system has the capability of monitoring drug transformations during dissolution For
instance the hydrolysis of aspirin to salicylic acid was studied using this technique The
instrument was able to monitor the simultaneous formation and elimination of aspirin while at
the same time monitor the formation of salicylic acid in solution This research was possible
because of the versatility of A TR-IR system Specifically the unique fingerprint region of the
IR spectra gave detailed information about the release profile of the drug Conventional
methods namely in-situ UV-Vis would only show the release profile of one component
However peak deconvolution software can be used to analyze aspirin hydrolysis Moreover
the hydrolysis and transformation of the drug from one form to another may be missed with
conventional techniques ATR-IR captures those minor details and displays them in the
fingerprint region as shown earlier in the results The unique feature of this system is that it is
able to detect several forms of the same drug In other words it was able to detect the
formation and elimination of a pharmaceutical drug (aspirin) while detecting the formation of
the hydrosylate of the aspirin (salicylic acid) in real4ime In addition this system could be
used to study other potential transformations One example might be the dimerization of
acetaminophen as mentioned earlier The novelty with this particular system is its capability
to see drug transformations in solutions while conducting the experiment in-situ
Also this system was used to support the research related to the BP oil spill The A TR-IR
system coupled with dissolution was able evaluate the effect of dishwashing soaps in the
[144]
Seton Hall University
dispersion of crude oil and the results call into question the efficacy of application of
dispersants in certain situations
Lastly a new instrument design was proposed and discussed in this thesis The proposed
system also known as the Solv-IR would be built at Seton Hall University An MRl NSF
grant was recently filed for this proposal The proposal to develop this instrument aims
construct a new type of detection technique that will allow the study of solvation of solutes in
aqueous and organic systems 787980 The proposed unit has great potential for use in studies of
dissolution of drugs and monitoring competing reactions such as hydrolysis of pro-drugs in
pharmaceutical development formulation and quality assurance The proposed instrument
also has application in environmental chemistry especially to study of the fundamental
chemistry and remediation of anthropomorphic events 81 82 83
7S Chen Zeng-Ping Morris Julian Borissova Antonia Khan Shahid Mahmud Tariq Penchev Rado Roberts Kevin On-line monitoring of batch cooling crystallization oforganic compounds using ATR-FTIR spectroscopy coupled with an advanced calibration method Chemometrics and Intelligent Laboratory Systems 20099649-58 79 Wartewig Siegfried Neubert Reinhard Pharmaceutical applications of Mid-IR and Raman spectroscopy Advanced Drug Delivery Reviews 2005 57 1144-1170 80 Kubicki JD Schroeter LM Itoh Ml Nguyem BN Apitz SE Attenuated total reflectance Fouriershytransform infrared spectroscopy of carboxylic acids adsorbed onto mineral surfaces Geochimica et Cosmochimica Acta 1999 63(18) 2709-2725 81 Mas Silvia Juan Anna de Tauler Roma Olivieri Alejandro Escandar Graciela Application of chemometric methods to environmental analysis of organic pollutants A review Talanta 201080 1052-1067 82Varela RF Rodriguez DS Carracedo MP Andrade JM Fernandez Muniategui S Prada D Screening the origin and weathering of oil slicks by attenuated total reflectance mid-IR spectrometry Talanta 200568116-125 83 Varela RF Carracedo MP Rivera PF Andrade JM Muniategui S Prada D Monitoring photooxidation of the Prestiges oil spill by attenuated total reflectance infrared spectroscopy Talanta 200669 409-417
[145]
7
Seton Hall University
Appendix [A] In situ ATR-IR Spectroscopy and Dissolution Data
The chart below is an example of the digitized data that is obtained for the calibration of
salicylic acid using A TR-IR The data corresponds to Figure 2-1 in Chapter 2
Salicylic Acid Linearity Raw Data
l M N 0 P Q R S WlMIflUmber (cm-1) Stdmiddot1 Sld-2 Stdmiddot3 Std-4 Std-5 Std-6 Std-7
2 18994378 0001186 0000446 0000116 0000126 0000327 0000332 -Q00013 3 shy 18957061
18919744 0000956 0001085
0000368 0000601
297E-Q5 0000275
636E-Q5 567E-Q5
-Qoool -HE-05
-28E-Q5 -QOOO21
-Q00048 -Q00061
5 18882427 000135 0000766 0000266 0000206 ~9E-Q5 -Q0001 -Q00035 6 1884511 0001409 0000702 0000398 874E-06 -Q00021 0000126 602E-Q5 7 18807793 0001273 0000655 0000511 717E-06 -Q00016 0000112 0000106 8 18n0476 0001176 0000475 0000361 0000187 385E-Q5 -91E-Q5 0000104 9 18733159 0000934 0000146 middot31E-Q5 -Q00017 528E-Q5 -000037 546E-Q5 10 18695842 0000714 000013 -Q00018 -Q00025 -Q00018 -Q00035 -Q00013 11 18658525 0000853 0000385 0000114 0000137 ~6E-05 -7E-Q5 -Q00018 12 18621208 0000974 0000557 000033 0000109 795E-Q5 -92E-Q5 -Q00014 13 18583891 0001009 0000404 0000217 -000014 -67E-05 -Q00033 -Q00025 14 18546574 0001254 0000447 0000337 0000101 0000163 -98E-Q5 -Q00016 15 18509256 0001315 0000639 000059 0000189 0000494 000038 0000282 16 18471939 0000906 0000532 0000408 0000194 000038 0000376 0000391 17 18434622 0000585 0000351 654E-Q5 0000176 -21E-05 -000017 -41E-Q5 18 18397305 0000589 0000239 759E-Q5 0000164 -Q00012 -Q00024 -Q00028 19 18359988 0000927 000026 00004 0000308 0000295 0000233 0000175 20 18322671 000112 0000365 0000567 0000381 0000366 0000376 0000426 21 18285354 0001019 0000457 0000329 0000243 0000125 0000229 0000222 22 18248037 0000767 0000366 000014 726E-06 594E-Q5 -000013 46E-Q5 23 1821072 0000492 00001 -5E-05 -Q00022 -Q0002 -000044 -Q00026 24 18173403 0000374 -Qoooll -000023 -Q00027 -000034 -000043 -00004 25 18136086 0000341 -46E-Q5 -QOOO19 -7 1E-Q5 -Q00019 -Q0002 -Q0002 26 18098769 0000349 -13E-05 -00002 ~E-06 -Q00023 -000015 -Q00024 27 18061452 0000152 -59E-05 -000019 -32E-Q5 -QOOOll -96E-05 -Q0002 28 18024135 0000112 middot17E-05 -000012 ~E-Q5 551E-Q5 167E-05 -61E-05 29 17986818 0000295 0000206 625E-Q5 522E-Q5 0000209 0000276 0000301 30 17949501 0000326 0000391 0000215 0000247 0000343 0000462 0000572 31 17912184 0000106 928E-Q5 669E-06 -55E-Q5 609E-Q5 569E-05 0000151 32 17874867 0000117 411E-06 -97E-05 -Q0002 -Q00013 -000017 -98E-Q5 33 1783755 0000426 0000234 000014 99E-05 259E-Q5 -5E-05 -22E-Q5 34 17800233 0000404 0000284 0000199 0000391 0000302 0000199 000021 35 17762915 0000371 0000486 0000451 0000764 0000605 0000895 0000987 36 17725598 0000245 0000244 0000312 0000401 0000523 0000637 0000742 37 17688281 388E-05 -74E-05 394E-06 -Q00012 0000101 000011 000013 38 17650964 -63E-05 -21E-05 921E-06 -Q00015 0000165 000013 0000171 39 17613647 -Q00016 -2Emiddot05 -23E-Q5 -95E-Q5 608E-Q5 612E-05 0000174 40 1757633 -Q00019 803E-05 582E-Q5 0000166 0000218 0000284 0000409 41 17539013 -Q00029 0000117 0000191 0000436 0000616 0000827 0000916 42 17501696 -Q00049 -Q00017 982E-06 982E-05 0000345 0000517 0000566 43 17464379 middot000056 -Q00027 -000012 -19E-05 000025 0000287 0000317
i 44 17427062 -Q00051 -86E-05 -35E-Q5 0000333 0000621 0000642 000077 45 17389745 -Q00046 000021 0000433 0000988 0001429 0001708 0002004 46 17352428 -QOOO63 0000101 0000445 0000915 0001478 0001787 0001949 47 17315111 -Q00103 -Q00055 -000038 -Q00015 0000226 000019 0000184 48 17271794 -00011 middot00006 middot000057 -Q00043 -Q0002 -Q0003 -Q00019 49 17240477 -Q00102 -Q00026 ~8E-06 0000193 0000553 000063 0000699 50 172031El -QOOO96 321E-05 0000646 000114 0001678 0002053 0002386 51 17165843 -000101 -Q00022 0000232 0000695 0001058 0001399 000156
[146]
Seton Hall University
Salicylic Acid Linearity Raw Data
87
56 57 56 59 60 61 62 63 64 65 66 67 68 69 70 71 72 73 74 75 76 77
78 79 80 81 82 83 84 85
186
90 91 92
93 94 95 96 97 98 99 100 101 102
l 17128526 17091209 17053892 17016574 16979257 1694194 16904623 16867306 16829989 16792672 16755355 16718036 16680721 16643404 16606087 1656877 16531453 16494136 16456819 16419502 16382185 16344868 16307551 16270234 16232916 16195599 16158282 16120965 16083648 16046331 16009014 15971697 1593438 15897063 15859746 15822429 15785112 15747795 15710478 15673161 15635844 15598527 1556121 15523893 15486575 15449258 15411941 15374624 15337307 1529999
15262673
M -(loo135 -000169 -000158 -000137 -0_00151 -000179 -000172 -000149 -000136 -0_00103 -000058 -000026 -000024 -18E-05 0000598 0001461 0002052 0002549 0002871 0003484 0004217 0004913 0005507 0005408 0005116 0004863 0004013 0003593 0003529 0003243 0003843 0004418 000446
0004379 0_004226 0004503 000481 0004666 0004259 0003809 0003742 0003015 0_002047 0001426 0000831 0000738 0000631 189E-05 -000042 -000041 -000028
N -000057 -000061 -000028 -64E-05 -000049 -000087 -000044 636E-05 -000022 -000018 0000105 000024
0000271 0000317 0000614 0001521 0001872 0002015 0001834 0001966 0002804 0003363 0003671 0003017 000253 0002607 0002211 0002006 0001883 0001683 0001906 0002021 0002019 0002145 0001989 0002447 0002972 0002667 000225 0002204 0002966 0002666 0001626 0000998 0000796 0001292 000126
0000407 -87E-05 16E-05
0000454
0 -000028 -00004
0000105 0000622 0000211 -000035 0000117 0000642 0000184 0000147 0000503 0000747 0000683 0000337 0000603 0001783 0001991 0001953 0001371 0001583 0002488 0002566 0002571 0002313 0002077 0002114 0001505 0001433 0001704 0001429 0001293 0001197 0001239 0001421 0001427 0002033 0002495 0002121 0001758 0001733 0002804 0002645 0001474 0000854 0000863 0001712 0001695 0000636 667E-05 0000245 0000897
P -84E-05 -89E-05 0000678 0001256 0000605 -00003
0000371 0001131 0000488 0000437 0_000868 0001202 0001076 0000815 0001152 0002499 0002544 0002269 0001695 0001557 0002059 0002168 0002323 00019
0001755 0002018 0001531 0001264 0001158 0000724 0000651 0000801 0000974 0001154 0001185 0001804 0002395 0001997 0001532 0001662 000323
0003158 0001614 0000824 000107 0002334 0002244 000103
0000373 0000508 0001294
Q R S 0000218 0000394 0000496 0000276 OJ)()0494 0000667 0001315 0001761 0002152 0002196 0002715 0003221 0001399 0001807 000208 0000253 000053 0000575 0001154 0001581 0001793 0002001 0002561 0002855 000093 0001237 0001419
0000719 0001093 00014 0001316 0001638 0001966 0001627 0001811 0001981 0001491 0001617 0001777 0001329 0001406 000168 0001739 0002054 000221 0003535 0004215 0004565 0003286 0003881 000432 0002765 0003057 0003508 0002215 0002284 000251 0001868 0001993 0002262 0002582 0002784 0003125 0002763 00025 000276 0002625 0002211 0002611 0002059 0001872 0002161 0002031 0001956 0002238
00023 0002298 0002563 0001478 0001332 0001496 000118 0001062 0001137 0001232 000126 0001033 0000871 0000978 000065 0000812 0000723 00006 0000832 0000642 0000628 0000834 0000778 0000709 0001034 0000973 0000692 0001046 0000976 0000783 0001956 0001973 0002109 0002826 0002929 0003247 000223 0002352 0002464 000166 0001823 0001755 000187 0002077 0002042 000381 0004369 0004606
0003769 0004346 0004669 0001894 000218 0002324 0000991 000114 0001238 0001416 0001524 0001795 0003066 0003471 0003976 0003061 0003621 0003955 0001535 0001916 0001958 0000723 0000964 0000992 0001002 0001193 0001353 0002015 0002362 0002688
[147]
------------- -
Seton Hall University
Salicylic Acid Linearity Raw Data
104 105 106 101 108 109 110 111 11
6 117 118 119 120 121 122
121 128 129 130 131 132 133 134 135 136 137 138 139 140 141 142 14
145 146 147 148 149 150 15 152 153
L N 0 P a R S 15225356 15188039 15150122 15113405 15016088 15038111 15001454 14964131 1492682 14889503 14852186 14814869 14777552 14740234 14702917 146656
14628283 14590966 14553649 14516332 14419015 14441698 14404381 14361064 14329147 1429243
14255113 14211796 14180479 14143162 14105845 14068528 14031211 13993894 13956576 13919259 13881942 13844625 13801308 13169991 13132614 13695357 1365804 13620723 13583406 13546089 13508112 13471455 13434138 13396821 13359504
-000061 -000012 -000043 -000021 -00001
0000916 0003351 0006785 0001163 0004093 0001505 0000584 0000399 0000651 0002111 0006014 0006588 0003853 0001528 0000208 -000029 -000025 -000035 middot000039 -000031 -000023 944E-05 0000413 0000783 0001229 0001582 000238 000411 000123
0010625 0011517 0009322 0006639 0004745 0003576 0002964 0002925 000319
0003132 0003297 0003966 0004446 0004486 0004391 0003976
11 -000012 -000024 0000349 0000441 0000149 0000788 0001924 0003629
00031 0001919 0000668 0000497 0000456 0000365 0001411 0003346 0003804 000205 000068 -000012 -000043 -000021 -000021 -00002
-000012 -56E-05 000021
0000187 0000316 0000692 0000908 0001332 000226
0003786 0005419 0005803 000456
0003193 0002303 0001644 000128
0001388 0001619 0001462 0001511 0002018 0002376 0002431 0002383 0002084
0()()08B3 0000213 0000111 0000883 0000962 0000393 0000863 0001548 0002652 0002682 0001384 0000422 0000561 0000678 0000351 0001032 000261
0003064 0001519 0000414 -000019 -000044 -7E-05
-39E-05 -000015 -53E-05 121E-05 0000361 0000263 0000287 0000593 0000738 0001071 0001145 0002654 0003111 0003926 0002895 0002056 0001541 0001055 000069 0000801 0001039 0000881 0000896 0001364 0001719 0001152 0001119 0001469
O 1 18 0000559 0000303 0001316 0001496 0000684 0000905 0001223 0002141 0002235 0001053 0000392 000091
0000891 0000312 0001008 0002558 0003025 0001511 0000513 -000013 -000056 -000018 --S2E-05 -4E-05
0000113 0000328 0000549 0000111 503E-05 0000356 0000409 0000714 0001243 0001951 000305
0003381 0002381 0001641 0001224
00001 0000491 0000181 0000891 0000669 0000839 0001218 0001276 0001346 000129
0000776
0001992 0002411 0002148 0001058 0001415 000154 0000164 0001019 0001165 0002082 0002589 0002924 0002189 0002101 000305 000106 0001374 0001435
0001411 0001686 0001733 0001588 0001689 0001733 0002244 0002175 0002169 0002164 0001911 0001924 0001048 0000952 0000819 000055 0000608 0000618
0001281 0001501 0001614 0001312 0001515 0001108 0000586 0000659 0000113 0001056 0001119 000106 000258 0002668 0002682
0003316 0003411 0003606 0001121 0001169 0001768 0000609 0000658 0000649 -74E-05 363E-05 182E-05 -000048 -000034 -000034 985E-05 0000275 0000414 0000156 0000341 0000446 578E-05 000016 0000119 0000152 0000237 0000254 0000428 0000585 0000652 0000894 0001073 0001228 0000443 0000471 0000569 0000194 0000178 0000115 0000466 0000553 0000449 0000584 0000648 000062 0000883 000092 0000919 0001327 0001341 0001324 0001154 0001637 0001532 0002591 0002352 0002151 0002882 0002586 0002351 0001961 0001106 0001443 0001377 000123 0000992 000108 0000948 0000799 000067 0000572 0000445
0000432 0000431 0000326 0000661 0000681 0000613 0000115 0000148 0000721 0000565 0000511 000045 0000104 0000643 0000525 0001046 0000987 000081 0001214 0001134 0001006 0001331 0001206 0001113 0001206 0001142 0001091 0000144 0000645 0000552
[1481
Seton Hall University
Salicylic Acid Linearity Raw Data
l M N 0 P Q R S 13322187 000338 0001653 0001025 0000664 0000468 0000352 0000257
155 1328487 0002996 0001477 0000908 0000941 0000618 0000534 0000424 156 13247553 0002511 000119 0000724 0000769 0000566 0000513 000043 157 13210235 0002244 0001047 0000652 000052 0000495 0000449 0000424 158 13172918 0002288 0001121 0000739 0000519 0000533 0000496 0000473 159 13135601 0002267 0001008 0000576 0000396 0000379 0000356 0000295 160 13098284 0002465 0001017 0000567 0000432 0000423 0000394 0000312 161 13060967 0002911 0001308 0000842 0000661 0000678 0000606 0000501 162 1302365 0003314 0001634 0001101 0000778 0000716 0000635 0000505 163 12986333 0003299 0001693 000116 0000854 0000696 0000622 0000489 164 12949016 0003022 0001543 0001068 0000843 0000789 0000736 0000598 165 12911699 0002832 0001469 0001037 0000822 0000878 0000635 0000737 166 12874382 0002753 0001452 0001042 0000799 000074 0000701 00006 167 12837065 0002886 0001571 0001151 0000807 0000676 000062 0000497 168 12799748 000303 0001679 000123 0000866 0000823 0000751 0000679 169 12762431 000309 0001643 0001152 0000976 0000917 000065 0000804 170 12725114 000324 0001658 00011 0000864 0000866 0000768 0000716 171 12687797 0003783 000191 0001298 0000783 0000866 0000731 000064 172 1265048 0004695 0002387 0001656 0001061 000095 0000795 0000701 173 12613163 0005823 0002982 0002023 0001436 0001121 0000989 0000863
1174 12575846 0006738 0003401 000223 0001667 0001343 0001195 000103 175 12538529 0006747 0003343 0002168 0001566 0001244 0001031 0000874 176 12501212 0005908 0002911 0001931 0001398 0001088 0000919 0000748 177 12463894 0004836 000232 0001482 0001029 0000816 0000698 0000495 178 12426577 0004405 0002154 0001394 0000901 0000741 0000629 000045 179 1238926 000419 0002078 0001404 0000894 0000771 000069 0000548 180 12351943 0003753 0001813 0001124 0000674 0000462 0000394 0000261 181 12314626 0003634 0001757 0001095 0000713 0000472 0000368 0000316 182 12277309 0003853 0001965 0001355 0001022 0000876 0000756 0000738 183 12239992 000387 0001951 0001356 0001098 0001005 0000925 0000854 184 12202675 0003658 0001736 000111 0000889 0000776 0000738 0000635 185 12165358 0003675 000178 0001127 0000979 0000626 0000745 0000679 186 12128041 0003753 0001899 0001217 0001156 0001025 0000878 0000802 187 12090724 0003834 0001958 0001254 0001085 0000959 0000814 0000702 188 12053407 0003864 0001879 0001173 0000842 0000791 0000667 000056 189 1201609 000397 000189 0001212 0000742 0000797 0000721 0000614 190 11978773 0004257 0002126 0001457 0000872 000093 0000873 0000745 191 11941456 0004628 0002425 0001697 0001134 0001031 0000931 000077 192 11904139 0004976 0002665 0001879 0001307 0001027 0000908 0000793 193 11866822 0005204 000272 0001878 0001212 0001006 0000914 0000827 194 11829505 0005668 0002891 0002031 0001388 0001294 0001153 0001049 195 11792188 0006234 0003232 0002276 0001674 00015 0001306 0001194 196 11754871 0006604 0003391 0002266 0001499 0001286 0001087 0000922 197 11717553 0006879 0003437 000217 0001422 0001196 0000999 0000803 198 11680236 0007416 0003675 000235 0001609 0001364 0001155 0000954 199 11642919 0008204 000413 0002754 000195 0001723 0001427 000124 200 11605602 0008411 0004226 0002832 0002038 0001825 0001501 0001325 201 11568285 0007971 0003972 0002644 0001869 0001626 000136 0001185 202 11530968 0007722 0003877 0002546 0001929 0001639 0001426 0001268 203 11493651 0007602 0003817 0002446 0001717 0001408 0001198 0001026 204 11456334 0006491 0003212 0002016 0001224 0000872 0000653 0000515
[149]
Seton Hall University
Salicylic Acid Linearity Raw Data
l M N 0 P a R s 11419017 0004839 0002328 0001445 0000891 0000551 0000403 0000323
113817 0003536 0001676 0001013 0000684 0000464 0000371 0000304 11344383 0002521 0001262 0000793 0000473 0000403 0000311 0000212
208 11301066 0001495 0000142 0000469 525E-05 944E-05 -2E-05 -19E-05 209 11269749 245E-05 -00002 -000031 -000054 -000044 -000054 -000052 210 11232432 -000118 -000018 -000068 -000059 -000044 -000044 -000041 21 11195115 -000226 -000121 -000089 -000069 -000053 -000043 -000039 212 11157198 -000371 -000194 -000142 -000106 -000092 -000079 -000015 213 11120481 -000512 -000253 -000174 -000144 -000118 -000098 -000095 214 11083164 -00066 -000314 -000199 -000193 -000147 -000121 -000104 215 11045847 middot000868 -000424 -000274 -000242 -00019 -000161 -000133 216 1100853 -00111 -000558 -000374 -000309 -000241 -000212 -000181 217 10971213 -001326 -000669 -000451 -000351 -000277 -000233 -000204 218 10933895 middot001488 -000162 -000519 -000399 -000321 -000268 -000232 219 10896518 -001538 -000803 -00055 -000442 -000361 -000308 -000269 220 10859261 -001451 -000162 -000525 -00044 -000348 -000299 -000261 221 10821944 -001219 -000618 -000468 -000383 -000291 -000256 -000122 122 10184627 -001176 -000634 -000441 -00035 -000274 -00024 -000207 223 1014131 -001193 -00064 -000445 -000348 -000268 -000229 -000198 224 10709993 -001221 -000643 -00044 -000335 -000253 -000214 -000188 225 10672616 -001213 -000631 -000438 -00034 -000266 -000229 -000205 226 10635359 middot001119 -000595 -000414 -000336 -000212 -000233 -000211 227 10598042 -000961 -000508 -000354 -00029 -000242 -000203 -000184 228 10560725 -000191 -000409 -000286 -000223 -000191 -000157 -000139 229 10523408 -00063 -000316 -000217 -000161 -000142 -000116 -000099 230 10486091 -000517 -000264 -000183 -000147 -000134 -000115 -000098 231 10448774 -000415 -000211 -000148 -000134 -000115 -000099 -000085 232 10411457 middot000293 -000138 -00009 -000086 -000057 -000048 -000038 233 1037414 middot000193 -000091 -000057 -00006 -000037 -000039 -000029 234 10336823 -000152 -000082 -000055 -000062 -000045 -00005 -00004 235 10299506 -000169 -000096 -00007 -00008 -000056 -000056 -00005 236 10262189 -000176 -000099 -000075 -000076 -000054 -00005 -000046 237 10224872 -000198 -000119 -000101 -000087 -000074 -000064 -000064 238 10187554 -000221 -000136 -000118 -000104 -000097 -000083 -000087 239 10150237 -000208 -000112 -00009 -000069 -000061 -00005 -000051 240 1011292 -000219 -00011 -000079 -000058 -000036 -00003 -000024 241 10075603 -00027 -000139 -000093 -000095 -000074 -000064 -000055 242 10038286 -000371 -000185 -000119 -000121 -00009 -000075 -000065 243 10000969 -000586 -000293 -000196 -000154 -000098 -000075 -000062 244 9963652 -00087 -00044 -000298 -000219 -000158 -000118 -000104 245 9926335 -001057 -00054 -000367 -000278 -000122 -000173 -000152 246 9889018 -000982 -000499 -000345 -000255 -000195 -000155 -00013 247 9851701 -000724 -000364 -00025 -00017 -000113 -000087 -000067 248 9814384 -000489 -000257 -000178 -000125 -000083 -000071 -000055 249 9777067 -000331 -00018 -000132 -000096 -000073 -000062 -000049 250 973975 -000208 -000108 -000079 -000048 -000036 -000021 -00001 25 9702433 -000118 -000063 -000049 -000039 -000019 -92E-05 -56E-05 252 9665116 -000044 -000028 -000026 -000024 -1E-05 742E-05 301E-05 253 9627799 0000815 0000539 000047 0000491 0000655 0000717 0000705 254 9590482 0002108 0001349 0001195 0001016 0001059 0001048 00011 255 9553165 0002958 0001739 0001411 0000919 0000847 0000858 000087
[150]
Seton Hall University
Salicylic Acid Linearity Raw Data
l M N 0 P Q R S 9515848 0003795 0002052 0001546 0000769 0000633 000059 0000539
257 9478531 0004571 000237 0001777 0001007 0000903 0000774 0000714 258 9441213 0004691 0002306 0001617 0001273 0001165 0001099 0000984 259 9403896 0004372 0002068 0001318 0001026 0000997 0000965 0000868 260 9366579 0004143 0002079 0001323 0000962 0000931 0000916 0000862 261 9329262 0003803 0002096 0001401 0001324 000126 0001301 0001234 262 9291945 0003135 0001903 0001382 0001508 0001561 0001594 0001528 263 9254628 0002265 000147 0001244 0001512 0001764 0001758 0001767 264 9217311 0001181 0000692 0000776 0001116 0001422 0001473 0001564 265 9179994 0000139 748E-05 0000247 0000604 0000756 0000895 0000993 266 9142677 -000066 -000037 -00001 000043 000058 000072 0000773 267 910536 -000111 -000055 -000018 0000233 0000703 0000826 0000854 268 9068043 -000145 -000048 -000016 0000153 0000723 0000877 0000917 269 9030726 -000203 -000074 -000027 0000119 0000555 0000717 0000854 210 8993409 -000255 -000114 -000047 633E-05 0000483 0000604 0000875 271 8956092 -000298 -000149 -000071 553E-05 0000489 0000728 0000813 272 8918775 -000341 -000167 -000085 -00003 0000225 0000674 0000554 273 8881458 -000366 -000178 -000088 -00005 0000303 0000795 0000705 214 8844141 -000371 -000176 -000093 -000054 000054 0001018 0000964 215 8806824 middot000388 -000205 -000119 -000095 271E-05 0000539 000056 216 8769507 -000393 -000226 -000116 -000079 -7E-05 0000362 0000589 277 873219 -000433 -000239 -000119 -000055 0000101 000032 0000496 218 8694872 -000487 -000264 -000157 -00008 -SE-05 0000167 0000311 219 8657555 -000509 -000283 -000172 -000128 -00004 -000018 0000181
8620238 -000537 -000265 -000138 -000101 -000023 0000242 0000488 8582921 -000619 -000314 -000166 -000095 -000016 0000614 0000697 8545604 -000725 -000408 -000256 -000151 -000072 -000019 0000125 8508287 -000788 -000415 -000262 -000135 -000058 -00001 0000241
284 847097 -000796 -00037 -000195 -00009 000016 0000811 0000701 285 8433653 -000754 -000338 -000168 -000072 0000331 0000964 0001029 286 8396336 -00077 -000362 -000202 -000133 -000016 000029 0000708 287 8359019 -000812 -000387 -000244 -000186 -000039 925E-05 0000235 288 8321702 -000763 -000413 -000235 -000145 114E-05 0000779 0000564 289 8284385 -000704 -000427 -000174 -000094 0000403 0001395 0001235
8247068 -00077 -000418 -000212 -000147 0000107 0000949 0000877 8209751 -00082 -000388 -000268 -000202 -000054 -00003 -000029 8172434 -000781 -000401 -000245 -000199 -000124 -000118 -000075 8135117 -000678 -000338 -000158 -00009 -000054 0000213 0000371
80978 -000636 -000321 -000153 -000048 34E-05 000109 0000918 8060483 -000736 -000368 -000201 -000164 -00004 0000307 0000387 8023166 -000797 -000406 -000254 -000259 -000083 -000051 0000109 7985849 -000819 -000484 -000311 -000241 -000122 -000087 294E-05 7948532 -00082 -00049 -000359 -000217 -000133 -000064 -44E-05 7911214 -000786 -000405 -000322 -000221 -000135 -18E-05 0000357 7873897 -000714 -000339 -000148 -000058 162E-05 0000994 0001373
301 783658 -000734 -000333 -0001 0000207 0000315 0001158 00018 302 7799263 -000693 -000292 -000114 -000023 -1E-04 0000946 0001363 303 7761946 -000613 -000272 -000141 -000076 0000415 0001108 0001337 304 7724629 -000777 -000383 -000335 -000201 -75E-05 0000259 0000769 305 7687312 -000763 -000403 -000417 -000264 -000036 -000019 000045 306 7649995 -000575 -000161 -00015 -000051 -65E-05 0001896 000175
[1511
Seton Hall University
Salicylic Acid Linearity Raw Data
L M N 0 P a R S 7612678 -000503 -000106 -000032 0001092 523E-05 000358 0001615
308 7575361 -000629 -000331 -00015 -000044 -000015 0003362 0001435 309 7538044 -000683 -000424 -00015 -000113 0000211 0002343 0003148 310 7500727 -000725 -000467 -000072 -000203 0000186 0000415 0003189 311 746341 -000736 -000409 -000072 -000209 0000299 0000565 0001658 312 7426093 -000727 -00023 -000152 -000068 0000539 000208 0001731 313 7388776 -000746 -000387 -000284 -00003 0000658 0002007 0001217 314 7351459 -000653 -000268 -000376 0000387 0001801 0002261 0002028 315 7314142 -000631 -000243 -000418 0000465 0001284 0001984 0002449 316 7276825 -000448 -00036 -000271 0000659 379E-05 0003612 0002328 317 7239508 -000609 -000211 -00007 0002337 0001633 0004503 0002582 318 7202191 -000823 -00018 -00018 0003083 0003483 0001606 -65E-05 319 7164873 -001052 -000518 -000618 -000112 -000192 -000196 -000296 320 7127556 -0009 -000408 -000503 -000335 -000193 0000819 0002041 321 7090239 -000263 0002016 846E-05 0000322 0006467 000659 0008253 322 7052922 0000411 000198 0000152 0000988 0008183 0007496 0007357 323 7015605 -000433 -000022 -000489 0000451 0001238 0008372 0003532 324 6978288 -000972 0001882 -000648 -00021 -000287 0006825 0000633 325 6940971 -001283 0001633 -000345 -000274 0004553 0003136 0005014 326 6903654 -000477 -000307 0001101 000155 0015475 0008684 0007746 327 6866337 0002714 0004069 0008987 0017488 0023048 0017339 000774 328 682902 0002344 0008319 00125 0019268 0012339 0021648 0014214 329 6791703 001973 0009579 0014092 0022671 0006015 0020514 0020884 330 6754386 0022907 0027308 0011454 0008652 0013533 000993 0018337
67U069 0040395 0047424 004506 0017746 003161 -000108 0038309 6679752 003742 0034306 -00015 0211175 0041259 -000308 0041487 6642435 -003673 0031214 -010889 0176551 -001099 -001847 -001638 6605118 -001329 005025 -007151 0057809 0006968 0009254 -000372 6567801 0045812 0024709 0032092 0047795 0042077 0073839 00306 6530484 -004397 0004264 0035975 -003612 -001248 0056891 -002779 6493167 -00637 000249 -0C1432 -005065 000042 0118745 0020689
[152J
Seton Hall University
Figure 7-1 Linearity of salicylic acid in pH 74 phosphate buffer (corresponds to Figure 2-1 in Chapter 2)
The table below contains the raw data collected during the salicylic acid linearity experiment Eight serial dilutions of salicylic acid reference standards were used during the linearity study The molar concentrations are displayed in the table Standard 1 represents about 21 mg of salicylic acid per 900 ml of buffer while Standard 8 represents about 300 mg of salicylic acid per 900 ml of buffer Since a large salicylic acid peak was observed at 1388 em-I a singleshypoint baseline correction at 1370 em-I was used to correct the data
Description Flask Volume (L) Concentration (M) 1388nm 1388-1370 Std-1 0050 003215 001152 000855 Std-2 0100 001607 OO51=i 000452 Std-3 0150 001072 O00039 000324 Std-4 0200 000804 00033 000290 Std-5 0250 000643 000288 000245 Std-6 0300 000536 000259 000215 Std-7 0350 000459 000235 000203 Std-8 0700 000230 000103 000118
NoteConc ~1oo of300mg tablet In actual vessel (900ml) dIssolutIOn
[153]
Seton Hall University
Figure 7middot2 Linear regression chart for saliyclic acid
The figure below is a linear regression plot for the serial dilutions of salicylic acid reference standards Since a large salicylic acid peak was observed at 1388 cm-1
a single-point baseline correction at 1370 cm-1 was used to correct the data
Linear Regression for Serial Dilutions of Salicylic Acid Reference Standards 1388-1370cm-1
000900
000800
000700
000600 gt
U)c Q)
000500 y = 02362x + 000091
gtlt R2 = 09975 C1I 000400 Q)
Cl
000300
000200
000100
000000 00000 00050 00100 00150 00200 00250 00300 00350(
1 Concentration (M)
I [154]
I
Seton Hall University
Figure 7-3 Dissolution results for salicylic acid in pH 74 phosphate buffer HPLC vs IR data (corresponds to Figure 2-2 in Chapter 2)
The table below corresponds to the percent () dissolved data obtained from the salicylic acid dissolution experiment The table compares ATR-IR to HPLC percent dissolved results HPLC samples were collected after 30 min 1 hour 2 hour 3 hour 65 hours and finally after 7 hours Moreover the samples were analyzed using an Agilent HPLC system As shown in the table below the maximum absolute difference observed between the IR and HPLC data was found to be 3
Time (hhmm) Dissolved (HPlq Dissolved by(lR) Difference 0000 00 00 0 0030 111 144 -3 0100 209 231 -2 0200 382 380 0 0300 529 509 2 0630 878 883 -1 0700 948 978 -3
[155]
Seton Hall University
Figure 7-4 ATR-IR System photo
The figure below shows a photo of the Mettler Toledo ATR-IR system coupled with a DiComp fiber optic probe The photo shows the DiComp probe inserted into a standard dissolution vessel An external electric stirrer was used to control the agitation speed (RPMs)
[156]
I
Seton Hall University
Figure 7-5 Mettler Toledo ATR-IRI Dissolution Systems
The figure below shows a photo of the Mettler Toledo ATR-IR system coupled with a DiComp fiber optic probe The photo shows the DiComp probe inserted into a standard dissolution vessel The Vankel six-vessel dissolution system was used for during testing
[157]
Seton Hall University
Figure 7-6 Flow Cell Fiber Optic Probe
The figure below shows a photo of the Mettler Toledo ATR-IR system coupled with a Flow Cell fiber optic probe Plumbing from the Flow Cell was attached to an Agilent six-port valve pump Also plumbing from a dissolution vessel was attached to the pump Thus a close-loop system was created whereby dissolution samples were drawn to the flow cell via the pump and back to the dissolution vessel Homogeneous mixing within the dissolution vessel was achieved using a stir plate and magnetic stir bar
[158]
Seton Hall University
Figure 7-7 K4 Fiber Optic Probe
The figure below shows a photo of the Mettler Toledo A TR-IR system coupled with a K4 Conduit fiber optic probe The photo also shows a dissolution vessel attached to the K4 probe The dissolution vessel was produced out of a methanol bottle A valve was attached to the vessel in order to empty the vessel contents during dissolution runs and cleaning
[159]
Seton Hall University
Figure 7-8 HPLC analysis for Salicylic Acid calibrator tablets
Salicylic Acid Tablets (HPLC Analysis) Batch No Salicylic Acid calibrator tablets Lot Q00200
Sample Name Vial No Injection RT Area Result 10 Standard 1 1 1 2533 07 4252948
30min 2 1 2534 07 472913 1 hour 3 1 2535 07 891091
12 hour 4 2536 07 1629150 3 hour 15 2537 07 2259379
65 hour 076 3764607 7 hour 077 2539 4064077
Standard 1 1 ~ 1 2533 07 4252948
Standard-1 Weight (mg) 6001 Standard-1 Avg Area 4252948 Standard Declared Content () 1000 Std-1WtlStd-1PA 1411E-05
Vessel Volume (mL) 5000 Potency (mg) 3000
Standard Volume (mL) 100 0 Sample (mL) 15
I
I
Time (hour) Vessel Volume 05 5000 1 4985 2 4970 3 4955
65 4940 7 4925
Time (hour) Dissolved (HPLC) 05 11 1 21 2 38 3 53
65 88 7 95
[160]
Seton Hall University
Figure 7-9 HPLC Method Parameters Single Component and Multi Component
Experiments
HPLC Parameters (HP1050)
bull Symmetry 300 C18 5 m column (46mm x50 mm)
bull Mobile phase 60401 (watermethanolglacial acetic acid)
bull Flow rate 20 mllmin isocratic mode Injection volume = 5 IJL
UV detector was set at 296 nm
HPLC Parameters (Waters 26951
Symmetry Shied RP C18 3IJm column (35mmx50 mm)
Mobile phase 70301 (wateracetonitriletrifluoroacetic acid (TFAraquo
bull Flow rate 15 mllmin isocratic mode injection volume was 51J1 UV detection was set at 296 nm
HPLC Parameters (HP10501
bull Phenomenex Intersil ODS C18 5IJm column (46mmx150 mm)
bull Mobile phase 60401 (methanoVwatertrifluoroacetic acid (TFAraquo
bull Flow rate 10 mVmin isocratic mode injection volume 251J1
UV detection was set at 280 nm
[161]
Seton Hall University
Figure 7-10 Typical Excedrinreg experiment spectra
FTIR spedra for Excedrin Caplets
- 00459 middotmiddotmiddot--middot01000 0014 +--------------------------1
-01500 -02000 --02500 -03000
03459 - 04500 i0012 +---- -----~- -------------- shy
05459 -10000
1__________________________~===1=4=5=00~========j~ 001 + c B c
~ 0008 +-------------~------------~-----___i (Il
i0006+----------------~~~-------~~---~ o
~ 0OO4~~~~-------~~-~--~-~~~~==~~~~~~~~~
0OO2~~~~~--~~~----------~~-------c----~~~
O+---~--~~--__--_r---~--~---~--~---~
1000 1050 1100 1150 1200 1250 1300 1350 1400 1450 Wavenumber (emmiddot)
Figure 7-11 Excedrinreg HPLC Data
Ret time (min) Area Acetaminophen 2033 190158
AcetylSalicylic Acid 3585 90043
Acetaminophen Acetylsalicylic Acid 10 min 158561 86841 20 min 161448 88486 30 min 183010 92246 1 hour 188684 93413
Acetaminophen Acetylsalicylic Acid 0 0 0
10 834 964 20 841 973 30 943 1004 60 962 1006
[162]
8
Seton Hall University
Appendix [8] Studying drug kinetics via ATR-IR Spectroscopy
Figure 8-1 Salicylic Acid standard spectra
ATRmiddotIR Spectra of Salicylic Acid Standard (l25 meIOO mL SGF)
1
1 l
~~1
QQ()9
MOB
(IOJ7
(I(x)6
OGOS
000
0003
(1002
0001 -Salicylic Acid
1060 1070 1080 100 1100 1110 lZ() 1130 1140 1150 ll60 1170 l1SO 19() 1200 220 220 1230 1240 1250 1260 1270 1280 1290 1300 1310
Wnumbe (em-ll
[163]
Seton Hall University
Figure 8-2 Acetylsalicylic Acid standard spectra
ATR-IR Spectra of Acetylsalicylic Acid Standard (325 me1OO mL SGF)
001
0009
0008
0007
0006
f i 0005
l -
0004
0003
0002
0001
0
Acetylsalicylic Acid Peak not shyin salicylic acid
standard r
J --- shy ~ r- I
-- V
-Acetylsalicylic Acid
A V ~
1060 1070 1080 1090 1100 1110 ll20 1130 1140 1150 1160 1170 1180 1190 1200 1210 1220 230 1240 1250 1260 1270 1280 1290 BOO
W_number laquomll
[164]
Seton Hall University
Table 8-1 Aspirin FT-IR Frequencies of Interest
i Wavelength (c-m-) Assignment
I 2300-2500 carboxylOH i 1760 vinyl ester C=O bull 1690 aromatic acid C=O
1610 aromatic acid C=O 1580 aromatic C=C stretch 1490 aromatic C=C stretch 1220 =C-O (acid and ester) 1190 =C-O (acid and ester) 760 ortho substituted phenyl C-H bending
[165]
Seton Half University
Figure 8-3 Rate Order Formulas and Equations (Reproduced from Wikipedia website on Rate Order)
Zeroorder Secondorder lIihorder
_ d[A] = k _ d[A]middotmiddot~ k[41~4Jd[4]Rate Law k[4]ftdt -Ttdt
Flntorder
_drA) = k[4] dt
1 Ii
In([4]) VB t
In(2) tl2 = -k-
[4]0n-l + (n - l)kt 1 1
Integrated Rate Law [A] [Alo-
M 1 1Units of Rate Constant (k)
bull SMs 1
1 VB t Lnear Plot to determine ilt [A] VB t [4] VB t
(Exoept first ofde~
[4]0 _ ~41 (n _ 1)k[4]on 1Half-life t I2 - k[4]0t1 2 = 2k [Except filSt order)
[166]
9
Seton Hall University
Appendix [C] New Instrument Design (Solv-IR) attachments
Figure 9-1 ATR-IR Technique Diagram (courtesy of Jian Wang PhD Mettler Toledo)
[167]
10
Seton Hall University
~---~-------~~~--~~
Appendix [0] BP Gulf oil research attachments
Figure 10-1 Detergents used during BP Gulf oil research
[168]
100
Seton Hall University
Figure 10-2 IR Spectra of Gulf Oil from Riser Pre- April 20 2010
-DIStiIedWltIter
- Rl$erOlL_Pe~20
1800 1700 1600 1500 1400 1200 1100 1000 800 700
MpoundlnER TOLEPO
[169]
Seton Hall University
Table 10middot1 Amount of Dawnreg dishwashing detergent added
Time (hmm) Volume added (ml) Total volume in vessel (ml)
001 1 1
004 1 2
006 1 3
008 3 6
010 3 9
013 3 12
014 3 15
017 3 18
019 3 21
020 3 24
022 3 27
024 3 30
026 3 33
026 3 36
028 3 39
034 3 42
039 3 45
041 3 48
148 3 51
206 3 54
[170]
Seton Hall University
Figure 10-3 Thermo Nicolet 4700 Transmittance of OIL samples
Minimal Sheen
i I ~
Slmiddot
1m Sea Water under oil m ~ 11ll)t
~~~---~-- ~--~---- -~-- shy
AIJXJ University of New Orleans OIL SamplesI w
lIDshy
II t------~ ~ v~v ___ v ~-- __ __ ~__ ___ _~_tv-_
1500AIJXJ ill lO)
t
00 Venigtce OIL Samples (colleded by I)r Sows) I III ~_~cl
[1711
Seton Hall University
Figure 10-4 Thermo Nicolet 4700 Absorbance of OIL samples
Minimal Sheen
i U 0( CO
C6~ Surface Sheen
I~______--J
S University of New Orleans OIL Samples II ~
~ 2i Q
0( O~
Venice OIL Samples (collected by Dr Sowa)
Imiddot
IIlX1
[172]
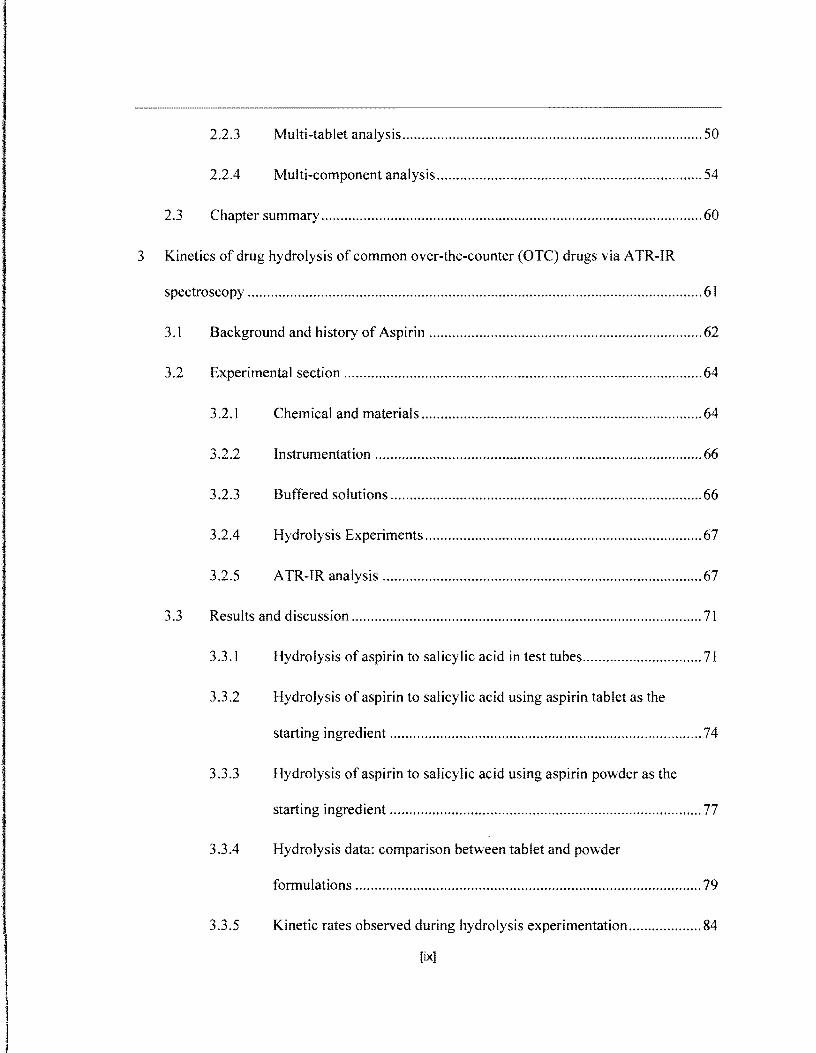
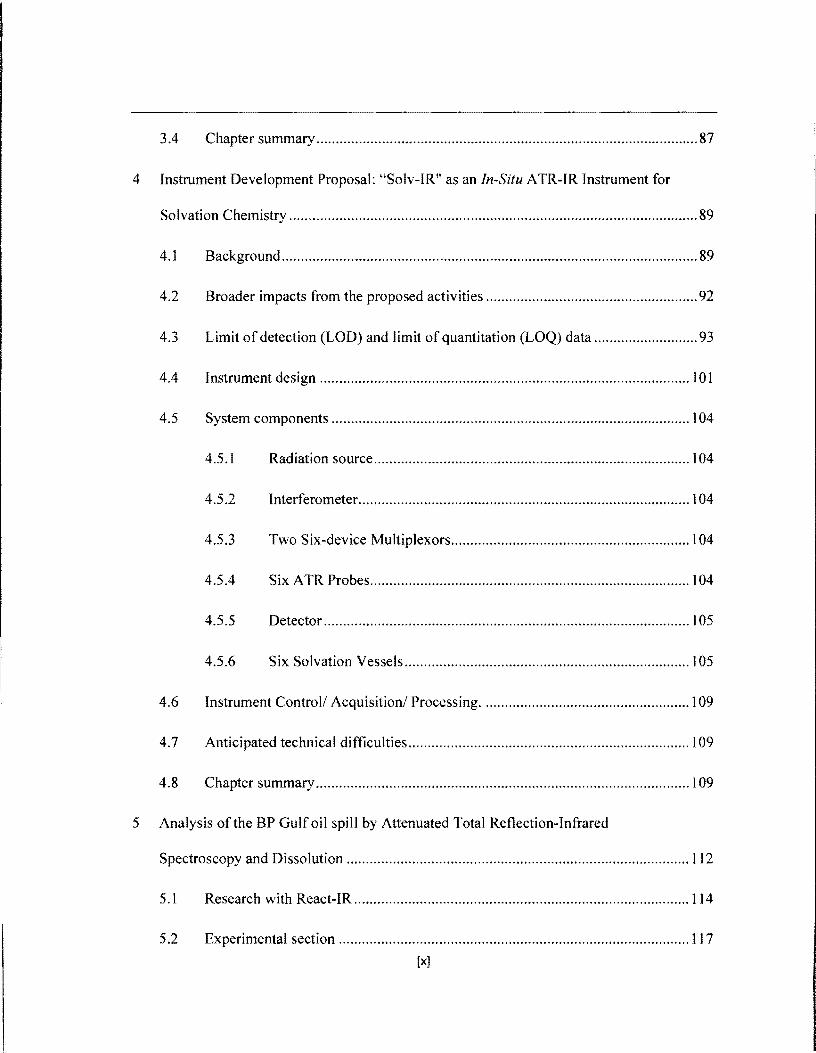
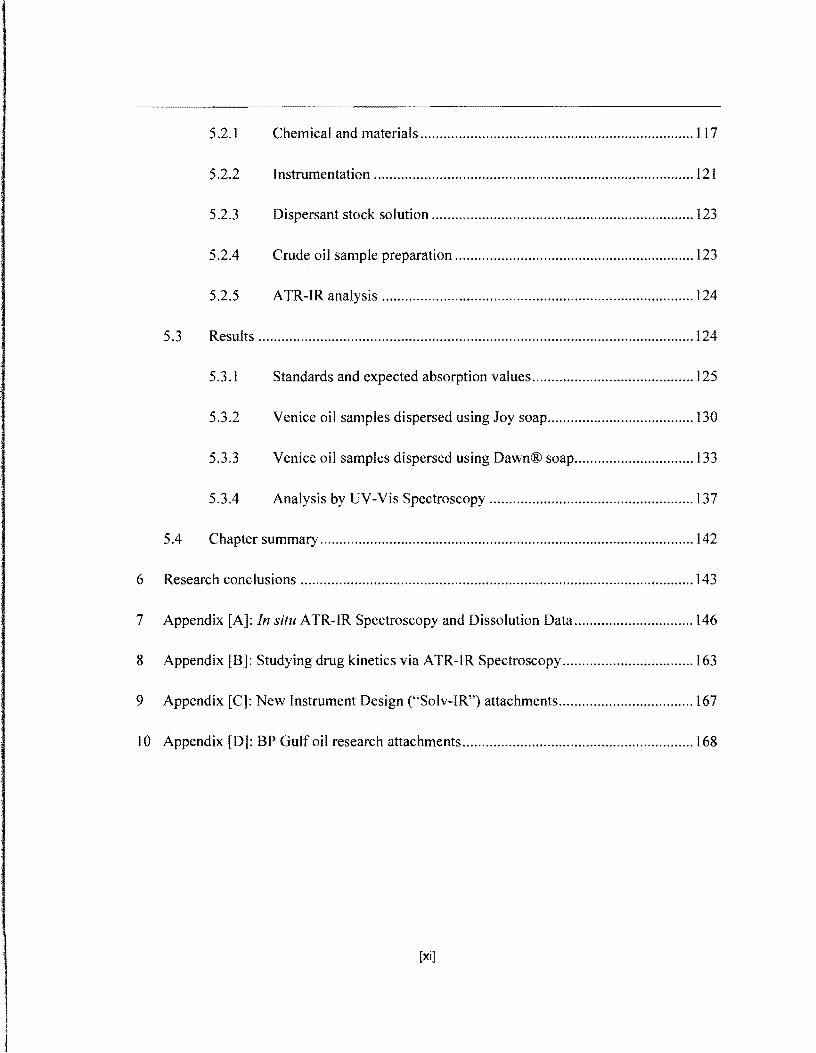
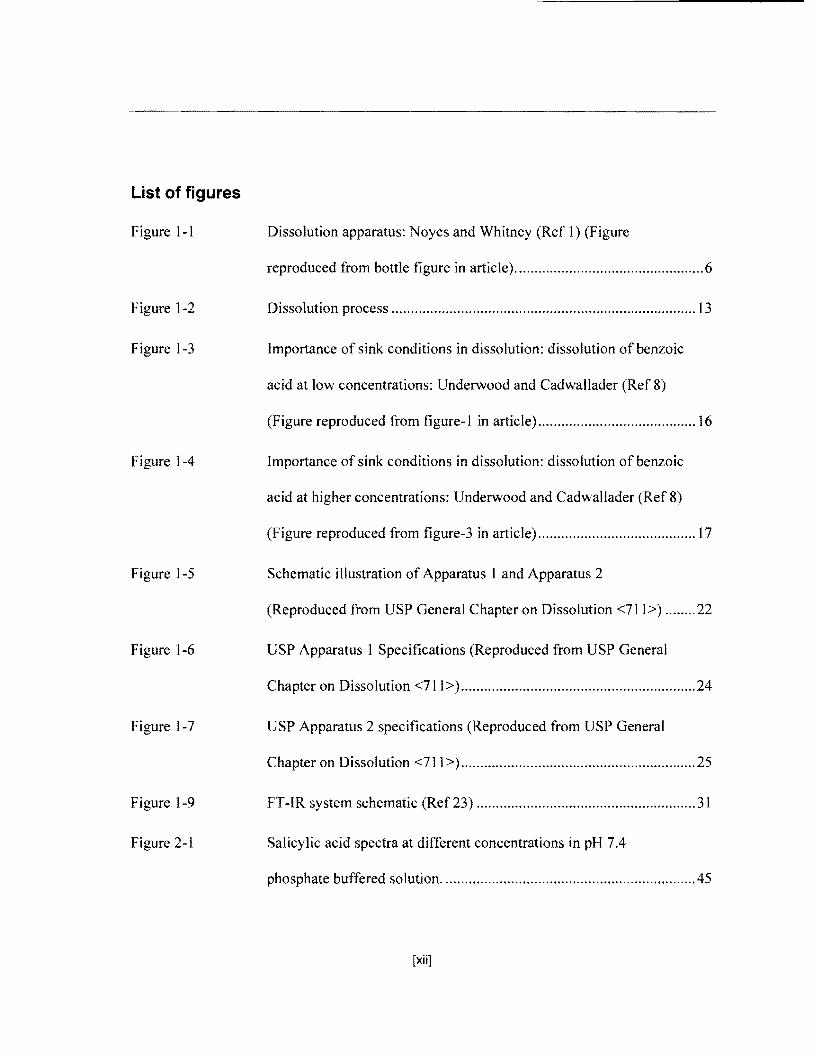

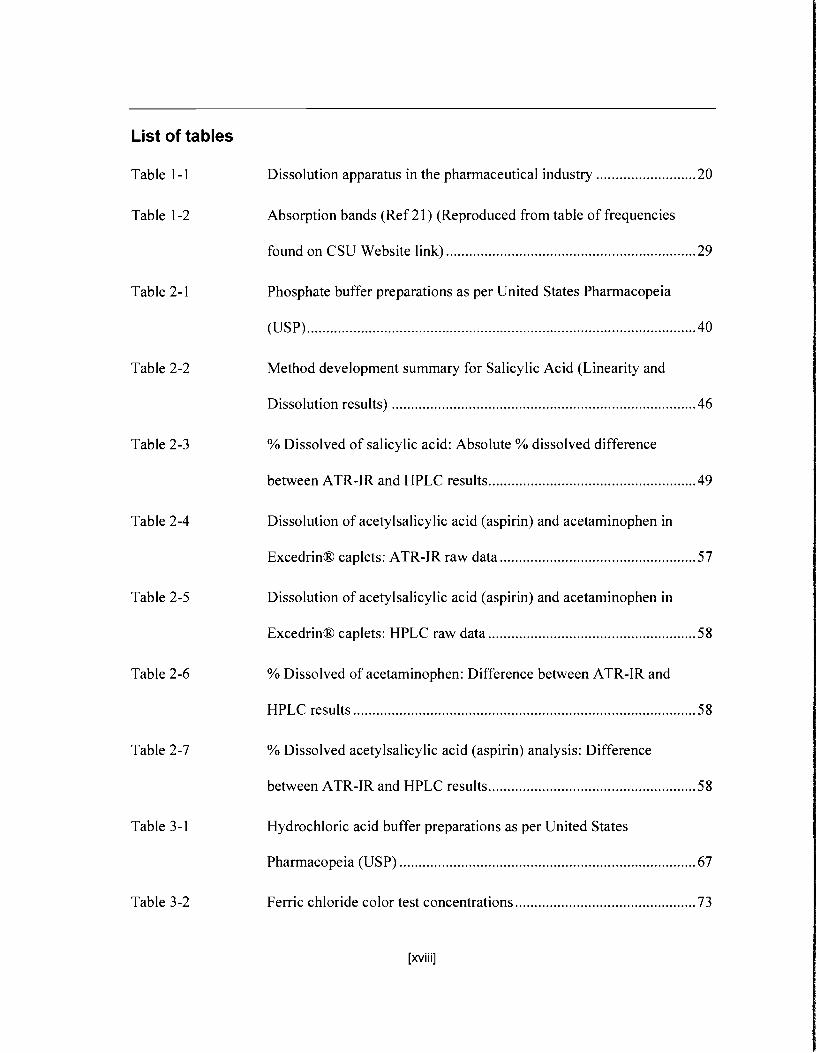
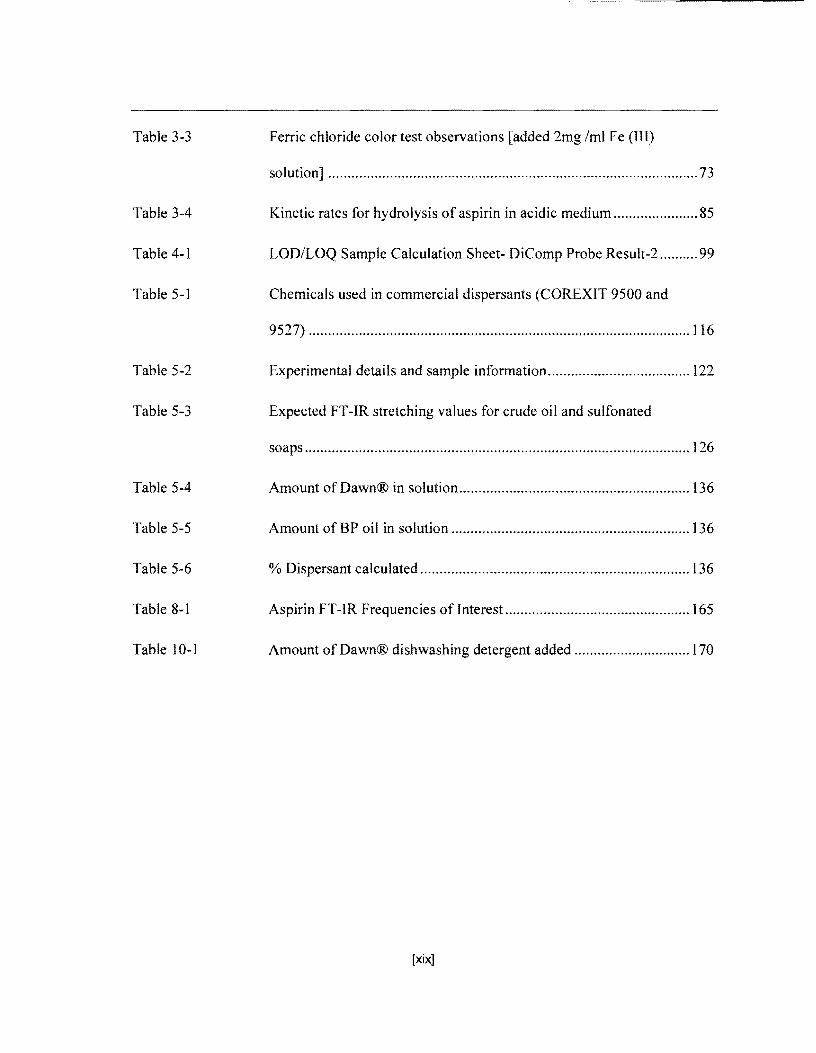
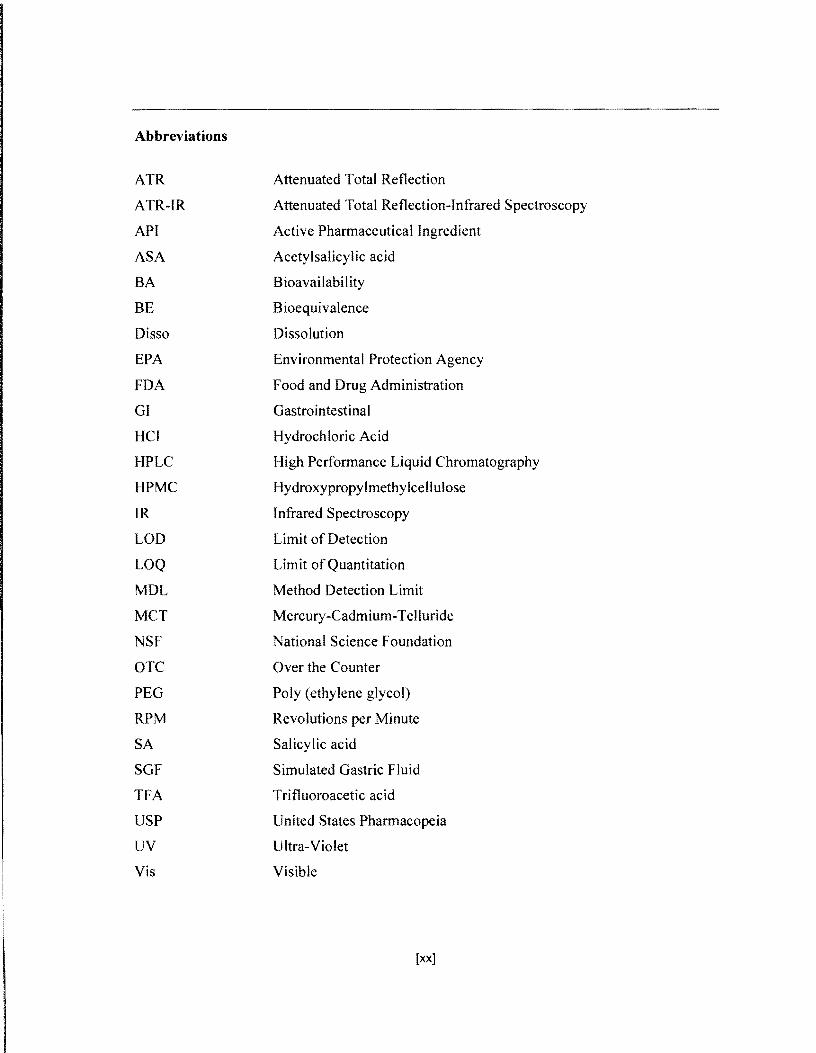
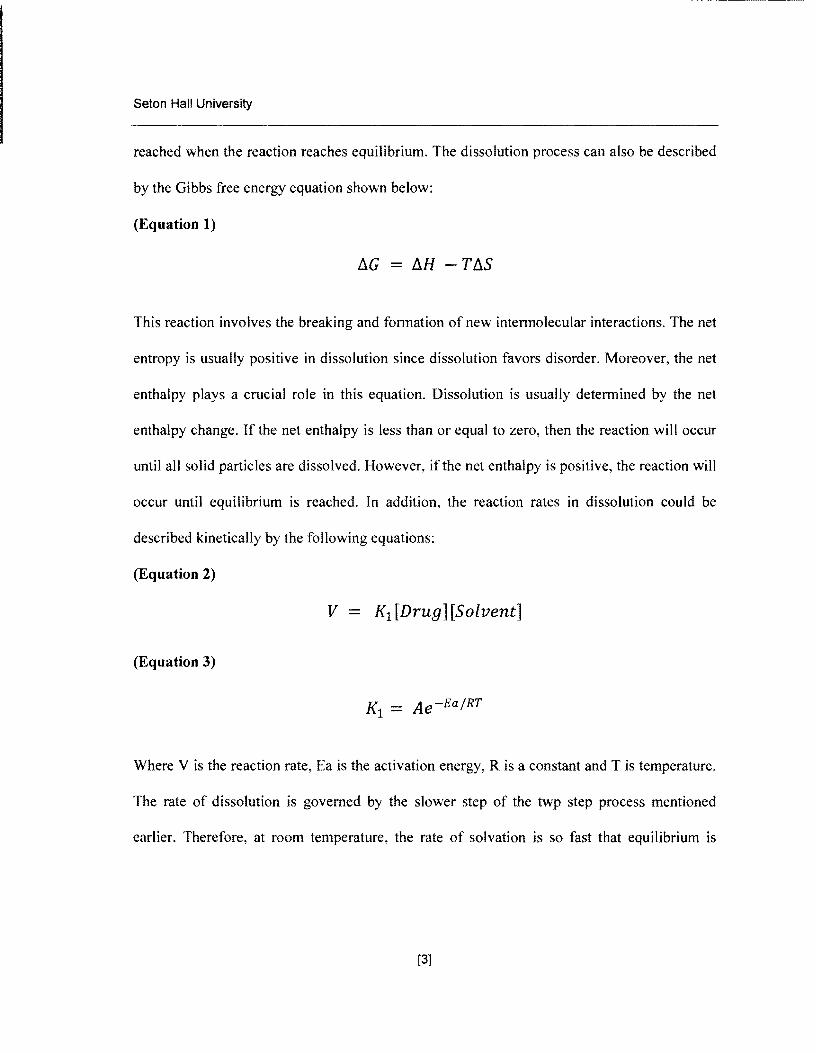
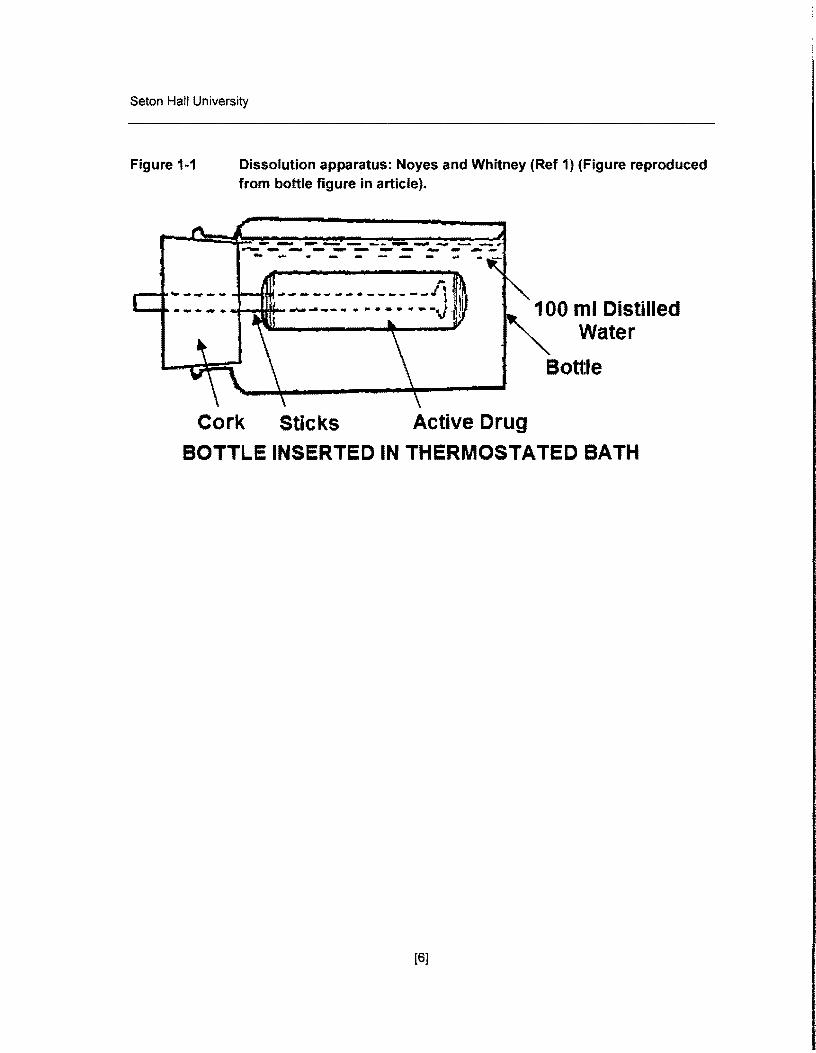
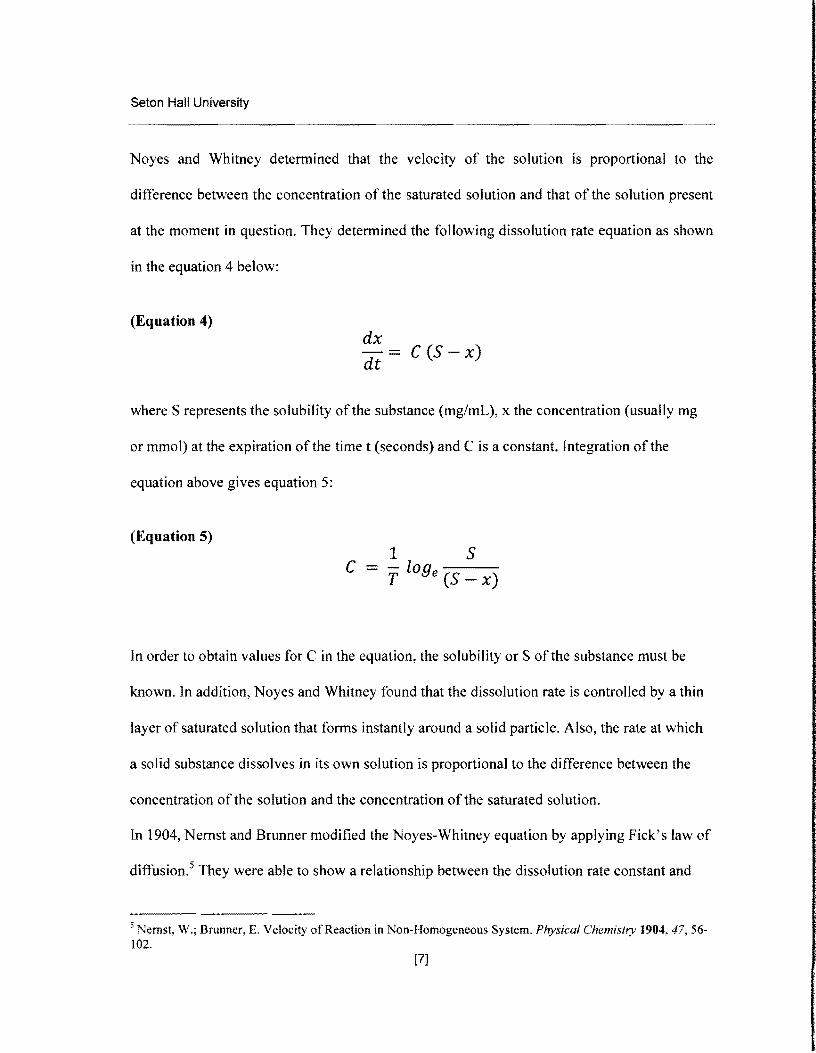
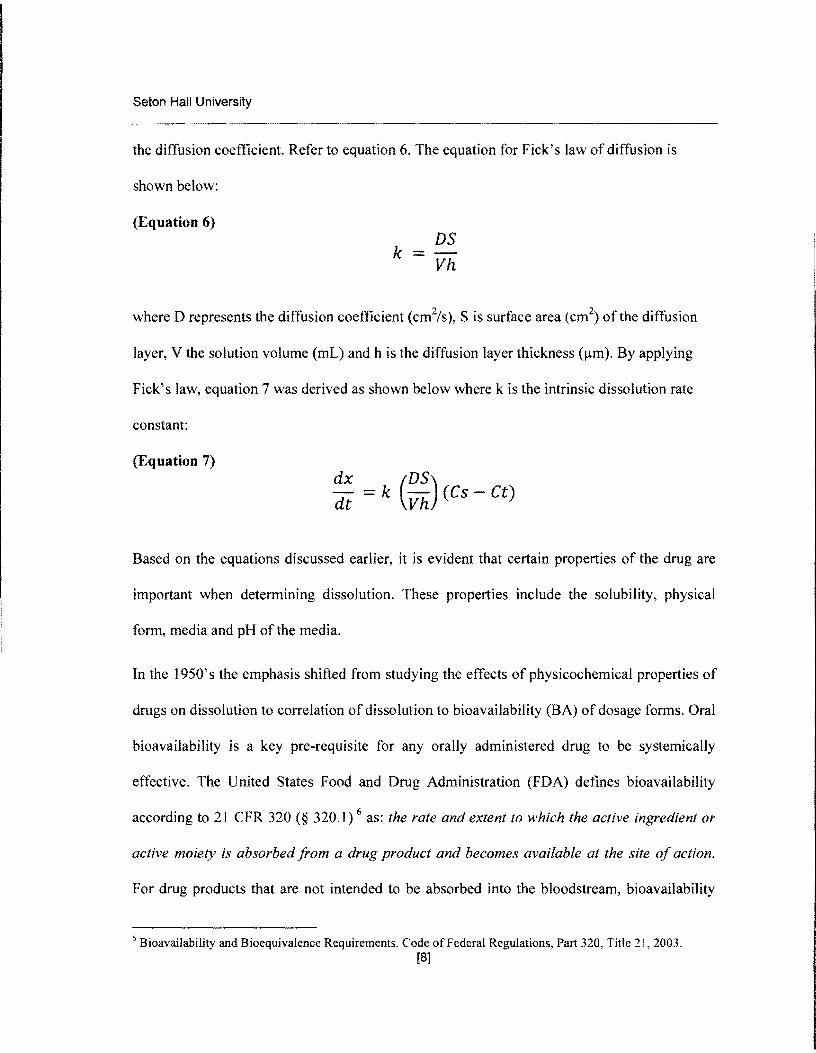
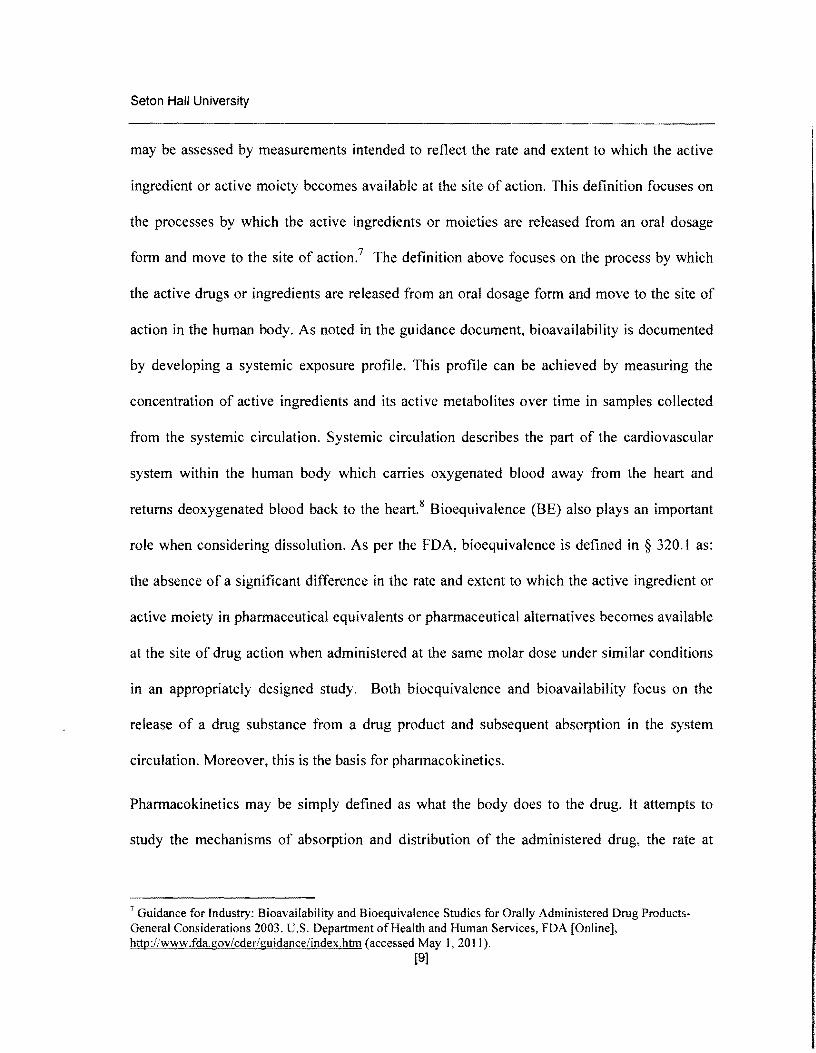
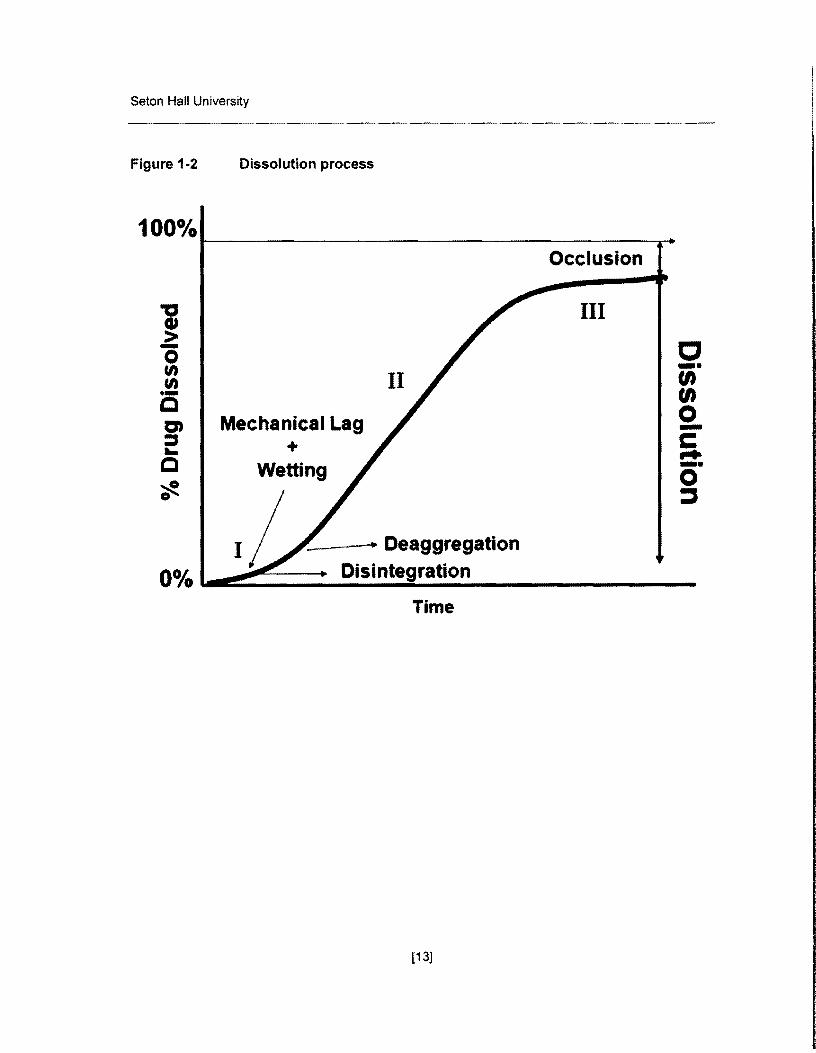
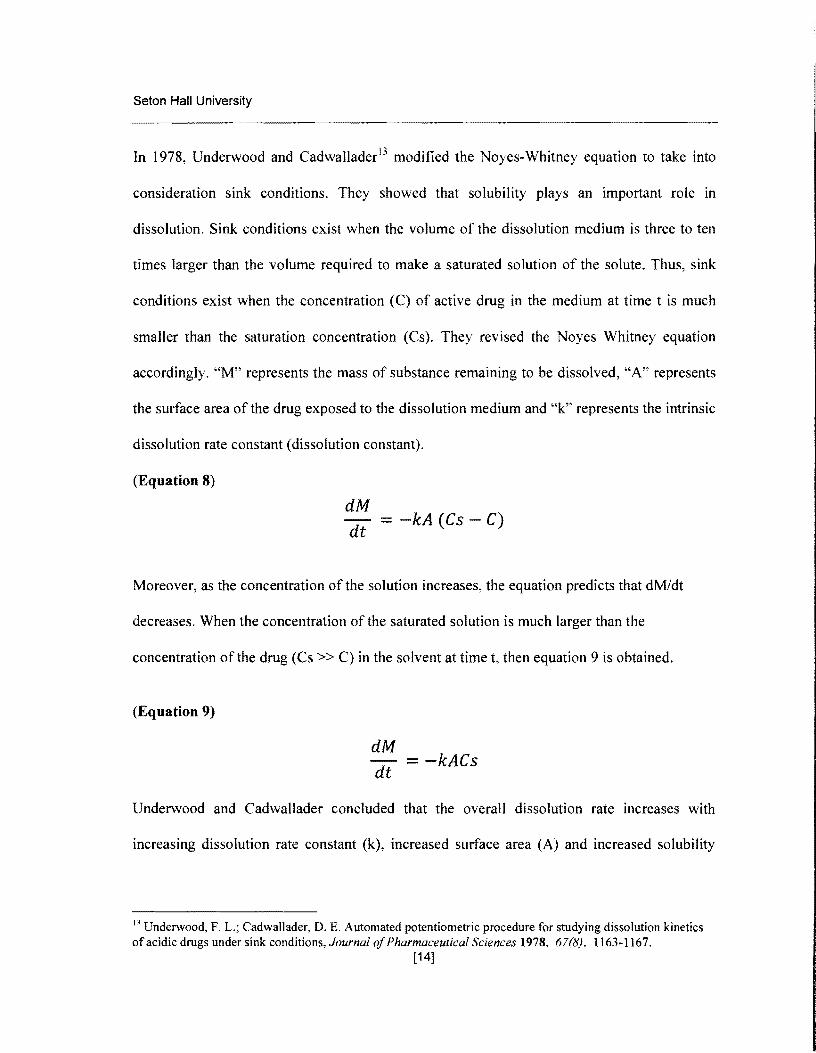
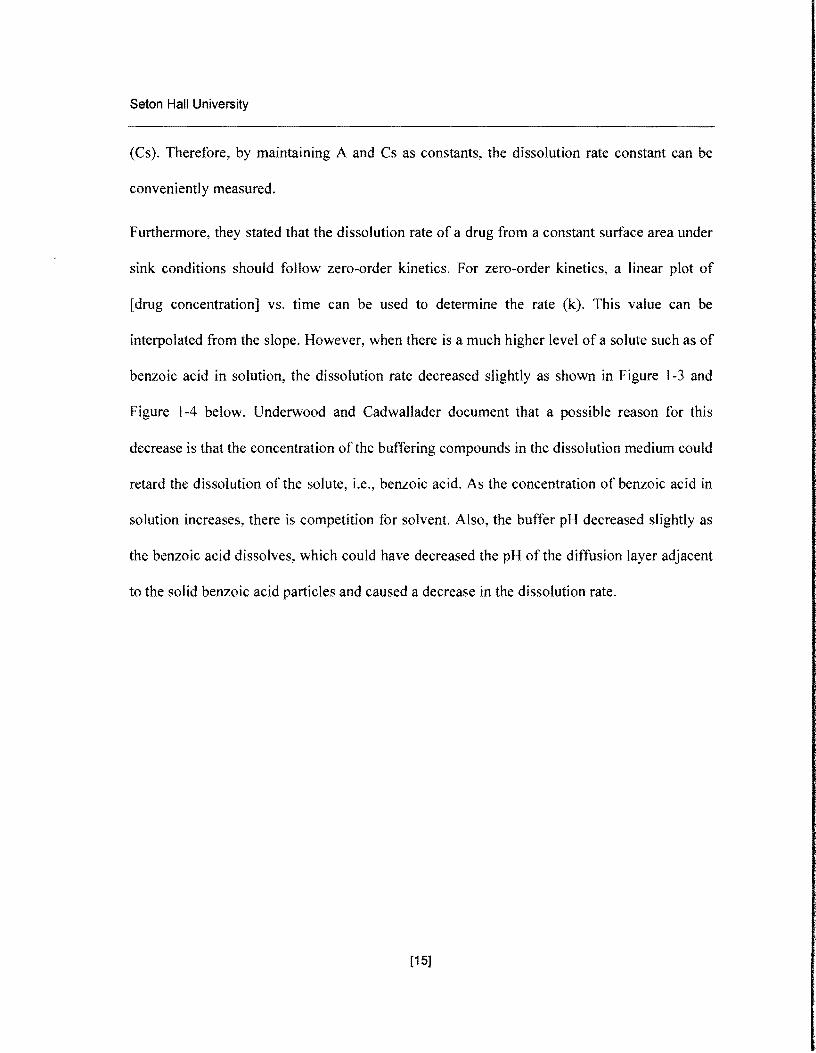
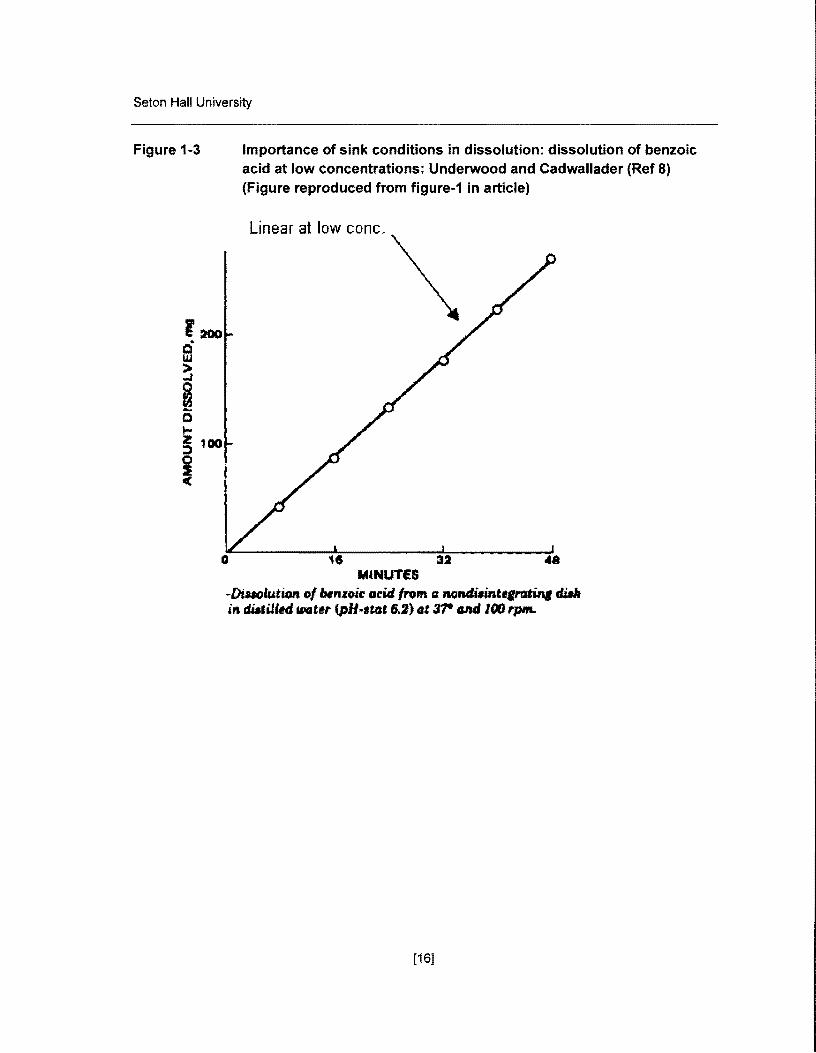
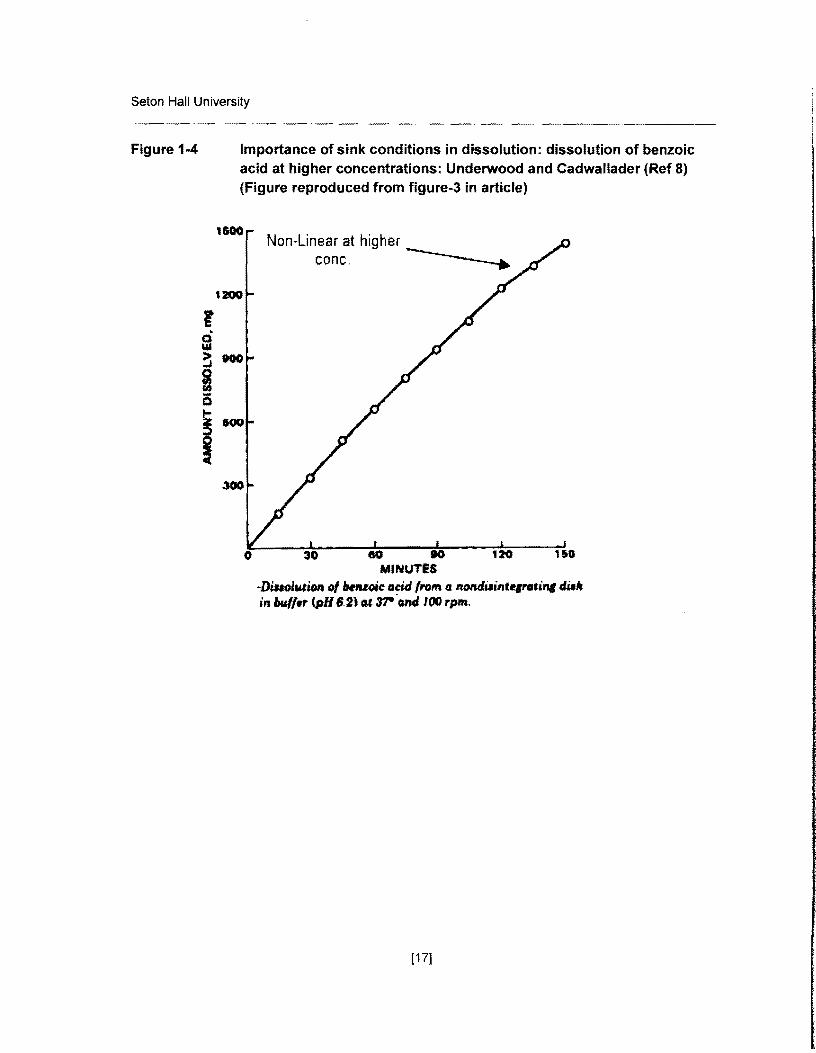
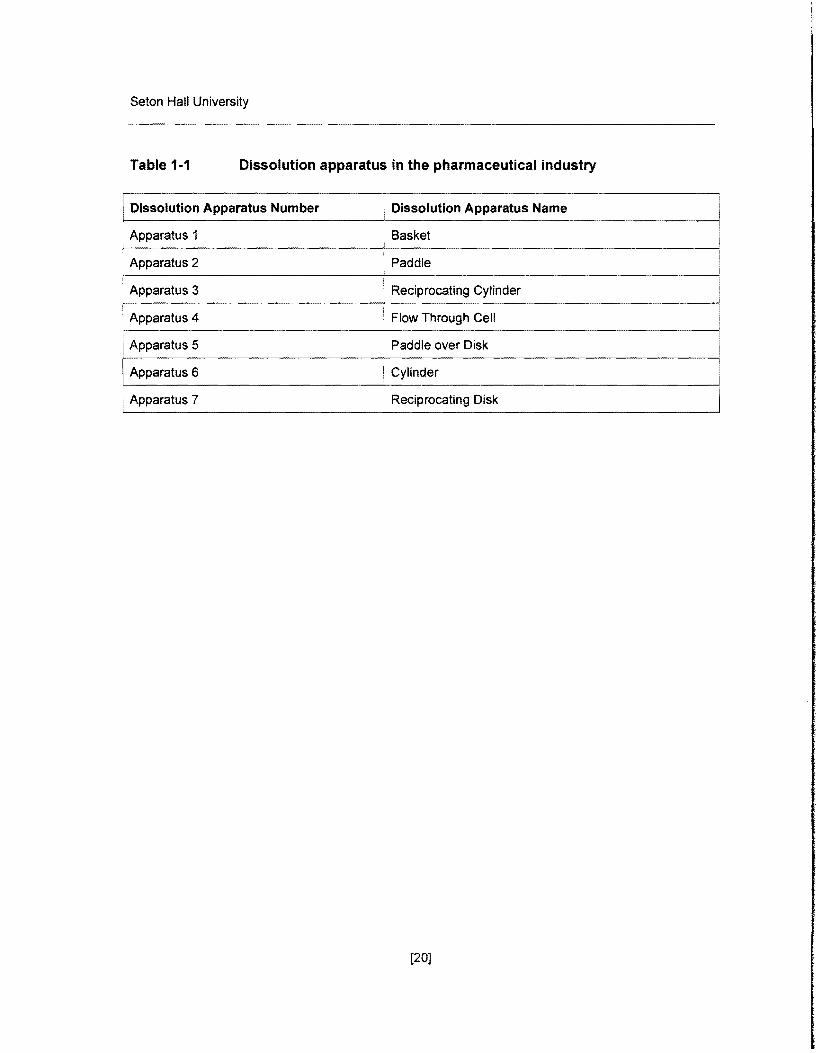
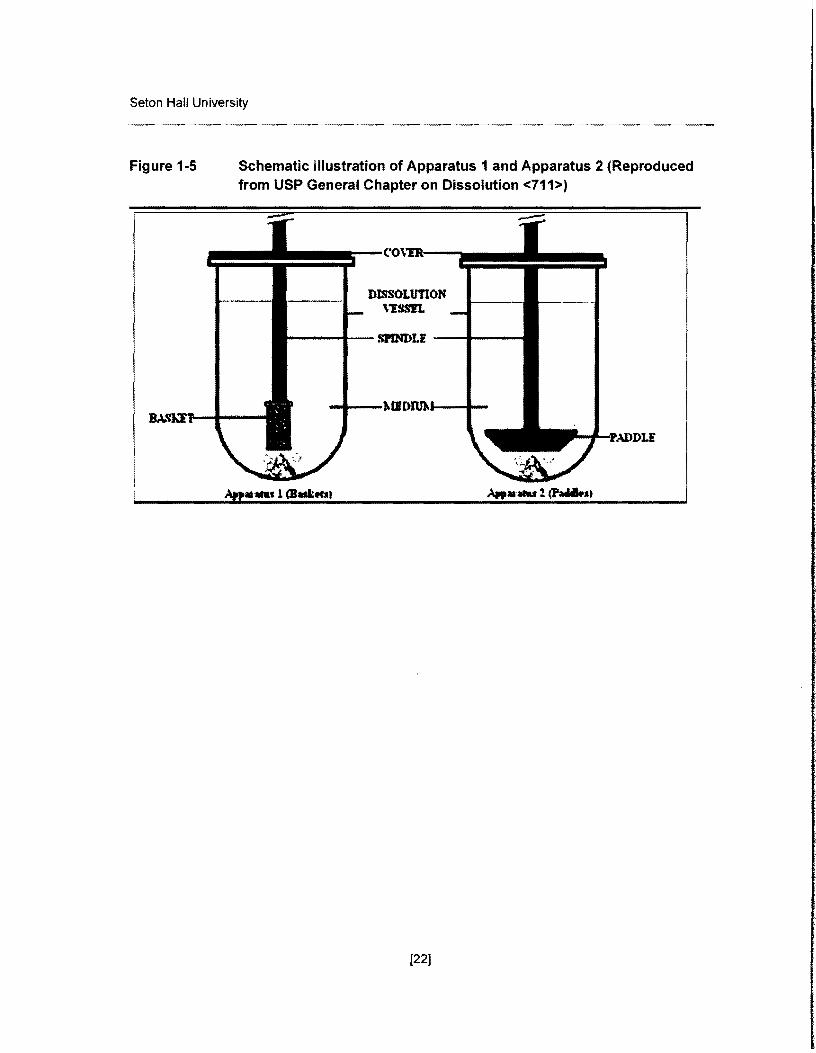
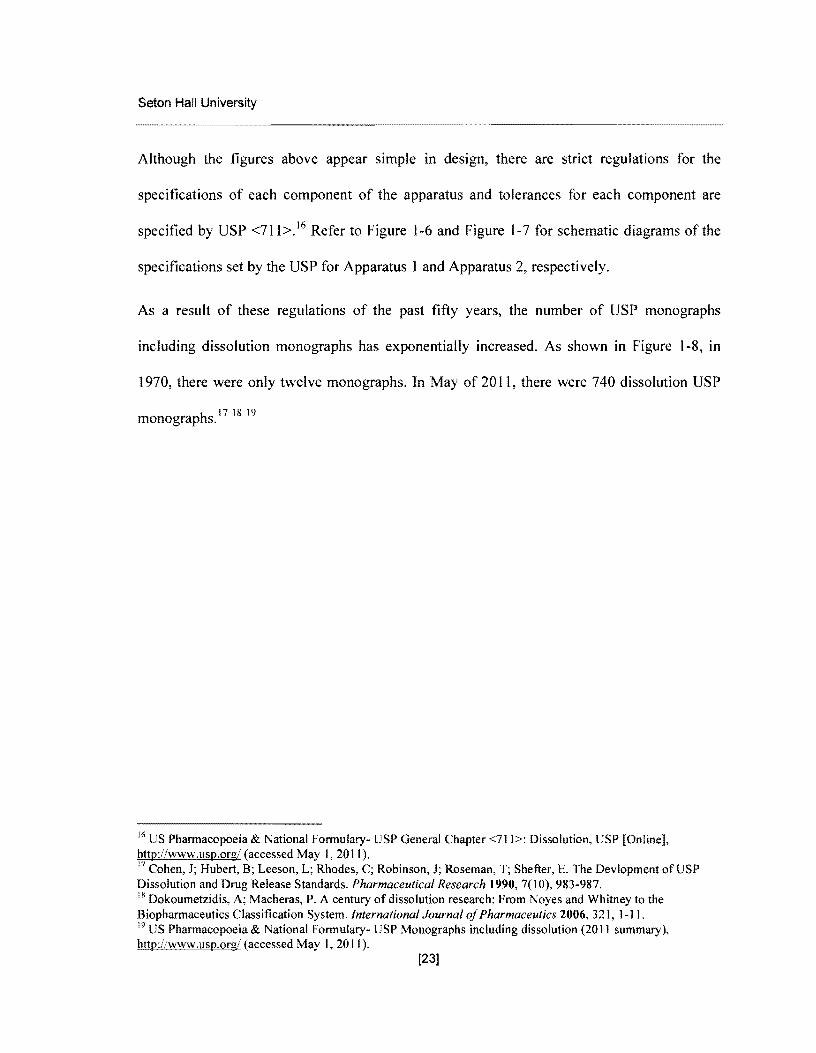
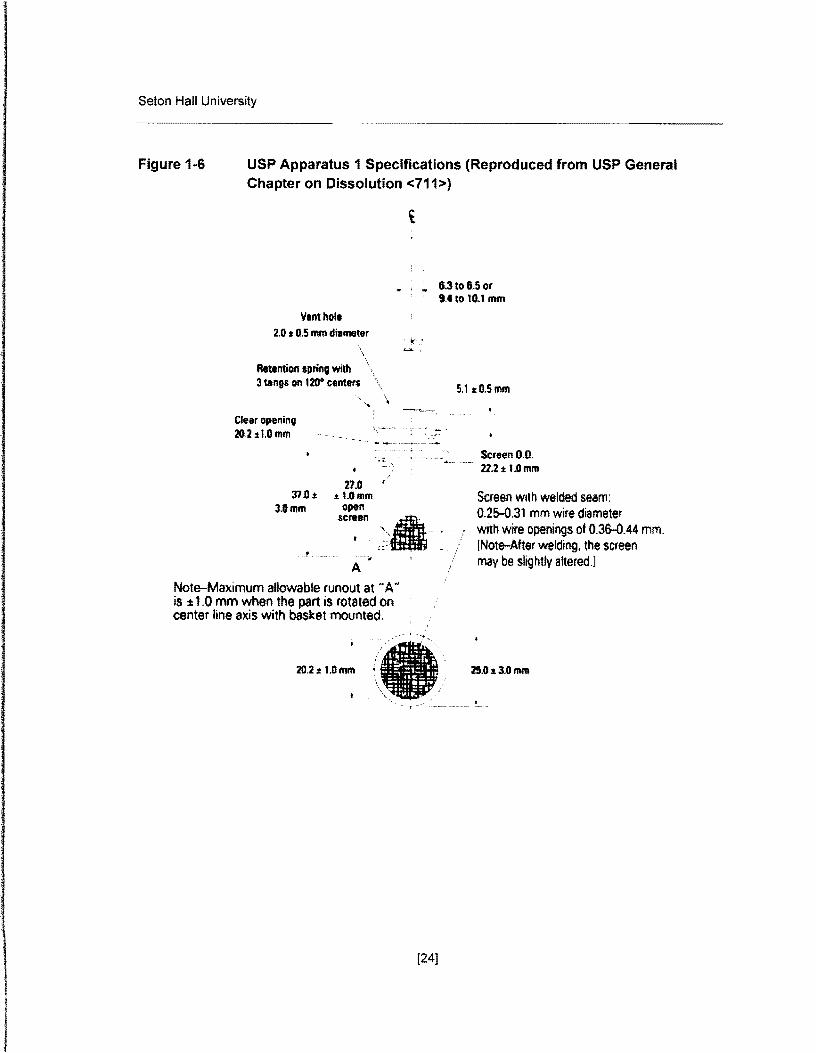
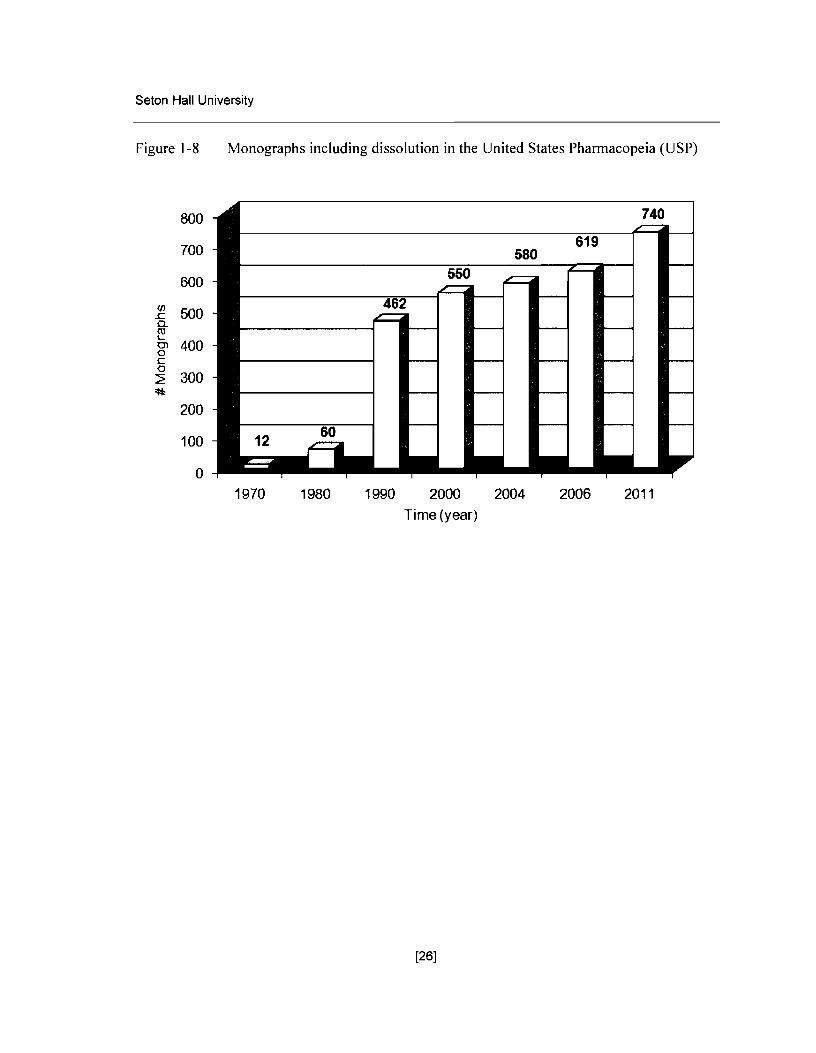
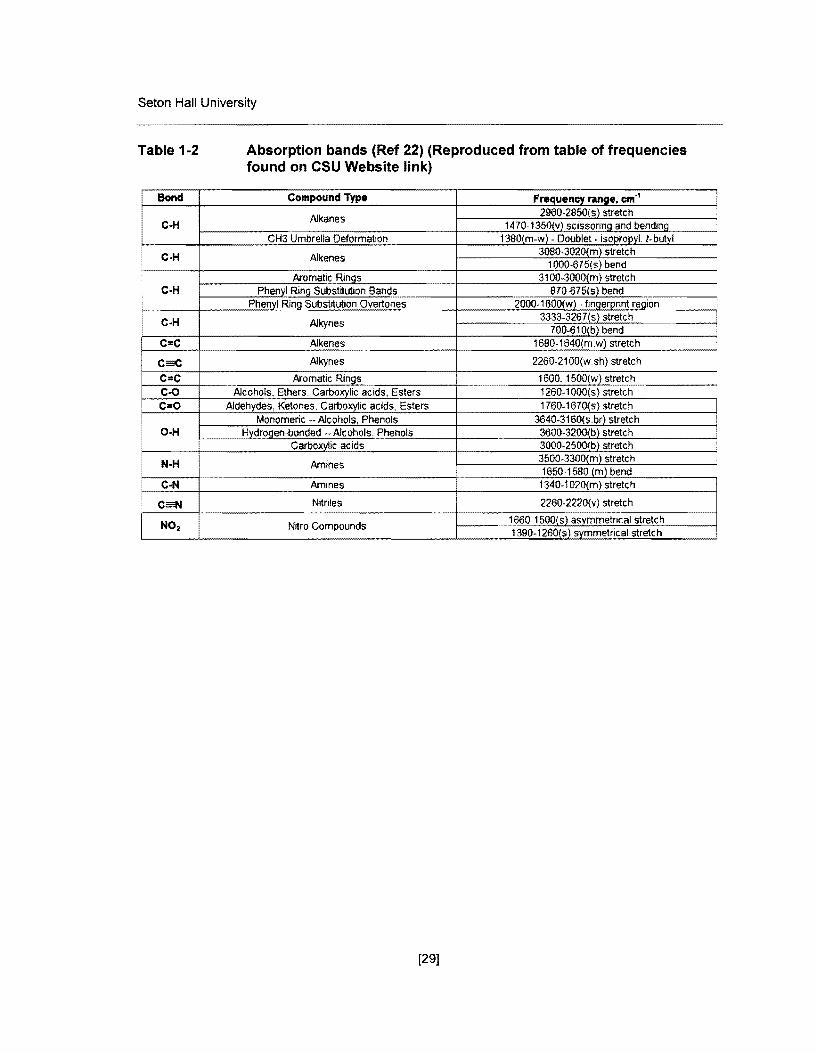
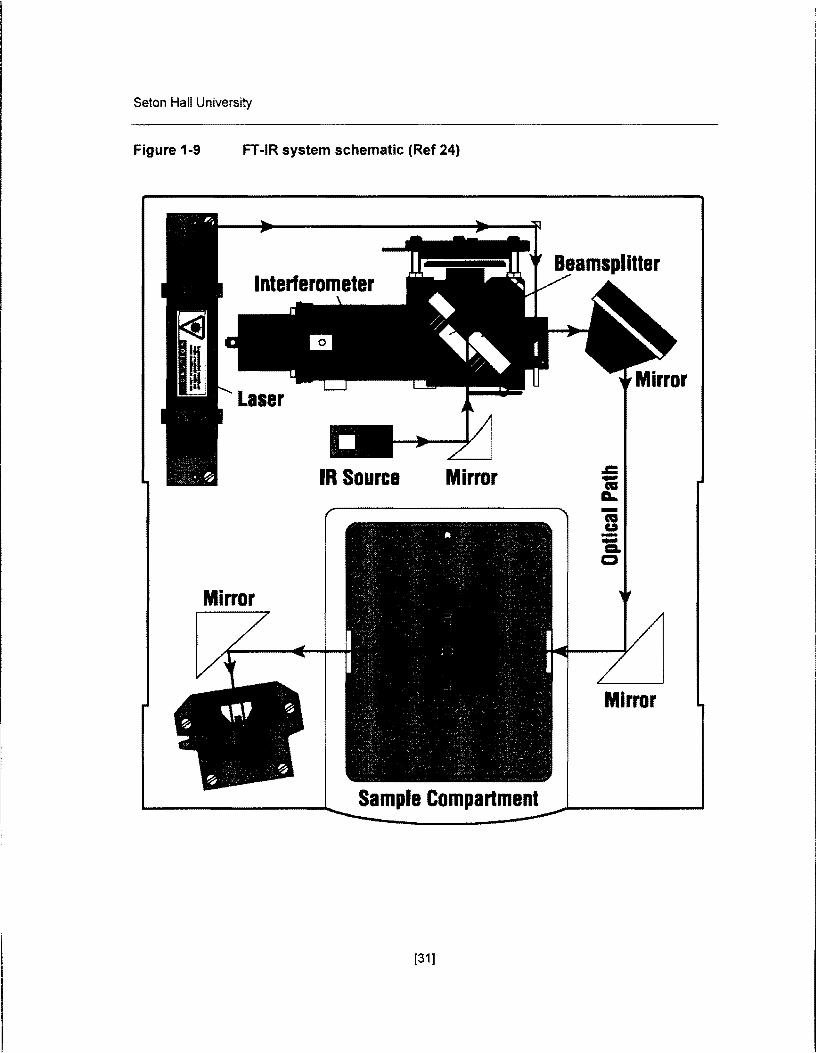
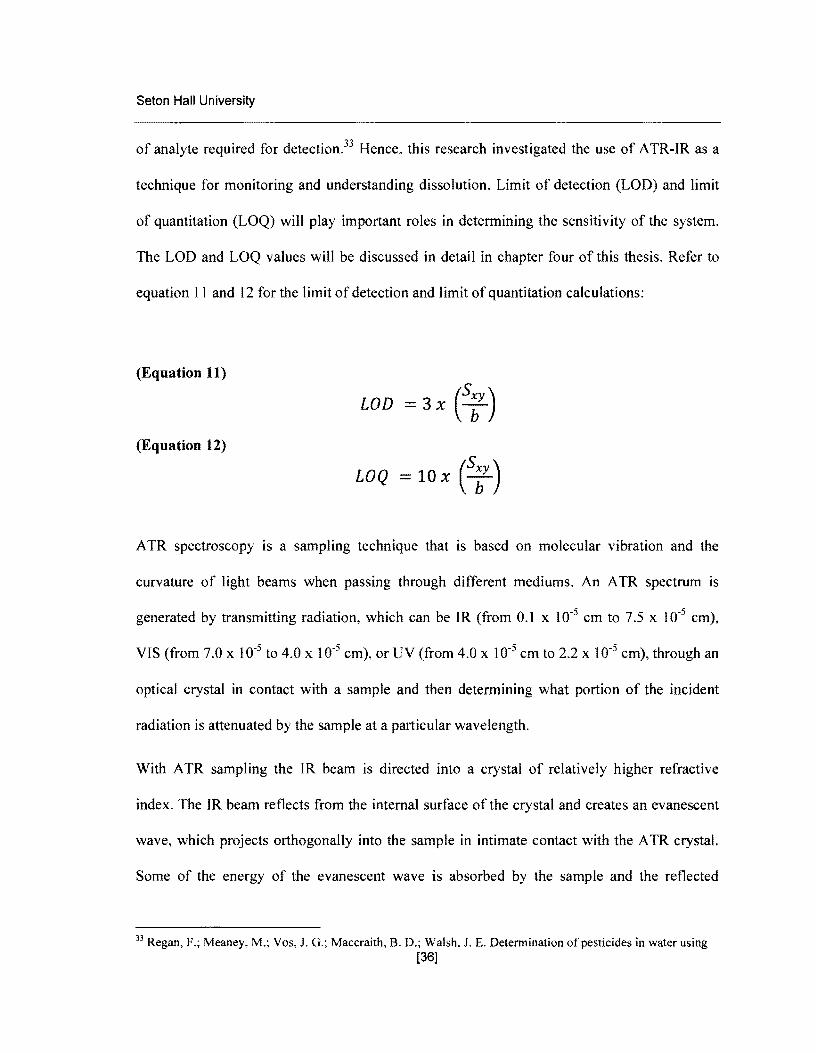
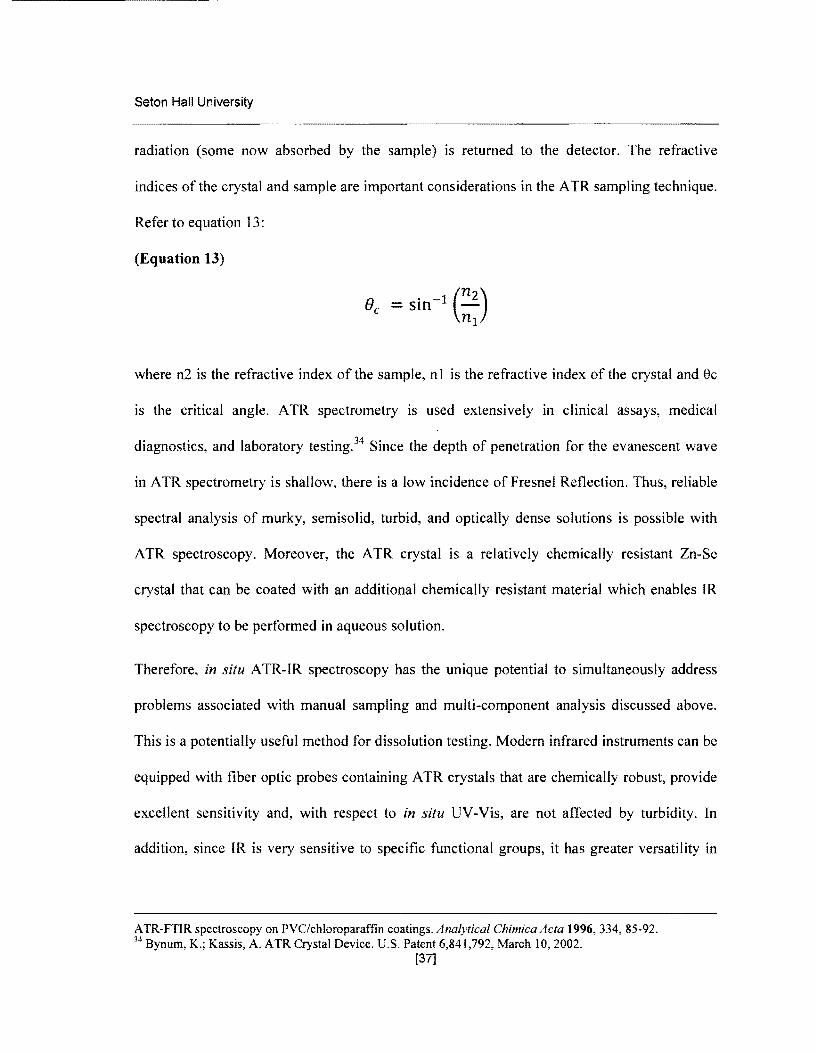
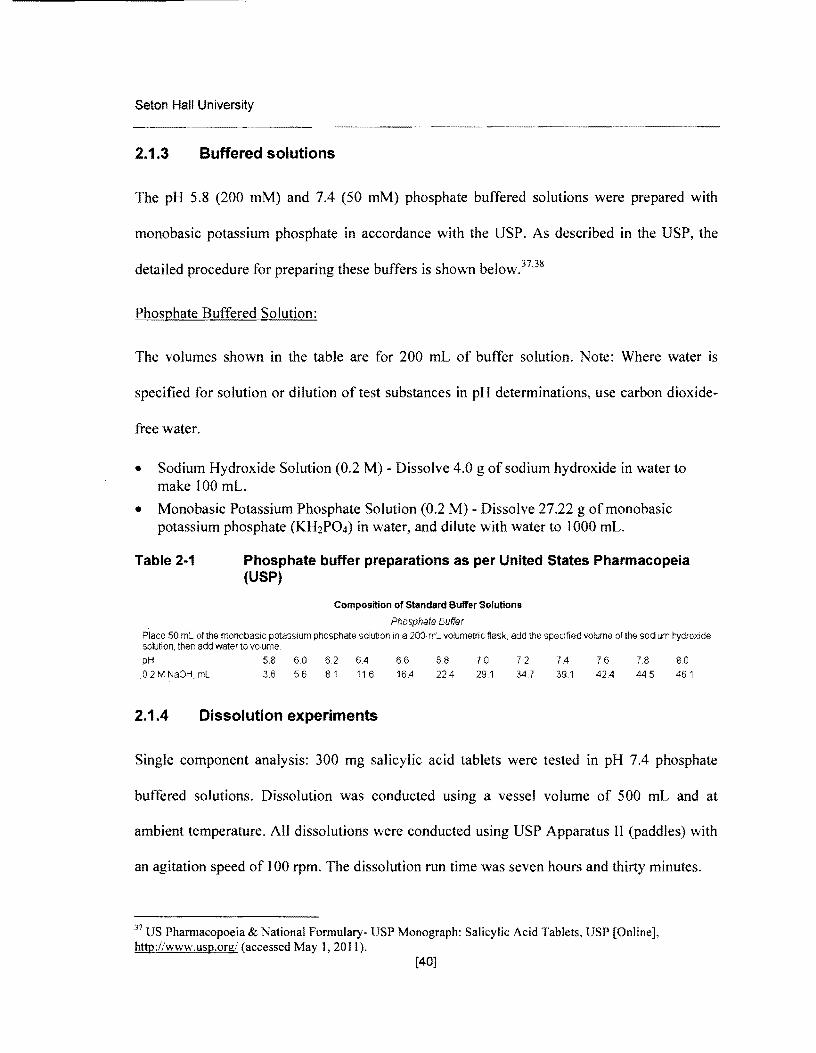
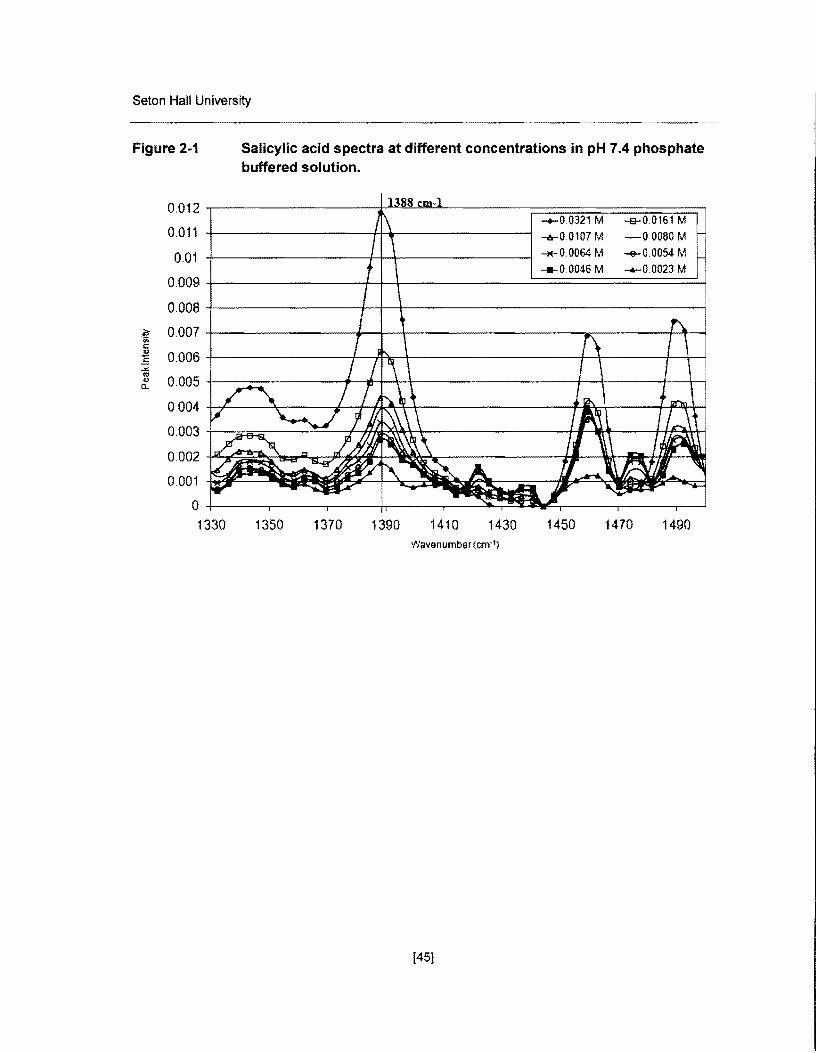
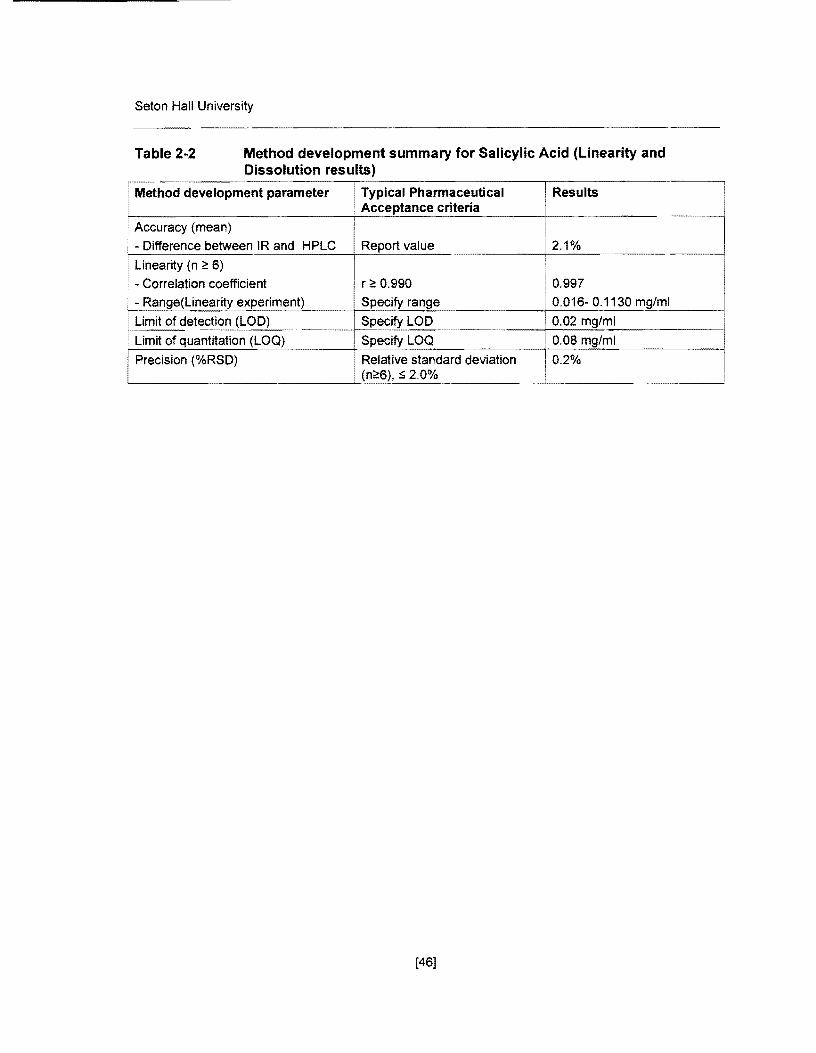
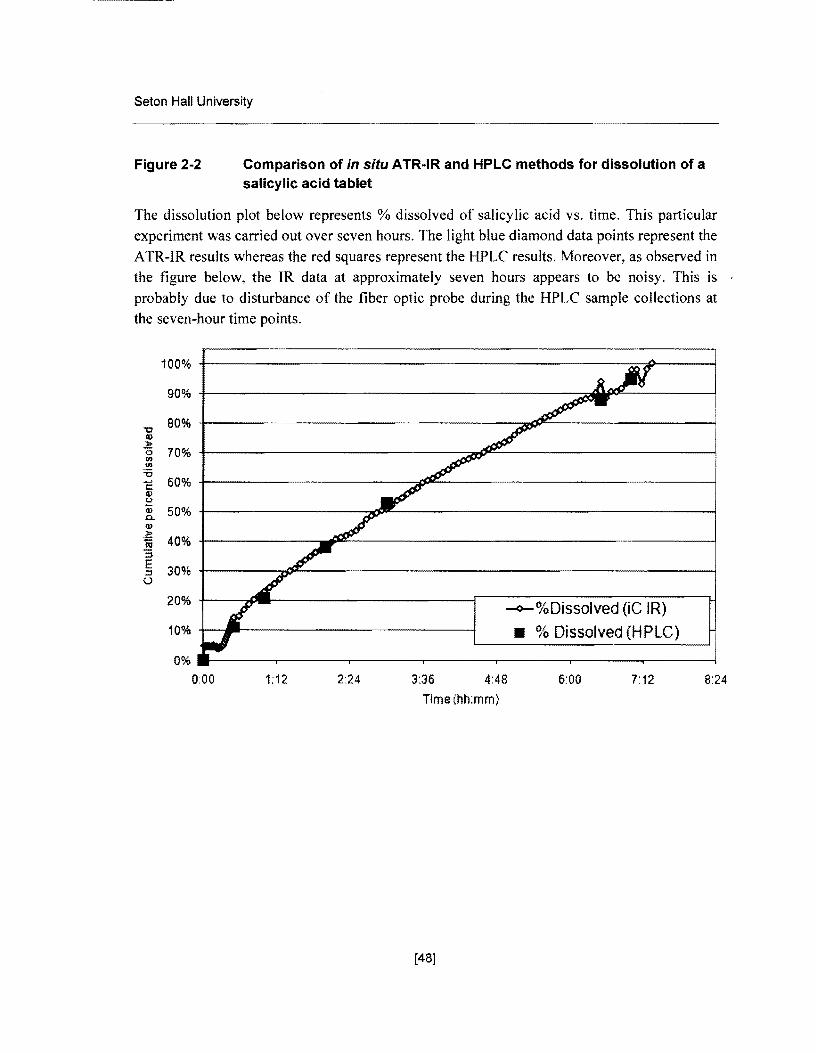
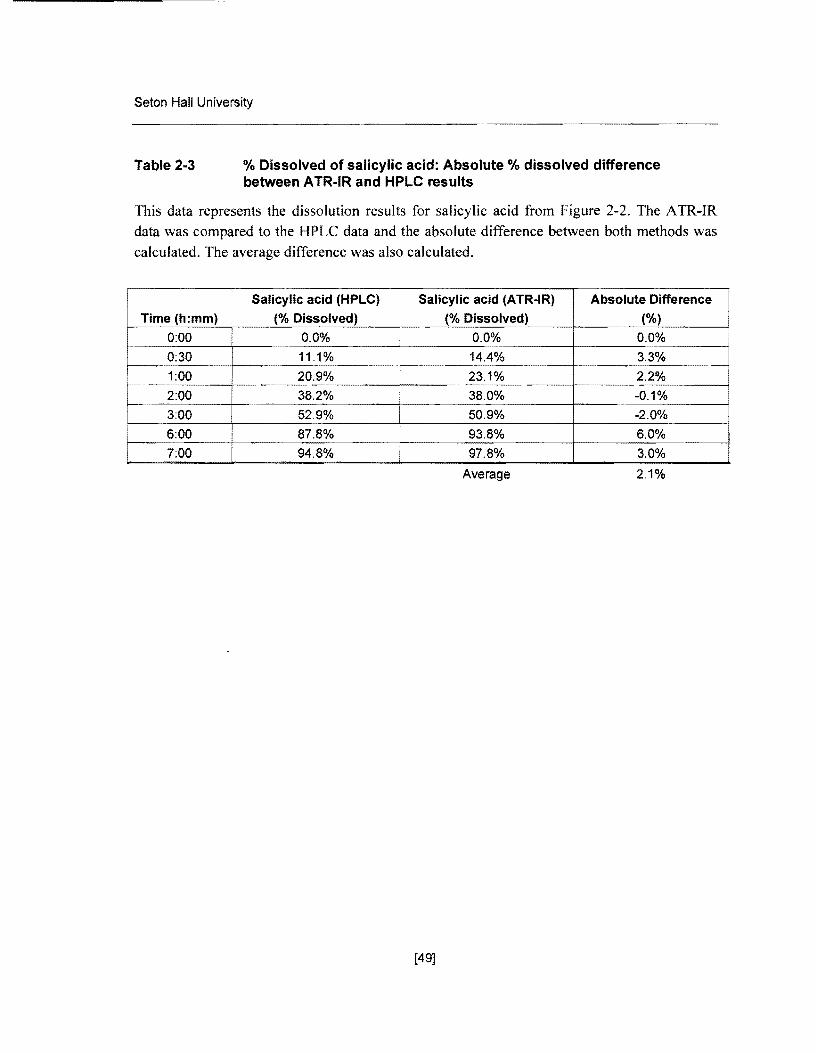
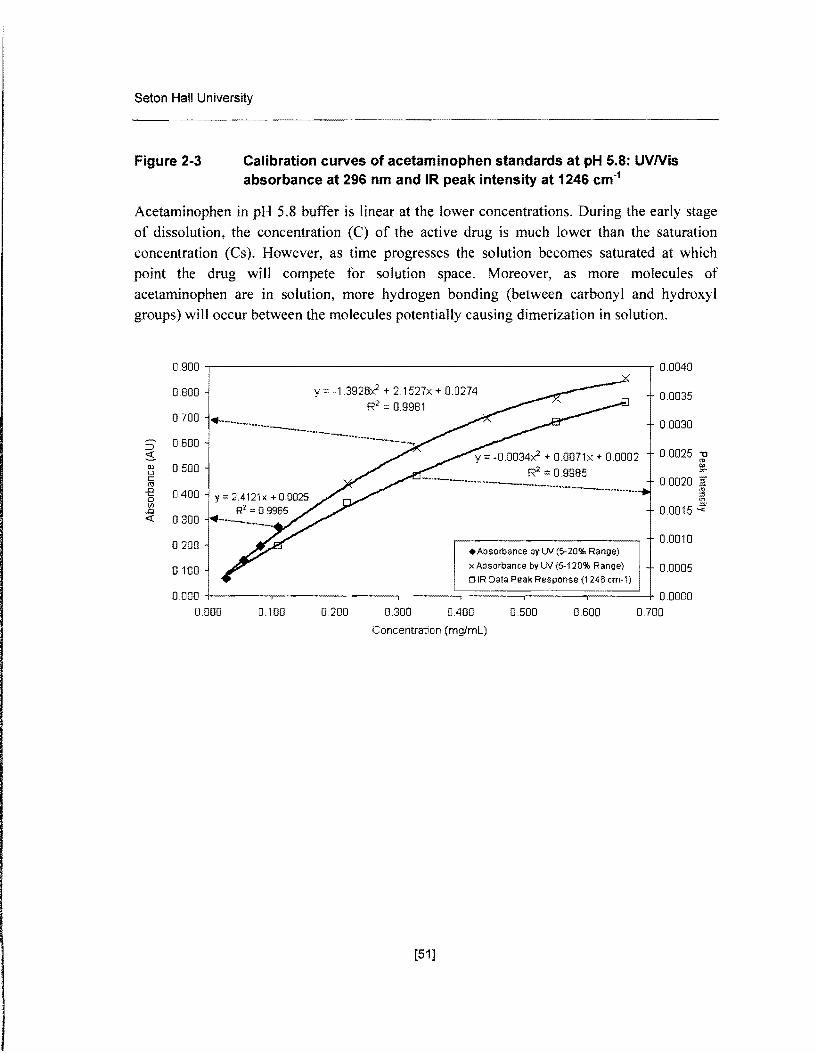
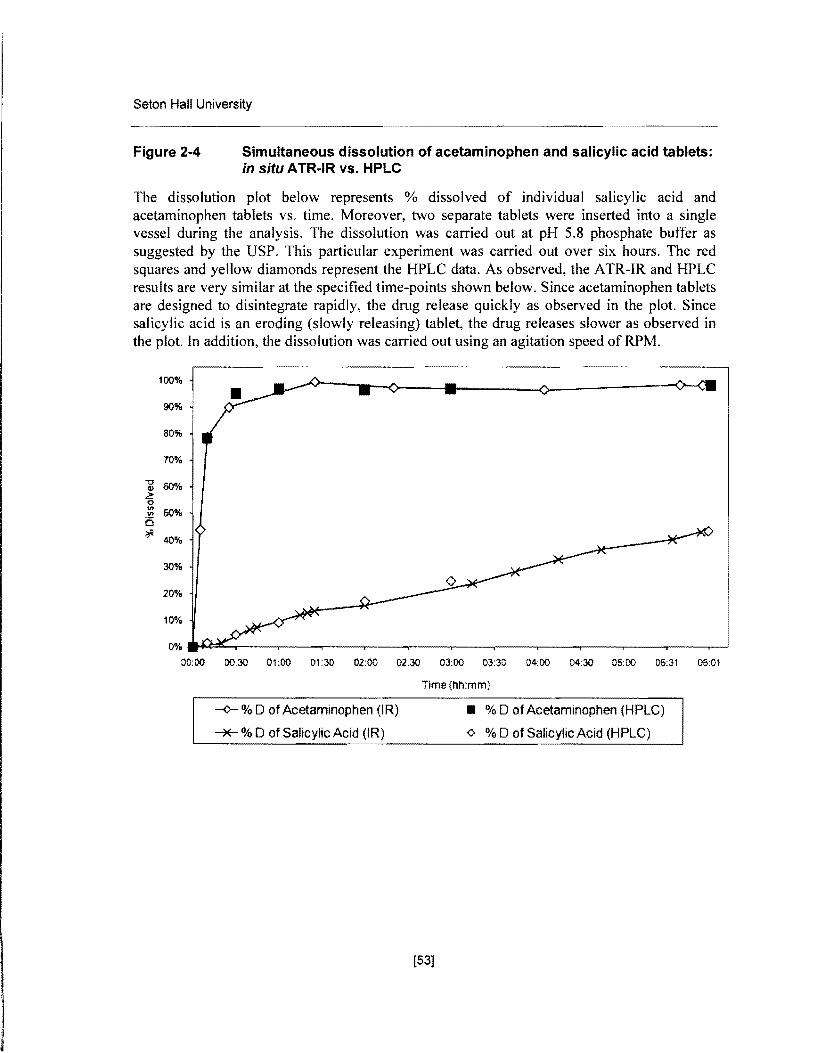
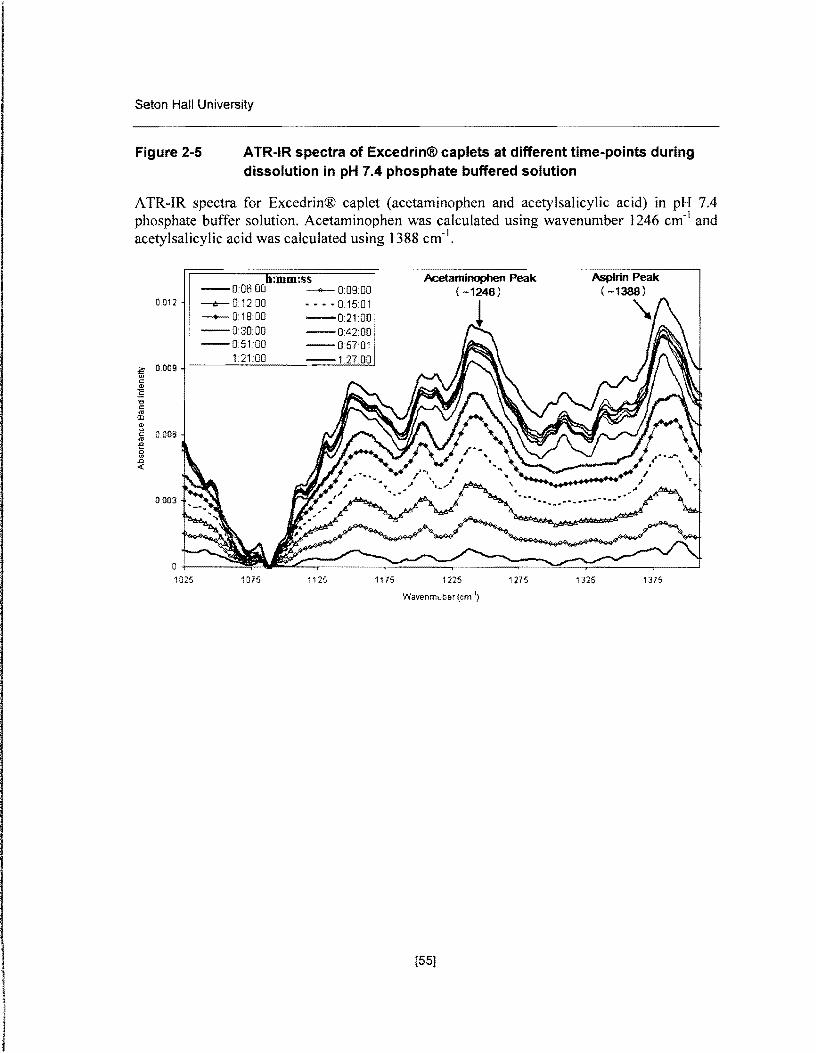
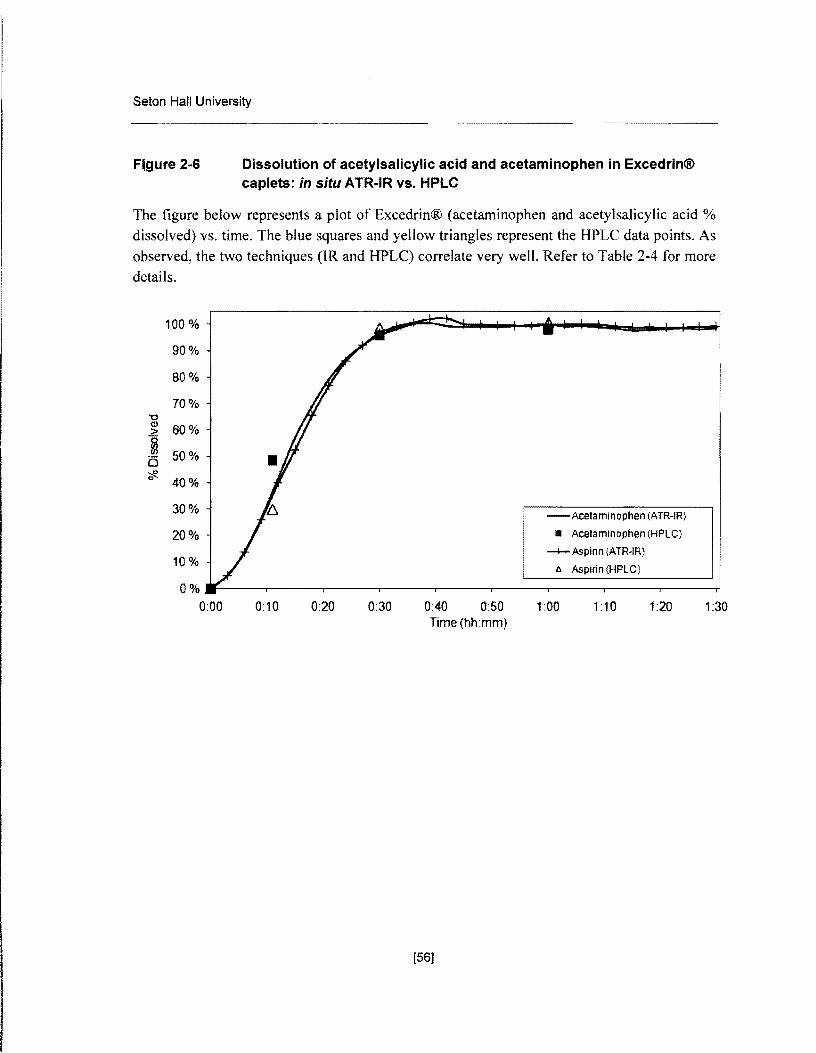
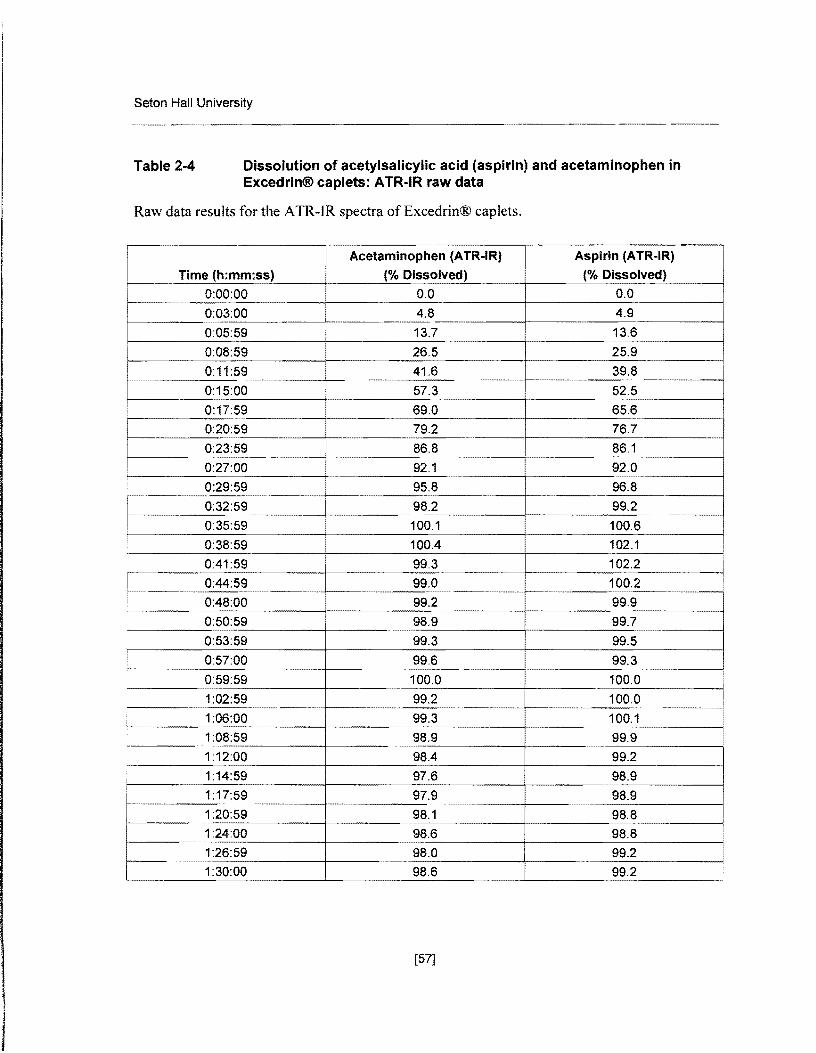
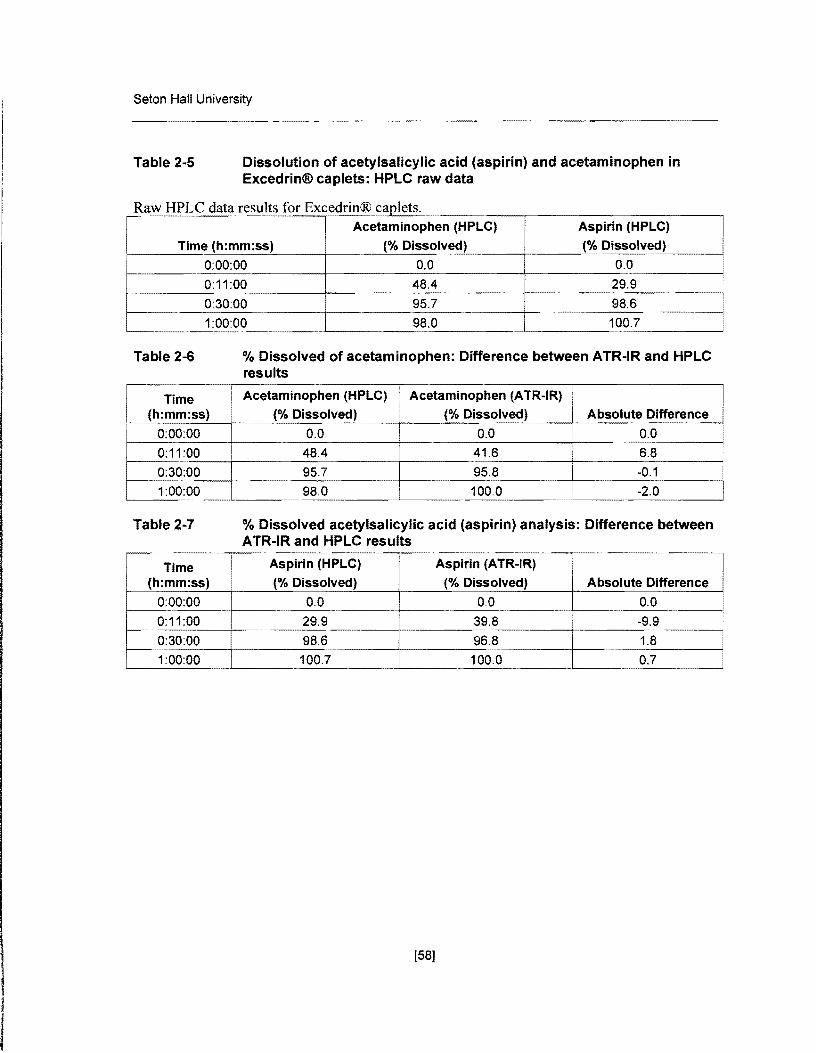
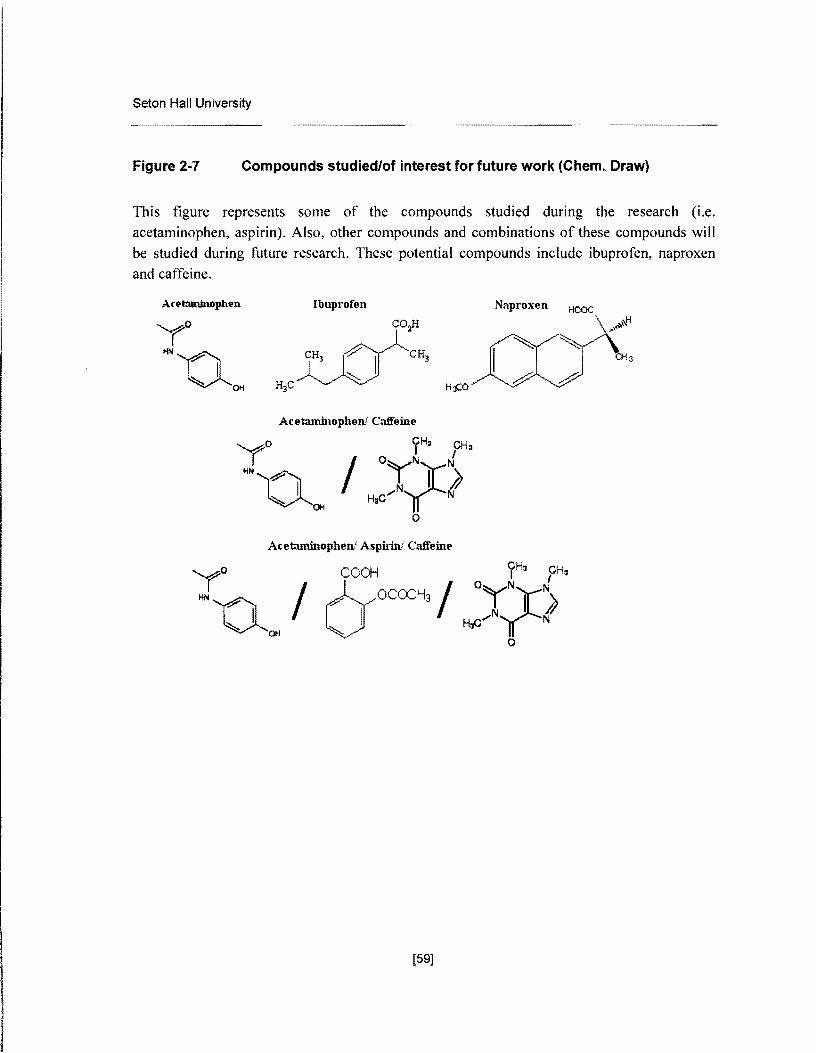
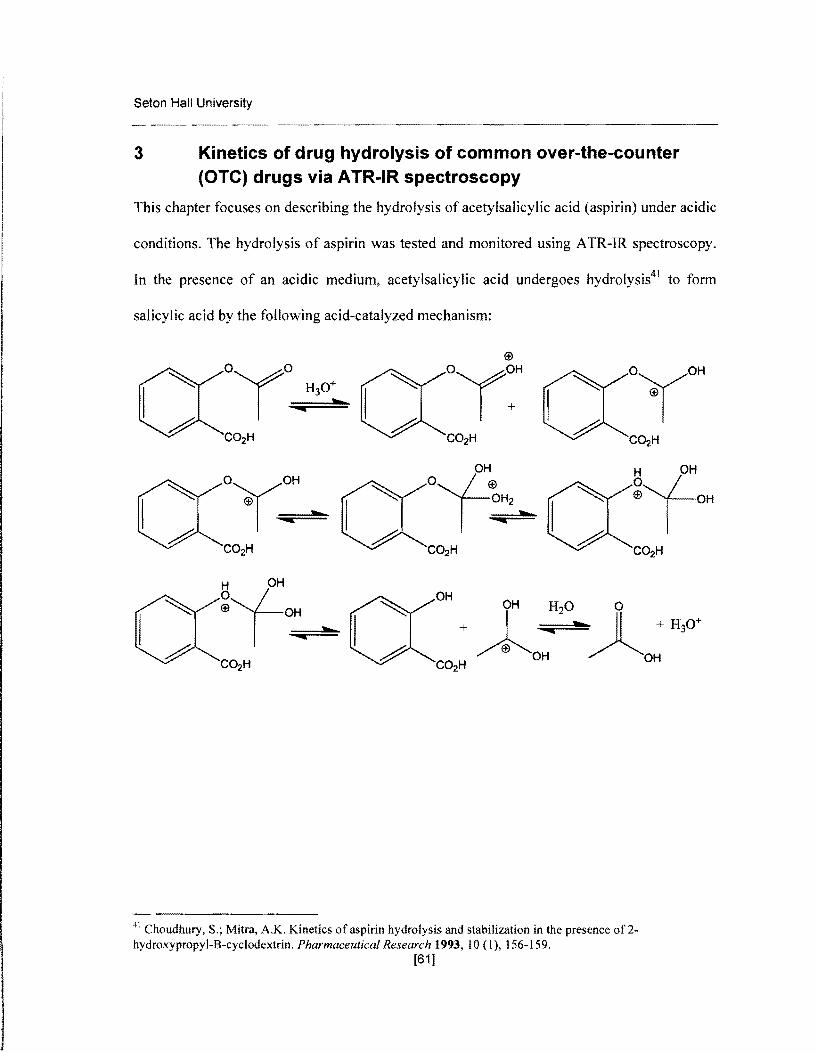
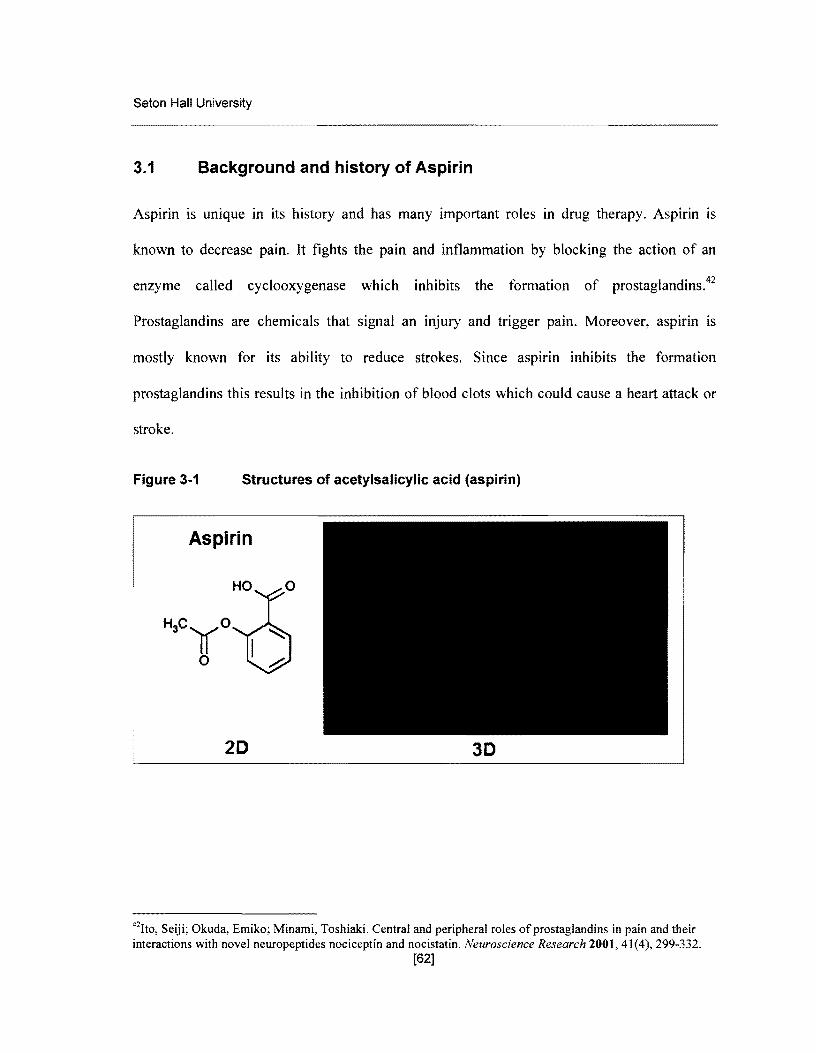
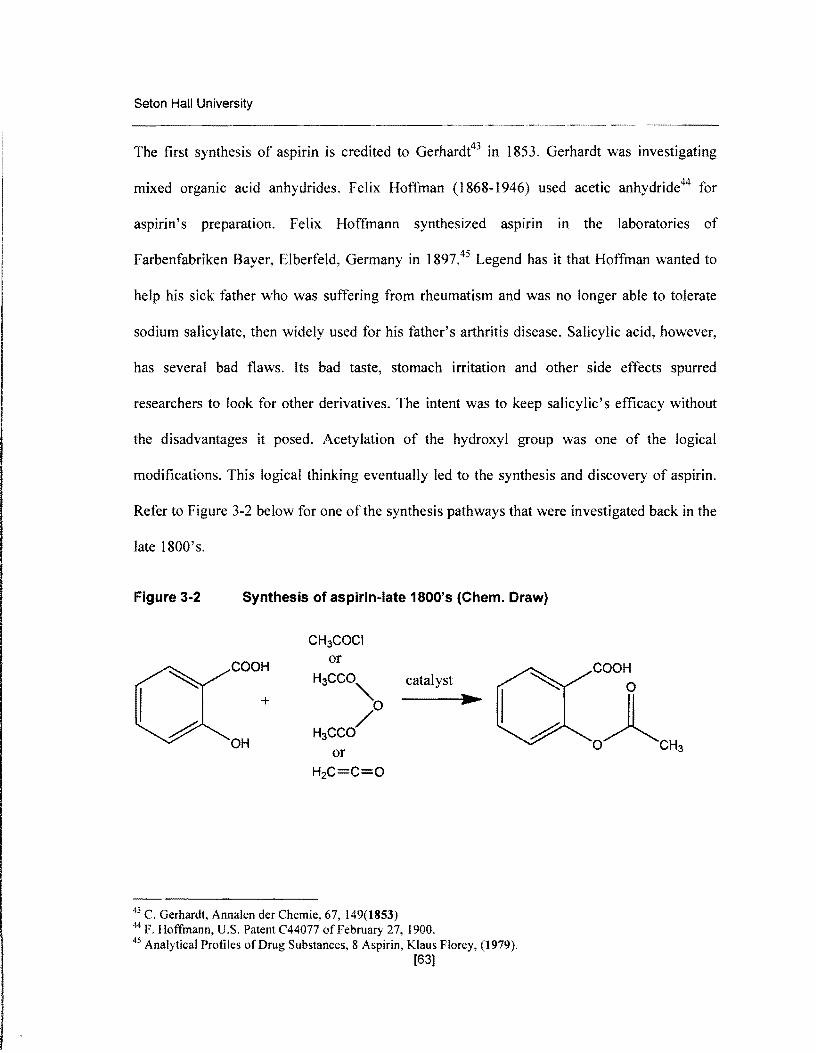
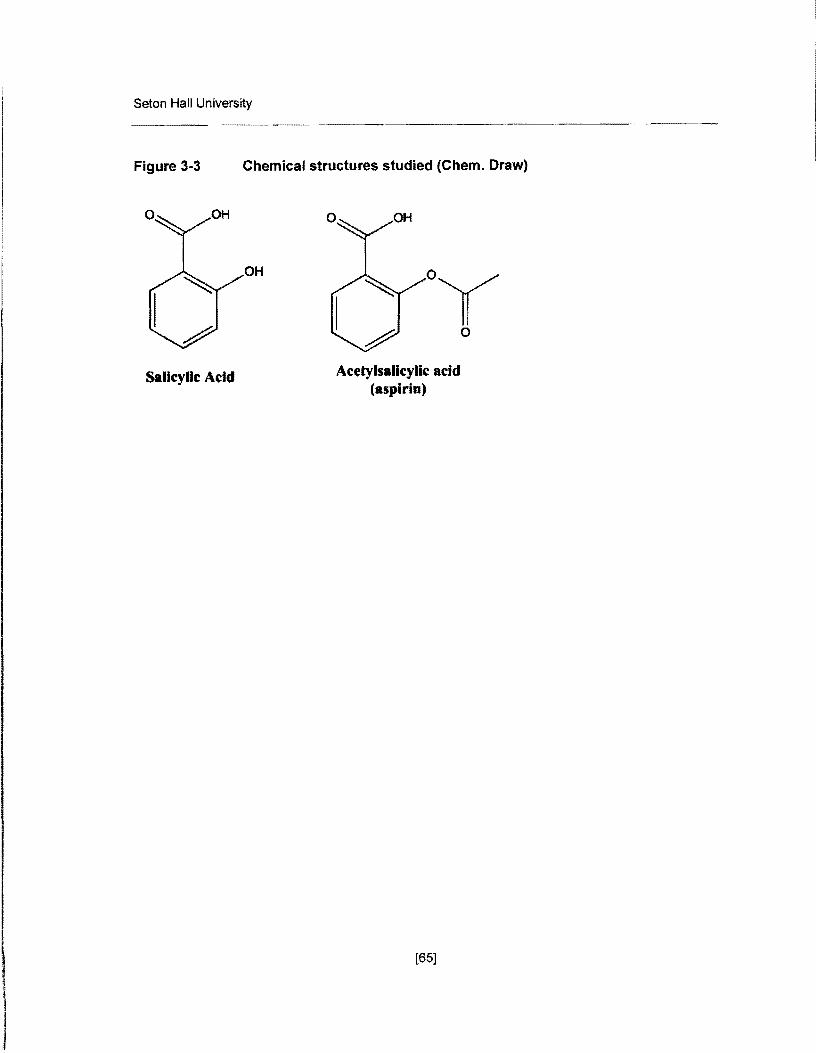
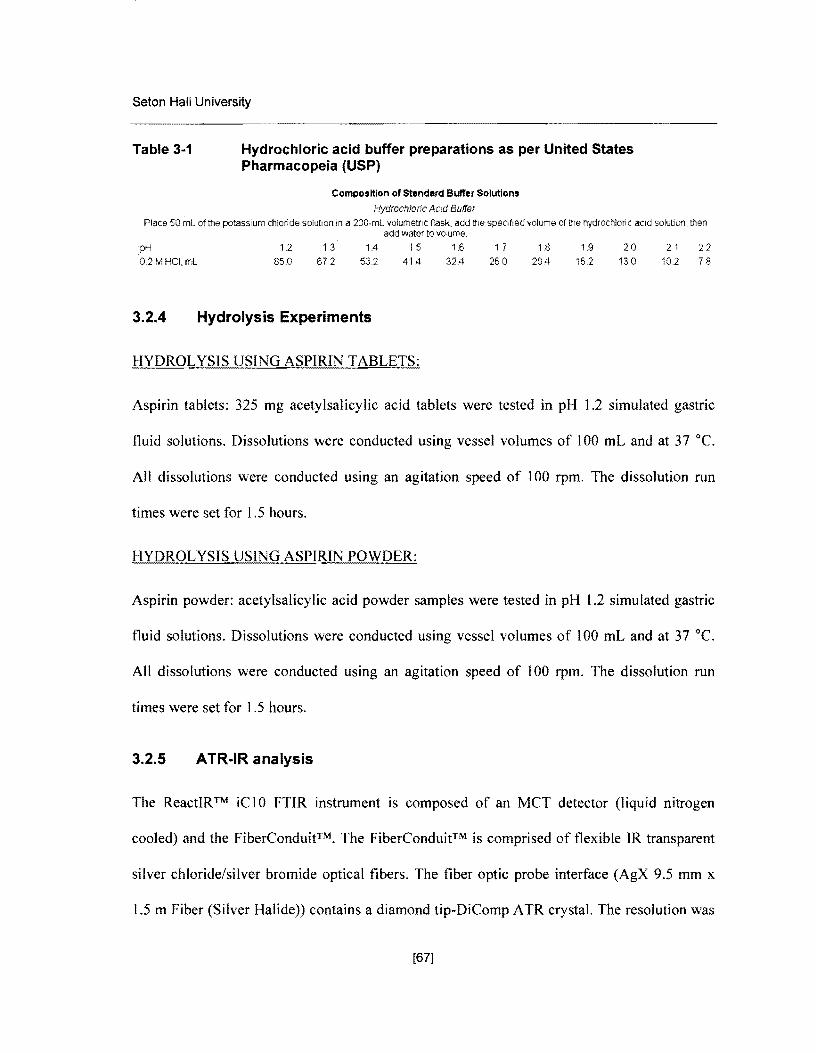
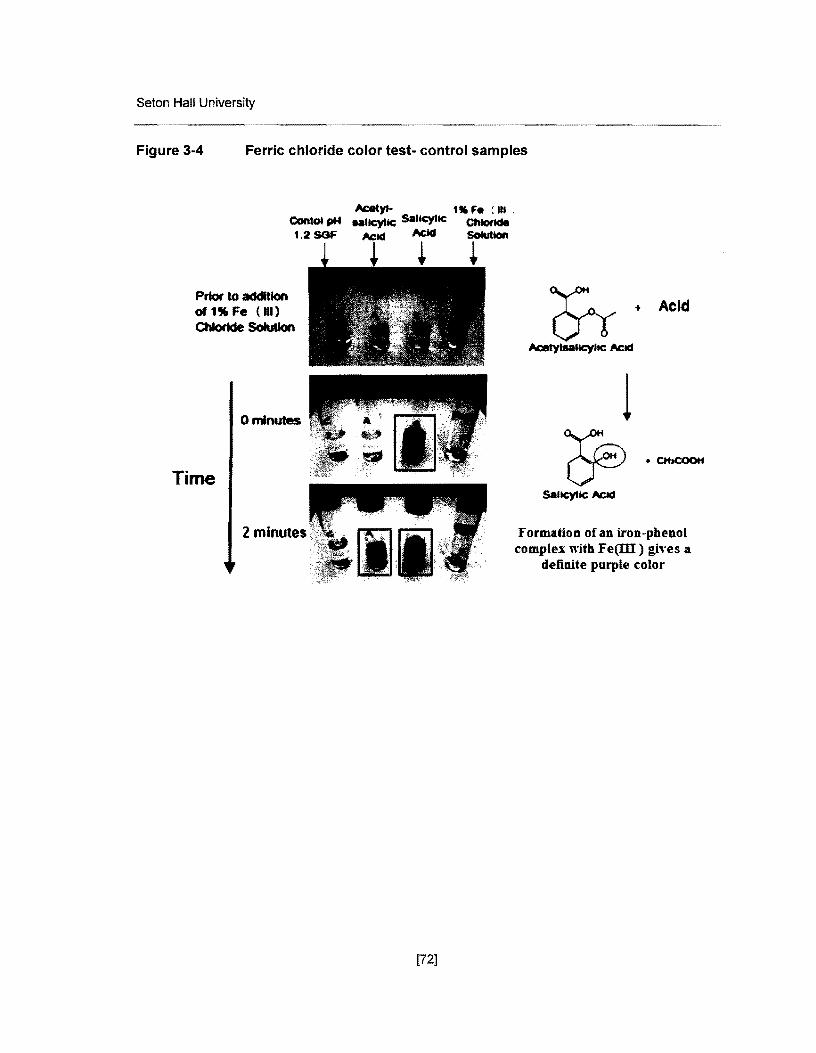
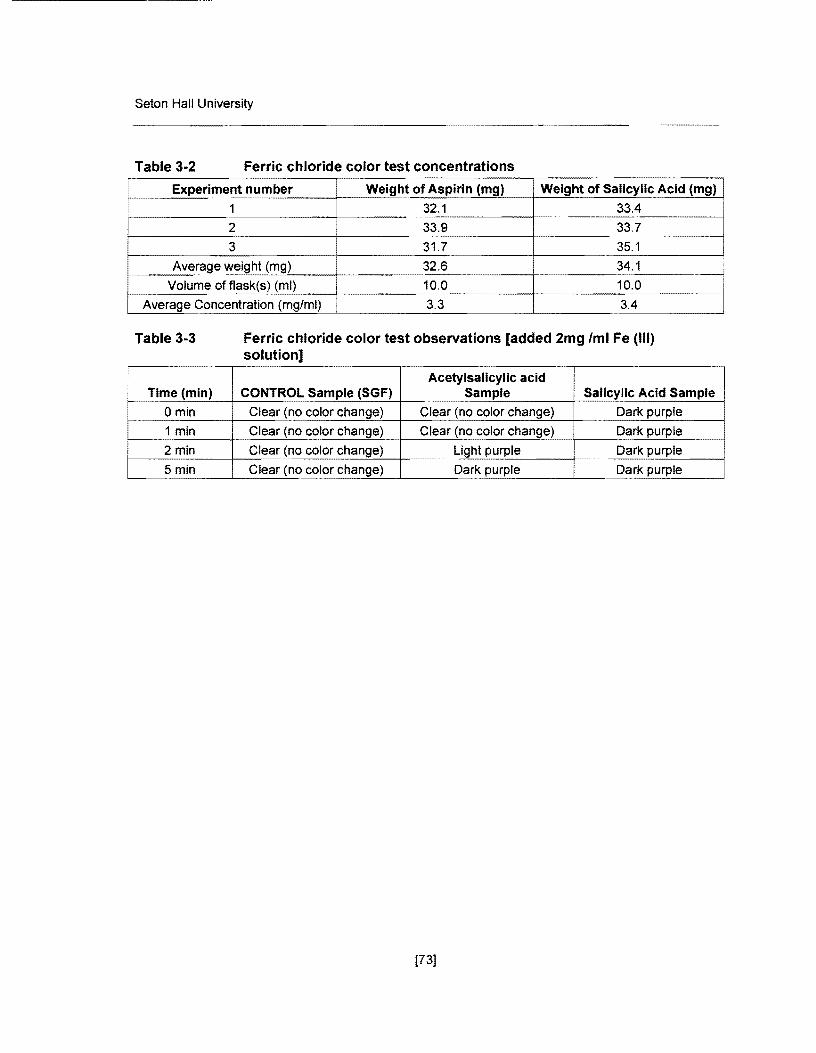
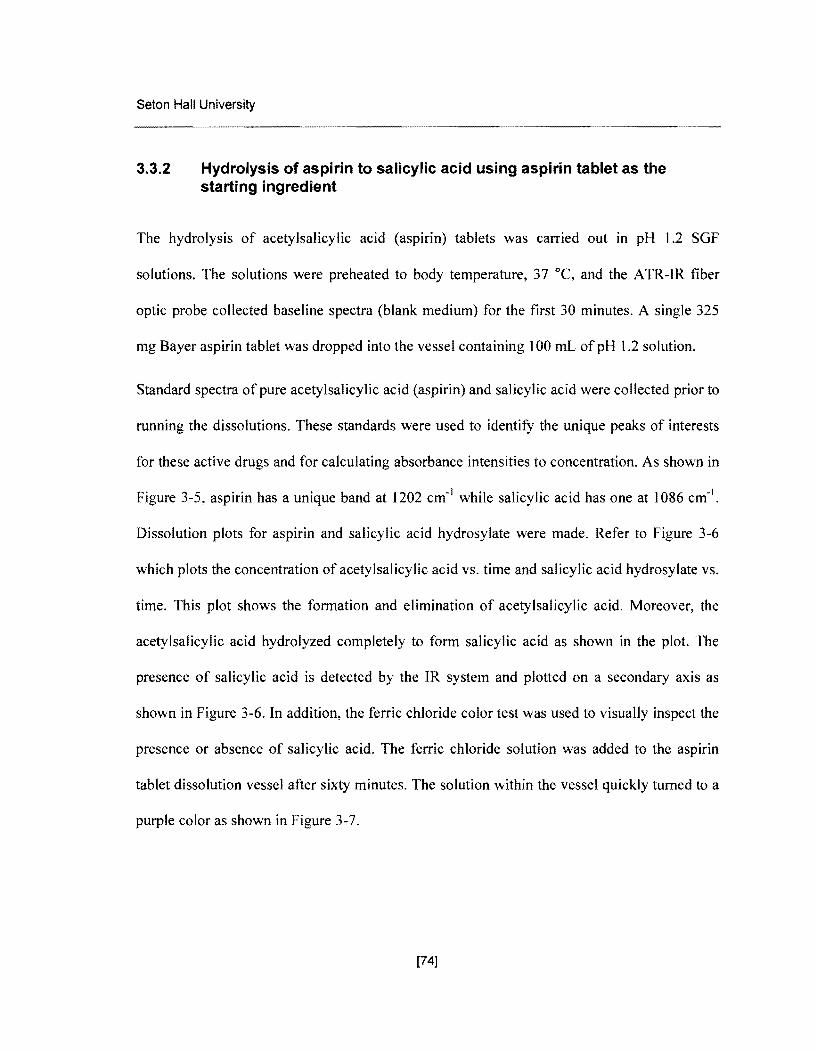
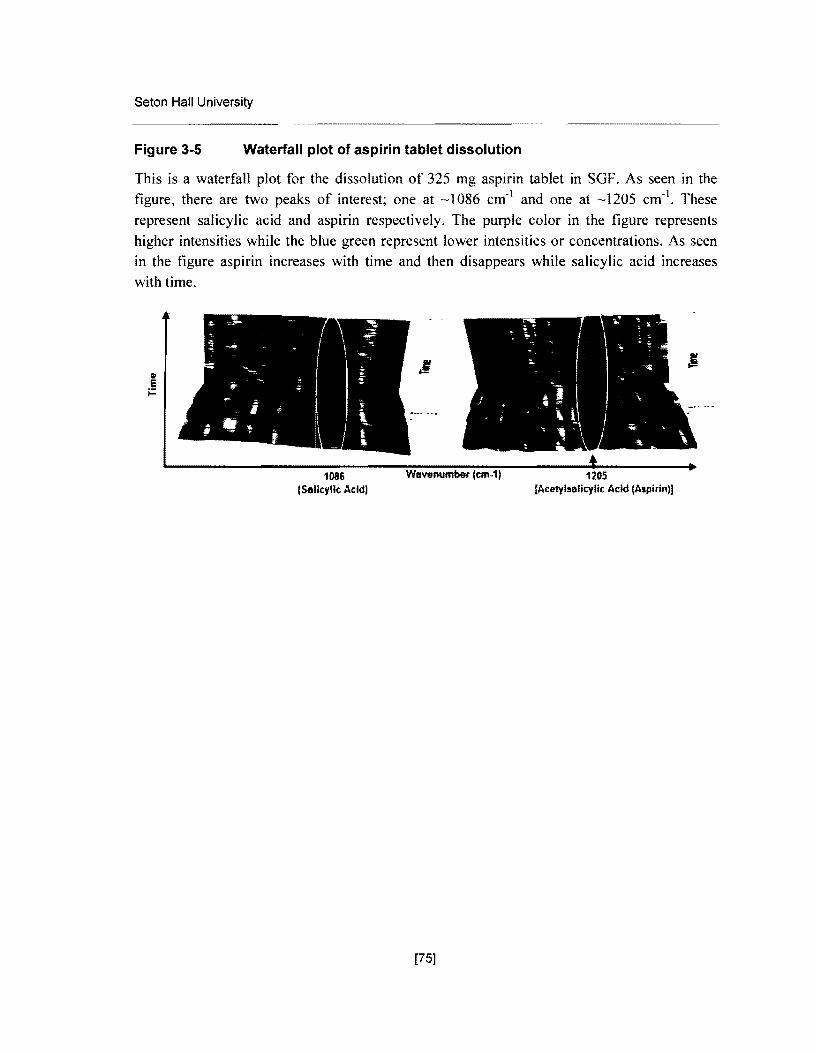
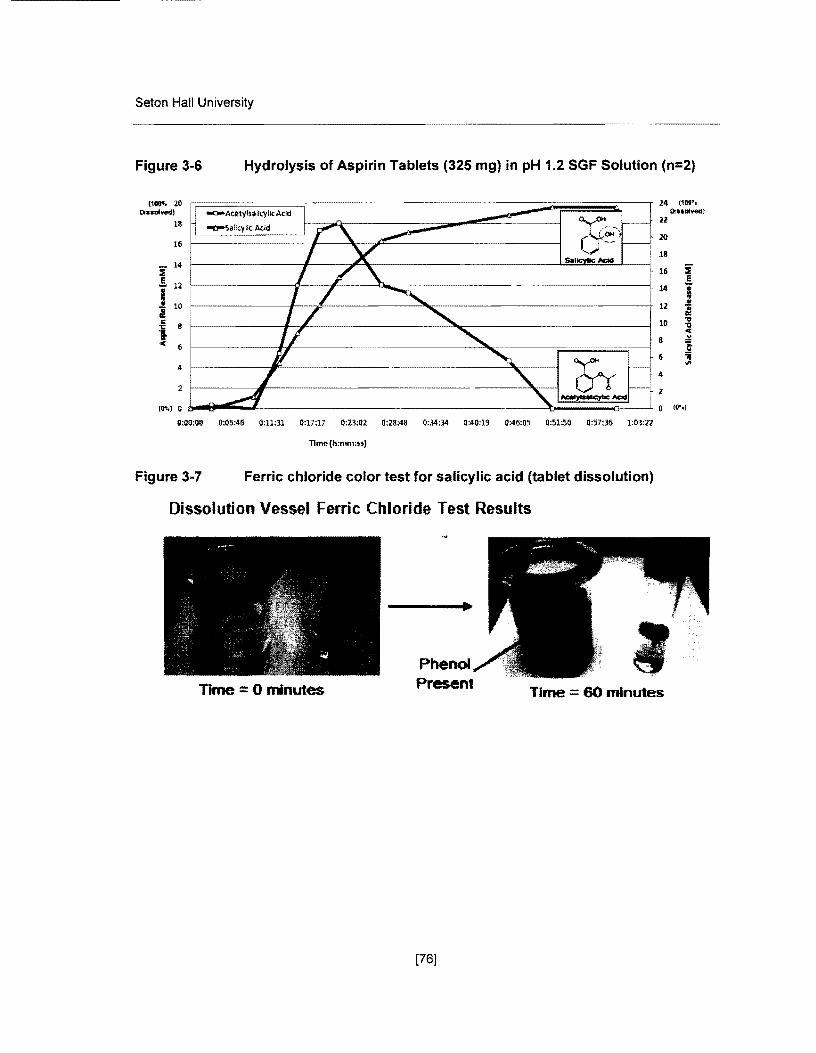
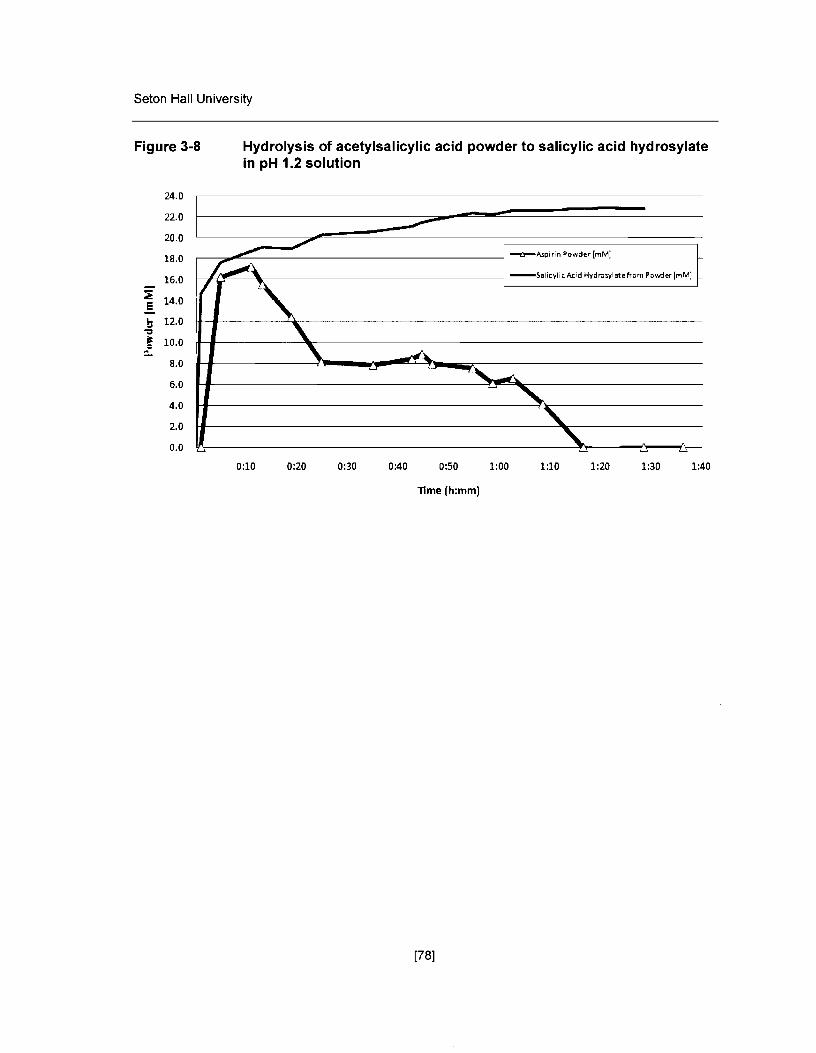
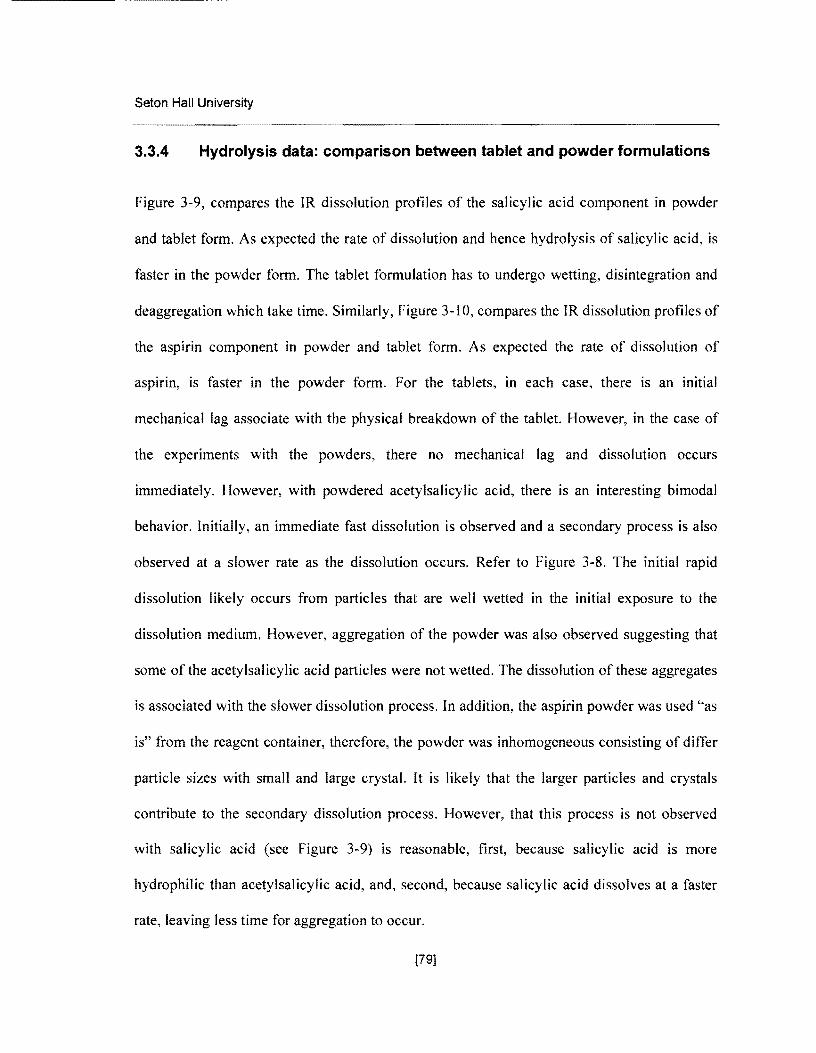
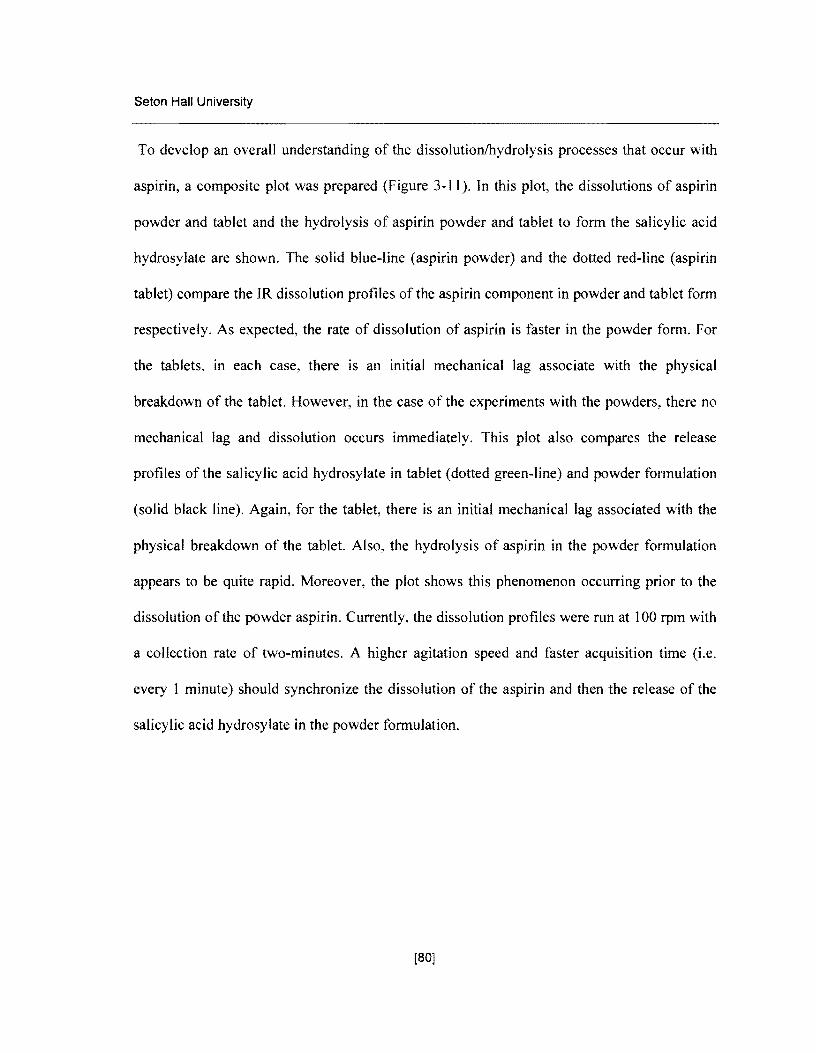
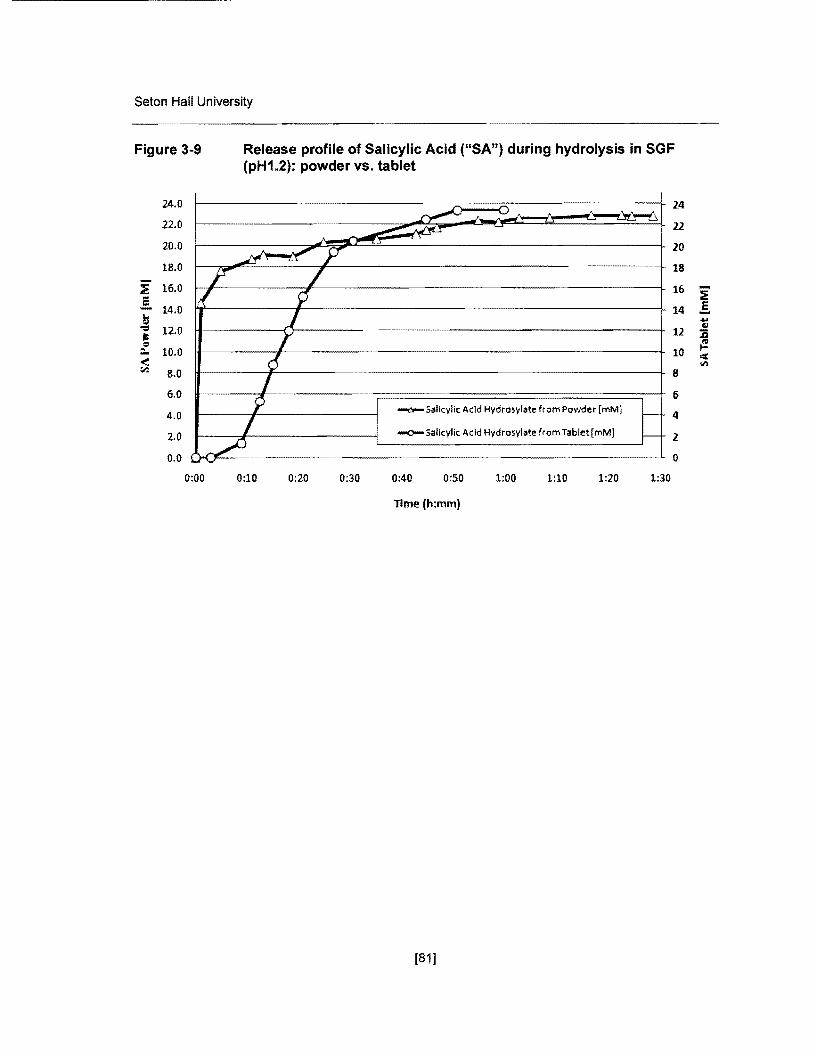
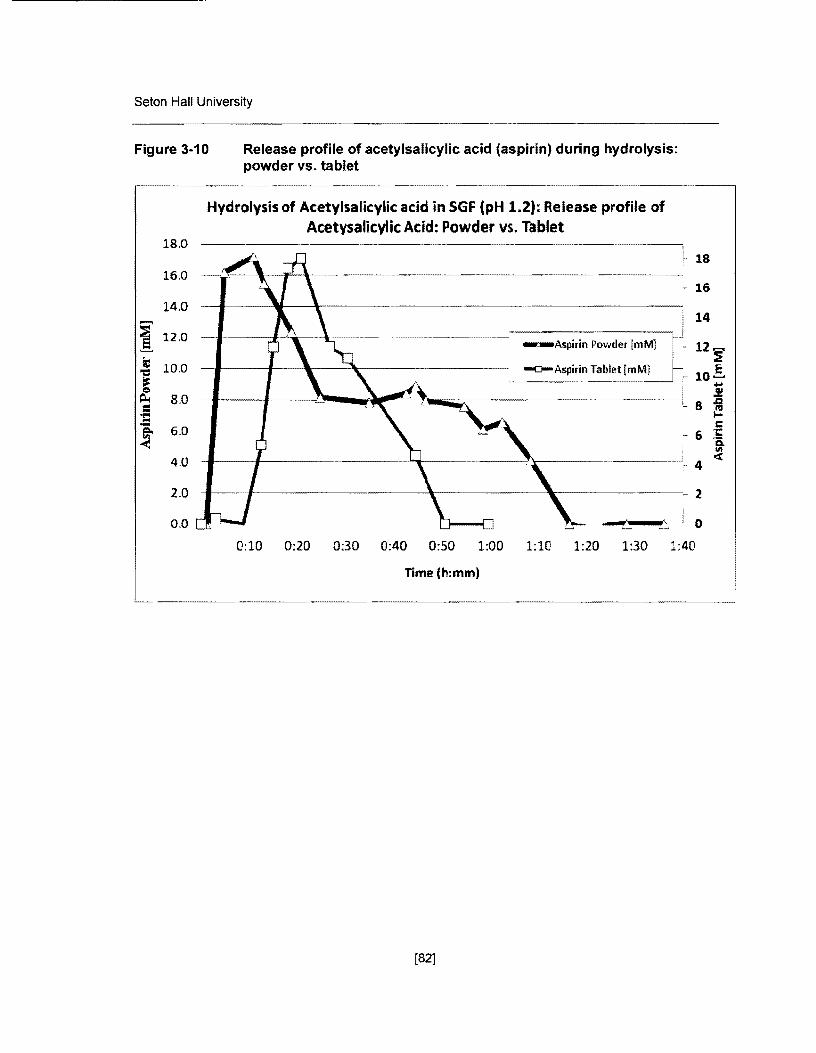
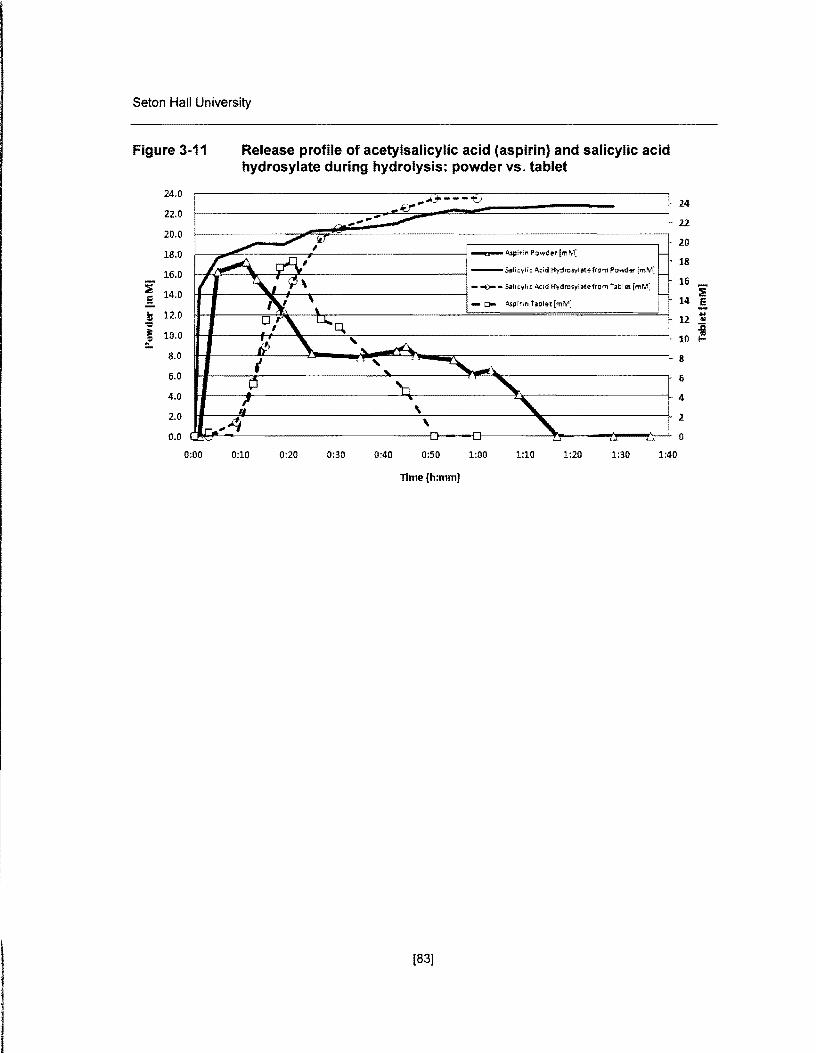
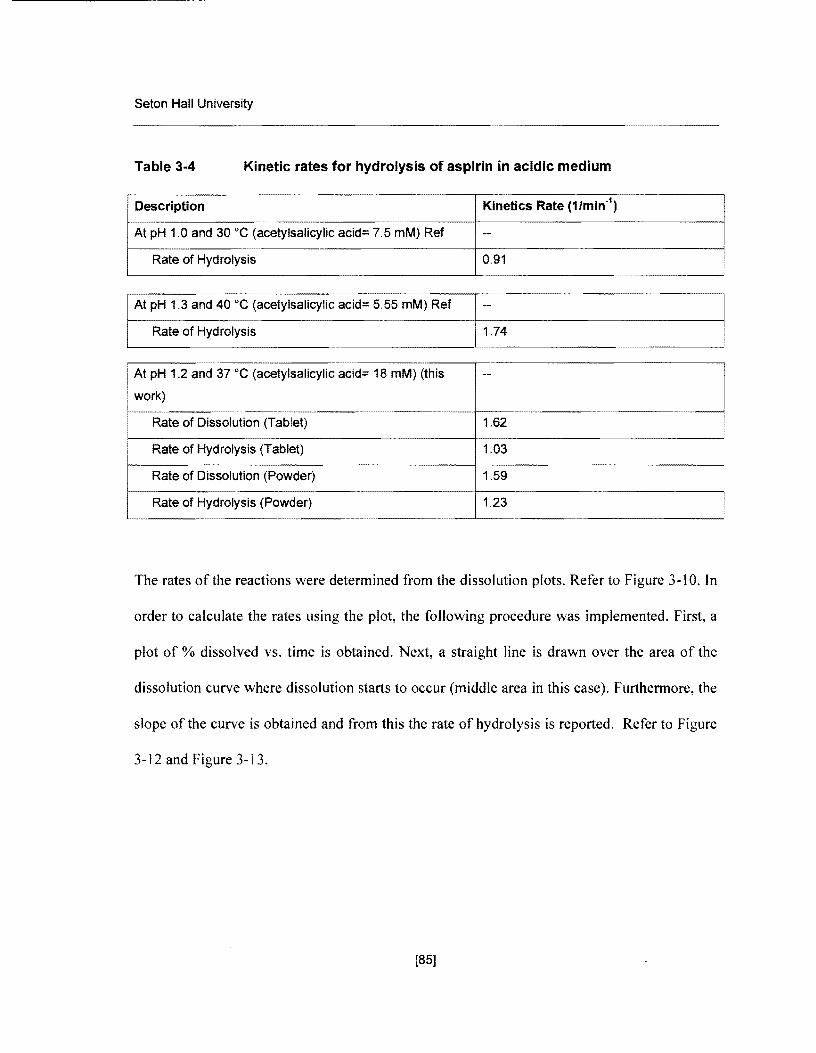
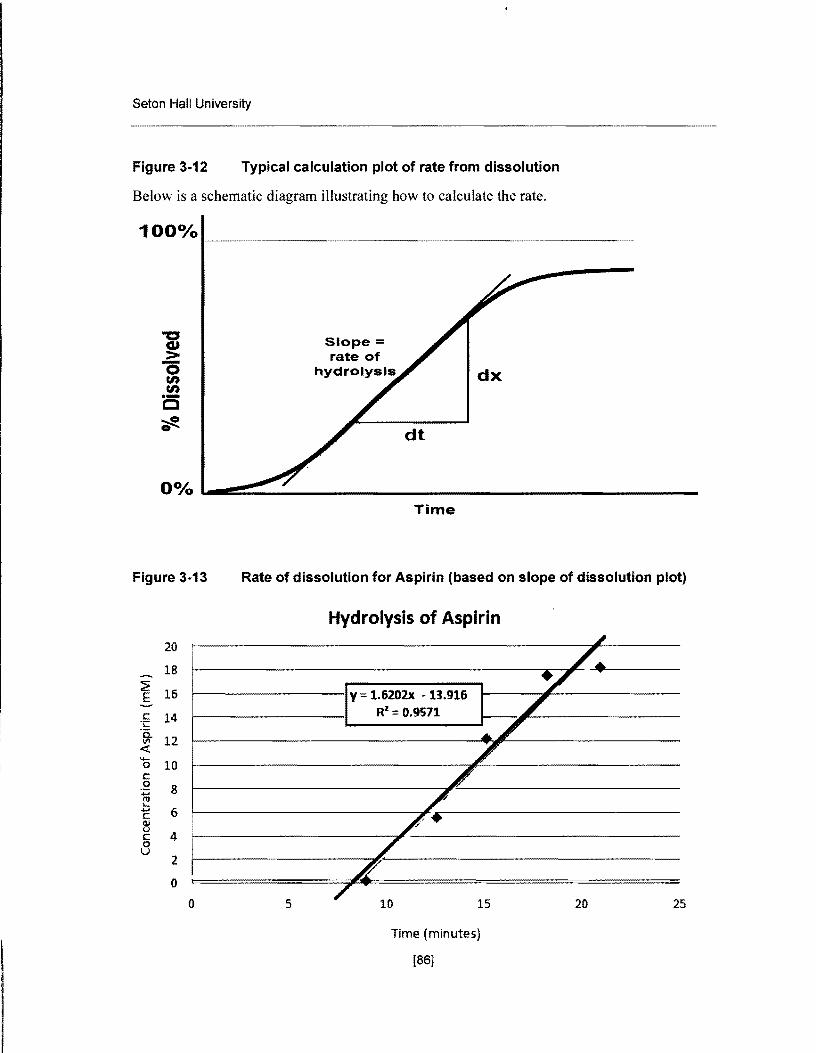
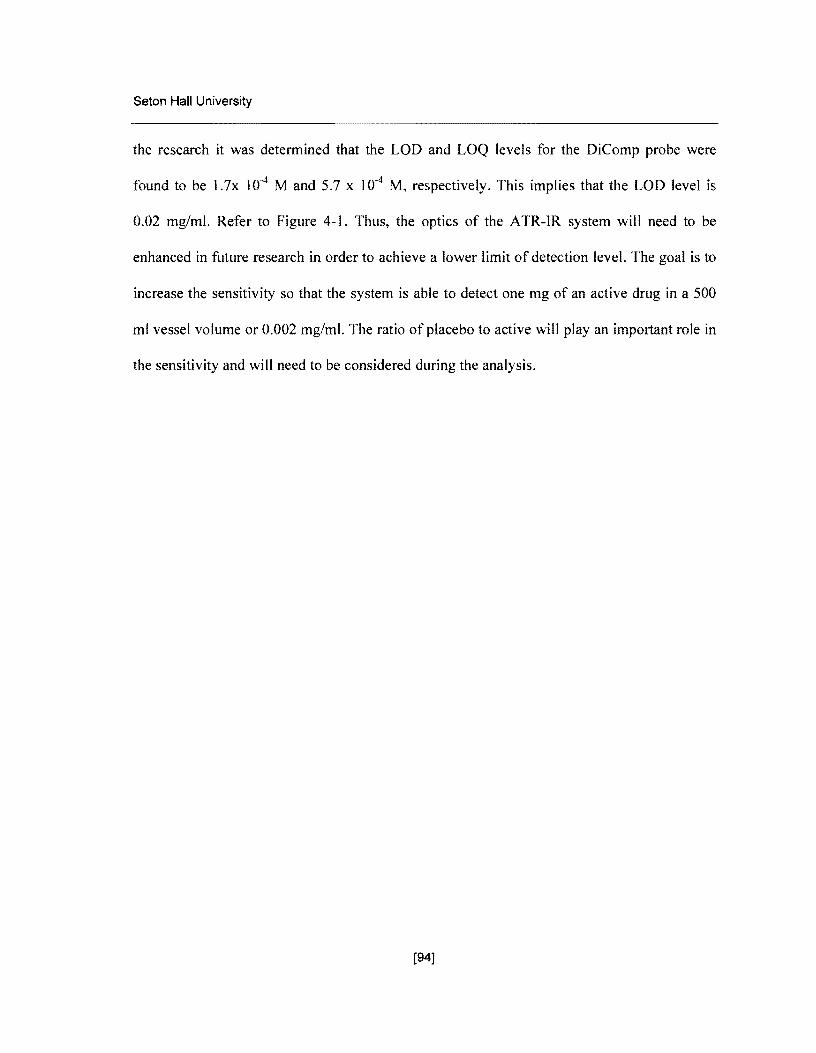
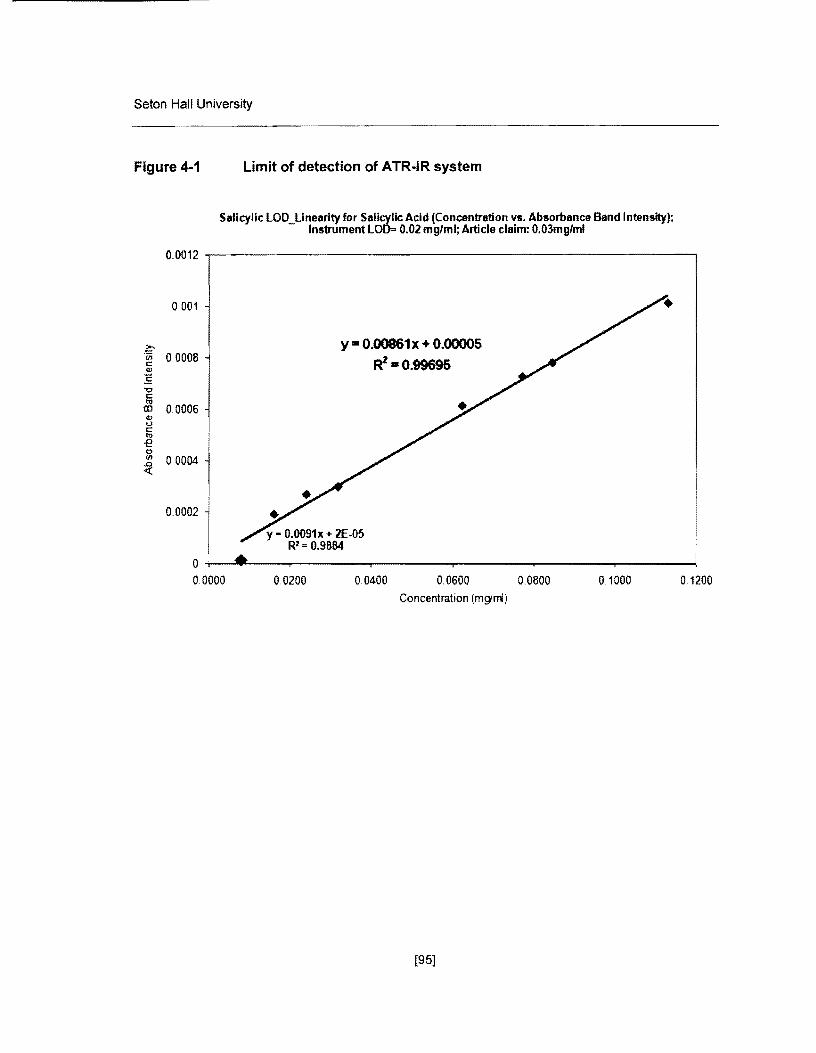
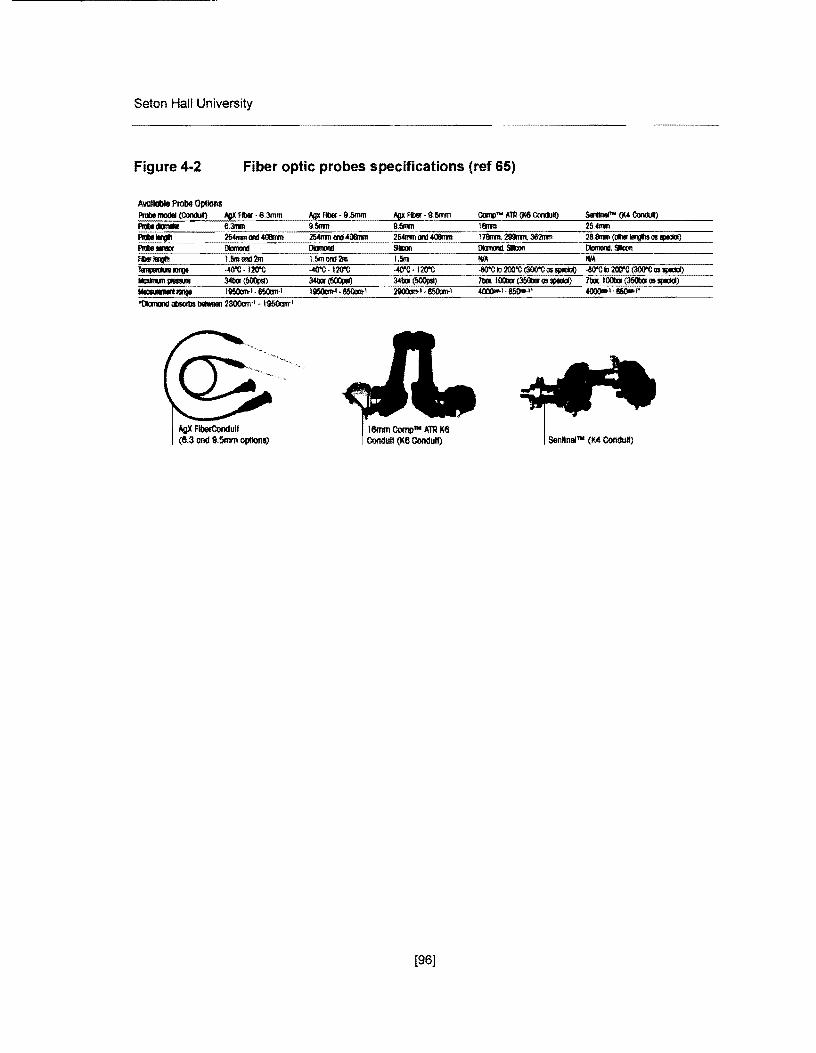
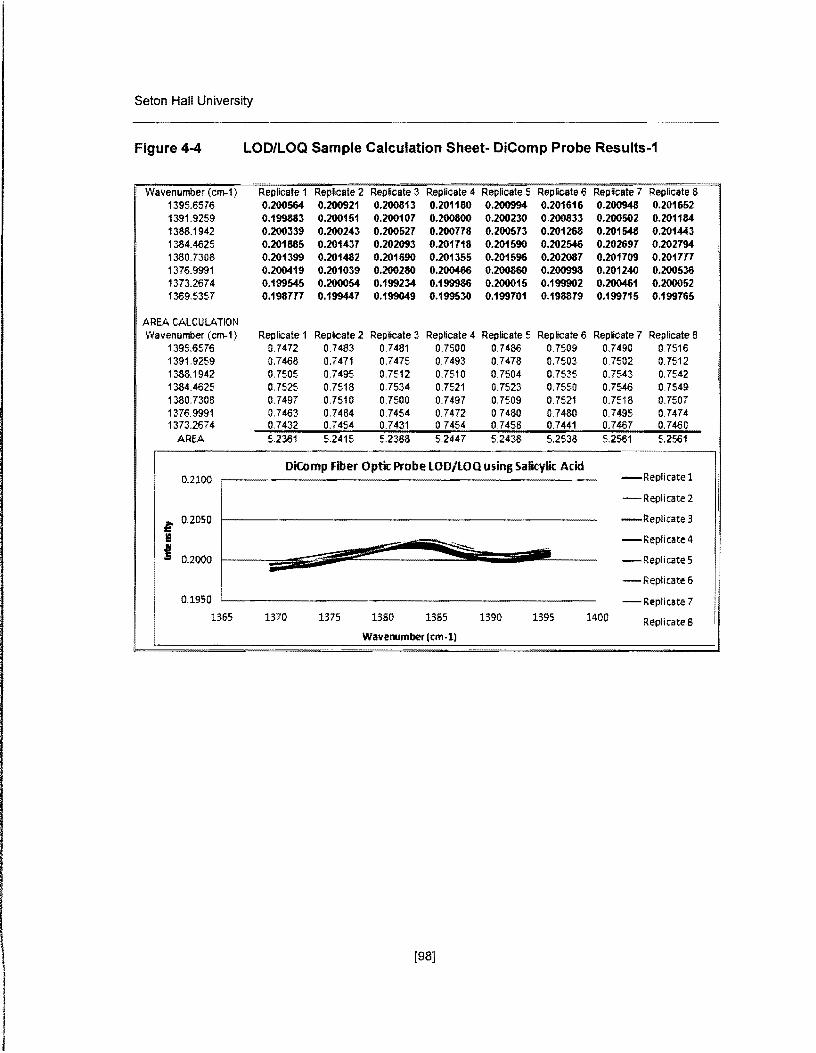
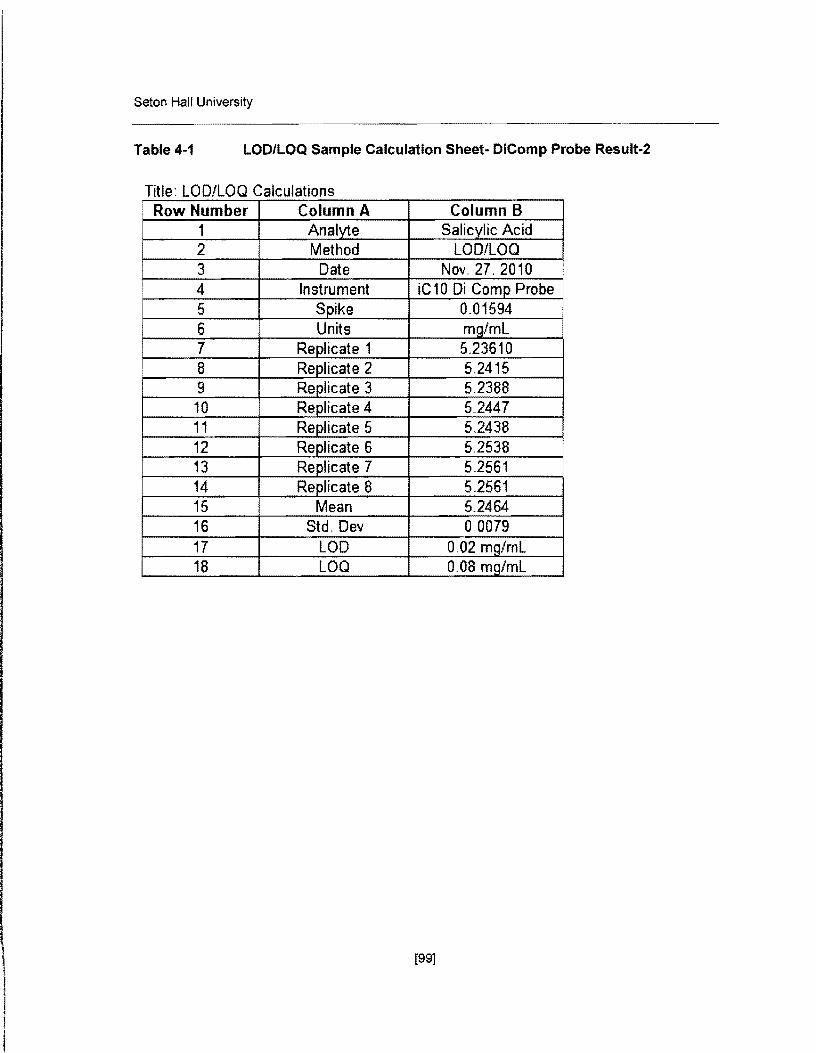
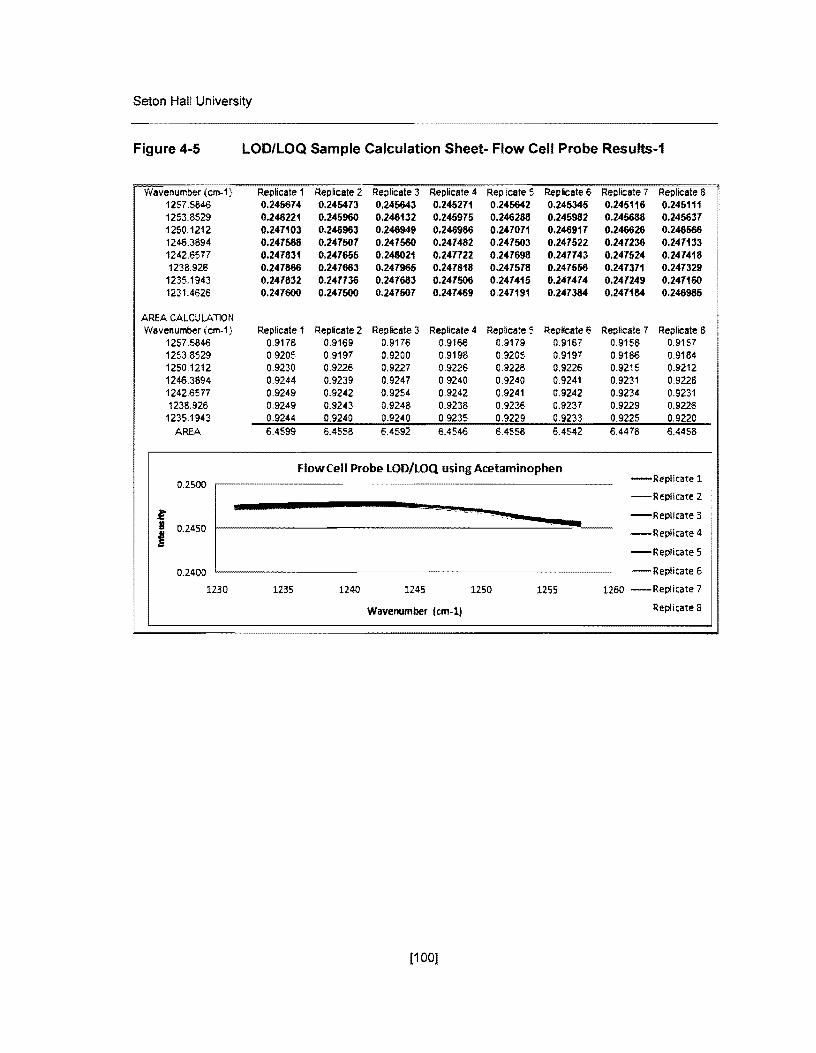
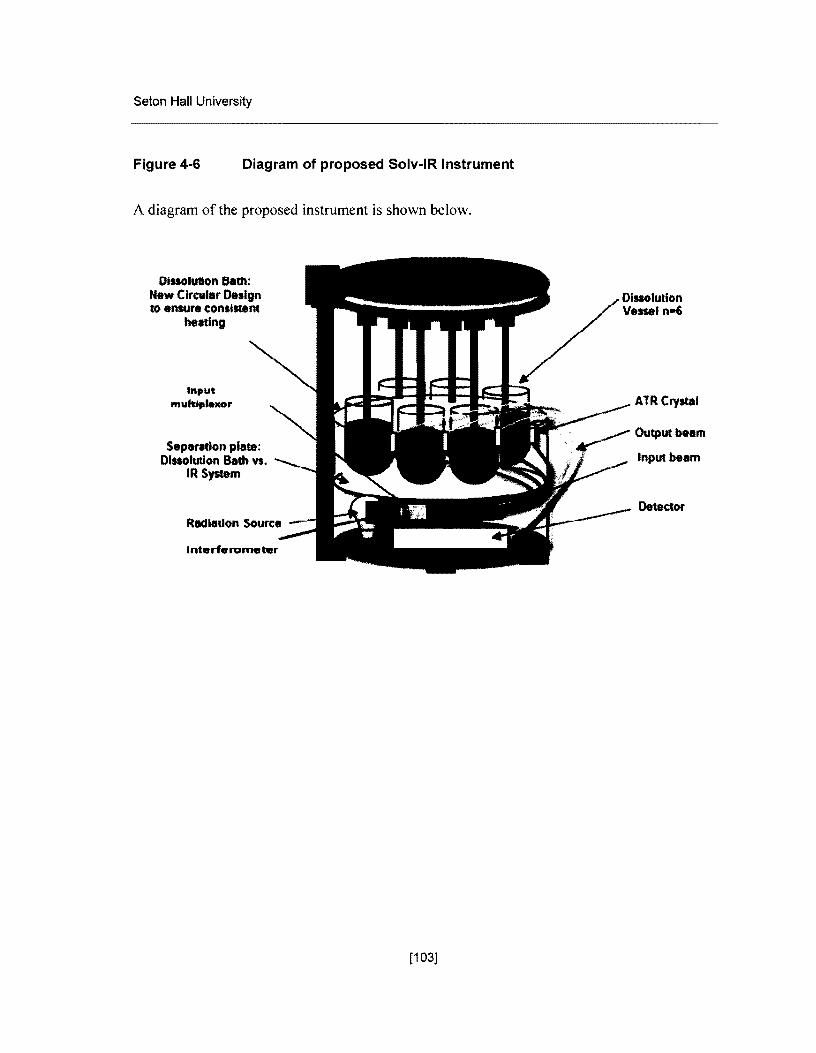
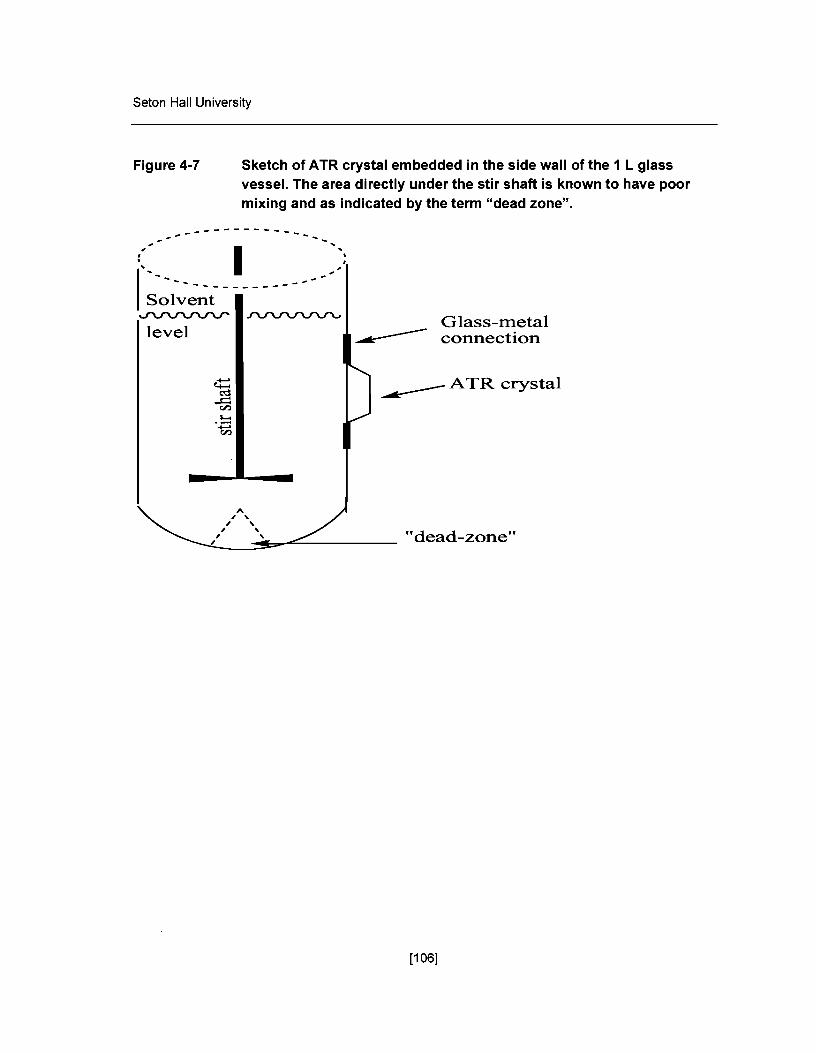
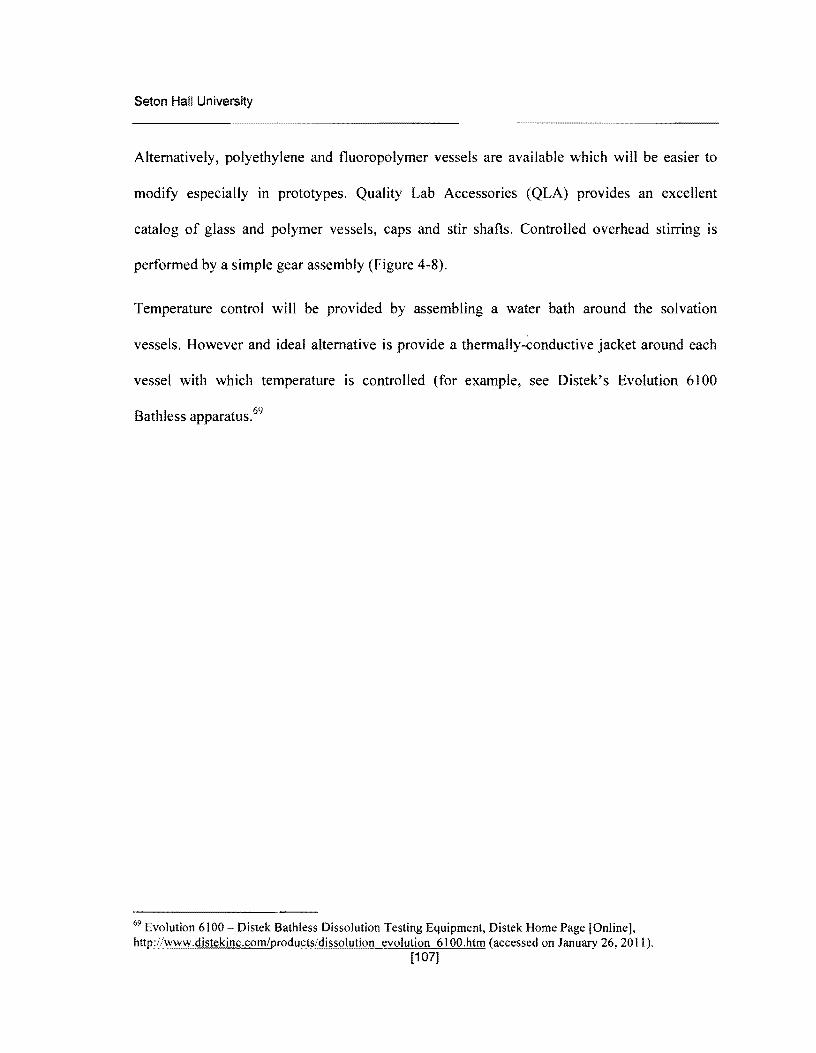
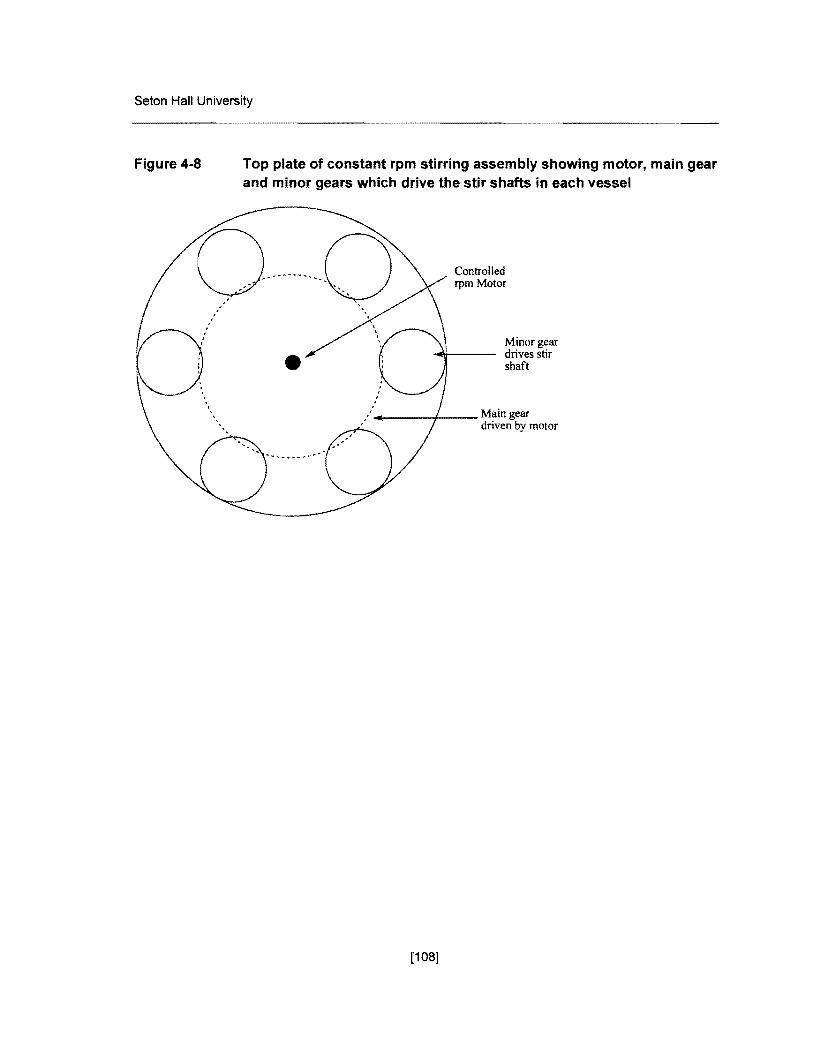
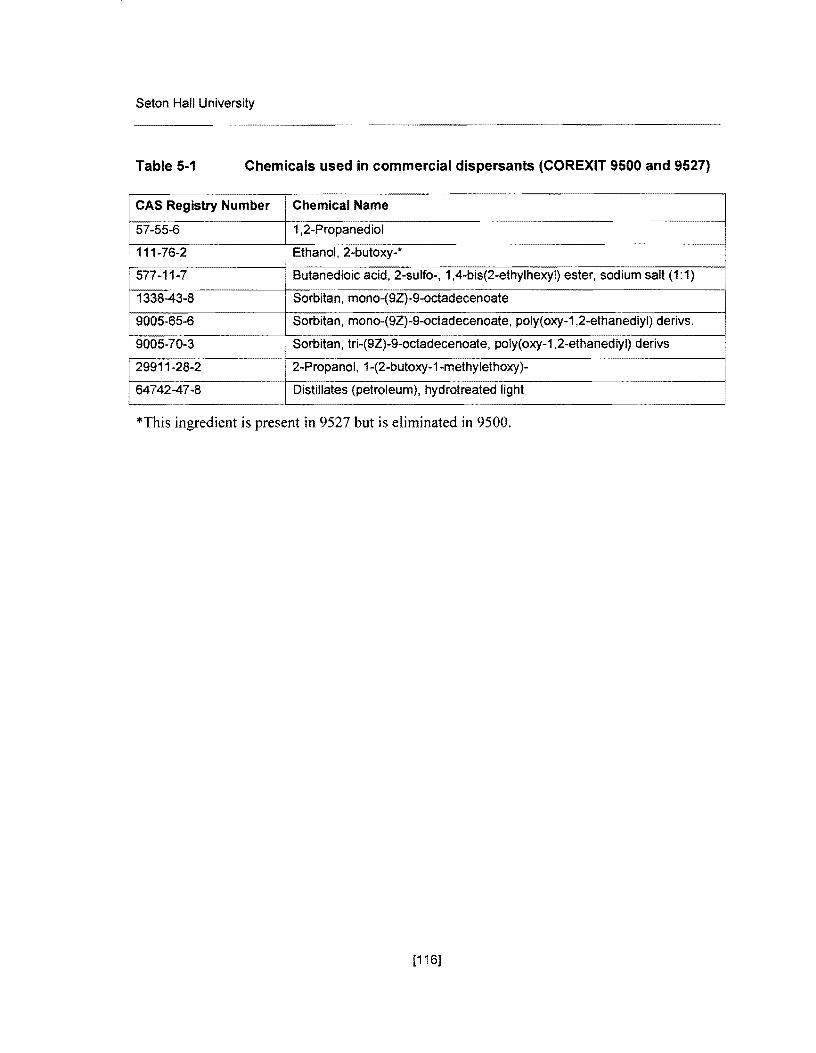
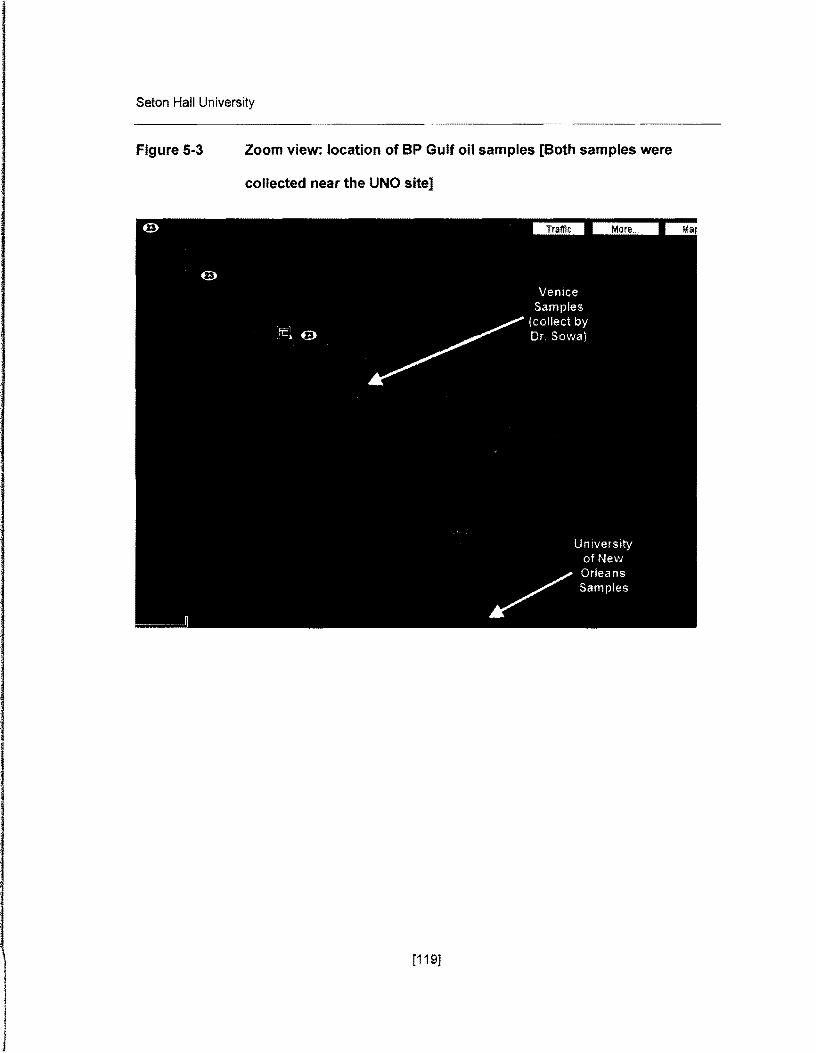
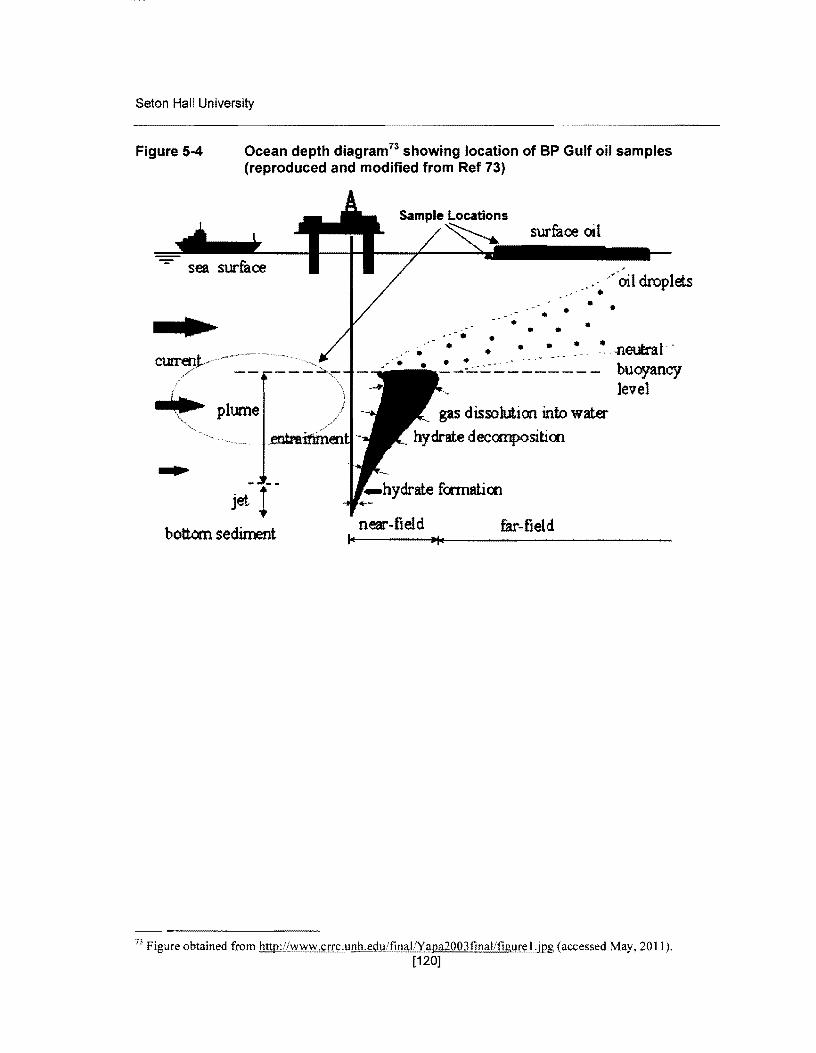
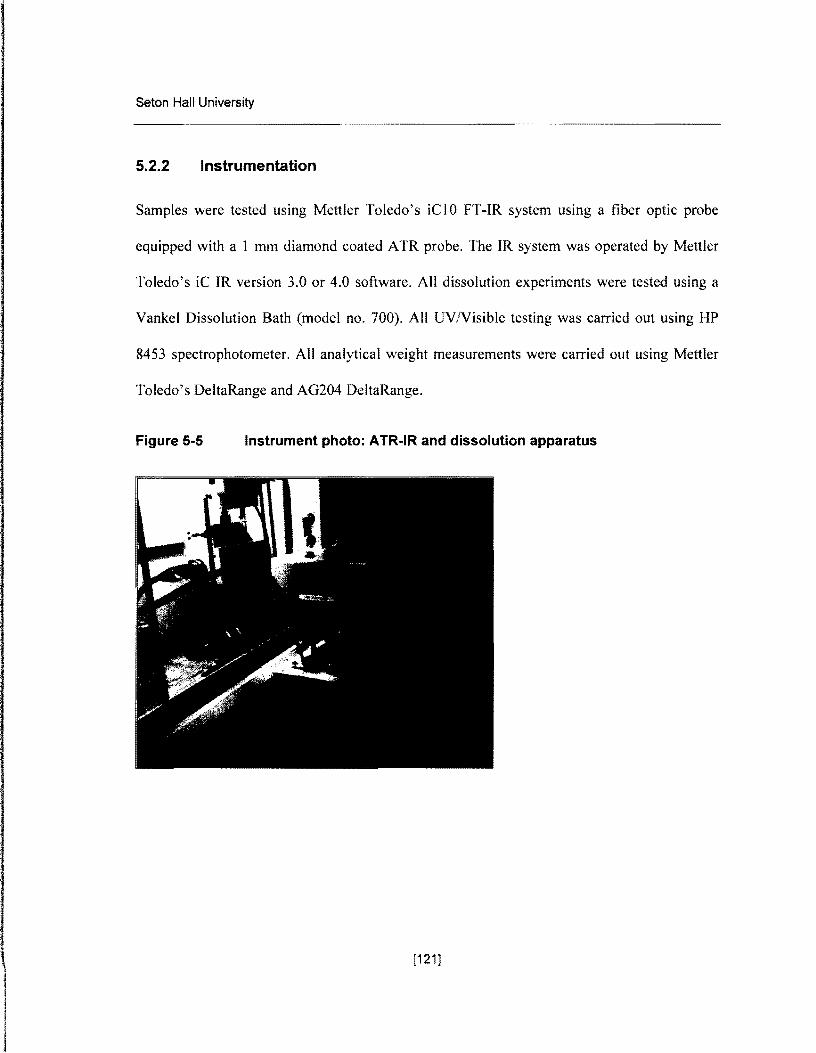
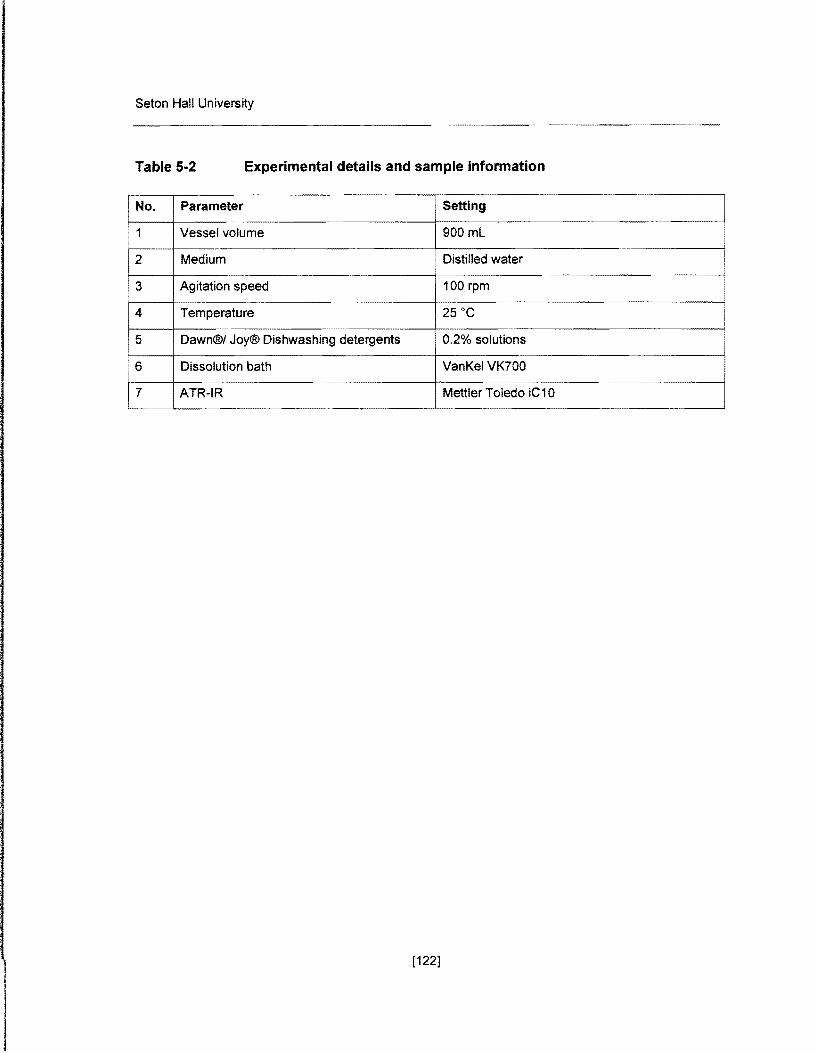
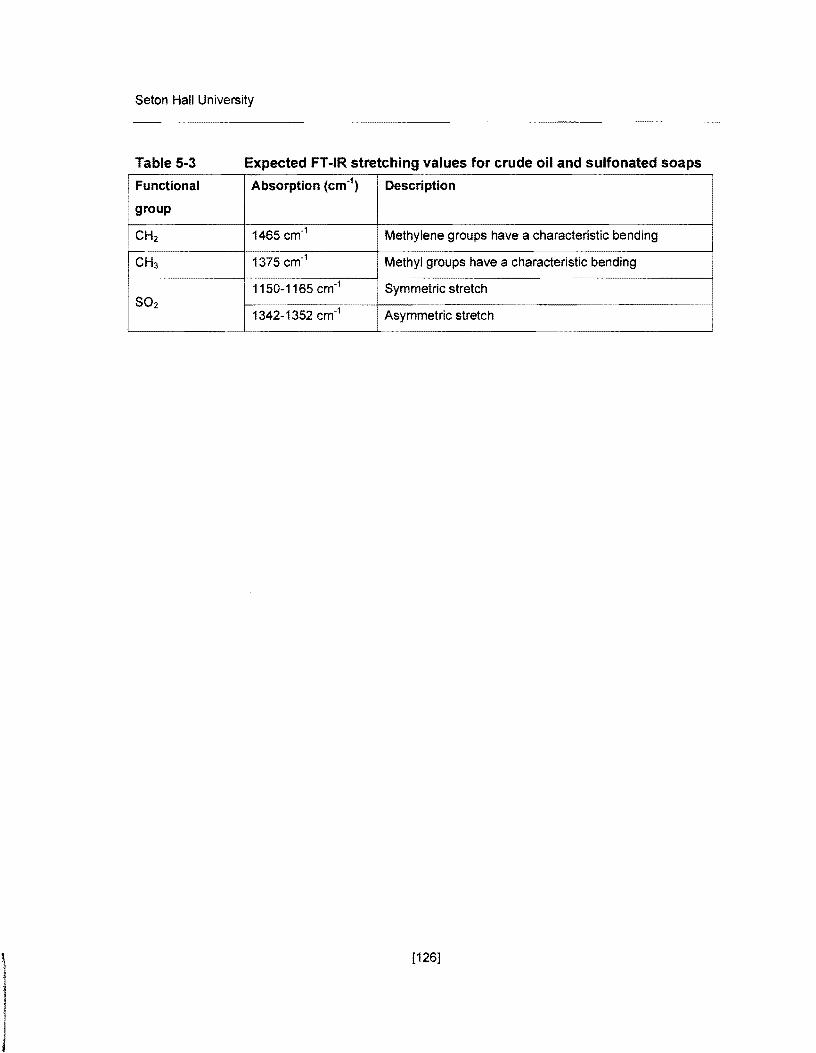
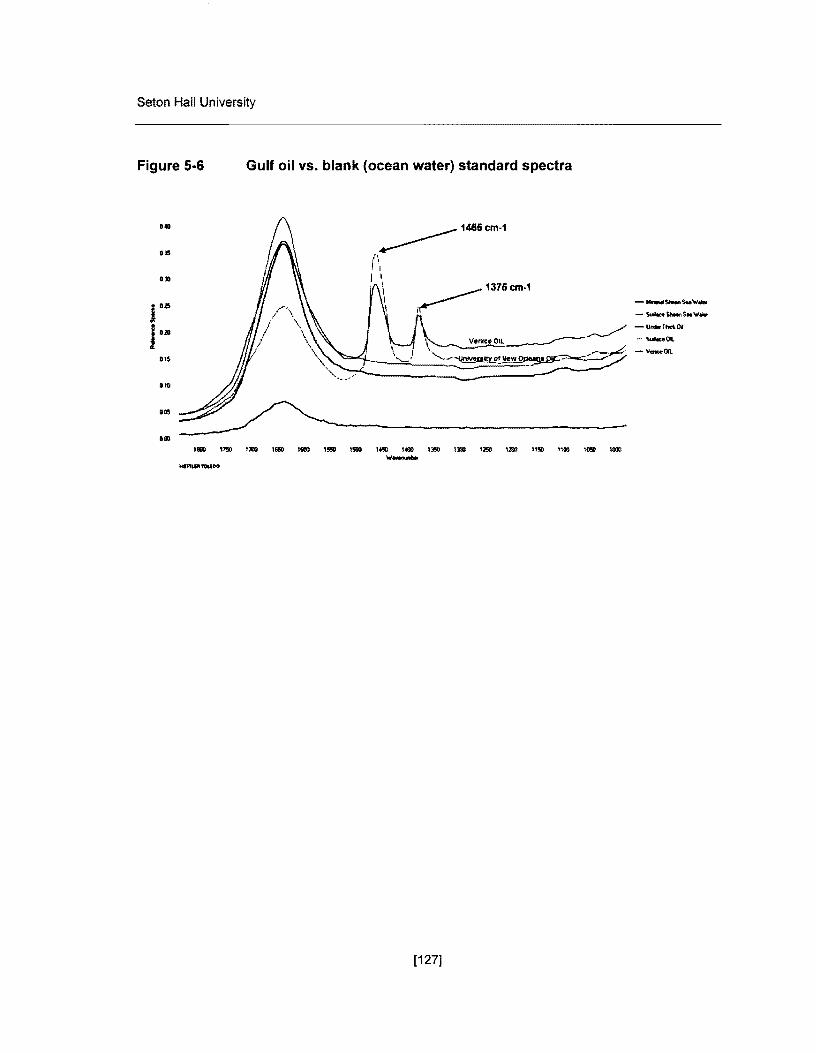
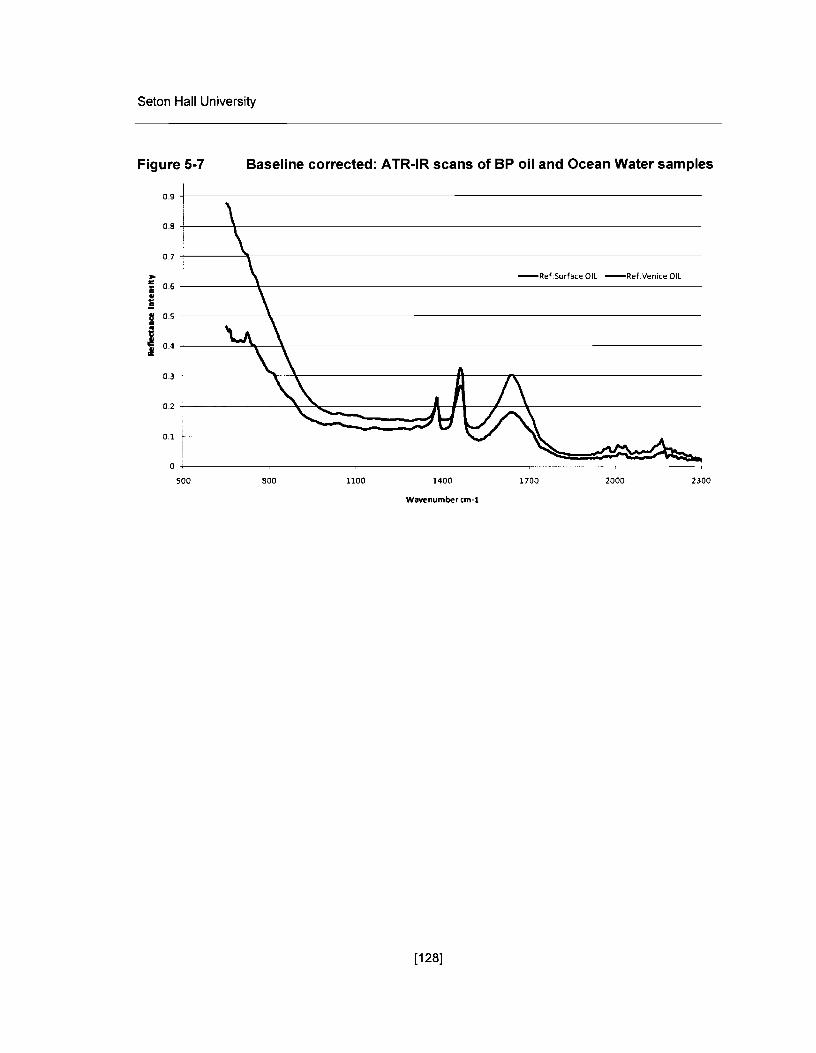
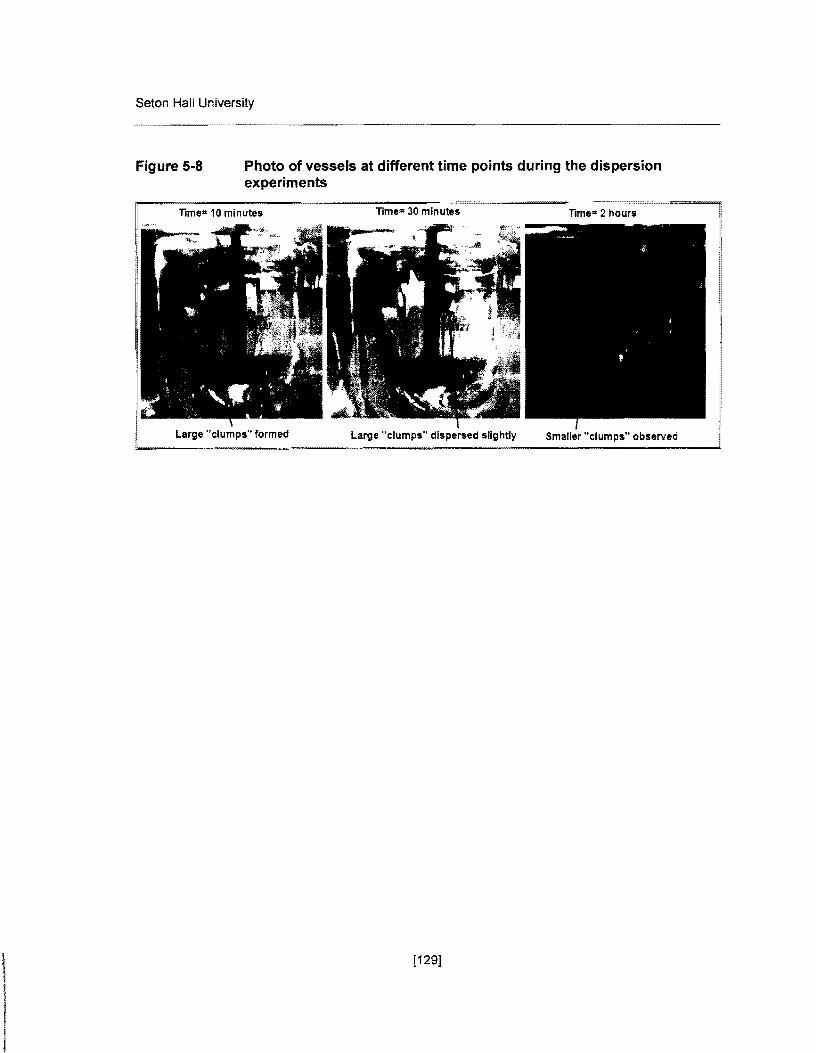
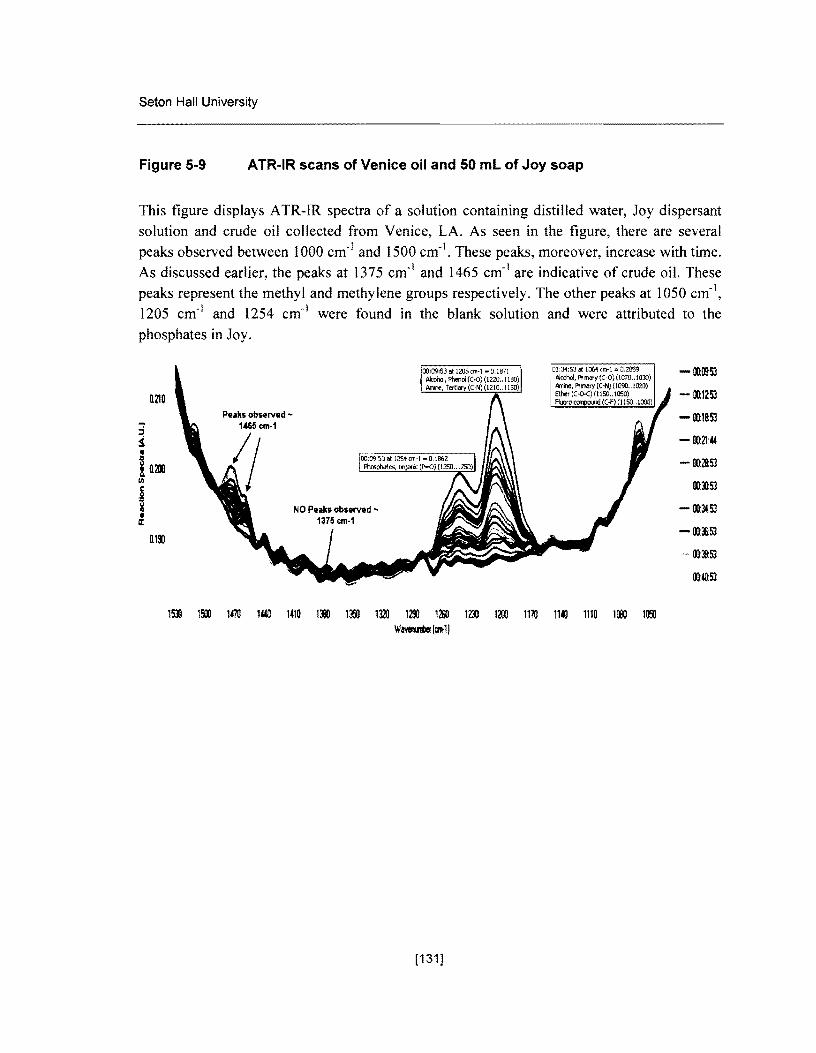
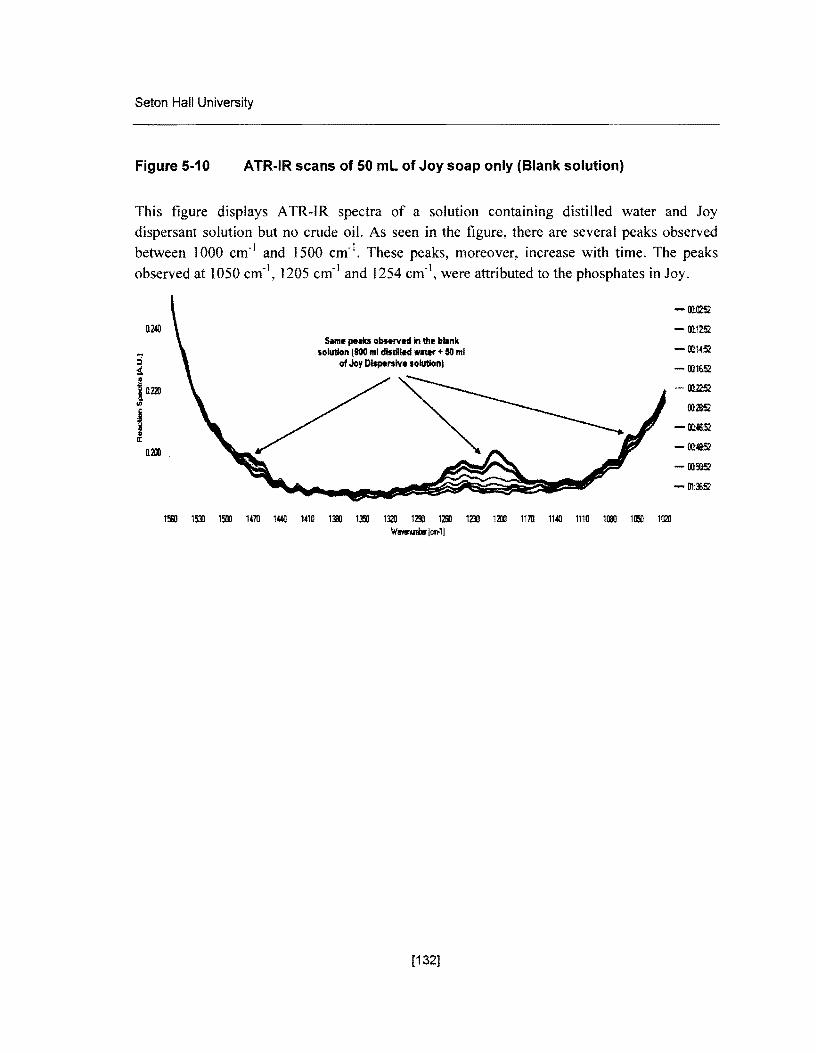
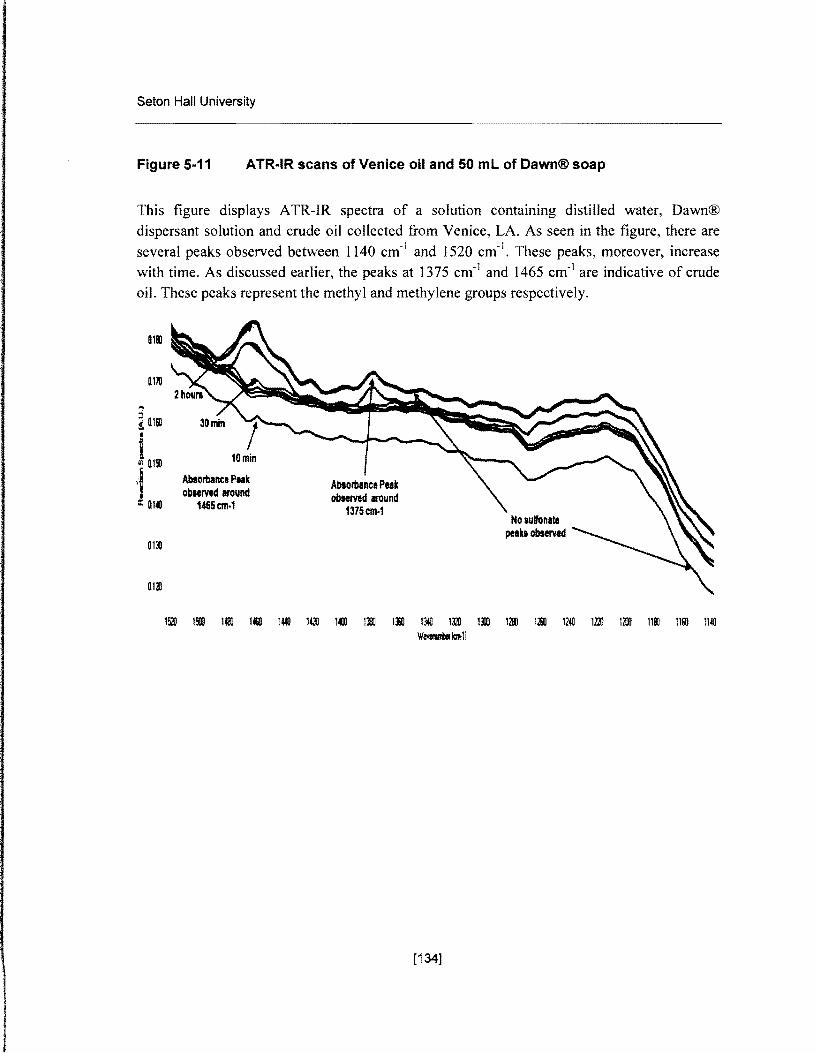
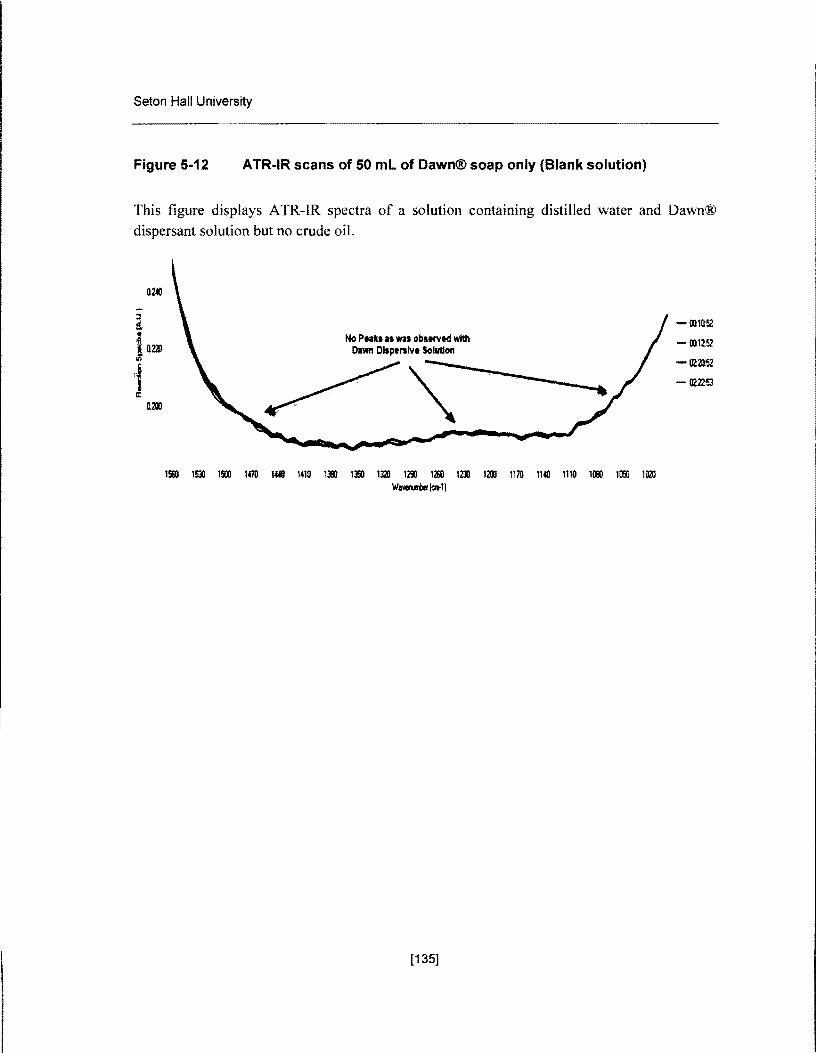
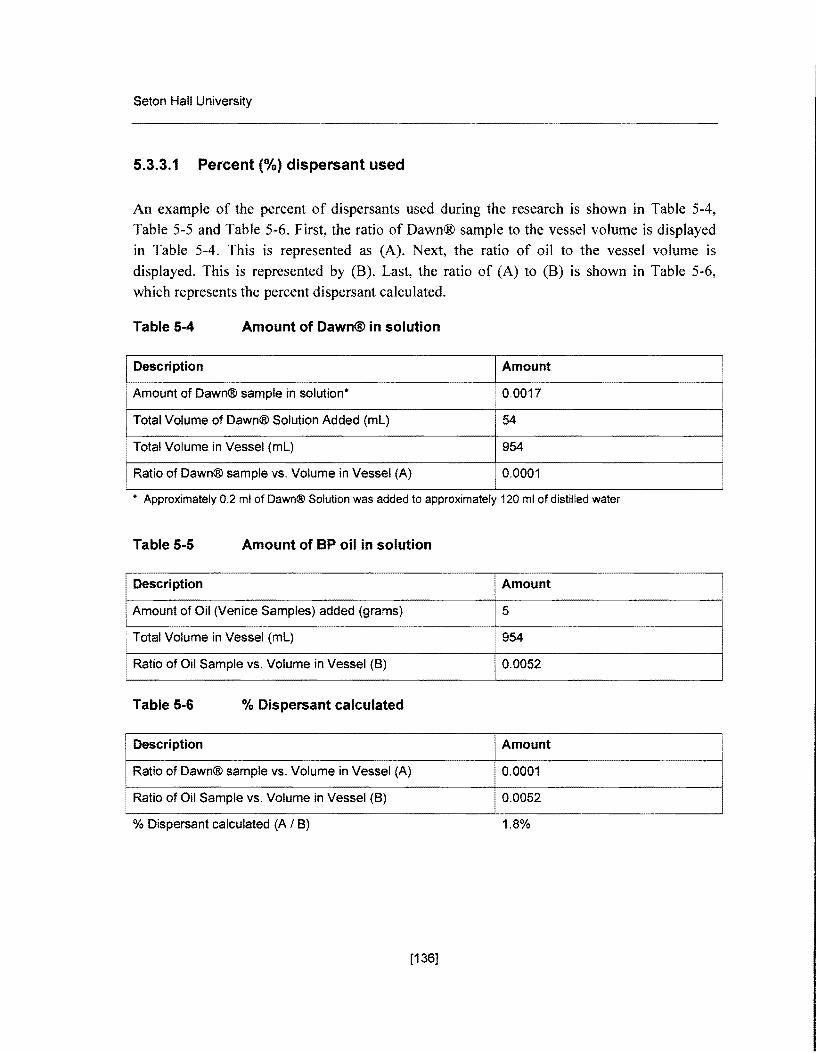
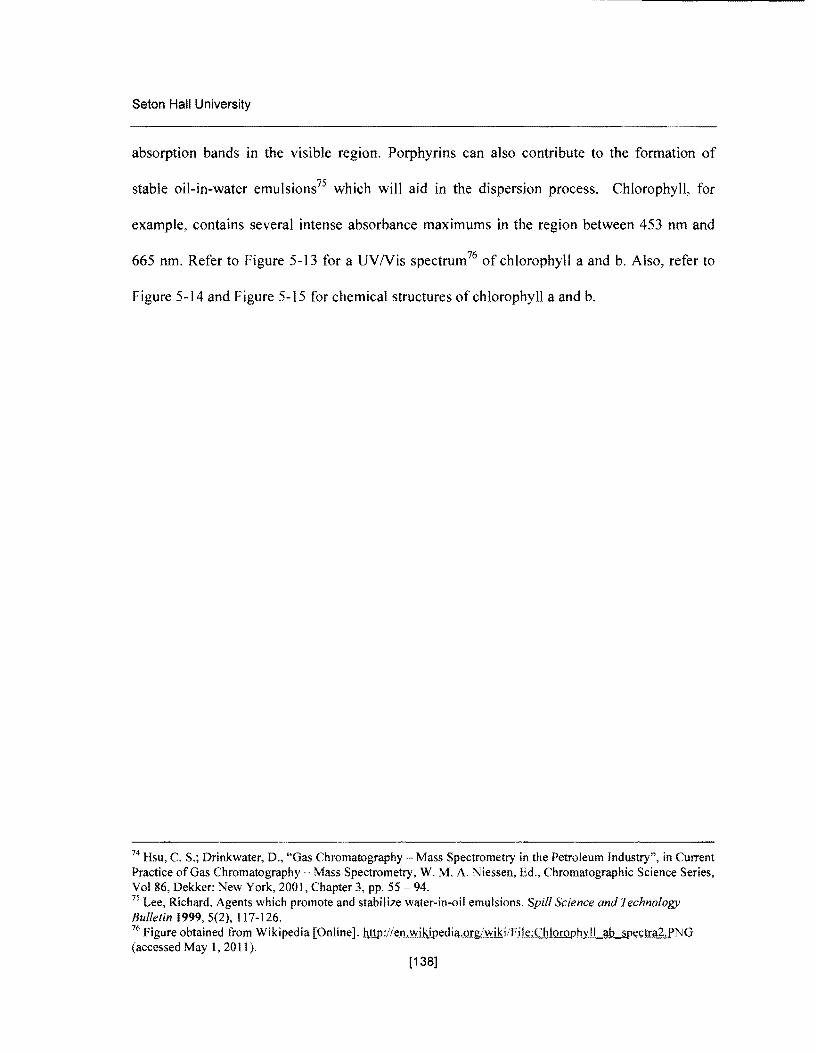
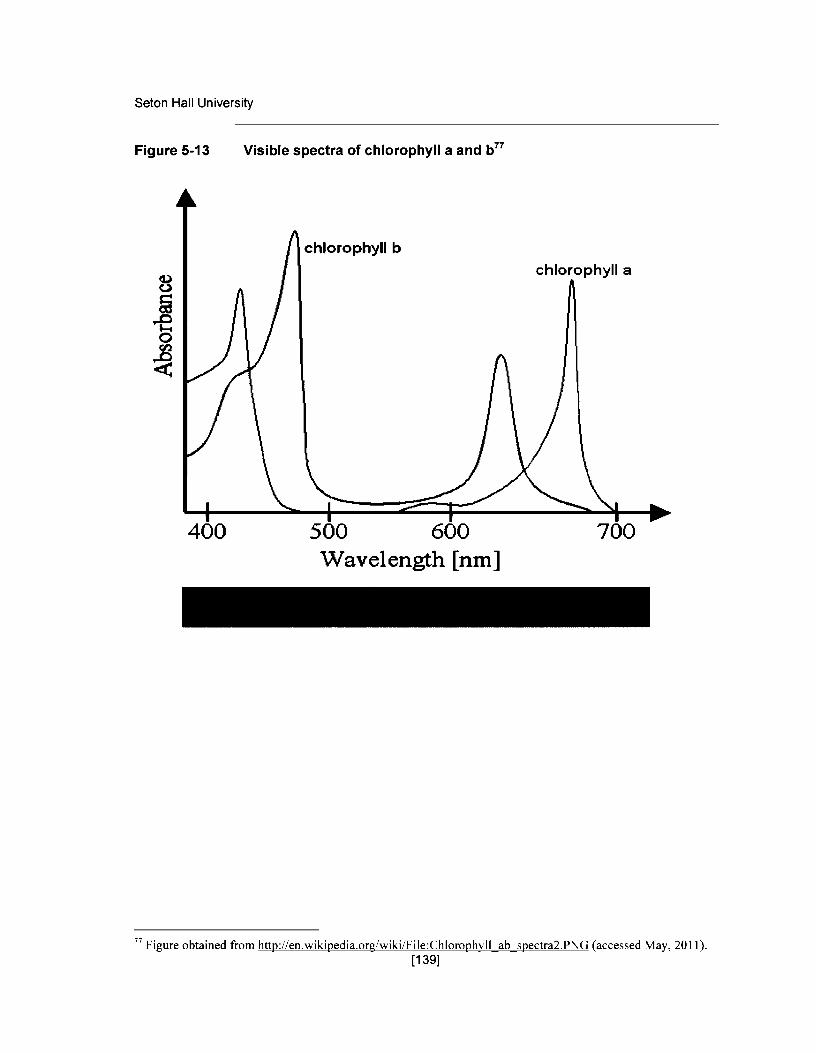
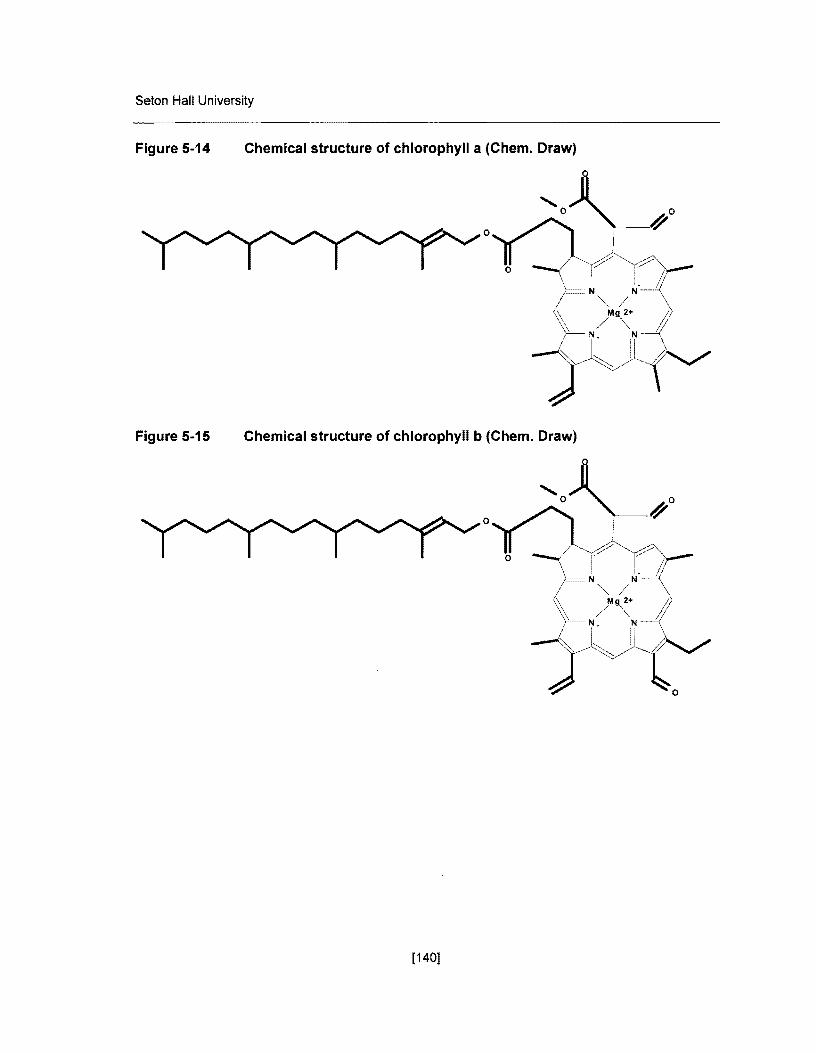
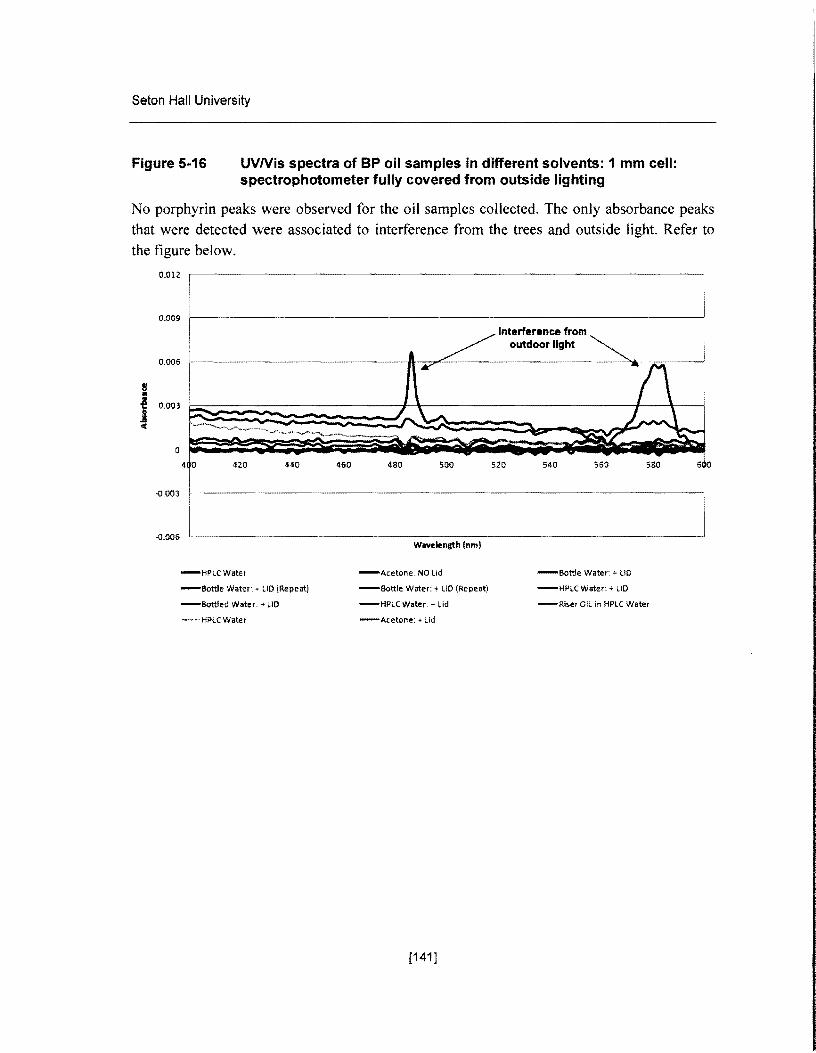
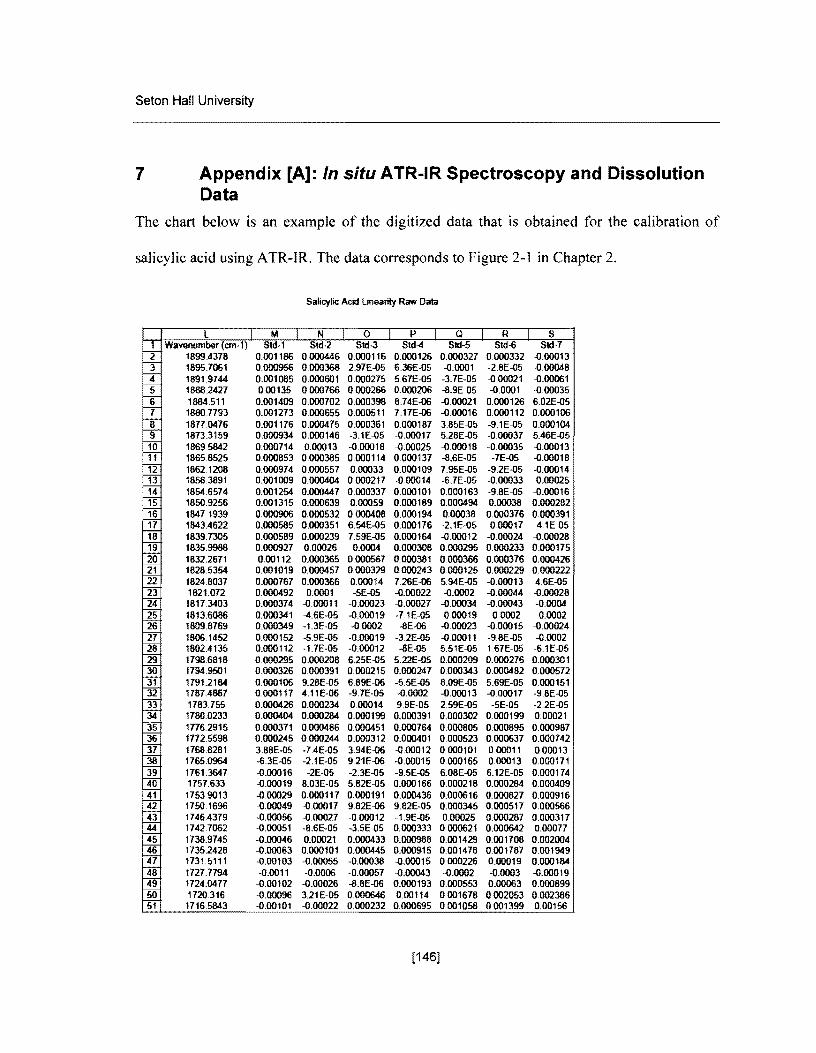
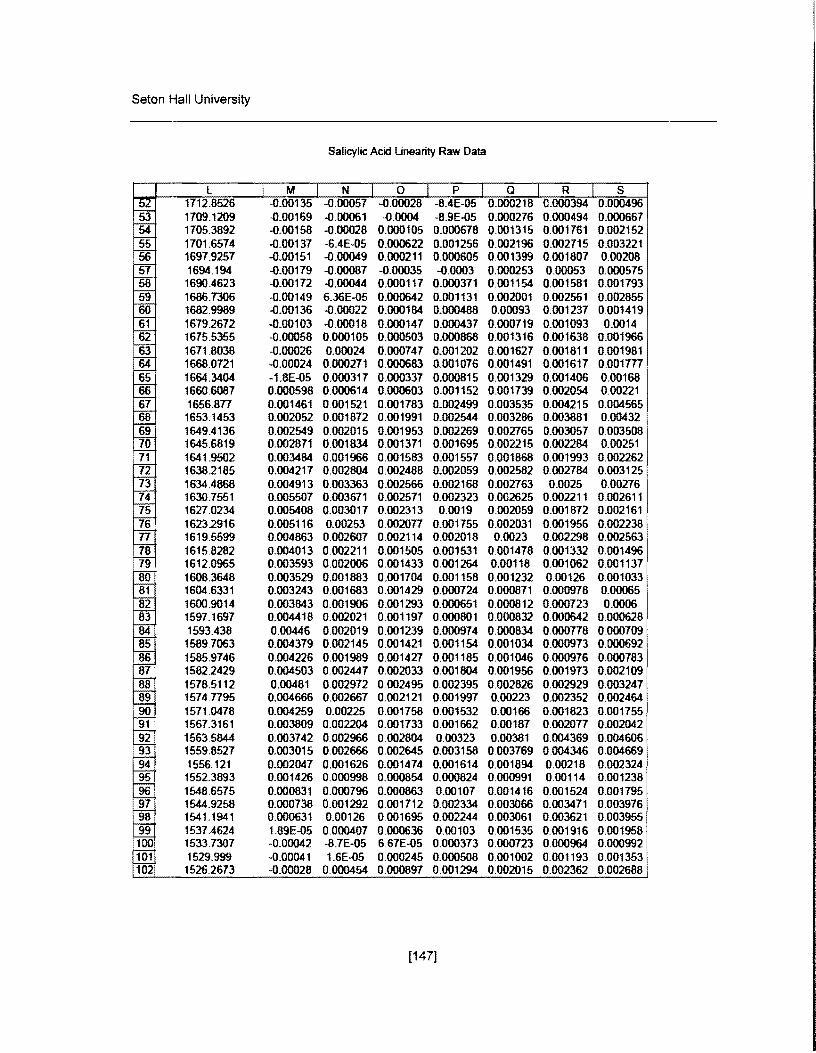
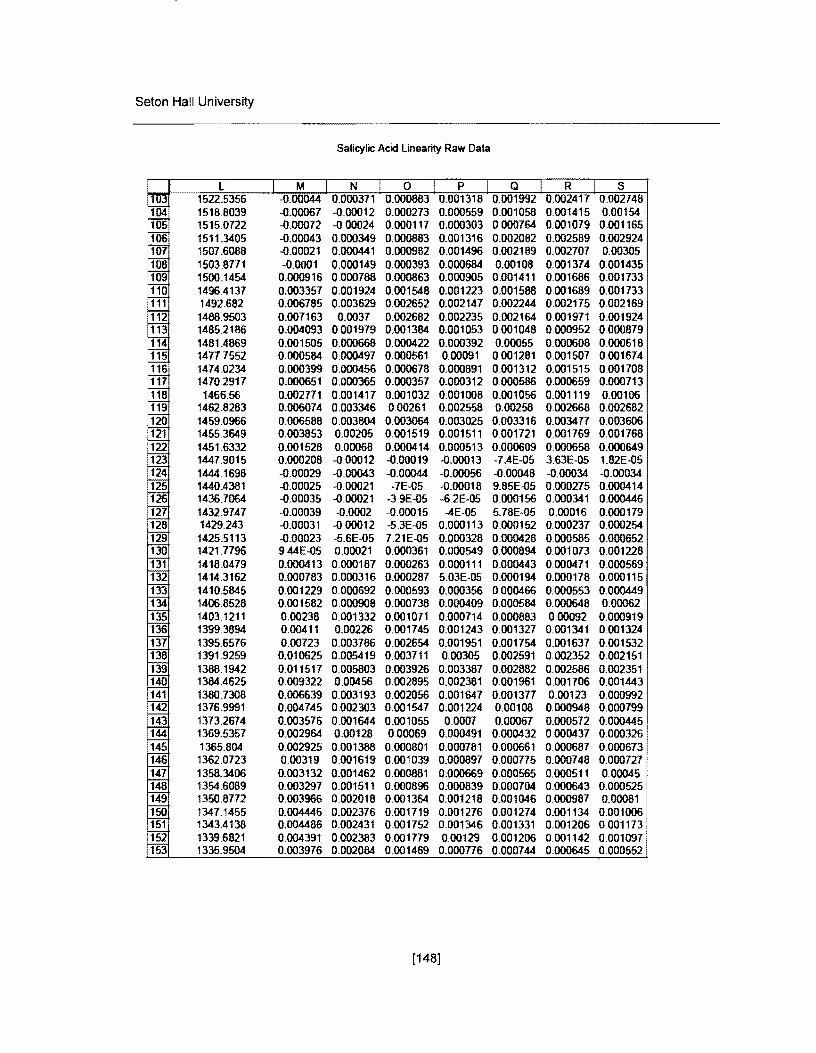
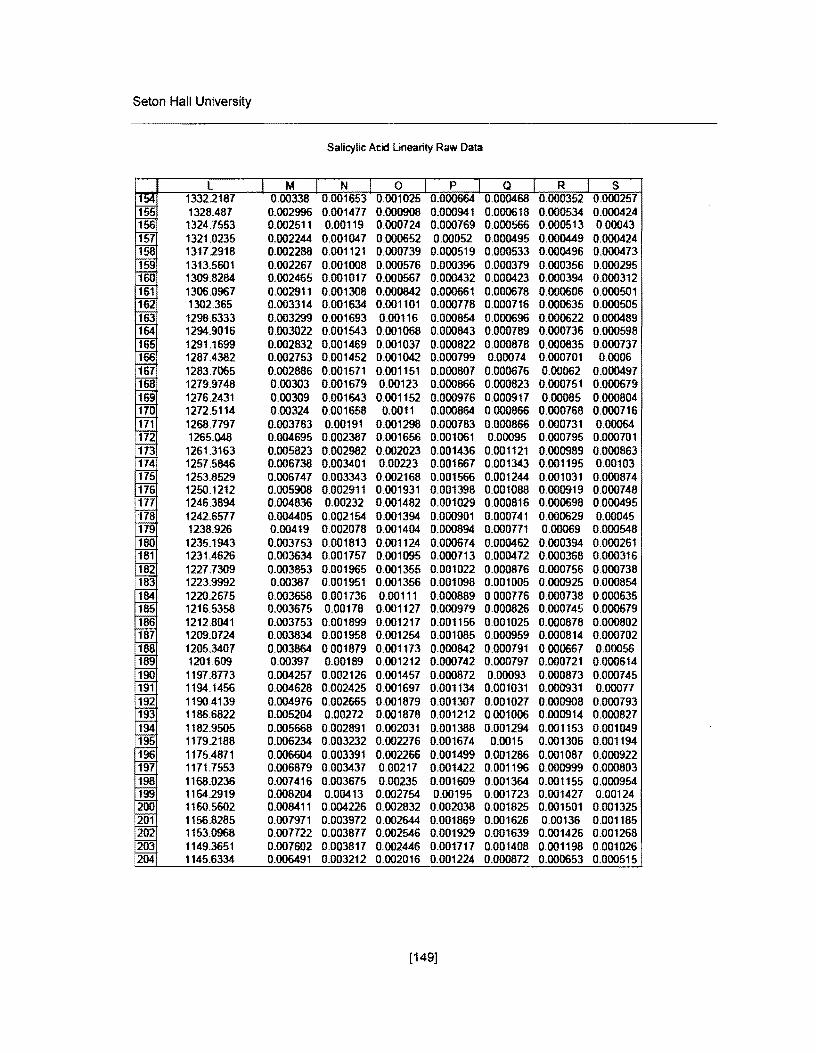
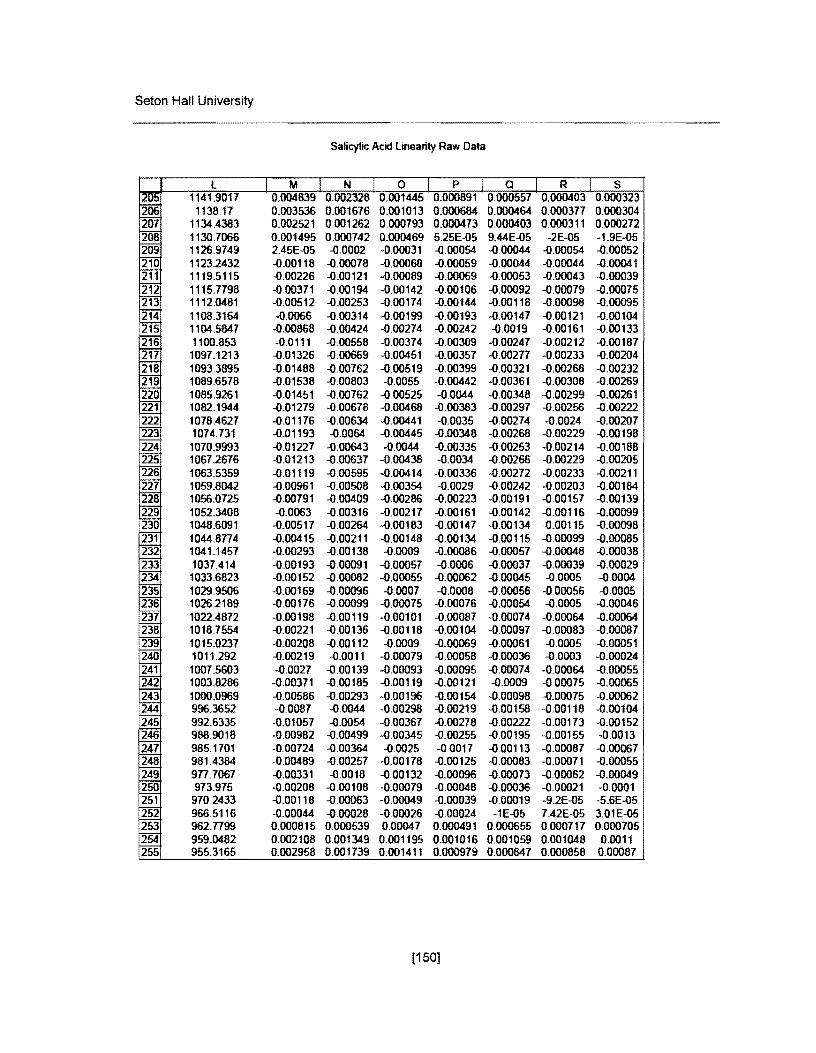
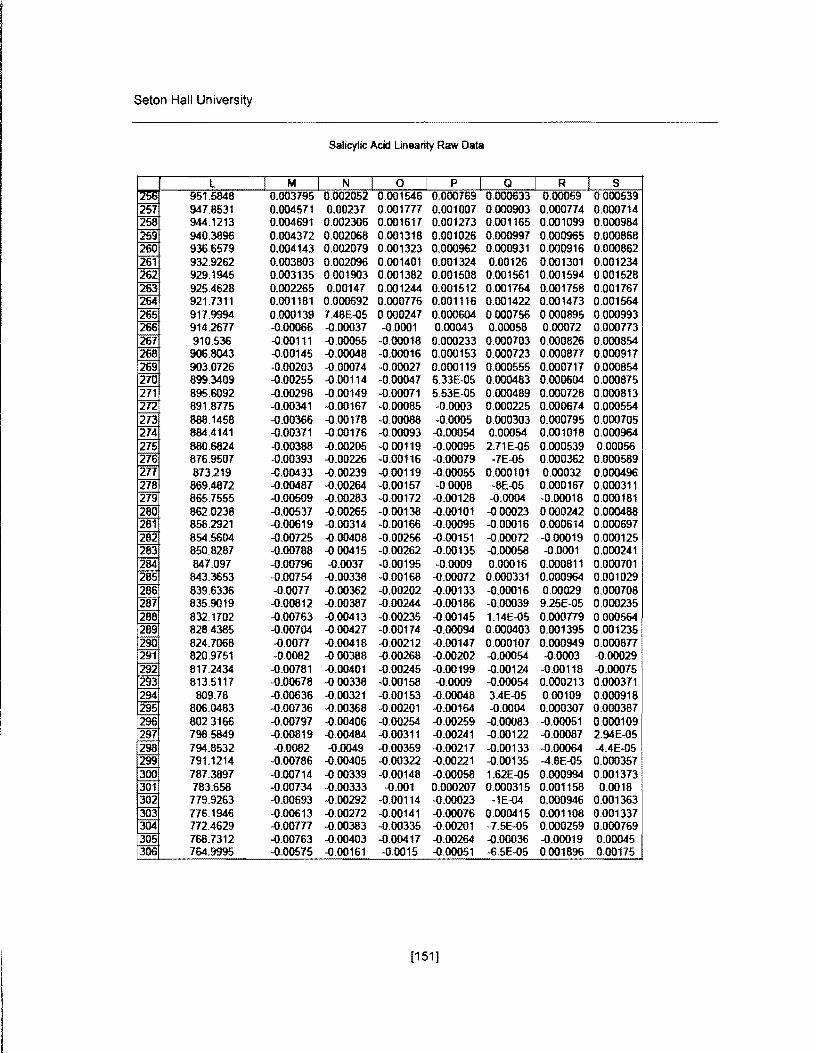
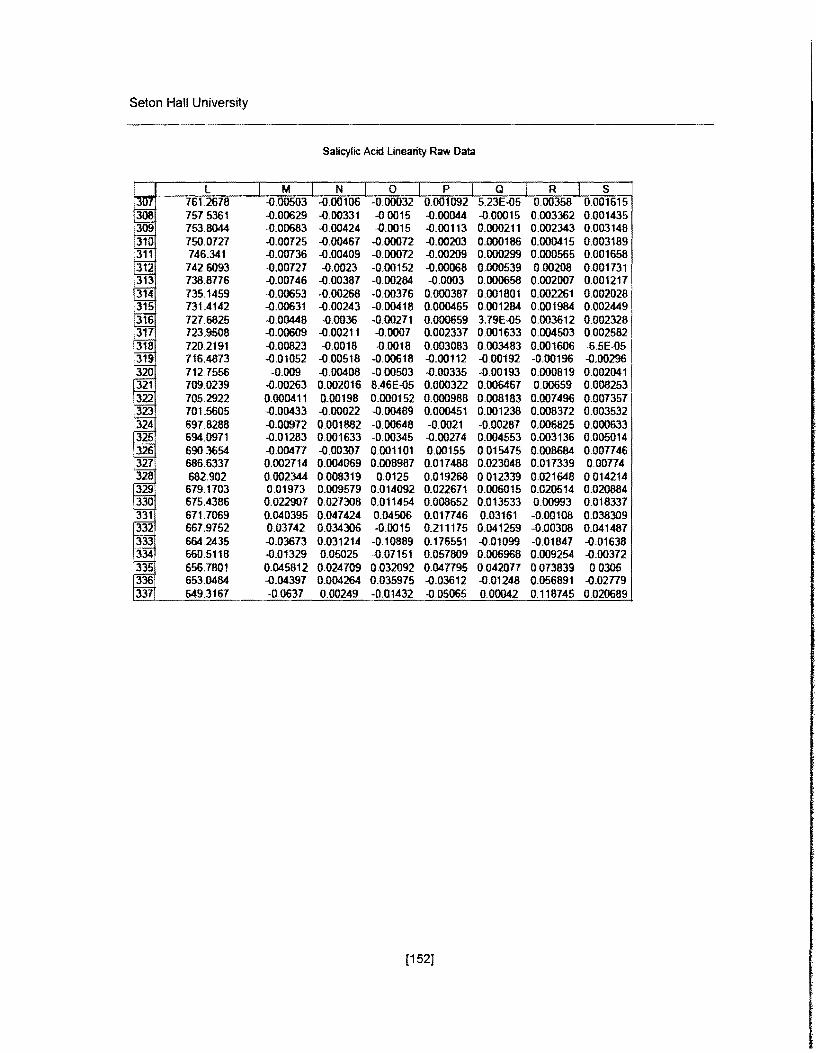
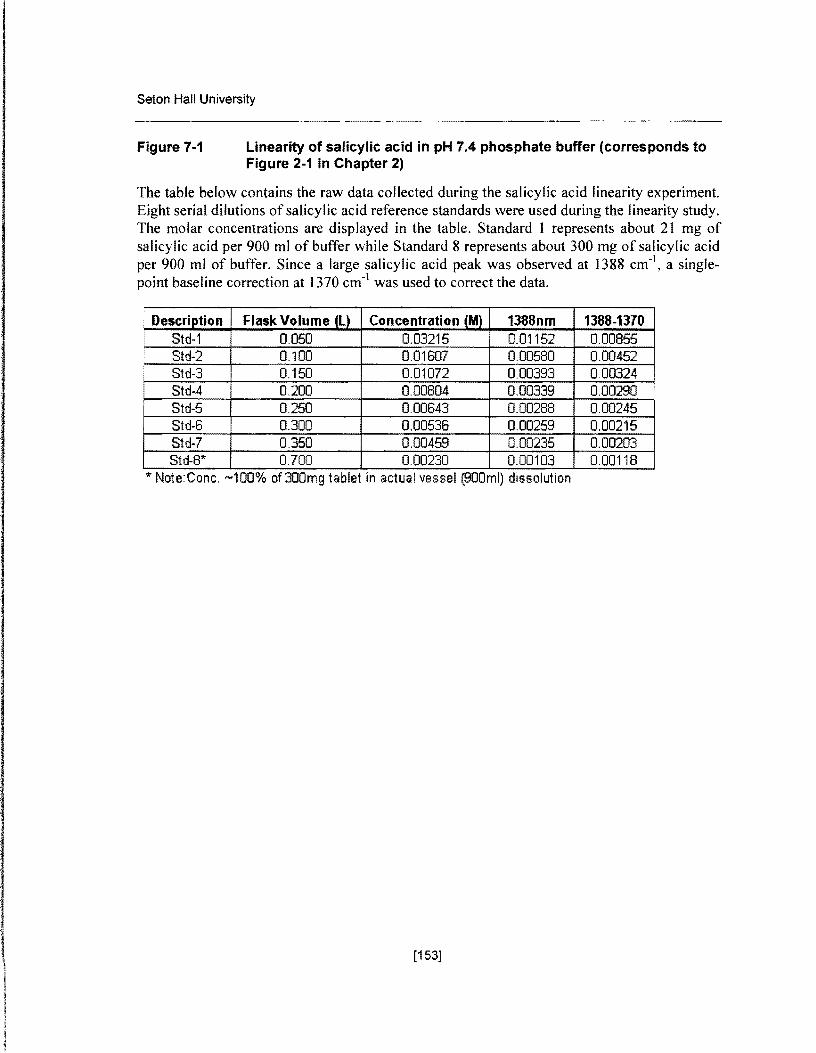
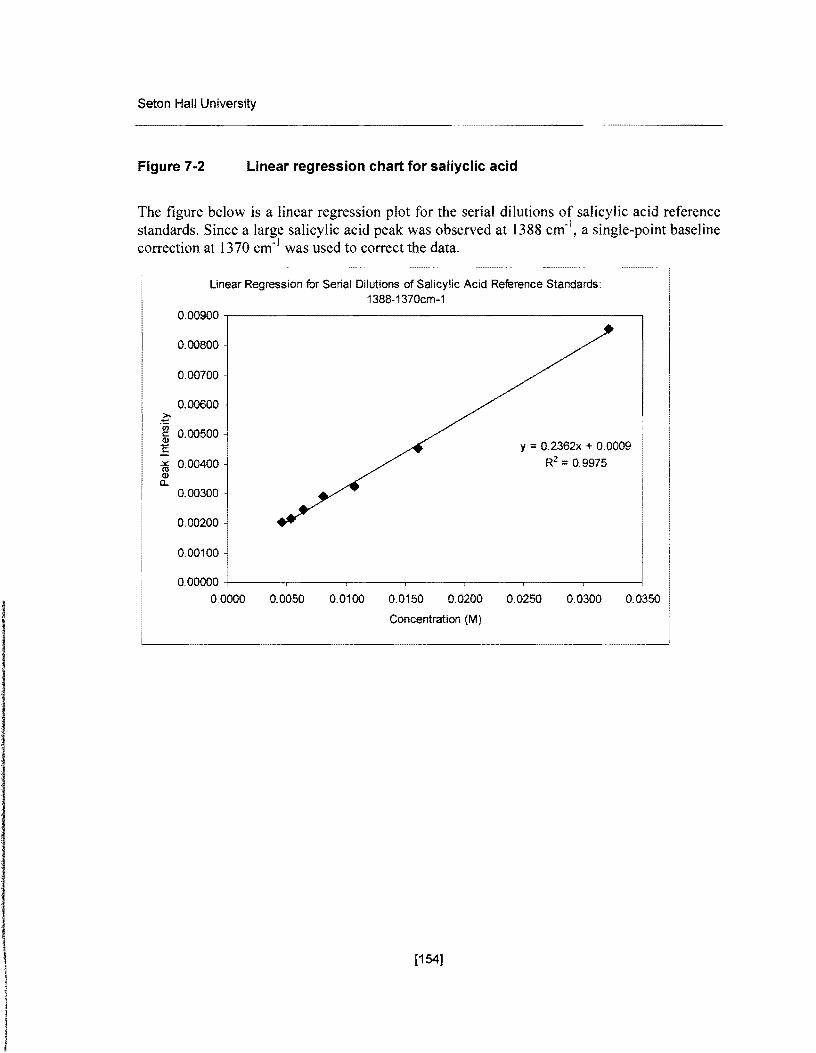
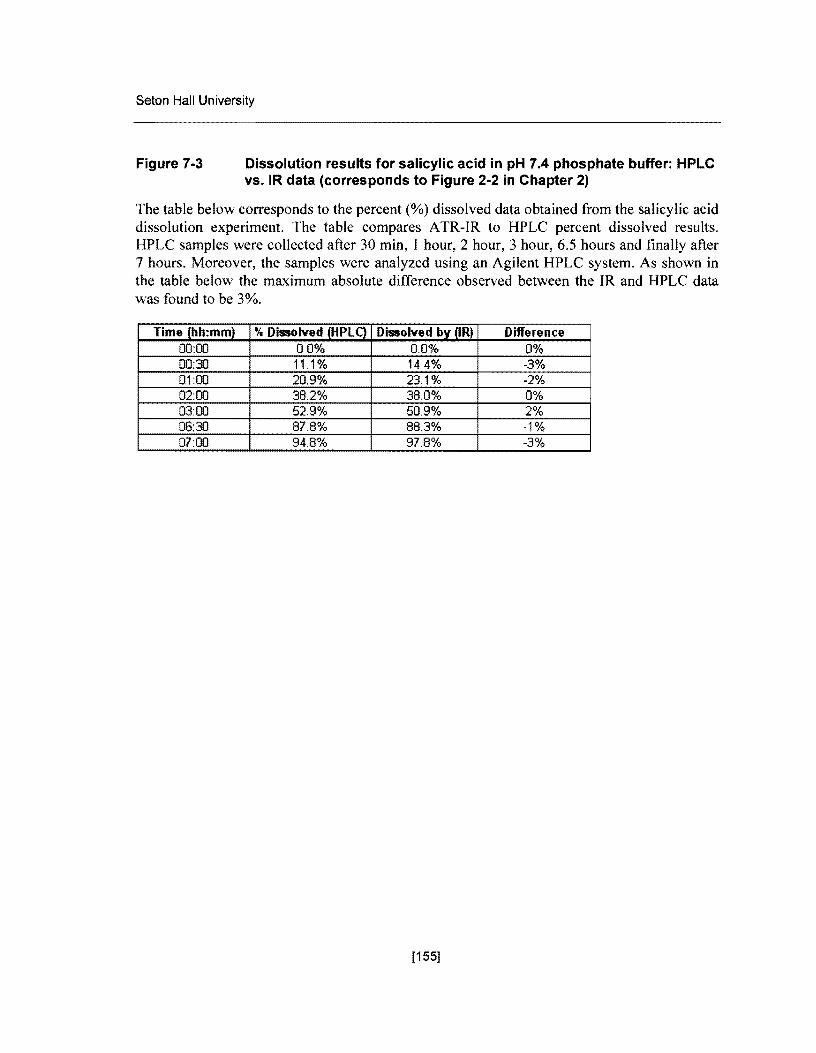
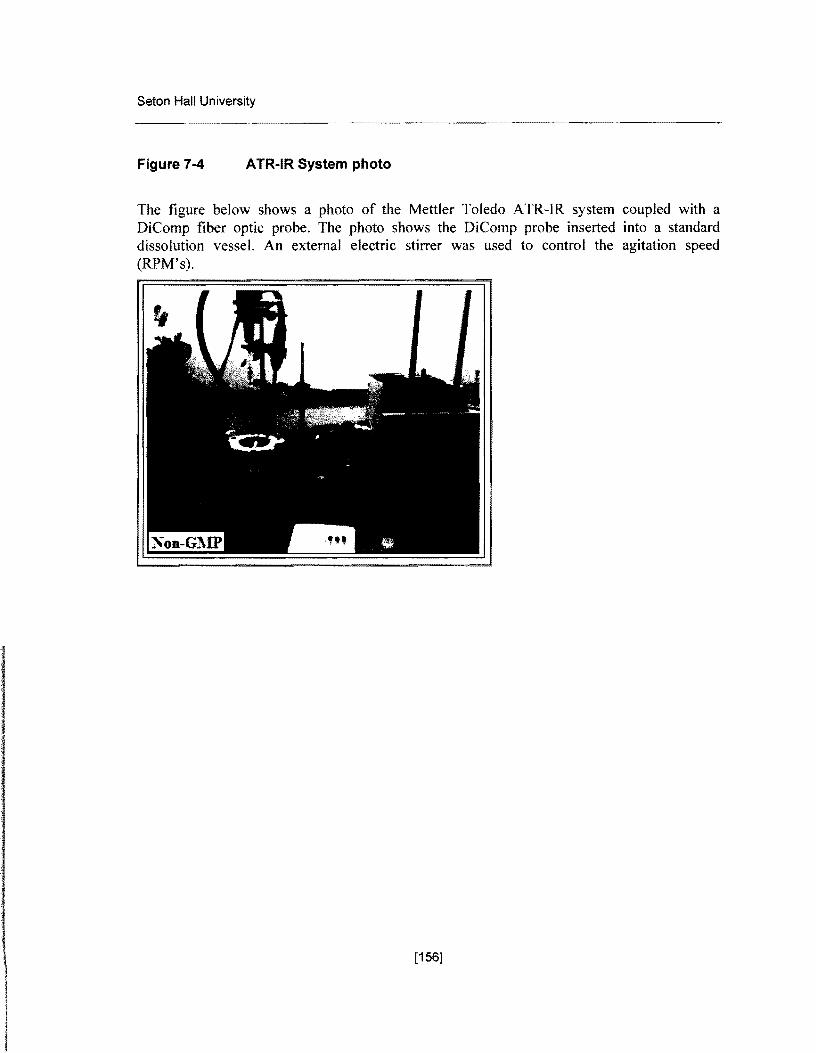
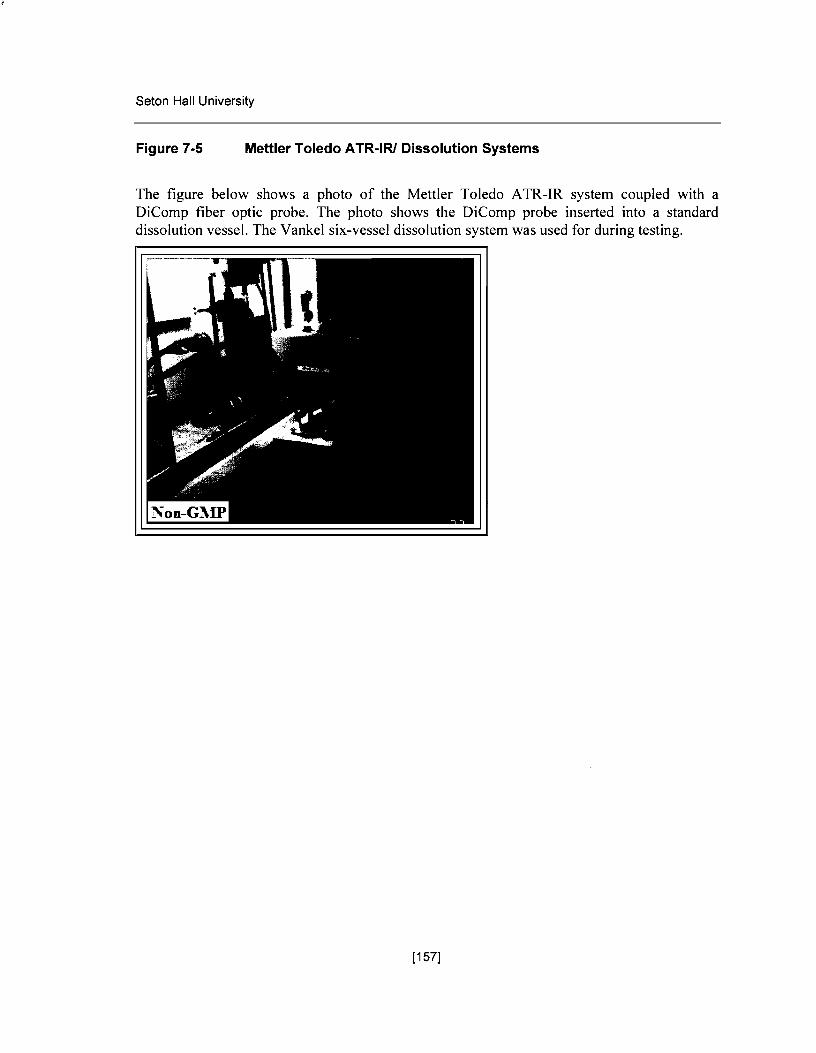
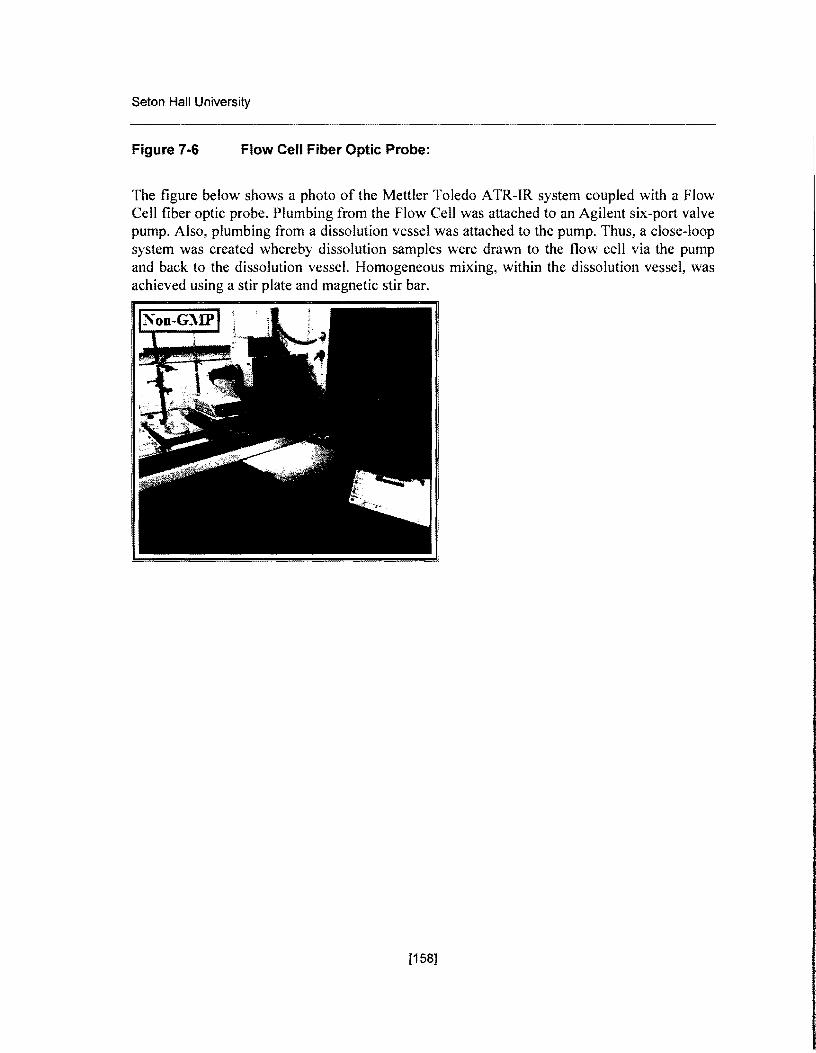
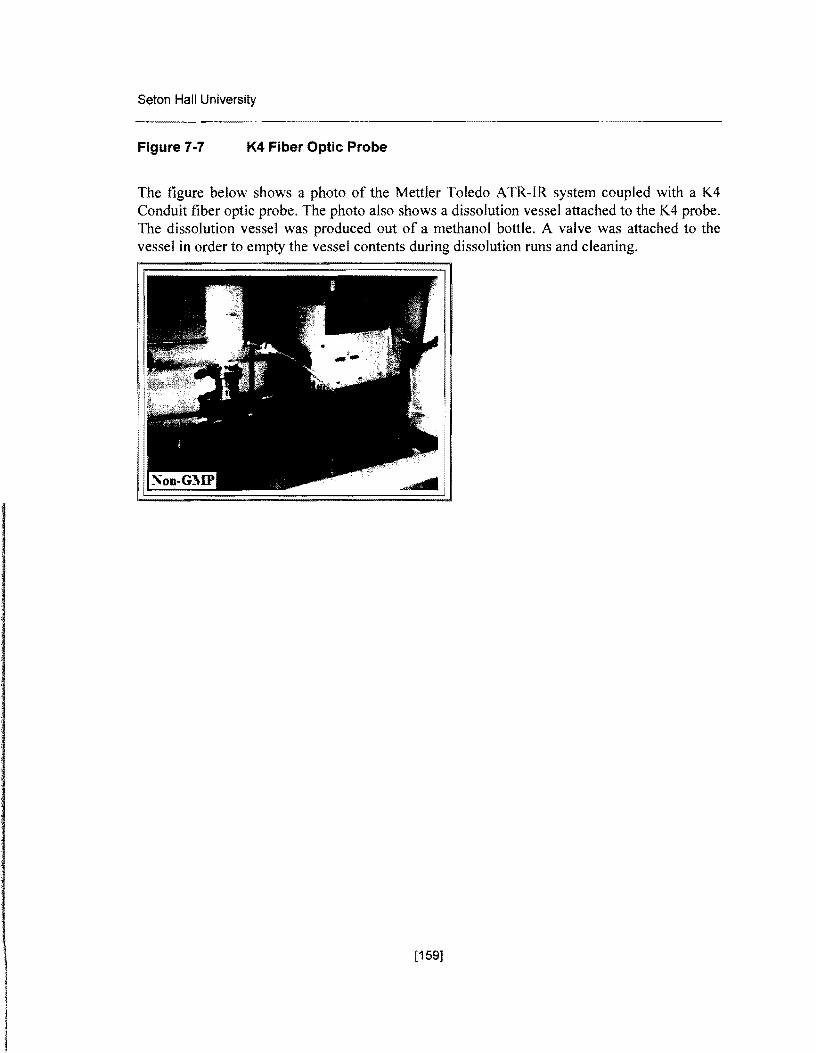
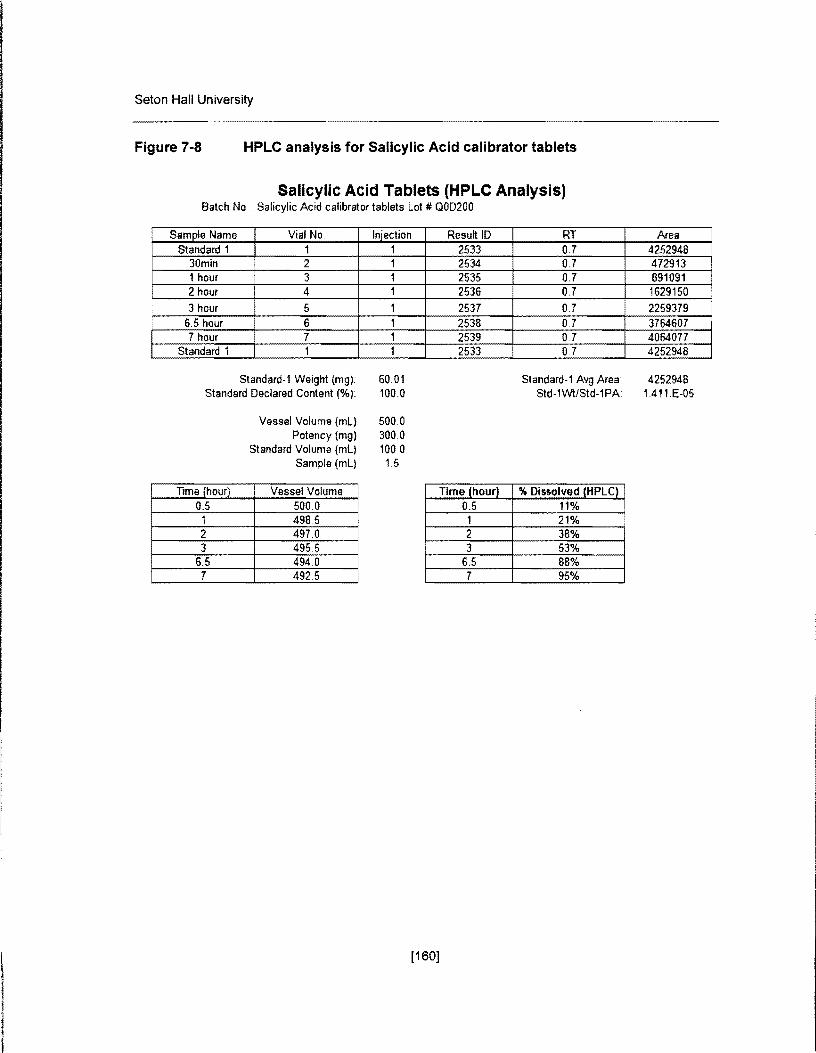
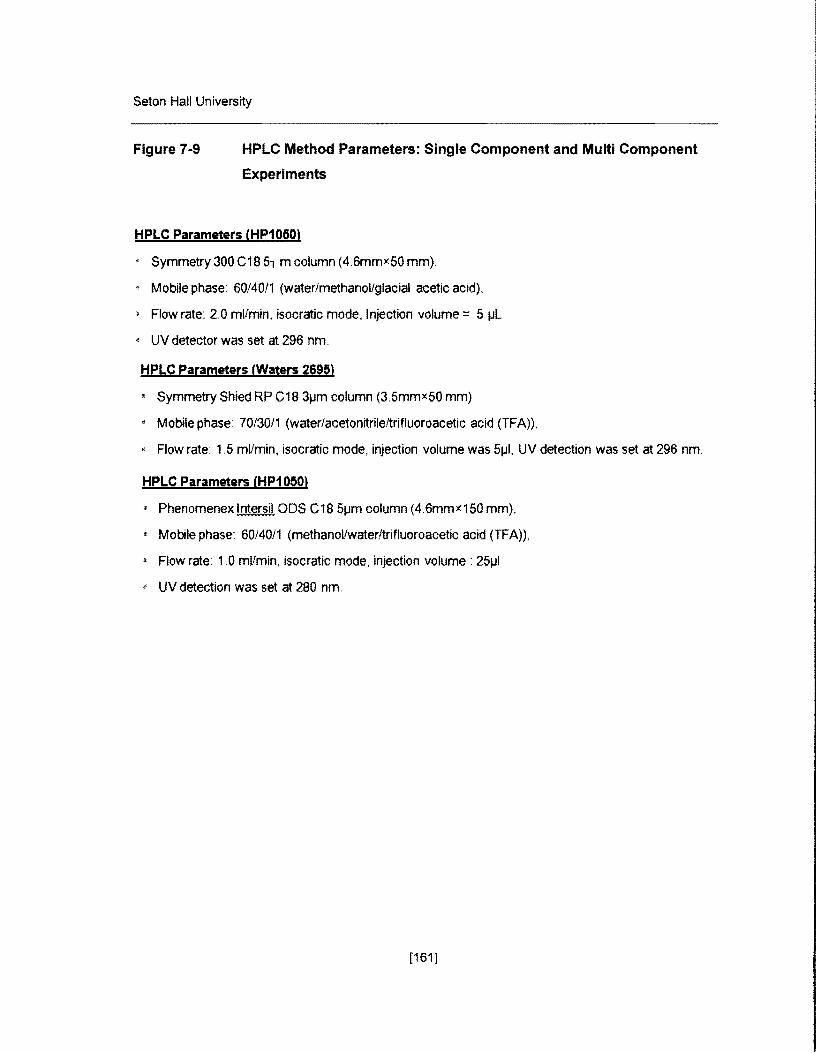
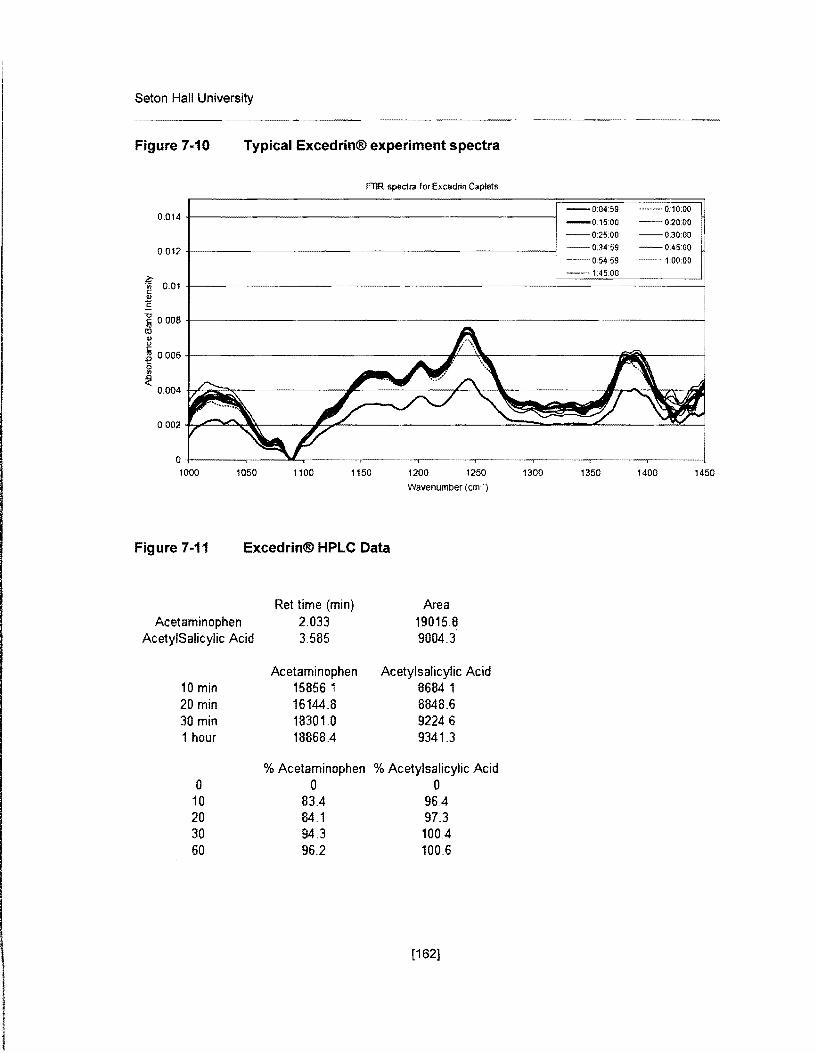
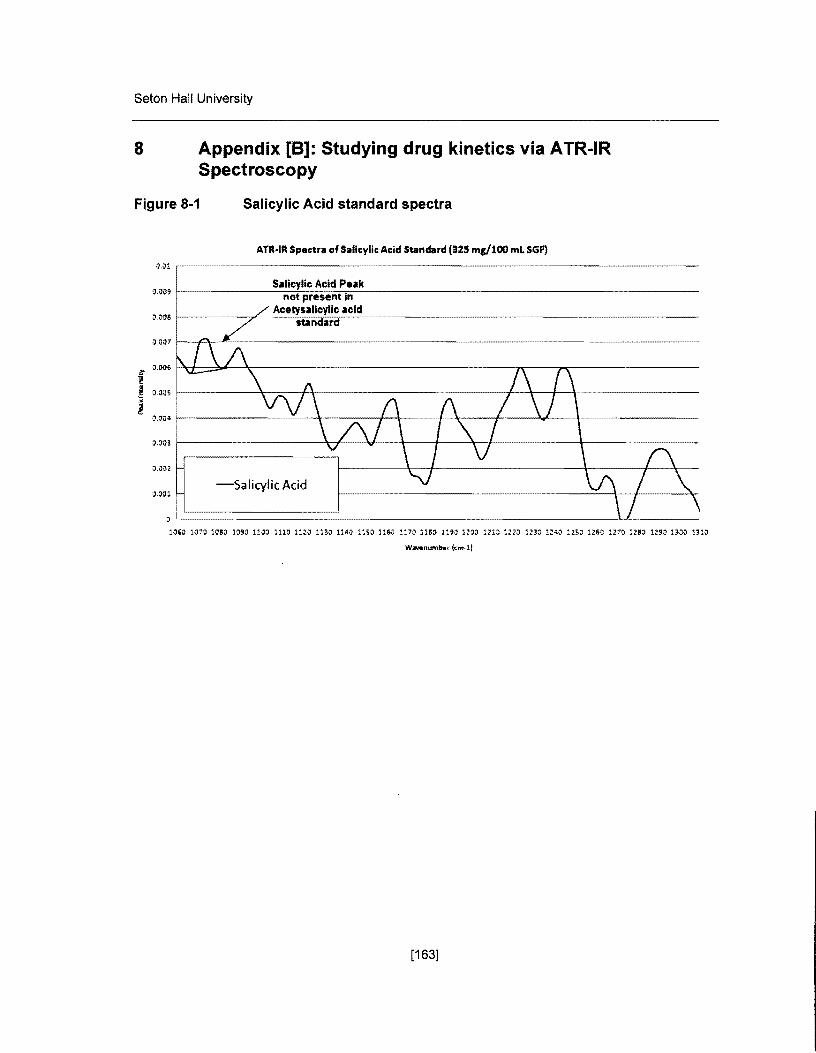
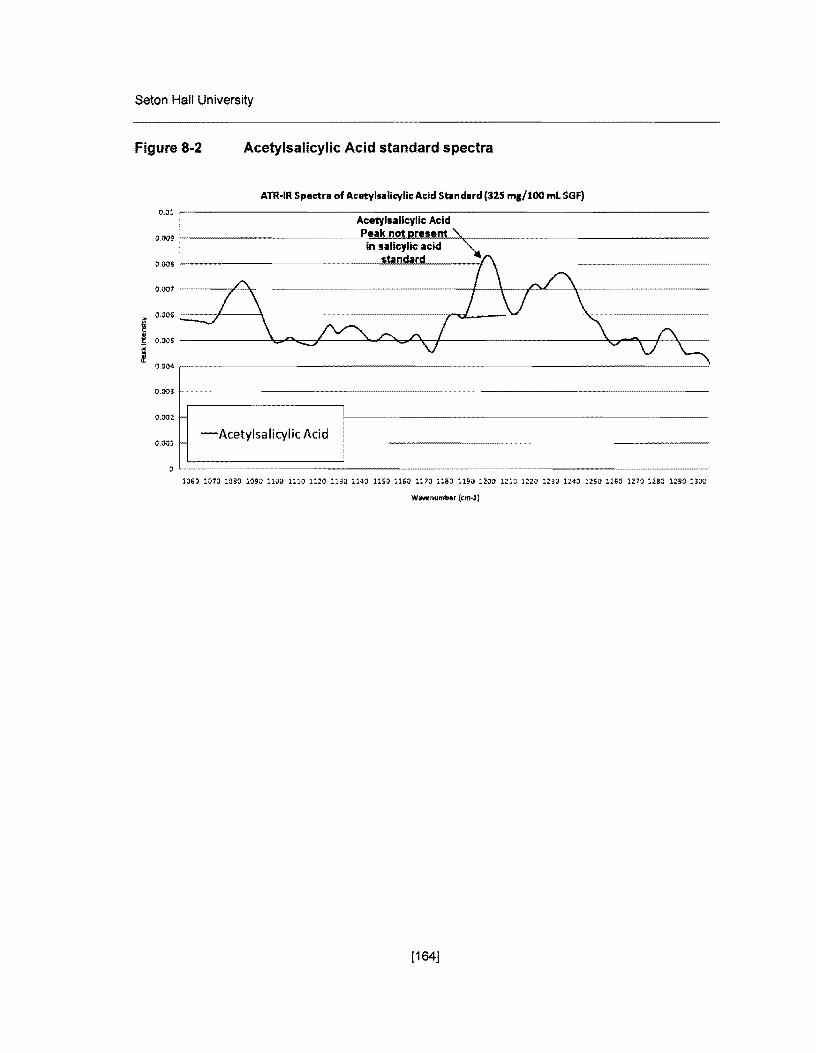
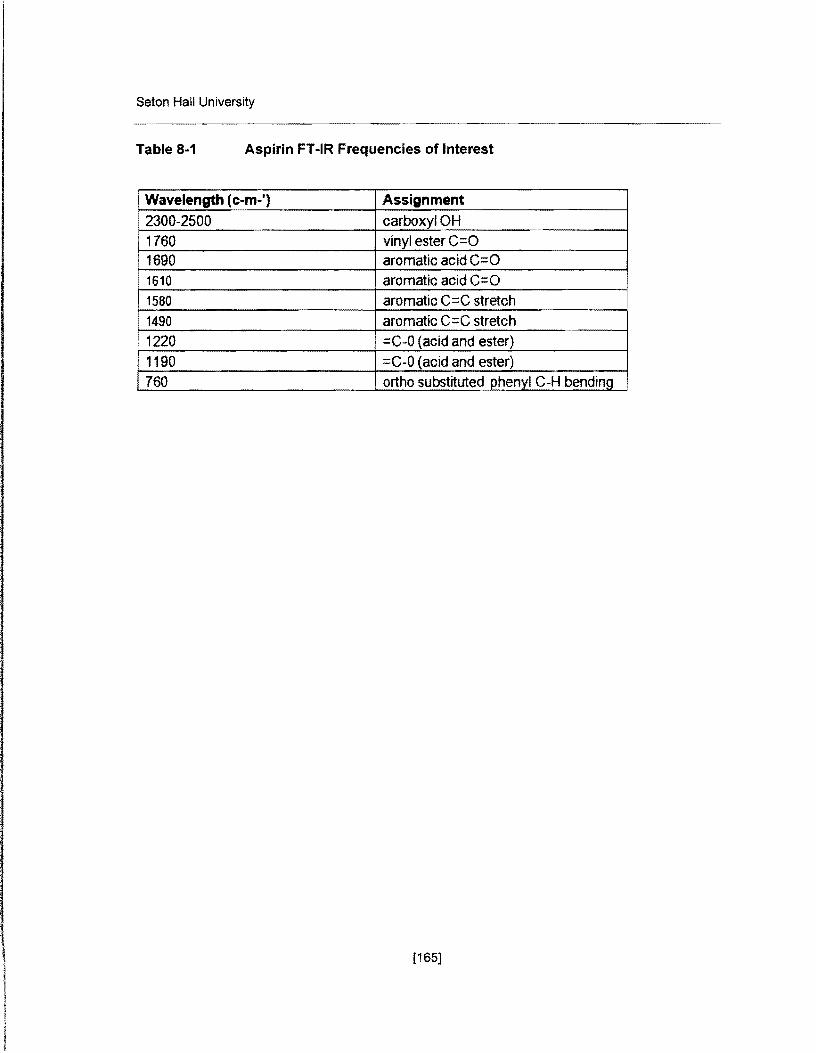
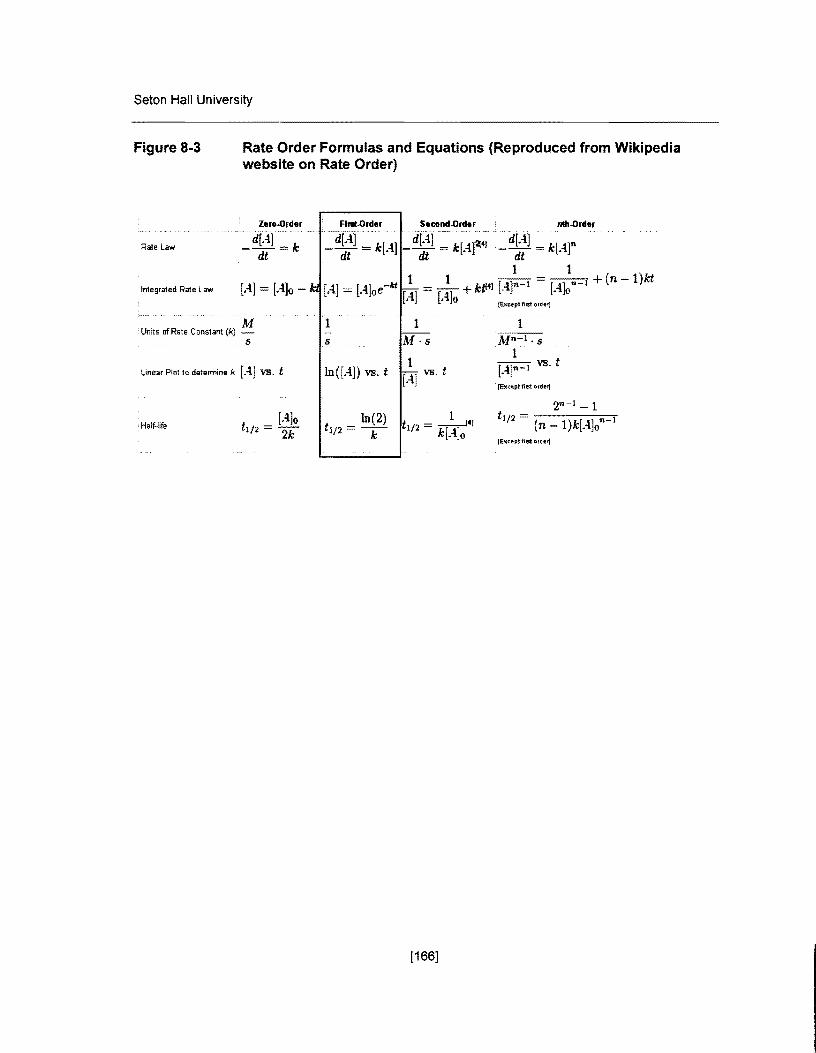
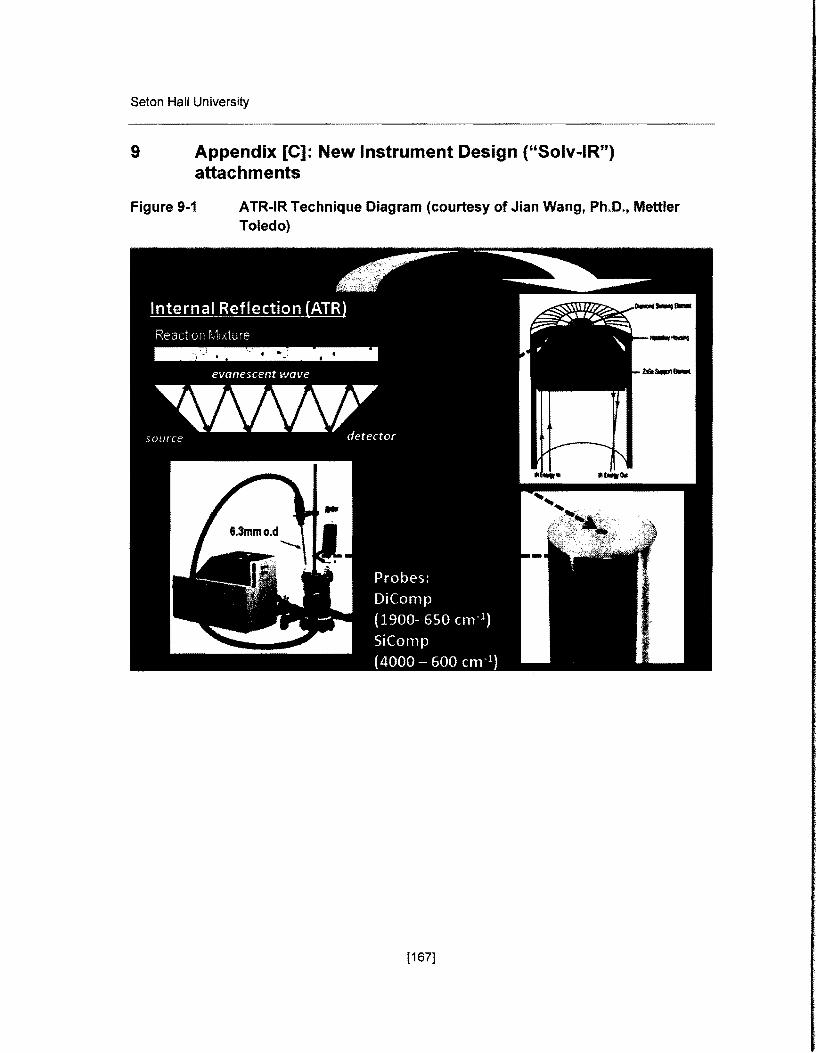
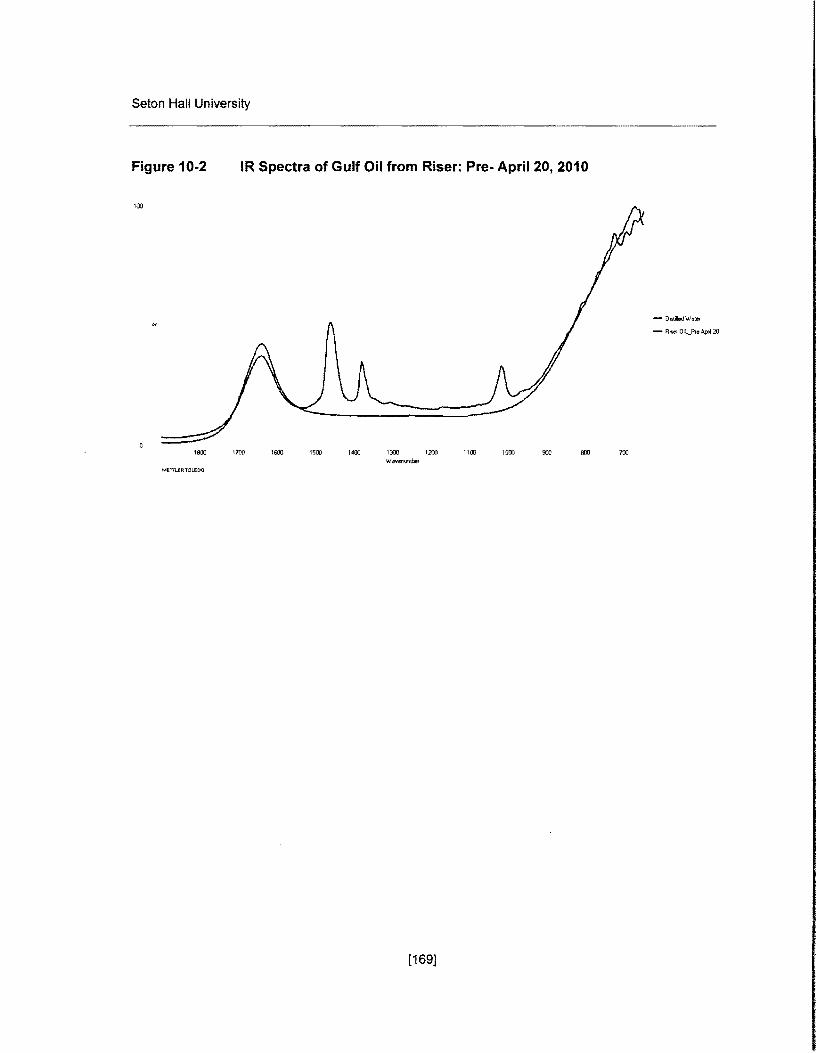
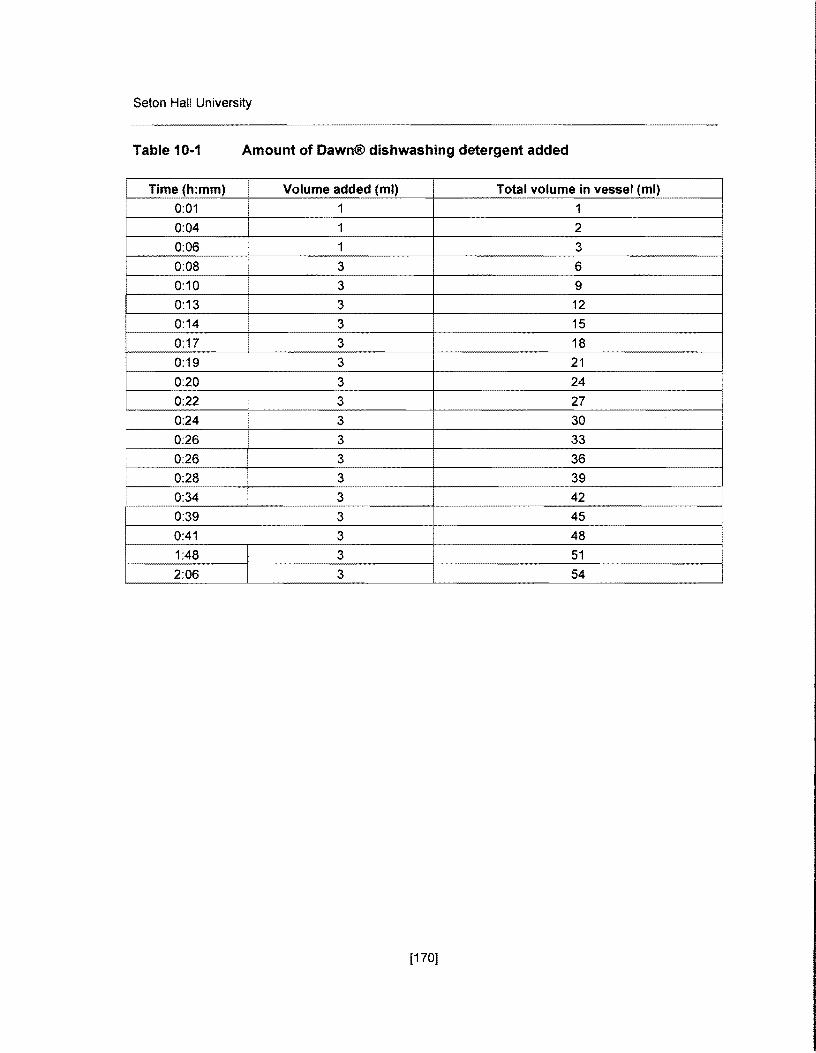
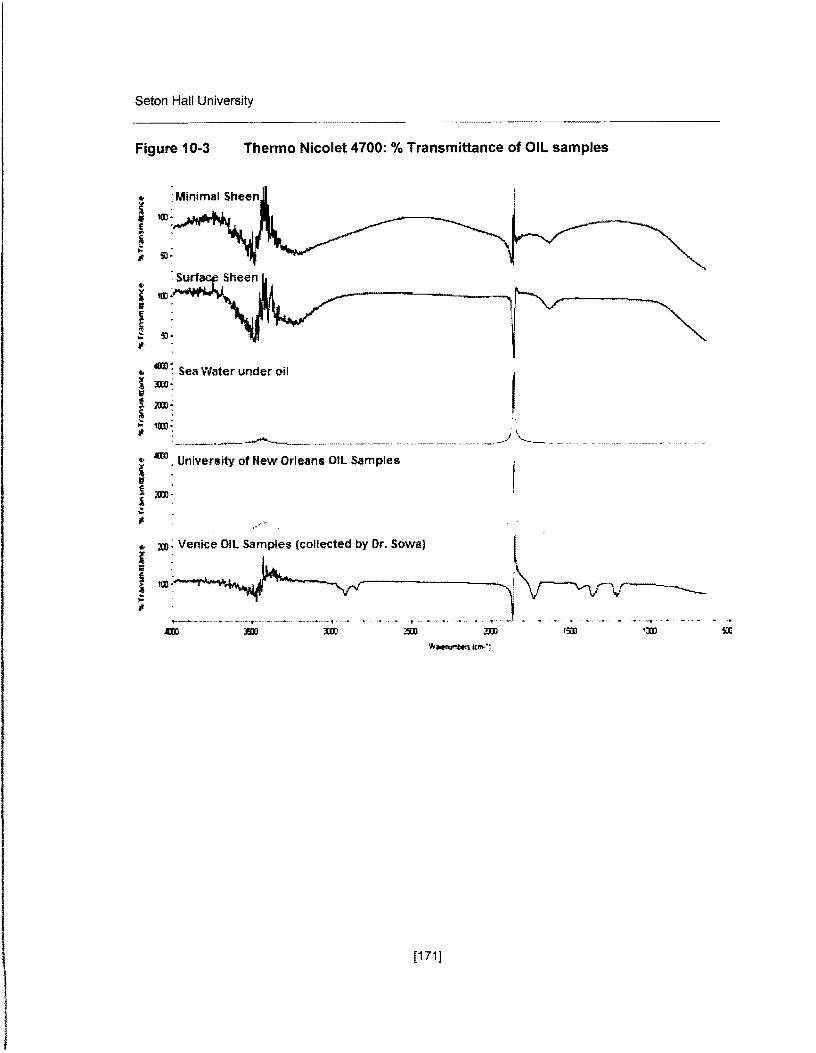
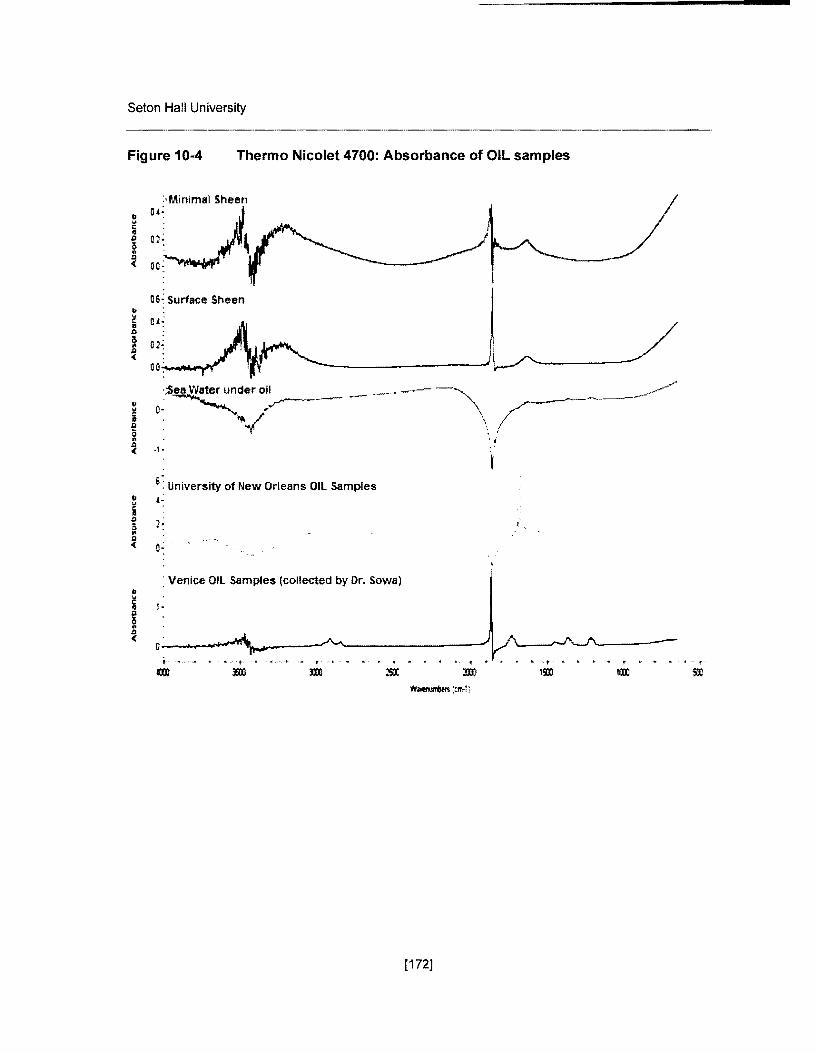


![Impact of near-infrared radiation in dermatology · 2017-05-05 · Tanaka Y. Impact of near-infrared in dermatology Both UV and visible light radiation are attenuated by melanin[7],](https://img.pdfslide.net/doc/110x75/5e963a10d647936d586aa42b/impact-of-near-infrared-radiation-in-dermatology-2017-05-05-tanaka-y-impact-of.jpg)