Embed Size (px)
Citation preview
1
August 2013
Barry Lipton, John Robertson, and Katy Porter
Workers Compensation Temporary Total Disability Indemnity Benefit Duration— 2013 Update
KEY FINDINGS Previous NCCI studies of Temporary Total Disability (TTD) indemnity benefits duration
1, 2 showed an increase in nationwide
average duration following the onset of the Great Recession in 2007. Now that we have post-recession results, we can see that Accident Year (AY) 2009 was the nationwide peak at 143 days, and average duration has since declined to 140 days in AY 2012. Average durations have risen or fallen in step with the national unemployment rate,
3 as the following table
illustrates: Comparison of Average Duration to Unemployment Rate
Accident Year Ultimate Duration
(in Days) Unemployment Rate
for December 2007 127 5.0% 2009 143 9.9% 2012 140 7.8%
Other key findings include:
Countrywide, the Contracting and Manufacturing industry groups4 had the steepest declines in average duration from
AY 2009 to AY 2011, following substantial increases between AY 2006 and AY 2009. Recent duration trends in the other industry groups were either slight declines or modest increases.
The median of the average durations in states with seven-day waiting periods5 is about 20 days longer than in states
with three-day waiting periods.
Within most industry groups, average durations for women are longer than average durations for men. However, men have higher shares of claims than women in the longer-duration industry groups, so that when viewed overall, men’s average duration is longer than women’s.
Duration increased for all age groups between AY 2005 and AY 2009, with most age groups reflecting the countrywide duration increase of 10%. Duration for the youngest age group—workers under age 30 or less—stands out as about 30% lower than countrywide.
1 Temporary Total Disability indemnity benefits are paid to injured workers to replace wages—and other costs such as vocational rehabilitation―while the claimant is recovering from a work-related injury or illness and is not able to work. Duration is the number of compensated days of lost wages. 2 Lipton, B., J. Robertson, and K. Porter, “Workers Compensation Temporary Total Disability Indemnity Benefit Duration 2012 Update,” NCCI, July 2012, on ncci.com. 3 Bureau of Labor Statistics, seasonally adjusted unemployment. 4 NCCI industry groups are groupings of workers compensation classifications, based primarily on the industry described by the classification. The current industry groups are Manufacturing, Contracting, Office and Clerical, Goods and Services, and Miscellaneous. We use a sixth group for Alaska: Oil and Gas. 5 Compensation for lost wages begins after the waiting period.
2
STUDY DESIGN Data for this study includes claims with injury dates from January 1, 1998, through June 30, 2012, for which TTD indemnity benefits have been paid.
6 This adds 12 months of experience beyond that used in our prior TTD duration study.
Countrywide estimates in this study are based on data for 46 jurisdictions—all jurisdictions except ND, OH, WA, WV, and WY—and include large deductible and self-insured claims, where reported to NCCI. The duration of TTD indemnity benefits is determined by adding the number of distinct compensated days reported on indemnity payment transactions. Lump-sum settlements have been included where the compensated days were listed as part of the payment. If a settlement transaction only included a single covered day, then only that one day was included as part of the claim duration. More information on methodology is included in Appendix 1.
6 The data, licensed to NCCI, is a transactional-level claims sample provided by carriers.
3
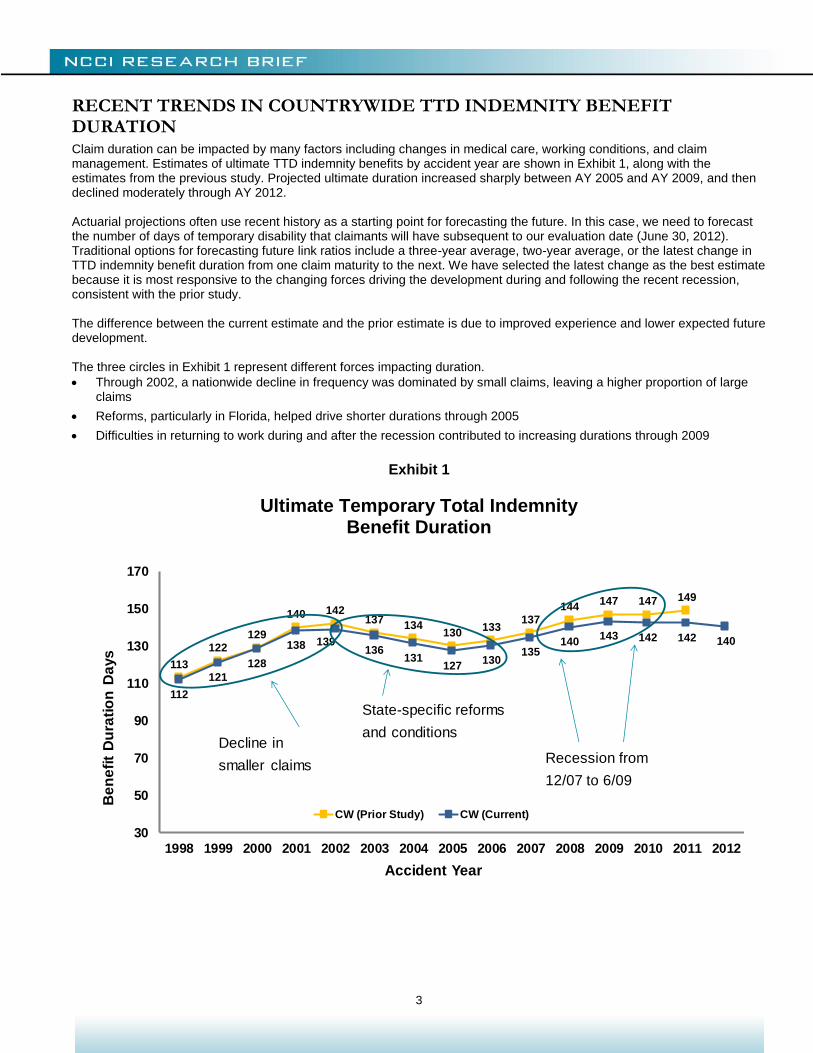
RECENT TRENDS IN COUNTRYWIDE TTD INDEMNITY BENEFIT DURATION Claim duration can be impacted by many factors including changes in medical care, working conditions, and claim management. Estimates of ultimate TTD indemnity benefits by accident year are shown in Exhibit 1, along with the estimates from the previous study. Projected ultimate duration increased sharply between AY 2005 and AY 2009, and then declined moderately through AY 2012. Actuarial projections often use recent history as a starting point for forecasting the future. In this case, we need to forecast the number of days of temporary disability that claimants will have subsequent to our evaluation date (June 30, 2012). Traditional options for forecasting future link ratios include a three-year average, two-year average, or the latest change in TTD indemnity benefit duration from one claim maturity to the next. We have selected the latest change as the best estimate because it is most responsive to the changing forces driving the development during and following the recent recession, consistent with the prior study. The difference between the current estimate and the prior estimate is due to improved experience and lower expected future development. The three circles in Exhibit 1 represent different forces impacting duration.
Through 2002, a nationwide decline in frequency was dominated by small claims, leaving a higher proportion of large claims
Reforms, particularly in Florida, helped drive shorter durations through 2005
Difficulties in returning to work during and after the recession contributed to increasing durations through 2009
Exhibit 1
Ultimate Temporary Total Indemnity Benefit Duration
113
122129
140 142137
134130
133137
144147 147 149
112
121
128
138 139136
131127
130135
140143 142 142 140
30
50
70
90
110
130
150
170
1998 1999 2000 2001 2002 2003 2004 2005 2006 2007 2008 2009 2010 2011 2012
Be
ne
fit
Du
rati
on
Da
ys
Accident Year
CW (Prior Study) CW (Current)
Decline in
smaller claims
State-specific reforms
and conditions
Recession from
12/07 to 6/09
4
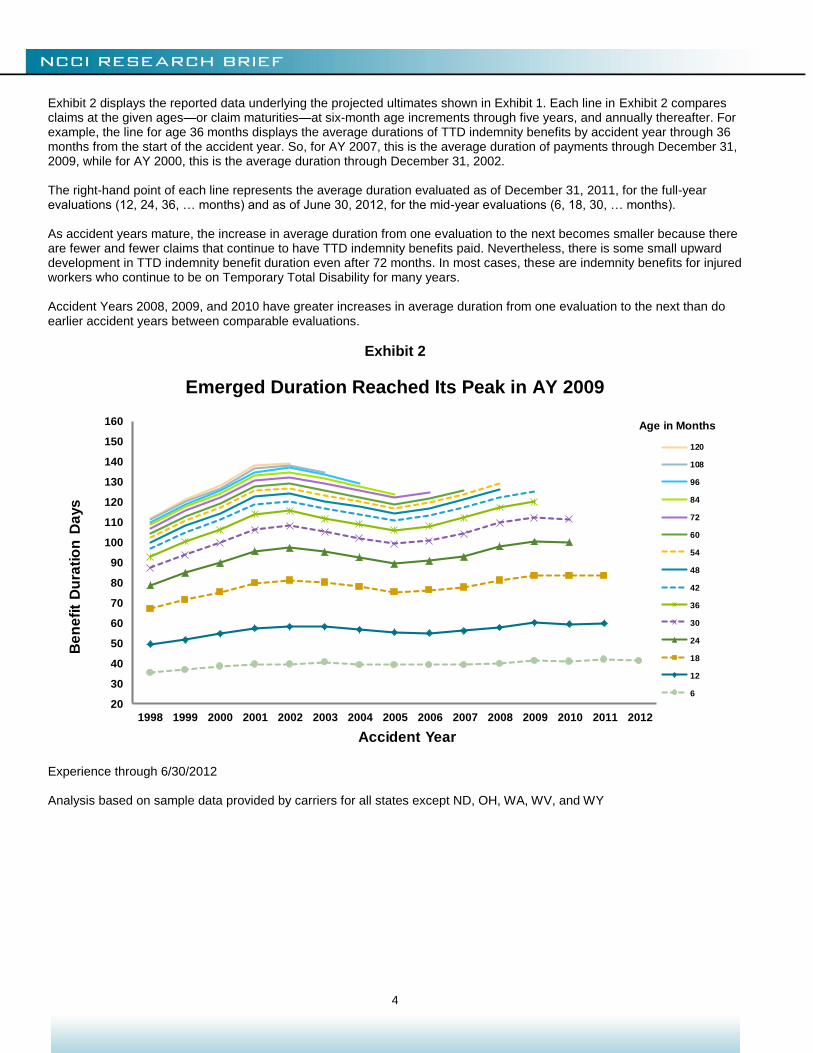
Exhibit 2 displays the reported data underlying the projected ultimates shown in Exhibit 1. Each line in Exhibit 2 compares claims at the given ages—or claim maturities—at six-month age increments through five years, and annually thereafter. For example, the line for age 36 months displays the average durations of TTD indemnity benefits by accident year through 36 months from the start of the accident year. So, for AY 2007, this is the average duration of payments through December 31, 2009, while for AY 2000, this is the average duration through December 31, 2002. The right-hand point of each line represents the average duration evaluated as of December 31, 2011, for the full-year evaluations (12, 24, 36, … months) and as of June 30, 2012, for the mid-year evaluations (6, 18, 30, … months). As accident years mature, the increase in average duration from one evaluation to the next becomes smaller because there are fewer and fewer claims that continue to have TTD indemnity benefits paid. Nevertheless, there is some small upward development in TTD indemnity benefit duration even after 72 months. In most cases, these are indemnity benefits for injured workers who continue to be on Temporary Total Disability for many years. Accident Years 2008, 2009, and 2010 have greater increases in average duration from one evaluation to the next than do earlier accident years between comparable evaluations.
Exhibit 2
Emerged Duration Reached Its Peak in AY 2009
20
30
40
50
60
70
80
90
100
110
120
130
140
150
160
1998 1999 2000 2001 2002 2003 2004 2005 2006 2007 2008 2009 2010 2011 2012
Be
ne
fit
Du
rati
on
Da
ys
Accident Year
120
108
96
84
72
60
54
48
42
36
30
24
18
12
6
Age in Months
Experience through 6/30/2012 Analysis based on sample data provided by carriers for all states except ND, OH, WA, WV, and WY
5
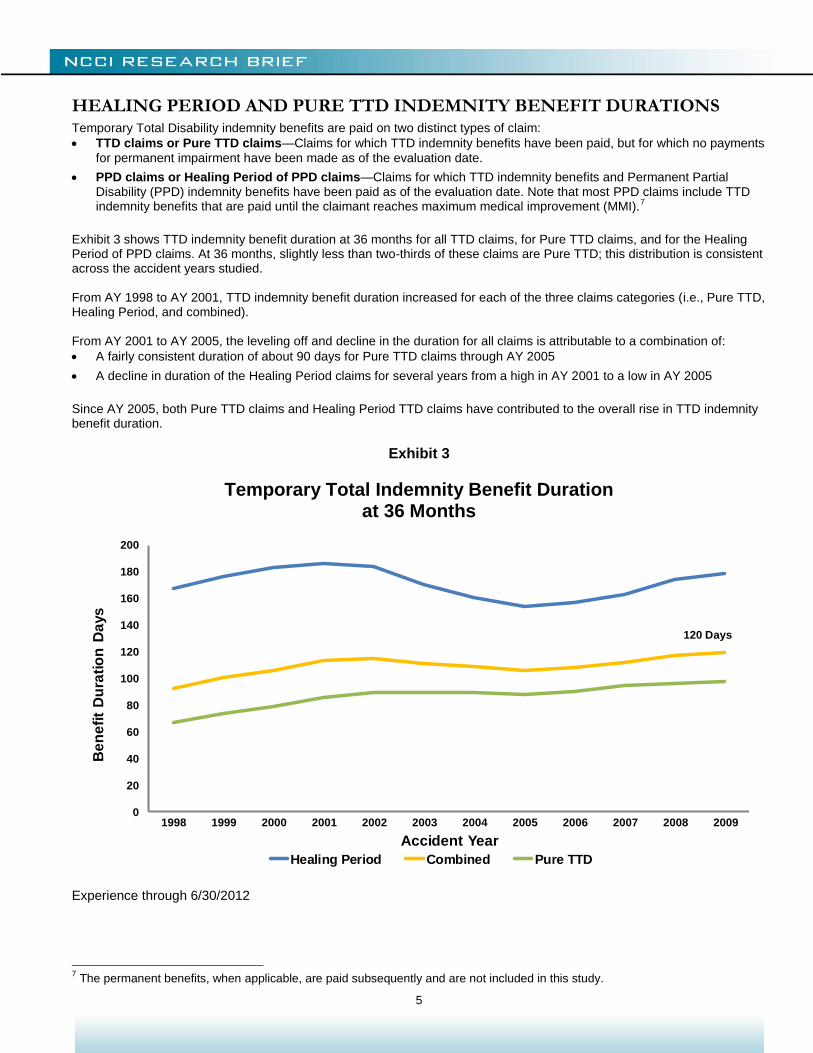
HEALING PERIOD AND PURE TTD INDEMNITY BENEFIT DURATIONS Temporary Total Disability indemnity benefits are paid on two distinct types of claim:
TTD claims or Pure TTD claims—Claims for which TTD indemnity benefits have been paid, but for which no payments
for permanent impairment have been made as of the evaluation date.
PPD claims or Healing Period of PPD claims—Claims for which TTD indemnity benefits and Permanent Partial Disability (PPD) indemnity benefits have been paid as of the evaluation date. Note that most PPD claims include TTD indemnity benefits that are paid until the claimant reaches maximum medical improvement (MMI).
7
Exhibit 3 shows TTD indemnity benefit duration at 36 months for all TTD claims, for Pure TTD claims, and for the Healing Period of PPD claims. At 36 months, slightly less than two-thirds of these claims are Pure TTD; this distribution is consistent across the accident years studied. From AY 1998 to AY 2001, TTD indemnity benefit duration increased for each of the three claims categories (i.e., Pure TTD, Healing Period, and combined). From AY 2001 to AY 2005, the leveling off and decline in the duration for all claims is attributable to a combination of:
A fairly consistent duration of about 90 days for Pure TTD claims through AY 2005
A decline in duration of the Healing Period claims for several years from a high in AY 2001 to a low in AY 2005
Since AY 2005, both Pure TTD claims and Healing Period TTD claims have contributed to the overall rise in TTD indemnity benefit duration.
Exhibit 3
Temporary Total Indemnity Benefit Duration at 36 Months
0
20
40
60
80
100
120
140
160
180
200
1998 1999 2000 2001 2002 2003 2004 2005 2006 2007 2008 2009
Be
ne
fit
Du
rati
on
Da
ys
Accident Year
Healing Period Combined Pure TTD
120 Days
Experience through 6/30/2012
7 The permanent benefits, when applicable, are paid subsequently and are not included in this study.
6
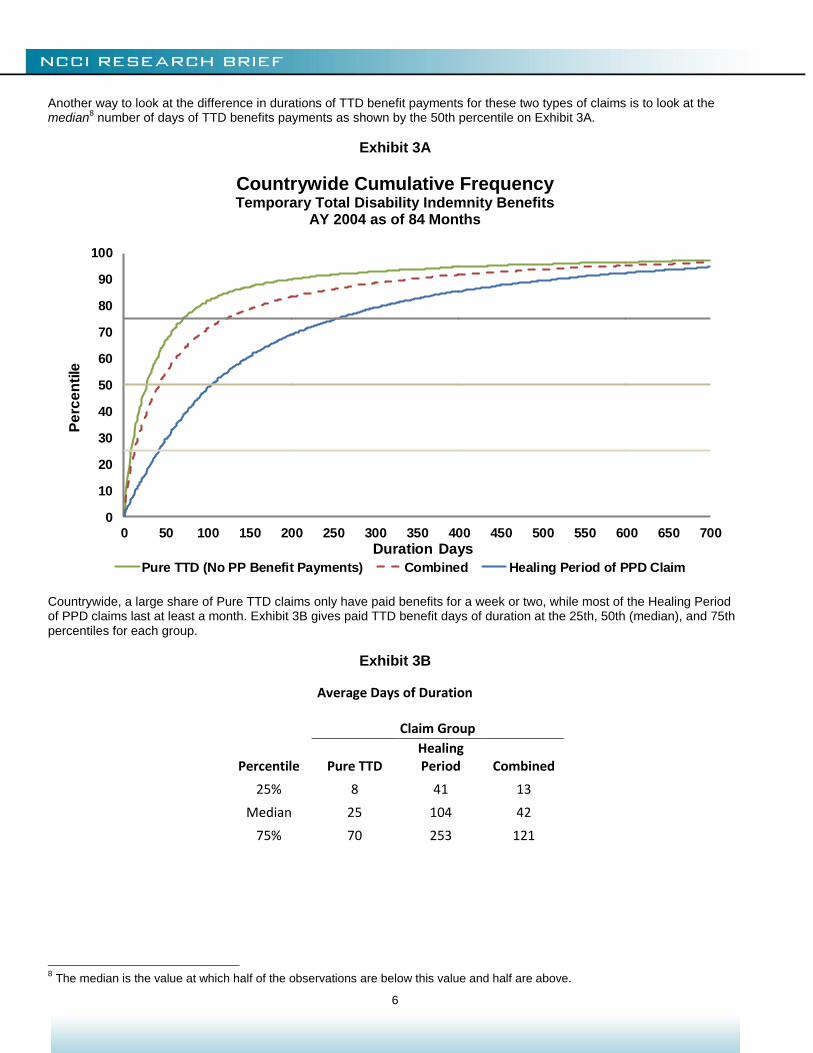
Another way to look at the difference in durations of TTD benefit payments for these two types of claims is to look at the median
8 number of days of TTD benefits payments as shown by the 50th percentile on Exhibit 3A.
Exhibit 3A
Countrywide Cumulative Frequency Temporary Total Disability Indemnity Benefits
AY 2004 as of 84 Months
0
10
20
30
40
50
60
70
80
90
100
0 50 100 150 200 250 300 350 400 450 500 550 600 650 700
Pe
rce
nti
le
Duration Days
Pure TTD (No PP Benefit Payments) Combined Healing Period of PPD Claim
Countrywide, a large share of Pure TTD claims only have paid benefits for a week or two, while most of the Healing Period of PPD claims last at least a month. Exhibit 3B gives paid TTD benefit days of duration at the 25th, 50th (median), and 75th percentiles for each group.
Exhibit 3B
Average Days of Duration
Claim Group
Percentile Pure TTD Healing Period Combined
25% 8 41 13
Median 25 104 42
75% 70 253 121
8 The median is the value at which half of the observations are below this value and half are above.
7
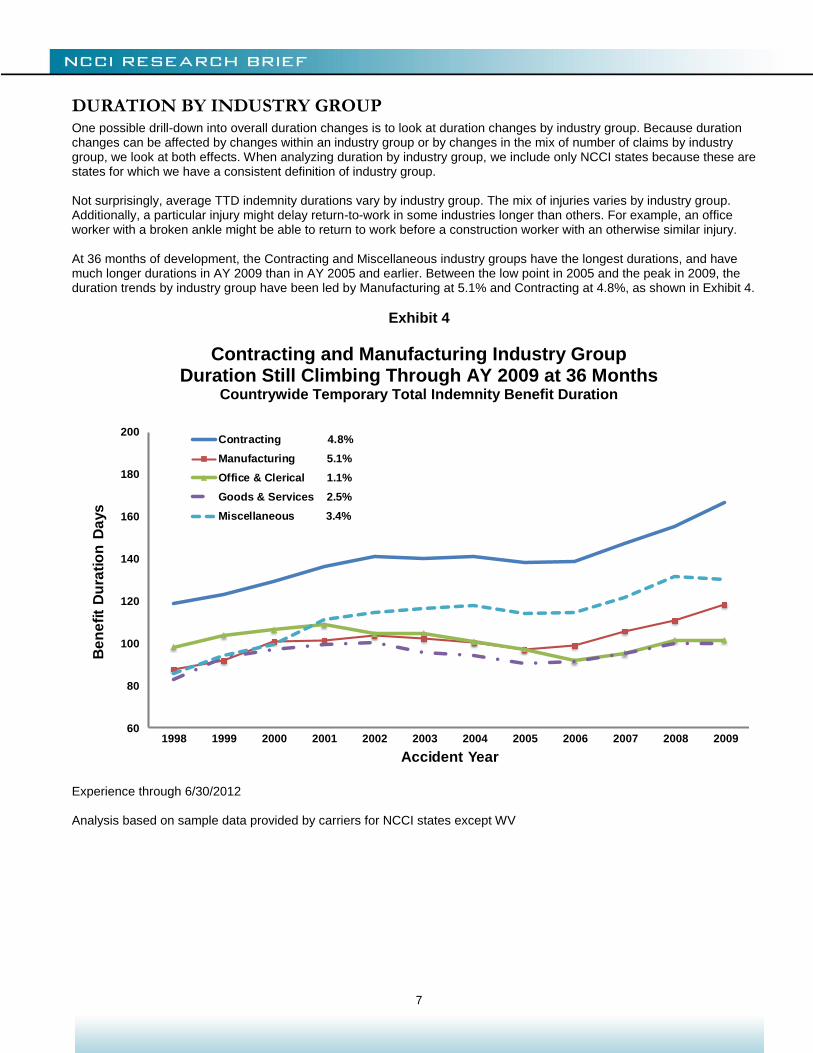
DURATION BY INDUSTRY GROUP One possible drill-down into overall duration changes is to look at duration changes by industry group. Because duration changes can be affected by changes within an industry group or by changes in the mix of number of claims by industry group, we look at both effects. When analyzing duration by industry group, we include only NCCI states because these are states for which we have a consistent definition of industry group. Not surprisingly, average TTD indemnity durations vary by industry group. The mix of injuries varies by industry group. Additionally, a particular injury might delay return-to-work in some industries longer than others. For example, an office worker with a broken ankle might be able to return to work before a construction worker with an otherwise similar injury. At 36 months of development, the Contracting and Miscellaneous industry groups have the longest durations, and have much longer durations in AY 2009 than in AY 2005 and earlier. Between the low point in 2005 and the peak in 2009, the duration trends by industry group have been led by Manufacturing at 5.1% and Contracting at 4.8%, as shown in Exhibit 4.
Exhibit 4
Contracting and Manufacturing Industry Group Duration Still Climbing Through AY 2009 at 36 Months
Countrywide Temporary Total Indemnity Benefit Duration
60
80
100
120
140
160
180
200
1998 1999 2000 2001 2002 2003 2004 2005 2006 2007 2008 2009
Be
ne
fit
Du
rati
on
Da
ys
Accident Year
Contracting 4.8%
Manufacturing 5.1%
Office & Clerical 1.1%
Goods & Services 2.5%
Miscellaneous 3.4%
Experience through 6/30/2012 Analysis based on sample data provided by carriers for NCCI states except WV
8
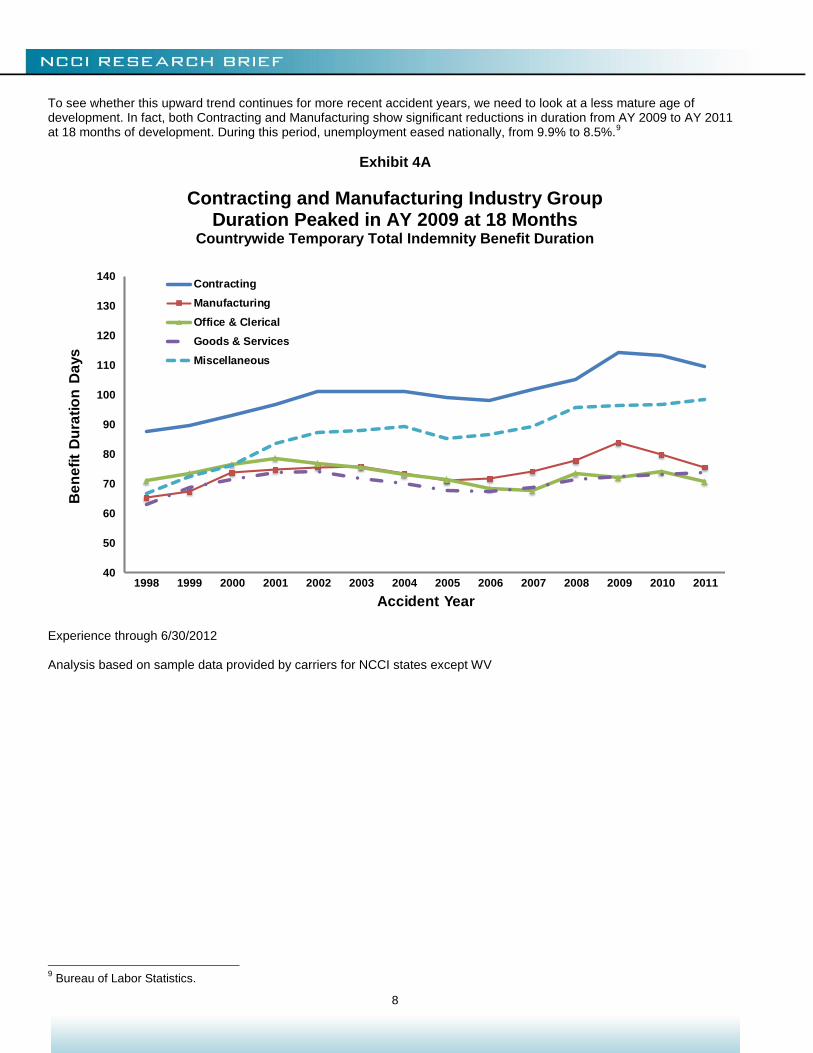
To see whether this upward trend continues for more recent accident years, we need to look at a less mature age of development. In fact, both Contracting and Manufacturing show significant reductions in duration from AY 2009 to AY 2011 at 18 months of development. During this period, unemployment eased nationally, from 9.9% to 8.5%.
9
Exhibit 4A
Contracting and Manufacturing Industry Group Duration Peaked in AY 2009 at 18 Months
Countrywide Temporary Total Indemnity Benefit Duration
40
50
60
70
80
90
100
110
120
130
140
1998 1999 2000 2001 2002 2003 2004 2005 2006 2007 2008 2009 2010 2011
Be
ne
fit
Du
rati
on
Da
ys
Accident Year
Contracting
Manufacturing
Office & Clerical
Goods & Services
Miscellaneous
Experience through 6/30/2012 Analysis based on sample data provided by carriers for NCCI states except WV
9 Bureau of Labor Statistics.
9
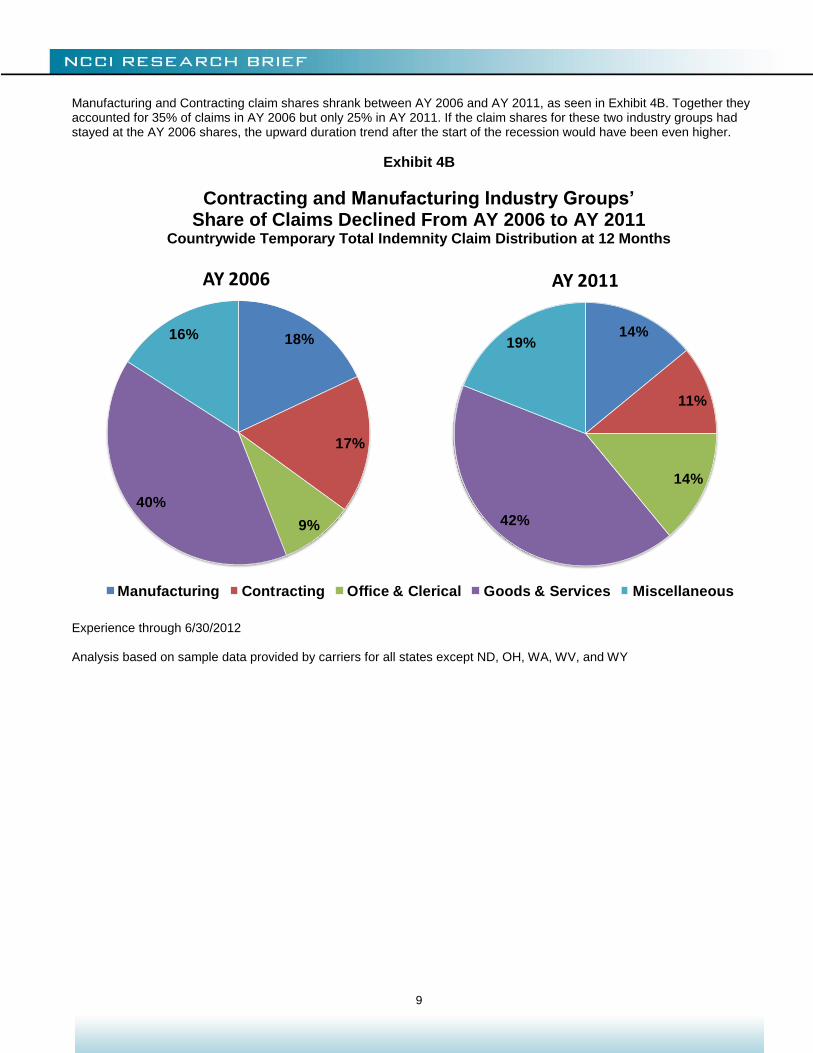
Manufacturing and Contracting claim shares shrank between AY 2006 and AY 2011, as seen in Exhibit 4B. Together they accounted for 35% of claims in AY 2006 but only 25% in AY 2011. If the claim shares for these two industry groups had stayed at the AY 2006 shares, the upward duration trend after the start of the recession would have been even higher.
Exhibit 4B
Contracting and Manufacturing Industry Groups’ Share of Claims Declined From AY 2006 to AY 2011
Countrywide Temporary Total Indemnity Claim Distribution at 12 Months
18%
17%
9%
40%
16%
AY 2006
Manufacturing Contracting Office & Clerical Goods & Services Miscellaneous
Experience through 6/30/2012 Analysis based on sample data provided by carriers for all states except ND, OH, WA, WV, and WY
14%
11%
14%
42%
19%
AY 2011
10
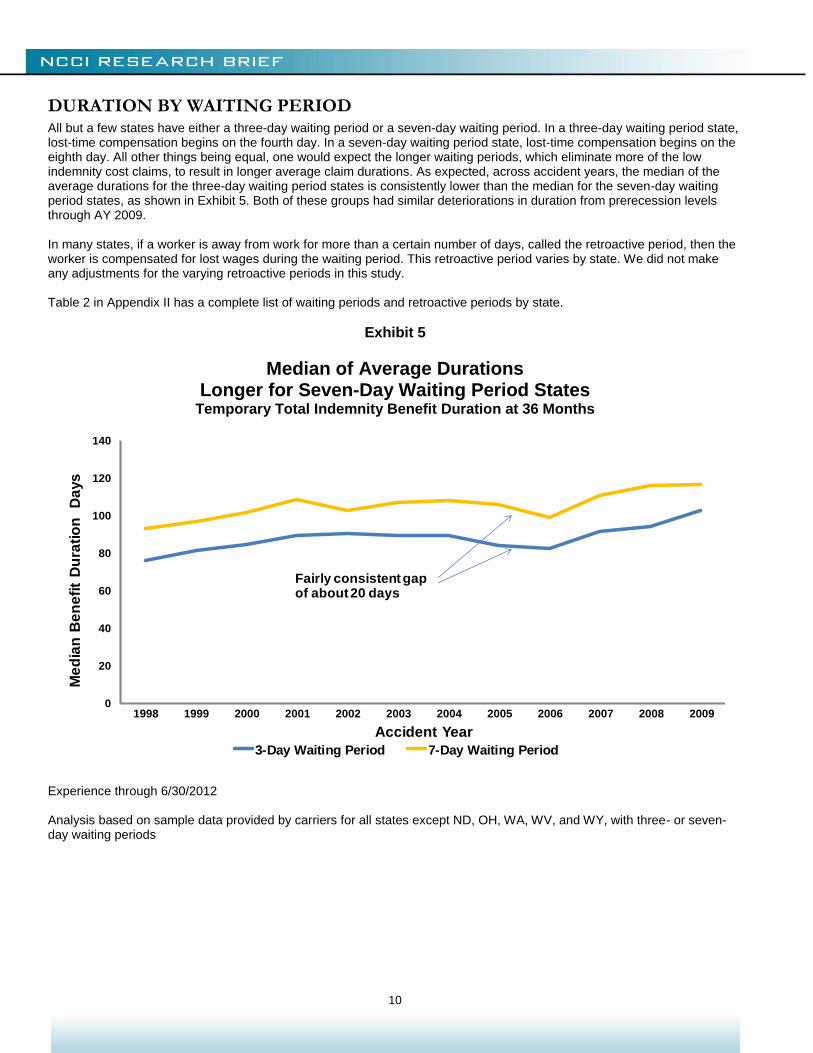
DURATION BY WAITING PERIOD All but a few states have either a three-day waiting period or a seven-day waiting period. In a three-day waiting period state, lost-time compensation begins on the fourth day. In a seven-day waiting period state, lost-time compensation begins on the eighth day. All other things being equal, one would expect the longer waiting periods, which eliminate more of the low indemnity cost claims, to result in longer average claim durations. As expected, across accident years, the median of the average durations for the three-day waiting period states is consistently lower than the median for the seven-day waiting period states, as shown in Exhibit 5. Both of these groups had similar deteriorations in duration from prerecession levels through AY 2009. In many states, if a worker is away from work for more than a certain number of days, called the retroactive period, then the worker is compensated for lost wages during the waiting period. This retroactive period varies by state. We did not make any adjustments for the varying retroactive periods in this study. Table 2 in Appendix II has a complete list of waiting periods and retroactive periods by state.
Exhibit 5
Median of Average Durations Longer for Seven-Day Waiting Period States
Temporary Total Indemnity Benefit Duration at 36 Months
0
20
40
60
80
100
120
140
1998 1999 2000 2001 2002 2003 2004 2005 2006 2007 2008 2009
Me
dia
n B
en
efi
t D
ura
tio
n
Da
ys
Accident Year
3-Day Waiting Period 7-Day Waiting Period
Fairly consistent gap of about 20 days
Experience through 6/30/2012 Analysis based on sample data provided by carriers for all states except ND, OH, WA, WV, and WY, with three- or seven-day waiting periods
11
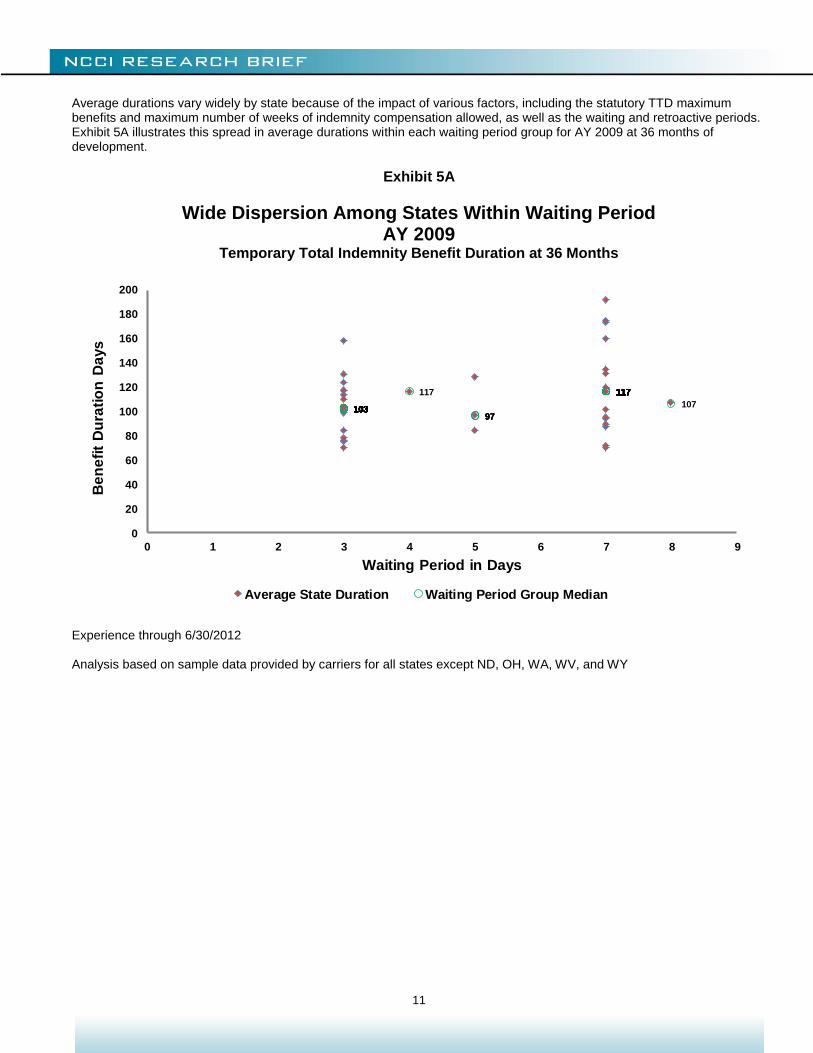
Average durations vary widely by state because of the impact of various factors, including the statutory TTD maximum benefits and maximum number of weeks of indemnity compensation allowed, as well as the waiting and retroactive periods. Exhibit 5A illustrates this spread in average durations within each waiting period group for AY 2009 at 36 months of development.
Exhibit 5A
Wide Dispersion Among States Within Waiting Period AY 2009
Temporary Total Indemnity Benefit Duration at 36 Months
103103103103103103103103103103103103103103
117
979797
117117117117117117117117117117117117117117117117
107
0
20
40
60
80
100
120
140
160
180
200
0 1 2 3 4 5 6 7 8 9
Be
ne
fit
Du
rati
on
Da
ys
Waiting Period in Days
Average State Duration Waiting Period Group Median
Experience through 6/30/2012 Analysis based on sample data provided by carriers for all states except ND, OH, WA, WV, and WY
12
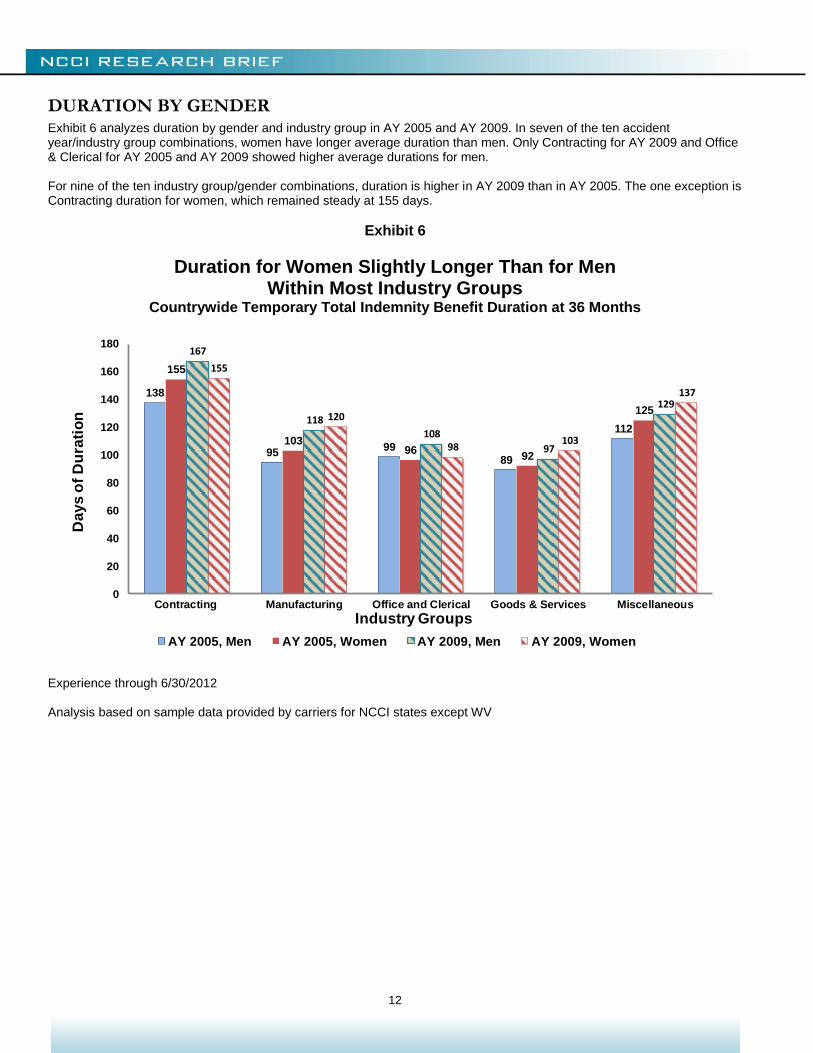
DURATION BY GENDER Exhibit 6 analyzes duration by gender and industry group in AY 2005 and AY 2009. In seven of the ten accident year/industry group combinations, women have longer average duration than men. Only Contracting for AY 2009 and Office & Clerical for AY 2005 and AY 2009 showed higher average durations for men. For nine of the ten industry group/gender combinations, duration is higher in AY 2009 than in AY 2005. The one exception is Contracting duration for women, which remained steady at 155 days.
Exhibit 6
Duration for Women Slightly Longer Than for Men Within Most Industry Groups
Countrywide Temporary Total Indemnity Benefit Duration at 36 Months
138
9599
89
112
155
10396
92
125
167
118108
97
129
155
120
98103
137
0
20
40
60
80
100
120
140
160
180
Contracting Manufacturing Office and Clerical Goods & Services Miscellaneous
Da
ys
of
Du
rati
on
Industry Groups
AY 2005, Men AY 2005, Women AY 2009, Men AY 2009, Women
Experience through 6/30/2012 Analysis based on sample data provided by carriers for NCCI states except WV
13
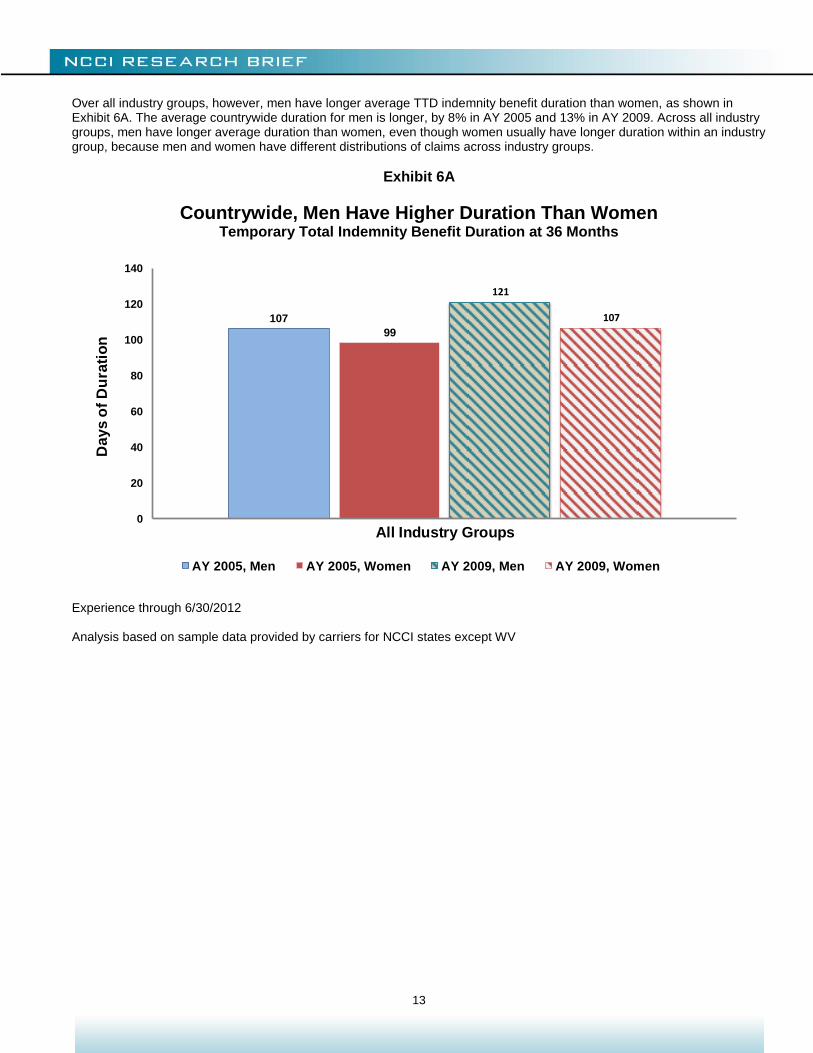
Over all industry groups, however, men have longer average TTD indemnity benefit duration than women, as shown in Exhibit 6A. The average countrywide duration for men is longer, by 8% in AY 2005 and 13% in AY 2009. Across all industry groups, men have longer average duration than women, even though women usually have longer duration within an industry group, because men and women have different distributions of claims across industry groups.
Exhibit 6A
Countrywide, Men Have Higher Duration Than Women Temporary Total Indemnity Benefit Duration at 36 Months
107
99
121
107
0
20
40
60
80
100
120
140
All Industry Groups
Da
ys
of
Du
rati
on
AY 2005, Men AY 2005, Women AY 2009, Men AY 2009, Women
Experience through 6/30/2012 Analysis based on sample data provided by carriers for NCCI states except WV
14
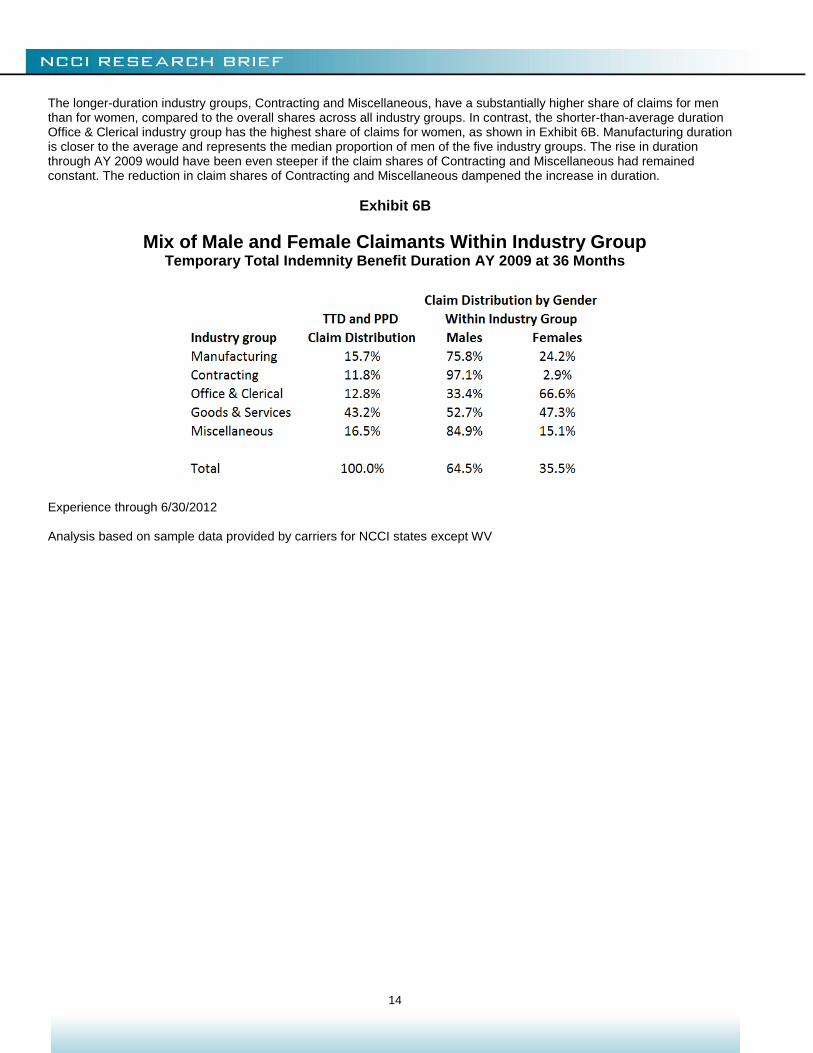
The longer-duration industry groups, Contracting and Miscellaneous, have a substantially higher share of claims for men than for women, compared to the overall shares across all industry groups. In contrast, the shorter-than-average duration Office & Clerical industry group has the highest share of claims for women, as shown in Exhibit 6B. Manufacturing duration is closer to the average and represents the median proportion of men of the five industry groups. The rise in duration through AY 2009 would have been even steeper if the claim shares of Contracting and Miscellaneous had remained constant. The reduction in claim shares of Contracting and Miscellaneous dampened the increase in duration.
Exhibit 6B
Mix of Male and Female Claimants Within Industry Group Temporary Total Indemnity Benefit Duration AY 2009 at 36 Months
Experience through 6/30/2012 Analysis based on sample data provided by carriers for NCCI states except WV
15
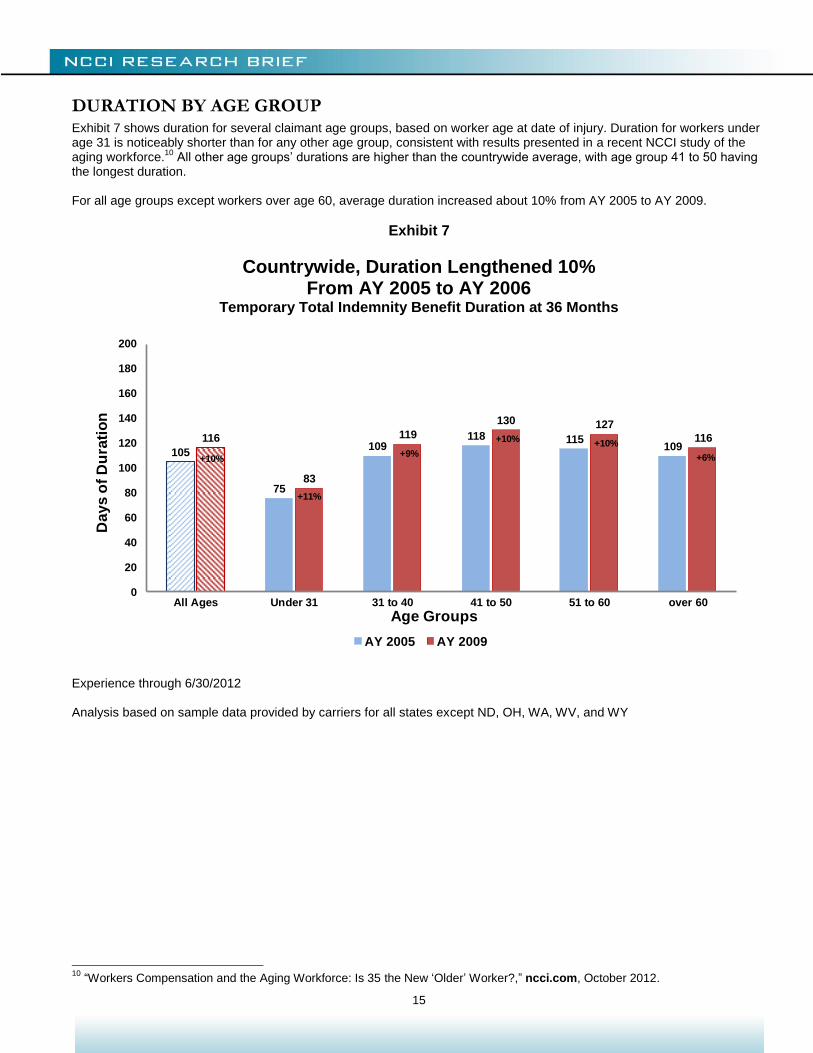
DURATION BY AGE GROUP Exhibit 7 shows duration for several claimant age groups, based on worker age at date of injury. Duration for workers under age 31 is noticeably shorter than for any other age group, consistent with results presented in a recent NCCI study of the aging workforce.
10 All other age groups’ durations are higher than the countrywide average, with age group 41 to 50 having
the longest duration. For all age groups except workers over age 60, average duration increased about 10% from AY 2005 to AY 2009.
Exhibit 7
Countrywide, Duration Lengthened 10% From AY 2005 to AY 2006
Temporary Total Indemnity Benefit Duration at 36 Months
Experience through 6/30/2012 Analysis based on sample data provided by carriers for all states except ND, OH, WA, WV, and WY
10
“Workers Compensation and the Aging Workforce: Is 35 the New ‘Older’ Worker?,” ncci.com, October 2012.
105
75
109118 115
109116
83
119
130 127
116
0
20
40
60
80
100
120
140
160
180
200
All Ages Under 31 31 to 40 41 to 50 51 to 60 over 60
Da
ys
of
Du
rati
on
Age Groups
AY 2005 AY 2009
+10%
+11%
+9%
+10% +10%
+6%
16
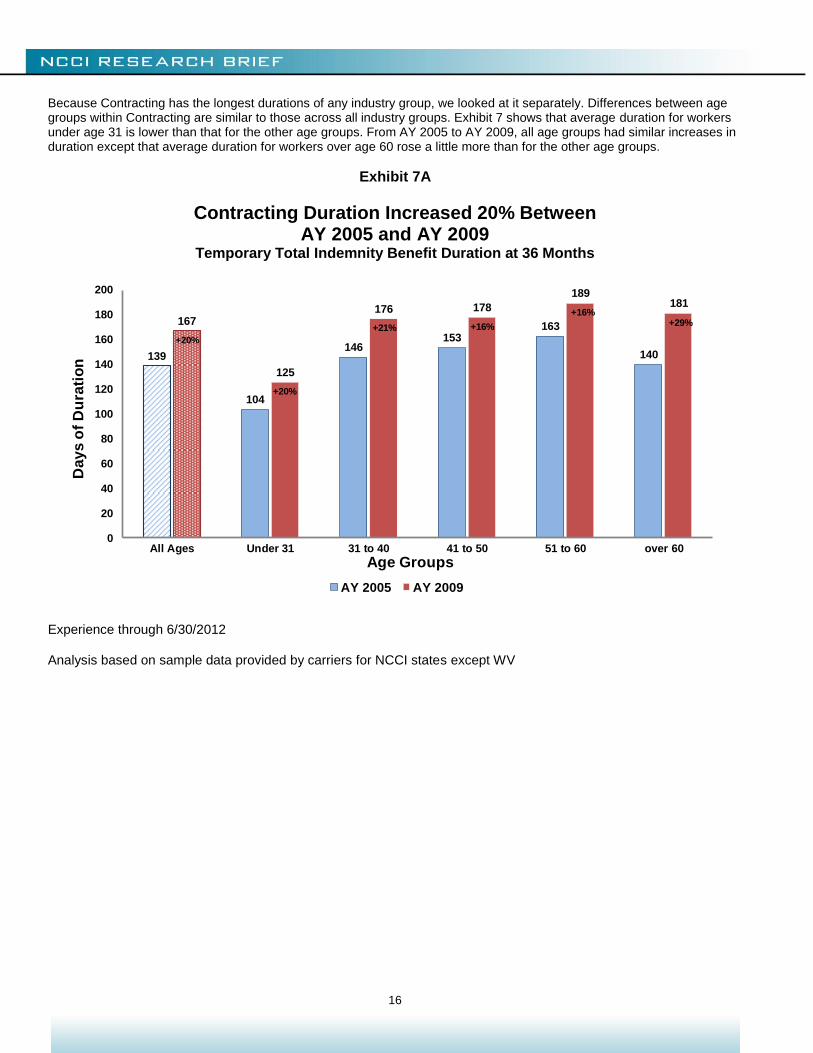
Because Contracting has the longest durations of any industry group, we looked at it separately. Differences between age groups within Contracting are similar to those across all industry groups. Exhibit 7 shows that average duration for workers under age 31 is lower than that for the other age groups. From AY 2005 to AY 2009, all age groups had similar increases in duration except that average duration for workers over age 60 rose a little more than for the other age groups.
Exhibit 7A
Contracting Duration Increased 20% Between AY 2005 and AY 2009
Temporary Total Indemnity Benefit Duration at 36 Months
139
104
146153
163
140
167
125
176 178
189181
0
20
40
60
80
100
120
140
160
180
200
All Ages Under 31 31 to 40 41 to 50 51 to 60 over 60
Days o
f D
ura
tio
n
Age Groups
AY 2005 AY 2009
+20%
+20%
+21% +16%
+16%+29%
Experience through 6/30/2012 Analysis based on sample data provided by carriers for NCCI states except WV
17
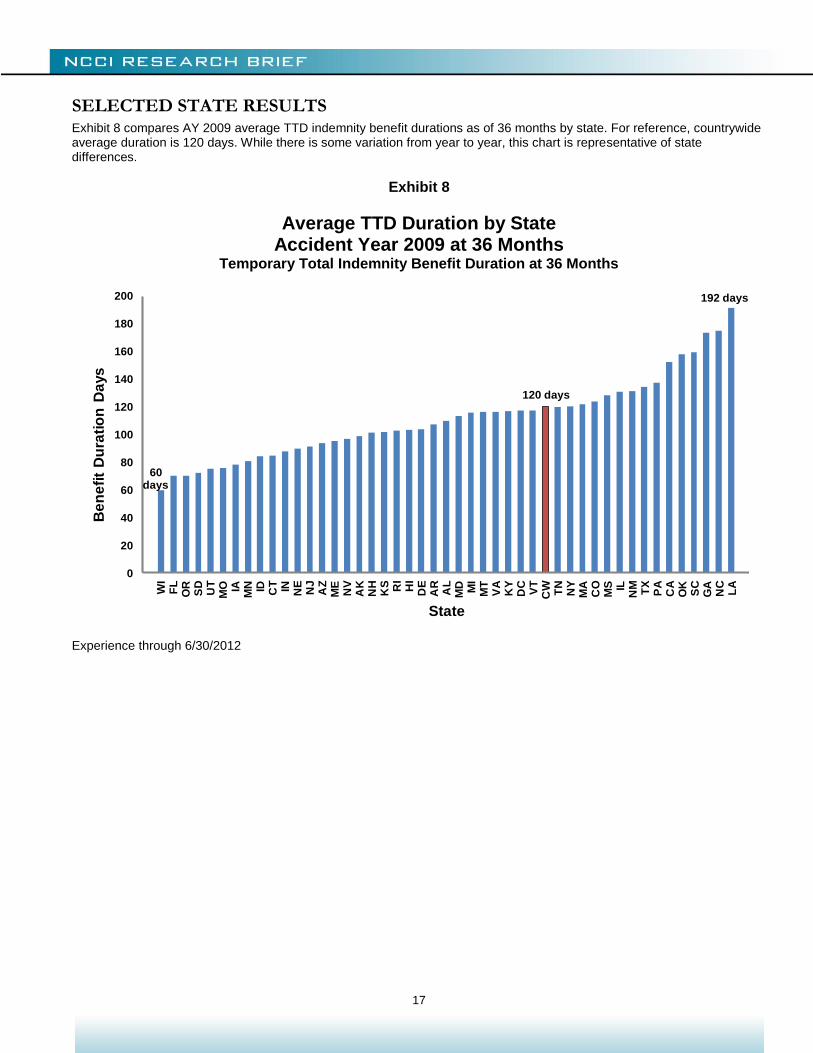
SELECTED STATE RESULTS Exhibit 8 compares AY 2009 average TTD indemnity benefit durations as of 36 months by state. For reference, countrywide average duration is 120 days. While there is some variation from year to year, this chart is representative of state differences.
Exhibit 8
Average TTD Duration by State Accident Year 2009 at 36 Months
Temporary Total Indemnity Benefit Duration at 36 Months
60days
120 days
192 days
0
20
40
60
80
100
120
140
160
180
200
WI
FL
OR
SD
UT
MO IA
MN ID CT IN NE
NJ
AZ
ME
NV
AK
NH
KS RI
HI
DE
AR
AL
MD MI
MT
VA
KY
DC
VT
CW TN
NY
MA
CO
MS IL
NM
TX
PA
CA
OK
SC
GA
NC
LA
Be
ne
fit
Du
rati
on
Da
ys
State
Experience through 6/30/2012
18
Average duration for a given state is influenced by the state benefit structure, regulatory and judicial environments, and the efficiency of claim systems. One possible benefit structure difference between states is the waiting period—the first few days of lost time prior to eligibility for workers compensation indemnity benefits. Most states also have a retroactive period. When an injured worker is disabled longer than the retroactive period, the waiting period is reimbursed. Table 2 in Appendix II displays the waiting period and retroactive period, and the maximum TTD and PPD indemnity benefits by state.
11
The contribution to each state’s average TTD duration of (1) Pure TTD and (2) the Healing Period of a PPD claim varies considerably. Table 3 in Appendix II displays these average durations for all states studied. In some states, a sizable portion of claims have been awarded a PPD rating by 36 months, resulting in an average value that is between the Pure TTD and Healing Period average durations (see Florida for an example). In other states, almost all claims are Pure TTD as of 36 months, resulting in an overall average duration that is very close to the average duration of Pure TTD claims (see Virginia and Louisiana as examples). The remainder of this section provides comments on duration in larger premium volume states. We have ordered these selected states by duration, based on the AY 2009 duration at 36 months. The states with the shortest duration, beginning with Florida, are first. The states reviewed are:
Florida
Missouri
Virginia
Illinois
Oklahoma
Georgia
Louisiana
For each state, two exhibits are included. The first exhibit shows duration by accident year at the several points in time and, hence, shows how duration develops incrementally in the state. The second exhibit shows durations for Pure TTD and Healing Period of PPD at 36 months.
11
The waiting and retroactive periods, as well as maximum statutory benefits, are compiled in NCCI’s 2012 Annual Statistical Bulletin, Exhibit 7, “Benefit Provisions.”
19
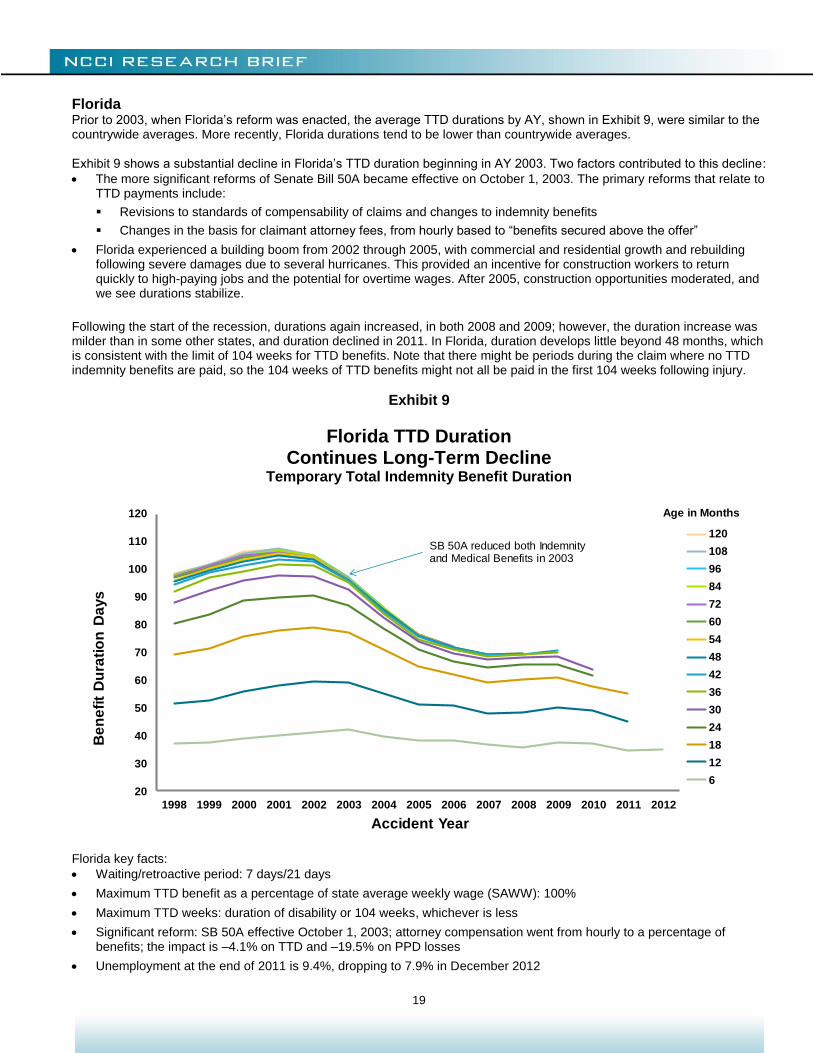
Florida Prior to 2003, when Florida’s reform was enacted, the average TTD durations by AY, shown in Exhibit 9, were similar to the countrywide averages. More recently, Florida durations tend to be lower than countrywide averages. Exhibit 9 shows a substantial decline in Florida’s TTD duration beginning in AY 2003. Two factors contributed to this decline:
The more significant reforms of Senate Bill 50A became effective on October 1, 2003. The primary reforms that relate to TTD payments include:
Revisions to standards of compensability of claims and changes to indemnity benefits
Changes in the basis for claimant attorney fees, from hourly based to “benefits secured above the offer”
Florida experienced a building boom from 2002 through 2005, with commercial and residential growth and rebuilding following severe damages due to several hurricanes. This provided an incentive for construction workers to return quickly to high-paying jobs and the potential for overtime wages. After 2005, construction opportunities moderated, and we see durations stabilize.
Following the start of the recession, durations again increased, in both 2008 and 2009; however, the duration increase was milder than in some other states, and duration declined in 2011. In Florida, duration develops little beyond 48 months, which is consistent with the limit of 104 weeks for TTD benefits. Note that there might be periods during the claim where no TTD indemnity benefits are paid, so the 104 weeks of TTD benefits might not all be paid in the first 104 weeks following injury.
Exhibit 9
Florida TTD Duration Continues Long-Term Decline
Temporary Total Indemnity Benefit Duration
20
30
40
50
60
70
80
90
100
110
120
1998 1999 2000 2001 2002 2003 2004 2005 2006 2007 2008 2009 2010 2011 2012
Be
ne
fit
Du
rati
on
Da
ys
Accident Year
120
108
96
84
72
60
54
48
42
36
30
24
18
12
6
Age in Months
SB 50A reduced both Indemnity and Medical Benefits in 2003
Florida key facts:
Waiting/retroactive period: 7 days/21 days
Maximum TTD benefit as a percentage of state average weekly wage (SAWW): 100%
Maximum TTD weeks: duration of disability or 104 weeks, whichever is less
Significant reform: SB 50A effective October 1, 2003; attorney compensation went from hourly to a percentage of benefits; the impact is –4.1% on TTD and –19.5% on PPD losses
Unemployment at the end of 2011 is 9.4%, dropping to 7.9% in December 2012
20
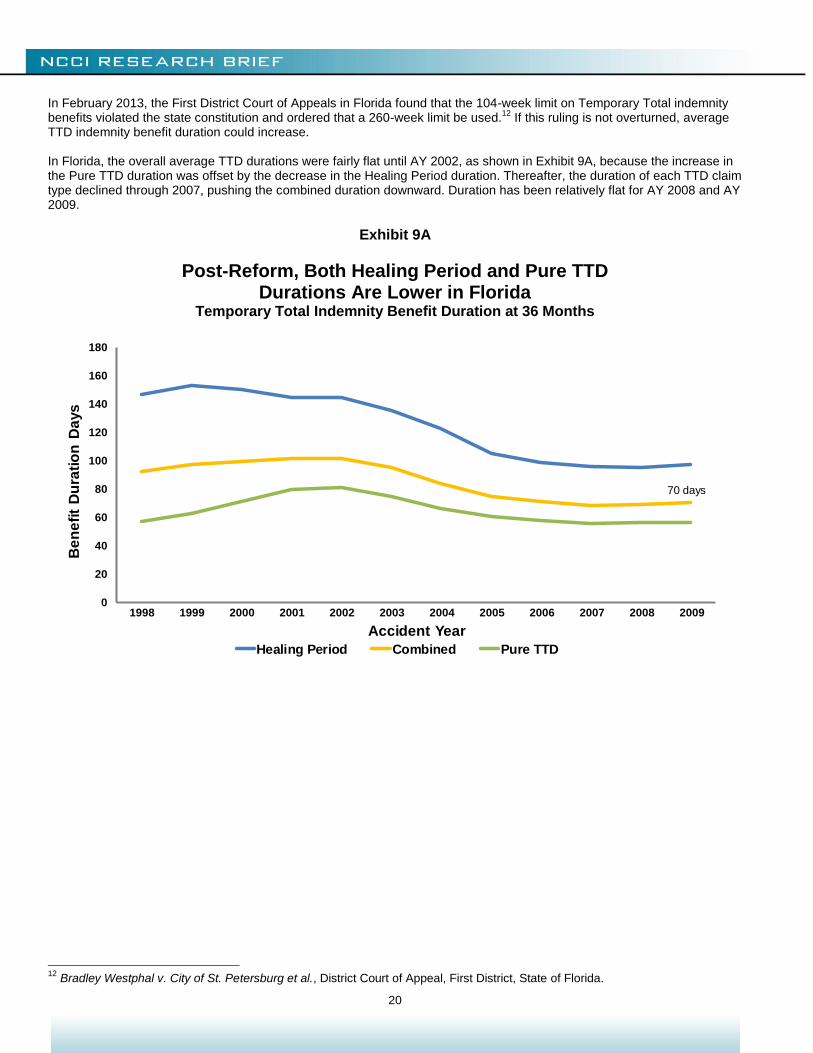
In February 2013, the First District Court of Appeals in Florida found that the 104-week limit on Temporary Total indemnity benefits violated the state constitution and ordered that a 260-week limit be used.
12 If this ruling is not overturned, average
TTD indemnity benefit duration could increase. In Florida, the overall average TTD durations were fairly flat until AY 2002, as shown in Exhibit 9A, because the increase in the Pure TTD duration was offset by the decrease in the Healing Period duration. Thereafter, the duration of each TTD claim type declined through 2007, pushing the combined duration downward. Duration has been relatively flat for AY 2008 and AY 2009.
Exhibit 9A
Post-Reform, Both Healing Period and Pure TTD Durations Are Lower in Florida
Temporary Total Indemnity Benefit Duration at 36 Months
0
20
40
60
80
100
120
140
160
180
1998 1999 2000 2001 2002 2003 2004 2005 2006 2007 2008 2009
Be
ne
fit
Du
rati
on
Da
ys
Accident Year
Healing Period Combined Pure TTD
70 days
12
Bradley Westphal v. City of St. Petersburg et al., District Court of Appeal, First District, State of Florida.
21
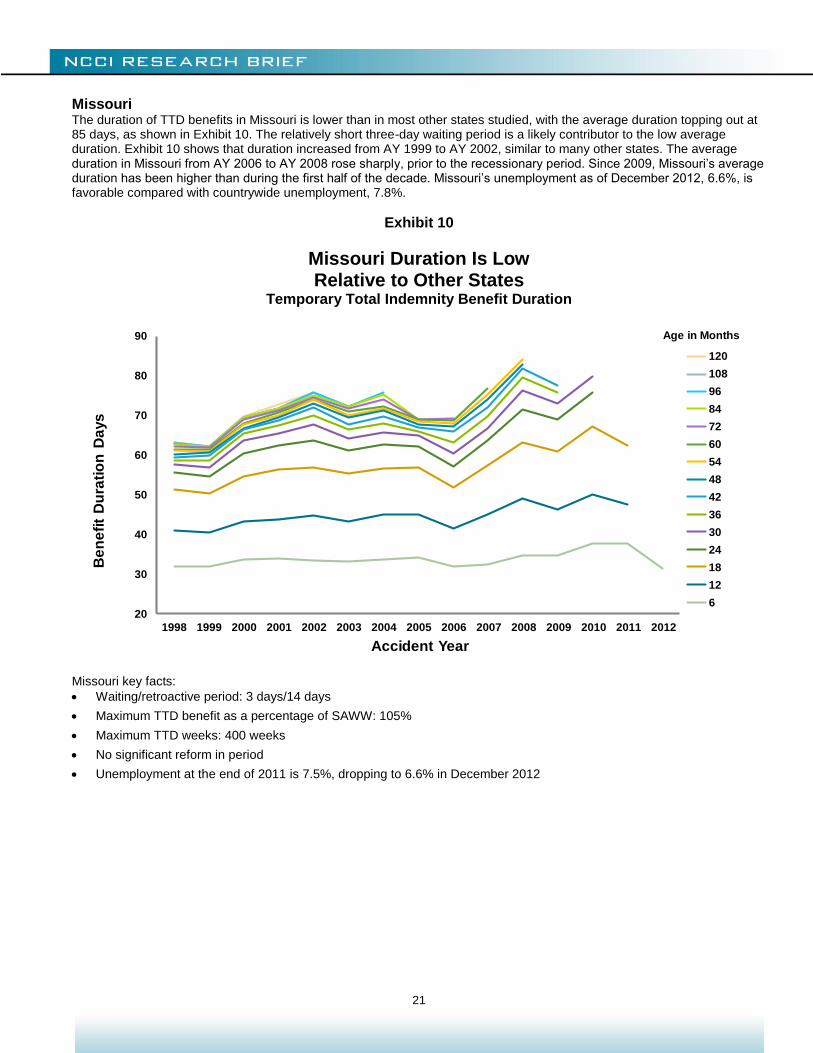
Missouri The duration of TTD benefits in Missouri is lower than in most other states studied, with the average duration topping out at 85 days, as shown in Exhibit 10. The relatively short three-day waiting period is a likely contributor to the low average duration. Exhibit 10 shows that duration increased from AY 1999 to AY 2002, similar to many other states. The average duration in Missouri from AY 2006 to AY 2008 rose sharply, prior to the recessionary period. Since 2009, Missouri’s average duration has been higher than during the first half of the decade. Missouri’s unemployment as of December 2012, 6.6%, is favorable compared with countrywide unemployment, 7.8%.
Exhibit 10
Missouri Duration Is Low Relative to Other States
Temporary Total Indemnity Benefit Duration
20
30
40
50
60
70
80
90
1998 1999 2000 2001 2002 2003 2004 2005 2006 2007 2008 2009 2010 2011 2012
Be
ne
fit
Du
rati
on
Da
ys
Accident Year
120
108
96
84
72
60
54
48
42
36
30
24
18
12
6
Age in Months
Missouri key facts:
Waiting/retroactive period: 3 days/14 days
Maximum TTD benefit as a percentage of SAWW: 105%
Maximum TTD weeks: 400 weeks
No significant reform in period
Unemployment at the end of 2011 is 7.5%, dropping to 6.6% in December 2012
22
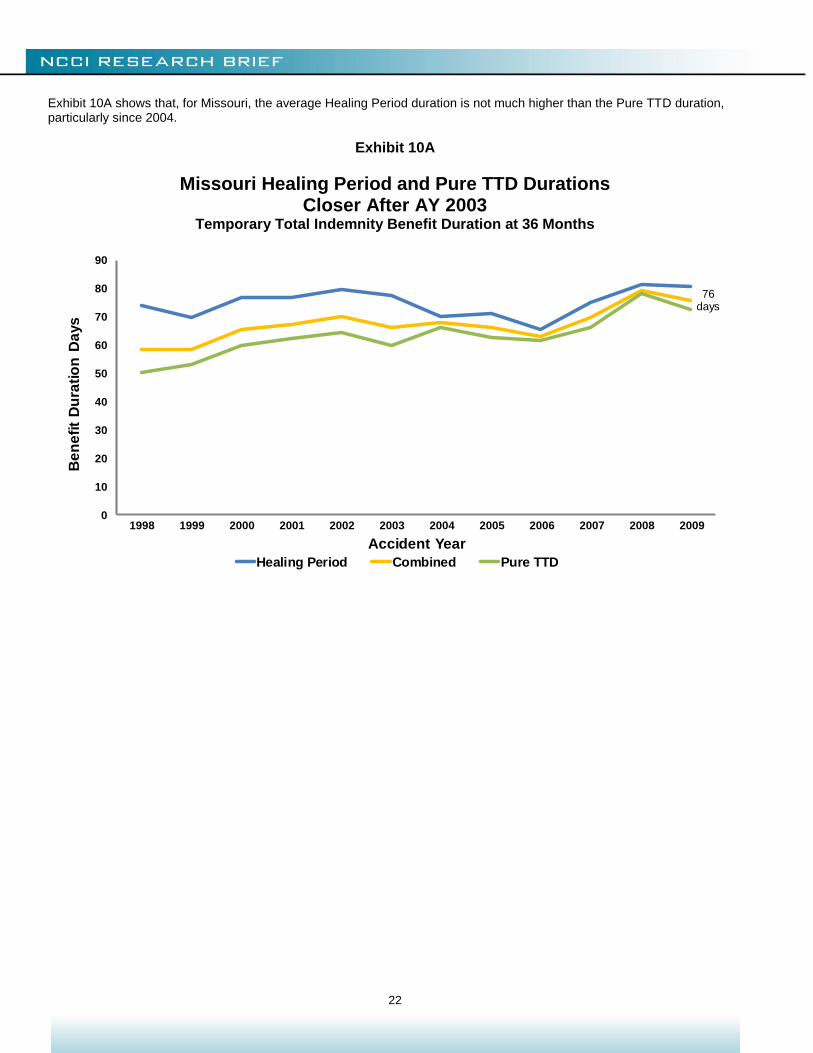
Exhibit 10A shows that, for Missouri, the average Healing Period duration is not much higher than the Pure TTD duration, particularly since 2004.
Exhibit 10A
Missouri Healing Period and Pure TTD Durations Closer After AY 2003
Temporary Total Indemnity Benefit Duration at 36 Months
0
10
20
30
40
50
60
70
80
90
1998 1999 2000 2001 2002 2003 2004 2005 2006 2007 2008 2009
Be
ne
fit
Du
rati
on
Da
ys
Accident Year
Healing Period Combined Pure TTD
76 days
23
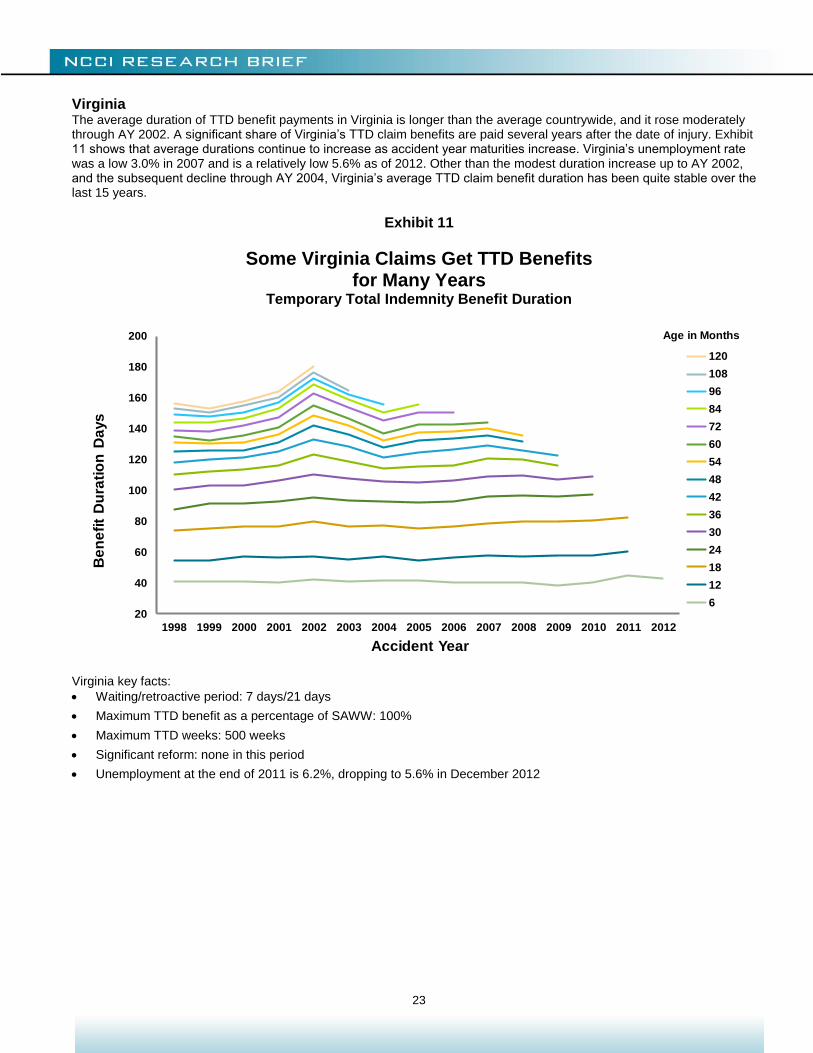
Virginia The average duration of TTD benefit payments in Virginia is longer than the average countrywide, and it rose moderately through AY 2002. A significant share of Virginia’s TTD claim benefits are paid several years after the date of injury. Exhibit 11 shows that average durations continue to increase as accident year maturities increase. Virginia’s unemployment rate was a low 3.0% in 2007 and is a relatively low 5.6% as of 2012. Other than the modest duration increase up to AY 2002, and the subsequent decline through AY 2004, Virginia’s average TTD claim benefit duration has been quite stable over the last 15 years.
Exhibit 11
Some Virginia Claims Get TTD Benefits for Many Years
Temporary Total Indemnity Benefit Duration
20
40
60
80
100
120
140
160
180
200
1998 1999 2000 2001 2002 2003 2004 2005 2006 2007 2008 2009 2010 2011 2012
Be
ne
fit
Du
rati
on
Da
ys
Accident Year
120
108
96
84
72
60
54
48
42
36
30
24
18
12
6
Age in Months
Virginia key facts:
Waiting/retroactive period: 7 days/21 days
Maximum TTD benefit as a percentage of SAWW: 100%
Maximum TTD weeks: 500 weeks
Significant reform: none in this period
Unemployment at the end of 2011 is 6.2%, dropping to 5.6% in December 2012
24
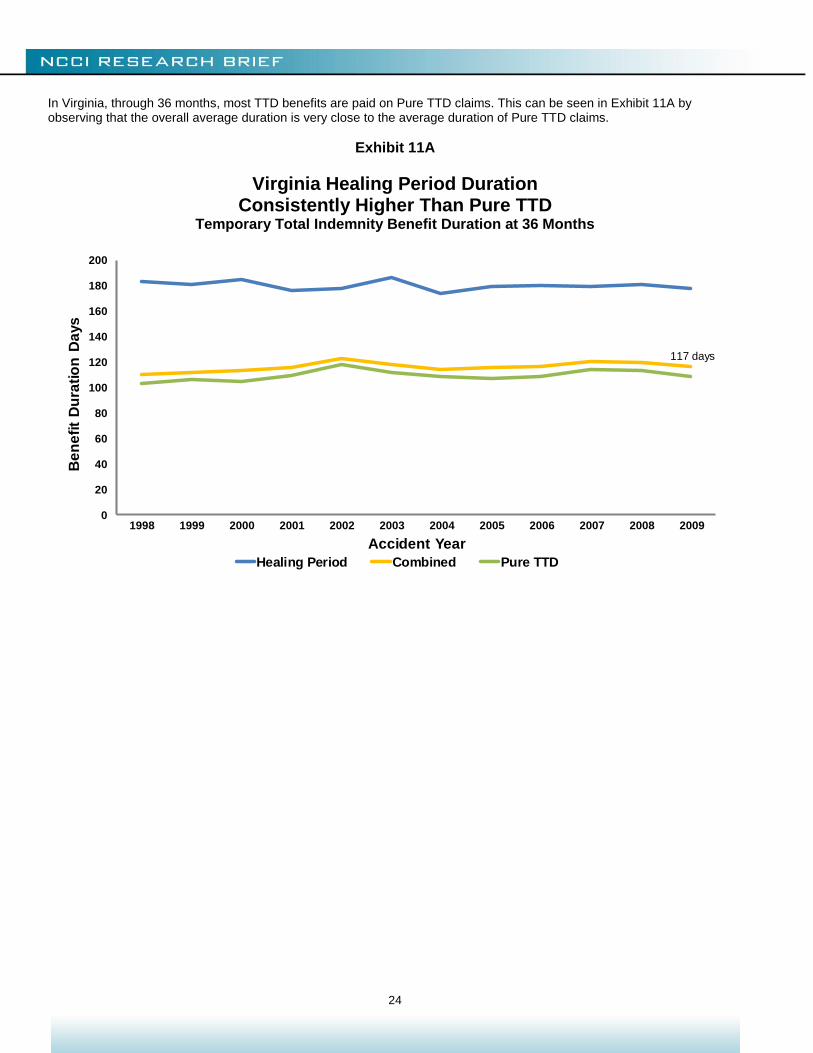
In Virginia, through 36 months, most TTD benefits are paid on Pure TTD claims. This can be seen in Exhibit 11A by observing that the overall average duration is very close to the average duration of Pure TTD claims.
Exhibit 11A
Virginia Healing Period Duration Consistently Higher Than Pure TTD
Temporary Total Indemnity Benefit Duration at 36 Months
0
20
40
60
80
100
120
140
160
180
200
1998 1999 2000 2001 2002 2003 2004 2005 2006 2007 2008 2009
Be
ne
fit
Du
rati
on
Da
ys
Accident Year
Healing Period Combined Pure TTD
117 days
25
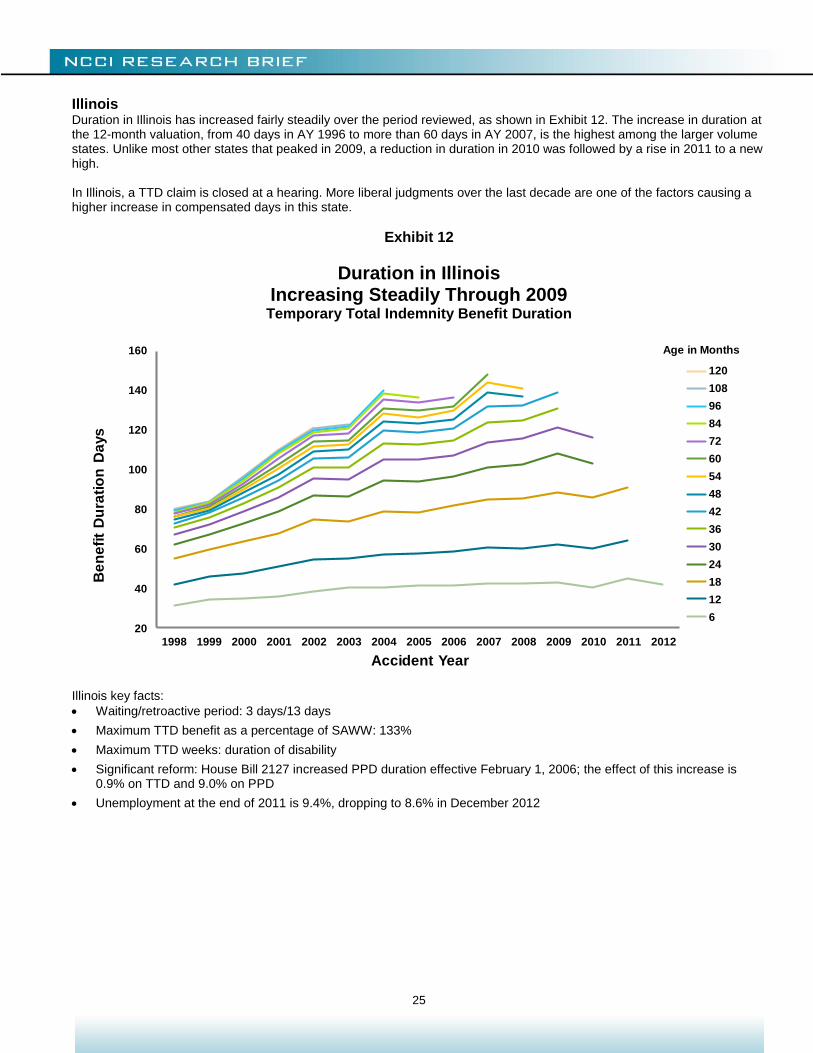
Illinois Duration in Illinois has increased fairly steadily over the period reviewed, as shown in Exhibit 12. The increase in duration at the 12-month valuation, from 40 days in AY 1996 to more than 60 days in AY 2007, is the highest among the larger volume states. Unlike most other states that peaked in 2009, a reduction in duration in 2010 was followed by a rise in 2011 to a new high. In Illinois, a TTD claim is closed at a hearing. More liberal judgments over the last decade are one of the factors causing a higher increase in compensated days in this state.
Exhibit 12
Duration in Illinois Increasing Steadily Through 2009
Temporary Total Indemnity Benefit Duration
20
40
60
80
100
120
140
160
1998 1999 2000 2001 2002 2003 2004 2005 2006 2007 2008 2009 2010 2011 2012
Be
ne
fit
Du
rati
on
Da
ys
Accident Year
120
108
96
84
72
60
54
48
42
36
30
24
18
12
6
Age in Months
Illinois key facts:
Waiting/retroactive period: 3 days/13 days
Maximum TTD benefit as a percentage of SAWW: 133%
Maximum TTD weeks: duration of disability
Significant reform: House Bill 2127 increased PPD duration effective February 1, 2006; the effect of this increase is 0.9% on TTD and 9.0% on PPD
Unemployment at the end of 2011 is 9.4%, dropping to 8.6% in December 2012
26
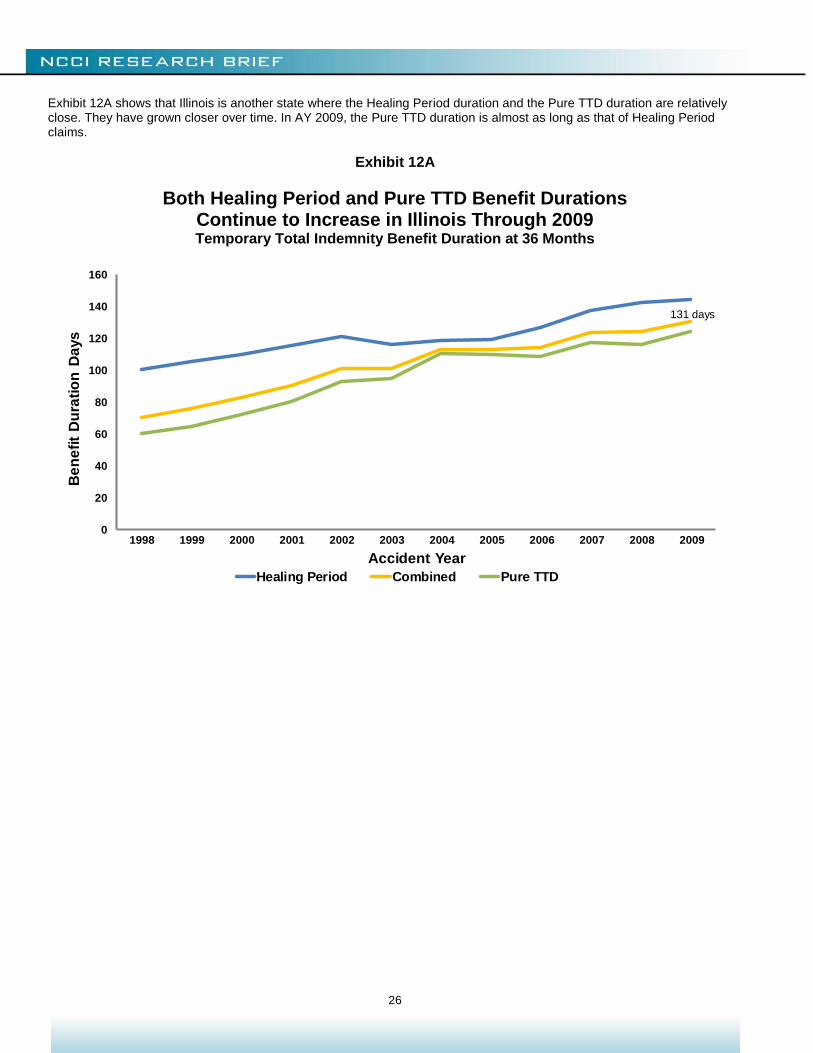
Exhibit 12A shows that Illinois is another state where the Healing Period duration and the Pure TTD duration are relatively close. They have grown closer over time. In AY 2009, the Pure TTD duration is almost as long as that of Healing Period claims.
Exhibit 12A
Both Healing Period and Pure TTD Benefit Durations Continue to Increase in Illinois Through 2009 Temporary Total Indemnity Benefit Duration at 36 Months
0
20
40
60
80
100
120
140
160
1998 1999 2000 2001 2002 2003 2004 2005 2006 2007 2008 2009
Be
ne
fit
Du
rati
on
Da
ys
Accident Year
Healing Period Combined Pure TTD
131 days
27
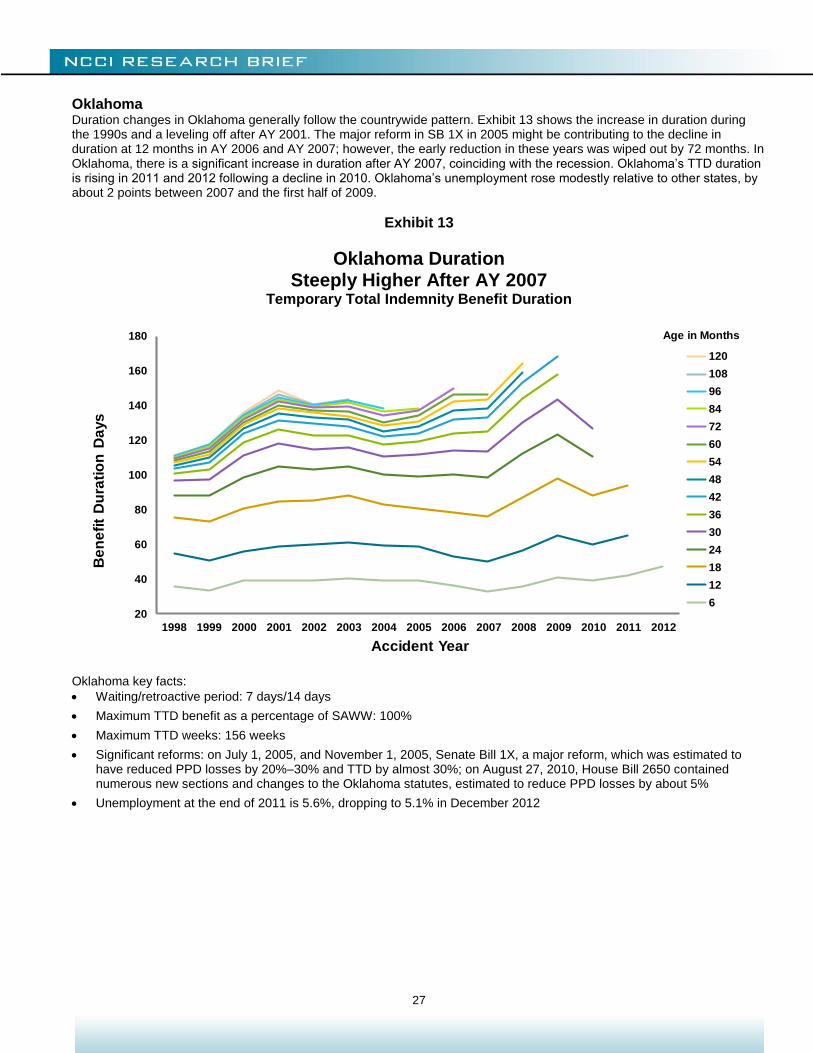
Oklahoma Duration changes in Oklahoma generally follow the countrywide pattern. Exhibit 13 shows the increase in duration during the 1990s and a leveling off after AY 2001. The major reform in SB 1X in 2005 might be contributing to the decline in duration at 12 months in AY 2006 and AY 2007; however, the early reduction in these years was wiped out by 72 months. In Oklahoma, there is a significant increase in duration after AY 2007, coinciding with the recession. Oklahoma’s TTD duration is rising in 2011 and 2012 following a decline in 2010. Oklahoma’s unemployment rose modestly relative to other states, by about 2 points between 2007 and the first half of 2009.
Exhibit 13
Oklahoma Duration Steeply Higher After AY 2007
Temporary Total Indemnity Benefit Duration
20
40
60
80
100
120
140
160
180
1998 1999 2000 2001 2002 2003 2004 2005 2006 2007 2008 2009 2010 2011 2012
Be
ne
fit
Du
rati
on
Da
ys
Accident Year
120
108
96
84
72
60
54
48
42
36
30
24
18
12
6
Age in Months
Oklahoma key facts:
Waiting/retroactive period: 7 days/14 days
Maximum TTD benefit as a percentage of SAWW: 100%
Maximum TTD weeks: 156 weeks
Significant reforms: on July 1, 2005, and November 1, 2005, Senate Bill 1X, a major reform, which was estimated to have reduced PPD losses by 20%–30% and TTD by almost 30%; on August 27, 2010, House Bill 2650 contained numerous new sections and changes to the Oklahoma statutes, estimated to reduce PPD losses by about 5%
Unemployment at the end of 2011 is 5.6%, dropping to 5.1% in December 2012
28
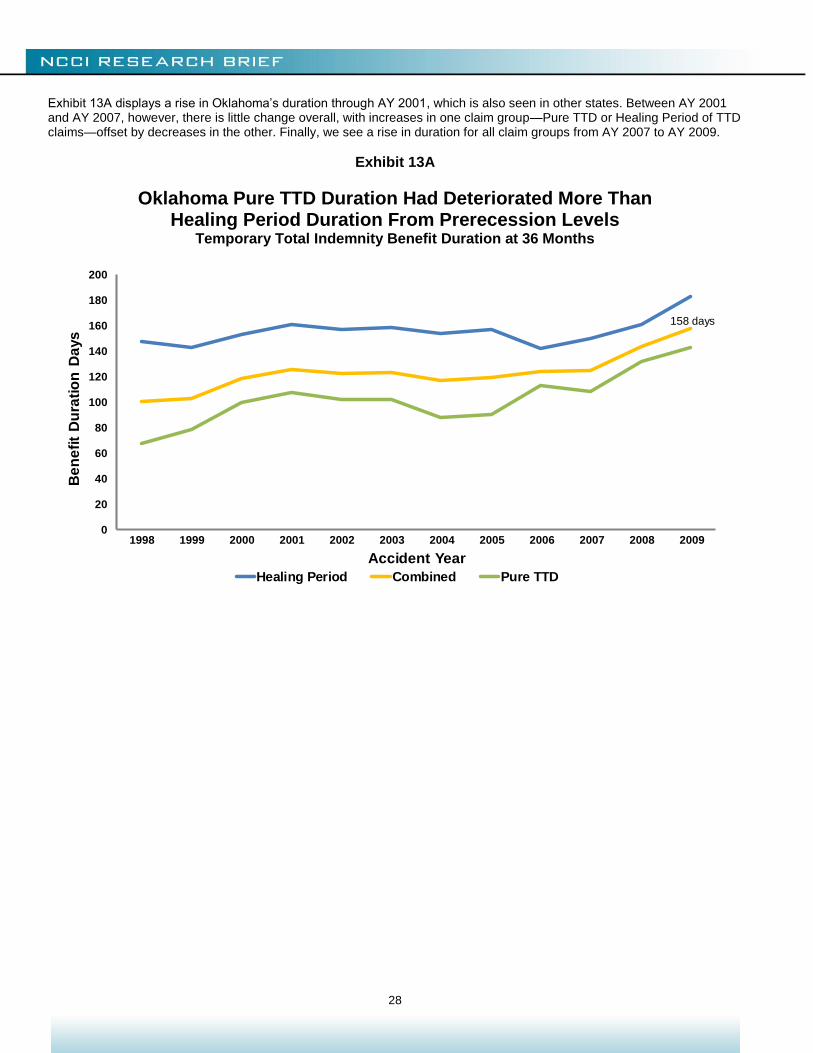
Exhibit 13A displays a rise in Oklahoma’s duration through AY 2001, which is also seen in other states. Between AY 2001 and AY 2007, however, there is little change overall, with increases in one claim group—Pure TTD or Healing Period of TTD claims—offset by decreases in the other. Finally, we see a rise in duration for all claim groups from AY 2007 to AY 2009.
Exhibit 13A
Oklahoma Pure TTD Duration Had Deteriorated More Than Healing Period Duration From Prerecession Levels
Temporary Total Indemnity Benefit Duration at 36 Months
0
20
40
60
80
100
120
140
160
180
200
1998 1999 2000 2001 2002 2003 2004 2005 2006 2007 2008 2009
Be
ne
fit
Du
rati
on
Da
ys
Accident Year
Healing Period Combined Pure TTD
158 days
29
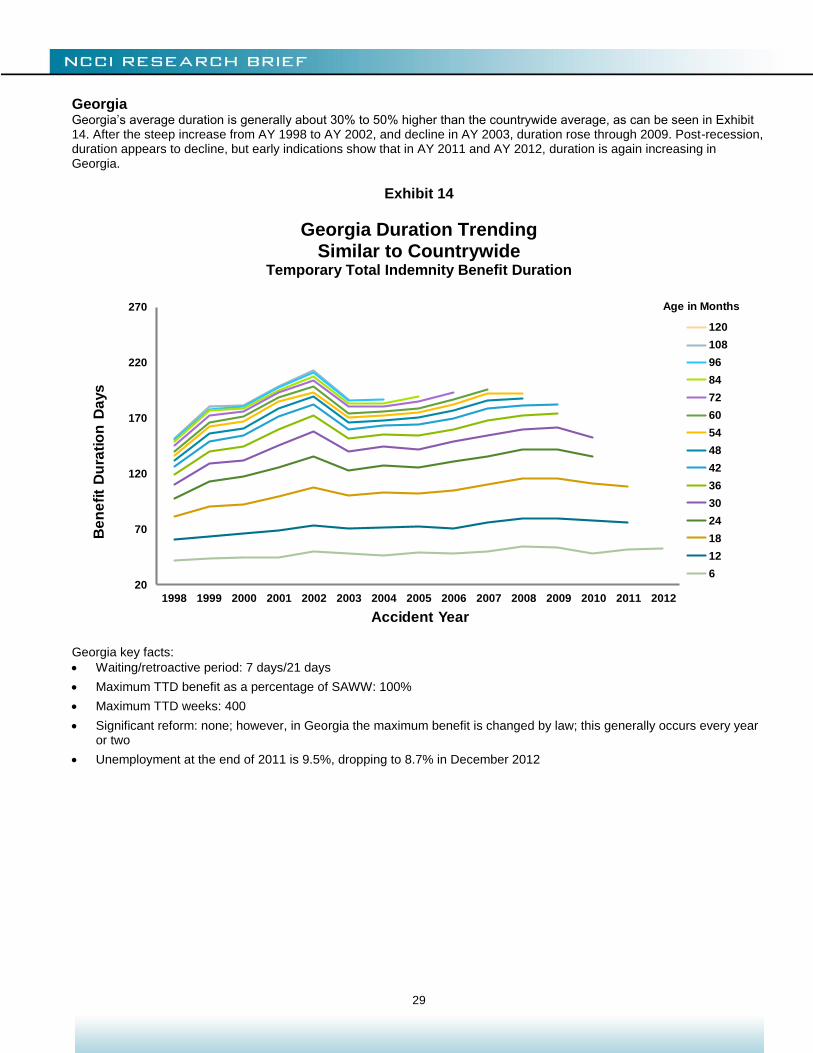
Georgia Georgia’s average duration is generally about 30% to 50% higher than the countrywide average, as can be seen in Exhibit 14. After the steep increase from AY 1998 to AY 2002, and decline in AY 2003, duration rose through 2009. Post-recession, duration appears to decline, but early indications show that in AY 2011 and AY 2012, duration is again increasing in Georgia.
Exhibit 14
Georgia Duration Trending Similar to Countrywide
Temporary Total Indemnity Benefit Duration
20
70
120
170
220
270
1998 1999 2000 2001 2002 2003 2004 2005 2006 2007 2008 2009 2010 2011 2012
Be
ne
fit
Du
rati
on
Da
ys
Accident Year
120
108
96
84
72
60
54
48
42
36
30
24
18
12
6
Age in Months
Georgia key facts:
Waiting/retroactive period: 7 days/21 days
Maximum TTD benefit as a percentage of SAWW: 100%
Maximum TTD weeks: 400
Significant reform: none; however, in Georgia the maximum benefit is changed by law; this generally occurs every year or two
Unemployment at the end of 2011 is 9.5%, dropping to 8.7% in December 2012
30
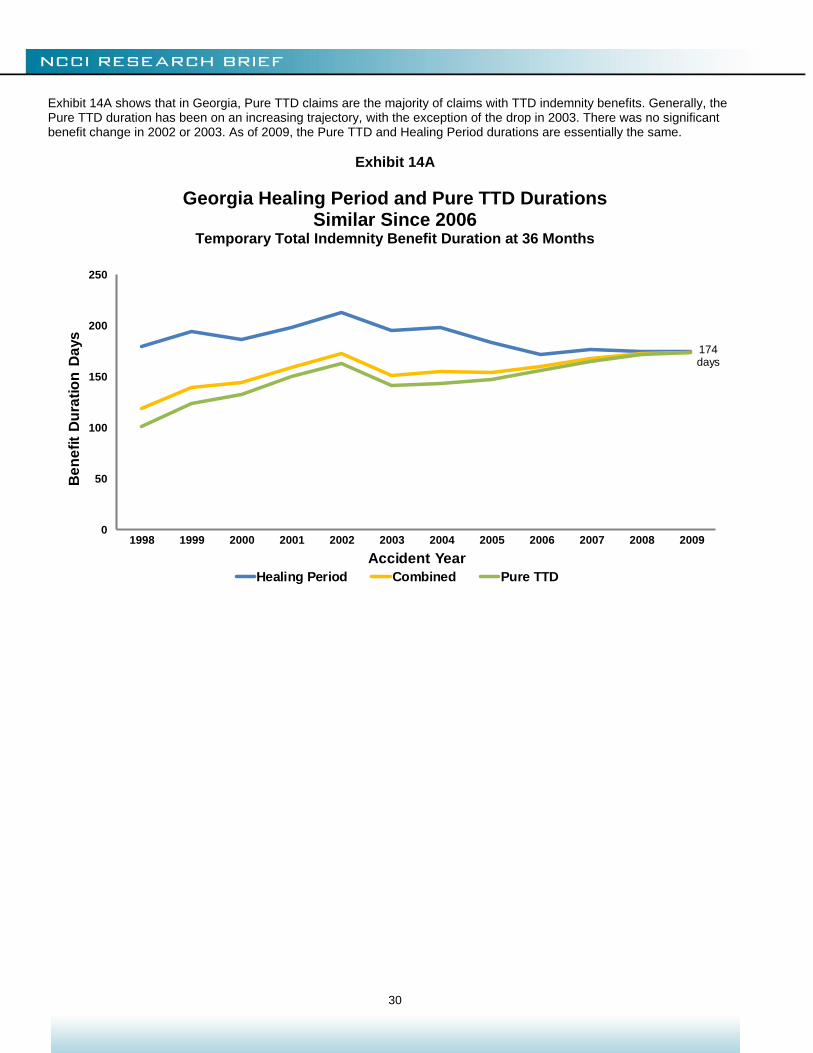
Exhibit 14A shows that in Georgia, Pure TTD claims are the majority of claims with TTD indemnity benefits. Generally, the Pure TTD duration has been on an increasing trajectory, with the exception of the drop in 2003. There was no significant benefit change in 2002 or 2003. As of 2009, the Pure TTD and Healing Period durations are essentially the same.
Exhibit 14A
Georgia Healing Period and Pure TTD Durations Similar Since 2006
Temporary Total Indemnity Benefit Duration at 36 Months
0
50
100
150
200
250
1998 1999 2000 2001 2002 2003 2004 2005 2006 2007 2008 2009
Be
ne
fit
Du
rati
on
Da
ys
Accident Year
Healing Period Combined Pure TTD
174days
31
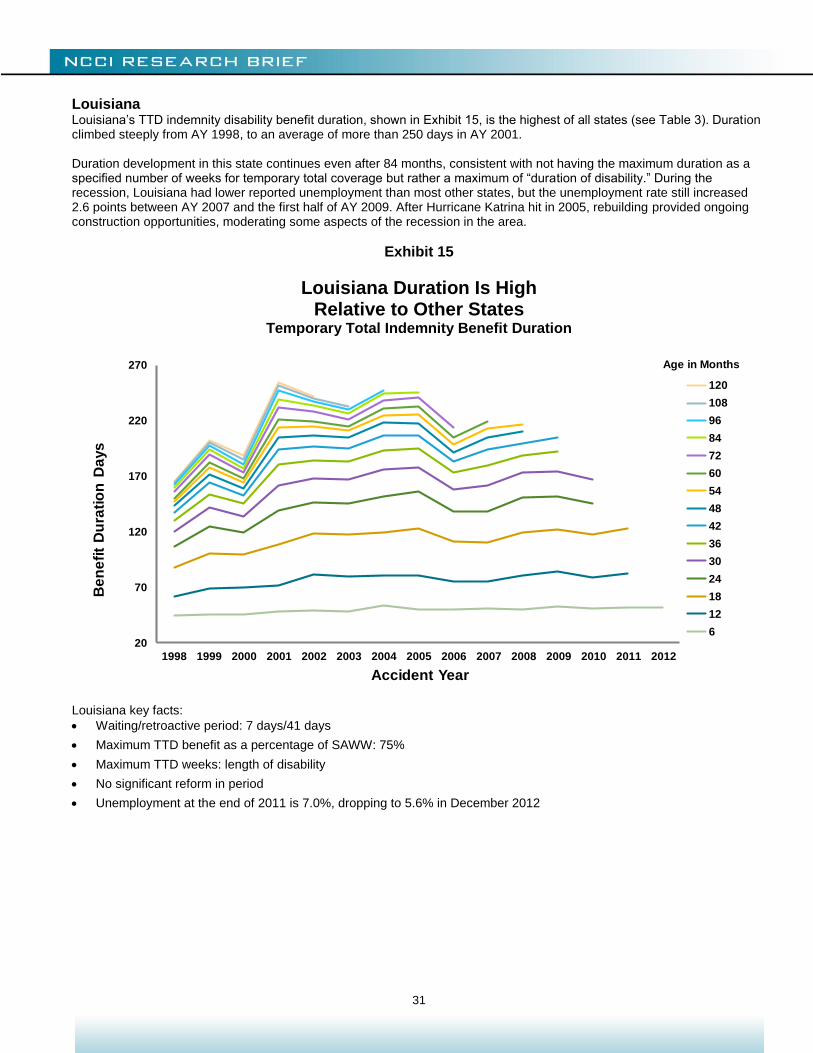
Louisiana Louisiana’s TTD indemnity disability benefit duration, shown in Exhibit 15, is the highest of all states (see Table 3). Duration climbed steeply from AY 1998, to an average of more than 250 days in AY 2001. Duration development in this state continues even after 84 months, consistent with not having the maximum duration as a specified number of weeks for temporary total coverage but rather a maximum of “duration of disability.” During the recession, Louisiana had lower reported unemployment than most other states, but the unemployment rate still increased 2.6 points between AY 2007 and the first half of AY 2009. After Hurricane Katrina hit in 2005, rebuilding provided ongoing construction opportunities, moderating some aspects of the recession in the area.
Exhibit 15
Louisiana Duration Is High Relative to Other States
Temporary Total Indemnity Benefit Duration
20
70
120
170
220
270
1998 1999 2000 2001 2002 2003 2004 2005 2006 2007 2008 2009 2010 2011 2012
Be
ne
fit
Du
rati
on
Da
ys
Accident Year
120
108
96
84
72
60
54
48
42
36
30
24
18
12
6
Age in Months
Louisiana key facts:
Waiting/retroactive period: 7 days/41 days
Maximum TTD benefit as a percentage of SAWW: 75%
Maximum TTD weeks: length of disability
No significant reform in period
Unemployment at the end of 2011 is 7.0%, dropping to 5.6% in December 2012
32
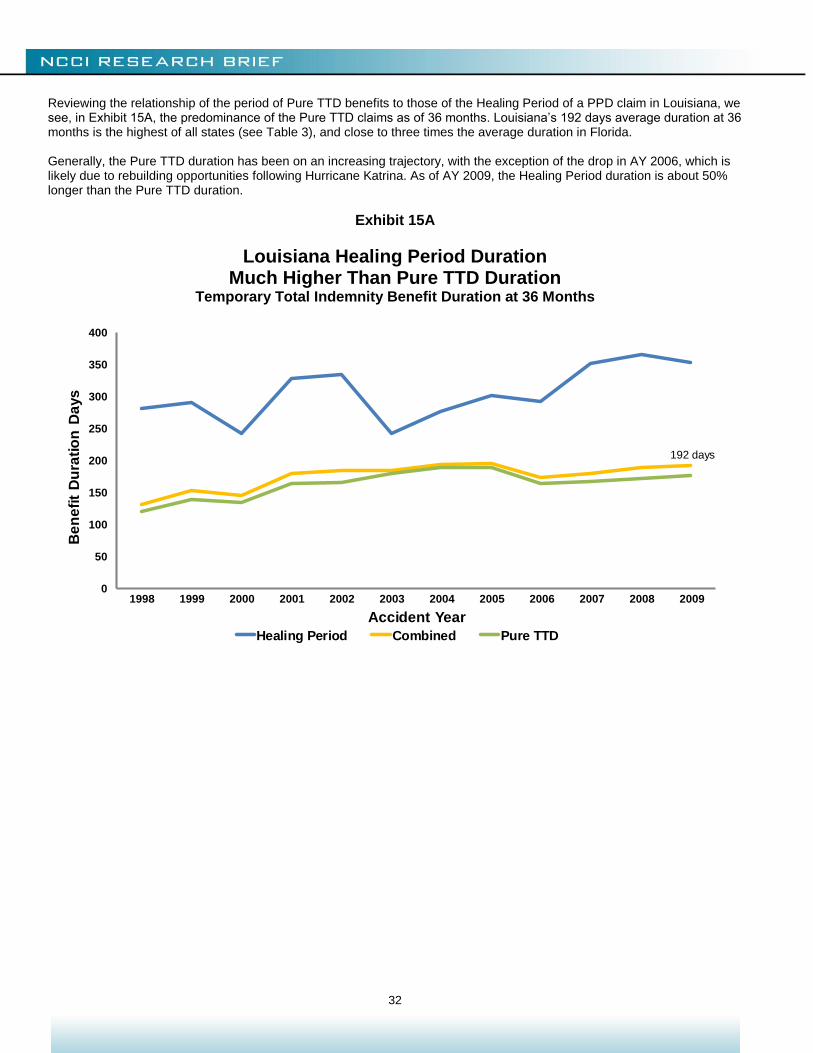
Reviewing the relationship of the period of Pure TTD benefits to those of the Healing Period of a PPD claim in Louisiana, we see, in Exhibit 15A, the predominance of the Pure TTD claims as of 36 months. Louisiana’s 192 days average duration at 36 months is the highest of all states (see Table 3), and close to three times the average duration in Florida. Generally, the Pure TTD duration has been on an increasing trajectory, with the exception of the drop in AY 2006, which is likely due to rebuilding opportunities following Hurricane Katrina. As of AY 2009, the Healing Period duration is about 50% longer than the Pure TTD duration.
Exhibit 15A
Louisiana Healing Period Duration Much Higher Than Pure TTD Duration
Temporary Total Indemnity Benefit Duration at 36 Months
0
50
100
150
200
250
300
350
400
1998 1999 2000 2001 2002 2003 2004 2005 2006 2007 2008 2009
Be
ne
fit
Du
rati
on
Da
ys
Accident Year
Healing Period Combined Pure TTD
192 days
33
CONCLUSION TTD duration, like the unemployment rate in many states, did not drop right back to “normal” after the recession. Since peaking in AY 2009, duration has only moderated slightly nationwide, and in some states it continues to lengthen. Duration began to decline for both Contracting and Manufacturing in AY 2011. However, durations in the other three industry groups—Office & Clerical, Good & Services, and Miscellaneous—either increased or remained at high levels, thereby keeping the overall duration relatively steady. The median duration in states in the seven-day waiting period group is longer than in the three-day waiting period group. The gap is consistently about 20 days longer for the seven-day group across accident years. However, average durations vary significantly by state, with state durations impacted by other factors, such as the statutory TTD maximum benefit. Women have longer duration than men within most industry groups. However, men have longer duration than women, overall. The link between the two results is men’s relatively higher claim share in the longer-duration industry groups. Duration increased for all age groups between AY 2005 and AY 2009, with most reflecting increases similar to the countrywide duration increase of 10%. For Contracting, which experienced a 20% increase in the same period, all age groups reflected similar increases. The youngest age group, consisting of workers under age 31, has a duration that is about 30% lower than countrywide. All other groups have higher durations than the overall average duration, with the ages 51 to 60 cohort standing out as the highest duration for Contracting, both in AY 2005 and in AY 2009. Durations by state reflect benefit and judicial structures, as well as significant events that affect workers’ environments. The influence of the Great Recession is seen in most states as lengthening average durations, reflecting the difficulty workers had in returning to work. As unemployment eases, we see that duration begins to shorten, also. We acknowledge the contributions of David Colón, Ampegama Perera, and Jennifer Edwards.
34
APPENDIX I—METHODOLOGY This study is based on a review of approximately 2.7 million TTD and PPD claims. Claims from Accident Years 1998 through 2012 were valued as of the end of each six months (each December 31 and each June 30) through June 30, 2012. The study uses data for all states except ND, OH, WA, WV, and WY. Some detailed analysis uses experience from NCCI states only. Large deductible policy experience and self-insured policy experience, where available, are included in the study. TTD indemnity benefit duration is measured by counting the days of covered loss on payment records.
A small portion of claims included transactions with overlapping dates. Each date was only counted once.
In cases where the dates associated with a large payment covered numerous days, those days were included as part of duration. This could be a disputed claim settlement, for example, where the claimant is compensated after the dispute is settled.
When a large payment had only a single covered day, it appeared that the claim included a negotiated lump-sum settlement. We did not expand the single day to cover any imputed lost time because there are numerous circumstances for these settlements, which might have or have not covered lost work time. To the extent that some of these settlements covered time away from the job not covered by other transactions, the durations we calculated could be understated.
Each claim meets a reasonableness criterion that the sum of the payments at a transactional level are close to the payments posted at the overall claim level. In addition, each claim’s dates were validated to pick up inaccuracies and typos that could distort results, such as a closure year of 2099 rather than 1999.
Examples of validation logic are that claims included in the study:
Have injury dates on or before the report date
Do not have a claim closed date before injury or report date
Do not have a claim closed date after June 30, 2012, the final evaluation date in the database
Claims with total payments of less than $50 were excluded on the basis that such a small payment accounted for less than one day’s wages.
35
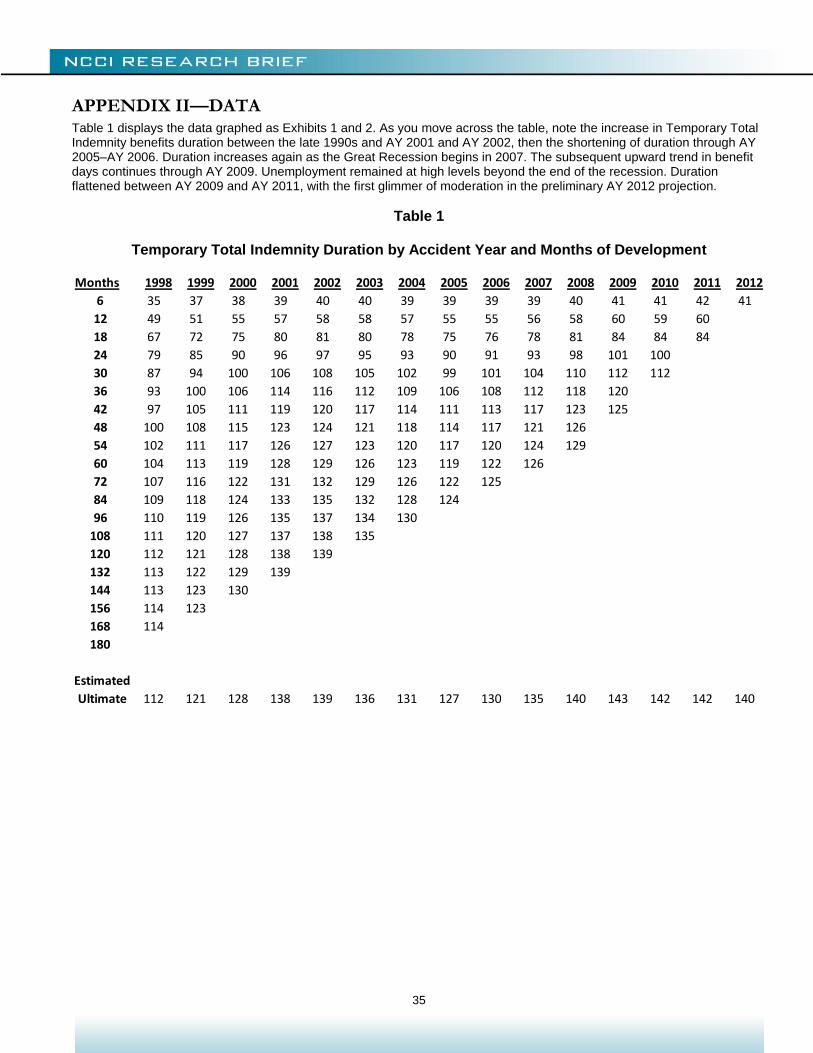
APPENDIX II—DATA Table 1 displays the data graphed as Exhibits 1 and 2. As you move across the table, note the increase in Temporary Total Indemnity benefits duration between the late 1990s and AY 2001 and AY 2002, then the shortening of duration through AY 2005–AY 2006. Duration increases again as the Great Recession begins in 2007. The subsequent upward trend in benefit days continues through AY 2009. Unemployment remained at high levels beyond the end of the recession. Duration flattened between AY 2009 and AY 2011, with the first glimmer of moderation in the preliminary AY 2012 projection.
Table 1
Temporary Total Indemnity Duration by Accident Year and Months of Development
Months 1998 1999 2000 2001 2002 2003 2004 2005 2006 2007 2008 2009 2010 2011 2012
6 35 37 38 39 40 40 39 39 39 39 40 41 41 42 41
12 49 51 55 57 58 58 57 55 55 56 58 60 59 60
18 67 72 75 80 81 80 78 75 76 78 81 84 84 84
24 79 85 90 96 97 95 93 90 91 93 98 101 100
30 87 94 100 106 108 105 102 99 101 104 110 112 112
36 93 100 106 114 116 112 109 106 108 112 118 120
42 97 105 111 119 120 117 114 111 113 117 123 125
48 100 108 115 123 124 121 118 114 117 121 126
54 102 111 117 126 127 123 120 117 120 124 129
60 104 113 119 128 129 126 123 119 122 126
72 107 116 122 131 132 129 126 122 125
84 109 118 124 133 135 132 128 124
96 110 119 126 135 137 134 130
108 111 120 127 137 138 135
120 112 121 128 138 139
132 113 122 129 139
144 113 123 130
156 114 123
168 114
180
Estimated
Ultimate 112 121 128 138 139 136 131 127 130 135 140 143 142 142 140
36
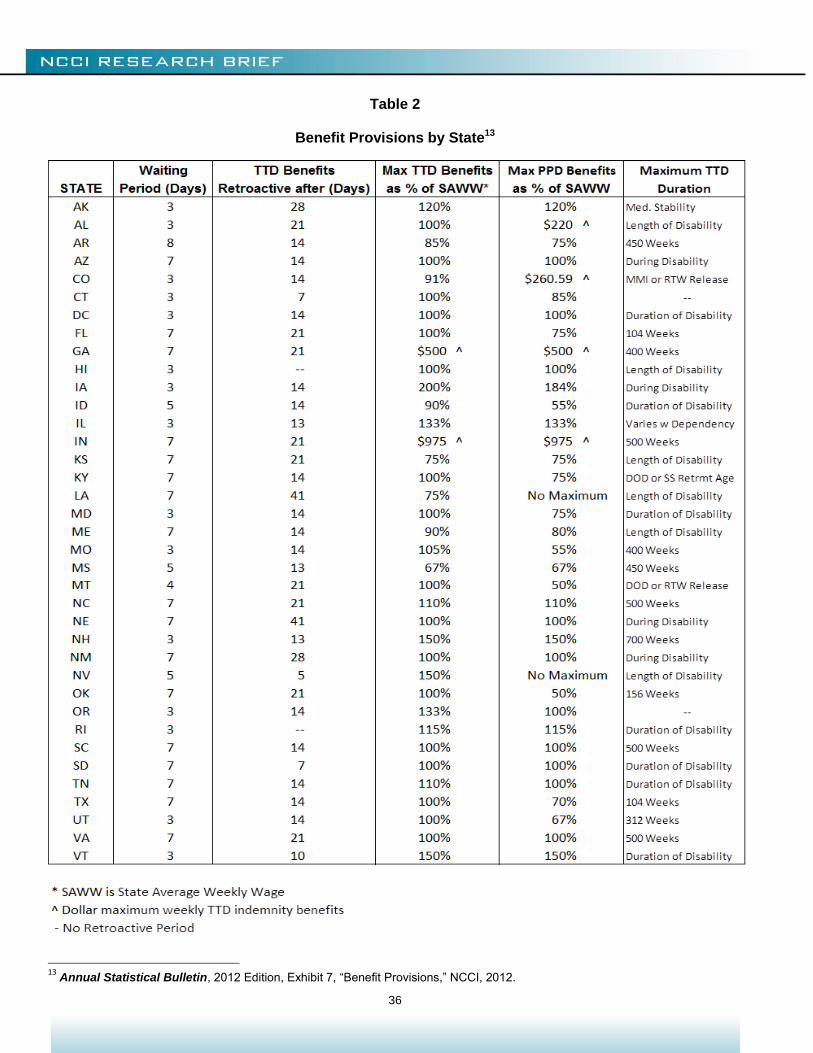
Table 2
Benefit Provisions by State13
13
Annual Statistical Bulletin, 2012 Edition, Exhibit 7, “Benefit Provisions,” NCCI, 2012.
37
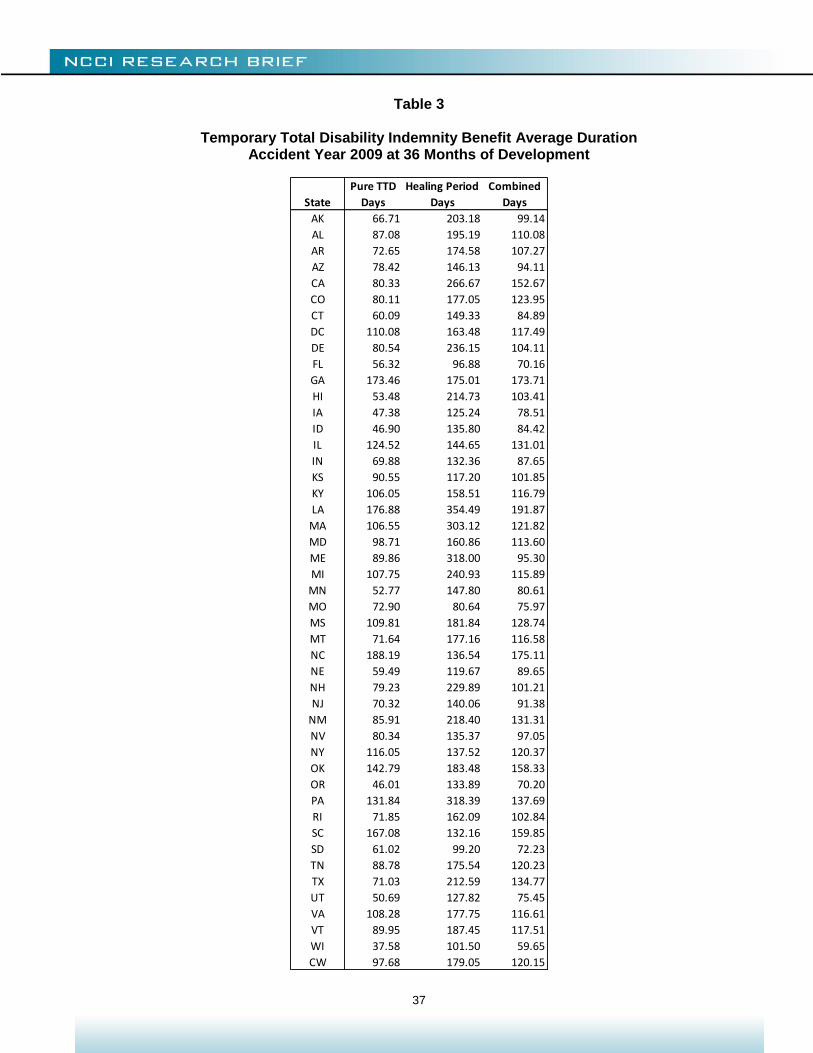
Table 3
Temporary Total Disability Indemnity Benefit Average Duration Accident Year 2009 at 36 Months of Development
State
Pure TTD
Days
Healing Period
Days
Combined
Days
AK 66.71 203.18 99.14
AL 87.08 195.19 110.08
AR 72.65 174.58 107.27
AZ 78.42 146.13 94.11
CA 80.33 266.67 152.67
CO 80.11 177.05 123.95
CT 60.09 149.33 84.89
DC 110.08 163.48 117.49
DE 80.54 236.15 104.11
FL 56.32 96.88 70.16
GA 173.46 175.01 173.71
HI 53.48 214.73 103.41
IA 47.38 125.24 78.51
ID 46.90 135.80 84.42
IL 124.52 144.65 131.01
IN 69.88 132.36 87.65
KS 90.55 117.20 101.85
KY 106.05 158.51 116.79
LA 176.88 354.49 191.87
MA 106.55 303.12 121.82
MD 98.71 160.86 113.60
ME 89.86 318.00 95.30
MI 107.75 240.93 115.89
MN 52.77 147.80 80.61
MO 72.90 80.64 75.97
MS 109.81 181.84 128.74
MT 71.64 177.16 116.58
NC 188.19 136.54 175.11
NE 59.49 119.67 89.65
NH 79.23 229.89 101.21
NJ 70.32 140.06 91.38
NM 85.91 218.40 131.31
NV 80.34 135.37 97.05
NY 116.05 137.52 120.37
OK 142.79 183.48 158.33
OR 46.01 133.89 70.20
PA 131.84 318.39 137.69
RI 71.85 162.09 102.84
SC 167.08 132.16 159.85
SD 61.02 99.20 72.23
TN 88.78 175.54 120.23
TX 71.03 212.59 134.77
UT 50.69 127.82 75.45
VA 108.28 177.75 116.61
VT 89.95 187.45 117.51
WI 37.58 101.50 59.65
CW 97.68 179.05 120.15
38
APPENDIX III—REFERENCES NCCI Studies at ncci.com
Workers Compensation Temporary Total Disability Indemnity Benefit Duration 2010 Update, February 2011
Workers Compensation Temporary Total Disability Indemnity Benefit Duration 2011 Update, April 2012
Workers Compensation Temporary Total Disability Indemnity Benefit Duration 2012 Update, July 2012
Workers Compensation and the Aging Workforce: Is 35 the New “Older” Worker?, October 2012
Other References
Bureau of Labor Statistics, www.bls.gov/bls/unemployment.htm
© Copyright 2013 National Council on Compensation Insurance, Inc. All Rights Reserved. THE RESEARCH ARTICLES AND CONTENT DISTRIBUTED BY NCCI ARE PROVIDED FOR GENERAL INFORMATIONAL PURPOSES ONLY AND ARE PROVIDED “AS IS.” NCCI DOES NOT GUARANTEE THEIR ACCURACY OR COMPLETENESS NOR DOES NCCI ASSUME ANY LIABILITY THAT MAY RESULT IN YOUR RELIANCE UPON SUCH INFORMATION. NCCI EXPRESSLY DISCLAIMS ANY AND ALL WARRANTIES OF ANY KIND INCLUDING ALL EXPRESS, STATUTORY AND IMPLIED WARRANTIES INCLUDING THE IMPLIED WARRANTIES OF MERCHANTABILITY AND FITNESS FOR A PARTICULAR PURPOSE.