Embed Size (px)
Citation preview
Please see Appendix for analyst certifications and all other important disclosures.
Institu
tion
al Research
Aurobindo Pharma Vaccine opportunity
Changes in the report
Rating: Unchanged at BUY
Target Price: Rs 1,485 from Rs 1,285
Earnings estimates: FY22E -3.5%
Source: Centrum Research
Aurobindo relative to Nifty 50
Source: Bloomberg
Shareholding pattern
March-21 Dec-20 Sep-20 Jun-20
Promoter 51.9 51.9 52.0 52.0
FIIs 24.4 25.0 23.0 22.6
DIIs 11.0 10.2 11.2 12.6
Public/other 12.7 12.9 13.8 12.8
Source: BSE
70
90
110
130
150
170
Jun-20 Jul-20 Sep-20 Nov-20 Jan-21 Mar-21 May-21
Nifty 50
ARBP
ARBP Q4FY21 earnings marginally below estimates, quarter not comparable given the Natrol divestment. Gross margins improved given traction in each business segment along with generic global injectable recovery. The Natrol cash would be largely utilized towards additional capex of US$200mn across additional injectable facilities (EU&EMs), APIs and Derma/inhalers. In the next 2 years, R&D spend to sustain at 6% range considering the additional complex filings. The generic injectable are expected to reach US$700mn by FY24. Management highlighted the medium term growth drivers to be Vaccine and PLI scheme and niche product basket instead of large acquisition. Net cash balance sheet and strong operating cash flows. We maintain strong Buy at 18x FY23 with a target price of Rs1,285 + Rs200 vaccine NPV (assuming 400mn dose in a year).
US sales better than estimates, vaccination to drive faster recovery
US reported sales at US$393mn increased 5%YoY contributing 47% of sales. Global generic injectable sales for the quarter stood at US$111mn. The US generic injectable sequentially recovering amid pandemic to US$395mn in the fiscal with branded injectables clocking US$103mn.US sales FY21 at US$1.7bn - Oral Solids $1.1bn up by 7%YoY, Injectables $250mn down 10%YoY, Spectrum $103mn 3%YoY, OTC $50mn. (Natrol $148mn – divested).
Net cash balance sheet with visible opportunities in Biosimilar, Vaccines and APIs Biosimilar upcoming filings in EU& US along with in development pipeline of total 13 biosimilar underway. The company to file 2 filing each in FY22 and FY23 with the first launch in FY23. The yield and the opportunity would increase the product basket of ARBP in complex products. External APIs sales expected to double in 3-4yrs. Additionally PLI scheme would lead to large capacities and backward integration. Generated operating cash flow of US$429mn in FY21. The net cash on books stood at US$113mn Vs net debt at US$359mn at Mar20.
Vaccine opportunity to be meaningful
UB-612, peptides based Covid vaccine, expected to entered into pre-qualification by July initially starting with Taiwan market while would expand to other geographies based on approvals. ARBP would be starting the production with ~25mn doses in the beginning and would expand as the Indian and other market approvals would follow. The phase 2/3 trial of UB612 expected to begin shortly in India as ARBP has filed for trials recently. Indian launch could be by end of CY21 or early CY22 based on the ramp-up of trails and EUA data requirements. We expect the company to supply as much as 400mn doses in a year and value the opportunity at an NPV of Rs200 NPV.
Valuation The improved compliance status of the company – Management has completed the CAPA for unit IX, XI and I and submitted e-audit request awaiting clarity from USFDA, Unit VII also the CAPA is completed and awaiting USFDA guidance one the way forward. The management continues to look for ways to deploy cash better however at this point in time company has most of the R&D basket covering all niche areas of filings. The earnings have been chnaged by -3.5%/0.4% to reflect the improving margins for FY22E/FY23E, respectively. We continue to maintain BUY. We continue to value ARBP at 18x FY23E earnings multiple with our target price at Rs 1,285+Rs.200vaccine opportunity. The stock at CMP of Rs 1,001 trades at 16x FY22E EPS of Rs62.6 and 13.7x FY23E EPS of Rs 73.3.
Financial and valuation summary
YE Mar (Rs mn) Q4FY21 Q4FY20 YoY(%) Q3FY21 QoQ(%) FY21 FY22E FY23E
Revenue 59,916.8 60,634.0 -1.2% 63,531.3 -5.7% 2,47,747 2,71,584 3,06,298
EBITDA 12,746.7 13,162.3 -3.2% 13,685.8 -6.9% 53,335 61,351 70,855
EBITDA margin (%) 21.3% 21.7% -43bps 21.5% -27bps 21.5% 22.6% 23.1%
Adj. net profit 8,088.6 8,560.9 -5.5% 8,509.4 -4.9% 32,235 36,685 42,950
Diluted EPS Rs. 13.67 14.51 -5.7% 50.29 -72.8% 55.0 62.6 73.3
P/E (x) 18.2 16.0 13.7
EV/EBIDTA (x) 10.9 9.3 7.8
RoE (%) 16.6 15.7 16.1
Source: Company, Centrum Research estimates
.
Buy Target Price: Rs1,485
Price: Rs1,001 Forecast return: 49%
Market Data
Bloomberg: ARBP IN
52 week H/L: Rs1064/722
Market cap: Rs585bn
Shares Outstanding: 586mn
Free float: 46%
Avg. daily vol. 3mth: 2605163
Source: Bloomberg
Ph
armace
utica
ls
Cyndrella Carvalho Analyst, Pharmaceuticals
+91 22 4215 9643 [email protected]
Result Update l Pharmaceutical l 1 June 2021
Aurobindo Pharma
2 Centrum Institutional Research
Estimate revisions
YE Mar (Rs mn) FY22E
New FY22E
Old % chg
FY23E New
FY23E Old
% chg
Sales 2,71,584 2,72,062 -0.2% 3,06,298 3,06,319 0.0%
EBITDA 61,351 62,099 -1.2% 70,855 70,380 0.7%
EBITDA margin (%) 22.6 22.8 24bps 23.1 23.0 -16bps
Net profit 36,685 38,011 -3.5% 42,950 42,770 0.4%
Source: Centrum Research estimates
Centrum estimates vs Actual results
YE Mar (Rs mn) Actual
Q4FY21 Centrum Q4FY21
Variance (%)
Revenue 59,917 61,074 -1.9%
EBITDA 12,747 13,586 -6.2%
EBITDA margin (%) 21.3% 22.2% 97bps
Tax rate (%) 24.3% 26.0%
Adj. net profit 8,089 8,315 -2.7%
Source: Bloomberg Centrum Research estimates
ARBP versus NIFTY 50 1m 6m 1 year
ARBP IN 1.7 14.9 33.8
NIFTY 50 6.5 20.2 62.7 Source: Bloomberg, NSE
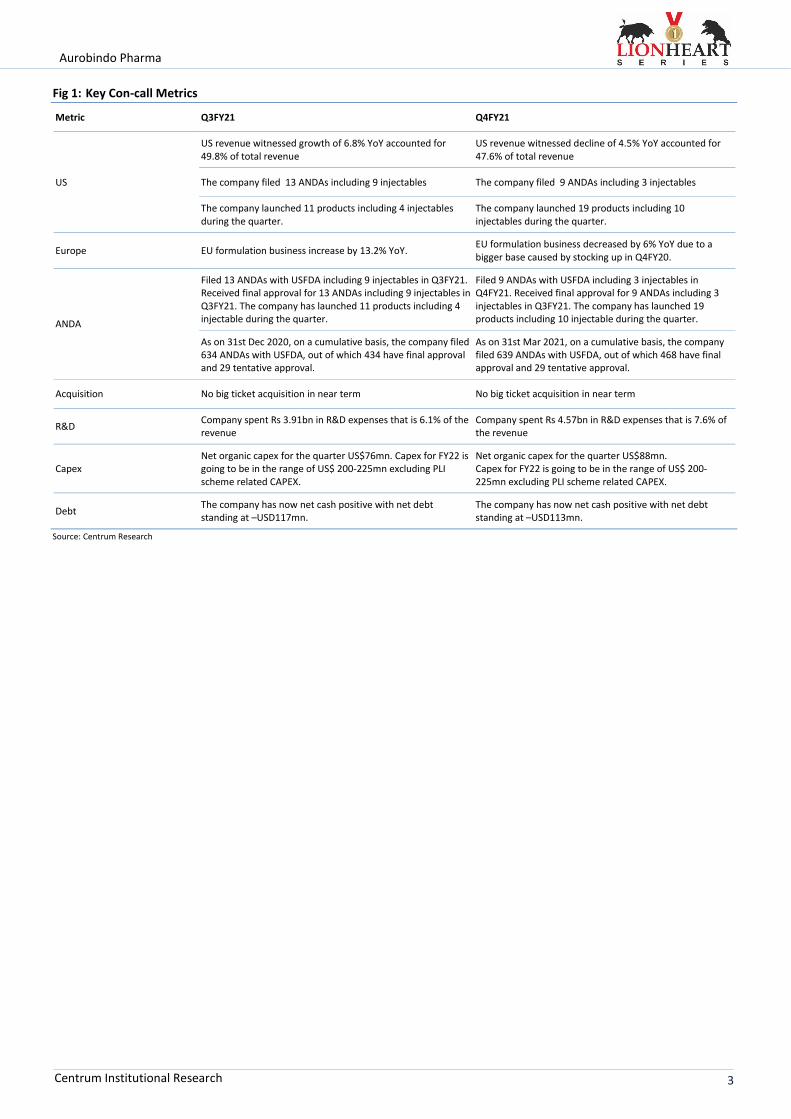
Valuations The stock at CMP of Rs 1,001 trades at 16x FY22E EPS of Rs62.6 and 13.7x FY23E EPS of Rs 73.3. We maintain strong Buy at 18x FY23 with a target price of Rs1,285 + Rs200 vaccine NPV (assuming 400mn dose in a year)
Valuations
EPS FY23E Rs73.3
PER FY23E 13.7x
P/E mean and standard deviation
EV/EBITDA mean and standard deviation
Source: Bloomberg, Centrum Research estimates
369
1215182124
May
-15
No
v-15
May
-16
No
v-16
May
-17
No
v-17
May
-18
No
v-18
May
-19
No
v-19
May
-20
No
v-20
May
-21
P/E Mean
Mean + Std Dev Mean - Std Dev
2468
1012141618
May
-15
No
v-15
May
-16
No
v-16
May
-17
No
v-17
May
-18
No
v-18
May
-19
No
v-19
May
-20
No
v-20
May
-21
EV/EBITDA Mean
Mean + Std Dev Mean - Std Dev
Thesis Snapshot
Company Mkt Cap
Rs mn
CAGR FY21-FY23E (%) PE (x) EV/EBITDA (x) RoE (%)
Sales EBIDTA PAT FY21 FY22E FY23E FY21 FY22E FY23E FY21 FY22E FY23E
Lupin 553,374 13.1 29.2 39.3 45.3 31.6 23.3 24.2 18.3 13.6 9.2 12.9 16.6
Aurobindo 584,737 11.2 15.3 15.4 18.2 16.0 13.7 10.9 9.3 7.8 16.6 15.7 16.1
Cipla 765,644 11.5 18.9 29.6 31.8 29.4 23.8 17.5 15.9 12.9 14.1 13.3 14.5
Dr. Reddy's Labs 882,870 15.2 19.4 23.6 36.0 26.8 23.6 19.2 15.2 12.8 14.8 17.3 16.9
Source: Company, Centrum Research
Aurobindo Pharma
3 Centrum Institutional Research
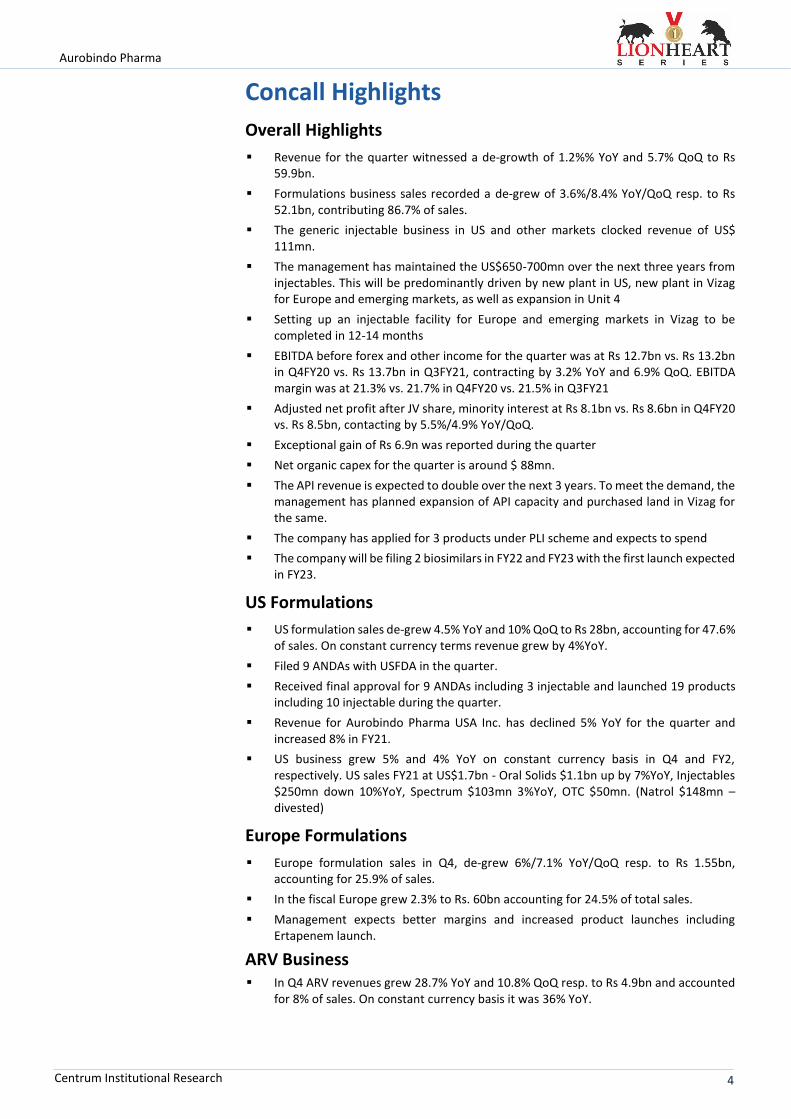
Fig 1: Key Con-call Metrics
Metric Q3FY21 Q4FY21
US
US revenue witnessed growth of 6.8% YoY accounted for 49.8% of total revenue
US revenue witnessed decline of 4.5% YoY accounted for 47.6% of total revenue
The company filed 13 ANDAs including 9 injectables The company filed 9 ANDAs including 3 injectables
The company launched 11 products including 4 injectables during the quarter.
The company launched 19 products including 10 injectables during the quarter.
Europe EU formulation business increase by 13.2% YoY. EU formulation business decreased by 6% YoY due to a bigger base caused by stocking up in Q4FY20.
ANDA
Filed 13 ANDAs with USFDA including 9 injectables in Q3FY21. Received final approval for 13 ANDAs including 9 injectables in Q3FY21. The company has launched 11 products including 4 injectable during the quarter.
Filed 9 ANDAs with USFDA including 3 injectables in Q4FY21. Received final approval for 9 ANDAs including 3 injectables in Q3FY21. The company has launched 19 products including 10 injectable during the quarter.
As on 31st Dec 2020, on a cumulative basis, the company filed 634 ANDAs with USFDA, out of which 434 have final approval and 29 tentative approval.
As on 31st Mar 2021, on a cumulative basis, the company filed 639 ANDAs with USFDA, out of which 468 have final approval and 29 tentative approval.
Acquisition No big ticket acquisition in near term No big ticket acquisition in near term
R&D Company spent Rs 3.91bn in R&D expenses that is 6.1% of the revenue
Company spent Rs 4.57bn in R&D expenses that is 7.6% of the revenue
Capex Net organic capex for the quarter US$76mn. Capex for FY22 is going to be in the range of US$ 200-225mn excluding PLI scheme related CAPEX.
Net organic capex for the quarter US$88mn. Capex for FY22 is going to be in the range of US$ 200-225mn excluding PLI scheme related CAPEX.
Debt The company has now net cash positive with net debt standing at –USD117mn.
The company has now net cash positive with net debt standing at –USD113mn.
Source: Centrum Research
Aurobindo Pharma
4 Centrum Institutional Research
Concall Highlights
Overall Highlights
Revenue for the quarter witnessed a de-growth of 1.2%% YoY and 5.7% QoQ to Rs 59.9bn.
Formulations business sales recorded a de-grew of 3.6%/8.4% YoY/QoQ resp. to Rs 52.1bn, contributing 86.7% of sales.
The generic injectable business in US and other markets clocked revenue of US$ 111mn.
The management has maintained the US$650-700mn over the next three years from injectables. This will be predominantly driven by new plant in US, new plant in Vizag for Europe and emerging markets, as well as expansion in Unit 4
Setting up an injectable facility for Europe and emerging markets in Vizag to be completed in 12-14 months
EBITDA before forex and other income for the quarter was at Rs 12.7bn vs. Rs 13.2bn in Q4FY20 vs. Rs 13.7bn in Q3FY21, contracting by 3.2% YoY and 6.9% QoQ. EBITDA margin was at 21.3% vs. 21.7% in Q4FY20 vs. 21.5% in Q3FY21
Adjusted net profit after JV share, minority interest at Rs 8.1bn vs. Rs 8.6bn in Q4FY20 vs. Rs 8.5bn, contacting by 5.5%/4.9% YoY/QoQ.
Exceptional gain of Rs 6.9n was reported during the quarter
Net organic capex for the quarter is around $ 88mn.
The API revenue is expected to double over the next 3 years. To meet the demand, the management has planned expansion of API capacity and purchased land in Vizag for the same.
The company has applied for 3 products under PLI scheme and expects to spend
The company will be filing 2 biosimilars in FY22 and FY23 with the first launch expected in FY23.
US Formulations
US formulation sales de-grew 4.5% YoY and 10% QoQ to Rs 28bn, accounting for 47.6% of sales. On constant currency terms revenue grew by 4%YoY.
Filed 9 ANDAs with USFDA in the quarter.
Received final approval for 9 ANDAs including 3 injectable and launched 19 products including 10 injectable during the quarter.
Revenue for Aurobindo Pharma USA Inc. has declined 5% YoY for the quarter and increased 8% in FY21.
US business grew 5% and 4% YoY on constant currency basis in Q4 and FY2, respectively. US sales FY21 at US$1.7bn - Oral Solids $1.1bn up by 7%YoY, Injectables $250mn down 10%YoY, Spectrum $103mn 3%YoY, OTC $50mn. (Natrol $148mn – divested)
Europe Formulations
Europe formulation sales in Q4, de-grew 6%/7.1% YoY/QoQ resp. to Rs 1.55bn, accounting for 25.9% of sales.
In the fiscal Europe grew 2.3% to Rs. 60bn accounting for 24.5% of total sales.
Management expects better margins and increased product launches including Ertapenem launch.
ARV Business In Q4 ARV revenues grew 28.7% YoY and 10.8% QoQ resp. to Rs 4.9bn and accounted
for 8% of sales. On constant currency basis it was 36% YoY.
Aurobindo Pharma
5 Centrum Institutional Research
During FY21, ARV business grew 48.8% to Rs. 18.6bn accounting for 7.5%of total revenues. The increased conversion of TLE to TLD across geographies led to the growth for the quarter.
Growth Market Formulations
Growth markets formulations during Q4 de-grew 18.8% YoY and 22.8% QoQ to Rs 3.06bn and accounted for 5.1% of sales. On constant currency basis it grew 10% YoY.
In the FY21 GM grew 6.1% to Rs. 14.4 and accounted for 5.8%
API Business
API business in Q4 grew 5.1%/13.2% YoY/QoQ to Rs 7.9bn and contributed 13.2% of sales.
Betalactum sales declined 24.2% YoY while growth of 5.6% QoQ to Rs 4.09bn while Non-Betalactum sales grew 78.2%/30.5% YoY/QoQ to Rs 3.85bn
During the fiscal
Filed 1 DMFs with USFDA during the quarter with 252 DMFs filed till date.
ARBP expects to double the revenue in next 4-5 years with PLI scheme investment of Rs30bn along with additional Rs 8bn investment in the existing business.
Regulatory
Filed 145 injectables ANDAs as on 31st Mar’21, out of which 91 have received final approval and balance 54 are under review.
As on 31st Mar’21, filed 639 ANDAs on cumulative basis, out of which 439 have final approval and 29 having tentative.
R&D and Debt
R&D spend at for the quarter was at Rs 4.57bn (7.6% of sales) and for the year stood at Rs. 15bn (6.1%) of sales.
The net debt has improved significantly. The company is now net cash positive to $ 113mn Mar’21
PLI scheme
Aurobindo Pharma received approval from GoI for three fermentation based products under PLI Scheme.
These products include Penicillin G, 7-ACA and Erythromycin Thiocyanate (TIOC). Currently, these products are largely dependent on China imports. The PLI scheme, Aurobindo would become a very large player in anti-biotic space while company also imports heavily in this segment which would allow company to be backward integrated.
The committed production capacities and capital investment for these products are Penicillin G - 15,000MT with Rs13.9bn, 7-ACA 2,000MT with Rs8.13bn and Erythromycin Thiocyanate (TIOC) -1,600MT with Rs8.34bn, respectively.
The combined committed capital investment for these three products stands at Rs30.4bn which can easily be funded from internal accruals and can have asset turnover of nearly 1.5x.
Also this backward integration and the control of entire supply chain would lead to better margins and a formidable position in the fermentation product basket. Also company would be consuming nearly 40% of it internally.
Biologics
The company has a robust pipeline in four therapeutics namely: Oncology, Immunology, Ophthalmology and Respiratory
CuraTeQ Biologics, a fully owned subsidiary, will continue developing biosimilar with a portfolio of products covering market size of over US$ 50bn.
Aurobindo Pharma
6 Centrum Institutional Research
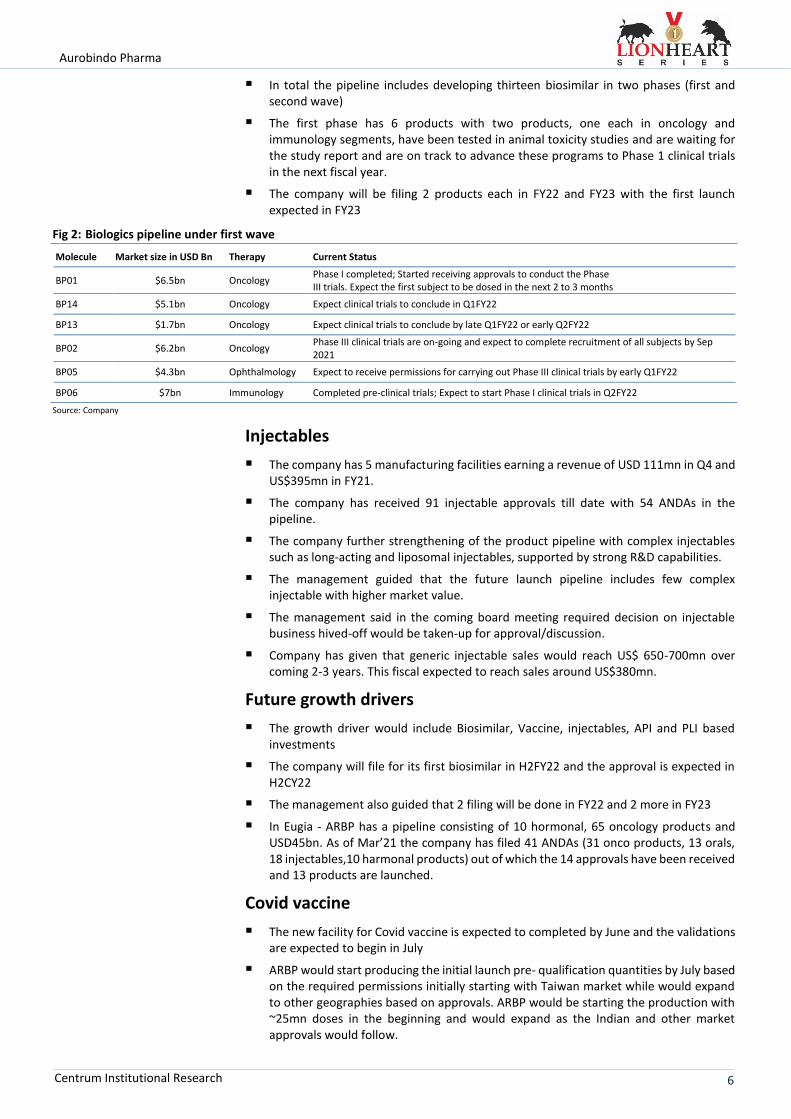
In total the pipeline includes developing thirteen biosimilar in two phases (first and second wave)
The first phase has 6 products with two products, one each in oncology and immunology segments, have been tested in animal toxicity studies and are waiting for the study report and are on track to advance these programs to Phase 1 clinical trials in the next fiscal year.
The company will be filing 2 products each in FY22 and FY23 with the first launch expected in FY23
Fig 2: Biologics pipeline under first wave
Molecule Market size in USD Bn Therapy Current Status
BP01 $6.5bn Oncology Phase I completed; Started receiving approvals to conduct the Phase III trials. Expect the first subject to be dosed in the next 2 to 3 months
BP14 $5.1bn Oncology Expect clinical trials to conclude in Q1FY22
BP13 $1.7bn Oncology Expect clinical trials to conclude by late Q1FY22 or early Q2FY22
BP02 $6.2bn Oncology Phase III clinical trials are on-going and expect to complete recruitment of all subjects by Sep 2021
BP05 $4.3bn Ophthalmology Expect to receive permissions for carrying out Phase III clinical trials by early Q1FY22
BP06 $7bn Immunology Completed pre-clinical trials; Expect to start Phase I clinical trials in Q2FY22
Source: Company
Injectables
The company has 5 manufacturing facilities earning a revenue of USD 111mn in Q4 and US$395mn in FY21.
The company has received 91 injectable approvals till date with 54 ANDAs in the pipeline.
The company further strengthening of the product pipeline with complex injectables such as long-acting and liposomal injectables, supported by strong R&D capabilities.
The management guided that the future launch pipeline includes few complex injectable with higher market value.
The management said in the coming board meeting required decision on injectable business hived-off would be taken-up for approval/discussion.
Company has given that generic injectable sales would reach US$ 650-700mn over coming 2-3 years. This fiscal expected to reach sales around US$380mn.
Future growth drivers
The growth driver would include Biosimilar, Vaccine, injectables, API and PLI based investments
The company will file for its first biosimilar in H2FY22 and the approval is expected in H2CY22
The management also guided that 2 filing will be done in FY22 and 2 more in FY23
In Eugia - ARBP has a pipeline consisting of 10 hormonal, 65 oncology products and USD45bn. As of Mar’21 the company has filed 41 ANDAs (31 onco products, 13 orals, 18 injectables,10 harmonal products) out of which the 14 approvals have been received and 13 products are launched.
Covid vaccine
The new facility for Covid vaccine is expected to completed by June and the validations are expected to begin in July
ARBP would start producing the initial launch pre- qualification quantities by July based on the required permissions initially starting with Taiwan market while would expand to other geographies based on approvals. ARBP would be starting the production with ~25mn doses in the beginning and would expand as the Indian and other market approvals would follow.
Aurobindo Pharma
7 Centrum Institutional Research
As the Vaccine is peptide based vaccine could be produced at bacterial and other injectable facilities as well not necessary to have produced at viral vaccine plants.
The phase 2/3 trial of UB612 expected to begin shortly in India as ARBP has filed for trials recently. Indian launch could be by end of CY21 or early CY22 based on the ramp-up of trails and EUA data requirements.
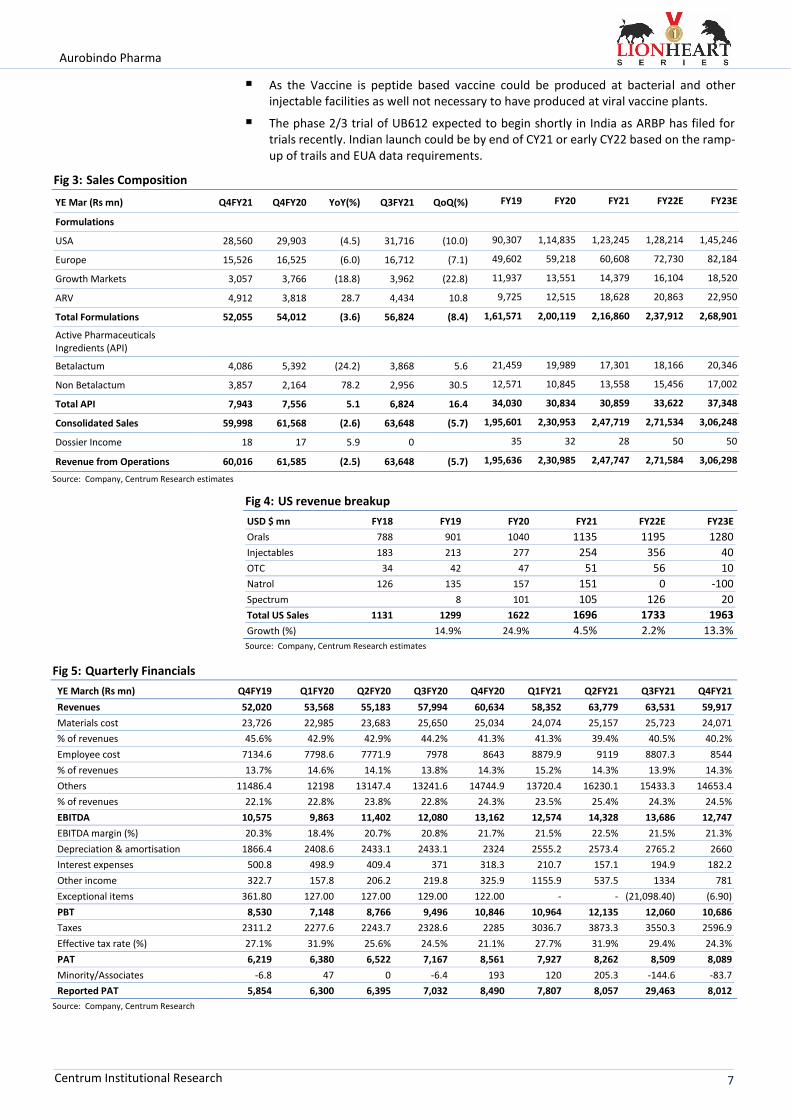
Fig 3: Sales Composition
YE Mar (Rs mn) Q4FY21 Q4FY20 YoY(%) Q3FY21 QoQ(%) FY19 FY20 FY21 FY22E FY23E
Formulations
USA 28,560 29,903 (4.5) 31,716 (10.0) 90,307 1,14,835 1,23,245 1,28,214 1,45,246
Europe 15,526 16,525 (6.0) 16,712 (7.1) 49,602 59,218 60,608 72,730 82,184
Growth Markets 3,057 3,766 (18.8) 3,962 (22.8) 11,937 13,551 14,379 16,104 18,520
ARV 4,912 3,818 28.7 4,434 10.8 9,725 12,515 18,628 20,863 22,950
Total Formulations 52,055 54,012 (3.6) 56,824 (8.4) 1,61,571 2,00,119 2,16,860 2,37,912 2,68,901
Active Pharmaceuticals Ingredients (API)
Betalactum 4,086 5,392 (24.2) 3,868 5.6 21,459 19,989 17,301 18,166 20,346
Non Betalactum 3,857 2,164 78.2 2,956 30.5 12,571 10,845 13,558 15,456 17,002
Total API 7,943 7,556 5.1 6,824 16.4 34,030 30,834 30,859 33,622 37,348
Consolidated Sales 59,998 61,568 (2.6) 63,648 (5.7) 1,95,601 2,30,953 2,47,719 2,71,534 3,06,248
Dossier Income 18 17 5.9 0 35 32 28 50 50
Revenue from Operations 60,016 61,585 (2.5) 63,648 (5.7) 1,95,636 2,30,985 2,47,747 2,71,584 3,06,298
Source: Company, Centrum Research estimates
Fig 4: US revenue breakup
USD $ mn FY18 FY19 FY20 FY21 FY22E FY23E
Orals 788 901 1040 1135 1195 1280
Injectables 183 213 277 254 356 40
OTC 34 42 47 51 56 10
Natrol 126 135 157 151 0 -100
Spectrum 8 101 105 126 20
Total US Sales 1131 1299 1622 1696 1733 1963
Growth (%) 14.9% 24.9% 4.5% 2.2% 13.3% Source: Company, Centrum Research estimates
Fig 5: Quarterly Financials
YE March (Rs mn) Q4FY19 Q1FY20 Q2FY20 Q3FY20 Q4FY20 Q1FY21 Q2FY21 Q3FY21 Q4FY21
Revenues 52,020 53,568 55,183 57,994 60,634 58,352 63,779 63,531 59,917
Materials cost 23,726 22,985 23,683 25,650 25,034 24,074 25,157 25,723 24,071
% of revenues 45.6% 42.9% 42.9% 44.2% 41.3% 41.3% 39.4% 40.5% 40.2%
Employee cost 7134.6 7798.6 7771.9 7978 8643 8879.9 9119 8807.3 8544
% of revenues 13.7% 14.6% 14.1% 13.8% 14.3% 15.2% 14.3% 13.9% 14.3%
Others 11486.4 12198 13147.4 13241.6 14744.9 13720.4 16230.1 15433.3 14653.4
% of revenues 22.1% 22.8% 23.8% 22.8% 24.3% 23.5% 25.4% 24.3% 24.5%
EBITDA 10,575 9,863 11,402 12,080 13,162 12,574 14,328 13,686 12,747
EBITDA margin (%) 20.3% 18.4% 20.7% 20.8% 21.7% 21.5% 22.5% 21.5% 21.3%
Depreciation & amortisation 1866.4 2408.6 2433.1 2433.1 2324 2555.2 2573.4 2765.2 2660
Interest expenses 500.8 498.9 409.4 371 318.3 210.7 157.1 194.9 182.2
Other income 322.7 157.8 206.2 219.8 325.9 1155.9 537.5 1334 781
Exceptional items 361.80 127.00 127.00 129.00 122.00 - - (21,098.40) (6.90)
PBT 8,530 7,148 8,766 9,496 10,846 10,964 12,135 12,060 10,686
Taxes 2311.2 2277.6 2243.7 2328.6 2285 3036.7 3873.3 3550.3 2596.9
Effective tax rate (%) 27.1% 31.9% 25.6% 24.5% 21.1% 27.7% 31.9% 29.4% 24.3%
PAT 6,219 6,380 6,522 7,167 8,561 7,927 8,262 8,509 8,089
Minority/Associates -6.8 47 0 -6.4 193 120 205.3 -144.6 -83.7
Reported PAT 5,854 6,300 6,395 7,032 8,490 7,807 8,057 29,463 8,012
Source: Company, Centrum Research
Aurobindo Pharma
8 Centrum Institutional Research
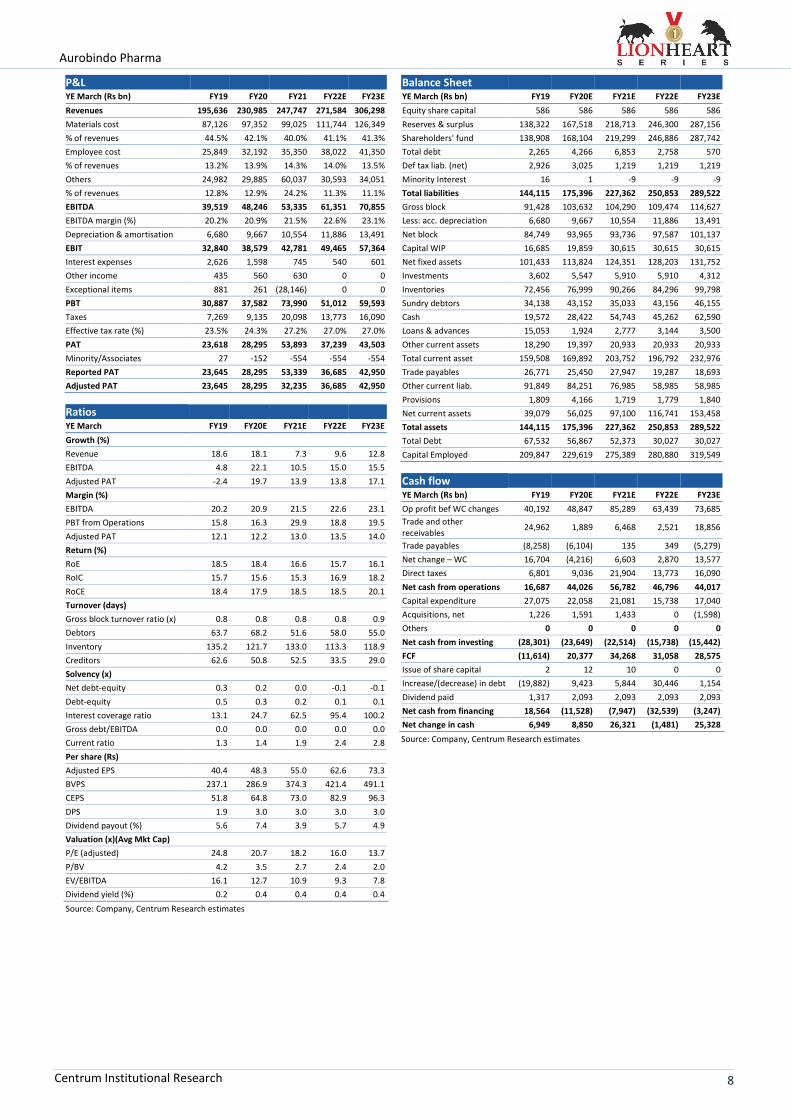
P&L
YE March (Rs bn) FY19 FY20 FY21 FY22E FY23E
Revenues 195,636 230,985 247,747 271,584 306,298
Materials cost 87,126 97,352 99,025 111,744 126,349
% of revenues 44.5% 42.1% 40.0% 41.1% 41.3%
Employee cost 25,849 32,192 35,350 38,022 41,350
% of revenues 13.2% 13.9% 14.3% 14.0% 13.5%
Others 24,982 29,885 60,037 30,593 34,051
% of revenues 12.8% 12.9% 24.2% 11.3% 11.1%
EBITDA 39,519 48,246 53,335 61,351 70,855
EBITDA margin (%) 20.2% 20.9% 21.5% 22.6% 23.1%
Depreciation & amortisation 6,680 9,667 10,554 11,886 13,491
EBIT 32,840 38,579 42,781 49,465 57,364
Interest expenses 2,626 1,598 745 540 601
Other income 435 560 630 0 0
Exceptional items 881 261 (28,146) 0 0
PBT 30,887 37,582 73,990 51,012 59,593
Taxes 7,269 9,135 20,098 13,773 16,090
Effective tax rate (%) 23.5% 24.3% 27.2% 27.0% 27.0%
PAT 23,618 28,295 53,893 37,239 43,503
Minority/Associates 27 -152 -554 -554 -554
Reported PAT 23,645 28,295 53,339 36,685 42,950
Adjusted PAT 23,645 28,295 32,235 36,685 42,950
Ratios
YE March FY19 FY20E FY21E FY22E FY23E
Growth (%)
Revenue 18.6 18.1 7.3 9.6 12.8
EBITDA 4.8 22.1 10.5 15.0 15.5
Adjusted PAT -2.4 19.7 13.9 13.8 17.1
Margin (%)
EBITDA 20.2 20.9 21.5 22.6 23.1
PBT from Operations 15.8 16.3 29.9 18.8 19.5
Adjusted PAT 12.1 12.2 13.0 13.5 14.0
Return (%)
RoE 18.5 18.4 16.6 15.7 16.1
RoIC 15.7 15.6 15.3 16.9 18.2
RoCE 18.4 17.9 18.5 18.5 20.1
Turnover (days)
Gross block turnover ratio (x) 0.8 0.8 0.8 0.8 0.9
Debtors 63.7 68.2 51.6 58.0 55.0
Inventory 135.2 121.7 133.0 113.3 118.9
Creditors 62.6 50.8 52.5 33.5 29.0
Solvency (x)
Net debt-equity 0.3 0.2 0.0 -0.1 -0.1
Debt-equity 0.5 0.3 0.2 0.1 0.1
Interest coverage ratio 13.1 24.7 62.5 95.4 100.2
Gross debt/EBITDA 0.0 0.0 0.0 0.0 0.0
Current ratio 1.3 1.4 1.9 2.4 2.8
Per share (Rs)
Adjusted EPS 40.4 48.3 55.0 62.6 73.3
BVPS 237.1 286.9 374.3 421.4 491.1
CEPS 51.8 64.8 73.0 82.9 96.3
DPS 1.9 3.0 3.0 3.0 3.0
Dividend payout (%) 5.6 7.4 3.9 5.7 4.9
Valuation (x)(Avg Mkt Cap)
P/E (adjusted) 24.8 20.7 18.2 16.0 13.7
P/BV 4.2 3.5 2.7 2.4 2.0
EV/EBITDA 16.1 12.7 10.9 9.3 7.8
Dividend yield (%) 0.2 0.4 0.4 0.4 0.4
Source: Company, Centrum Research estimates
Balance Sheet
YE March (Rs bn) FY19 FY20E FY21E FY22E FY23E
Equity share capital 586 586 586 586 586
Reserves & surplus 138,322 167,518 218,713 246,300 287,156
Shareholders' fund 138,908 168,104 219,299 246,886 287,742
Total debt 2,265 4,266 6,853 2,758 570
Def tax liab. (net) 2,926 3,025 1,219 1,219 1,219
Minority Interest 16 1 -9 -9 -9
Total liabilities 144,115 175,396 227,362 250,853 289,522
Gross block 91,428 103,632 104,290 109,474 114,627
Less: acc. depreciation 6,680 9,667 10,554 11,886 13,491
Net block 84,749 93,965 93,736 97,587 101,137
Capital WIP 16,685 19,859 30,615 30,615 30,615
Net fixed assets 101,433 113,824 124,351 128,203 131,752
Investments 3,602 5,547 5,910 5,910 4,312
Inventories 72,456 76,999 90,266 84,296 99,798
Sundry debtors 34,138 43,152 35,033 43,156 46,155
Cash 19,572 28,422 54,743 45,262 62,590
Loans & advances 15,053 1,924 2,777 3,144 3,500
Other current assets 18,290 19,397 20,933 20,933 20,933
Total current asset 159,508 169,892 203,752 196,792 232,976
Trade payables 26,771 25,450 27,947 19,287 18,693
Other current liab. 91,849 84,251 76,985 58,985 58,985
Provisions 1,809 4,166 1,719 1,779 1,840
Net current assets 39,079 56,025 97,100 116,741 153,458
Total assets 144,115 175,396 227,362 250,853 289,522
Total Debt 67,532 56,867 52,373 30,027 30,027
Capital Employed 209,847 229,619 275,389 280,880 319,549
Cash flow
YE March (Rs bn) FY19 FY20E FY21E FY22E FY23E
Op profit bef WC changes 40,192 48,847 85,289 63,439 73,685
Trade and other receivables
24,962 1,889 6,468 2,521 18,856
Trade payables (8,258) (6,104) 135 349 (5,279)
Net change – WC 16,704 (4,216) 6,603 2,870 13,577
Direct taxes 6,801 9,036 21,904 13,773 16,090
Net cash from operations 16,687 44,026 56,782 46,796 44,017
Capital expenditure 27,075 22,058 21,081 15,738 17,040
Acquisitions, net 1,226 1,591 1,433 0 (1,598)
Others 0 0 0 0 0
Net cash from investing (28,301) (23,649) (22,514) (15,738) (15,442)
FCF (11,614) 20,377 34,268 31,058 28,575
Issue of share capital 2 12 10 0 0
Increase/(decrease) in debt (19,882) 9,423 5,844 30,446 1,154
Dividend paid 1,317 2,093 2,093 2,093 2,093
Net cash from financing 18,564 (11,528) (7,947) (32,539) (3,247)
Net change in cash 6,949 8,850 26,321 (1,481) 25,328
Source: Company, Centrum Research estimates
Aurobindo Pharma
9 Centrum Institutional Research
Disclaimer
Centrum Broking Limited (“Centrum”) is a full-service, Stock Broking Company and a member of The Stock Exchange, Mumbai (BSE) and National Stock Exchange of India Ltd. (NSE). Our holding company, Centrum Capital Ltd, is an investment banker and an underwriter of securities. As a group Centrum has Investment Banking, Advisory and other business relationships with a significant percentage of the companies covered by our Research Group. Our research professionals provide important inputs into the Group's Investment Banking and other business selection processes. Recipients of this report should assume that our Group is seeking or may seek or will seek Investment Banking, advisory, project finance or other businesses and may receive commission, brokerage, fees or other compensation from the company or companies that are the subject of this material/report. Our Company and Group companies and their officers, directors and employees, including the analysts and others involved in the preparation or issuance of this material and their dependants, may on the date of this report or from, time to time have "long" or "short" positions in, act as principal in, and buy or sell the securities or derivatives thereof of companies mentioned herein. Centrum or its affiliates do not own 1% or more in the equity of this company Our sales people, dealers, traders and other professionals may provide oral or written market commentary or trading strategies to our clients that reflect opinions that are contrary to the opinions expressed herein, and our proprietary trading and investing businesses may make investment decisions that are inconsistent with the recommendations expressed herein. We may have earlier issued or may issue in future reports on the companies covered herein with recommendations/ information inconsistent or different those made in this report. In reviewing this document, you should be aware that any or all of the foregoing, among other things, may give rise to or potential conflicts of interest. We and our Group may rely on information barriers, such as "Chinese Walls" to control the flow of information contained in one or more areas within us, or other areas, units, groups or affiliates of Centrum. Centrum or its affiliates do not make a market in the security of the company for which this report or any report was written. Further, Centrum or its affiliates did not make a market in the subject company’s securities at the time that the research report was published. This report is for information purposes only and this document/material should not be construed as an offer to sell or the solicitation of an offer to buy, purchase or subscribe to any securities, and neither this document nor anything contained herein shall form the basis of or be relied upon in connection with any contract or commitment whatsoever. This document does not solicit any action based on the material contained herein. It is for the general information of the clients of Centrum. Though disseminated to clients simultaneously, not all clients may receive this report at the same time. Centrum will not treat recipients as clients by virtue of their receiving this report. It does not constitute a personal recommendation or take into account the particular investment objectives, financial situations, or needs of individual clients. Similarly, this document does not have regard to the specific investment objectives, financial situation/circumstances and the particular needs of any specific person who may receive this document. The securities discussed in this report may not be suitable for all investors. The securities described herein may not be eligible for sale in all jurisdictions or to all categories of investors. The countries in which the companies mentioned in this report are organized may have restrictions on investments, voting rights or dealings in securities by nationals of other countries. The appropriateness of a particular investment or strategy will depend on an investor's individual circumstances and objectives. Persons who may receive this document should consider and independently evaluate whether it is suitable for his/ her/their particular circumstances and, if necessary, seek professional/financial advice. Any such person shall be responsible for conducting his/her/their own investigation and analysis of the information contained or referred to in this document and of evaluating the merits and risks involved in the securities forming the subject matter of this document. The projections and forecasts described in this report were based upon a number of estimates and assumptions and are inherently subject to significant uncertainties and contingencies. Projections and forecasts are necessarily speculative in nature, and it can be expected that one or more of the estimates on which the projections and forecasts were based will not materialize or will vary significantly from actual results, and such variances will likely increase over time. All projections and forecasts described in this report have been prepared solely by the authors of this report independently of the Company. These projections and forecasts were not prepared with a view toward compliance with published guidelines or generally accepted accounting principles. No independent accountants have expressed an opinion or any other form of assurance on these projections or forecasts. You should not regard the inclusion of the projections and forecasts described herein as a representation or warranty by or on behalf of the Company, Centrum, the authors of this report or any other person that these projections or forecasts or their underlying assumptions will be achieved. For these reasons, you should only consider the projections and forecasts described in this report after carefully evaluating all of the information in this report, including the assumptions underlying such projections and forecasts. The price and value of the investments referred to in this document/material and the income from them may go down as well as up, and investors may realize losses on any investments. Past performance is not a guide for future performance. Future returns are not guaranteed and a loss of original capital may occur. Actual results may differ materially from those set forth in projections. Forward-looking statements are not predictions and may be subject to change without notice. Centrum does not provide tax advice to its clients, and all investors are strongly advised to consult regarding any potential investment. Centrum and its affiliates accept no liabilities for any loss or damage of any kind arising out of the use of this report. Foreign currencies denominated securities are subject to fluctuations in exchange rates that could have an adverse effect on the value or price of or income derived from the investment. In addition, investors in securities such as ADRs, the value of which are influenced by foreign currencies effectively assume currency risk. Certain transactions including those involving futures, options, and other derivatives as well as non-investment-grade securities give rise to substantial risk and are not suitable for all investors. Please ensure that you have read and understood the current risk disclosure documents before entering into any derivative transactions. This report/document has been prepared by Centrum, based upon information available to the public and sources, believed to be reliable. No representation or warranty, express or implied is made that it is accurate or complete. Centrum has reviewed the report and, in so far as it includes current or historical information, it is believed to be reliable, although its accuracy and completeness cannot be guaranteed. The opinions expressed in this document/material are subject to change without notice and have no obligation to tell you when opinions or information in this report change. This report or recommendations or information contained herein do/does not constitute or purport to constitute investment advice in publicly accessible media and should not be reproduced, transmitted or published by the recipient. The report is for the use and consumption of the recipient only. This publication may not be distributed to the public used by the public media without the express written consent of Centrum. This report or any portion hereof may not be printed, sold or distributed without the written consent of Centrum. The distribution of this document in other jurisdictions may be restricted by law, and persons into whose possession this document comes should inform themselves about, and observe, any such restrictions. Neither Centrum nor its directors, employees, agents or representatives shall be liable for any damages whether direct or indirect, incidental, special or consequential including lost revenue or lost profits that may arise from or in connection with the use of the information. This document does not constitute an offer or invitation to subscribe for or purchase or deal in any securities and neither this document nor anything contained herein shall form the basis of any contract or commitment whatsoever. This document is strictly confidential and is being furnished to you solely for your information, may not be distributed to the press or other media and may not be reproduced or redistributed to any other person. The distribution of this report in other jurisdictions may be restricted by law and persons into whose possession this report comes should inform themselves about, and observe any such restrictions. By accepting this report, you agree to be bound by the fore going limitations. No representation is made that this report is accurate or complete. The opinions and projections expressed herein are entirely those of the author and are given as part of the normal research activity of Centrum Broking and are given as of this date and are subject to change without notice. Any opinion estimate or projection herein constitutes a view as of the date of this report and there can be no assurance that future results or events will be consistent with any such opinions, estimate or projection. This document has not been prepared by or in conjunction with or on behalf of or at the instigation of, or by arrangement with the company or any of its directors or any other person. Information in this document must not be relied upon as having been authorized or approved by the company or its directors
Aurobindo Pharma
10 Centrum Institutional Research
or any other person. Any opinions and projections contained herein are entirely those of the authors. None of the company or its directors or any other person accepts any liability whatsoever for any loss arising from any use of this document or its contents or otherwise arising in connection therewith. Centrum and its affiliates have not managed or co-managed a public offering for the subject company in the preceding twelve months. Centrum and affiliates have not received compensation from the companies mentioned in the report during the period preceding twelve months from the date of this report for service in respect of public offerings, corporate finance, debt restructuring, investment banking or other advisory services in a merger/acquisition or some other sort of specific transaction. As per the declarations given by Cyndrella Carvalho research analyst and and/or any of her family members do not serve as an officer, director or any way connected to the company/companies mentioned in this report. Further, as declared by her, she has not received any compensation from the above companies in the preceding twelve months. He does not hold any shares by him or through his relatives or in case if holds the shares then will not to do any transactions in the said scrip for 30 days from the date of release such report. Our entire research professionals are our employees and are paid a salary. They do not have any other material conflict of interest of the research analyst or member of which the research analyst knows of has reason to know at the time of publication of the research report or at the time of the public appearance. While we would endeavour to update the information herein on a reasonable basis, Centrum, its associated companies, their directors and employees are under no obligation to update or keep the information current. Also, there may be regulatory, compliance or other reasons that may prevent Centrum from doing so. Non-rated securities indicate that rating on a particular security has been suspended temporarily and such suspension is in compliance with applicable regulations and/or Centrum policies, in circumstances where Centrum is acting in an advisory capacity to this company, or any certain other circumstances. This report is not directed to, or intended for distribution to or use by, any person or entity who is a citizen or resident of or located in any locality, state, country or other jurisdiction where such distribution, publication, availability or use would be contrary to law or regulation or which would subject Centrum Broking Limited or its group companies to any registration or licensing requirement within such jurisdiction. Specifically, this document does not constitute an offer to or solicitation to any U.S. person for the purchase or sale of any financial instrument or as an official confirmation of any transaction to any U.S. person unless otherwise stated, this message should not be construed as official confirmation of any transaction. No part of this document may be distributed in Canada or used by private customers in United Kingdom. The information contained herein is not intended for publication or distribution or circulation in any manner whatsoever and any unauthorized reading, dissemination, distribution or copying of this communication is prohibited unless otherwise expressly authorized. Please ensure that you have read “Risk Disclosure Document for Capital Market and Derivatives Segments” as prescribed by Securities and Exchange Board of India before investing in Indian Securities Market.
Ratings definitions
Our ratings denote the following 12-month forecast returns:
Buy – The stock is expected to return above 15%.
Add – The stock is expected to return 5-15%.
Reduce – The stock is expected to deliver -5-+5% returns.
Sell – The stock is expected to deliver <-5% returns.
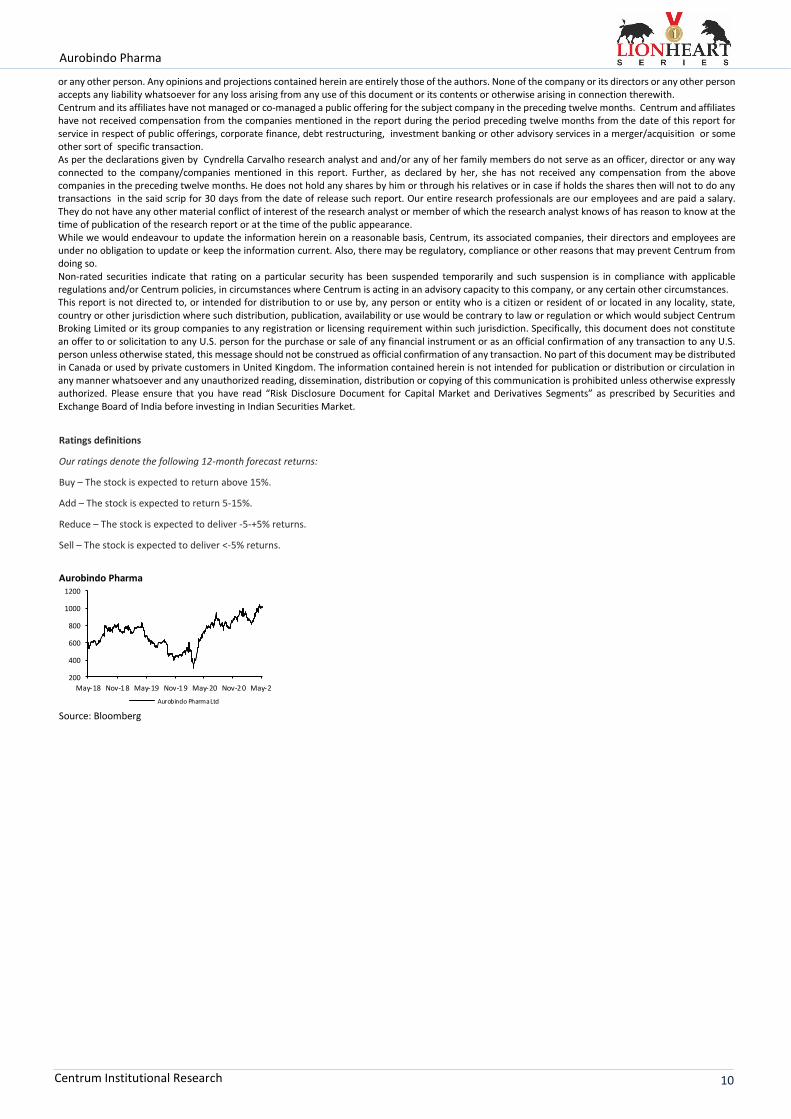
Aurobindo Pharma
Source: Bloomberg
200
400
600
800
1000
1200
May-18 Nov-1 8 May-19 Nov-19 May-20 Nov-2 0 May-21
Aurobindo Pharma Ltd
Aurobindo Pharma
11 Centrum Institutional Research
Aurobindo Pharma
4 Whether Research analyst’s or relatives’ have any financial interest in the subject company and nature of such financial interest No
5 Whether Research analyst or relatives have actual / beneficial ownership of 1% or more in securities of the subject company at the end of the month immediately preceding the date of publication of the document.
No
6 Whether the research analyst or his relatives has any other material conflict of interest No
7 Whether research analyst has received any compensation from the subject company in the past 12 months and nature of products / services for which such compensation is received
No
8 Whether the Research Analyst has received any compensation or any other benefits from the subject company or third party in connection with the research report
No
9 Whether Research Analysts has served as an officer, director or employee of the subject company No
10 Whether the Research Analyst has been engaged in market making activity of the subject company. No
11 Whether it or its associates have managed or co-managed public offering of securities for the subject company in the past twelve months; No
12 Whether it or its associates have received any compensation for investment banking or merchant banking or brokerage services from the subject company in the past twelve months;
No
13 Whether it or its associates have received any compensation for products or services other than investment banking or merchant banking or brokerage services from the subject company in the past twelve months;
No
Member (NSE and BSE). Member MSEI (Inactive)
Single SEBI Regn No.: INZ000205331
Depository Participant (DP)
CDSL DP ID: 120 – 12200 SEBI REGD NO. : CDSL : IN-DP-CDSL-661-2012
PORTFOLIO MANAGER
SEBI REGN NO.: INP000004383
Research Analyst
SEBI Registration No. INH000001469
Mutual Fund Distributor AMFI REGN No. ARN- 147569
Website: www.centrum.co.in
Investor Grievance Email ID: [email protected]
Compliance Officer Details: Ashok D Kadambi
(022) 4215 9937; Email ID: [email protected]
Centrum Broking Ltd. (CIN :U67120MH1994PLC078125)
Registered Office Address Bombay Mutual Building , 2nd Floor, Dr. D. N. Road, Fort, Mumbai - 400 001
Corporate Office & Correspondence Address Centrum House
6th Floor, CST Road, Near Vidya Nagari Marg, Kalina, Santacruz (E), Mumbai 400 098.
Tel: (022) 4215 9000 Fax: +91 22 4215 9344
Disclosure of Interest Statement
1 Business activities of Centrum Broking Limited (CBL)
Centrum Broking Limited (hereinafter referred to as “CBL”) is a registered member of NSE (Cash, F&O and Currency Derivatives Segments), MCX-SX (Currency Derivatives Segment) and BSE (Cash segment), Depository Participant of CDSL and a SEBI registered Portfolio Manager.
2 Details of Disciplinary History of CBL CBL has not been debarred/ suspended by SEBI or any other regulatory authority from accessing /dealing in securities market.
3 Registration status of CBL: CBL is registered with SEBI as a Research Analyst (SEBI Registration No. INH000001469)
Aurobindo Pharma
12 Centrum Institutional Research
Centrum Broking Institutional Equities Team Details
Nischal Maheshwari CEO [email protected] +91-22-4215 9841
Research Analyst Sector E-mail Phone number
Anish Rankawat Auto & Auto Ancillary [email protected] +91-22-4215 9053
Gaurav Jani BFSI [email protected] +91-22-4215 9110
Chirag Muchhala Capital Goods & Consumer Durables [email protected] +91-22-4215 9203
Milind S Raginwar Cement & Building Materials [email protected] +91-22-4215 9201
Shirish Pardeshi FMCG [email protected] +91-22-4215 9634
Ashish Shah Infra & Aviation [email protected] +91-22-4215 9021
Ashish Kejriwal Metals &Mining [email protected] +91-22-4215 9855
Probal Sen Oil & Gas [email protected] +91-22-4215 9001
Cyndrella Carvalho Pharma [email protected] +91-22-4215 9643
Subhankar Sanyal Economist [email protected] +91-22-4215 9035
Alternative Research Desk Quant [email protected] +91-22-42159636
Equity Sales Designation Email Phone number
Rajesh Makharia Director [email protected] +91-22-4215 9854
Paresh Shah MD [email protected] +91-22-4215 9617
Anil Chaurasia Sr. VP [email protected] +91-22-4215 9631
Amit Kapoor Sr. VP [email protected] +91-22-4215 9980
Himani Sanghavi AVP [email protected] +91-22-4215 9082
Saahil Harwani Associate [email protected] +91-22-4215 9623