Embed Size (px)
Citation preview
Australasian Journal of Economics Education
Volume 7 Number 1 March 2010 ARTICLES Emission Control: Efficiency in Gerald Visgilio the Textbook Model Teaching Open-Economy Gordon Menzies Macroeconomics with Implicit Aggregate Supply on a Single Diagram Teaching Economics with Short Stories Philip J. Ruder Reducing the Expectations Gap: Using Peter Docherty an Academic Literacies Approach to Harry Tse Improve Student Writing in Economics ISSN 1448-448 X

Editorial Executive Co-Editor Professor Rod O’Donnell Telephone: (+61 2) 9514 7738 Email: [email protected] Co-Editor Dr Peter Docherty Telephone: (+61 2) 9514 7780 Email: [email protected] Co-Editor Mr Joseph Macri Telephone: (+61 2) 9850 6069 Email: [email protected]
Editorial Board Professor William J. Baumol, New York University, USA. Professor Harry Bloch, Curtin University of Technology, Australia. Professor Bruce Chapman, Australian National University. Professor Kenneth Clements, University of Western Australia. Professor David Colander, Middlebury College, Vermont, USA. Professor John Foster, University of Queensland, Australia. Professor Andrew Hannan, University of Plymouth, UK. Professor Yujiro Hayami, Foundation for Advanced Studies in
International Development, Japan. Professor Tim Hazledine, University of Auckland, New Zealand. Professor K.L. Krishna, Delhi School of Economics, India. Professor Alan Luke, Nanyang Technological University, Singapore. Professor Rod O’Donnell, Macquarie University, Australia. Professor David Round, University of South Australia. Professor Daniel Rubinfeld, University of California, Berkeley, USA. Professor Warren Samuels, Michigan State University, USA. Professor Amartya Sen, Harvard University, USA. Professor John Siegfried, Vanderbilt University, USA. Professor Jim Taylor, University of Lancaster, UK.
Secondary School Teaching Representatives Mr Doug Cave, Queensland Economics Teachers Association. Mr Ian Searle, Brisbane Boys Grammar.
AUSTRALASIAN JOURNAL OF ECONOMICS EDUCATION
MISSION STATEMENT The Australasian Journal of Economics Education is a peer-reviewed journal that publishes papers on all aspects of economics education. With a view to fostering scholarship in the teaching and learning of economics, it provides a forum for publishing high quality papers and seeks to bring the results to a widening audience. Given both the increasing diversity of the student clientele, and increasing calls for greater attention to the quality of tertiary teaching, this Journal seeks to foster debate on such issues as teaching techniques, innovations in the teaching of economics, student responses to such teaching, and the incentive systems which influence the academic teaching environment. The AJEE is interested in research involving both quantitative and qualitative analyses and also in interpretative analyses based on case studies. While the Journal is Australasian-focussed, it encourages contributions from other countries in order to promote an international perspective on the issues that confront the economics discipline. AJEE aspires to: 1. Report research on the teaching of economics, and cultivate heightened interest in the teaching of economics and the scholarship of teaching. Pedagogical issues will be a central feature, and will encompass work on the teaching of economics in diverse contexts, including large and small classes, undergraduate and postgraduate classes, distance learning, issues confronting foreign students on-shore and off-shore, and issues related to the teaching of fee-paying MBA and other post-graduate groups from diverse disciplinary backgrounds. Though economics is the prime focus, consideration will also be given to work on other subjects that have a demonstrated relevance for the teaching of economics. Such issues will also involve evolutionary issues in the teaching of economics, in terms both of effective ways to teach evolving theory and of evolving technology with which to teach that theory (including on-line teaching). Recognition will be given to the fact that economics as a discipline has not fared well in CEQ results (course experience questionnaire
results) since the reporting of those results began in Australia. Nor has economics teaching typically been well received in the USA or UK, according to survey evidence. In that context the relevance to teaching of changing administrative arrangements in universities will also be highlighted (eg in terms of contemporary quality assurance procedures and other government policy changes in Australia and New Zealand). 2. Report research on the nexus between teaching and research (including research on the diverse, changing and potentially conflicting incentives within the academic industry). Papers exploring the extent to which research and teaching activities are complementary or competitive will be welcomed. 3. Recognise the relevance of some more deep-seated implicit assumptions and issues of economic philosophy embedded in what is commonly taught, (as in Sen’s work on economics and ethics, for example). Inter alia, the question arises as to the way in which students respond to economics taught as a path to scientific certainty, as against economics taught as reflecting unsettled debate and vigorous controversy. 4. Recognise the place of history in the teaching of economics. Both HET and economic history tend to play a diminishing role in professional economics training, as emphasis on technique dominates. This a-historical approach to the teaching of economics has been criticised by many influential economists (including Joan Robinson, Leontief, Myrdal, Colander, and Robert Clower in his acerbic remarks about the value of much that is published in such prestigious journals as the AER). This line of criticism has been continued in the recent growth of heterodox economics associations in a number of countries (including one for Australia and New Zealand) and on the web through the Post Autistic Economics (PAE) newsletter. Historical and institutional factors will thus provide one focal interest. 5. Recognise interdisciplinary issues important to the presentation of economics in various contexts. On the one hand, economics students are not systematically exposed to the insights of other social sciences and the conformity or otherwise of their conclusions with those of economics. On the other hand, other disciplines within the social sciences and humanities (e.g. the Social Work profession) do not always include even an introduction to economics for their students, notwithstanding that economic issues are often very important
determinants of the environment within which they operate. More fundamentally, questions arise as to whether social science is more than the sum of its respective parts, and as to whether the roots of economics can be fully understood in isolation from the history not only of economics but also of politics and philosophy. 6. Establish a link to the teaching of economics in the secondary schools, given that tertiary enrolments in economics reflect fluctuating enrolments in economics in the secondary schools. 7. Encourage on-going surveys of student response to the teaching of economics across Australasian (and other) institutions, including response to experimental teaching and to differences between institutional approaches. (c.f. Colander and Klamer’s 1988 survey of economics students at USA ivy league institutions.) 8. Monitor trends in the teaching of economics both globally and in the Australian and New Zealand university systems (such as enrolments, staff-student ratios, international-domestic student ratios, offshore offerings etc), and the implications of those trends for various funding arrangements. 9. Promote a series of papers on specialised themes within the overall province of the teaching of economics e.g. on the teaching of Principles courses, the teaching of History of Economic Thought, the teaching of intermediate microeconomics and macroeconomics, the teaching of development economics, and likewise regarding teaching in such streams as Quantitative Methods, large first year classes, non-English speaking background students, the teaching of economics to non-economists, product differentiation in teaching economics, and professional education in economics in executive education programs outside conventional university contexts. 10. Monitor the measuring and rewarding of quality (economics) teaching within Australasian universities.
AUSTRALASIAN JOURNAL OF ECONOMICS EDUCATION
Volume 7, Number 1
March, 2010
CONTENTS
ARTICLES Emission Control: Efficiency in the Textbook Model
Gerald Visgilio 1
Teaching Open-Economy Macroeconomics with Implicit Aggregate Supply on a Single Diagram
Gordon Menzies 9
Teaching Economics with Short Stories
Philip J. Ruder 20
Reducing the Expectations Gap: Using an Academic Literacies Approach to Improve Student Writing in Economics
Peter Docherty & Harry Tse
31

Australasian Journal of Economics Education Volume 7, Number 1, 2010, pp.1-8
EMISSION CONTROL: EFFICIENCY IN THE
TEXTBOOK MODEL*
Gerald Visgilio
Connecticut College
ABSTRACT The authors of several leading undergraduate textbooks on environmental economics use an MD-MAC model to graphically show and explain emission control. Their analysis, however, is site specific with an individual emission source using a least cost strategy to abate its emissions at a specific location. In this paper I expand the traditional textbook model with a graphical representation of the net gain to society when an emission source changes its venue. Specifically, I use my analysis to evaluate various emission control policies in terms of whether or not an individual policy will bring about the efficient move.
Keywords: Emission control, pollution abatement.
JEL classifications: Q50, Q58 1. INTRODUCTION The teaching of environmental economics to undergraduate students has been greatly enhanced by the publication of several textbooks dealing with environmental and natural resource economics and policy. Field and Field (2009), Kahn (2005), Keohane and Olmstead (2007), Kolstad (2010), Tietenberg and Lewis (2009), and Ward (2006) are examples of excellent texts in this area. These authors use a comparative statics analysis to show and explain the economically efficient level of emissions. In their analysis, an emission source reduces its emissions in a cost-effective manner by selecting the best control strategy from a broad array of abatement activities that * Correspondence: Gerald Visgilio, Department of Economics, Connecticut College, Box 5571, 270 Mohegan Ave, New London, CT 06320, USA, Email: [email protected]. Thanks to two anonymous referees for comments and suggestions. ISSN 1448-448X © 2010 Australasian Journal of Economics Education
2 G. Visgilio
includes output reduction, input changes, technological improvements, waste treatment, residuals recycling, and site abandonment.
Although framed in a broad context, emission abatement is shown at a specific location.1
To facilitate discussion of the central issue posed in this paper, a graphical representation of Downing’s model is presented. Although my analysis draws from the conventional emission control model of most introductory environmental economics textbooks, the graphical analysis developed in this paper evaluates the effects of different emission control policies on the net gain to society from a change in the point of discharge. More specifically, this paper raises the question as to what type of emission control policy may bring about the efficient move for a polluting facility. By recognizing the net gain to society from a move, this paper also hopes to engender discussion among teachers and lecturers, especially those teaching courses in introductory environmental economics, about the concept of efficiency.
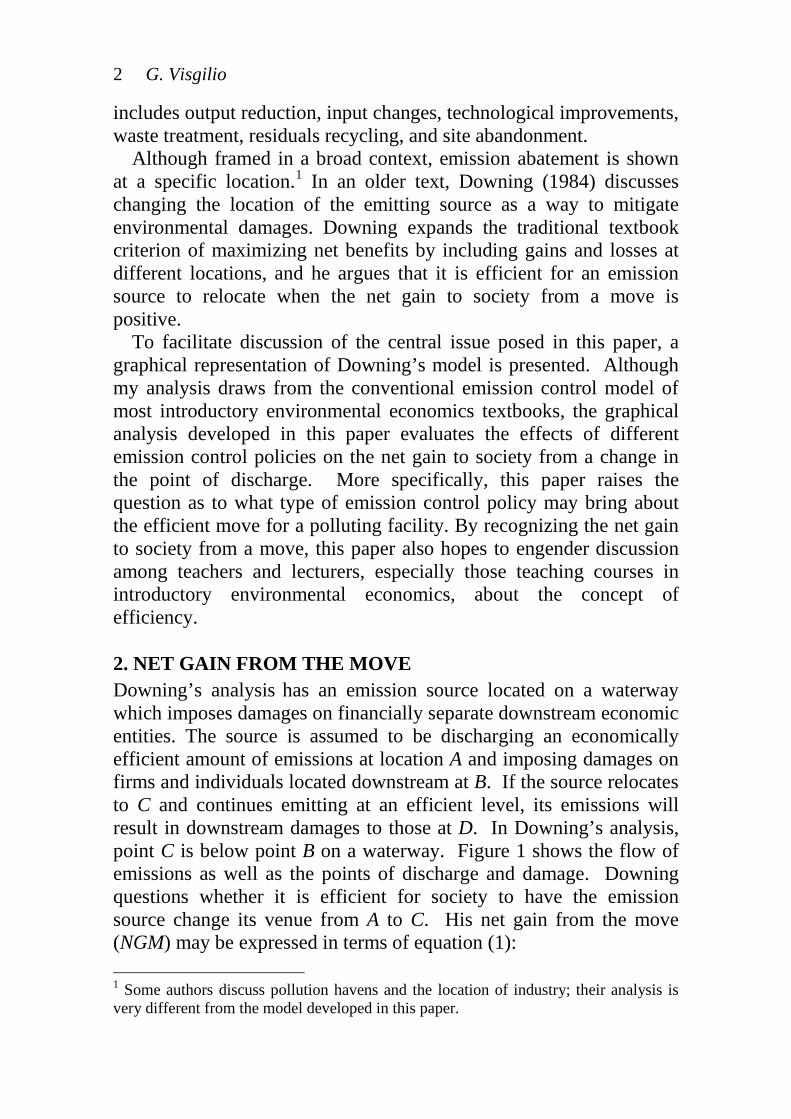
In an older text, Downing (1984) discusses changing the location of the emitting source as a way to mitigate environmental damages. Downing expands the traditional textbook criterion of maximizing net benefits by including gains and losses at different locations, and he argues that it is efficient for an emission source to relocate when the net gain to society from a move is positive.
2. NET GAIN FROM THE MOVE Downing’s analysis has an emission source located on a waterway which imposes damages on financially separate downstream economic entities. The source is assumed to be discharging an economically efficient amount of emissions at location A and imposing damages on firms and individuals located downstream at B. If the source relocates to C and continues emitting at an efficient level, its emissions will result in downstream damages to those at D. In Downing’s analysis, point C is below point B on a waterway. Figure 1 shows the flow of emissions as well as the points of discharge and damage. Downing questions whether it is efficient for society to have the emission source change its venue from A to C. His net gain from the move (NGM) may be expressed in terms of equation (1): 1 Some authors discuss pollution havens and the location of industry; their analysis is very different from the model developed in this paper.
Emission Control 3
Emissions
O----------------------O----------------------O----------------------O Discharge Damage Discharge Damage Point A Point B Point C Point D Upwind or Downwind or Upwind or Downwind or Upstream Downstream Upstream Downstream Figure 1: The Flow of Emissions with Points of Damage and Discharge 𝑁𝐺𝑀 = 𝑇𝐴𝐶𝐴 + 𝑇𝐷𝐵 − 𝑇𝑅𝐶𝐴𝐶 − 𝑇𝐴𝐶𝐶 − 𝑇𝐷𝐷 (1) where TACA is the total abatement cost saved when the source is no longer operating at A, TDB is the reduction in total damage at B as the result of the move from A to C, TRCAC is the total cost of relocating from A to C, TACC is the total abatement cost incurred by the source at C, and TDD is the total damage at D when the source is discharging at C. If NGM is positive, the source should relocate downstream. In this case, the move from A to C is efficient and society is better off.2
3. EMISSION CONTROL POLICIES AND THE EFFICIENT MOVE
Equation (1) is illustrated graphically in Figure 2.3
2 See Downing (1984), pp.82-83.
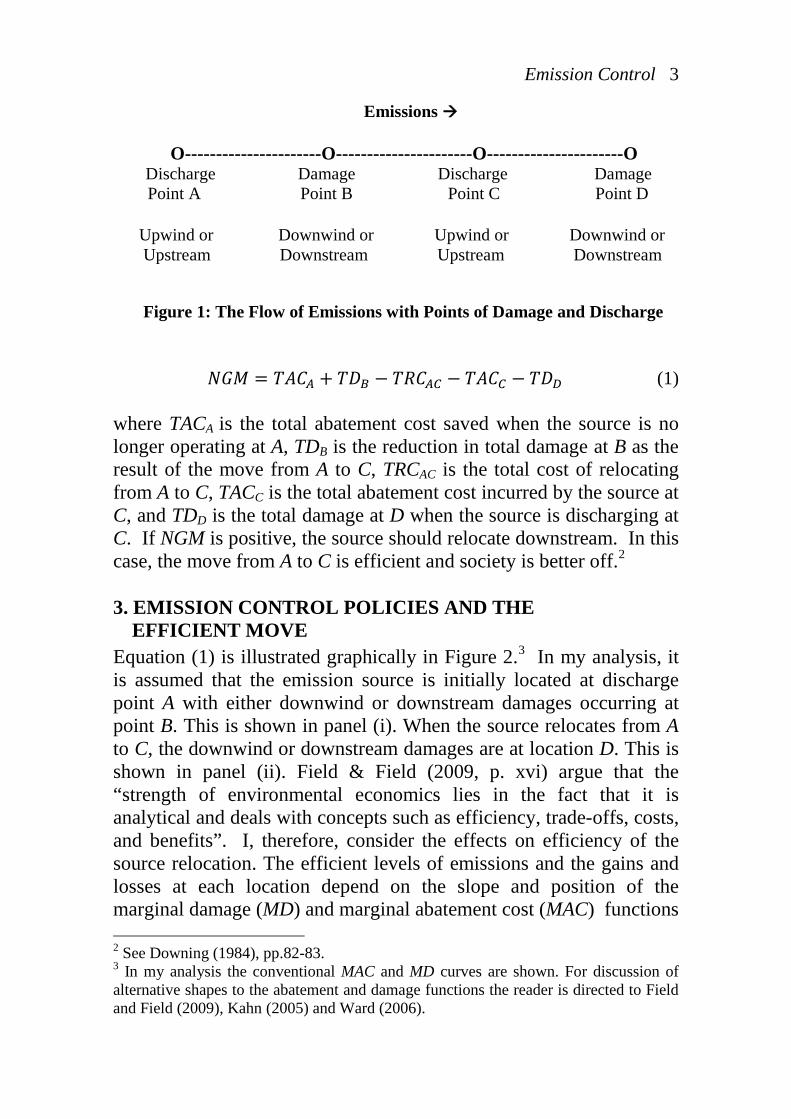
In my analysis, it is assumed that the emission source is initially located at discharge point A with either downwind or downstream damages occurring at point B. This is shown in panel (i). When the source relocates from A to C, the downwind or downstream damages are at location D. This is shown in panel (ii). Field & Field (2009, p. xvi) argue that the “strength of environmental economics lies in the fact that it is analytical and deals with concepts such as efficiency, trade-offs, costs, and benefits”. I, therefore, consider the effects on efficiency of the source relocation. The efficient levels of emissions and the gains and losses at each location depend on the slope and position of the marginal damage (MD) and marginal abatement cost (MAC) functions
3 In my analysis the conventional MAC and MD curves are shown. For discussion of alternative shapes to the abatement and damage functions the reader is directed to Field and Field (2009), Kahn (2005) and Ward (2006).
4 G. Visgilio
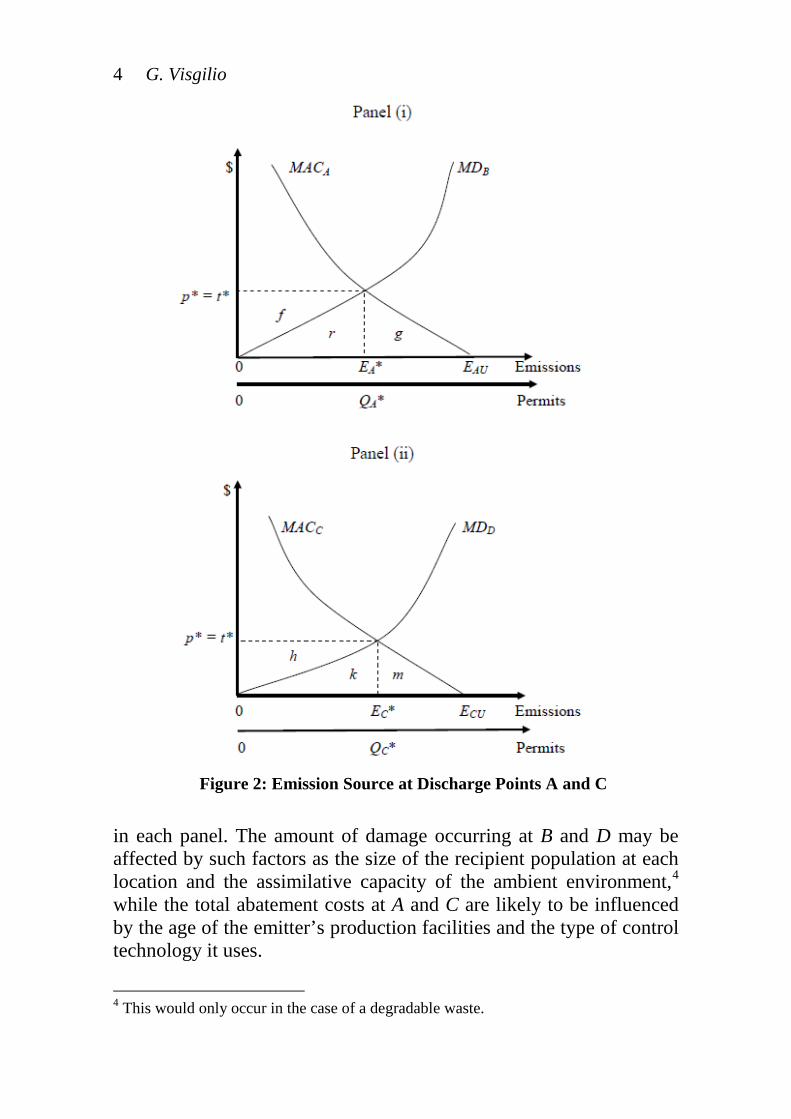
Figure 2: Emission Source at Discharge Points A and C in each panel. The amount of damage occurring at B and D may be affected by such factors as the size of the recipient population at each location and the assimilative capacity of the ambient environment,4
4 This would only occur in the case of a degradable waste.
while the total abatement costs at A and C are likely to be influenced by the age of the emitter’s production facilities and the type of control technology it uses.
Emission Control 5
In keeping with Downing’s analysis, the source generates the efficient amount of emissions at either discharge point.5
When the emission source is located at discharge point A in panel (i), EA* is the efficient level of emissions and EAU is the unregulated level. Total abatement cost is equal to area g when the source reduces its emissions from EAU to EA*, and total damage at location B is shown by area r. When the emission source changes its location, it will discharge at point C. In panel (ii), EC
* and ECU are respectively the efficient and unregulated levels of emission with total abatement cost now given by area m and total damage by area k. The cost of relocating from site A to C is not shown in my diagram. In this case equation (1) is rewritten as:
NGM = Area g + Area r - TRCAC - Area m - Area k (2) When the NGM is positive, the move from A to C is efficient.6
A command and control (CAC) policy, which sets an emission standard at the efficient level, legally requires the source to reduce its emissions from either EAU to EA* or from ECU to EC*. In panel (i), area g is the total abatement cost saved when the source ceases to operate at location A and area m is the abatement cost incurred when it relocates to site C. Since a CAC emission standard approach gives the source the right to discharge a specific amount of emissions, the damages given by area r and area k will always be external to the source’s decision to pollute at each location and to its decision to change its venue. In other words, the source does not consider TDB and TDD in equation (1) when deciding whether it should move from A to C. Although this CAC policy requires the emission source to discharge the efficient emissions at each location, under this policy the source may or may not make the efficient move. The source will move from discharge point A to discharge point C when (area g – area m) > TRCAC, and this move is also socially efficient if NGM > 0. As a consequence, a pollution control authority will have to evaluate
5 The efficient levels of emission at discharge points A and C are locally efficient. 6 The traditional textbook model is a single time period analysis with all costs and benefits occurring in the current period. In a more complex model, the move from A to C would still generate a one-time cost but the MAC and MD functions would occur in both the current and subsequent time periods. In this situation one would compare the discounted stream of costs and gains to the one-time cost of moving.
6 G. Visgilio
equation (1) to determine whether the move from location A to location C is efficient for society.
In contrast, an emission tax per unit of waste discharged may force the emission source to incur a cost that exceeds its downwind or downstream damage. With a tax of t* per unit of emissions, the source, depending on its location, makes a cost minimizing decision to reduce its emissions to either EA* or EC*. At location A, the source’s pollution related cost consists of its abatement cost given by area g and its tax bill represented by area f+r. This tax payment is greater than the damage at B by an amount equal to area f. In similar respect, area h represents the excess tax payment relative to the damages at D. With respect to equation (1), the emission source experiences a tax savings greater than TDB and it incurs a tax expense larger than TDC. The source in Figure 2, which pays for the right to pollute and at each discharge point operates efficiently, may make a decision that brings about the efficient move from point A to point C. The source will move when (area [f + r + g] – area [h + k + m]) > TRCAC, and this move is socially efficient if NGM > 0. However, the flatter the marginal damage functions, the closer the tax payments will approximate the damages at B and D. When the marginal damage functions at the downwind or downstream locations are horizontal, tax payments equal damages and a move by the emission source from A to C is efficient.
With a system of transferable discharge permits (TDPs), pollution permits may be initially auctioned off or given away. My analysis begins with the assumption that TDPs are sold in a competitive market at a price of p*. As a result, panel (i) of Figure 2 shows that the emission source at location A will purchase QA* permits and discharge EA* units of emissions, and that its pollution costs will equal to area g (abatement cost) and area f+r (permit cost). The polluter’s permit cost for the discharge of EA* unit of emissions exceeds the damage cost at B by the area f. Panel (ii) shows the relocation of the emitter to point C with an abatement cost given by area m and a permit cost by area h+k. The permit cost now exceeds the damages at location D by area h. In this scenario, the emission source bears the same pollution related expense as it did with the emission tax and, as previously shown, its decision to move also may be socially efficient. However, when TDPs are freely allocated, the polluter’s right to discharge is akin to the right granted under the aforementioned CAC emission
Emission Control 7
standard approach, and, as discussed, this situation may or may not lead to the efficient move.
A liability rule, which requires an emission source to pay compensatory damages, may bring about the efficient move from upstream to downstream. When a liability rule holds an emission source exactly liable for its damages, the source will internalize a cost just equal to its emission damages. As a consequence, when moving from A to C the source will consider an amount just equal to damages given by TDB and TDD in equation (1). Under this scheme, at discharge point A the source pays area r in damages in panel (i) of Figure 2, while at point C it pays area k in panel (ii). Since the source exactly compensates victims for damages and pays the cost of relocating from A to C, the move is always efficient. 4. CONCLUDING REMARKS The model used to frame the discussion of emission control in undergraduate textbooks is site specific. Several years ago, Downing expanded the traditional analysis by considering the net gain to society when an emission source changes its point of discharge. In this paper, the conventional textbook MD-MAC model is used to develop a graphical analysis of the NGM.
My analysis provides additional insight with respect to alternative emission control policies and the socially efficient move. Specifically, it addresses the issue of whether a particular control policy will force an emission source to internalize a cost just equal to its pollution damage and, as a result, make the efficient move. Because downwind or downstream damages are always external to both its decision to pollute and its decision to change location, my analysis shows that with a CAC emission standard approach the emission source’s decision to move is efficient when the net gain from the move is positive.
My model also examines three incentive based policies – an emission tax, TDPs, and a liability rule. It shows that under certain circumstances each of these approaches will lead to an efficient move. In contrast to CAC, incentive based policies require the emission source to pay for the right to pollute. More specifically, my analysis shows that a liability rule and, when marginal damages are constant, either an emission tax or TDPs with initially auctioned permits forces the source to internalize a cost just equal to its damages. As a result,
8 G. Visgilio
these moves are socially efficient. There are, of course, other variations of these control strategies and alternative situations that could be evaluated in terms an efficient move. I leave that task to the interested reader. REFERENCES Downing, P. B. (1984) Environmental Economics and Policy, Boston, MA:
Little, Brown and Company. Field, B.C. and Field, M. (2009) Environmental Economics: An
Introduction, 5th edition, New York: McGraw-Hill. Kahn, J. R. (2005) The Economic Approach to Environmental and Natural
Resources, 3rd edition, Fort Worth, TX: The Dryden Press. Keohane, N. O. and Olmstead, S.M (2007) Markets and the Environment,
Washington, DC: Island Press. Kolstad, C. D. (2010) Environmental Economics 2nd edition, New York:
Oxford University Press. Tietenberg, T. and Lewis, L. (2009) Environmental and Natural Resource
Economics, 8th edition, Reading, MA: Addison-Wesley. Ward, F. A. (2006) Environmental and Natural Resource Economics,
Upper Saddle River, NJ: Pearson/Prentice Hall.
Australasian Journal of Economics Education Volume 7, Number 1, 2010, pp.9-19
TEACHING OPEN-ECONOMY
MACROECONOMICS WITH IMPLICIT AGGREGATE SUPPLY ON A SINGLE DIAGRAM*
Gordon Menzies
School of Finance and Economics University of Technology, Sydney
ABSTRACT The standard IS/LM/BP macroeconomic model with infinite capital mobility, the so-called Mundell-Fleming model, remains a mainstay of teaching undergraduate open-economy macroeconomics. But Mundell-Fleming does not handle longer term issues including money neutrality, purchasing power parity and the long-run irrelevance of the exchange rate regime so well. University economics teachers usually move to augmented aggregate supply-aggregate demand frameworks to consider these matters with all the attendant complexity of building multiple frameworks. This paper argues that introducing an implicit aggregate supply inflation mechanism to the standard Mundell-Fleming model overcomes its limitations for addressing long run issues without the need to build alternative structures. This can also facilitate discussion of elementary dynamics and terminal conditions. It thus represents a potentially more efficient way of handling such issues in undergraduate open economy courses.
Keywords: Money neutrality, purchasing power parity, dynamics.
JEL classifications: A20, A22 1. INTRODUCTION The standard IS/LM/BP macroeconomic model with infinite capital mobility, the so-called Mundell-Fleming model, remains a mainstay of teaching undergraduate open-economy macroeconomics. This is * Correspondence: Gordon Menzies, School of Finance and Economics, University of Technology, Sydney, P.O. Box 123 Broadway, N.S.W. 2007, Australia, Email: [email protected]. Thanks to two anonymous referees for suggestions that improved the paper. ISSN 1448-448X © 2010 Australasian Journal of Economics Education
10 G. Menzies
reflected in the range of popular texts that continue to develop, explain and employ this model (see, for example, Dornbusch et al. 2006, pp.278-286). The model has some important features that underpin this continued treatment in the textbooks, most notable of which is its accessible analytics and the ready application of these analytics to common policy problems. For example, the Mundell-Fleming model can be used to discuss the relative effectiveness of fiscal and monetary policies in a world of floating exchange rates.1
But Mundell-Fleming does not handle longer term issues so well. These include money neutrality, purchasing power parity and the long-run irrelevance of the exchange rate regime. In order to consider these matters, university economics teachers usually move to augmented aggregate supply-aggregate demand frameworks. I have found, however, that a simple extension of the standard Mundell-Fleming model enables me to deal with money neutrality, purchasing power parity and the long-run irrelevance of the exchange rate regime as well as elementary dynamics and terminal conditions all within the same framework.
2 The extension consists of introducing an implicit aggregate-supply inflation mechanism and the objective of this paper is to outline this extension and to show how it can be used to inform the teaching of these long run concepts.3
The structure of the paper is as follows. The next section recaps the key features of the standard Mundell-Fleming model and its application to the use of fiscal and monetary policies. Section 3 then outlines the implicit aggregate-supply inflation mechanism and explains how this modifies the standard model. Section 4 applies the extended model to a discussion of money neutrality, purchasing power parity and the long-run irrelevance of the exchange rate regime as well
1 This, of course, assumes the absence of a zero lower bound to interest rates which is currently causing so many problems. 2 This teaching innovation was developed without reference to Abel, Bernanke and Croushore (2010), an undergraduate text in macro which utilizes a full employment level of output on the IS/LM diagram to discuss inflation and deflation. I thank an anonymous referee for directing me to that reference. This paper uses the full employment output level, which they do, but appends it to the standard infinite capital mobility case, which they don’t. See their appendix 13.B. 3 This is not to deny the value of an extended discussion of aggregate supply facilitated by the AS/AD diagrams. However, all that is required for some crucial policy discussions is the bland assertion that accentuated or attenuated GDP growth causes price changes, after some delay. Students who understand the importance of these delayed price changes may be inspired to ask why there is a delay.
Open Economy Macroeconomics 11
as to elementary dynamics and terminal conditions. Section 5 then reflects upon the benefits of this exposition before Section 6 draws some conclusions for the teaching of open economy macroeconomics.
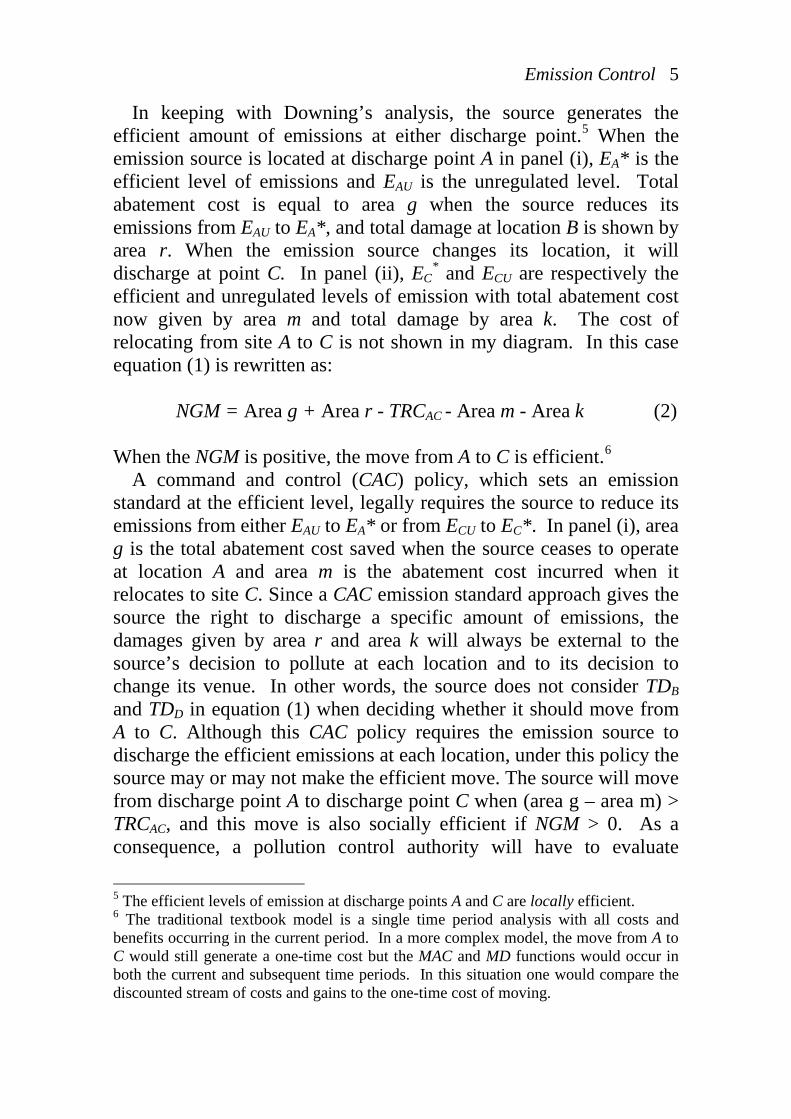
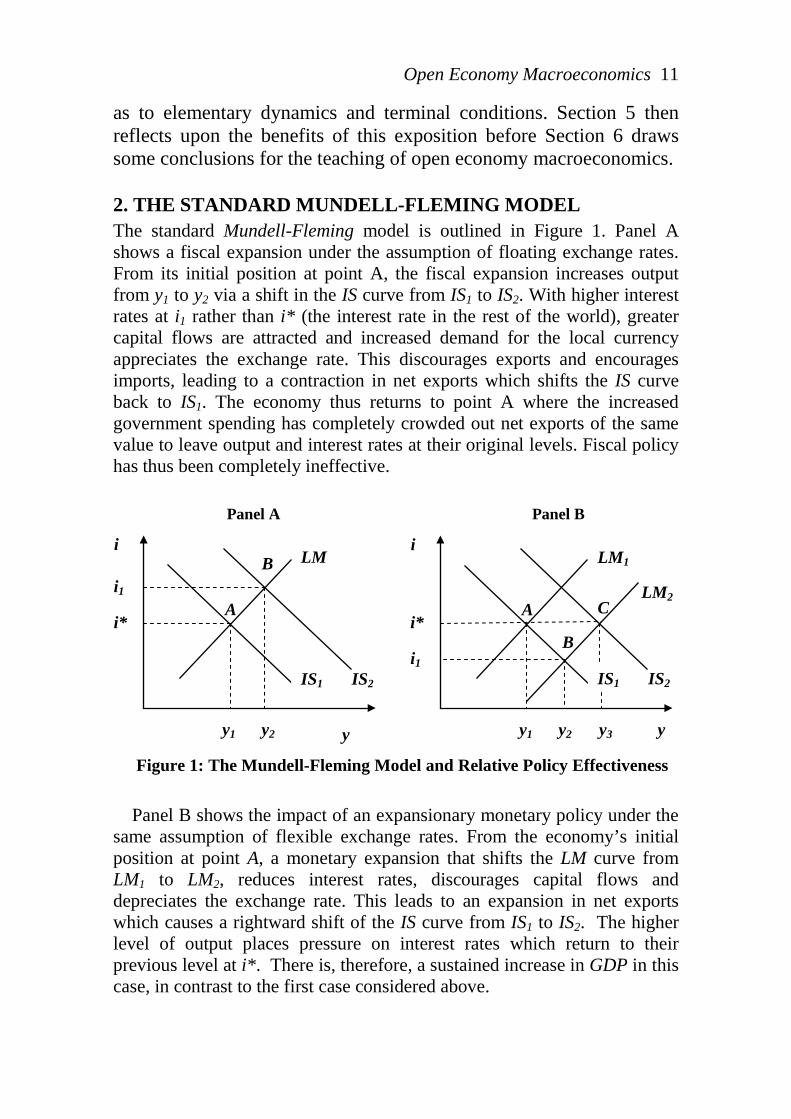
2. THE STANDARD MUNDELL-FLEMING MODEL The standard Mundell-Fleming model is outlined in Figure 1. Panel A shows a fiscal expansion under the assumption of floating exchange rates. From its initial position at point A, the fiscal expansion increases output from y1 to y2 via a shift in the IS curve from IS1 to IS2. With higher interest rates at i1 rather than i* (the interest rate in the rest of the world), greater capital flows are attracted and increased demand for the local currency appreciates the exchange rate. This discourages exports and encourages imports, leading to a contraction in net exports which shifts the IS curve back to IS1. The economy thus returns to point A where the increased government spending has completely crowded out net exports of the same value to leave output and interest rates at their original levels. Fiscal policy has thus been completely ineffective.
Figure 1: The Mundell-Fleming Model and Relative Policy Effectiveness
Panel B shows the impact of an expansionary monetary policy under the
same assumption of flexible exchange rates. From the economy’s initial position at point A, a monetary expansion that shifts the LM curve from LM1 to LM2, reduces interest rates, discourages capital flows and depreciates the exchange rate. This leads to an expansion in net exports which causes a rightward shift of the IS curve from IS1 to IS2. The higher level of output places pressure on interest rates which return to their previous level at i*. There is, therefore, a sustained increase in GDP in this case, in contrast to the first case considered above.
LM
IS2
B
A
i
y
IS1
i1
i*
y1 y2
Panel A
C LM2
LM1
IS2
B
A
i
IS1
i*
i1
y1 y2 y3 y
Panel B
12 G. Menzies
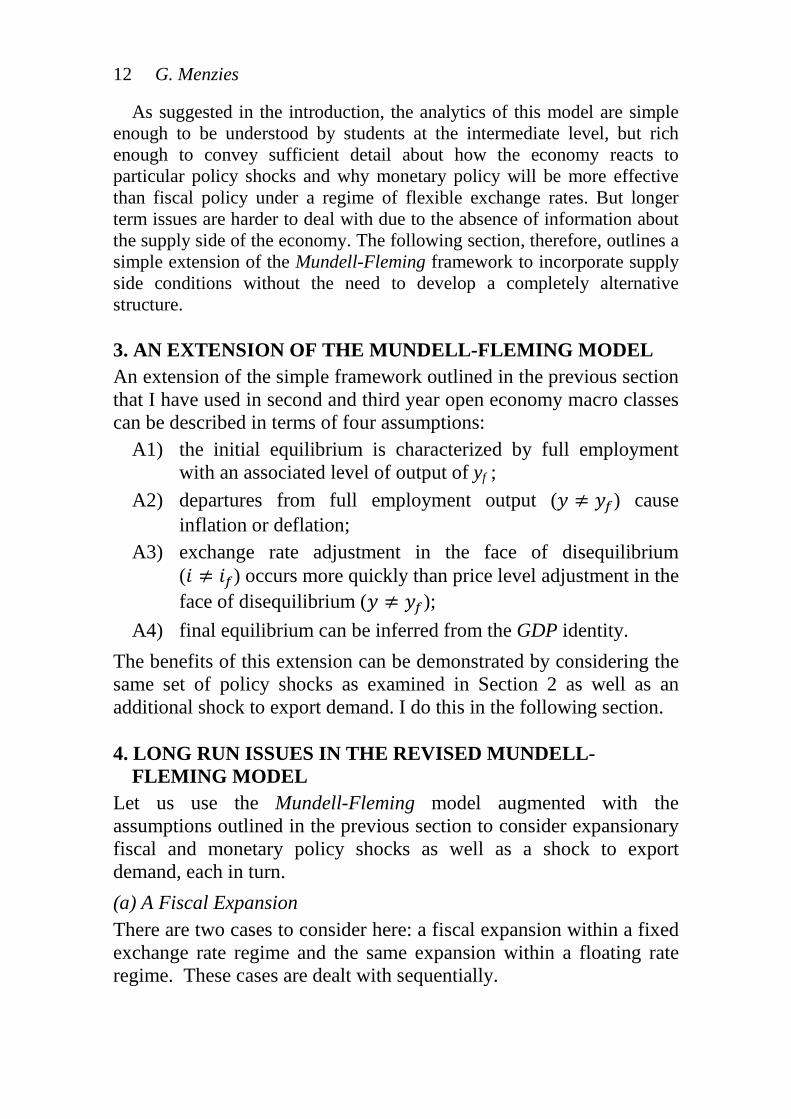
As suggested in the introduction, the analytics of this model are simple enough to be understood by students at the intermediate level, but rich enough to convey sufficient detail about how the economy reacts to particular policy shocks and why monetary policy will be more effective than fiscal policy under a regime of flexible exchange rates. But longer term issues are harder to deal with due to the absence of information about the supply side of the economy. The following section, therefore, outlines a simple extension of the Mundell-Fleming framework to incorporate supply side conditions without the need to develop a completely alternative structure.
3. AN EXTENSION OF THE MUNDELL-FLEMING MODEL An extension of the simple framework outlined in the previous section that I have used in second and third year open economy macro classes can be described in terms of four assumptions:
A1) the initial equilibrium is characterized by full employment with an associated level of output of yf ;
A2) departures from full employment output (𝑦 ≠ 𝑦𝑓) cause inflation or deflation;
A3) exchange rate adjustment in the face of disequilibrium (𝑖 ≠ 𝑖𝑓) occurs more quickly than price level adjustment in the face of disequilibrium (𝑦 ≠ 𝑦𝑓);
A4) final equilibrium can be inferred from the GDP identity. The benefits of this extension can be demonstrated by considering the same set of policy shocks as examined in Section 2 as well as an additional shock to export demand. I do this in the following section. 4. LONG RUN ISSUES IN THE REVISED MUNDELL-
FLEMING MODEL Let us use the Mundell-Fleming model augmented with the assumptions outlined in the previous section to consider expansionary fiscal and monetary policy shocks as well as a shock to export demand, each in turn. (a) A Fiscal Expansion There are two cases to consider here: a fiscal expansion within a fixed exchange rate regime and the same expansion within a floating rate regime. These cases are dealt with sequentially.
Open Economy Macroeconomics 13
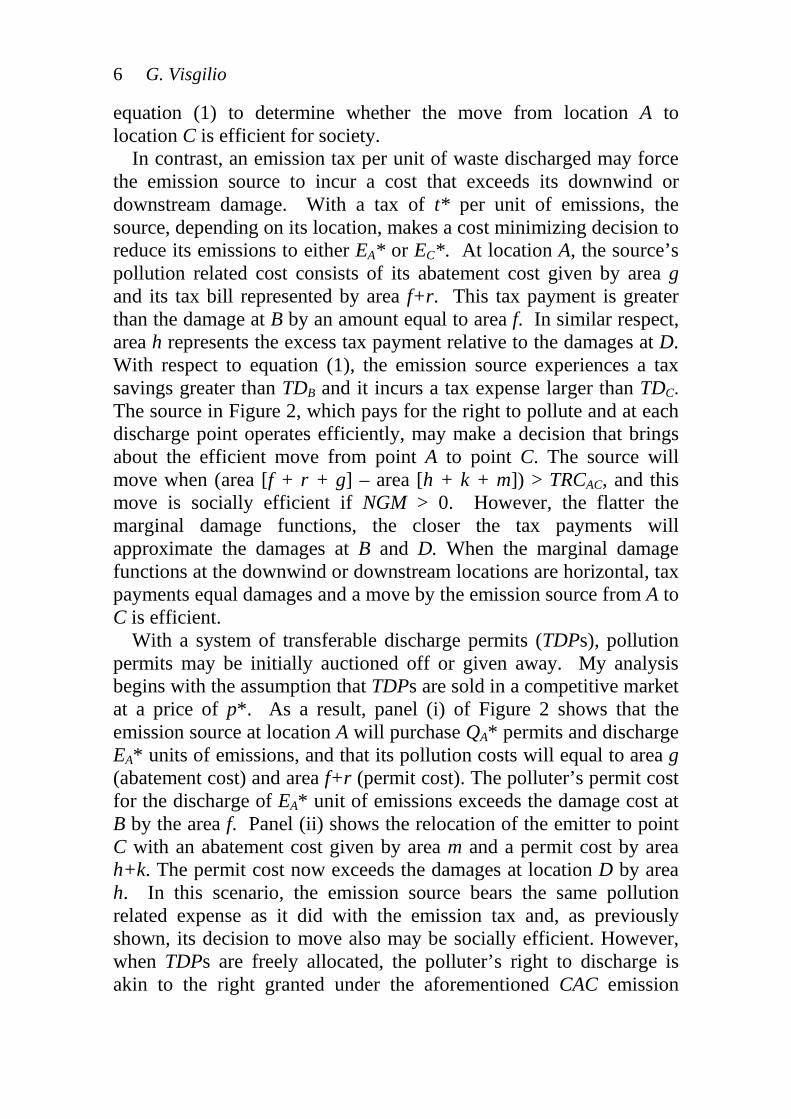
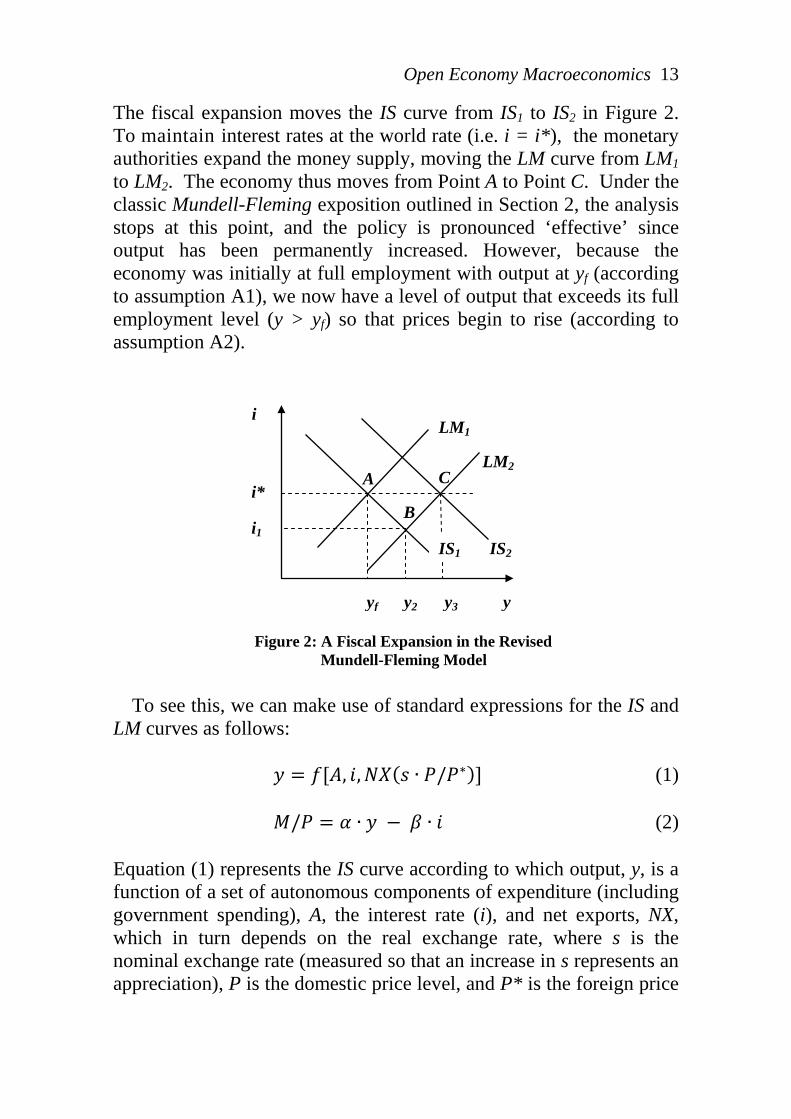
The fiscal expansion moves the IS curve from IS1 to IS2 in Figure 2. To maintain interest rates at the world rate (i.e. i = i*), the monetary authorities expand the money supply, moving the LM curve from LM1 to LM2. The economy thus moves from Point A to Point C. Under the classic Mundell-Fleming exposition outlined in Section 2, the analysis stops at this point, and the policy is pronounced ‘effective’ since output has been permanently increased. However, because the economy was initially at full employment with output at yf (according to assumption A1), we now have a level of output that exceeds its full employment level (y > yf) so that prices begin to rise (according to assumption A2).
Figure 2: A Fiscal Expansion in the Revised Mundell-Fleming Model
To see this, we can make use of standard expressions for the IS and LM curves as follows: 𝑦 = 𝑓[𝐴, 𝑖,𝑁𝑋(𝑠 ∙ 𝑃/𝑃∗)] (1)
𝑀/𝑃 = 𝛼 ∙ 𝑦 − 𝛽 ∙ 𝑖 (2)
Equation (1) represents the IS curve according to which output, y, is a function of a set of autonomous components of expenditure (including government spending), A, the interest rate (i), and net exports, NX, which in turn depends on the real exchange rate, where s is the nominal exchange rate (measured so that an increase in s represents an appreciation), P is the domestic price level, and P* is the foreign price
yf y2 y3 y
C LM2
LM1
IS2
B
A
i
IS1
i*
i1
14 G. Menzies
level. Equation (2) represents the LM curve according to which the real money supply, M/P, is equated with the money demand where α and β are parameters assumed to be strictly positive. From (1) and (2) it is clear that an increase in the price level will result in a loss of competitiveness (as the real exchange rate appreciates) and a real money contraction. Thus the IS and LM curves will both shift back to the left.
Given that prices will rise as long as y > yf, the IS and LM curves will continue to shift left until y = yf. Given the fixed exchange rate policy we are considering, and which we express in terms of the condition i = i*, we know that the final equilibrium must occur at y = yf and i = i*. By assumption A4, this immediately allows us to make strong statements about the final equilibrium based on the GDP identity show in equation (3), even if the path back to this final equilibrium is complex.4
y = C + I + G + NX (3)
where C, I, and G represent the usual components of aggregate demand, consumption, investment and government spending, and we assume that C is increasing in y, I is decreasing in i, G is exogenous and NX is decreasing in the real exchange rate. Our statements about final equilibrium can be supported by working through a comparative static analysis of each of the components of (3) where a plus sign (+) indicates an increase compared with the original equilibrium, a minus sign (−) indicates a decrease, and a zero (0) indicates no change. For the fiscal expansion case, these changes are shown in expression (4): y = C + I + G + NX (4) 0 0 0 + −
Since at the new equilibrium we are back at yf, the left hand side of
the GDP equation is unchanged, indicated by the zero under y in expression (4). Since y is unchanged, C must also be unchanged. Since i = i*, I is also unchanged. The value of G is higher due to the fiscal expansion being considered. Thus in equilibrium, NX must have 4 The path could be very complex indeed. If the IS and LM curves move back at different speeds, there will have to be small adjustments to nominal money M to keep i = i*, as required by a fixed rate regime.
Open Economy Macroeconomics 15
fallen by precisely the increase in G to make the GDP identity hold. The reduction in NX must also be attributable to a real exchange rate appreciation.5
The second case of fiscal expansion is that under floating exchange rates. By virtue of assumption A3, which states that any exchange rate adjustment precedes any price adjustment, this case is exactly the same as in the standard Mundell-Fleming model. In Figure 2, the IS curve shifts out from IS1 to IS2, taking the economy from point A to point B. Since i > i*, the exchange rate appreciates and competitiveness is eroded. The IS curve shifts back to IS1 prior to any price effects taking hold, and the economy reverts to the original equilibrium. The classic analysis ends here, pronouncing the policy ineffective, and our implicit aggregate supply extension arrives at precisely the same conclusion.
Since both P* and s are fixed (the latter by virtue of the fixed exchange rate regime), the entire increase in the real exchange rate must have come about by an increase in the domestic price level. How much has the price increased? In the final equilibrium, the right hand side of (2) must be unchanged from its initial value (with y = yf and i = i*), implying that the left hand side must also be unchanged. Thus prices must have increased exactly in proportion to the increase in money supply associated with maintaining the fixed exchange rate.
The comparative static analysis of (4) also remains valid since the components of aggregate expenditure are determined by the final values of y and i. However, one difference is that the money supply is unchanged. This is a hallmark of a floating rate regime.6 Thus, from (2), the money supply and prices are unchanged, and the entire real appreciation required to reduce NX by the increase in G must occur through the nominal appreciation of s.7
5 Although I have assumed away income effects on net exports, they would be irrelevant in the final equilibrium even if they were present, since y = yf.
That is, s.P/P* increases by the same amount under both regimes, but the choice of policy
6 In any presentation of the Mundell-Fleming model, or the extension proposed in this paper, it is problematic to talk as though the monetary policy instrument were the money supply rather than an interest rate. This is often glossed over at second year undergraduate level, but an alternative would be to redefine M as a nominal income (level) target. 7 Actually, this would be true even without A3. If prices increased over the time that y > yf, both the IS and LM curves would shift back, and the exchange rate would appreciate until an equilibrium occurred where i = i* and y < yf. But this would necessarily reduce prices until y = yf. Without a change in the money supply, (2) ensures that prices cannot ultimately rise.
16 G. Menzies
determines whether it comes quickly through changes in s in the floating rate regime, or slowly through changes in P in the fixed rate regime.
(b) A Monetary Expansion There are also two cases to consider here: a monetary expansion within a fixed exchange rate regime and the same expansion within a floating rate regime. Once again, we consider these cases sequentially.
In the fixed exchange rate case, a monetary expansion is not an effective policy as is true in the standard Mundell-Fleming model. Any monetary expansion reduces i below i*, causing significant capital outflows and weak demand for the local currency that places downward pressure on the exchange rate. The central bank must deal with this situation under a fixed exchange rate regime with currency purchases that increase the money supply and reverse the original policy action.
In the floating exchange rate case, the LM curve in Figure 2 shifts out to LM1, taking the economy from point A to point D. Since i < i* at point D, the exchange rate depreciates and competitiveness improves. Net exports increase, shifting IS from IS1 to IS2 and the economy moves from D to C. The Mundell-Fleming analysis concludes at this point and the policy is deemed a success since output is permanently higher.
Our extension of the standard model, however, shows that this position is unsustainable in the long run. With y > yf, prices rise and both the IS and LM curves shift back to their original levels. The economy follows an unspecified path back from point C to point A in Figure 2. If the IS and LM curves move at different rates, i will depart from i* and there will be a nominal exchange rate adjustment (either a depreciation or an appreciation, depending on the path of interest rates).
Despite the prospect of a complex adjustment path, we obtain clear predictions about the final equilibrium, where y = yf and i = i*. This can be understood in terms of expression (5):
y = C + I + G + NX (5) 0 0 0 0 0
Since we are back at yf, the left hand side of (5) is unchanged. Since y is unchanged, C must also be unchanged. Since i = i*, i is unchanged.
Open Economy Macroeconomics 17
Thus, in equilibrium, NX must be unchanged because G (which is exogenous) has not changed. Therefore the real exchange rate is unchanged. At the final equilibrium, the right hand side of (2) is unchanged from its initial value (with y = yf and i = i*), implying that the left hand side must also be unchanged. Thus prices must have increased exactly in proportion to any increase in the money supply. But if this is the case, only s remains undetermined in the expression for the real exchange rate s.P/P*. For the real exchange rate to be unchanged, s must fall exactly in proportion to the rise in P, which is in turn equal to the expansion of money.
This is the classic money neutrality result. Prices rise in proportion to the increase in liquidity, and the nominal exchange rate depreciates by the same proportion as prices (and the money supply) increase. Nothing real changes – neither the expenditure components nor the real exchange rate. I like to ask students what would be the outcome if the government decreed that all holders of money could move the decimal place one step to the right (i.e. increasing liquidity tenfold by fiat). Many can see that the money neutrality result would obtain more or less immediately.
Taking money neutrality further, this extension is an ideal vehicle for introducing students to the thinking behind modern central banking. The actions of the monetary authorities are very important for short run growth and therefore employment, but the skepticism about long run effects is behind the move to inflation targeting.
Finally, the unchanged real exchange rate following a monetary shock gives rise naturally to a discussion of Purchasing Power Parity (PPP). Provided shocks are nominal, the extended model leads us to expect exchange rate changes to offset inflation. This is not the case following a real shock, as the following example makes clear.
(c) A Real Trade Shock Suppose, in Figure 2, that NX receives a positive exogenous shock; say an increase in the demand for the economy’s exports unrelated to the real exchange rate. In this case, the IS curve would shift out from IS1 to IS2. Under the fixed rate regime, the LM curve shifts out from LM1 to LM2 to keep i = i*. Under the floating rate regime, the IS curve is pulled back as the nominal exchange rate appreciates and NX falls. As before, the implicit aggregate supply extension pulls the equilibrium back to y = yf and i = i* regardless of the regime. However, the analysis of the final equilibrium is now different.
18 G. Menzies
y = C + I + G + NX (6) 0 0 0 0 0
We may consider this in terms of expression (6). Since we are back at yf, the left hand side of (6) is unchanged. Since y is unchanged, C must be too. Since i = i*, i is unchanged. Thus, in equilibrium NX must be unchanged because G (which is exogenous) is unchanged. However, it no longer follows that the real exchange rate is unchanged. Since NX has received a positive exogenous shock from increased demand, the real exchange rate must have appreciated enough for a fall in NX to exactly offset this. At the final equilibrium, the right hand side of (6) is unchanged from its initial value (with y = yf and i = i*), implying that the left hand side must also be unchanged. Thus, as before, prices must have increased exactly in proportion to any increase in the money supply. As before, only s remains undetermined in the real exchange rate s.P/P*, but the real exchange rate has increased.
In the fixed rate case, which is the simplest, s is unchanged and the entire increase in the real exchange rate comes through prices. This, in turn, must be accommodated by an expansion of the money supply, from (2). In the floating rate case, prices are unchanged so the entire increase comes through variations in s. Either way, students can see that the real exchange rate can change following a real shock, violating PPP.
5. WHAT IS GAINED BY EXTENDING THE STANDARD
MUNDELL-FLEMING MODEL? The implicit-aggregate-supply extension, like its Mundell-Fleming parent, can guide students towards many interesting policy discussions using accessible analytics. First, students can engage with issues of long run vs short run. In the short run, a fiscal expansion is effective under a fixed rate regime, but this unravels in the long run. Whichever policy is chosen, a real appreciation will erode competitiveness. Second, the monetarist assertion that inflation is always and everywhere a monetary phenomena is borne out by the model. In the final equilibrium, M and P must increase proportionately. For this not to occur, there must be a structural change in the LM relation, and this was precisely the issue that derailed monetary targeting.
Third, students can be introduced to notions of dynamics without sophisticated mathematics. Furthermore, they can perceive that sometimes
Open Economy Macroeconomics 19
economics provides insights about the final state of affairs, as read from equilibrium conditions, even if the adjustment path is difficult or impossible to discover.
6. CONCLUSION Despite the fact that the standard Mundell-Fleming model remains a mainstay of teaching undergraduate open-economy macroeconomics, this paper has argued that a simple extension of the standard model possess some important attributes that commend it over its common textbook version. The extension of introducing an implicit aggregate-supply inflation mechanism allows the model to deal with issues of money neutrality, purchasing power parity and the long-run irrelevance of the exchange rate regime as well as elementary dynamics and terminal conditions all within the same framework. The extended version thus makes it possible to deal with a wider range of issues than the standard version without having to develop an alternative aggregate demand-aggregate supply structure. For this reason it may represent a more efficient pedagogical tool than the aggregate demand-aggregate supply structure in teaching elementary university economics.
REFERENCES Abel, A. B., Bernanke, B. S. and D. Croushore (2010), Macroeconomics,
7th Edition, New York: Pearson. Dornbusch R., Bodman P., Crosby M., Fischer S. and R. Startz (2006),
Macroeconomics, 2nd edition, New York: McGraw-Hill.
Australasian Journal of Economics Education Volume 7, Number 1, 2010, pp.20-30
TEACHING ECONOMICS WITH
SHORT STORIES*
Philip J. Ruder Department of Economics
Pacific University, Oregon, USA
ABSTRACT
Using short stories as supplements to traditional economics courses or as part of non-traditional or interdisciplinary courses helps students to grasp economic concepts while diversifying readings and instructional methods in the classroom. The paper describes the pedagogical value of short stories, provides two detailed examples, and identifies numerous stories appropriate for use in the economics classroom.
Keywords: student engagement, short story, economic concepts.
JEL classifications: A20, A22. 1. INTRODUCTION A constant challenge for teachers of university and college economics is the perception among many students that economics is boring, difficult and highly abstract. Such perceptions can operate as a barrier to effective student engagement with the core ideas presented in economics courses and can significantly undermine student motivation and learning. This is deeply ironic given the conviction of most economics professors that economics is very much about analyzing, understanding and explaining the real world. The problem partly lies in the ability of teachers to make useful links between the abstract mathematical tools of analysis taught in economics classes * Correspondence: Philip J. Ruder, Department of Economics, Pacific University, 2043 College Way, Forest Grove, OR 97116, USA, E-mail: [email protected]. I am grateful for comments received from Steve Myers and other participants at the annual meetings of the Western Economic Association in Vancouver, BC, on July 3, 2004. Anonymous reviewers also offered useful suggestions, which I greatly appreciate. ISSN 1448-448X © 2010 Australasian Journal of Economics Education
Teaching Economics with Short Stories 21
and the experience of their students. These teachers may also lack adequate pedagogical resources to makes these links.
A common suggestion to enhance the link between what is frequently referred to as theory and practice is the business example or policy problem. There is much to be said for this approach of going to the newspapers, current affairs media and case literature for material to enhance “realism” in the classroom. But Watts and Smith (1989) and others have also documented the effectiveness of including English literature in economics courses to enhance the applicability of economics and motivate students. Another possibility in this vein is use of the short story. The typical brevity and intensity of short stories make them especially effective at conveying economic principles, offering students a pleasant surprise in the syllabus, and demonstrating the ubiquity of economic concepts. The emotional power of a short story can also provide undergraduates with a sense of the importance and complexity of an economic issue which might otherwise appear distant and abstract. In addition, active learning exercises based on short stories can lead to animated small group and class discussions and to enhanced student understanding of important points sometimes left out of the introductory course.
This paper documents the experience of the present author in making use of short stories in his own teaching. The following section reviews some of the pedagogical literature relevant to the use of English literature in the teaching of economics. Section 3 presents two case studies from the author’s own teaching experience. Section 4 discusses the response of students to this kind of teaching innovation while Section 5 concludes and makes some suggestions that might be of value to other economics instructors.
2. PEDAGOGICAL LITERATURE ON THE USE OF
ENGLISH LITERATURE IN TEACHING ECONOMICS Although the use of literature, films, and music in the economics classroom is not widespread (Becker & Watts 1998), articles on pedagogy outline many possibilities. Watts and Smith (1989) and Watts (1998, 2003) describe the use of literature and drama as supplements to the material in otherwise traditional courses. Kish-Goodling (1998) and Scahill (1998) present particular literary works as useful supplements to textbooks and news articles in economics courses. Hartley (2001) presents an introductory economics course for
22 P.J. Ruder
non-majors based entirely on the great books of Western Civilization. Tinari and Khandke (2000), Mateer (2004), and Hall and Lawson (2008) use music to engage students in their principles courses. Leet and Houser (2003) and Bhadra (2006) have developed principles courses for non-majors using films and documentaries. Economists are not alone in their use of literature to teach subjects outside of the humanities. For example, Peters (2005) and Saletta (2006) describe their use of literature in teaching law.
Literature, music, and films enhance economics courses by offering students entertaining materials that are rich in economic content. The unexpected presence of fiction in the economics syllabus captures students’ attention, especially important to do in introductory courses. The nontraditional material also demonstrates the usefulness of economic insight for understanding a broader range of subjects than students generally anticipate. Students enjoy the music, films, and literary works and thus are more likely to prepare for class, engage enthusiastically in assignments based on this material, and, indeed, sign up for the course.
Literature and film in general and short stories in particular can give undergraduate students a sense of the importance and complexity of economic issues that their own experience has not yet taught them. Given their inexperience, traditional undergraduates often lack much first-hand knowledge of the problems under study in an economics course. As a result, the relevance of economics to students’ lives can be under-appreciated. The emotional power of a short story can provide a connection with the material that students’ own experience does not. Thus, literature and film in economics courses can lead to increased student motivation to master the analytical frameworks central to introductory courses.
Much shorter than full-length movies, possessing a beginning, middle, and end as excerpts do not, and more accessible to students than poems, short stories prove very effective additions to economics courses where class preparation is also likely to include a substantial amount of technical reading and other work. Joyce Carol Oates describes the short story as “a prose piece that is not a mere concatenation of events, as in a news account or an anecdote, but an intensification of meaning by way of events” (Oates 1992, p. 7). The intensity of a short story enables even a short reading to illustrate complex economic ideas.
Teaching Economics with Short Stories 23
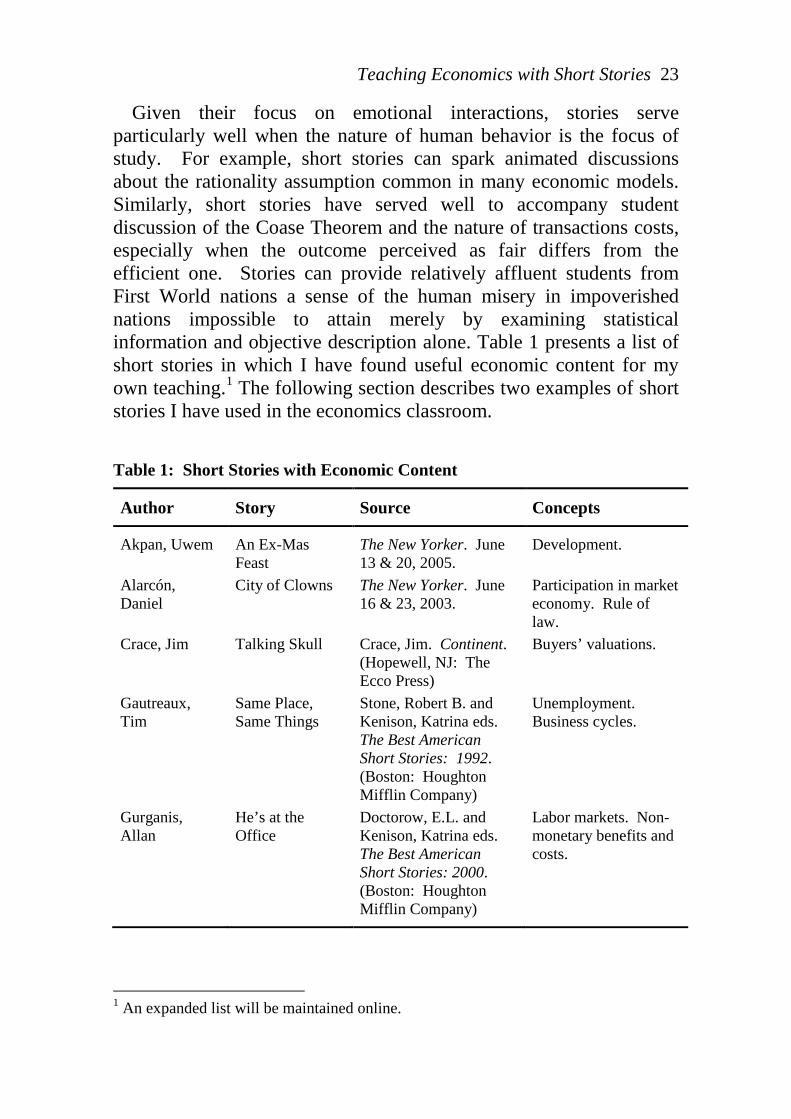
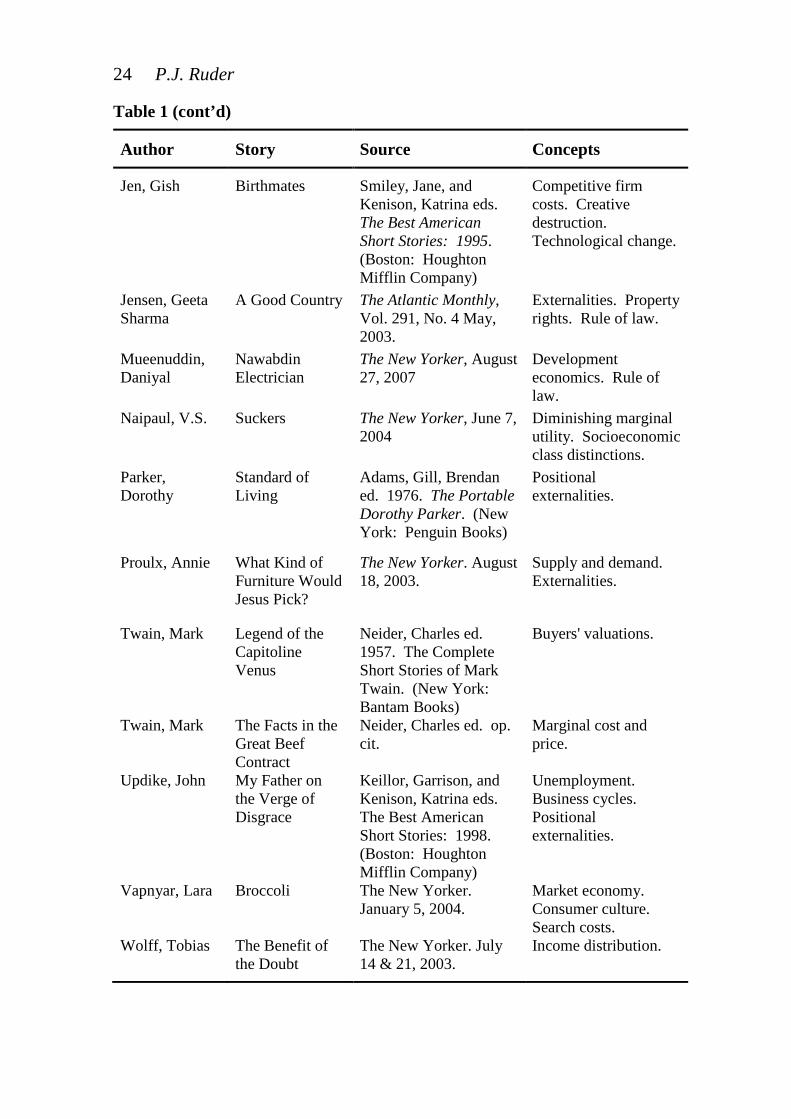
Given their focus on emotional interactions, stories serve particularly well when the nature of human behavior is the focus of study. For example, short stories can spark animated discussions about the rationality assumption common in many economic models. Similarly, short stories have served well to accompany student discussion of the Coase Theorem and the nature of transactions costs, especially when the outcome perceived as fair differs from the efficient one. Stories can provide relatively affluent students from First World nations a sense of the human misery in impoverished nations impossible to attain merely by examining statistical information and objective description alone. Table 1 presents a list of short stories in which I have found useful economic content for my own teaching.1
The following section describes two examples of short stories I have used in the economics classroom.
Table 1: Short Stories with Economic Content
Author Story Source Concepts
Akpan, Uwem An Ex-Mas Feast
The New Yorker. June 13 & 20, 2005.
Development.
Alarcón, Daniel
City of Clowns The New Yorker. June 16 & 23, 2003.
Participation in market economy. Rule of law.
Crace, Jim Talking Skull Crace, Jim. Continent. (Hopewell, NJ: The Ecco Press)
Buyers’ valuations.
Gautreaux, Tim
Same Place, Same Things
Stone, Robert B. and Kenison, Katrina eds. The Best American Short Stories: 1992. (Boston: Houghton Mifflin Company)
Unemployment. Business cycles.
Gurganis, Allan
He’s at the Office
Doctorow, E.L. and Kenison, Katrina eds. The Best American Short Stories: 2000. (Boston: Houghton Mifflin Company)
Labor markets. Non-monetary benefits and costs.
1 An expanded list will be maintained online.
24 P.J. Ruder
Table 1 (cont’d)
Author Story Source Concepts
Jen, Gish Birthmates Smiley, Jane, and Kenison, Katrina eds. The Best American Short Stories: 1995. (Boston: Houghton Mifflin Company)
Competitive firm costs. Creative destruction. Technological change.
Jensen, Geeta Sharma
A Good Country The Atlantic Monthly, Vol. 291, No. 4 May, 2003.
Externalities. Property rights. Rule of law.
Mueenuddin, Daniyal
Nawabdin Electrician
The New Yorker, August 27, 2007
Development economics. Rule of law.
Naipaul, V.S. Suckers The New Yorker, June 7, 2004
Diminishing marginal utility. Socioeconomic class distinctions.
Parker, Dorothy
Standard of Living
Adams, Gill, Brendan ed. 1976. The Portable Dorothy Parker. (New York: Penguin Books)
Positional externalities.
Proulx, Annie What Kind of Furniture Would Jesus Pick?
The New Yorker. August 18, 2003.
Supply and demand. Externalities.
Twain, Mark Legend of the Capitoline Venus
Neider, Charles ed. 1957. The Complete Short Stories of Mark Twain. (New York: Bantam Books)
Buyers' valuations.
Twain, Mark The Facts in the Great Beef Contract
Neider, Charles ed. op. cit.
Marginal cost and price.
Updike, John My Father on the Verge of Disgrace
Keillor, Garrison, and Kenison, Katrina eds. The Best American Short Stories: 1998. (Boston: Houghton Mifflin Company)
Unemployment. Business cycles. Positional externalities.
Vapnyar, Lara Broccoli The New Yorker. January 5, 2004.
Market economy. Consumer culture. Search costs.
Wolff, Tobias The Benefit of the Doubt
The New Yorker. July 14 & 21, 2003.
Income distribution.
Teaching Economics with Short Stories 25
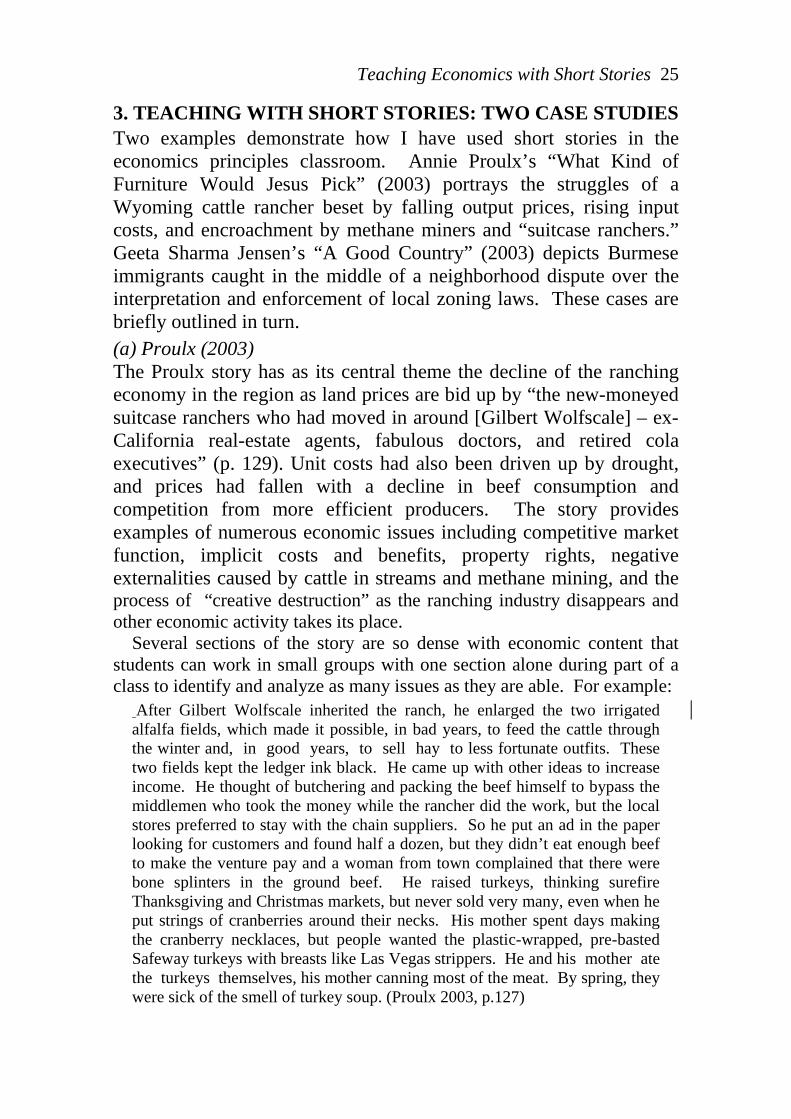
3. TEACHING WITH SHORT STORIES: TWO CASE STUDIES Two examples demonstrate how I have used short stories in the economics principles classroom. Annie Proulx’s “What Kind of Furniture Would Jesus Pick” (2003) portrays the struggles of a Wyoming cattle rancher beset by falling output prices, rising input costs, and encroachment by methane miners and “suitcase ranchers.” Geeta Sharma Jensen’s “A Good Country” (2003) depicts Burmese immigrants caught in the middle of a neighborhood dispute over the interpretation and enforcement of local zoning laws. These cases are briefly outlined in turn. (a) Proulx (2003) The Proulx story has as its central theme the decline of the ranching economy in the region as land prices are bid up by “the new-moneyed suitcase ranchers who had moved in around [Gilbert Wolfscale] – ex-California real-estate agents, fabulous doctors, and retired cola executives” (p. 129). Unit costs had also been driven up by drought, and prices had fallen with a decline in beef consumption and competition from more efficient producers. The story provides examples of numerous economic issues including competitive market function, implicit costs and benefits, property rights, negative externalities caused by cattle in streams and methane mining, and the process of “creative destruction” as the ranching industry disappears and other economic activity takes its place.
Several sections of the story are so dense with economic content that students can work in small groups with one section alone during part of a class to identify and analyze as many issues as they are able. For example:
After Gilbert Wolfscale inherited the ranch, he enlarged the two irrigated alfalfa fields, which made it possible, in bad years, to feed the cattle through the winter and, in good years, to sell hay to less fortunate outfits. These two fields kept the ledger ink black. He came up with other ideas to increase income. He thought of butchering and packing the beef himself to bypass the middlemen who took the money while the rancher did the work, but the local stores preferred to stay with the chain suppliers. So he put an ad in the paper looking for customers and found half a dozen, but they didn’t eat enough beef to make the venture pay and a woman from town complained that there were bone splinters in the ground beef. He raised turkeys, thinking surefire Thanksgiving and Christmas markets, but never sold very many, even when he put strings of cranberries around their necks. His mother spent days making the cranberry necklaces, but people wanted the plastic-wrapped, pre-basted Safeway turkeys with breasts like Las Vegas strippers. He and his mother ate the turkeys themselves, his mother canning most of the meat. By spring, they were sick of the smell of turkey soup. (Proulx 2003, p.127)
26 P.J. Ruder
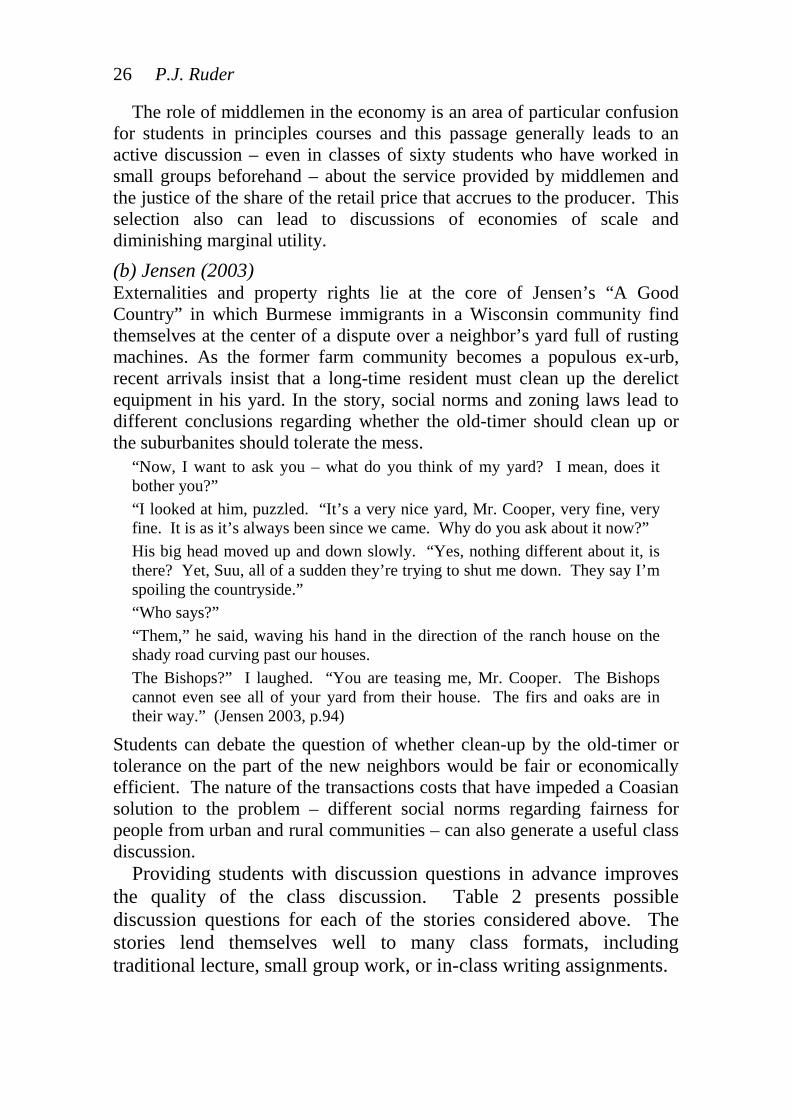
The role of middlemen in the economy is an area of particular confusion for students in principles courses and this passage generally leads to an active discussion – even in classes of sixty students who have worked in small groups beforehand – about the service provided by middlemen and the justice of the share of the retail price that accrues to the producer. This selection also can lead to discussions of economies of scale and diminishing marginal utility. (b) Jensen (2003) Externalities and property rights lie at the core of Jensen’s “A Good Country” in which Burmese immigrants in a Wisconsin community find themselves at the center of a dispute over a neighbor’s yard full of rusting machines. As the former farm community becomes a populous ex-urb, recent arrivals insist that a long-time resident must clean up the derelict equipment in his yard. In the story, social norms and zoning laws lead to different conclusions regarding whether the old-timer should clean up or the suburbanites should tolerate the mess.
“Now, I want to ask you – what do you think of my yard? I mean, does it bother you?” “I looked at him, puzzled. “It’s a very nice yard, Mr. Cooper, very fine, very fine. It is as it’s always been since we came. Why do you ask about it now?” His big head moved up and down slowly. “Yes, nothing different about it, is there? Yet, Suu, all of a sudden they’re trying to shut me down. They say I’m spoiling the countryside.” “Who says?” “Them,” he said, waving his hand in the direction of the ranch house on the shady road curving past our houses. The Bishops?” I laughed. “You are teasing me, Mr. Cooper. The Bishops cannot even see all of your yard from their house. The firs and oaks are in their way.” (Jensen 2003, p.94)
Students can debate the question of whether clean-up by the old-timer or tolerance on the part of the new neighbors would be fair or economically efficient. The nature of the transactions costs that have impeded a Coasian solution to the problem – different social norms regarding fairness for people from urban and rural communities – can also generate a useful class discussion.
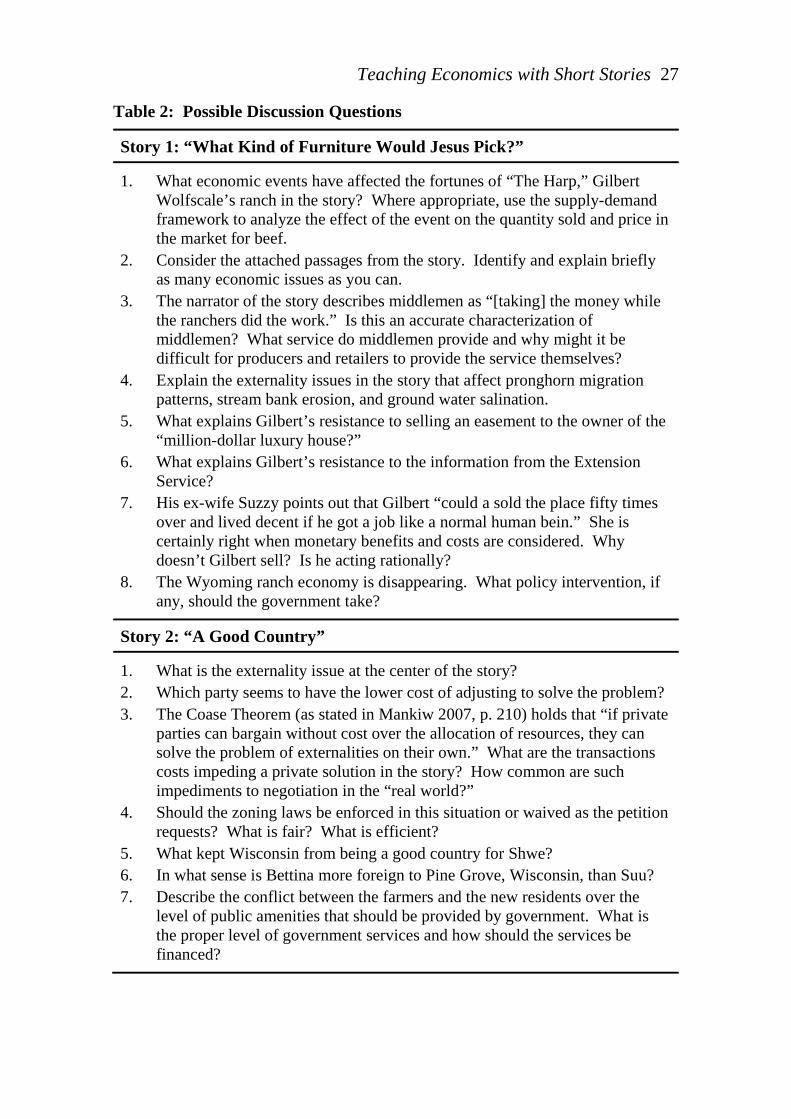
Providing students with discussion questions in advance improves the quality of the class discussion. Table 2 presents possible discussion questions for each of the stories considered above. The stories lend themselves well to many class formats, including traditional lecture, small group work, or in-class writing assignments.
Teaching Economics with Short Stories 27
Table 2: Possible Discussion Questions
Story 1: “What Kind of Furniture Would Jesus Pick?”
1. What economic events have affected the fortunes of “The Harp,” Gilbert Wolfscale’s ranch in the story? Where appropriate, use the supply-demand framework to analyze the effect of the event on the quantity sold and price in the market for beef.
2. Consider the attached passages from the story. Identify and explain briefly as many economic issues as you can.
3. The narrator of the story describes middlemen as “[taking] the money while the ranchers did the work.” Is this an accurate characterization of middlemen? What service do middlemen provide and why might it be difficult for producers and retailers to provide the service themselves?
4. Explain the externality issues in the story that affect pronghorn migration patterns, stream bank erosion, and ground water salination.
5. What explains Gilbert’s resistance to selling an easement to the owner of the “million-dollar luxury house?”
6. What explains Gilbert’s resistance to the information from the Extension Service?
7. His ex-wife Suzzy points out that Gilbert “could a sold the place fifty times over and lived decent if he got a job like a normal human bein.” She is certainly right when monetary benefits and costs are considered. Why doesn’t Gilbert sell? Is he acting rationally?
8. The Wyoming ranch economy is disappearing. What policy intervention, if any, should the government take?
Story 2: “A Good Country”
1. What is the externality issue at the center of the story? 2. Which party seems to have the lower cost of adjusting to solve the problem? 3. The Coase Theorem (as stated in Mankiw 2007, p. 210) holds that “if private
parties can bargain without cost over the allocation of resources, they can solve the problem of externalities on their own.” What are the transactions costs impeding a private solution in the story? How common are such impediments to negotiation in the “real world?”
4. Should the zoning laws be enforced in this situation or waived as the petition requests? What is fair? What is efficient?
5. What kept Wisconsin from being a good country for Shwe? 6. In what sense is Bettina more foreign to Pine Grove, Wisconsin, than Suu? 7. Describe the conflict between the farmers and the new residents over the
level of public amenities that should be provided by government. What is the proper level of government services and how should the services be financed?
28 P.J. Ruder
4. STUDENT FEEDBACK The small size of classes at Pacific University in Forest Grove, Oregon and the fact that single sections of each principles course are taught each semester have made it difficult to formally test the effect of using shorts stories on student learning. However, student satisfaction with courses that have included short stories and with the stories themselves, offer some evidence of the positive effect of including short stories in introductory economics classes.
Student ratings for a course designed for non-majors called Economics in Short Stories, Poems, and Plays was overwhelmingly positive. Of 22 students completing evaluations for this course, 16 strongly agreed and 6 agreed with the statement that the “[i]nstructor taught the course well”.2
Student satisfaction with the traditional Principles of Microeconomics course has been similarly high across a number of the last several semesters. When asked to comment on the short story readings used in this course, students provided overwhelmingly positive feedback. Many students praised the stories for “providing a strong source of real-world economic examples,” as one student put it. Also common were comments such as: “I think the short stories were the best pieces we read in class. I enjoyed reading them because they were leading to something.”
A second broad summary statement on the evaluation form was: “The course was a positive intellectual experience.” Half the students strongly agreed with this statement, seven agreed, and four slightly agreed. Comments such as: “really liked the lit mix on such a dry topic”; and “interesting to see econ in the different plays, stories, and poems” were typical of open-ended student responses to the course.
Such feedback echoes the positive student reactions described by Watts and Smith (1989) and justifies further experimentation with this approach to teaching undergraduate economics subjects as well as further efforts to more rigorously measure its impact on student learning of core economic concepts.
5. CONCLUSION The short story offers economics instructors and their students a powerful device to illustrate economic concepts and to vary the format 2 The possible responses to the statements on the evaluations are “strongly agree,” “agree,” “slightly agree,” “disagree,” and “strongly disagree.”
Teaching Economics with Short Stories 29
of classes. Whether as supplements to otherwise traditional economics courses or as part of non-traditional economics or interdisciplinary courses, short stories, focused on economic concepts, pack a great deal into short, enjoyable, and accessible reading assignments. Stories convey the connection between the economic concepts under study and the world surrounding the students in a manner that textbook reading and even periodical articles often cannot. Class discussions focused on stories often succeed in drawing out contributions to class discussions from quiet or struggling students who might learn from a story what they cannot glean from an economics text, lecture, or class discussion. Positive student feedback on courses using short stories at Pacific University justify further efforts to experiment with such courses and to carefully measure their impact on student learning of economics. REFERENCES Bhadra, L. J. (2006) “A Picture is Worth a Thousand Words: Engaging
Kinesthetic and Multimodal Learners of Economics Using Contemporary Films”, Inquiry, 11 (Spring), pp.11-19.
Becker, W. E. and Watts, M. (1998) “Teaching Economics: What was, is and could be”, in Becker, W.E. and Watts, M. (eds.), Teaching Economics to Undergraduates: Alternatives to Chalk and Talk. Northampton, MA: Edward Elgar, pp.1-10.
Hall, J. C. and Lawson, R. A. (2008) “From ABBA to Zeppelin, Led: Using Music to Teach Introductory Microeconomics”, Perspectives on Economic Education Research, 4(1), Spring, pp.23-36.
Hartley, J. E. (2001) “The Great Books and Economics”, Journal of Economic Education, 32(2), pp.147-159.
Jensen, G. S. (2003) “A Good Country”, The Atlantic Monthly, 291(4), May, pp.93-101.
Kish-Goodling, D. M. (1998) “Using The Merchant of Venice in Teaching Monetary Economics”, Journal of Economic Education, 29(4), pp.330-339.
Leet, D. and Houser, S. (2003) “Economics goes to Hollywood: Using Classic Films and Documentaries to Create an Undergraduate Economics Course”, Journal of Economic Education, 34(4), pp.326-332.
Mankiw, N. G. (2007) Principles of Microeconomics, 4th edition, Mason, OH: Thomson South-Western.
30 P.J. Ruder
Mateer, G. D. (2004) “Magic to Learn By: Songs with Economic Content”, Paper presented to Teaching Economics: Instruction and Classroom Based Research, Robert Morris University, Moon Township, PA. February 12-14.
Oates, J. C. (ed.) (1992) The Oxford Book of American Short Stories, New York: The Oxford University Press.
Peters, J. S. (2005) “The Changing Profession: Law, Literature, and the Vanishing Real: On the Future of an Interdisciplinary Illusion”, PMLA, 120(2), March, pp.442-454.
Proulx, A. (2003) “What Kind of Furniture Would Jesus Pick?”, The New Yorker, August 18, pp.126-137.
Saletta, E. (2006) “Teaching Law and Literature: A Successful Interdisciplinary Challenge”, Teaching Austria, 2. (http://www.malca. org/ ta/v2/vol2.html).
Scahill, E. M. (1998) “A Connecticut Yankee in Estonia”, Journal of Economic Education, 29(4), pp.340-347.
Tinari, F. D. and Khandke, K. (2000) “From Rhythm and Blues to Broadway: Using Music to Teach Economics”, Journal of Economic Education, 31(3), pp. 253-270.
Watts, M. (1998), “Using Literature and Drama in Undergraduate Economics Courses”, in Becker, W.E. and Watts, M. (eds.), Teaching Economics to Undergraduates: Alternatives to Chalk and Talk, Northampton, MA: Edward Elgar, pp.185-207.
Watts, M. (2003) The Literary Book of Economics, Wilmington, DE: ISI Books.
Watts, M. and Smith, R. F. (1989) “Economics in Literature and Drama”, Journal of Economic Education, 20(3), pp.291-307.
Australasian Journal of Economics Education Volume 7, Number 1, 2010, pp.31-58
REDUCING THE EXPECTATIONS GAP: USING AN ACADEMIC LITERACIES APPROACH TO
IMPROVE STUDENT WRITING IN ECONOMICS*
Peter Docherty & Harry Tse School of Finance and Economics University of Technology, Sydney
ABSTRACT
This paper reports on the evaluation of a writing program embedded within an intermediate macroeconomics course at an Australian university. This program was designed to address core issues identified by an academic literacies analysis of what might be called the higher education writing problem: an observed poor quality in the writing of higher education students across a range of disciplines. The program attempted to close an expectations gap between student and academic perceptions of what constitutes “good writing” by using clear and detailed assessment criteria, providing exemplars of good writing, and interacting with students about their writing in a series of writing workshops. Regressions of assignment results on a range of factors and a comparison of assignment results for students who attended the writing workshops versus those who did not, indicate a small but positive, and statistically significant, effect of important aspects of the writing program on assignment outcomes. A distributional effect was also observed whereby students at the pass-fail margin who attended the writing workshops performed better than those who did not. Limitations of the study are identified and suggestions are made for further work.
Keywords: academic literacies, assessment expectations, embedded writing programs.
JEL classifications: A13, A22
* Correspondence: Peter Docherty, School of Finance and Economics, University of Technology, Sydney. Ph. 61 2 9514-7780; Fax 61 2 9514-7777; Email: [email protected]. Thanks to Alex Barthel, Bill Becker, Ross Forman, Ruth French, Kerry Hunter, Jo McKenzie, Gordon Menzies, Rod O’Donnell, Tracy Taylor, participants at the Teaching and Learning Forum in the Faculty of Business, University of Technology, Sydney, participants at the 12th Australasian Teaching Economics Conference, University of Western Australia in 2006 and two anonymous referees for comments and suggestions. ISSN 1448-448X © 2010 Australasian Journal of Economics Education
32 P. Docherty & H. Tse
1. INTRODUCTION The poor quality of student writing in undergraduate university courses is now legendary. It applies across a range of discipline areas, including economics, and is both a source of frustration for academics responsible for grading poorly written essays and reports, and a cause of concern for employers wanting to hire graduates with the ability to communicate clearly and effectively. Research over the last ten years or so into problems with the quality of student writing in higher education has delivered a number of insights into these problems and provided the rationale for programs to improve writing quality.
The contributions of Lea and Street (1998) and Carless (2006), for example, have provided interview and survey-based evidence that identifies differing perceptions and expectations about student writing and assessment structures as an important factor affecting the quality of student writing. Further, Hansen (1998) and Simpson & Carroll (1999) report on the design and implementation of writing intensive programs that embed the explicit recognition and assessment of writing skills into economics subjects in ways that directly address the problems identified in the literature. There is, however, little work to date that carefully evaluates the effectiveness of these writing programs. This is partly because evaluation is difficult, involving a number of measurement problems, and partly because many writing programs (including those referred to above) are targeted at small classes which provide little data that can be used for evaluation.
In an earlier paper, the present authors described a writing program which systematically attempted to address the perceptions and expectations dimensions of the student writing problem in a large intermediate macroeconomics subject (cf. Docherty, Tse, Forman & McKenzie, forthcoming). A rich set of quantitative and qualitative data was collected from that program about student utilisation of program resources and student performance in various written assessments. The present paper reports findings from a study of quantitative data collected from that program.
The paper proceeds by reviewing the relevant literature on student writing in higher education, and economics courses more specifically. It then briefly outlines the writing program before describing the data collected from it and reporting the results of regressions relating assessment outcomes to various dimensions of the program. Some
Improving Student Writing in Economics 33
conclusions are drawn in the final section and suggestions made for further work.
2. LITERATURE REVIEW The “student writing problem” in higher education is anecdotally characterised as the poor ability of students to write clear and cogent prose that directs attention to the ideas being discussed rather than to the writing itself. Koutsantoni (2007, p.21) distinguishes between two dimensions of the problem, the first associated with poor grammar, spelling and syntax, and the second associated with poor organisation of ideas and deficient argument construction. In economics, the latter often takes the form of poor specification of assumptions and an apparent inability to undertake analysis within a coherent conceptual framework.
Hansen (1998, p.82) argues that the problem is to some extent inherited by universities but that little is done to correct the problem once students arrive at university. This is particularly the case in the economics discipline where students are often set assignment tasks that require them to solve problem sets and answer multiple choice questions rather than to write papers that academics regard as too time-consuming to grade (Walstad 2001, pp.283-285). Davies, Swinburn and Williams (2006, pp.vii-viii) advance a similar argument but make the additional point that this lack of skills means that students are not able to “make the most of their education” while at university.
An implication of framing the “writing problem” in these terms is that its source is often regarded as a reflection of the quality of the students being taught. Lea and Street (1998, pp.158-159) describe this way of thinking about student writing as the study skills approach. According to this approach, student literacy is comprised of a set of general abilities associated with reading and knowledge of such things as sentence-level grammar and syntax. The problem arises because students lack these skills, and the solution is to more effectively inculcate them although the success of this strategy is ultimately limited by the underlying ability of the students in question. Lea and Street compare this with a second academic socialisation model that defines skills more broadly to include a knowledge of and ability to adhere to academic conventions such as correct referencing and the avoidance of plagiarism. According to this approach, student writing
34 P. Docherty & H. Tse
may be improved by more effectively inducting students into academic society and teaching them to better follow the appropriate conventions. The second model to some extent encompasses the first but both models imply that writing skills are essentially generic and once learned, can be applied with relative ease to new areas of study.
A third model, however, provides a very different perspective. The academic literacies model views literacy as socially constructed and context dependent. Rather than being a set of generic skills that can be applied across a range of disciplines, writing skills vary from discipline to discipline as do the features of what constitutes “good writing”. Koutsantoni (2007, p.19) argues, therefore, that the nature of writing is closely linked to the “discourse communities” within which it is written and within which it is intended to be read (cf. Bloxham & West 2007, pp.77), and its features are governed by the epistemologies, ideologies and methodologies of these academic communities. Lillis and Turner (2001, pp.62-64) describe writing and language within this view as tools for constructing ideas and knowledge rather than simply as instruments for conveying ideas and knowledge as the study skills model might suggest.
Lea and Street (1998, p.165) outline the importance of discipline-specific contexts for writing with reference to the example of a student majoring in history who took a course in anthropology. While the student achieved high results in his history major, as well as in subjects taken prior to university, he scored poorly on his first anthropology paper receiving feedback that suggested a weakness in his ability to structure arguments. Lea and Street analyse this apparent difference in the student’s ability to write in history relative to anthropology as in fact reflecting a difference in the methodologies of the two subjects themselves. The student constructed an argument for his anthropology paper based around the description of facts and events, an approach that had delivered high results in history. But Lea and Street argue that the methodology of anthropology makes greater use of abstract theorising and values factual description to a significantly lesser extent than does the methodology of history. The meaning of terms such as ‘structure’ and ‘argument’ thus take different concrete forms in the two disciplines so that the student’s successful structure and argument in one subject did not translate into the other.
Improving Student Writing in Economics 35
An interesting aspect of this case was the grader’s evaluation of the problem. While the grader interpreted the poor quality of the anthropology paper as reflecting the student’s inattentiveness to ‘structure’ and ‘argument’, Lea and Street suggest that it was not that the student did not value structure or argument but that his conception of these features of writing for the discipline did not match that of the discipline community. Interestingly, while Lea and Street (1998, pp.163-164) provide evidence that students are aware of problems associated with switching between subjects with different epistemologies, academics are less aware of this problem and, more disturbingly, lack awareness of the importance that their own epistemology plays in the way they interpret what they read.
In economics, this methodology probably takes the form of the hypothetico-deductive method where assumptions and initial conditions are specified, a proposition or set of propositions is formulated, and then a set of logically implied consequences is inferred. These logical consequences may also be tested against data from which statistical inferences are drawn about the probability of their truth. The method of falsification then allows hypotheses to be held tentatively until such time as they are rejected on the basis of statistical inference (Blaug 1980). McCloskey (1983, p.482) has raised a number of problems with this methodology (as have a number of others, see, for example, Caldwell 1982 and Dow 1985) suggesting that in reality many economists apply quite different methodologies in their research and writing. It is, however, the case that economic methodology is rarely articulated to the majority of students who are essentially left to pick it up by observing its implicit use in lectures and textbooks.
Lea and Street (1998, p.164) suggest that this lack of methodological self-consciousness may lead academics, dissatisfied with the underlying epistemological methodology of a piece of student writing, to use more general dimensions of the writing, such as ‘structure’ and ‘argument’, to articulate their dissatisfaction. Students are thus sent inaccurate and misleading signals about the nature of problems with their writing and are likely to experience a kind of dissonance between feedback and their own perceptions of their writing, especially where they have given careful attention to such features as structure and argument. Lea and Street also argue that such differences are generalisable to a much broader range of disciplines,
36 P. Docherty & H. Tse
that students are aware of these differences, and that this awareness is the source of considerable uncertainty for students as they approach writing tasks in unfamiliar subjects (cf. Bloxham & West 2007, p.79).
This dimension of the problem has been further analysed in the literature in terms of the tacit nature of the knowledge academics possess about the epistemology and methodology underpinning a discipline area. Ecclestone (2001), O’Donovan, Price and Rust (2004), Price (2005) and Sadler (2005) all identify the tacit nature of this knowledge and point out the impact it may have in reducing the effectiveness of student assessment processes (cf. Bloxham & West 2007, p.78).
Analysis of the student writing problem in terms the academic literacies model, the tacit nature of understandings academics have about the epistemologies and methodologies of their discipline areas, and the expectations gap between student and teacher that this tacit knowledge creates, suggests a range of possible measures to improve student writing. Firstly, it suggests that writing programs are more effectively embedded in discipline-based units of study rather than offered to students from a range of discipline backgrounds because the nature of good quality writing is discipline-specific. Secondly, academics should increase their own awareness of the epistemological and methodological dimensions of how they interpret student writing in their specific discipline area. Thirdly, the gap between student and academic expectations of what constitutes good writing could be reduced if academics communicated these expectations to students more effectively and provided more resources that help students to understand these expectations. Fourthly, feedback that more accurately addresses the fundamental problems with student writing could be provided rather than misdirecting students to features of their writing not directly related to the real sources of problems.
A number of these issues have been addressed either explicitly or implicitly in programs designed to improve student writing. Hansen (1998) reports on a Writing Intensive (WI) course at the University of Wisconsin, Madison in which the “critical role of writing in the learning process” (Hansen 1998, p.80) is emphasised. This course in elementary economics, with an enrolment of between 50 and 100, embeds a program of writing instruction within an economics course, the objectives of which are linked explicitly to graduate proficiencies developed in conjunction with colleagues and employers. Students are
Improving Student Writing in Economics 37
given complementary writing instruction, required to complete a range of writing tasks, and feedback is an essential element in the program. Hansen clearly spells out a set of assessment criteria at the beginning of each semester and students study a collection of good quality writing in the field of economics which provides them with models they can use to shape their own writing. The Wisconsin program thus embodies all four measures outlined above to improve the quality of student writing.
Simpson and Carroll (1999, p.402) report on a program of WI courses in the undergraduate economics offering at Davidson College in the US. Three features characterise these courses: firstly, written assessment makes up at least 50% of final grades; secondly, academic support and feedback is provided for the entire writing process including drafting, editing and revising of drafted material; thirdly, course enrolment is capped at 12. The program asks students to “become flexible, critical thinkers who [are] simultaneously knowledgeable in a discipline and able to apply their skills beyond it” (Simpson & Carroll 1999, p.408). This program strongly emphasises the last of the measures outlined above.
Northedge (2003, pp.173-174) argues that higher education teachers should address the expectations gap by guiding students through their own exploration of discipline-specific epistemologies and methodologies, and by engaging them in on-going dialogues about these features of the discipline. This can be facilitated, he argues, by designing appropriate student learning experiences. Northedge’s conception of “dialogue” in this context can include traditional lecture-style teaching but students must be given the opportunity to converse with their teachers in order to articulate the way they understand discipline-specific frameworks and in order to allow their teachers to provide feedback about whether these understandings are consistent with established interpretations.
Carless (2006, p.230) suggests a useful framework for structuring Northedge’s recommendation of dialogue between academics and students to reduce the expectations gap and to facilitate a greater shared awareness of others’ perceptions of good writing. He proposes four objectives which may be used to organise ‘assessment dialogues’ between tutors and students:
• Helping students to unpack assessment criteria; • Genuine use of these criteria to grade assessment tasks;
38 P. Docherty & H. Tse
• Greater awareness by tutors of the formative function of comments on written assessment;
• Moderation processes to improve student perception of fairness in the grading process.
A number of reported writing programs and strategies have incorporated aspects of Carless’s measures. The criterion referenced approach to assessment attempts to close the expectations gap by having academics articulate their expectations using carefully formulated criteria against which assessment tasks are graded (Rust, Price & O’Donovan 2003). Writing across the curriculum (WAC) or writing in the disciplines (WID) programs stress the integration of teaching about writing into disciplinary courses and view writing as a tool for discipline-specific teaching as well as for improving student writing generally (cf. Cohen & Spencer 1993). Somerville & Creme (2005), for example, describe a WID program which placed heavy stress on a freewriting strategy to provide students with the opportunity to find a ‘voice’ in the writing process. Feedback on the writing produced from this strategy was then provided to shape student writing into more formal pieces that conformed to standard expectations of discipline-based writing. Bloxham & West (2007) describe an initiative that used well defined assessment criteria, grade descriptors and feedback on initial papers, and they provide student interview evidence that demonstrates the effectiveness of this approach. Saltmarsh & Saltmarsh (2008) report a program in which students completed regular “critical reviews” of key disciplinary texts which became the focus of student-teacher dialogues that helped students to engage with key methodological issues in the area of teacher education.
All of these programs are examples of practical approaches that may be taken to improve student writing by reducing the expectations gap described above. But despite this, most of these approaches remain outside the reach of large degree courses which have enrolments numbering in the hundreds. Evaluation of these approaches has also tended to be conducted on small samples of students and has tended to be mainly qualitative in nature. Scope therefore exists to develop large class programs which embody the key measures of these smaller scale initiatives and which may also provide the opportunity for quantitative evaluation that can complement the kinds of evaluation already reported. The following
Improving Student Writing in Economics 39
sections outline an attempt to implement such a program and initial findings from the program’s evaluation.
3. FEATURES OF THE WRITING PROGRAM The writing improvement program developed by the present authors attempted to reduce the expectations gap between academics and their students about what constitutes high quality writing in an intermediate macroeconomics course using a number of the measures described in the previous section. The course offered by the School of Finance and Economics at the University of Technology, Sydney (UTS) had an enrolment of 269 students, was implemented by a team made up of both academic language and subject area experts, and had the following key features:
• fifteen assessment criteria relating to the structure and content of assignments were specified and papers were graded carefully against these criteria;
• a variety of writing support materials were provided online; • a series of writing workshops were held to help students
understand the assessment criteria; • a single essay in the assessment structure was replaced with two
smaller papers on related questions to facilitate the provision of feedback to students and its use by them to learn and improve their writing.
A detailed description of the program is provided in Docherty, Tse, Forman and McKenzie (forthcoming) but a number of these key features are worth discussing briefly. The fifteen criteria were designed to provide students with a relatively detailed picture of what lecturers in the course would be looking for when grading assignments and are outlined in Table 1. While the criteria were formulated in relatively general terms, they articulated the importance of logical development in argument structure, connections between ideas and an appropriately critical stance in the writing expected of students. They were also cross-referenced to a sample essay from a previous semester on a different question to provide students with concrete examples of how the criteria could be reflected in student writing and they were also discussed and explained in the writing workshops considered below. These criteria were printed on the assignment coversheet and made available on the subject’s website (a Blackboard Version
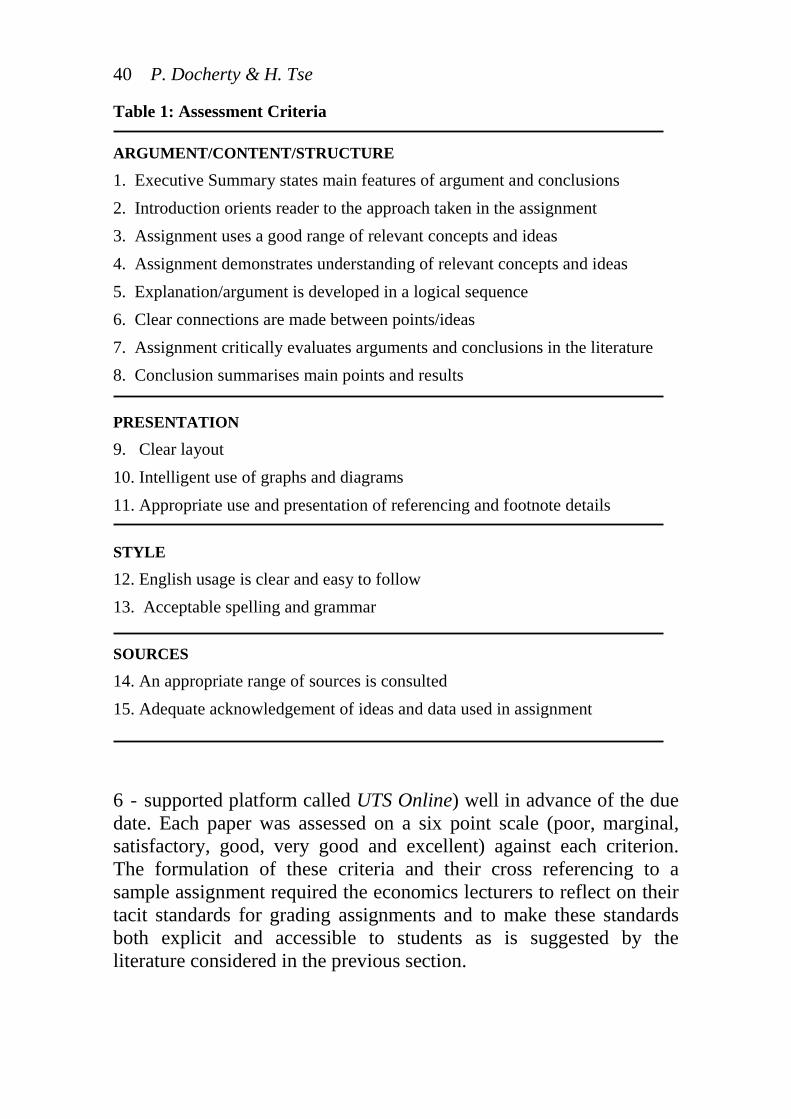
40 P. Docherty & H. Tse
Table 1: Assessment Criteria ARGUMENT/CONTENT/STRUCTURE
1. Executive Summary states main features of argument and conclusions 2. Introduction orients reader to the approach taken in the assignment 3. Assignment uses a good range of relevant concepts and ideas 4. Assignment demonstrates understanding of relevant concepts and ideas 5. Explanation/argument is developed in a logical sequence 6. Clear connections are made between points/ideas 7. Assignment critically evaluates arguments and conclusions in the literature 8. Conclusion summarises main points and results PRESENTATION
9. Clear layout 10. Intelligent use of graphs and diagrams 11. Appropriate use and presentation of referencing and footnote details STYLE
12. English usage is clear and easy to follow 13. Acceptable spelling and grammar SOURCES
14. An appropriate range of sources is consulted 15. Adequate acknowledgement of ideas and data used in assignment
6 - supported platform called UTS Online) well in advance of the due date. Each paper was assessed on a six point scale (poor, marginal, satisfactory, good, very good and excellent) against each criterion. The formulation of these criteria and their cross referencing to a sample assignment required the economics lecturers to reflect on their tacit standards for grading assignments and to make these standards both explicit and accessible to students as is suggested by the literature considered in the previous section.
Improving Student Writing in Economics 41
The online resources were similarly designed to help students understand more clearly what was expected of good writing in the course. These resources included:
• a 70-page Guide to Writing Assignments published by the Faculty of Business (2006) which examines how to read for an assignment and how to prepare for writing, how to identify and use different writing styles and business writing genres, and how to follow academic citation conventions; in addition a shorter guide of three pages was made available;
• the sample paper annotated against the assessment criteria; • references made available via the University Library’s Digital
Resources Register (DRR) and accessed via UTS Online, which were required to write the assignment. Since writing was the program focus rather than the development of research skills, it was decided to specify these references so that students could devote more time to the writing process itself.
The writing workshops were offered in the weeks leading up to submission, in order to facilitate an academic-student dialogue of the type suggested by Northedge (2003) and Carless (2006), and embodied in the approaches taken by Bloxham & West (2007) and Saltmarsh & Saltmarsh (2008). One workshop was offered in each of the three weeks before submission for each assignment, a total of six workshops in all. Each workshop dealt with a different set of issues and each series of three workshops was also designed to get students working on the relevant assignment at an early stage. It was decided to make the workshops voluntary since the project was at the development stage and this would provide the opportunity to iron out logistical problems before making the workshops mandatory. The workshops were, however, strongly advertised in lectures.
Each workshop was 90 minutes in duration, was taught by specialist academic language staff from the UTS ELSSA Centre (which provides academic and professional English assistance to students and staff) with support from the economics specialists, and was repeated twice per week to maximise convenience for student attendance. The first series of three workshops focused on helping students to:
• unpack the question for the first assignment and comprehend the readings. A worksheet activity was used to help students appreciate the purposes of each part of the assignment and to
42 P. Docherty & H. Tse
recognise the language features and writing styles each part of the assignment would require;
• identify the required content. Small segments of a model assignment were used to demonstrate the language structure of the whole text, model the language required in each part of the assignment and to draw attention to specific features of analytical writing in economics;
• identify the genre, formats and styles of “essays” as opposed to “reports”. Format issues were considered including the role of abstracts and executive summaries, subheadings, and the use of graphs and lists. Style issues such as language complexity versus accessibility, and argumentation versus explanation were also considered.
The replacement of a single essay with two smaller papers on related questions was designed to facilitate the provision of feedback to students that could be incorporated into preparation of further work within the semester. The core theme of these related questions focused on the forces affecting oil prices, which had increased significantly in the previous few years, and the potential impact that these increases could have on the macroeconomy. Via the first series of writing workshops, students were engaged in dialogue that began with accurate description of what had happened with oil prices in the immediately preceding years, what factors may have caused these developments and how this analysis could most accurately be articulated in writing. Students were thus taken from descriptive through more analytical modes of economic argument. In the second series of workshops, students were given feedback in addition to that on their individual papers concerning how the class as a whole had approached the first assignment, what had been the main strengths and weaknesses of this approach, and how this might be improved in the second assignment. Students were also engaged in dialogue about how more complex analytics that examined the impact of oil price movements on the broader economy might be approached and written about.
The program thus attempted to embody all of the main lessons from the literature about academic expectations of students in assessment items, communication of these expectations to students, and the provision of feedback to students on their learning and performance against clearly articulated criteria. Data on student interaction with
Improving Student Writing in Economics 43
various aspects of the program were collected to facilitate program evaluation. Dimensions of this data relevant to student performance in the first assignment is described in the following section.
4. THE DATA The ideal way to evaluate programs of this kind is to gauge the extent to which students’ writing improves as a result of the intervention. This could be done by comparing the characteristics of student writing samples before and after implementation. However, neither writing samples of previous students in the course nor writing samples of current students from previous courses were available for comparison.
An alternative approach arose, however, due to the voluntary nature of the program. Some students attended the workshops while others did not; and some students made use of the online resources while others did not. It was thus possible to compare the performance of students who made use of resources with the performance of students who did not, controlling for other factors likely to affect performance. Data on student access to online resources was available from UTS Online’s tracking function. This data is described in the first sub-section below. Data on workshop attendance is described in the second sub-section below, and data on student performance is outlined and an initial evaluation of this data is offered in the third sub-section below. Data for Online Self-Accessed Resources Figures 1 to 5 present information about student access to the resources provided online for Assignment 1. Two particular resources that ought to have played an important role in reducing the expectations gap were the assessment criteria and the annotated sample paper. Figure 1 shows the pattern of first time hits by students on this resource for a range of dates in March of the semester in which the program was implemented. The first assignment was due on March 31. Students who accessed these criteria early enough should have had more time to digest and come to terms with them and should have been better able to use them in shaping their assignments. Other factors held constant, they should also have performed better than students who ignored these criteria in preparing their assignments or who had little time to shape their papers using the criteria. It is worth noting that these criteria appeared on the compulsory assignment cover page, so that the high number of first hits on the due date of
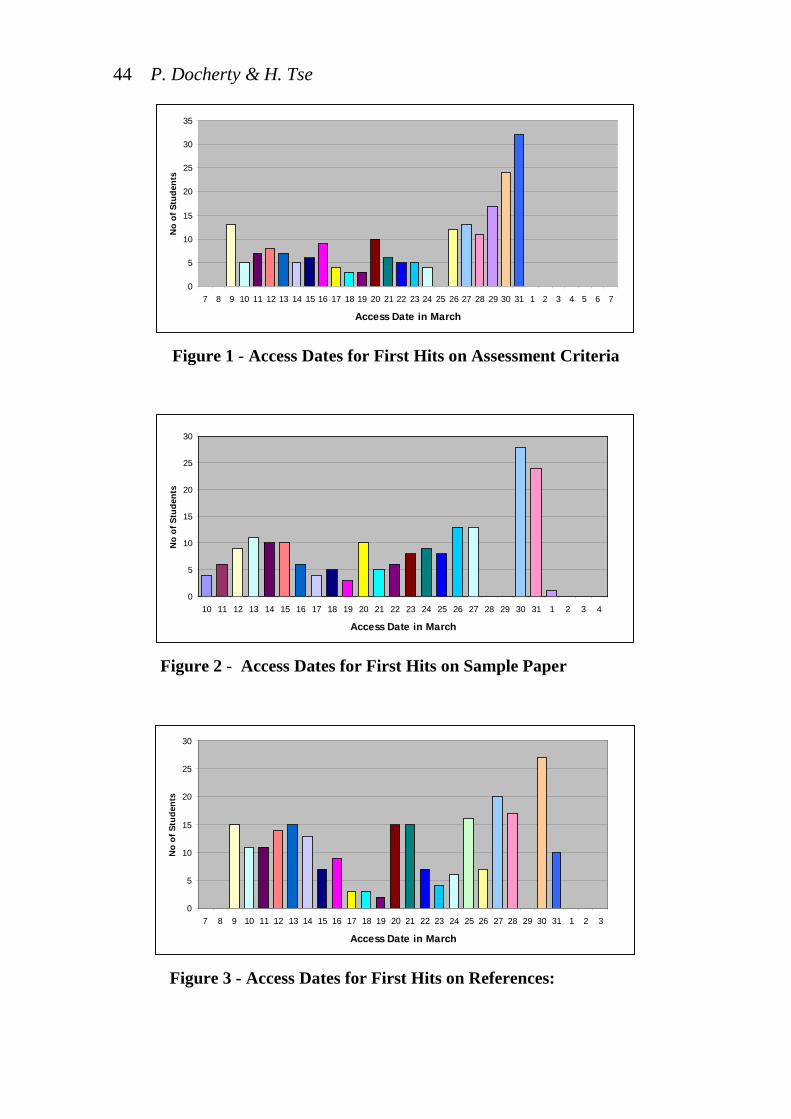
44 P. Docherty & H. Tse
Figure 1 - Access Dates for First Hits on Assessment Criteria
Figure 2 - Access Dates for First Hits on Sample Paper
Figure 3 - Access Dates for First Hits on References:
0
5
10
15
20
25
30
35
7 8 9 10 11 12 13 14 15 16 17 18 19 20 21 22 23 24 25 26 27 28 29 30 31 1 2 3 4 5 6 7
Access Date in March
No
of S
tude
nts
0
5
10
15
20
25
30
10 11 12 13 14 15 16 17 18 19 20 21 22 23 24 25 26 27 28 29 30 31 1 2 3 4
Access Date in March
No
of S
tude
nts
0
5
10
15
20
25
30
7 8 9 10 11 12 13 14 15 16 17 18 19 20 21 22 23 24 25 26 27 28 29 30 31 1 2 3
Access Date in March
No
of S
tude
nts
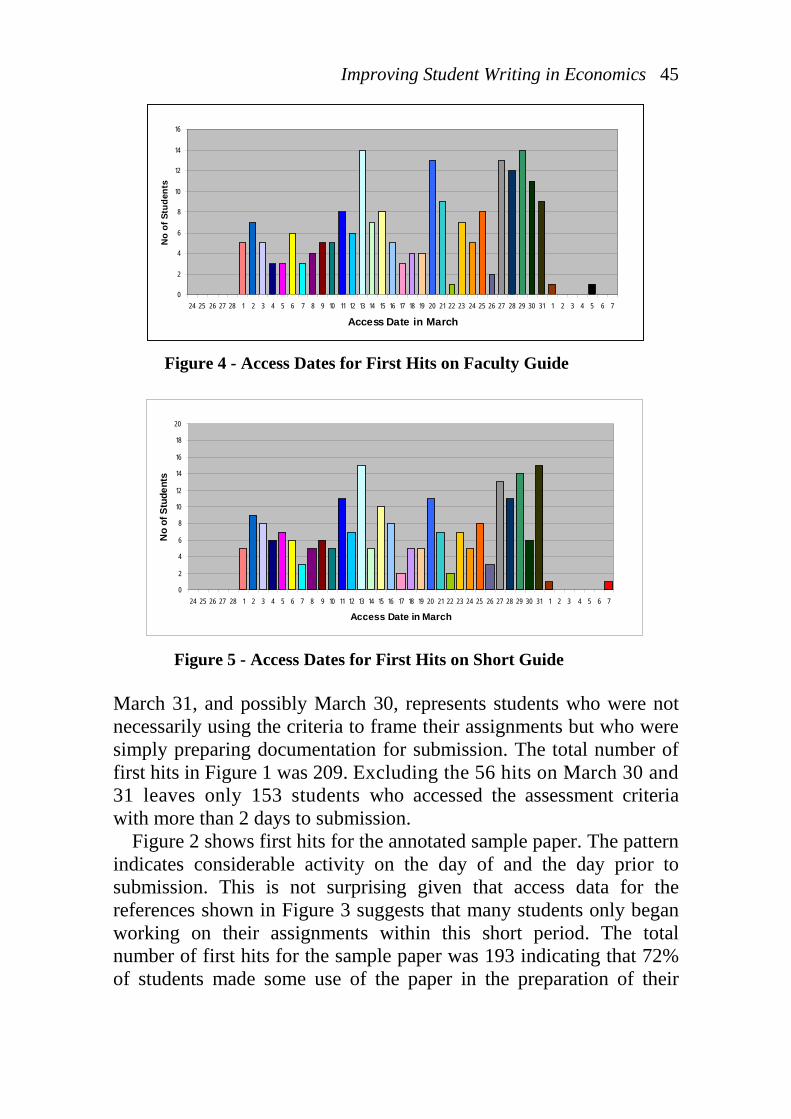
Improving Student Writing in Economics 45
Figure 4 - Access Dates for First Hits on Faculty Guide
Figure 5 - Access Dates for First Hits on Short Guide
March 31, and possibly March 30, represents students who were not necessarily using the criteria to frame their assignments but who were simply preparing documentation for submission. The total number of first hits in Figure 1 was 209. Excluding the 56 hits on March 30 and 31 leaves only 153 students who accessed the assessment criteria with more than 2 days to submission.
Figure 2 shows first hits for the annotated sample paper. The pattern indicates considerable activity on the day of and the day prior to submission. This is not surprising given that access data for the references shown in Figure 3 suggests that many students only began working on their assignments within this short period. The total number of first hits for the sample paper was 193 indicating that 72% of students made some use of the paper in the preparation of their
0
2
4
6
8
10
12
14
16
24 25 26 27 28 1 2 3 4 5 6 7 8 9 10 11 12 13 14 15 16 17 18 19 20 21 22 23 24 25 26 27 28 29 30 31 1 2 3 4 5 6 7
Access Date in March
No
of S
tude
nts
0
2
4
6
8
10
12
14
16
18
20
24 25 26 27 28 1 2 3 4 5 6 7 8 9 10 11 12 13 14 15 16 17 18 19 20 21 22 23 24 25 26 27 28 29 30 31 1 2 3 4 5 6 7
Access Date in March
No
of S
tude
nts
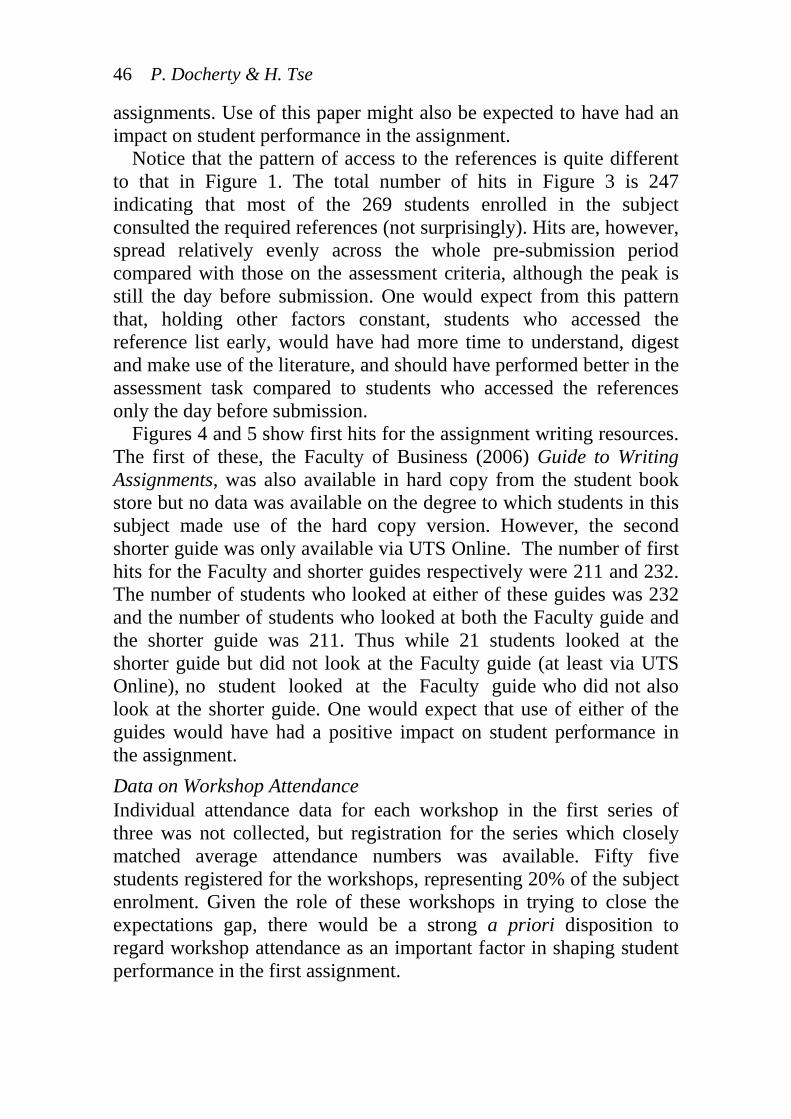
46 P. Docherty & H. Tse
assignments. Use of this paper might also be expected to have had an impact on student performance in the assignment.
Notice that the pattern of access to the references is quite different to that in Figure 1. The total number of hits in Figure 3 is 247 indicating that most of the 269 students enrolled in the subject consulted the required references (not surprisingly). Hits are, however, spread relatively evenly across the whole pre-submission period compared with those on the assessment criteria, although the peak is still the day before submission. One would expect from this pattern that, holding other factors constant, students who accessed the reference list early, would have had more time to understand, digest and make use of the literature, and should have performed better in the assessment task compared to students who accessed the references only the day before submission.
Figures 4 and 5 show first hits for the assignment writing resources. The first of these, the Faculty of Business (2006) Guide to Writing Assignments, was also available in hard copy from the student book store but no data was available on the degree to which students in this subject made use of the hard copy version. However, the second shorter guide was only available via UTS Online. The number of first hits for the Faculty and shorter guides respectively were 211 and 232. The number of students who looked at either of these guides was 232 and the number of students who looked at both the Faculty guide and the shorter guide was 211. Thus while 21 students looked at the shorter guide but did not look at the Faculty guide (at least via UTS Online), no student looked at the Faculty guide who did not also look at the shorter guide. One would expect that use of either of the guides would have had a positive impact on student performance in the assignment. Data on Workshop Attendance Individual attendance data for each workshop in the first series of three was not collected, but registration for the series which closely matched average attendance numbers was available. Fifty five students registered for the workshops, representing 20% of the subject enrolment. Given the role of these workshops in trying to close the expectations gap, there would be a strong a priori disposition to regard workshop attendance as an important factor in shaping student performance in the first assignment.
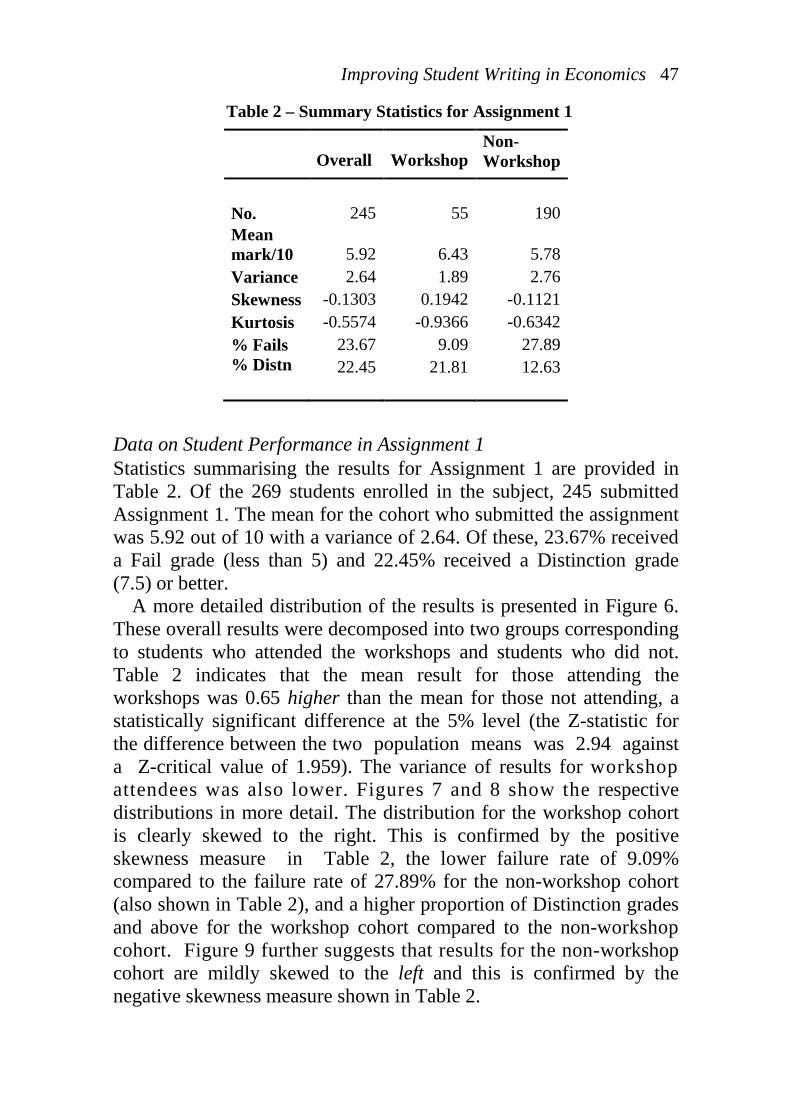
Improving Student Writing in Economics 47
Table 2 – Summary Statistics for Assignment 1
Overall Workshop Non-Workshop
No. 245 55 190 Mean mark/10 5.92 6.43 5.78 Variance 2.64 1.89 2.76 Skewness -0.1303 0.1942 -0.1121 Kurtosis -0.5574 -0.9366 -0.6342 % Fails 23.67 9.09 27.89 % Distn
22.45 21.81 12.63
Data on Student Performance in Assignment 1 Statistics summarising the results for Assignment 1 are provided in Table 2. Of the 269 students enrolled in the subject, 245 submitted Assignment 1. The mean for the cohort who submitted the assignment was 5.92 out of 10 with a variance of 2.64. Of these, 23.67% received a Fail grade (less than 5) and 22.45% received a Distinction grade (7.5) or better.
A more detailed distribution of the results is presented in Figure 6. These overall results were decomposed into two groups corresponding to students who attended the workshops and students who did not. Table 2 indicates that the mean result for those attending the workshops was 0.65 higher than the mean for those not attending, a statistically significant difference at the 5% level (the Z-statistic for the difference between the two population means was 2.94 against a Z-critical value of 1.959). The variance of results for workshop attendees was also lower. Figures 7 and 8 show the respective distributions in more detail. The distribution for the workshop cohort is clearly skewed to the right. This is confirmed by the positive skewness measure in Table 2, the lower failure rate of 9.09% compared to the failure rate of 27.89% for the non-workshop cohort (also shown in Table 2), and a higher proportion of Distinction grades and above for the workshop cohort compared to the non-workshop cohort. Figure 9 further suggests that results for the non-workshop cohort are mildly skewed to the left and this is confirmed by the negative skewness measure shown in Table 2.
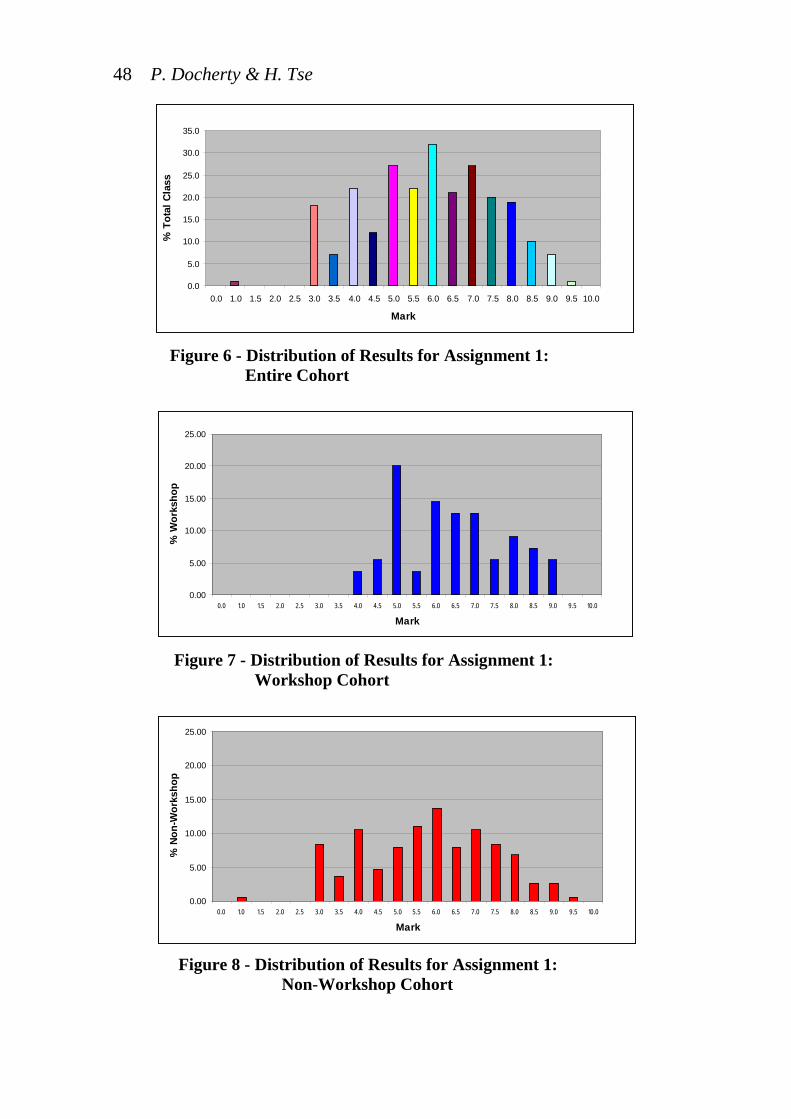
48 P. Docherty & H. Tse
Figure 6 - Distribution of Results for Assignment 1:
Entire Cohort
Figure 7 - Distribution of Results for Assignment 1:
Workshop Cohort
Figure 8 - Distribution of Results for Assignment 1:
Non-Workshop Cohort
0.0
5.0
10.0
15.0
20.0
25.0
30.0
35.0
0.0 1.0 1.5 2.0 2.5 3.0 3.5 4.0 4.5 5.0 5.5 6.0 6.5 7.0 7.5 8.0 8.5 9.0 9.5 10.0
Mark
% T
otal
Cla
ss
0.00
5.00
10.00
15.00
20.00
25.00
0.0 1.0 1.5 2.0 2.5 3.0 3.5 4.0 4.5 5.0 5.5 6.0 6.5 7.0 7.5 8.0 8.5 9.0 9.5 10.0
Mark
% W
orks
hop
0.00
5.00
10.00
15.00
20.00
25.00
0.0 1.0 1.5 2.0 2.5 3.0 3.5 4.0 4.5 5.0 5.5 6.0 6.5 7.0 7.5 8.0 8.5 9.0 9.5 10.0
Mark
% N
on-W
orks
hop
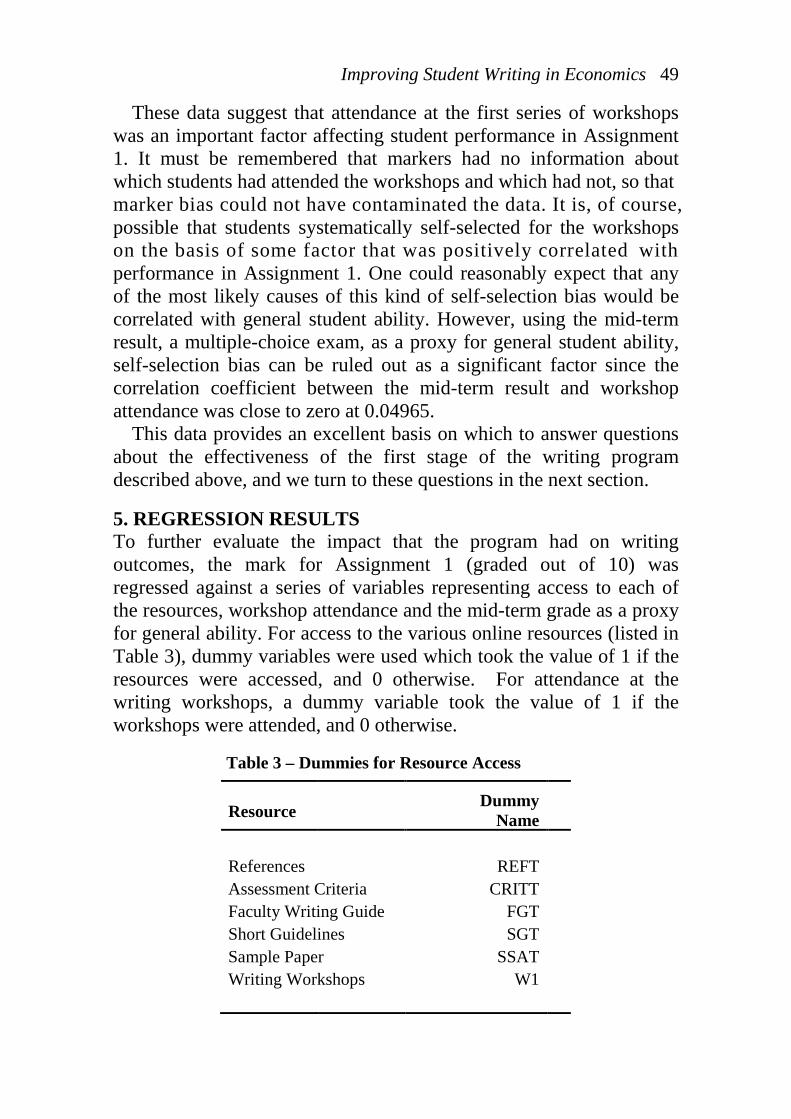
Improving Student Writing in Economics 49
These data suggest that attendance at the first series of workshops was an important factor affecting student performance in Assignment 1. It must be remembered that markers had no information about which students had attended the workshops and which had not, so that marker bias could not have contaminated the data. It is, of course, possible that students systematically self-selected for the workshops on the basis of some factor that was positively correlated with performance in Assignment 1. One could reasonably expect that any of the most likely causes of this kind of self-selection bias would be correlated with general student ability. However, using the mid-term result, a multiple-choice exam, as a proxy for general student ability, self-selection bias can be ruled out as a significant factor since the correlation coefficient between the mid-term result and workshop attendance was close to zero at 0.04965.
This data provides an excellent basis on which to answer questions about the effectiveness of the first stage of the writing program described above, and we turn to these questions in the next section.
5. REGRESSION RESULTS To further evaluate the impact that the program had on writing outcomes, the mark for Assignment 1 (graded out of 10) was regressed against a series of variables representing access to each of the resources, workshop attendance and the mid-term grade as a proxy for general ability. For access to the various online resources (listed in Table 3), dummy variables were used which took the value of 1 if the resources were accessed, and 0 otherwise. For attendance at the writing workshops, a dummy variable took the value of 1 if the workshops were attended, and 0 otherwise.
Table 3 – Dummies for Resource Access
Resource Dummy Name
References REFT Assessment Criteria CRITT Faculty Writing Guide FGT Short Guidelines SGT Sample Paper SSAT Writing Workshops W1
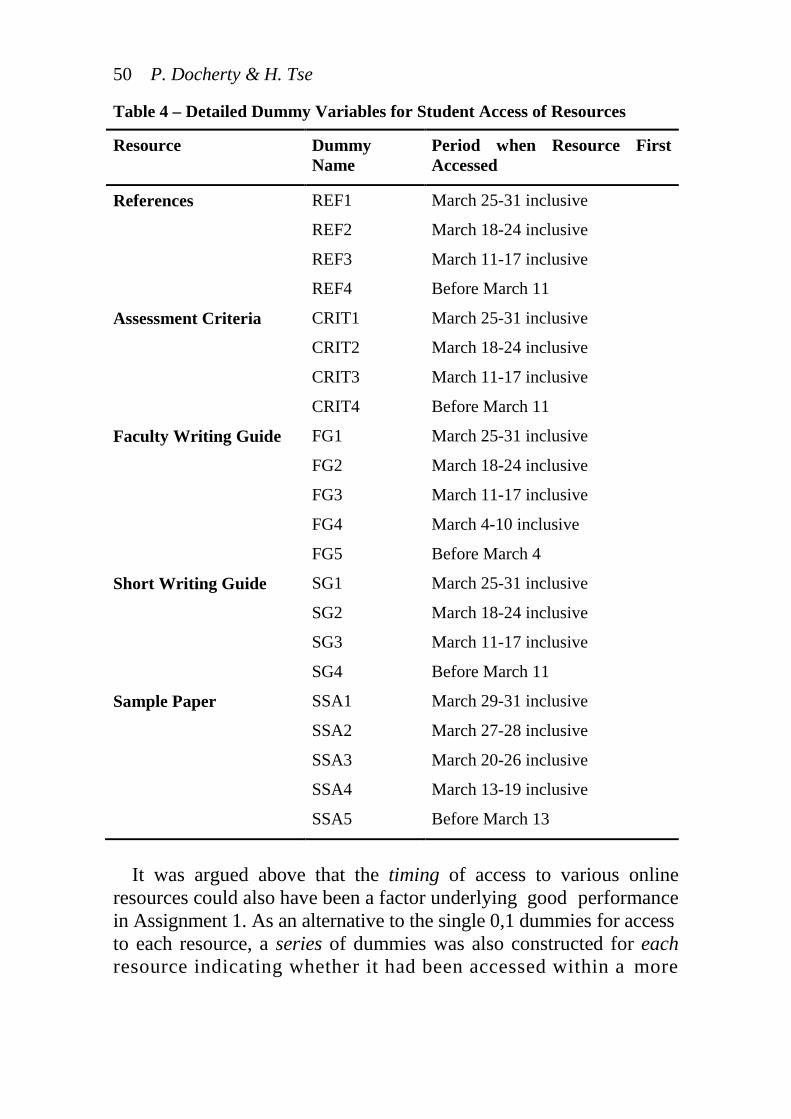
50 P. Docherty & H. Tse
Table 4 – Detailed Dummy Variables for Student Access of Resources
Resource Dummy Name
Period when Resource First Accessed
References REF1 March 25-31 inclusive
REF2 March 18-24 inclusive
REF3 March 11-17 inclusive
REF4 Before March 11
Assessment Criteria CRIT1 March 25-31 inclusive
CRIT2 March 18-24 inclusive
CRIT3 March 11-17 inclusive
CRIT4 Before March 11
Faculty Writing Guide FG1 March 25-31 inclusive
FG2 March 18-24 inclusive
FG3 March 11-17 inclusive
FG4 March 4-10 inclusive
FG5 Before March 4
Short Writing Guide SG1 March 25-31 inclusive
SG2 March 18-24 inclusive
SG3 March 11-17 inclusive
SG4 Before March 11
Sample Paper SSA1 March 29-31 inclusive
SSA2 March 27-28 inclusive
SSA3 March 20-26 inclusive
SSA4 March 13-19 inclusive
SSA5 Before March 13
It was argued above that the timing of access to various online
resources could also have been a factor underlying good performance in Assignment 1. As an alternative to the single 0,1 dummies for access to each resource, a series of dummies was also constructed for each resource indicating whether it had been accessed within a more
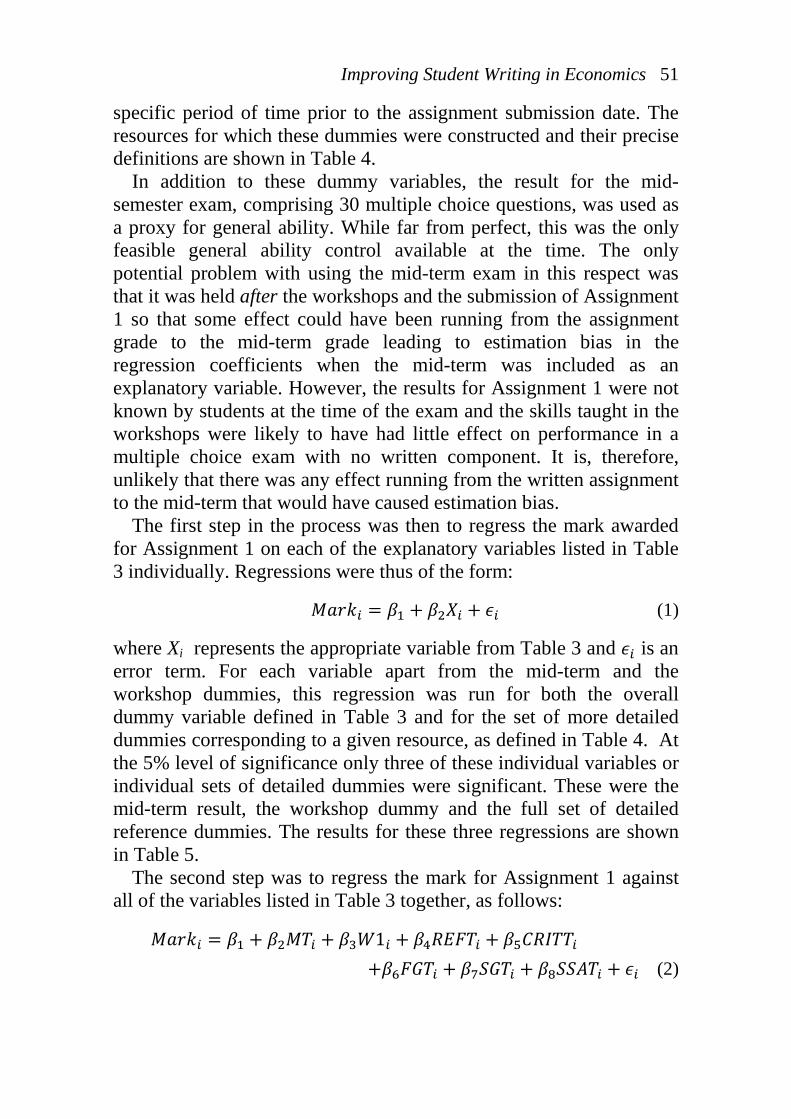
Improving Student Writing in Economics 51
specific period of time prior to the assignment submission date. The resources for which these dummies were constructed and their precise definitions are shown in Table 4.
In addition to these dummy variables, the result for the mid-semester exam, comprising 30 multiple choice questions, was used as a proxy for general ability. While far from perfect, this was the only feasible general ability control available at the time. The only potential problem with using the mid-term exam in this respect was that it was held after the workshops and the submission of Assignment 1 so that some effect could have been running from the assignment grade to the mid-term grade leading to estimation bias in the regression coefficients when the mid-term was included as an explanatory variable. However, the results for Assignment 1 were not known by students at the time of the exam and the skills taught in the workshops were likely to have had little effect on performance in a multiple choice exam with no written component. It is, therefore, unlikely that there was any effect running from the written assignment to the mid-term that would have caused estimation bias.
The first step in the process was then to regress the mark awarded for Assignment 1 on each of the explanatory variables listed in Table 3 individually. Regressions were thus of the form:
𝑀𝑎𝑟𝑘𝑖 = 𝛽1 + 𝛽2𝑋𝑖 + 𝜖𝑖 (1)
where Xi represents the appropriate variable from Table 3 and 𝜖𝑖 is an error term. For each variable apart from the mid-term and the workshop dummies, this regression was run for both the overall dummy variable defined in Table 3 and for the set of more detailed dummies corresponding to a given resource, as defined in Table 4. At the 5% level of significance only three of these individual variables or individual sets of detailed dummies were significant. These were the mid-term result, the workshop dummy and the full set of detailed reference dummies. The results for these three regressions are shown in Table 5.
The second step was to regress the mark for Assignment 1 against all of the variables listed in Table 3 together, as follows:
𝑀𝑎𝑟𝑘𝑖 = 𝛽1 + 𝛽2𝑀𝑇𝑖 + 𝛽3𝑊1𝑖 + 𝛽4𝑅𝐸𝐹𝑇𝑖 + 𝛽5𝐶𝑅𝐼𝑇𝑇𝑖 +𝛽6𝐹𝐺𝑇𝑖 + 𝛽7𝑆𝐺𝑇𝑖 + 𝛽8𝑆𝑆𝐴𝑇𝑖 + 𝜖𝑖 (2)
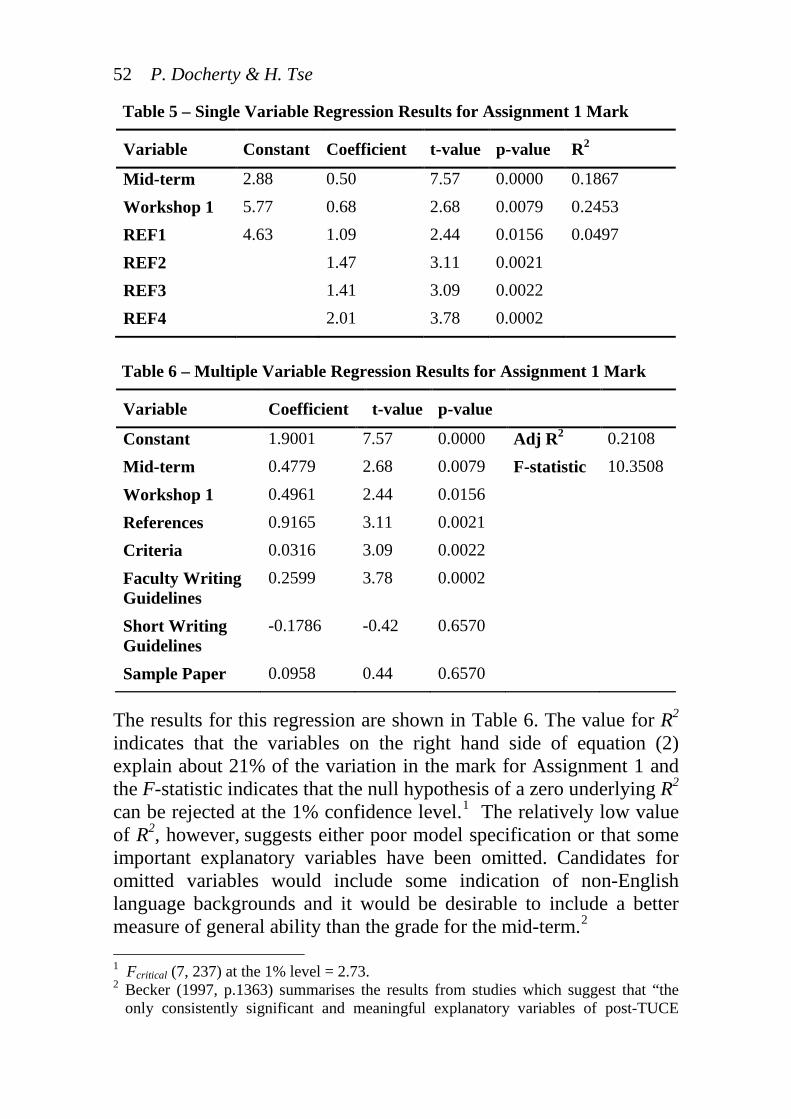
52 P. Docherty & H. Tse
Table 5 – Single Variable Regression Results for Assignment 1 Mark
Variable Constant Coefficient t-value p-value R2
Mid-term 2.88 0.50 7.57 0.0000 0.1867
Workshop 1 5.77 0.68 2.68 0.0079 0.2453 REF1 4.63 1.09 2.44 0.0156 0.0497
REF2 1.47 3.11 0.0021 REF3 1.41 3.09 0.0022
REF4 2.01 3.78 0.0002
Table 6 – Multiple Variable Regression Results for Assignment 1 Mark
Variable Coefficient t-value p-value
Constant 1.9001 7.57 0.0000 Adj R2 0.2108 Mid-term 0.4779 2.68 0.0079 F-statistic 10.3508
Workshop 1 0.4961 2.44 0.0156
References 0.9165 3.11 0.0021 Criteria 0.0316 3.09 0.0022
Faculty Writing Guidelines
0.2599 3.78 0.0002
Short Writing Guidelines
-0.1786 -0.42 0.6570
Sample Paper 0.0958 0.44 0.6570
The results for this regression are shown in Table 6. The value for R2 indicates that the variables on the right hand side of equation (2) explain about 21% of the variation in the mark for Assignment 1 and the F-statistic indicates that the null hypothesis of a zero underlying R2 can be rejected at the 1% confidence level.1 The relatively low value of R2, however, suggests either poor model specification or that some important explanatory variables have been omitted. Candidates for omitted variables would include some indication of non-English language backgrounds and it would be desirable to include a better measure of general ability than the grade for the mid-term.2
1 Fcritical (7, 237) at the 1% level = 2.73.
2 Becker (1997, p.1363) summarises the results from studies which suggest that “the only consistently significant and meaningful explanatory variables of post-TUCE
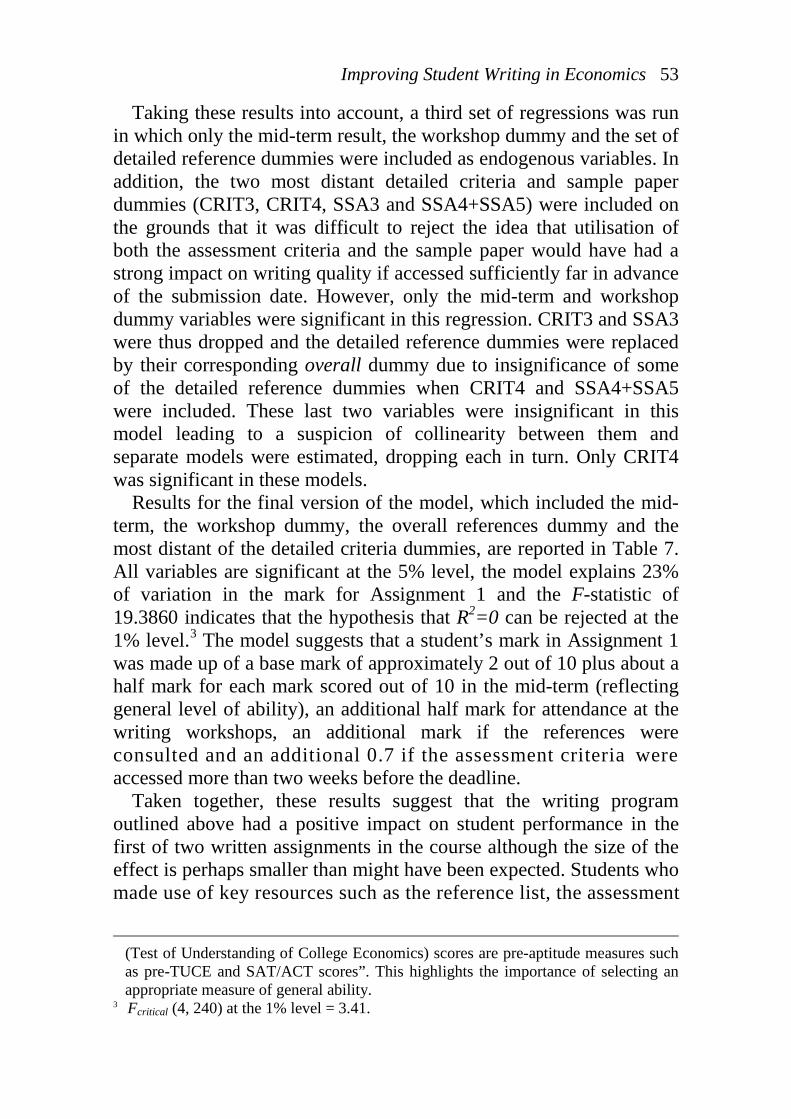
Improving Student Writing in Economics 53
Taking these results into account, a third set of regressions was run in which only the mid-term result, the workshop dummy and the set of detailed reference dummies were included as endogenous variables. In addition, the two most distant detailed criteria and sample paper dummies (CRIT3, CRIT4, SSA3 and SSA4+SSA5) were included on the grounds that it was difficult to reject the idea that utilisation of both the assessment criteria and the sample paper would have had a strong impact on writing quality if accessed sufficiently far in advance of the submission date. However, only the mid-term and workshop dummy variables were significant in this regression. CRIT3 and SSA3 were thus dropped and the detailed reference dummies were replaced by their corresponding overall dummy due to insignificance of some of the detailed reference dummies when CRIT4 and SSA4+SSA5 were included. These last two variables were insignificant in this model leading to a suspicion of collinearity between them and separate models were estimated, dropping each in turn. Only CRIT4 was significant in these models.
Results for the final version of the model, which included the mid-term, the workshop dummy, the overall references dummy and the most distant of the detailed criteria dummies, are reported in Table 7. All variables are significant at the 5% level, the model explains 23% of variation in the mark for Assignment 1 and the F-statistic of 19.3860 indicates that the hypothesis that R2=0 can be rejected at the 1% level.3
accessed more than two weeks before the deadline.
The model suggests that a student’s mark in Assignment 1 was made up of a base mark of approximately 2 out of 10 plus about a half mark for each mark scored out of 10 in the mid-term (reflecting general level of ability), an additional half mark for attendance at the writing workshops, an additional mark if the references were consulted and an additional 0.7 if the assessment criteria were
Taken together, these results suggest that the writing program outlined above had a positive impact on student performance in the first of two written assignments in the course although the size of the effect is perhaps smaller than might have been expected. Students who made use of key resources such as the reference list, the assessment
(Test of Understanding of College Economics) scores are pre-aptitude measures such as pre-TUCE and SAT/ACT scores”. This highlights the importance of selecting an appropriate measure of general ability.
3 Fcritical (4, 240) at the 1% level = 3.41.
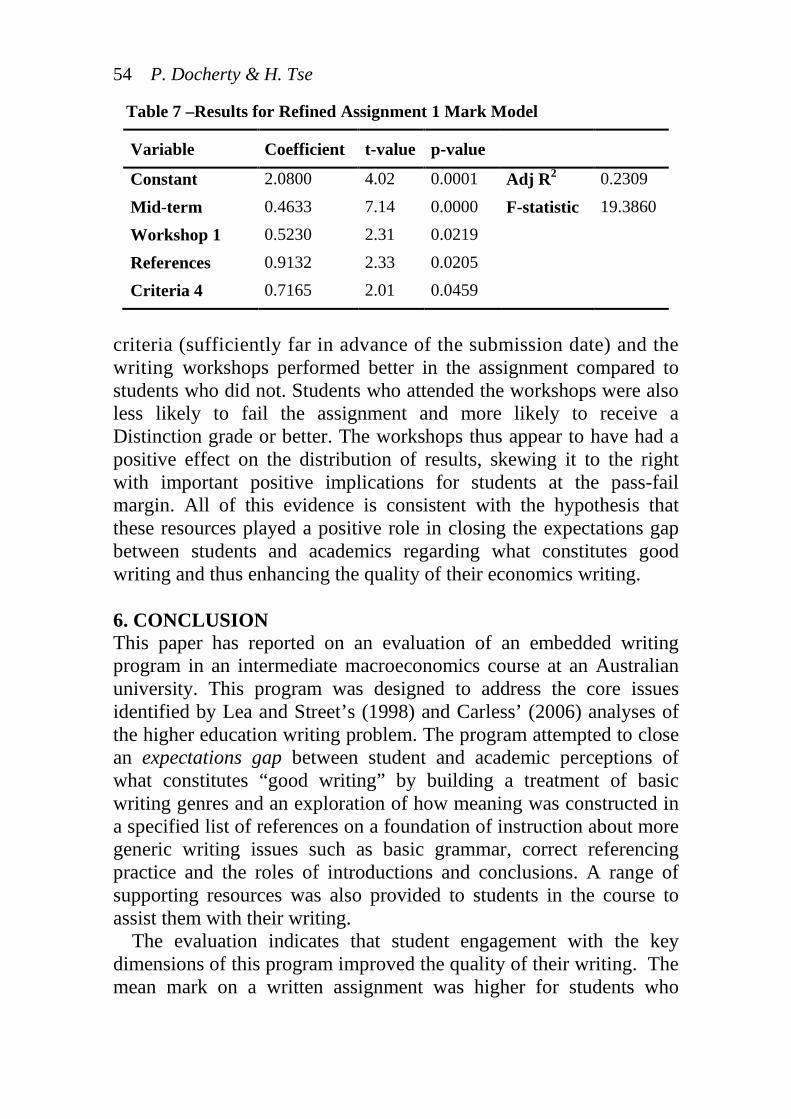
54 P. Docherty & H. Tse
Table 7 –Results for Refined Assignment 1 Mark Model
Variable Coefficient t-value p-value
Constant 2.0800 4.02 0.0001 Adj R2 0.2309
Mid-term 0.4633 7.14 0.0000 F-statistic 19.3860 Workshop 1 0.5230 2.31 0.0219
References 0.9132 2.33 0.0205 Criteria 4 0.7165 2.01 0.0459
criteria (sufficiently far in advance of the submission date) and the writing workshops performed better in the assignment compared to students who did not. Students who attended the workshops were also less likely to fail the assignment and more likely to receive a Distinction grade or better. The workshops thus appear to have had a positive effect on the distribution of results, skewing it to the right with important positive implications for students at the pass-fail margin. All of this evidence is consistent with the hypothesis that these resources played a positive role in closing the expectations gap between students and academics regarding what constitutes good writing and thus enhancing the quality of their economics writing. 6. CONCLUSION This paper has reported on an evaluation of an embedded writing program in an intermediate macroeconomics course at an Australian university. This program was designed to address the core issues identified by Lea and Street’s (1998) and Carless’ (2006) analyses of the higher education writing problem. The program attempted to close an expectations gap between student and academic perceptions of what constitutes “good writing” by building a treatment of basic writing genres and an exploration of how meaning was constructed in a specified list of references on a foundation of instruction about more generic writing issues such as basic grammar, correct referencing practice and the roles of introductions and conclusions. A range of supporting resources was also provided to students in the course to assist them with their writing.
The evaluation indicates that student engagement with the key dimensions of this program improved the quality of their writing. The mean mark on a written assignment was higher for students who
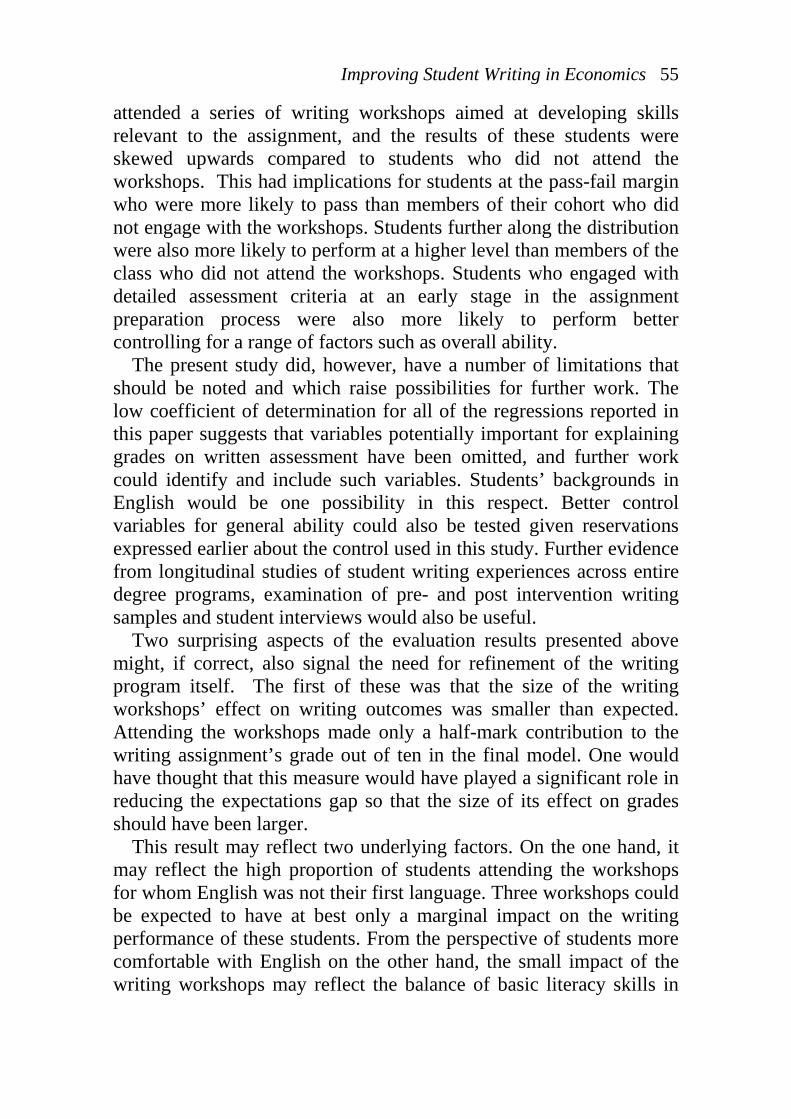
Improving Student Writing in Economics 55
attended a series of writing workshops aimed at developing skills relevant to the assignment, and the results of these students were skewed upwards compared to students who did not attend the workshops. This had implications for students at the pass-fail margin who were more likely to pass than members of their cohort who did not engage with the workshops. Students further along the distribution were also more likely to perform at a higher level than members of the class who did not attend the workshops. Students who engaged with detailed assessment criteria at an early stage in the assignment preparation process were also more likely to perform better controlling for a range of factors such as overall ability.
The present study did, however, have a number of limitations that should be noted and which raise possibilities for further work. The low coefficient of determination for all of the regressions reported in this paper suggests that variables potentially important for explaining grades on written assessment have been omitted, and further work could identify and include such variables. Students’ backgrounds in English would be one possibility in this respect. Better control variables for general ability could also be tested given reservations expressed earlier about the control used in this study. Further evidence from longitudinal studies of student writing experiences across entire degree programs, examination of pre- and post intervention writing samples and student interviews would also be useful.
Two surprising aspects of the evaluation results presented above might, if correct, also signal the need for refinement of the writing program itself. The first of these was that the size of the writing workshops’ effect on writing outcomes was smaller than expected. Attending the workshops made only a half-mark contribution to the writing assignment’s grade out of ten in the final model. One would have thought that this measure would have played a significant role in reducing the expectations gap so that the size of its effect on grades should have been larger.
This result may reflect two underlying factors. On the one hand, it may reflect the high proportion of students attending the workshops for whom English was not their first language. Three workshops could be expected to have at best only a marginal impact on the writing performance of these students. From the perspective of students more comfortable with English on the other hand, the small impact of the writing workshops may reflect the balance of basic literacy skills in
56 P. Docherty & H. Tse
the workshop curriculum compared to more discipline-specific epistemological training discussed by Lea and Street (1998). This balance may have been set too far in the direction of the former for students with greater English competency. Together these factors suggest that in future a differentiated intervention for students with English and non-English backgrounds should be considered. This could include an even stronger emphasis on the epistemological dimensions of writing in economics for students from both types of background but a more extended curriculum for students with non-English backgrounds that approached these epistemological dimensions with additional attention to lexico-grammatical and other language instruction that would also strengthen their general command of English.
The second surprising result was that student use of the annotated sample assignment appears to have made virtually no contribution to writing performance. This was despite the fact that this resource represented a concrete example of how the assessment criteria could be reflected in a piece of actual writing. This outcome may have derived from too little explicit discussion of the sample paper in the workshops themselves and this paper may need to be brought more explicitly into the curriculum in future to increase its effectiveness.
Even taking the above limitations into consideration, the overall results of this quantitative evaluation suggest that the provision of writing resources and embedded writing instruction has the potential to noticeably improve student writing outcomes. Qualified support for the academic literacies perspective is also provided since the program evaluated in this paper was designed with this perspective firmly in mind. Further work of the type suggested above is, however, strongly encouraged to provide further validation of these conclusions. REFERENCES Becker, W.E. (1997) “Teaching Economics to Undergraduates”, Journal of
Economic Literature, 35, pp.1347-1373. Blaug, M. (1980) The Methodology of Economics, Cambridge: Cambridge
University Press. Bloxham, S. and West, A. (2007) “Learning to Write in Higher Education:
Students’ Perceptions of an Intervention in Developing Understanding of Assessment Criteria”, Teaching in Higher Education, 12(1), pp.77-89.
Improving Student Writing in Economics 57
Caldwell, B.J. (1982) Beyond Positivism: Economic Methodology in the Twentieth Century, London: Allen & Unwin.
Carless, D. (2006) “Differing Perceptions in the Feedback Process”, Studies in Higher Education, 31(2), pp.219-233.
Cohen, A.J. and Spencer, J. (1993) “Using Writing Across the Curriculum in Economics: Is Taking the Plunge Worth It?”, Journal of Economic Education, 24(3), pp.219-230.
Davies, S., Swinburne, D. and Williams, G. (eds.) (2006) Writing Matters: The Royal Literary Fund Report on Student Writing in Higher Education London: The Royal Literary Fund.
Docherty, P., Tse, H., Foreman, R. and McKenzie, J. (forthcoming), “Extending the Principles of Intensive Writing to Large Macroeconomics Classes”, Journal of Economic Education.
Dow, S.C. (1985) Macroeconomic Thought: A Methodological Approach, Oxford: Basil Blackwell.
Ecclestone, K. (2001) “ ‘I Know a 2:1 When I See it’: Understanding Criteria for Degree Classifications in Franchised University Programs”, Journal of Further and Higher Education, 25(3), pp.301-313.
Faculty of Business (2006) Guide to Writing Assignments, Sydney: University of Technology, Sydney.
Hansen, W.L. (1998) “Integrating the Practice of Writing into Economics Education Instruction”, in Becker, W.E. and Watts, M. (eds.), Teaching Economics to Undergraduates: Alternatives to Chalk and Talk, Cheltenham, UK & Northampton MA, USA: Edward Elgar, pp.79-118.
Koutsantoni, D. (2007) Developing Academic Literacies: Understanding Disciplinary Communities, Culture and Rhetoric, Bern: European Academic Publishers.
Lea, M.R. and Street, B.V (1998) “Student Writing in Higher Education: An Academic Literacies Approach”, Studies in Higher Education, 23(2), pp.157-172.
Lillis, T. and Turner J. (2001) “Student Writing in Higher Education: Contemporary Confusion, Traditional Concerns”, Teaching in Higher Education, 6(1), pp.57-68.
McCloskey, D.N. (1983) “The Rhetoric of Economics”, Journal of Economic Literature, 21, pp.481-517.
Northedge, A. (2003) “Enabling Participation in Academic Discourse”, Teaching in Higher Education, 8(2), pp.169-180.
O’Donovan, B., Price, M. and Rust, C. (2004) “Know What I Mean? Enhancing Student Understanding of Assessment Standards and Criteria”, Teaching in Higher Education, 9(3), pp.325-335.
58 P. Docherty & H. Tse
Price, M. (2005) “Assessment Standards: The Role of Communities of Practice and the Scholarship of Assessment”, Assessment and Evaluation in Higher Education, 30(3), pp.215-230.
Rust, C., Price, M. and O’Donovan, B. (2003) “Improving Students’ Learning by Developing their Understanding of Assessment Criteria and Processes”, Assessment & Evaluation in Higher Education, 28(2), pp.147-164.
Sadler, R. (2005) “Interpretations of Criteria-based Assessment and Grading in Higher Education”, Assessment and Evaluation in Higher Education, 30(2), pp.175-194.
Saltmarsh, D. and Saltmarsh, S. (2008) “Has Anyone Read the Reading? Using Assessment to Promote Academic Literacies and Learning Cultures”, Teaching in Higher Education, 1(6), pp.621-632.
Simpson, M.S. and Carroll, S.E (1999) “Assignments for a Writing-Intensive Economics Course”, Journal of Economic Education, 30(4), pp.402-410.
Somerville, E.M. and Creme, P. (2005) “ ‘Asking Pompeii Questions’: A Co-operative Approach to Writing in the Disciplines”, Teaching in Higher Education, 10(1), pp.17-28.
Walstad,W.B. (2001) “Improving Assessment in University Economics”, Journal of Economic Education, 32(3), pp.281-294.