Embed Size (px)
Citation preview

Australian Life Tables
2005-07

© Commonwealth of Australia 2009
ISBN 978-0-642-74561-3
This work is copyright. Apart from any use as permitted under the Copyright Act 1968, no part may be reproduced by any process without prior written permission from the Commonwealth available from the Australian Government Actuary. Requests and inquiries concerning reproduction and rights should be addressed to:
Australian Government Actuary Department of the Treasury Treasury Building Langton Crescent CANBERRA ACT 2601 Or by email to: [email protected]
Printed by CanPrint Communications Pty Ltd
iii
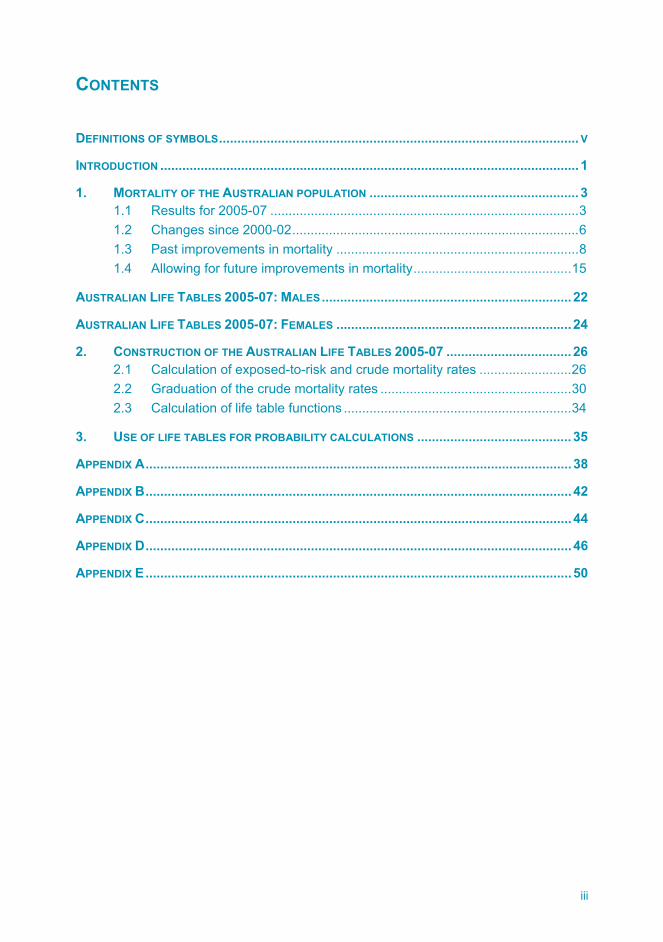
CONTENTS
DEFINITIONS OF SYMBOLS.................................................................................................. V
INTRODUCTION .................................................................................................................. 1
1. MORTALITY OF THE AUSTRALIAN POPULATION ......................................................... 3 1.1 Results for 2005-07 ....................................................................................3 1.2 Changes since 2000-02..............................................................................6 1.3 Past improvements in mortality ..................................................................8 1.4 Allowing for future improvements in mortality...........................................15
AUSTRALIAN LIFE TABLES 2005-07: MALES....................................................................22
AUSTRALIAN LIFE TABLES 2005-07: FEMALES ................................................................24
2. CONSTRUCTION OF THE AUSTRALIAN LIFE TABLES 2005-07 ..................................26 2.1 Calculation of exposed-to-risk and crude mortality rates .........................26 2.2 Graduation of the crude mortality rates ....................................................30 2.3 Calculation of life table functions ..............................................................34
3. USE OF LIFE TABLES FOR PROBABILITY CALCULATIONS ..........................................35
APPENDIX A....................................................................................................................38
APPENDIX B....................................................................................................................42
APPENDIX C....................................................................................................................44
APPENDIX D....................................................................................................................46
APPENDIX E ....................................................................................................................50
iv
LIST OF FIGURES
FIGURE 1: MORTALITY RATES 2005-07........................................................................... 3
FIGURE 2: RATIO OF MALE TO FEMALE MORTALITY RATES 2005-07.................................. 5
FIGURE 3: MORTALITY RATES 2000-02 AND 2005-07...................................................... 6
FIGURE 4: PERCENTAGE IMPROVEMENT IN MORTALITY SINCE 2000-02............................. 7
FIGURE 5: RATIO OF MALE TO FEMALE MORTALITY RATES — AGES 20 TO 100 2000-02 AND 2005-07 .................................................................................. 8
FIGURE 6: IMPROVEMENTS IN MORTALITY AT SELECTED AGES.......................................... 9
FIGURE 7: TOTAL LIFE EXPECTANCY AT SELECTED AGES ...............................................12
FIGURE 8: GENDER DIFFERENTIALS IN LIFE EXPECTANCY AT SELECTED AGES .................13
FIGURE 9: SMOOTHED MORTALITY RATES FROM 1881-90 TO THE PRESENT AGES 10 TO 40............................................................................................14
FIGURE 10: HISTORICAL MORTALITY IMPROVEMENT FACTORS DERIVED FROM THE AUSTRALIAN LIFE TABLES ...........................................................................16
FIGURE 11: ACTUAL AND PROJECTED PERIOD LIFE EXPECTANCY AT BIRTH — 1966 TO 2056 .............................................................................................18
FIGURE 12: COHORT LIFE EXPECTANCIES BY CURRENT AGE.............................................20
FIGURE 13: COMPARISON OF CENSUS POPULATION COUNT AND EXPOSED-TO-RISK..........29
FIGURE 14: CRUDE CENTRAL MORTALITY RATES .............................................................31
v
DEFINITIONS OF SYMBOLS
Australian Life Tables 2005-07 sets out the following functions:
xl = the number of persons surviving to exact age x out of 100,000 births
xd = the number of deaths in the year of age x to (x + 1) among the xl persons who are alive at the beginning of that year
xp = the probability of a person aged exactly x surviving the year to age (x + 1)
xq = the probability of a person aged exactly x dying before reaching age (x + 1)
μx = the force (or instantaneous rate) of mortality at exact age x
oxe = the complete expectation of life (that is, the average number of years
lived after age x ) of persons aged exactly x
xL = the total number of years of life experienced between age x and (x + 1) by xl persons aged exactly x
xT = the total number of years of life experienced after age x by xl persons aged exactly x
NOTE: Figures in the Tables are rounded and hence the usual identities between these functions may not be satisfied exactly.


1
INTRODUCTION
This publication presents the Australian Life Tables 2005-07 (the Tables), which are based on the mortality of Australians over the three year period centred on the 2006 Census of Population and Housing (the Census).
This publication discusses the major features of the 2005-07 Life Tables with particular reference to the previous Australian Life Tables. Mortality improvement factors have been calculated based on the improvements observed over the past 25 and 100 years. The impact of mortality improvement on life expectancies is explored in the context of these two scenarios.
This discussion is followed by the Tables themselves, together with the technical notes on their construction. The appendices include supporting information referred to in the text.
The Tables are also available on the AGA website (www.aga.gov.au/publications) together with past mortality rates and life expectancies and the mortality improvement factors referred to in the body of the report.
This is the seventeenth in the series of official Australian Life Tables. Tables for the years 1881-90, 1891-1900, 1901-10, 1920-22 and 1932-34 were prepared by the Commonwealth Statistician. The first three Tables took into account deaths over a ten year period and each Table incorporated information from two censuses. All subsequent Tables have been based on deaths and estimates of population over a period of three years centred on a Census. The Tables for the years 1946-48 and 1953-55 were prepared by the Commonwealth Actuary. Tables since 1960-62 have been produced quinquennially by the Australian Government Actuary (under the former title of Commonwealth Actuary in the case of the earlier tables).
P. Martin FIAA
Australian Government Actuary
November 2009

3
1. MORTALITY OF THE AUSTRALIAN POPULATION
1.1 Results for 2005-07
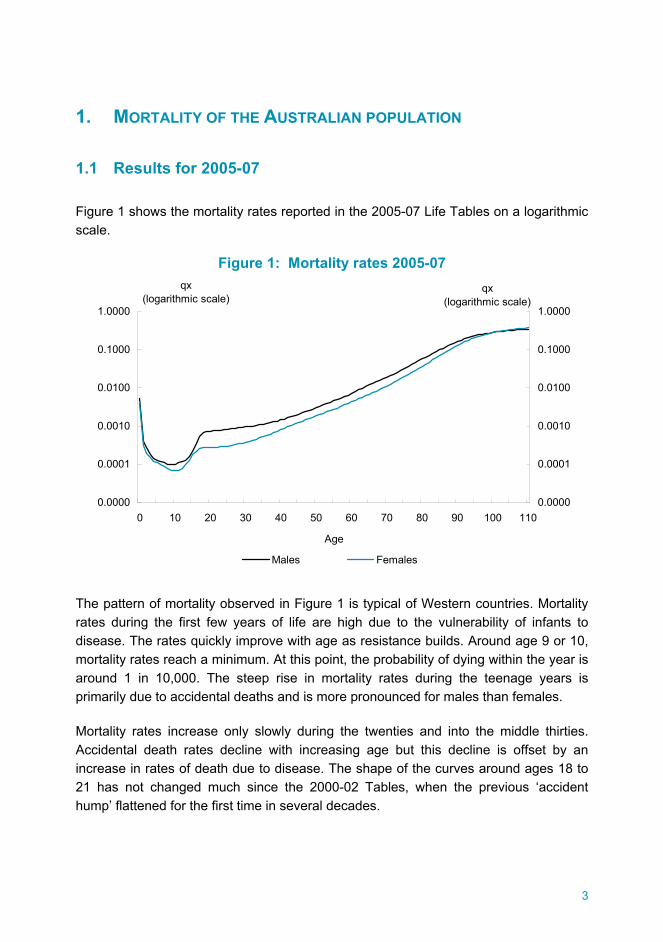
Figure 1 shows the mortality rates reported in the 2005-07 Life Tables on a logarithmic scale.
Figure 1: Mortality rates 2005-07
0.0000
0.0001
0.0010
0.0100
0.1000
1.0000
0 10 20 30 40 50 60 70 80 90 100 110
Age
0.0000
0.0001
0.0010
0.0100
0.1000
1.0000
Males Females
qx(logarithmic scale)
qx(logarithmic scale)
The pattern of mortality observed in Figure 1 is typical of Western countries. Mortality rates during the first few years of life are high due to the vulnerability of infants to disease. The rates quickly improve with age as resistance builds. Around age 9 or 10, mortality rates reach a minimum. At this point, the probability of dying within the year is around 1 in 10,000. The steep rise in mortality rates during the teenage years is primarily due to accidental deaths and is more pronounced for males than females.
Mortality rates increase only slowly during the twenties and into the middle thirties. Accidental death rates decline with increasing age but this decline is offset by an increase in rates of death due to disease. The shape of the curves around ages 18 to 21 has not changed much since the 2000-02 Tables, when the previous ‘accident hump’ flattened for the first time in several decades.
4
It can be argued that the underlying mortality process arising from normal biological ageing can be approximately represented by an exponential function (that is, a plot of mortality rates will appear as a straight line on a logarithmic scale). By fitting such a function between the point of minimum mortality to the point where the observed mortality is roughly exponential (age 47 for males and age 34 for females in the current Tables), it is possible to calculate the ‘excess mortality’ due to abnormal factors over the twenties and thirties. The 2005-07 Tables suggest that the ‘excess mortality’ over these years is of the order of 1,300 deaths per annum for males and 200 deaths per annum for females based on the population profile for the three years covered by the Tables. For males in particular, this is a significant reduction from the comparable figure of 1,800 reported in the 2000-02 Tables
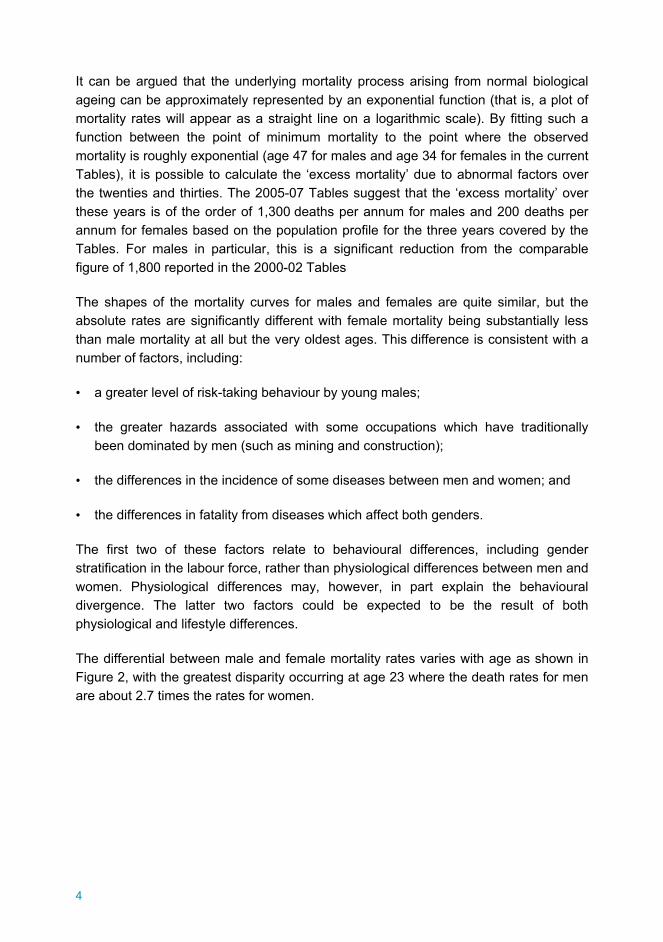
The shapes of the mortality curves for males and females are quite similar, but the absolute rates are significantly different with female mortality being substantially less than male mortality at all but the very oldest ages. This difference is consistent with a number of factors, including:
• a greater level of risk-taking behaviour by young males;
• the greater hazards associated with some occupations which have traditionally been dominated by men (such as mining and construction);
• the differences in the incidence of some diseases between men and women; and
• the differences in fatality from diseases which affect both genders.
The first two of these factors relate to behavioural differences, including gender stratification in the labour force, rather than physiological differences between men and women. Physiological differences may, however, in part explain the behavioural divergence. The latter two factors could be expected to be the result of both physiological and lifestyle differences.
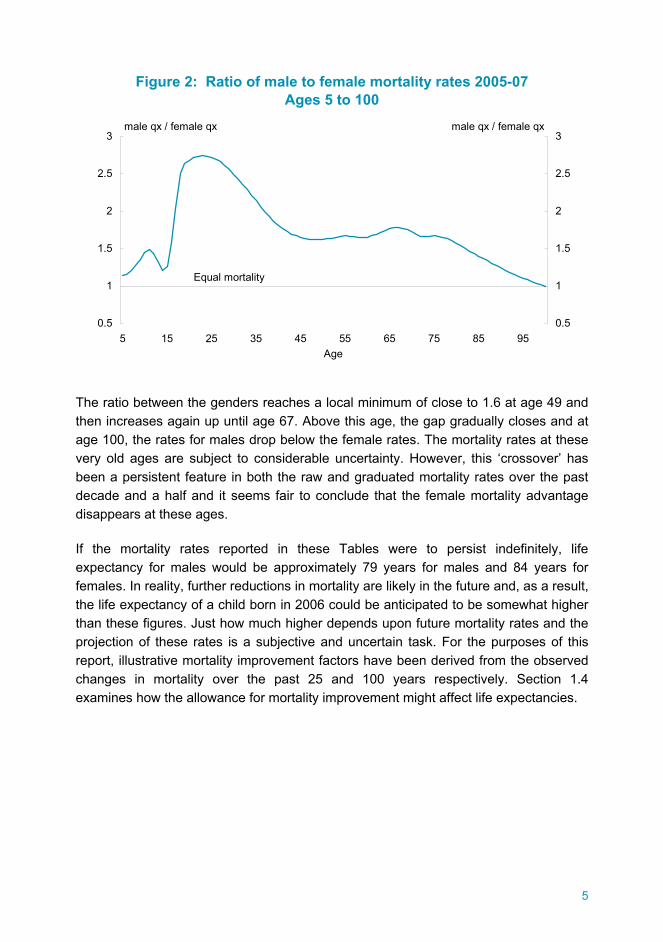
The differential between male and female mortality rates varies with age as shown in Figure 2, with the greatest disparity occurring at age 23 where the death rates for men are about 2.7 times the rates for women.
5
Figure 2: Ratio of male to female mortality rates 2005-07 Ages 5 to 100
0.5
1
1.5
2
2.5
3
5 15 25 35 45 55 65 75 85 95Age
0.5
1
1.5
2
2.5
3male qx / female qx male qx / female qx
Equal mortality
The ratio between the genders reaches a local minimum of close to 1.6 at age 49 and then increases again up until age 67. Above this age, the gap gradually closes and at age 100, the rates for males drop below the female rates. The mortality rates at these very old ages are subject to considerable uncertainty. However, this ‘crossover’ has been a persistent feature in both the raw and graduated mortality rates over the past decade and a half and it seems fair to conclude that the female mortality advantage disappears at these ages.
If the mortality rates reported in these Tables were to persist indefinitely, life expectancy for males would be approximately 79 years for males and 84 years for females. In reality, further reductions in mortality are likely in the future and, as a result, the life expectancy of a child born in 2006 could be anticipated to be somewhat higher than these figures. Just how much higher depends upon future mortality rates and the projection of these rates is a subjective and uncertain task. For the purposes of this report, illustrative mortality improvement factors have been derived from the observed changes in mortality over the past 25 and 100 years respectively. Section 1.4 examines how the allowance for mortality improvement might affect life expectancies.
6
1.2 Changes since 2000-02
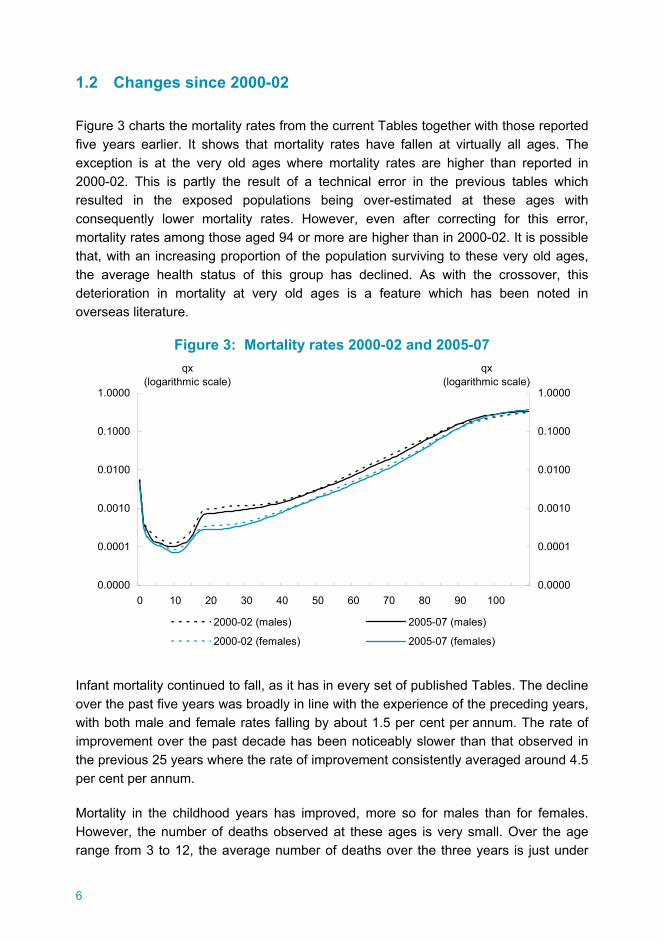
Figure 3 charts the mortality rates from the current Tables together with those reported five years earlier. It shows that mortality rates have fallen at virtually all ages. The exception is at the very old ages where mortality rates are higher than reported in 2000-02. This is partly the result of a technical error in the previous tables which resulted in the exposed populations being over-estimated at these ages with consequently lower mortality rates. However, even after correcting for this error, mortality rates among those aged 94 or more are higher than in 2000-02. It is possible that, with an increasing proportion of the population surviving to these very old ages, the average health status of this group has declined. As with the crossover, this deterioration in mortality at very old ages is a feature which has been noted in overseas literature.
Figure 3: Mortality rates 2000-02 and 2005-07
0.0000
0.0001
0.0010
0.0100
0.1000
1.0000
0 10 20 30 40 50 60 70 80 90 100
qx (logarithmic scale)
0.0000
0.0001
0.0010
0.0100
0.1000
1.0000
qx (logarithmic scale)
2000-02 (males) 2005-07 (males)
2000-02 (females) 2005-07 (females)
Infant mortality continued to fall, as it has in every set of published Tables. The decline over the past five years was broadly in line with the experience of the preceding years, with both male and female rates falling by about 1.5 per cent per annum. The rate of improvement over the past decade has been noticeably slower than that observed in the previous 25 years where the rate of improvement consistently averaged around 4.5 per cent per annum.
Mortality in the childhood years has improved, more so for males than for females. However, the number of deaths observed at these ages is very small. Over the age range from 3 to 12, the average number of deaths over the three years is just under
7
50 for males and fewer than 40 for females. This increases the risk that the shape of the smoothed mortality curve will be unduly affected by random variation in the number of deaths reported. As described in section 2.2, we modified the graduation process for the current Tables to address this issue. The modification reduced the variation in improvement at individual ages, but it is still the age range with the greatest volatility. In these circumstances, limited significance should be attached to the changes in mortality at individual ages.
Male mortality has fallen over the teenage and young adult ages, most notably for those in their mid twenties. Two to three decades ago, there was a clear peak in male mortality around age twenty, with mortality rates roughly comparable to those applying to males twenty years older. This phenomenon was known as the accident hump. While rates still increase substantially over the later teenage years, the more rapid improvement in male mortality for those in their early twenties means there is no longer a local maximum. The improvement in male rates was greater than for females for all but a couple of ages in this cohort. This is, however, the age group with the greatest disparity between male and female rates and, as illustrated in Figure 2, the gap remains significant.
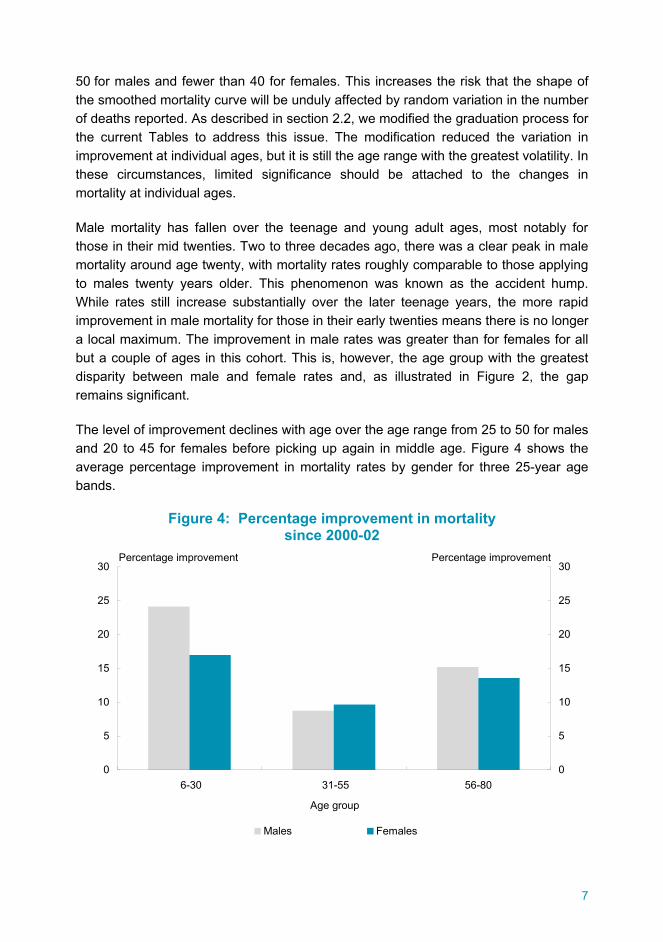
The level of improvement declines with age over the age range from 25 to 50 for males and 20 to 45 for females before picking up again in middle age. Figure 4 shows the average percentage improvement in mortality rates by gender for three 25-year age bands.
Figure 4: Percentage improvement in mortality since 2000-02
0
5
10
15
20
25
30
6-30 31-55 56-80
Age group
0
5
10
15
20
25
30
Males Females
Percentage improvement Percentage improvement
8
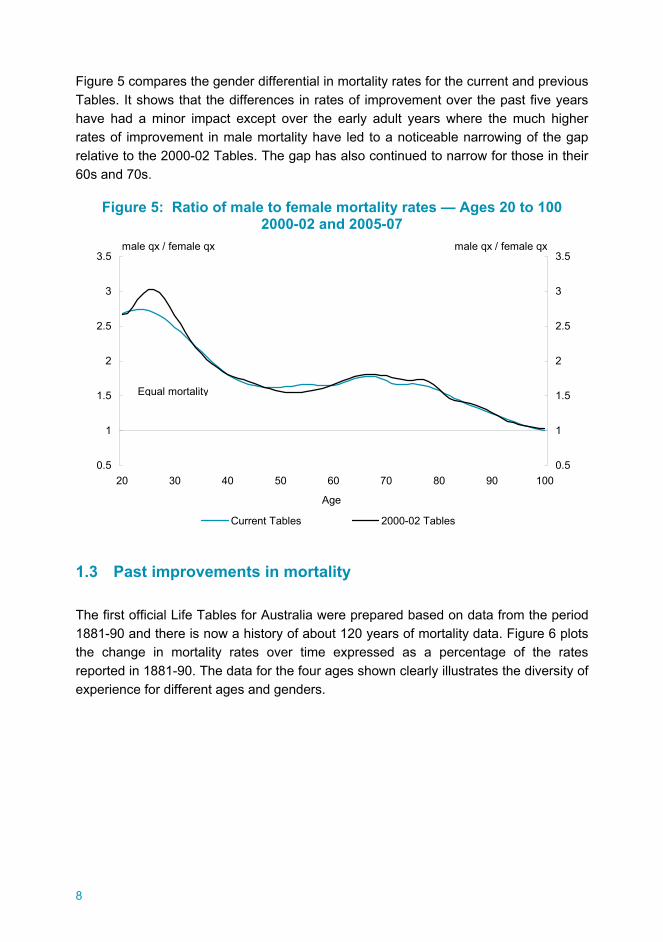
Figure 5 compares the gender differential in mortality rates for the current and previous Tables. It shows that the differences in rates of improvement over the past five years have had a minor impact except over the early adult years where the much higher rates of improvement in male mortality have led to a noticeable narrowing of the gap relative to the 2000-02 Tables. The gap has also continued to narrow for those in their 60s and 70s.
Figure 5: Ratio of male to female mortality rates — Ages 20 to 100 2000-02 and 2005-07
0.5
1
1.5
2
2.5
3
3.5
20 30 40 50 60 70 80 90 100
Age
0.5
1
1.5
2
2.5
3
3.5
Current Tables 2000-02 Tables
Equal mortality
male qx / female qx male qx / female qx
1.3 Past improvements in mortality
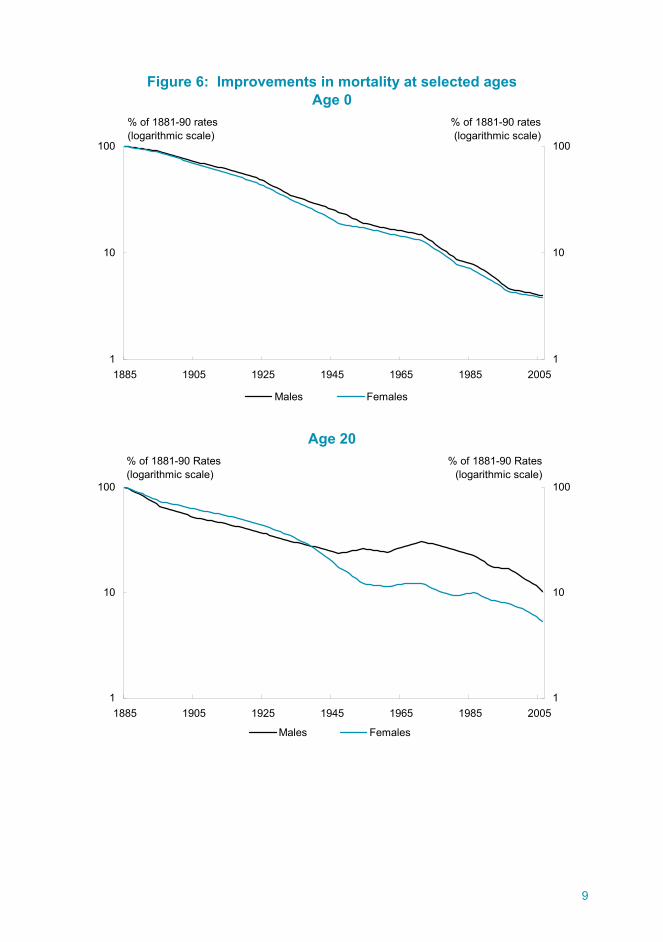
The first official Life Tables for Australia were prepared based on data from the period 1881-90 and there is now a history of about 120 years of mortality data. Figure 6 plots the change in mortality rates over time expressed as a percentage of the rates reported in 1881-90. The data for the four ages shown clearly illustrates the diversity of experience for different ages and genders.
9
Figure 6: Improvements in mortality at selected ages Age 0
1
10
100
1885 1905 1925 1945 1965 1985 20051
10
100
Males Females
% of 1881-90 rates(logarithmic scale)
% of 1881-90 rates(logarithmic scale)
Age 20
1
10
100
1885 1905 1925 1945 1965 1985 20051
10
100
Males Females
% of 1881-90 Rates(logarithmic scale)
% of 1881-90 Rates(logarithmic scale)
10
Figure 6: Improvements in mortality at selected ages (continued) Age 35
1
10
100
1885 1905 1925 1945 1965 1985 20051
10
100
Males Females
% of 1881-90 rates(logarithmic scale)
% of 1881-90 rates(logarithmic scale)
Age 65
1
10
100
1885 1905 1925 1945 1965 1985 20051
10
100
Males Females
% of 1881-90 rates(logarithmic scale)
% of 1881-90 rates(logarithmic scale)
11
Infant mortality has shown a sustained and substantial improvement over the entire period, with the improvement for males and females moving closely in parallel. The rates for both males and females are now less than 4 per cent of their level in 1881-90 and still do not appear to have reached an underlying minimum rate. The rate of improvement has, however, slowed somewhat over the last decade, particularly relative to the preceding two and a half decades.
The picture at age 20 is quite different, with male rates initially improving more quickly than female rates but then deteriorating from about 1945 to 1970 before starting to decline again as the accident hump emerged, subsided and then disappeared. For females at this age, the biggest improvements occurred from the 1920s to the 1950s and probably reflected improved maternal mortality experience as medical procedures were reformed and became accessible to more of the population. Mortality rates for 20 year old females are about 5 per cent of the corresponding rates from 120 years ago. For males of the same age, the relativity is around 10 per cent.
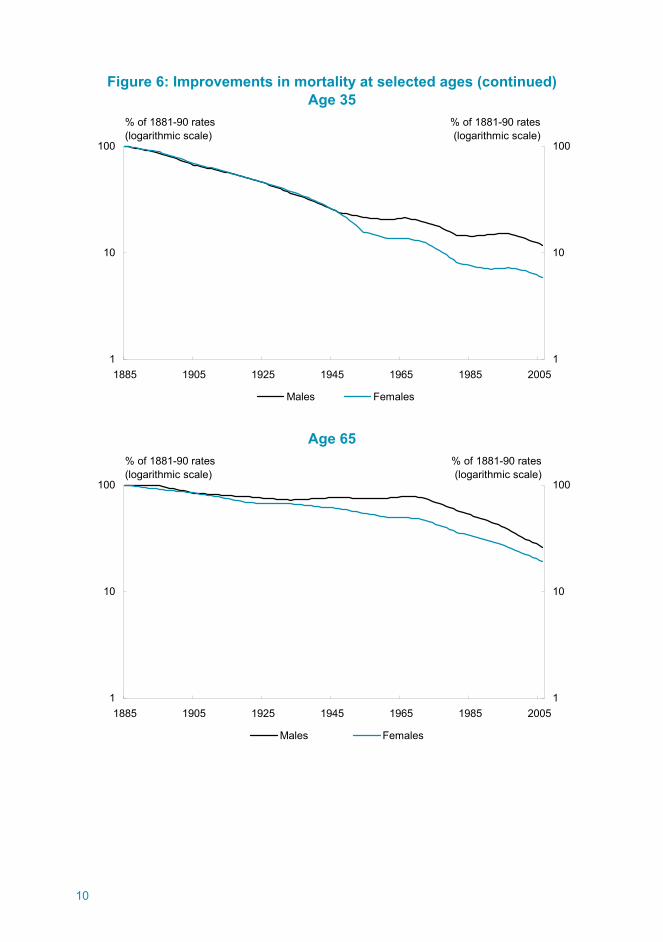
For those in their mid thirties, the improvements for males and females were virtually identical until around 1945. At that point, the rate of improvement for males slowed significantly and in some years reversed, while for females the downward trend continued unabated. Overall, the improvement over the last 120 years is very similar to that for 20 year olds, with male rates being 12 per cent and female rate 6 per cent of the rates reported in 1881-90.
At age 65, the rate of improvement was relatively slow for both males and females until around 1965. This is consistent with the benefits of medical advances up to that time primarily accruing to the young. Since the mid 1960s, however, mortality rates for 65 year olds have more than halved. Male rates for 65 year olds in the 2005-07 Tables are about 33 per cent of the corresponding rates in the mid 1960s, while for females the 2005-07 rates are about 38 per cent of the levels of the mid 1960s.
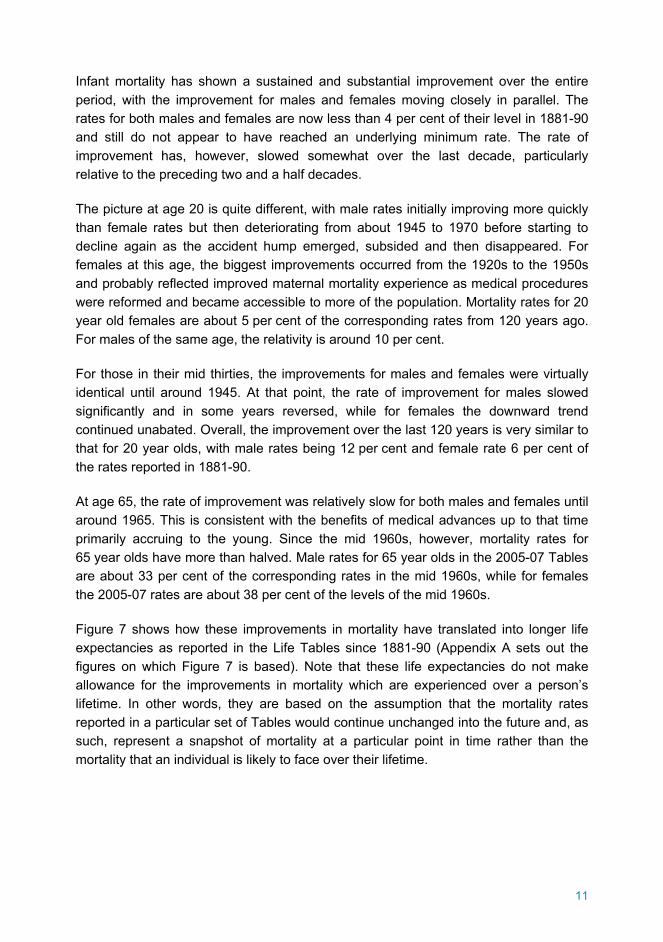
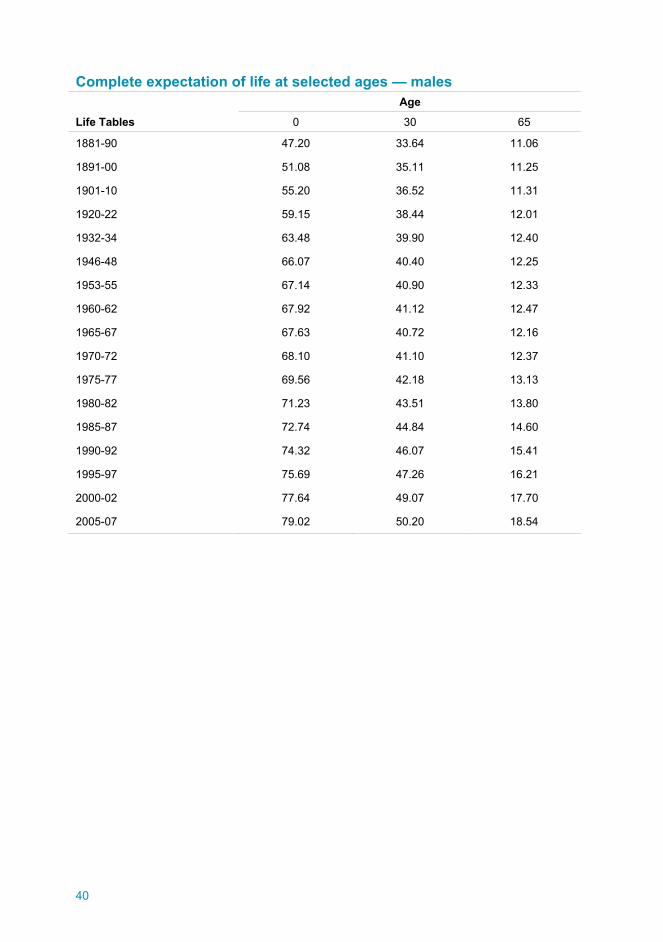
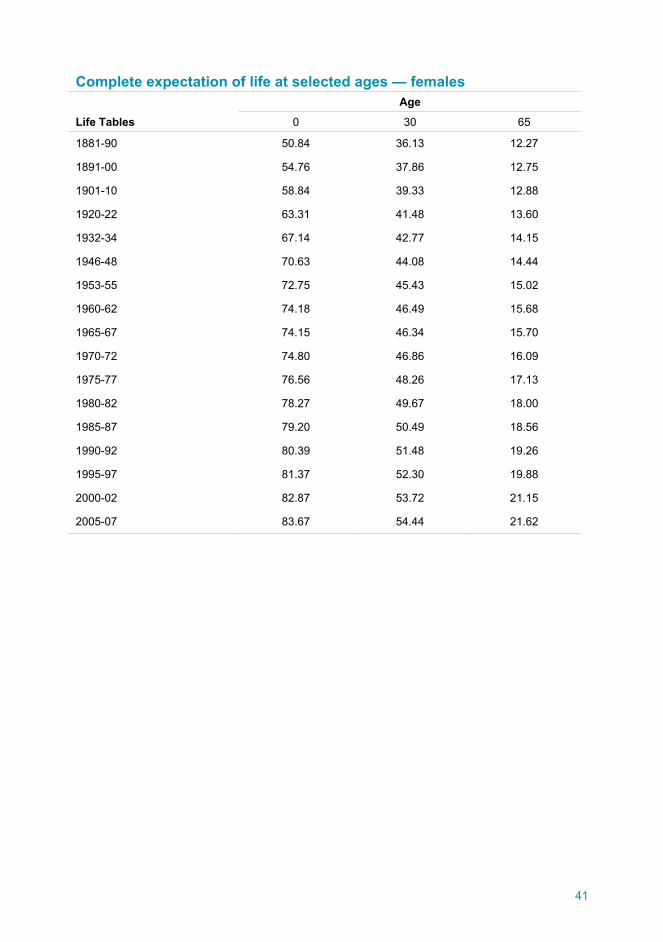
Figure 7 shows how these improvements in mortality have translated into longer life expectancies as reported in the Life Tables since 1881-90 (Appendix A sets out the figures on which Figure 7 is based). Note that these life expectancies do not make allowance for the improvements in mortality which are experienced over a person’s lifetime. In other words, they are based on the assumption that the mortality rates reported in a particular set of Tables would continue unchanged into the future and, as such, represent a snapshot of mortality at a particular point in time rather than the mortality that an individual is likely to face over their lifetime.
12
Figure 7: Total life expectancy at selected ages Males
40
45
50
55
60
65
70
75
80
85
90
1885 1895 1905 1915 1925 1935 1945 1955 1965 1975 1985 1995 2005
Life expectancy
40
45
50
55
60
65
70
75
80
85
90Life expectancy
At age 0 At age 30 At age 65
Females
40
45
50
55
60
65
70
75
80
85
90
1885 1895 1905 1915 1925 1935 1945 1955 1965 1975 1985 1995 2005
Life expectancy
40
45
50
55
60
65
70
75
80
85
90Life expectancy
At age 0 At age 30 At age 65
Reported life expectancy at birth has shown dramatic improvement, increasing by over 30 years for both males and females. The narrowing of the gap between life expectancy at birth and age 30 to around nine months for females and fourteen months for males vividly illustrates just how low mortality rates among infants and children now are. At older ages, the substantial improvements in mortality rates for this
13
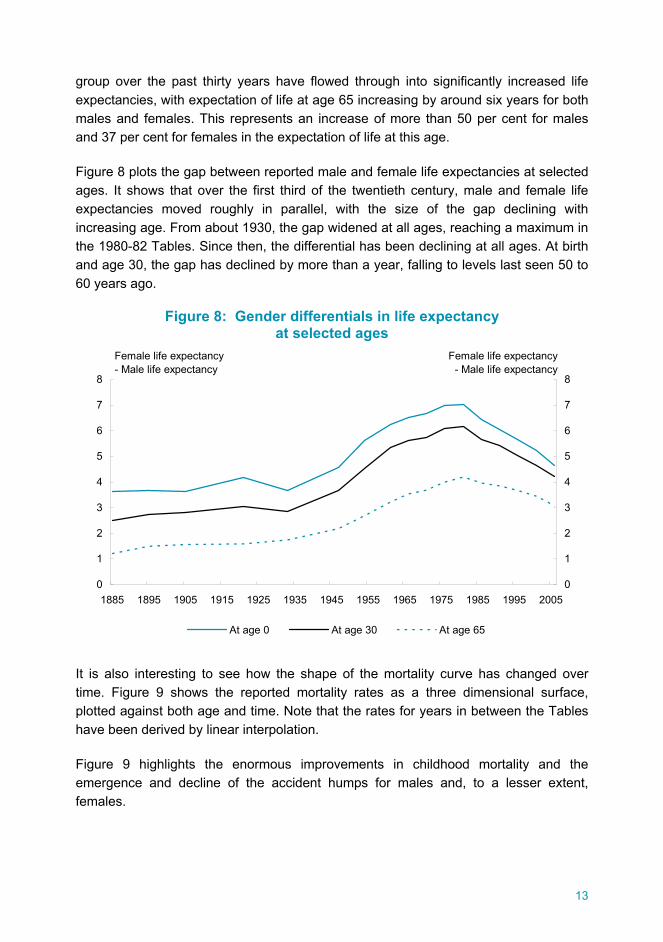
group over the past thirty years have flowed through into significantly increased life expectancies, with expectation of life at age 65 increasing by around six years for both males and females. This represents an increase of more than 50 per cent for males and 37 per cent for females in the expectation of life at this age.
Figure 8 plots the gap between reported male and female life expectancies at selected ages. It shows that over the first third of the twentieth century, male and female life expectancies moved roughly in parallel, with the size of the gap declining with increasing age. From about 1930, the gap widened at all ages, reaching a maximum in the 1980-82 Tables. Since then, the differential has been declining at all ages. At birth and age 30, the gap has declined by more than a year, falling to levels last seen 50 to 60 years ago.
Figure 8: Gender differentials in life expectancy at selected ages
0
1
2
3
4
5
6
7
8
1885 1895 1905 1915 1925 1935 1945 1955 1965 1975 1985 1995 20050
1
2
3
4
5
6
7
8
At age 0 At age 30 At age 65
Female life expectancy- Male life expectancy
Female life expectancy- Male life expectancy
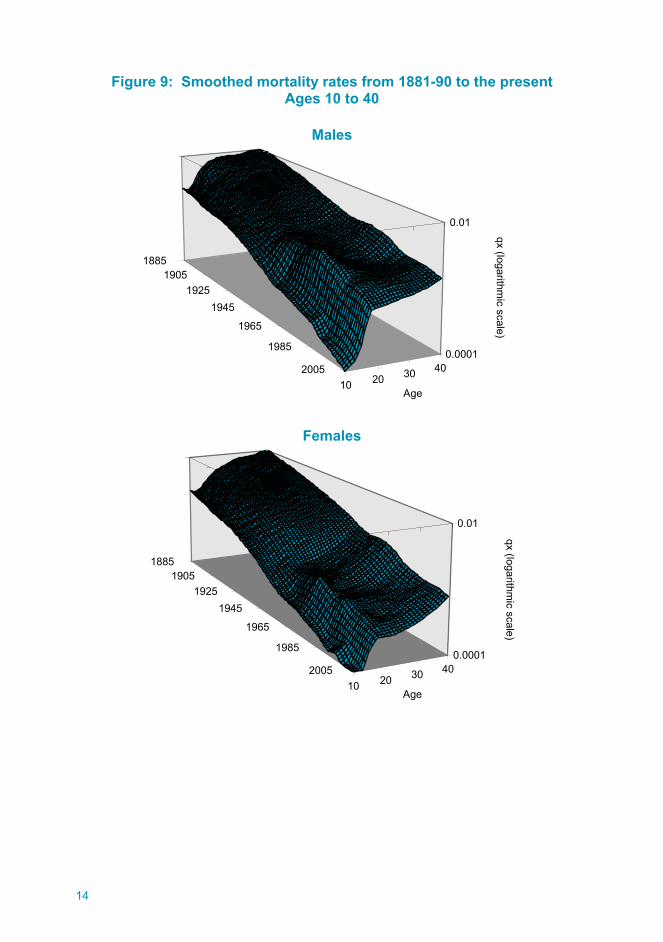
It is also interesting to see how the shape of the mortality curve has changed over time. Figure 9 shows the reported mortality rates as a three dimensional surface, plotted against both age and time. Note that the rates for years in between the Tables have been derived by linear interpolation.
Figure 9 highlights the enormous improvements in childhood mortality and the emergence and decline of the accident humps for males and, to a lesser extent, females.
14
Figure 9: Smoothed mortality rates from 1881-90 to the present Ages 10 to 40
Males
18851905
19251945
1965
1985
200510 20 30 40
0.0001
0.01
qx (logarithmic scale)
Age
Females
18851905
19251945
1965
1985
200510 20 30 40
0.0001
0.01
qx (logarithmic scale)
Age
15
1.4 Allowing for future improvements in mortality
The preceding section underlines the importance of mortality improvement in determining realistic life expectancies. The life expectancy of a boy born in 1886, as reported in the 1881-90 Tables, was 47.2 years, based on the rates in those Tables persisting throughout his life. Applying the rates reported in subsequent tables that would be appropriate given his age and the year, his life expectancy would in practice have been some six years higher. This latter measure of life expectancy is known as cohort life expectancy and requires age and time-specific mortality rates.
The issues associated with attempting to estimate more realistic life expectances by allowing for future mortality improvements were discussed in some detail in the 1995-97 Tables. Those Tables included improvement rates expressed as a yearly percentage change for mortality rates over the preceding 25 and 100 years. The current Tables continue this practice.
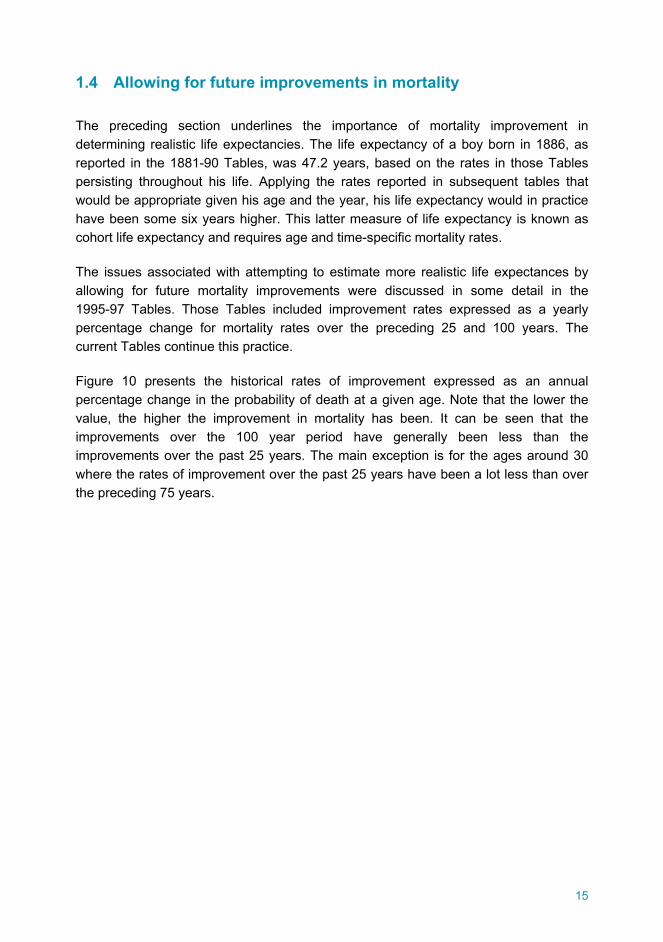
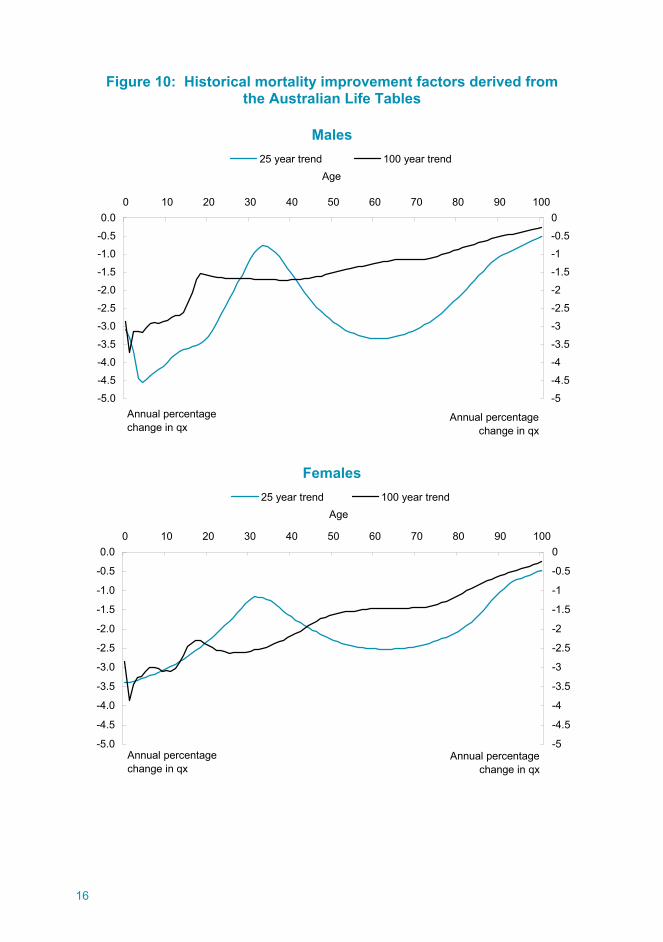
Figure 10 presents the historical rates of improvement expressed as an annual percentage change in the probability of death at a given age. Note that the lower the value, the higher the improvement in mortality has been. It can be seen that the improvements over the 100 year period have generally been less than the improvements over the past 25 years. The main exception is for the ages around 30 where the rates of improvement over the past 25 years have been a lot less than over the preceding 75 years.
16
Figure 10: Historical mortality improvement factors derived from the Australian Life Tables
Males
-5.0
-4.5
-4.0
-3.5
-3.0
-2.5
-2.0
-1.5
-1.0
-0.5
0.00 10 20 30 40 50 60 70 80 90 100
Age
Annual percentage change in qx
-5
-4.5
-4
-3.5
-3
-2.5
-2
-1.5
-1
-0.5
0
Annual percentage change in qx
25 year trend 100 year trend
Females
-5.0
-4.5
-4.0
-3.5
-3.0
-2.5
-2.0
-1.5
-1.0
-0.5
0.00 10 20 30 40 50 60 70 80 90 100
Age
Annual percentage change in qx
-5
-4.5
-4
-3.5
-3
-2.5
-2
-1.5
-1
-0.5
0
Annual percentage change in qx
25 year trend 100 year trend
17
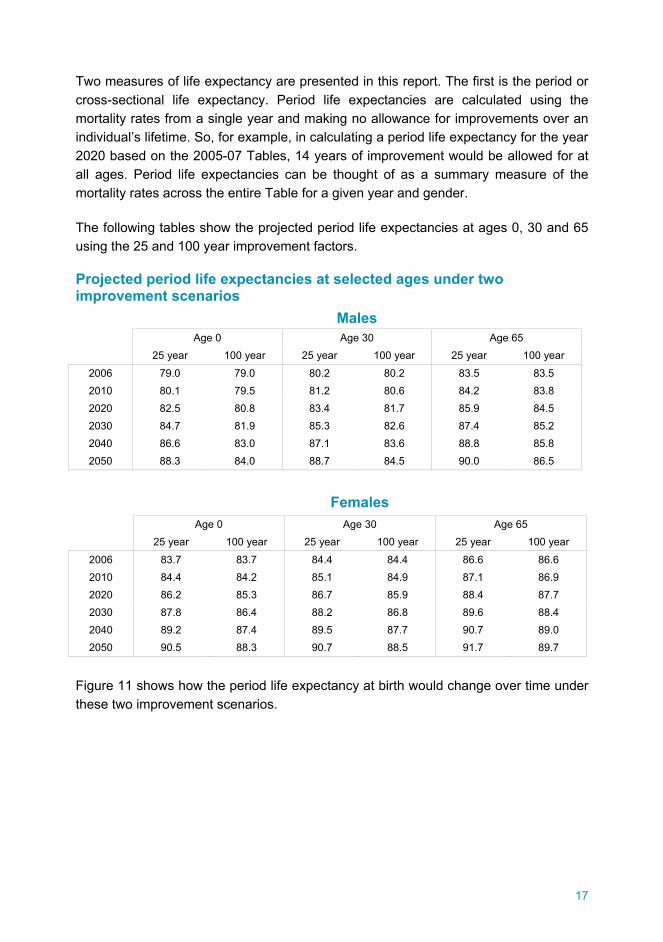
Two measures of life expectancy are presented in this report. The first is the period or cross-sectional life expectancy. Period life expectancies are calculated using the mortality rates from a single year and making no allowance for improvements over an individual’s lifetime. So, for example, in calculating a period life expectancy for the year 2020 based on the 2005-07 Tables, 14 years of improvement would be allowed for at all ages. Period life expectancies can be thought of as a summary measure of the mortality rates across the entire Table for a given year and gender.
The following tables show the projected period life expectancies at ages 0, 30 and 65 using the 25 and 100 year improvement factors.
Projected period life expectancies at selected ages under two improvement scenarios
Males Age 0 Age 30 Age 65 25 year 100 year 25 year 100 year 25 year 100 year
2006 79.0 79.0 80.2 80.2 83.5 83.5 2010 80.1 79.5 81.2 80.6 84.2 83.8 2020 82.5 80.8 83.4 81.7 85.9 84.5 2030 84.7 81.9 85.3 82.6 87.4 85.2 2040 86.6 83.0 87.1 83.6 88.8 85.8 2050 88.3 84.0 88.7 84.5 90.0 86.5
Females Age 0 Age 30 Age 65 25 year 100 year 25 year 100 year 25 year 100 year
2006 83.7 83.7 84.4 84.4 86.6 86.6 2010 84.4 84.2 85.1 84.9 87.1 86.9 2020 86.2 85.3 86.7 85.9 88.4 87.7 2030 87.8 86.4 88.2 86.8 89.6 88.4 2040 89.2 87.4 89.5 87.7 90.7 89.0 2050 90.5 88.3 90.7 88.5 91.7 89.7
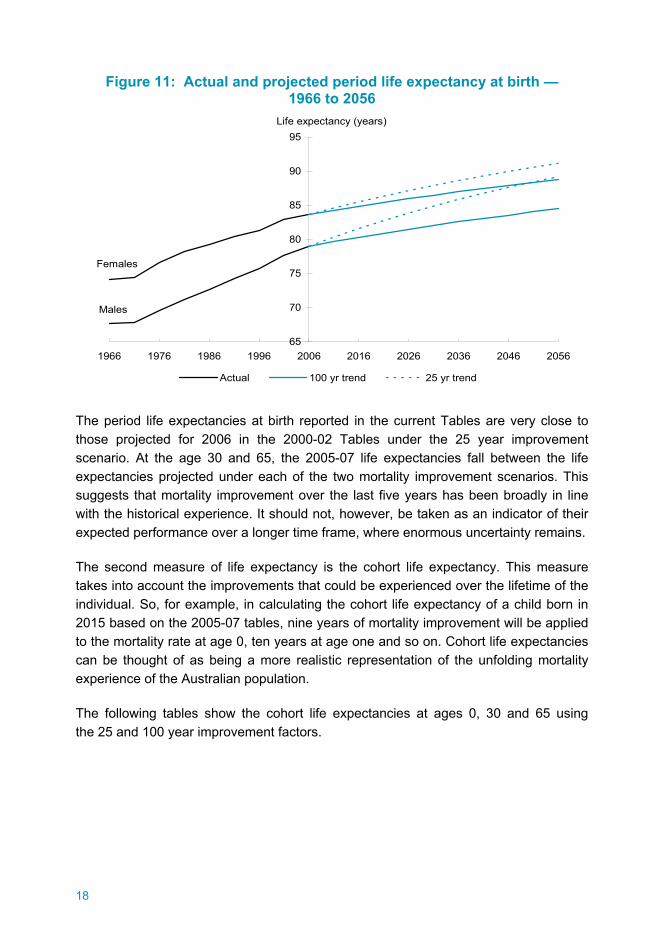
Figure 11 shows how the period life expectancy at birth would change over time under these two improvement scenarios.
18
Figure 11: Actual and projected period life expectancy at birth — 1966 to 2056
65
70
75
80
85
90
95
1966 1976 1986 1996 2006 2016 2026 2036 2046 2056
Actual 100 yr trend 25 yr trend
Life expectancy (years)
Females
Males
The period life expectancies at birth reported in the current Tables are very close to those projected for 2006 in the 2000-02 Tables under the 25 year improvement scenario. At the age 30 and 65, the 2005-07 life expectancies fall between the life expectancies projected under each of the two mortality improvement scenarios. This suggests that mortality improvement over the last five years has been broadly in line with the historical experience. It should not, however, be taken as an indicator of their expected performance over a longer time frame, where enormous uncertainty remains.
The second measure of life expectancy is the cohort life expectancy. This measure takes into account the improvements that could be experienced over the lifetime of the individual. So, for example, in calculating the cohort life expectancy of a child born in 2015 based on the 2005-07 tables, nine years of mortality improvement will be applied to the mortality rate at age 0, ten years at age one and so on. Cohort life expectancies can be thought of as being a more realistic representation of the unfolding mortality experience of the Australian population.
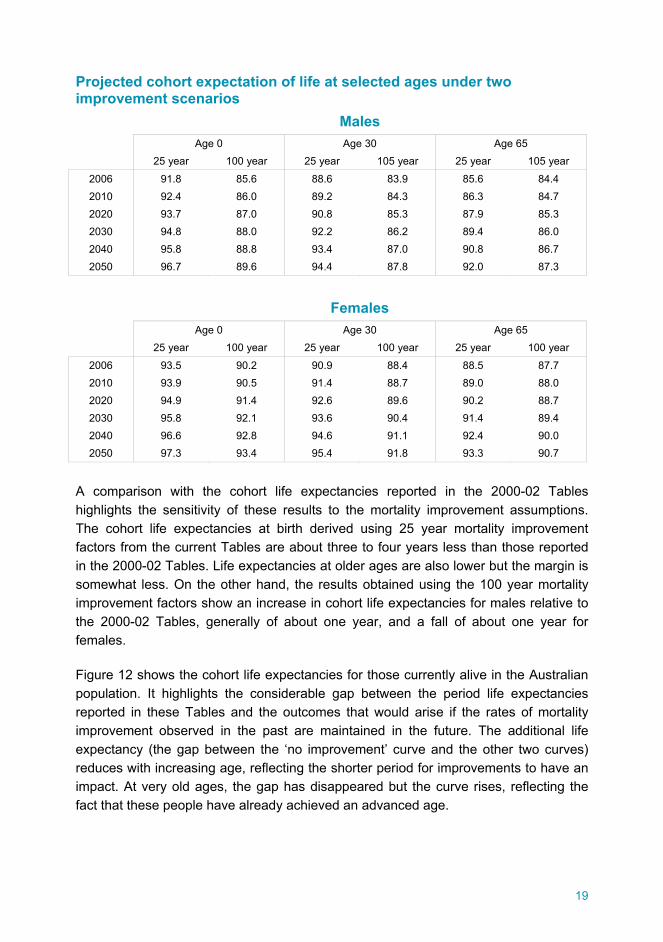
The following tables show the cohort life expectancies at ages 0, 30 and 65 using the 25 and 100 year improvement factors.
19
Projected cohort expectation of life at selected ages under two improvement scenarios
Males Age 0 Age 30 Age 65 25 year 100 year 25 year 105 year 25 year 105 year
2006 91.8 85.6 88.6 83.9 85.6 84.4 2010 92.4 86.0 89.2 84.3 86.3 84.7 2020 93.7 87.0 90.8 85.3 87.9 85.3 2030 94.8 88.0 92.2 86.2 89.4 86.0 2040 95.8 88.8 93.4 87.0 90.8 86.7 2050 96.7 89.6 94.4 87.8 92.0 87.3
Females Age 0 Age 30 Age 65 25 year 100 year 25 year 100 year 25 year 100 year
2006 93.5 90.2 90.9 88.4 88.5 87.7 2010 93.9 90.5 91.4 88.7 89.0 88.0 2020 94.9 91.4 92.6 89.6 90.2 88.7 2030 95.8 92.1 93.6 90.4 91.4 89.4 2040 96.6 92.8 94.6 91.1 92.4 90.0 2050 97.3 93.4 95.4 91.8 93.3 90.7
A comparison with the cohort life expectancies reported in the 2000-02 Tables highlights the sensitivity of these results to the mortality improvement assumptions. The cohort life expectancies at birth derived using 25 year mortality improvement factors from the current Tables are about three to four years less than those reported in the 2000-02 Tables. Life expectancies at older ages are also lower but the margin is somewhat less. On the other hand, the results obtained using the 100 year mortality improvement factors show an increase in cohort life expectancies for males relative to the 2000-02 Tables, generally of about one year, and a fall of about one year for females.
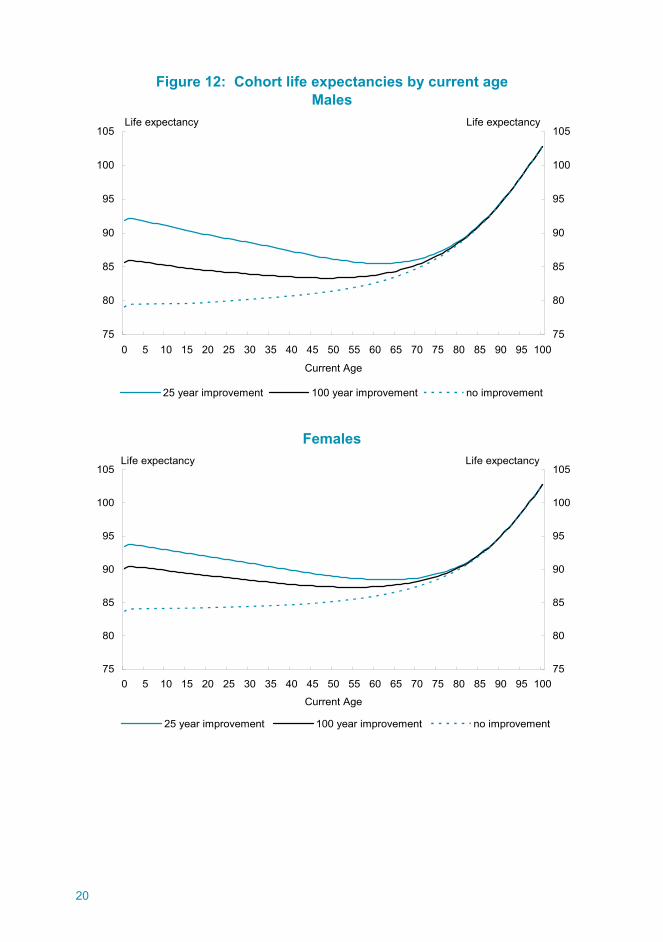
Figure 12 shows the cohort life expectancies for those currently alive in the Australian population. It highlights the considerable gap between the period life expectancies reported in these Tables and the outcomes that would arise if the rates of mortality improvement observed in the past are maintained in the future. The additional life expectancy (the gap between the ‘no improvement’ curve and the other two curves) reduces with increasing age, reflecting the shorter period for improvements to have an impact. At very old ages, the gap has disappeared but the curve rises, reflecting the fact that these people have already achieved an advanced age.
20
Figure 12: Cohort life expectancies by current age Males
75
80
85
90
95
100
105
0 5 10 15 20 25 30 35 40 45 50 55 60 65 70 75 80 85 90 95 100
Current Age
75
80
85
90
95
100
105
25 year improvement 100 year improvement no improvement
Life expectancy Life expectancy
Females
75
80
85
90
95
100
105
0 5 10 15 20 25 30 35 40 45 50 55 60 65 70 75 80 85 90 95 100
Current Age
75
80
85
90
95
100
105
25 year improvement 100 year improvement no improvement
Life expectancy Life expectancy
21
The period and cohort life expectancies set out above illustrate what would occur if mortality continued to improve at the rates observed in the past. Measured mortality improvement can change appreciably between successive Tables as the earliest period is removed from the calculation and the experience from the most recent five years incorporated. For example, for males aged 25, mortality actually increased between the 1975-77 Tables and the 1980-82 Tables. By contrast, over the past five years, mortality fell by almost 30 per cent. As a result, the 25 year mortality improvement factor at this age has more than doubled from 0.8 per cent per annum to 1.8 per cent per annum between the 2000-02 Tables and the current Tables.
Furthermore, the effects of these movements are magnified because the projections assume that mortality improvement will be constant for a particular age. In considering cohort life expectancy at birth, the projected mortality rate to be used at age 25 will include 25 years of mortality improvement; at 0.8 per cent per annum this amounts to an improvement of 18 per cent improvement but at 1.8 per cent the improvement over 25 years is 36 per cent.
History demonstrates that mortality improvement is not constant at a particular age and, indeed, can vary within a quite considerable range. The choice of the period over which mortality is measured will also affect the estimates of mortality improvement. Thus, the estimates of cohort mortality included here must be accepted as projections of outcomes under assumptions which have a certain historical basis. They should be regarded as indicative rather than firm forecasts of life expectancy.
22
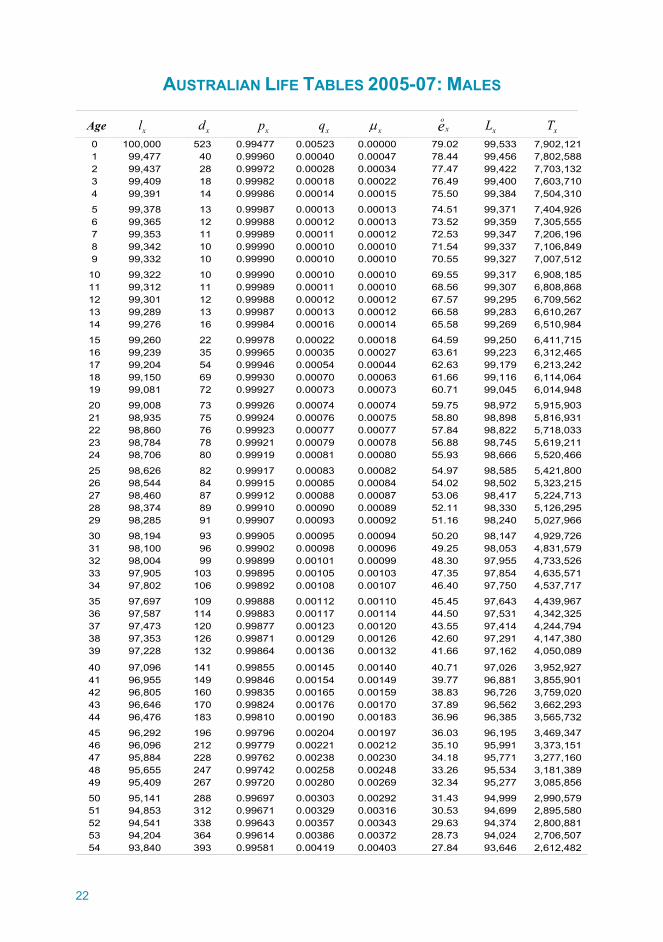
AUSTRALIAN LIFE TABLES 2005-07: MALES
Age xl xd xp xq μx o
xe xL xT
0 100,000 523 0.99477 0.00523 0.00000 79.02 99,533 7,902,121 1 99,477 40 0.99960 0.00040 0.00047 78.44 99,456 7,802,588 2 99,437 28 0.99972 0.00028 0.00034 77.47 99,422 7,703,132 3 99,409 18 0.99982 0.00018 0.00022 76.49 99,400 7,603,710 4 99,391 14 0.99986 0.00014 0.00015 75.50 99,384 7,504,310
5 99,378 13 0.99987 0.00013 0.00013 74.51 99,371 7,404,926 6 99,365 12 0.99988 0.00012 0.00013 73.52 99,359 7,305,555 7 99,353 11 0.99989 0.00011 0.00012 72.53 99,347 7,206,196 8 99,342 10 0.99990 0.00010 0.00010 71.54 99,337 7,106,849 9 99,332 10 0.99990 0.00010 0.00010 70.55 99,327 7,007,512
10 99,322 10 0.99990 0.00010 0.00010 69.55 99,317 6,908,185 11 99,312 11 0.99989 0.00011 0.00010 68.56 99,307 6,808,868 12 99,301 12 0.99988 0.00012 0.00012 67.57 99,295 6,709,562 13 99,289 13 0.99987 0.00013 0.00012 66.58 99,283 6,610,267 14 99,276 16 0.99984 0.00016 0.00014 65.58 99,269 6,510,984
15 99,260 22 0.99978 0.00022 0.00018 64.59 99,250 6,411,715 16 99,239 35 0.99965 0.00035 0.00027 63.61 99,223 6,312,465 17 99,204 54 0.99946 0.00054 0.00044 62.63 99,179 6,213,242 18 99,150 69 0.99930 0.00070 0.00063 61.66 99,116 6,114,064 19 99,081 72 0.99927 0.00073 0.00073 60.71 99,045 6,014,948
20 99,008 73 0.99926 0.00074 0.00074 59.75 98,972 5,915,903 21 98,935 75 0.99924 0.00076 0.00075 58.80 98,898 5,816,931 22 98,860 76 0.99923 0.00077 0.00077 57.84 98,822 5,718,033 23 98,784 78 0.99921 0.00079 0.00078 56.88 98,745 5,619,211 24 98,706 80 0.99919 0.00081 0.00080 55.93 98,666 5,520,466
25 98,626 82 0.99917 0.00083 0.00082 54.97 98,585 5,421,800 26 98,544 84 0.99915 0.00085 0.00084 54.02 98,502 5,323,215 27 98,460 87 0.99912 0.00088 0.00087 53.06 98,417 5,224,713 28 98,374 89 0.99910 0.00090 0.00089 52.11 98,330 5,126,295 29 98,285 91 0.99907 0.00093 0.00092 51.16 98,240 5,027,966
30 98,194 93 0.99905 0.00095 0.00094 50.20 98,147 4,929,726 31 98,100 96 0.99902 0.00098 0.00096 49.25 98,053 4,831,579 32 98,004 99 0.99899 0.00101 0.00099 48.30 97,955 4,733,526 33 97,905 103 0.99895 0.00105 0.00103 47.35 97,854 4,635,571 34 97,802 106 0.99892 0.00108 0.00107 46.40 97,750 4,537,717
35 97,697 109 0.99888 0.00112 0.00110 45.45 97,643 4,439,967 36 97,587 114 0.99883 0.00117 0.00114 44.50 97,531 4,342,325 37 97,473 120 0.99877 0.00123 0.00120 43.55 97,414 4,244,794 38 97,353 126 0.99871 0.00129 0.00126 42.60 97,291 4,147,380 39 97,228 132 0.99864 0.00136 0.00132 41.66 97,162 4,050,089
40 97,096 141 0.99855 0.00145 0.00140 40.71 97,026 3,952,927 41 96,955 149 0.99846 0.00154 0.00149 39.77 96,881 3,855,901 42 96,805 160 0.99835 0.00165 0.00159 38.83 96,726 3,759,020 43 96,646 170 0.99824 0.00176 0.00170 37.89 96,562 3,662,293 44 96,476 183 0.99810 0.00190 0.00183 36.96 96,385 3,565,732
45 96,292 196 0.99796 0.00204 0.00197 36.03 96,195 3,469,347 46 96,096 212 0.99779 0.00221 0.00212 35.10 95,991 3,373,151 47 95,884 228 0.99762 0.00238 0.00230 34.18 95,771 3,277,160 48 95,655 247 0.99742 0.00258 0.00248 33.26 95,534 3,181,389 49 95,409 267 0.99720 0.00280 0.00269 32.34 95,277 3,085,856
50 95,141 288 0.99697 0.00303 0.00292 31.43 94,999 2,990,579 51 94,853 312 0.99671 0.00329 0.00316 30.53 94,699 2,895,580 52 94,541 338 0.99643 0.00357 0.00343 29.63 94,374 2,800,881 53 94,204 364 0.99614 0.00386 0.00372 28.73 94,024 2,706,507 54 93,840 393 0.99581 0.00419 0.00403 27.84 93,646 2,612,482
23
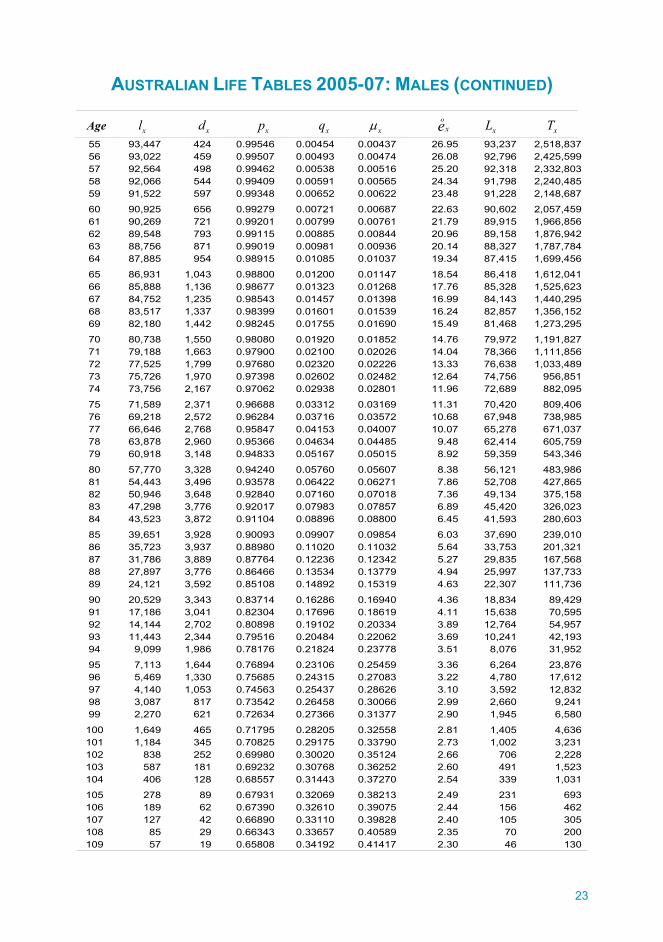
AUSTRALIAN LIFE TABLES 2005-07: MALES (CONTINUED)
Age xl xd xp xq μx o
xe xL xT
55 93,447 424 0.99546 0.00454 0.00437 26.95 93,237 2,518,837 56 93,022 459 0.99507 0.00493 0.00474 26.08 92,796 2,425,599 57 92,564 498 0.99462 0.00538 0.00516 25.20 92,318 2,332,803 58 92,066 544 0.99409 0.00591 0.00565 24.34 91,798 2,240,485 59 91,522 597 0.99348 0.00652 0.00622 23.48 91,228 2,148,687
60 90,925 656 0.99279 0.00721 0.00687 22.63 90,602 2,057,459 61 90,269 721 0.99201 0.00799 0.00761 21.79 89,915 1,966,856 62 89,548 793 0.99115 0.00885 0.00844 20.96 89,158 1,876,942 63 88,756 871 0.99019 0.00981 0.00936 20.14 88,327 1,787,784 64 87,885 954 0.98915 0.01085 0.01037 19.34 87,415 1,699,456
65 86,931 1,043 0.98800 0.01200 0.01147 18.54 86,418 1,612,041 66 85,888 1,136 0.98677 0.01323 0.01268 17.76 85,328 1,525,623 67 84,752 1,235 0.98543 0.01457 0.01398 16.99 84,143 1,440,295 68 83,517 1,337 0.98399 0.01601 0.01539 16.24 82,857 1,356,152 69 82,180 1,442 0.98245 0.01755 0.01690 15.49 81,468 1,273,295
70 80,738 1,550 0.98080 0.01920 0.01852 14.76 79,972 1,191,827 71 79,188 1,663 0.97900 0.02100 0.02026 14.04 78,366 1,111,856 72 77,525 1,799 0.97680 0.02320 0.02226 13.33 76,638 1,033,489 73 75,726 1,970 0.97398 0.02602 0.02482 12.64 74,756 956,851 74 73,756 2,167 0.97062 0.02938 0.02801 11.96 72,689 882,095
75 71,589 2,371 0.96688 0.03312 0.03169 11.31 70,420 809,406 76 69,218 2,572 0.96284 0.03716 0.03572 10.68 67,948 738,985 77 66,646 2,768 0.95847 0.04153 0.04007 10.07 65,278 671,037 78 63,878 2,960 0.95366 0.04634 0.04485 9.48 62,414 605,759 79 60,918 3,148 0.94833 0.05167 0.05015 8.92 59,359 543,346
80 57,770 3,328 0.94240 0.05760 0.05607 8.38 56,121 483,986 81 54,443 3,496 0.93578 0.06422 0.06271 7.86 52,708 427,865 82 50,946 3,648 0.92840 0.07160 0.07018 7.36 49,134 375,158 83 47,298 3,776 0.92017 0.07983 0.07857 6.89 45,420 326,023 84 43,523 3,872 0.91104 0.08896 0.08800 6.45 41,593 280,603
85 39,651 3,928 0.90093 0.09907 0.09854 6.03 37,690 239,010 86 35,723 3,937 0.88980 0.11020 0.11032 5.64 33,753 201,321 87 31,786 3,889 0.87764 0.12236 0.12342 5.27 29,835 167,568 88 27,897 3,776 0.86466 0.13534 0.13779 4.94 25,997 137,733 89 24,121 3,592 0.85108 0.14892 0.15319 4.63 22,307 111,736
90 20,529 3,343 0.83714 0.16286 0.16940 4.36 18,834 89,429 91 17,186 3,041 0.82304 0.17696 0.18619 4.11 15,638 70,595 92 14,144 2,702 0.80898 0.19102 0.20334 3.89 12,764 54,957 93 11,443 2,344 0.79516 0.20484 0.22062 3.69 10,241 42,193 94 9,099 1,986 0.78176 0.21824 0.23778 3.51 8,076 31,952
95 7,113 1,644 0.76894 0.23106 0.25459 3.36 6,264 23,876 96 5,469 1,330 0.75685 0.24315 0.27083 3.22 4,780 17,612 97 4,140 1,053 0.74563 0.25437 0.28626 3.10 3,592 12,832 98 3,087 817 0.73542 0.26458 0.30066 2.99 2,660 9,241 99 2,270 621 0.72634 0.27366 0.31377 2.90 1,945 6,580
100 1,649 465 0.71795 0.28205 0.32558 2.81 1,405 4,636 101 1,184 345 0.70825 0.29175 0.33790 2.73 1,002 3,231 102 838 252 0.69980 0.30020 0.35124 2.66 706 2,228 103 587 181 0.69232 0.30768 0.36252 2.60 491 1,523 104 406 128 0.68557 0.31443 0.37270 2.54 339 1,031
105 278 89 0.67931 0.32069 0.38213 2.49 231 693 106 189 62 0.67390 0.32610 0.39075 2.44 156 462 107 127 42 0.66890 0.33110 0.39828 2.40 105 305 108 85 29 0.66343 0.33657 0.40589 2.35 70 200 109 57 19 0.65808 0.34192 0.41417 2.30 46 130
24
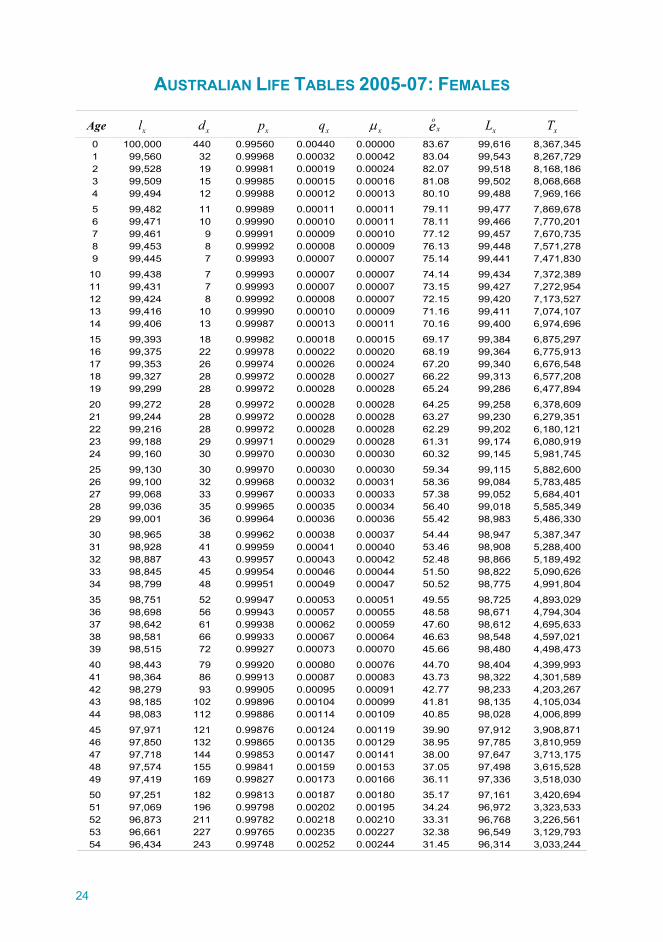
AUSTRALIAN LIFE TABLES 2005-07: FEMALES
Age xl xd xp xq μx o
xe xL xT
0 100,000 440 0.99560 0.00440 0.00000 83.67 99,616 8,367,345 1 99,560 32 0.99968 0.00032 0.00042 83.04 99,543 8,267,729 2 99,528 19 0.99981 0.00019 0.00024 82.07 99,518 8,168,186 3 99,509 15 0.99985 0.00015 0.00016 81.08 99,502 8,068,668 4 99,494 12 0.99988 0.00012 0.00013 80.10 99,488 7,969,166
5 99,482 11 0.99989 0.00011 0.00011 79.11 99,477 7,869,678 6 99,471 10 0.99990 0.00010 0.00011 78.11 99,466 7,770,201 7 99,461 9 0.99991 0.00009 0.00010 77.12 99,457 7,670,735 8 99,453 8 0.99992 0.00008 0.00009 76.13 99,448 7,571,278 9 99,445 7 0.99993 0.00007 0.00007 75.14 99,441 7,471,830
10 99,438 7 0.99993 0.00007 0.00007 74.14 99,434 7,372,389 11 99,431 7 0.99993 0.00007 0.00007 73.15 99,427 7,272,954 12 99,424 8 0.99992 0.00008 0.00007 72.15 99,420 7,173,527 13 99,416 10 0.99990 0.00010 0.00009 71.16 99,411 7,074,107 14 99,406 13 0.99987 0.00013 0.00011 70.16 99,400 6,974,696
15 99,393 18 0.99982 0.00018 0.00015 69.17 99,384 6,875,297 16 99,375 22 0.99978 0.00022 0.00020 68.19 99,364 6,775,913 17 99,353 26 0.99974 0.00026 0.00024 67.20 99,340 6,676,548 18 99,327 28 0.99972 0.00028 0.00027 66.22 99,313 6,577,208 19 99,299 28 0.99972 0.00028 0.00028 65.24 99,286 6,477,894
20 99,272 28 0.99972 0.00028 0.00028 64.25 99,258 6,378,609 21 99,244 28 0.99972 0.00028 0.00028 63.27 99,230 6,279,351 22 99,216 28 0.99972 0.00028 0.00028 62.29 99,202 6,180,121 23 99,188 29 0.99971 0.00029 0.00028 61.31 99,174 6,080,919 24 99,160 30 0.99970 0.00030 0.00030 60.32 99,145 5,981,745
25 99,130 30 0.99970 0.00030 0.00030 59.34 99,115 5,882,600 26 99,100 32 0.99968 0.00032 0.00031 58.36 99,084 5,783,485 27 99,068 33 0.99967 0.00033 0.00033 57.38 99,052 5,684,401 28 99,036 35 0.99965 0.00035 0.00034 56.40 99,018 5,585,349 29 99,001 36 0.99964 0.00036 0.00036 55.42 98,983 5,486,330
30 98,965 38 0.99962 0.00038 0.00037 54.44 98,947 5,387,347 31 98,928 41 0.99959 0.00041 0.00040 53.46 98,908 5,288,400 32 98,887 43 0.99957 0.00043 0.00042 52.48 98,866 5,189,492 33 98,845 45 0.99954 0.00046 0.00044 51.50 98,822 5,090,626 34 98,799 48 0.99951 0.00049 0.00047 50.52 98,775 4,991,804
35 98,751 52 0.99947 0.00053 0.00051 49.55 98,725 4,893,029 36 98,698 56 0.99943 0.00057 0.00055 48.58 98,671 4,794,304 37 98,642 61 0.99938 0.00062 0.00059 47.60 98,612 4,695,633 38 98,581 66 0.99933 0.00067 0.00064 46.63 98,548 4,597,021 39 98,515 72 0.99927 0.00073 0.00070 45.66 98,480 4,498,473
40 98,443 79 0.99920 0.00080 0.00076 44.70 98,404 4,399,993 41 98,364 86 0.99913 0.00087 0.00083 43.73 98,322 4,301,589 42 98,279 93 0.99905 0.00095 0.00091 42.77 98,233 4,203,267 43 98,185 102 0.99896 0.00104 0.00099 41.81 98,135 4,105,034 44 98,083 112 0.99886 0.00114 0.00109 40.85 98,028 4,006,899
45 97,971 121 0.99876 0.00124 0.00119 39.90 97,912 3,908,871 46 97,850 132 0.99865 0.00135 0.00129 38.95 97,785 3,810,959 47 97,718 144 0.99853 0.00147 0.00141 38.00 97,647 3,713,175 48 97,574 155 0.99841 0.00159 0.00153 37.05 97,498 3,615,528 49 97,419 169 0.99827 0.00173 0.00166 36.11 97,336 3,518,030
50 97,251 182 0.99813 0.00187 0.00180 35.17 97,161 3,420,694 51 97,069 196 0.99798 0.00202 0.00195 34.24 96,972 3,323,533 52 96,873 211 0.99782 0.00218 0.00210 33.31 96,768 3,226,561 53 96,661 227 0.99765 0.00235 0.00227 32.38 96,549 3,129,793 54 96,434 243 0.99748 0.00252 0.00244 31.45 96,314 3,033,244
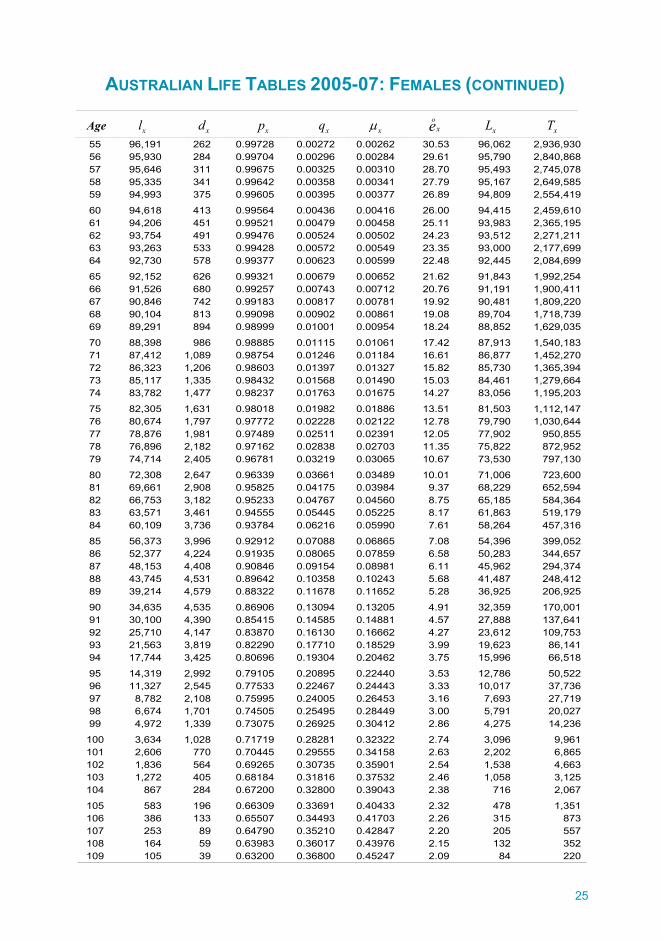
25
AUSTRALIAN LIFE TABLES 2005-07: FEMALES (CONTINUED)
Age xl xd xp xq μx o
xe xL xT
55 96,191 262 0.99728 0.00272 0.00262 30.53 96,062 2,936,930 56 95,930 284 0.99704 0.00296 0.00284 29.61 95,790 2,840,868 57 95,646 311 0.99675 0.00325 0.00310 28.70 95,493 2,745,078 58 95,335 341 0.99642 0.00358 0.00341 27.79 95,167 2,649,585 59 94,993 375 0.99605 0.00395 0.00377 26.89 94,809 2,554,419
60 94,618 413 0.99564 0.00436 0.00416 26.00 94,415 2,459,610 61 94,206 451 0.99521 0.00479 0.00458 25.11 93,983 2,365,195 62 93,754 491 0.99476 0.00524 0.00502 24.23 93,512 2,271,211 63 93,263 533 0.99428 0.00572 0.00549 23.35 93,000 2,177,699 64 92,730 578 0.99377 0.00623 0.00599 22.48 92,445 2,084,699
65 92,152 626 0.99321 0.00679 0.00652 21.62 91,843 1,992,254 66 91,526 680 0.99257 0.00743 0.00712 20.76 91,191 1,900,411 67 90,846 742 0.99183 0.00817 0.00781 19.92 90,481 1,809,220 68 90,104 813 0.99098 0.00902 0.00861 19.08 89,704 1,718,739 69 89,291 894 0.98999 0.01001 0.00954 18.24 88,852 1,629,035
70 88,398 986 0.98885 0.01115 0.01061 17.42 87,913 1,540,183 71 87,412 1,089 0.98754 0.01246 0.01184 16.61 86,877 1,452,270 72 86,323 1,206 0.98603 0.01397 0.01327 15.82 85,730 1,365,394 73 85,117 1,335 0.98432 0.01568 0.01490 15.03 84,461 1,279,664 74 83,782 1,477 0.98237 0.01763 0.01675 14.27 83,056 1,195,203
75 82,305 1,631 0.98018 0.01982 0.01886 13.51 81,503 1,112,147 76 80,674 1,797 0.97772 0.02228 0.02122 12.78 79,790 1,030,644 77 78,876 1,981 0.97489 0.02511 0.02391 12.05 77,902 950,855 78 76,896 2,182 0.97162 0.02838 0.02703 11.35 75,822 872,952 79 74,714 2,405 0.96781 0.03219 0.03065 10.67 73,530 797,130
80 72,308 2,647 0.96339 0.03661 0.03489 10.01 71,006 723,600 81 69,661 2,908 0.95825 0.04175 0.03984 9.37 68,229 652,594 82 66,753 3,182 0.95233 0.04767 0.04560 8.75 65,185 584,364 83 63,571 3,461 0.94555 0.05445 0.05225 8.17 61,863 519,179 84 60,109 3,736 0.93784 0.06216 0.05990 7.61 58,264 457,316
85 56,373 3,996 0.92912 0.07088 0.06865 7.08 54,396 399,052 86 52,377 4,224 0.91935 0.08065 0.07859 6.58 50,283 344,657 87 48,153 4,408 0.90846 0.09154 0.08981 6.11 45,962 294,374 88 43,745 4,531 0.89642 0.10358 0.10243 5.68 41,487 248,412 89 39,214 4,579 0.88322 0.11678 0.11652 5.28 36,925 206,925
90 34,635 4,535 0.86906 0.13094 0.13205 4.91 32,359 170,001 91 30,100 4,390 0.85415 0.14585 0.14881 4.57 27,888 137,641 92 25,710 4,147 0.83870 0.16130 0.16662 4.27 23,612 109,753 93 21,563 3,819 0.82290 0.17710 0.18529 3.99 19,623 86,141 94 17,744 3,425 0.80696 0.19304 0.20462 3.75 15,996 66,518
95 14,319 2,992 0.79105 0.20895 0.22440 3.53 12,786 50,522 96 11,327 2,545 0.77533 0.22467 0.24443 3.33 10,017 37,736 97 8,782 2,108 0.75995 0.24005 0.26453 3.16 7,693 27,719 98 6,674 1,701 0.74505 0.25495 0.28449 3.00 5,791 20,027 99 4,972 1,339 0.73075 0.26925 0.30412 2.86 4,275 14,236
100 3,634 1,028 0.71719 0.28281 0.32322 2.74 3,096 9,961 101 2,606 770 0.70445 0.29555 0.34158 2.63 2,202 6,865 102 1,836 564 0.69265 0.30735 0.35901 2.54 1,538 4,663 103 1,272 405 0.68184 0.31816 0.37532 2.46 1,058 3,125 104 867 284 0.67200 0.32800 0.39043 2.38 716 2,067
105 583 196 0.66309 0.33691 0.40433 2.32 478 1,351 106 386 133 0.65507 0.34493 0.41703 2.26 315 873 107 253 89 0.64790 0.35210 0.42847 2.20 205 557 108 164 59 0.63983 0.36017 0.43976 2.15 132 352 109 105 39 0.63200 0.36800 0.45247 2.09 84 220
26
2. CONSTRUCTION OF THE AUSTRALIAN LIFE TABLES 2005-07
There are three main elements in the process of constructing the Australian Life Tables. The first is the derivation of the exposed-to-risk and crude mortality rates from the information provided by the Australian Bureau of Statistics (ABS). The second is the graduation of the crude rates and associated statistical testing of the quality of the graduation. The final task is the calculation of the Life Table functions.
2.1 Calculation of exposed-to-risk and crude mortality rates
The calculation of mortality rates requires a measure of both the number of deaths and the population which was at risk of dying — the exposed-to-risk — over the same period. The raw data used for these calculations was provided by the ABS and comprised the following:
(a) Estimates of the numbers of males and females resident in Australia at each age last birthday up to 99 years and over, as at 30 June 2006. These estimates are based on the 2006 Census of Population and Housing adjusted for under-enumeration and the lapse of time between 30 June and 8 August 2006 (the night on which the Census was taken). They differ from the published official estimates of Australian resident population which contain further adjustments to exclude overseas visitors temporarily in Australia and include Australian residents who are temporarily absent.
(b) The numbers of deaths occurring inside Australia for each month from January 2005 to December 2007, classified by sex and age last birthday at the time of death. This covered all registrations of deaths to the end of 2008 and is considered to be effectively a complete record of all deaths occurring over the three year period.
(c) The number of births classified by gender in each month from January 2001 to December 2007.
(d) The number of deaths of those aged 3 years or less in each month from January 2001 to December 2007, classified by gender and age last birthday, with deaths of those aged less than one year classified by detailed duration.
27
(e) The numbers of persons moving into and out of Australia in each month from January 2005 to December 2007 for those aged 4 or more, and from January 2001 to December 2007 for those aged less than 4, grouped by age last birthday and gender.
Appendix B includes some selected summary information on the population, number of deaths and population movements, while Appendix C provides the detailed estimates of the population at each age last birthday at 30 June 2006, and the number of deaths at each age occurring over the three years 2005 to 2007.
The ABS conducts a five-yearly Census of Population and Housing. Adjusted population estimates based on a particular Census will usually differ from those produced by updating the results of the previous Census for population change (that is, for births, deaths and migration) during the following five years. The difference between an estimate based on the results of a particular Census and that produced by updating results from the previous Census is called intercensal discrepancy. It is caused by unattributable errors in either or both of the start and finish population estimates, together with any errors in the estimates of births, deaths or migration in the intervening period.
The Australian Life Tables are based on the most recent Census population estimates. This is consistent with the view of the ABS that the best available estimate of the population at 30 June of the Census year is the one based on that year’s Census, not the one carried forward from the previous period. Intercensal discrepancy can, however, affect the comparability of reported mortality rates, and consequently life expectancies and improvement factors.
The crude mortality rates are calculated by dividing the number of deaths at a particular age by the exposed-to-risk for that age. It is essential, then, that the measure of the exposed-to-risk and the number of deaths should refer to the same population. Effectively, this means that a person in the population should be included in the denominator (that is, counted in the exposed-to-risk) only if their death would have been included in the numerator had they died.
The deaths used in deriving these Tables are those which occurred in Australia during 2005-07, regardless of usual place of residence. The appropriate exposed-to-risk is, therefore, exposure of people actually present in Australia at any time during the three year period. The official population estimates published by the ABS (Estimated Resident Population, ABS Catalogue No 3201.0) are intended to measure the population usually resident in Australia and accordingly include adjustments to remove the effect of short-term movements, which are not appropriate for these Tables. Adjustment does, however, need to be made to the exposed-to-risk to take account of
28
those persons who, as a result of death or international movement, are not present in Australia for the full three year period.
The base estimate of the exposed-to-risk at age x, which assumes that all those present on Census night contribute a full three years to the exposed-to-risk, was taken to be:
2 1 +1 +2x- x- x x xP P P P P+ + + +1 7 7 18 8 8 8
where Px is the population inside Australia aged x last birthday as measured in the 2006 Census adjusted only for under-enumeration and the lapse of time from 30 June to Census night.
This estimate was then modified to reduce exposure for those who arrived in Australia between January 2005 and June 2006, or who died or left Australia between July 2006 and December 2007. Similarly, exposure was increased to take account of those who arrived between July 2006 and December 2007 or who died or left Australia between January 2005 and June 2006.
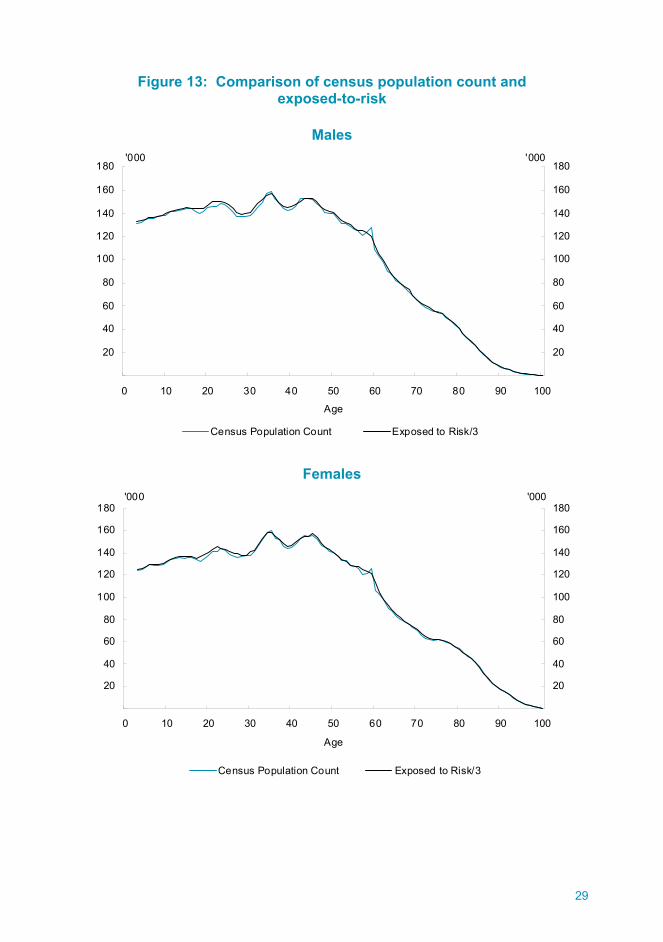
Figure 13 compares the Census population count with the exposed-to-risk after all adjustments have been made. It can be seen that the exposed-to-risk formula smoothes to some extent the fluctuations from age to age apparent in the unadjusted population count. The peak resulting from the high birth rates in 1971 remains clearly visible, as does the baby boomer cohort who were in their late 40s and 50s at the time of the Census. The impact of significant net inward migration over recent years can be seen in the fact that the exposed-to-risk sits above the Census population count for most of the prime working ages from 20 to 40.
29
Figure 13: Comparison of census population count and exposed-to-risk
Males
20
40
60
80
100
120
140
160
180
0 10 20 30 40 50 60 70 80 90 100
Age
'000
20
40
60
80
100
120
140
160
180'000
Census Population Count Exposed to Risk/3
Females
20
40
60
80
100
120
140
160
180
0 10 20 30 40 50 60 70 80 90 100
Age
'000
20
40
60
80
100
120
140
160
180'000
Census Population Count Exposed to Risk/3
30
For ages 2 and above, the crude central rate of mortality at age x, xm , was in most cases calculated by dividing the deaths at age x during 2005, 2006 and 2007 by the relevant exposed-to-risk. An exception was made for ages 4 to 16 inclusive. Deaths over the these ages have fallen to less than half the number observed two decades ago, despite the growth in the populations at risk. This has increased the potential for random fluctuations to result in dramatically different smoothed mortality rates from one set of Tables to the next. In order to avoid giving undue weight to random variation, we have combined the experience from 2000-02 and 2005-07 over these ages. The deaths data from 2000-02 has been adjusted to take account of the average level of mortality improvement over these ages before combining with the 2005-07 experience.
The exposed-to-risk for ages 0 and 1 was derived more directly by keeping a count of those at each age for each month of the three year period using monthly birth, death and movement records from 2001 to 2007. Because of the rapid fall in the force of mortality, μx over the first few weeks of life, xq , rather than xm was calculated for age zero. The formulae used are available on request.
2.2 Graduation of the crude mortality rates
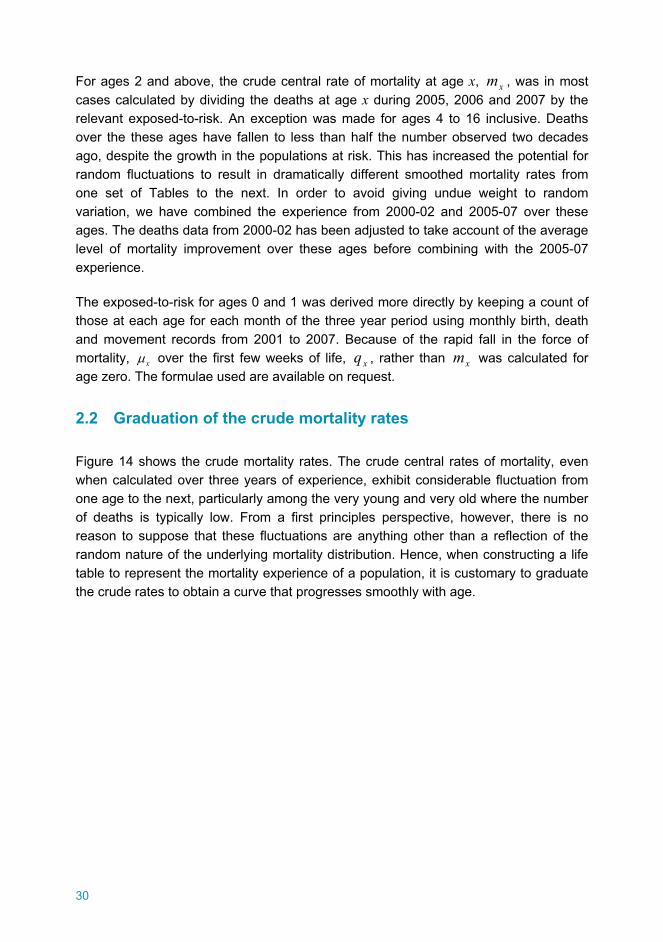
Figure 14 shows the crude mortality rates. The crude central rates of mortality, even when calculated over three years of experience, exhibit considerable fluctuation from one age to the next, particularly among the very young and very old where the number of deaths is typically low. From a first principles perspective, however, there is no reason to suppose that these fluctuations are anything other than a reflection of the random nature of the underlying mortality distribution. Hence, when constructing a life table to represent the mortality experience of a population, it is customary to graduate the crude rates to obtain a curve that progresses smoothly with age.
31
Figure 14: Crude central mortality rates
0.00001
0.0001
0.001
0.01
0.1
1
0 10 20 30 40 50 60 70 80 90 100Age
Crude mx
0.00001
0.0001
0.001
0.01
0.1
1Crude mx
Males Females
As with the six previous Life Tables, a combination of manual graduation and fitted cubic splines was used. Cubic splines were fitted over all but the two youngest ages and the very top of the age distribution. At the oldest ages, there is little exposure and few deaths and a different approach is required. This is discussed below.
The method of cubic splines involves fitting a series of cubic polynomials to the crude rates of mortality. These polynomials are constrained to be not only continuous at the 'knots' where they join, but also to have equal first and second derivatives at those points. This constraint, of itself, is insufficient to ensure that the fitted curve is smooth in the sense of having a low rate of change of curvature. A large number of knots or closely spaced knots would allow the curve to follow the random fluctuations in the crude rates. At the same time, large intervals between the knots can reduce the fitted curve's fidelity to the observed results. The choice of the number and location of knots, therefore, involves a balance between achieving a smooth curve and deriving fitted rates that are reasonably consistent with the observed mortality rates.
32
For any given choice of knots, the criterion used to arrive at the cubic spline was that the following weighted sum of squares (an approximate χ2 variable) should be minimised:
( )( )
2
1
2xx x x
x=x x x x
A - E mE m 1- m′ ′∑
where:
xA is the number of observed deaths aged x in the three years 2005, 2006 and 2007;
xE is the central exposed-to-risk at age x;
mx is the graduated value of the central mortality rate at age x, produced by the cubic spline;
xm′ is a preliminary value of mx obtained by minimising a sum of squares similar to that above, but with xA as the denominator;
1x is the lowest age of the range to which the cubic spline is to be fitted; and
2x is the highest age of the range to which the cubic spline is to be fitted.
As in the 2000-02 Life Tables, the knots were initially selected based on observation of the crude data. A computer program was then used to modify the location of the knots to improve the fidelity of the graduated rates to the data, and a series of statistical tests were performed on the rates to assess the adequacy of the fit. A process of trial-and-error was followed whereby a variety of initial knots was input into the program to produce alternative sets of graduated rates. The knots used in the graduation adopted are shown below.
Males: 4 16 19 21 22 32 57 60 73 75 78 89 94
Females: 4 11 17 20 22 35 36 57 58 65 78 91 105
The cubic splines were fitted from ages 2 to 105. In general, a larger number of knots is required at and near the ages where mortality undergoes a marked transition. For males, knots at ages 16, 19, 21 and 22 enabled the construction of a graduated curve that captured the behaviour of mortality rates at the edge of the accident ‘cliff’. Similarly, for females, knots were needed at ages 17, 20 and 22 to capture the sharp
33
increase and subsequent flattening in mortality rates over this age range. A further group of knots was required around age 75 to achieve the transition to the old age rates for males, while for females a pair of knots at ages 57 and 58 was needed to adequately fit the data.
Graduated rates for the uppermost ages were constructed by extrapolating the trend of the crude rates from age 95 to an age where there were sufficient deaths to make the crude rates meaningful; age 104 for males and 111 for females. The trend result was determined by fitting a Makeham curve to the crude rates over this age range. The Makeham curve was then used to extrapolate the graduated rates from age 105 for males and 107 for females. The Makeham curve for males was very much flatter than that fitted for females and we decided to increase the male rates half way to the female rates for ages above 99.
As has been the case for the last five Tables, the raw mortality rates for males and females cross at a very old age. The 1990-92 Tables maintained the apparent crossover as a genuine feature, placing it between ages 102 and 103. The 1995-97 set of crude mortality rates suggested a reduction in the age at which crossover occurs, placing it in the upper 90s and the crossover was placed at age 98. The crude rates for the 2000-02 Tables crossed at age 96 but after graduation, the crossover was placed at age 103.
The 2006 Census was the first to record individual ages for those aged 100 or more. It also asked for date of birth which allowed the internal consistency of the records to be checked. As result, both the quality and volume of data at these very old ages have improved. For the current Tables, the crude rates crossed at 99 and graduation increased this by only one year to 100. Thus, while the placement of the crossover is necessarily uncertain due to the relatively small volume of data and associated volatility in crude rates from one Table to the next, over the last four tables it has fallen within a five year age band, with the current Tables placing it at the midpoint of this range.
A negligible percentage of death registrations in 2005-07 did not include the age at death (less than 0.03 per cent for all ages), and consequently no adjustments were considered necessary to the graduated rates.
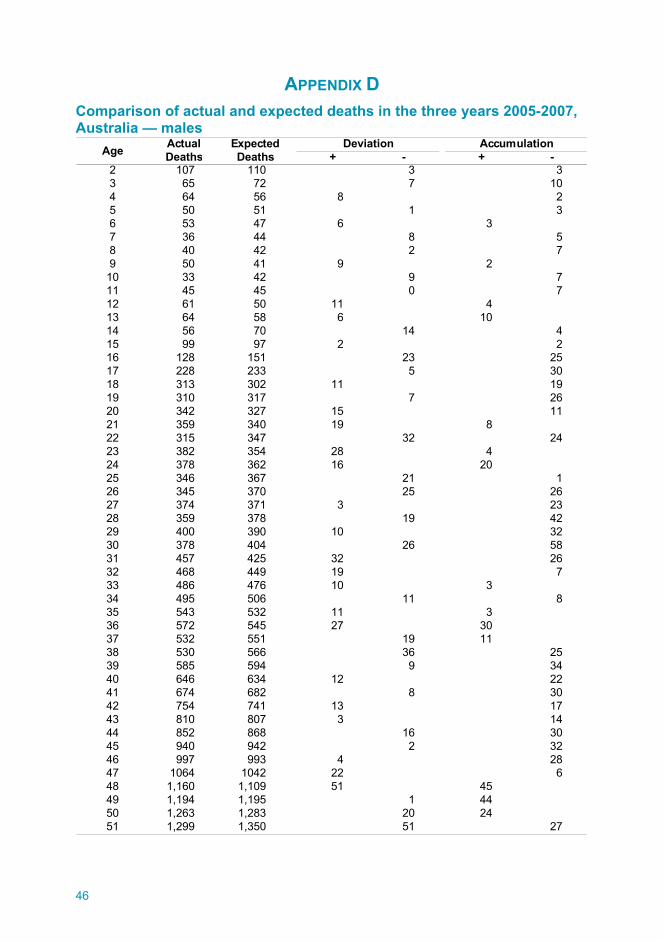
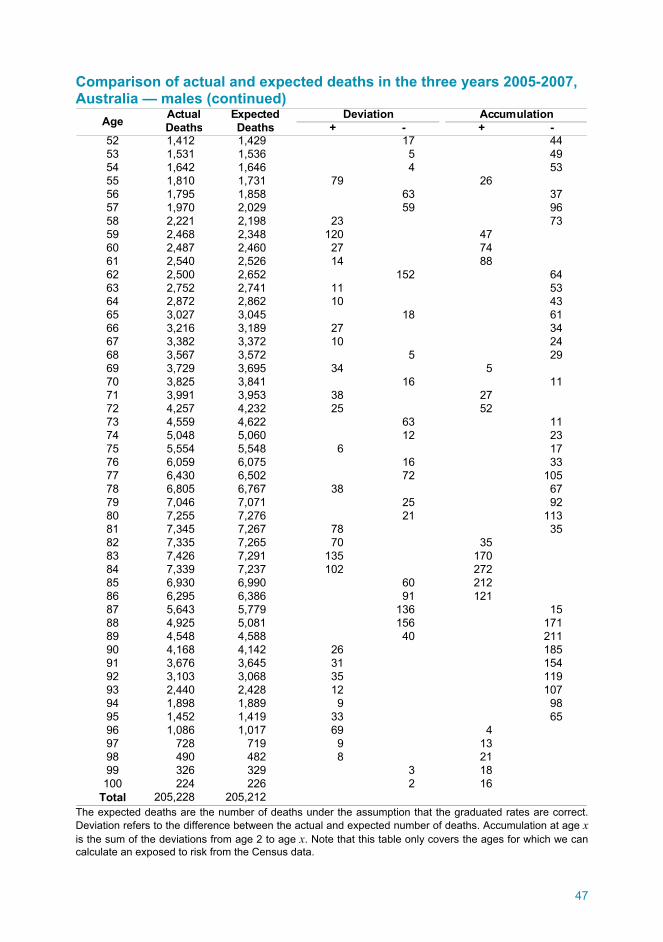
A number of tests were applied to the graduated rates to assess the suitability of the graduation. These tests indicated that the deviations between the crude rates and graduated rates were consistent with the hypothesis that the observed deaths representing a random sample from an underlying mortality distribution following the smoothed rates. Appendix D provides a comparison between the actual and expected number of deaths at each age.
34
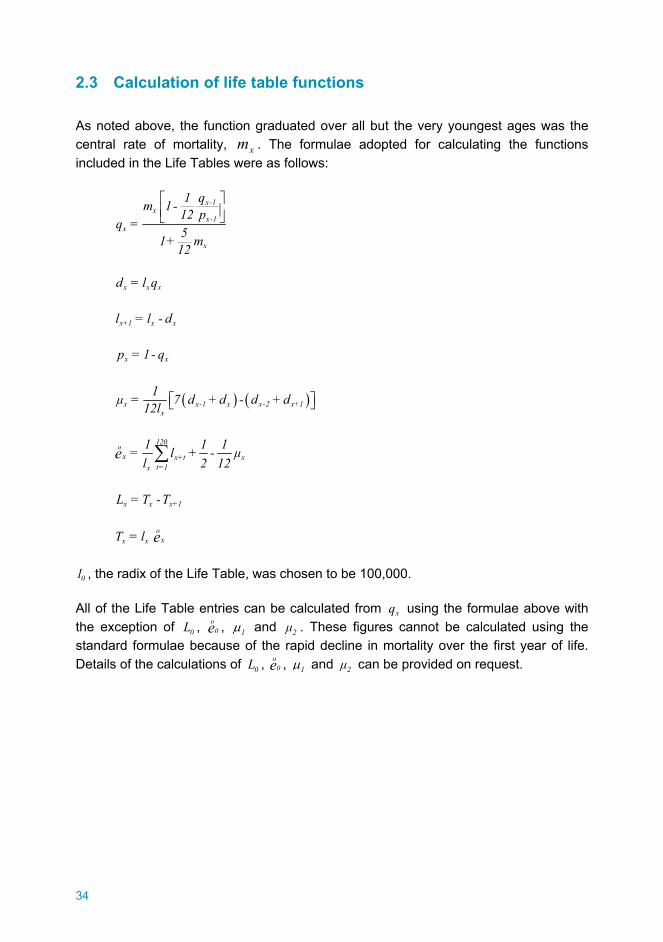
2.3 Calculation of life table functions
As noted above, the function graduated over all but the very youngest ages was the central rate of mortality, xm . The formulae adopted for calculating the functions included in the Life Tables were as follows:
x-1x
x-1x
x
1 qm 1- 12 pq =
51+ m12
⎡ ⎤⎢ ⎥⎣ ⎦
x x xd = l q
x+1 x xl = l - d
x xp = 1- q
( ) ( )x x-1 x x-2 x+1x
1μ = 7 d + d - d + d12l
⎡ ⎤⎣ ⎦
oxe
120
x+t xt=1x
1 1 1= l + - μl 2 12∑
x x x+1L = T -T
x xT = l oxe
0l , the radix of the Life Table, was chosen to be 100,000.
All of the Life Table entries can be calculated from xq using the formulae above with the exception of 0L , o
0e , 1μ and 2μ . These figures cannot be calculated using the standard formulae because of the rapid decline in mortality over the first year of life. Details of the calculations of 0L , o
0e , 1μ and 2μ can be provided on request.
35
3. USE OF LIFE TABLES FOR PROBABILITY CALCULATIONS
As well as being the most recent actuarially determined record of mortality rates, the 2005-07 Tables can be used to project the probabilities of persons living or dying at some time in the future. This does, however, require an assumption on what will happen to mortality rates over the intervening period.
The simplest assumption is that mortality rates remain unchanged at the 2005-07 level. However, the continuing improvement in mortality exhibited in these Tables suggests that this assumption will tend to underestimate survival probabilities.
A range of assumptions can be made about future mortality improvements. Appendix E contains the two series of improvement factors derived from the historical trends in Australian mortality improvement over the last 25 years and 100 years. These factors can be applied to the mortality rates included in the current Life Tables to obtain projections of future mortality and life expectancy scenarios.
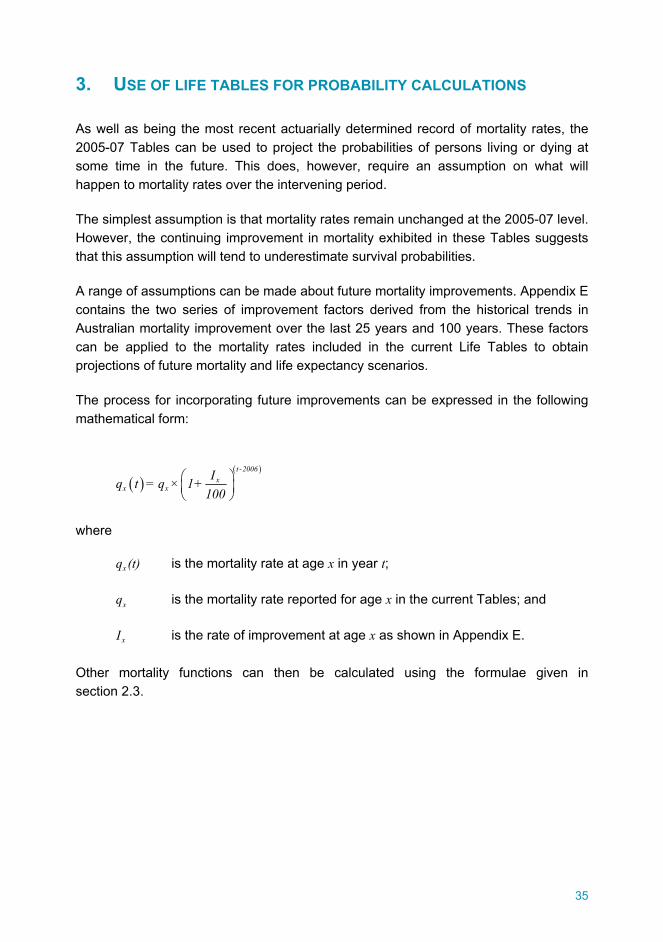
The process for incorporating future improvements can be expressed in the following mathematical form:
( )( )
⎛ ⎞⎜ ⎟⎝ ⎠
t -2006x
x xIq t = q × 1+
100
where
xq (t) is the mortality rate at age x in year t;
xq is the mortality rate reported for age x in the current Tables; and
xI is the rate of improvement at age x as shown in Appendix E.
Other mortality functions can then be calculated using the formulae given in section 2.3.
36
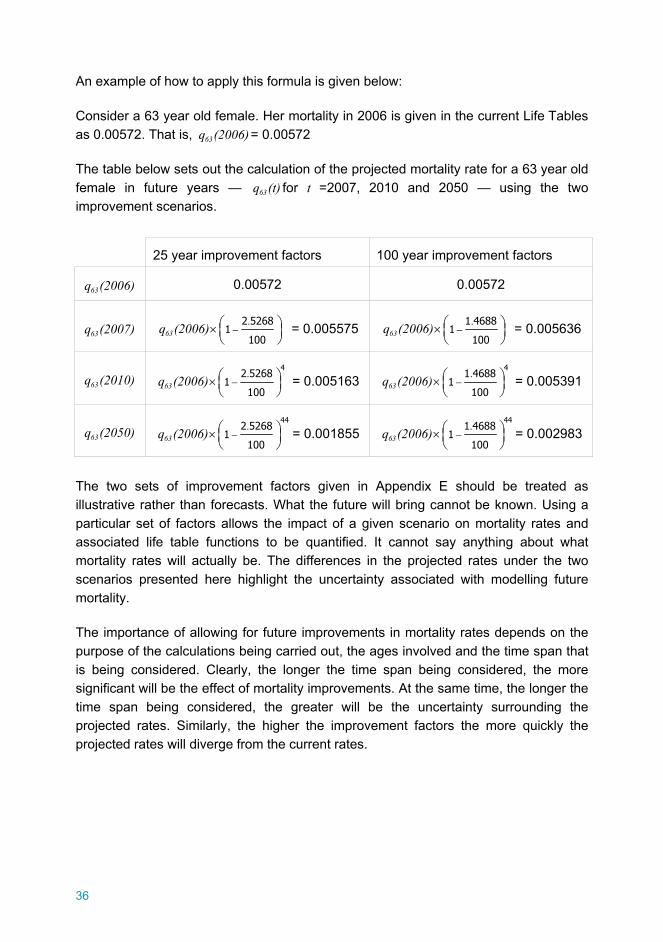
An example of how to apply this formula is given below:
Consider a 63 year old female. Her mortality in 2006 is given in the current Life Tables as 0.00572. That is, 63q (2006)= 0.00572
The table below sets out the calculation of the projected mortality rate for a 63 year old female in future years — 63q (t) for t =2007, 2010 and 2050 — using the two improvement scenarios.
The two sets of improvement factors given in Appendix E should be treated as illustrative rather than forecasts. What the future will bring cannot be known. Using a particular set of factors allows the impact of a given scenario on mortality rates and associated life table functions to be quantified. It cannot say anything about what mortality rates will actually be. The differences in the projected rates under the two scenarios presented here highlight the uncertainty associated with modelling future mortality.
The importance of allowing for future improvements in mortality rates depends on the purpose of the calculations being carried out, the ages involved and the time span that is being considered. Clearly, the longer the time span being considered, the more significant will be the effect of mortality improvements. At the same time, the longer the time span being considered, the greater will be the uncertainty surrounding the projected rates. Similarly, the higher the improvement factors the more quickly the projected rates will diverge from the current rates.
25 year improvement factors 100 year improvement factors
63q (2006) 0.00572 0.00572
63q (2007) .
−⎛ ⎞×⎜ ⎟⎝ ⎠63q (2006) 2 52681
100 = 0.005575 .
−⎛ ⎞×⎜ ⎟⎝ ⎠63q (2006) 1 46881
100 = 0.005636
63q (2010) .−⎛ ⎞×⎜ ⎟
⎝ ⎠63q (2006)4
2 52681
100 = 0.005163 .
−⎛ ⎞×⎜ ⎟⎝ ⎠63q (2006)
41 4688
1100
= 0.005391
63q (2050) .−⎛ ⎞×⎜ ⎟
⎝ ⎠63q (2006)44
2 52681
100= 0.001855 .
−⎛ ⎞×⎜ ⎟⎝ ⎠63q (2006)
441 4688
1100
= 0.002983

Appendices
38
APPENDIX A
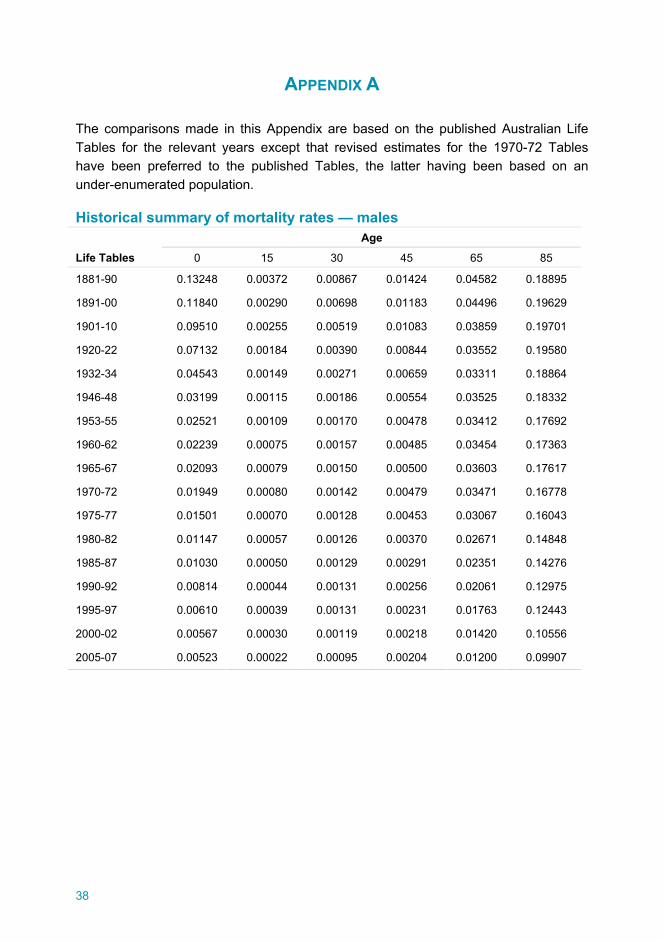
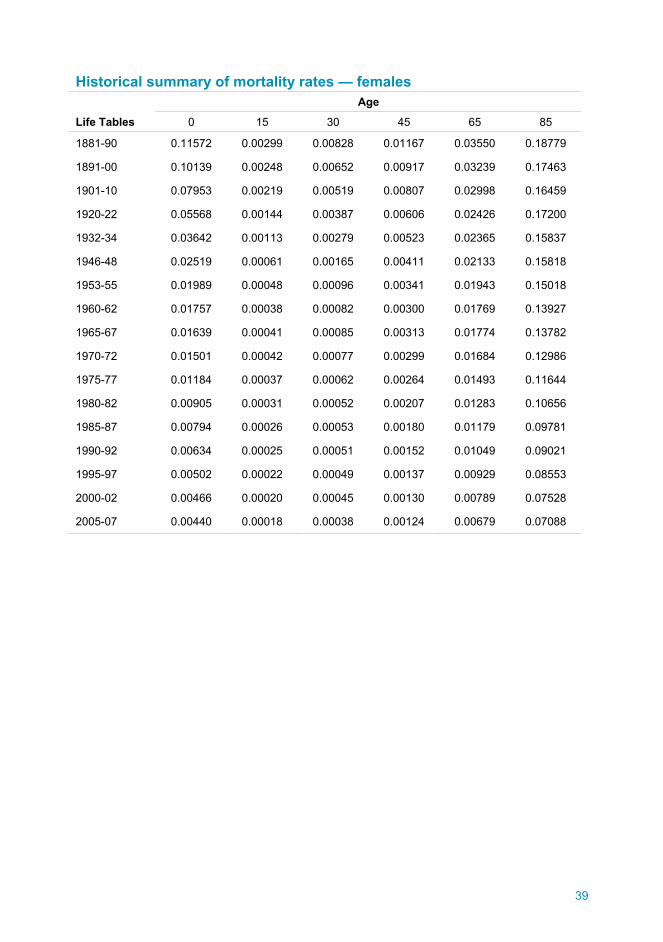
The comparisons made in this Appendix are based on the published Australian Life Tables for the relevant years except that revised estimates for the 1970-72 Tables have been preferred to the published Tables, the latter having been based on an under-enumerated population.
Historical summary of mortality rates — males Age
Life Tables 0 15 30 45 65 85
1881-90 0.13248 0.00372 0.00867 0.01424 0.04582 0.18895
1891-00 0.11840 0.00290 0.00698 0.01183 0.04496 0.19629
1901-10 0.09510 0.00255 0.00519 0.01083 0.03859 0.19701
1920-22 0.07132 0.00184 0.00390 0.00844 0.03552 0.19580
1932-34 0.04543 0.00149 0.00271 0.00659 0.03311 0.18864
1946-48 0.03199 0.00115 0.00186 0.00554 0.03525 0.18332
1953-55 0.02521 0.00109 0.00170 0.00478 0.03412 0.17692
1960-62 0.02239 0.00075 0.00157 0.00485 0.03454 0.17363
1965-67 0.02093 0.00079 0.00150 0.00500 0.03603 0.17617
1970-72 0.01949 0.00080 0.00142 0.00479 0.03471 0.16778
1975-77 0.01501 0.00070 0.00128 0.00453 0.03067 0.16043
1980-82 0.01147 0.00057 0.00126 0.00370 0.02671 0.14848
1985-87 0.01030 0.00050 0.00129 0.00291 0.02351 0.14276
1990-92 0.00814 0.00044 0.00131 0.00256 0.02061 0.12975
1995-97 0.00610 0.00039 0.00131 0.00231 0.01763 0.12443
2000-02 0.00567 0.00030 0.00119 0.00218 0.01420 0.10556
2005-07 0.00523 0.00022 0.00095 0.00204 0.01200 0.09907
39
Historical summary of mortality rates — females Age
Life Tables 0 15 30 45 65 85
1881-90 0.11572 0.00299 0.00828 0.01167 0.03550 0.18779
1891-00 0.10139 0.00248 0.00652 0.00917 0.03239 0.17463
1901-10 0.07953 0.00219 0.00519 0.00807 0.02998 0.16459
1920-22 0.05568 0.00144 0.00387 0.00606 0.02426 0.17200
1932-34 0.03642 0.00113 0.00279 0.00523 0.02365 0.15837
1946-48 0.02519 0.00061 0.00165 0.00411 0.02133 0.15818
1953-55 0.01989 0.00048 0.00096 0.00341 0.01943 0.15018
1960-62 0.01757 0.00038 0.00082 0.00300 0.01769 0.13927
1965-67 0.01639 0.00041 0.00085 0.00313 0.01774 0.13782
1970-72 0.01501 0.00042 0.00077 0.00299 0.01684 0.12986
1975-77 0.01184 0.00037 0.00062 0.00264 0.01493 0.11644
1980-82 0.00905 0.00031 0.00052 0.00207 0.01283 0.10656
1985-87 0.00794 0.00026 0.00053 0.00180 0.01179 0.09781
1990-92 0.00634 0.00025 0.00051 0.00152 0.01049 0.09021
1995-97 0.00502 0.00022 0.00049 0.00137 0.00929 0.08553
2000-02 0.00466 0.00020 0.00045 0.00130 0.00789 0.07528
2005-07 0.00440 0.00018 0.00038 0.00124 0.00679 0.07088
40
Complete expectation of life at selected ages — males Age
Life Tables 0 30 65
1881-90 47.20 33.64 11.06
1891-00 51.08 35.11 11.25
1901-10 55.20 36.52 11.31
1920-22 59.15 38.44 12.01
1932-34 63.48 39.90 12.40
1946-48 66.07 40.40 12.25
1953-55 67.14 40.90 12.33
1960-62 67.92 41.12 12.47
1965-67 67.63 40.72 12.16
1970-72 68.10 41.10 12.37
1975-77 69.56 42.18 13.13
1980-82 71.23 43.51 13.80
1985-87 72.74 44.84 14.60
1990-92 74.32 46.07 15.41
1995-97 75.69 47.26 16.21
2000-02 77.64 49.07 17.70
2005-07 79.02 50.20 18.54
41
Complete expectation of life at selected ages — females Age
Life Tables 0 30 65
1881-90 50.84 36.13 12.27
1891-00 54.76 37.86 12.75
1901-10 58.84 39.33 12.88
1920-22 63.31 41.48 13.60
1932-34 67.14 42.77 14.15
1946-48 70.63 44.08 14.44
1953-55 72.75 45.43 15.02
1960-62 74.18 46.49 15.68
1965-67 74.15 46.34 15.70
1970-72 74.80 46.86 16.09
1975-77 76.56 48.26 17.13
1980-82 78.27 49.67 18.00
1985-87 79.20 50.49 18.56
1990-92 80.39 51.48 19.26
1995-97 81.37 52.30 19.88
2000-02 82.87 53.72 21.15
2005-07 83.67 54.44 21.62
42
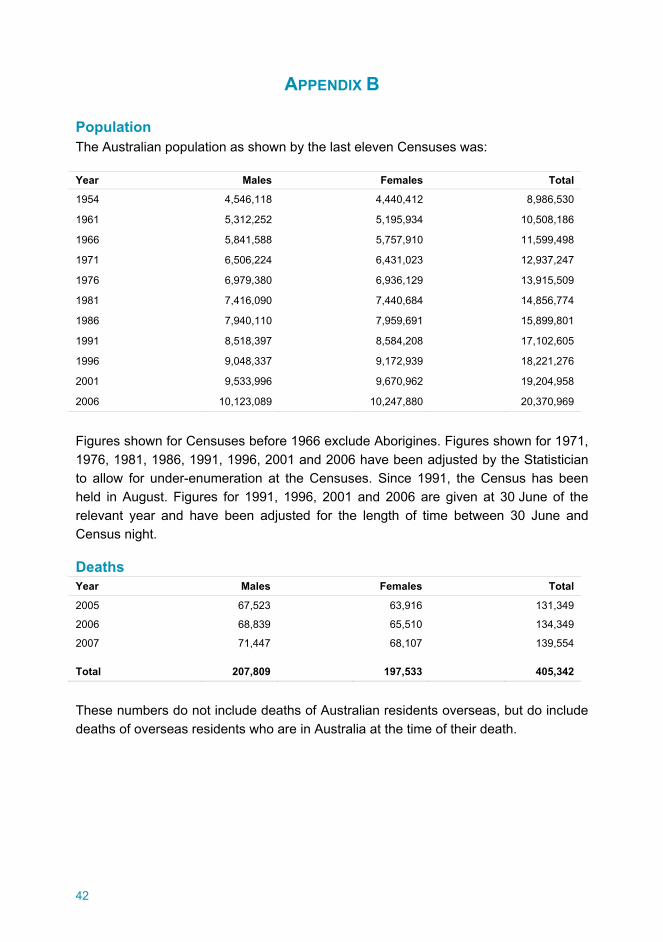
APPENDIX B
Population The Australian population as shown by the last eleven Censuses was:
Year Males Females Total
1954 4,546,118 4,440,412 8,986,530
1961 5,312,252 5,195,934 10,508,186
1966 5,841,588 5,757,910 11,599,498
1971 6,506,224 6,431,023 12,937,247
1976 6,979,380 6,936,129 13,915,509
1981 7,416,090 7,440,684 14,856,774
1986 7,940,110 7,959,691 15,899,801
1991 8,518,397 8,584,208 17,102,605
1996 9,048,337 9,172,939 18,221,276
2001 9,533,996 9,670,962 19,204,958
2006 10,123,089 10,247,880 20,370,969
Figures shown for Censuses before 1966 exclude Aborigines. Figures shown for 1971, 1976, 1981, 1986, 1991, 1996, 2001 and 2006 have been adjusted by the Statistician to allow for under-enumeration at the Censuses. Since 1991, the Census has been held in August. Figures for 1991, 1996, 2001 and 2006 are given at 30 June of the relevant year and have been adjusted for the length of time between 30 June and Census night.
Deaths Year Males Females Total
2005 67,523 63,916 131,349
2006 68,839 65,510 134,349
2007 71,447 68,107 139,554
Total 207,809 197,533 405,342
These numbers do not include deaths of Australian residents overseas, but do include deaths of overseas residents who are in Australia at the time of their death.
43
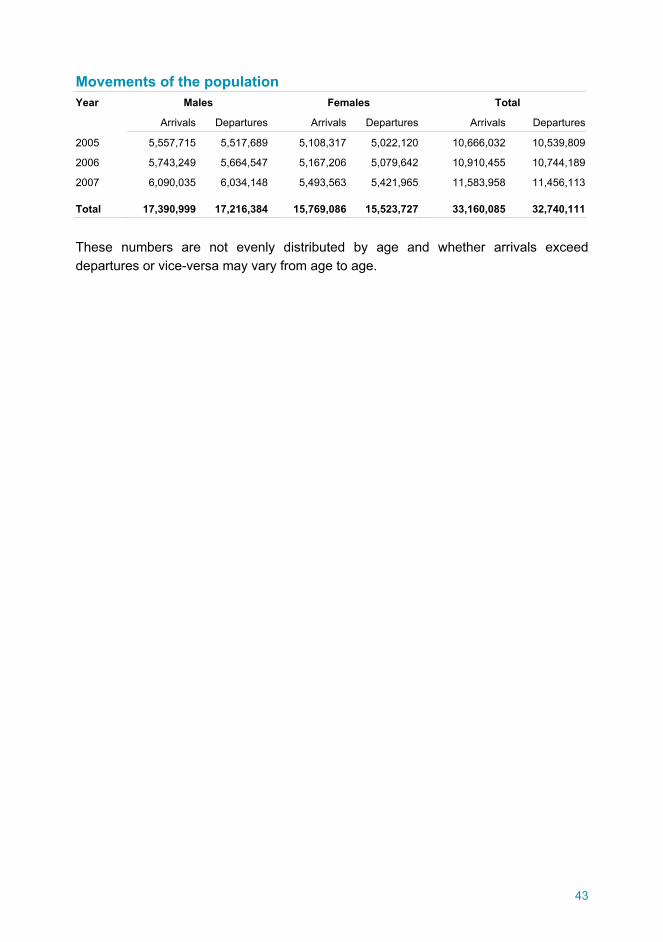
Movements of the population Year Males Females Total
Arrivals Departures Arrivals Departures Arrivals Departures
2005 5,557,715 5,517,689 5,108,317 5,022,120 10,666,032 10,539,809
2006 5,743,249 5,664,547 5,167,206 5,079,642 10,910,455 10,744,189
2007 6,090,035 6,034,148 5,493,563 5,421,965 11,583,958 11,456,113
Total 17,390,999 17,216,384 15,769,086 15,523,727 33,160,085 32,740,111
These numbers are not evenly distributed by age and whether arrivals exceed departures or vice-versa may vary from age to age.
44
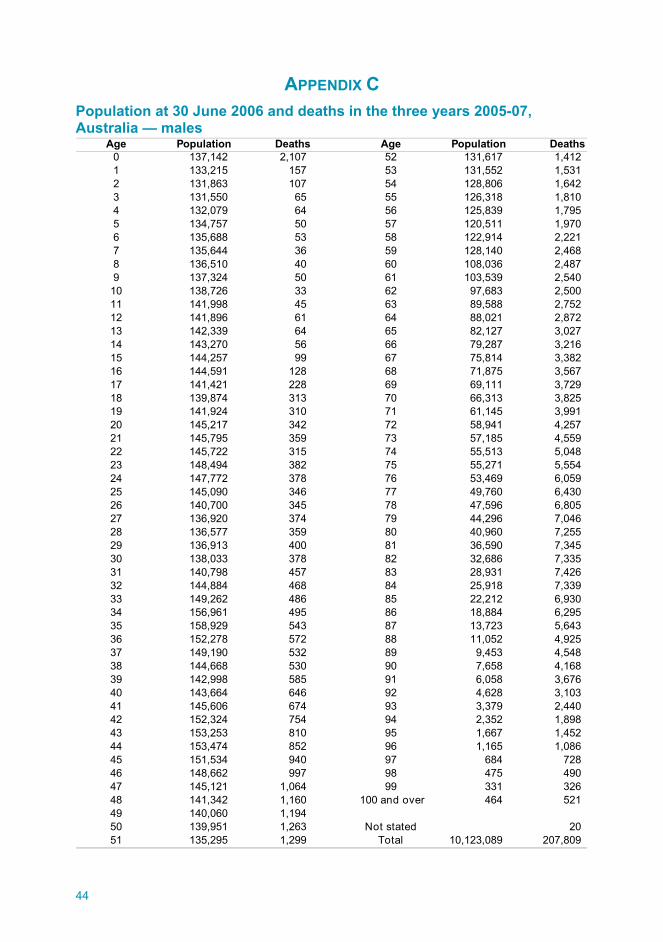
APPENDIX C Population at 30 June 2006 and deaths in the three years 2005-07, Australia — males
Age Population Deaths Age Population Deaths0 137,142 2,107 52 131,617 1,412 1 133,215 157 53 131,552 1,531 2 131,863 107 54 128,806 1,642 3 131,550 65 55 126,318 1,810 4 132,079 64 56 125,839 1,795 5 134,757 50 57 120,511 1,970 6 135,688 53 58 122,914 2,221 7 135,644 36 59 128,140 2,468 8 136,510 40 60 108,036 2,487 9 137,324 50 61 103,539 2,540
10 138,726 33 62 97,683 2,500 11 141,998 45 63 89,588 2,752 12 141,896 61 64 88,021 2,872 13 142,339 64 65 82,127 3,027 14 143,270 56 66 79,287 3,216 15 144,257 99 67 75,814 3,382 16 144,591 128 68 71,875 3,567 17 141,421 228 69 69,111 3,729 18 139,874 313 70 66,313 3,825 19 141,924 310 71 61,145 3,991 20 145,217 342 72 58,941 4,257 21 145,795 359 73 57,185 4,559 22 145,722 315 74 55,513 5,048 23 148,494 382 75 55,271 5,554 24 147,772 378 76 53,469 6,059 25 145,090 346 77 49,760 6,430 26 140,700 345 78 47,596 6,805 27 136,920 374 79 44,296 7,046 28 136,577 359 80 40,960 7,255 29 136,913 400 81 36,590 7,345 30 138,033 378 82 32,686 7,335 31 140,798 457 83 28,931 7,426 32 144,884 468 84 25,918 7,339 33 149,262 486 85 22,212 6,930 34 156,961 495 86 18,884 6,295 35 158,929 543 87 13,723 5,643 36 152,278 572 88 11,052 4,925 37 149,190 532 89 9,453 4,548 38 144,668 530 90 7,658 4,168 39 142,998 585 91 6,058 3,676 40 143,664 646 92 4,628 3,103 41 145,606 674 93 3,379 2,440 42 152,324 754 94 2,352 1,898 43 153,253 810 95 1,667 1,452 44 153,474 852 96 1,165 1,086 45 151,534 940 97 684 728 46 148,662 997 98 475 490 47 145,121 1,064 99 331 326 48 141,342 1,160 100 and over 464 521 49 140,060 1,194 50 139,951 1,263 Not stated 20 51 135,295 1,299 Total 10,123,089 207,809
45
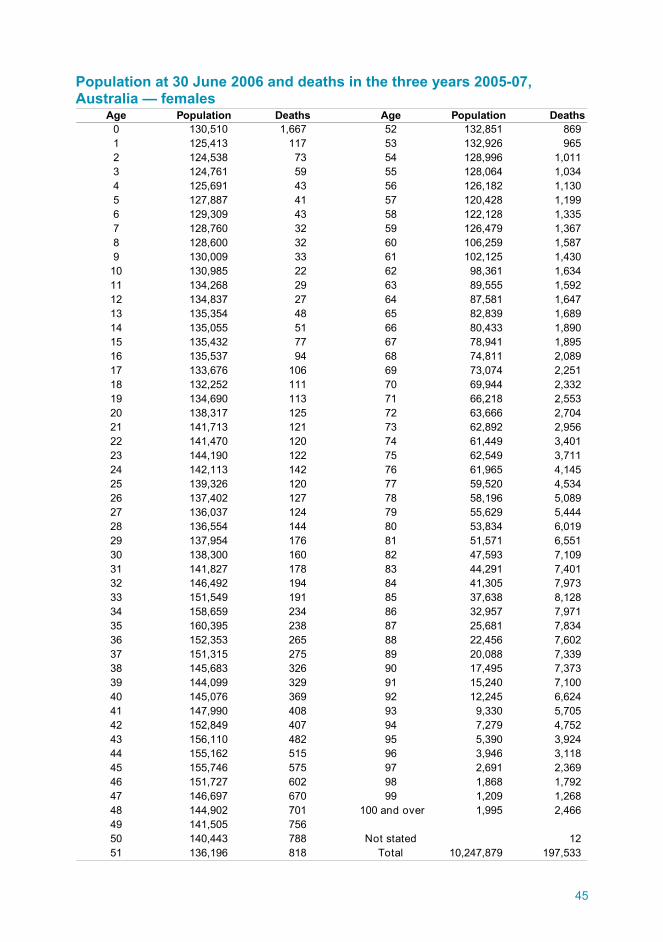
Population at 30 June 2006 and deaths in the three years 2005-07, Australia — females
Age Population Deaths Age Population Deaths0 130,510 1,667 52 132,851 869 1 125,413 117 53 132,926 965 2 124,538 73 54 128,996 1,011 3 124,761 59 55 128,064 1,034 4 125,691 43 56 126,182 1,130 5 127,887 41 57 120,428 1,199 6 129,309 43 58 122,128 1,335 7 128,760 32 59 126,479 1,367 8 128,600 32 60 106,259 1,587 9 130,009 33 61 102,125 1,430
10 130,985 22 62 98,361 1,634 11 134,268 29 63 89,555 1,592 12 134,837 27 64 87,581 1,647 13 135,354 48 65 82,839 1,689 14 135,055 51 66 80,433 1,890 15 135,432 77 67 78,941 1,895 16 135,537 94 68 74,811 2,089 17 133,676 106 69 73,074 2,251 18 132,252 111 70 69,944 2,332 19 134,690 113 71 66,218 2,553 20 138,317 125 72 63,666 2,704 21 141,713 121 73 62,892 2,956 22 141,470 120 74 61,449 3,401 23 144,190 122 75 62,549 3,711 24 142,113 142 76 61,965 4,145 25 139,326 120 77 59,520 4,534 26 137,402 127 78 58,196 5,089 27 136,037 124 79 55,629 5,444 28 136,554 144 80 53,834 6,019 29 137,954 176 81 51,571 6,551 30 138,300 160 82 47,593 7,109 31 141,827 178 83 44,291 7,401 32 146,492 194 84 41,305 7,973 33 151,549 191 85 37,638 8,128 34 158,659 234 86 32,957 7,971 35 160,395 238 87 25,681 7,834 36 152,353 265 88 22,456 7,602 37 151,315 275 89 20,088 7,339 38 145,683 326 90 17,495 7,373 39 144,099 329 91 15,240 7,100 40 145,076 369 92 12,245 6,624 41 147,990 408 93 9,330 5,705 42 152,849 407 94 7,279 4,752 43 156,110 482 95 5,390 3,924 44 155,162 515 96 3,946 3,118 45 155,746 575 97 2,691 2,369 46 151,727 602 98 1,868 1,792 47 146,697 670 99 1,209 1,268 48 144,902 701 100 and over 1,995 2,466 49 141,505 756 50 140,443 788 Not stated 12 51 136,196 818 Total 10,247,879 197,533
46
APPENDIX D Comparison of actual and expected deaths in the three years 2005-2007, Australia — males
Actual ExpectedDeaths Deaths + - + -
2 107 110 3 33 65 72 7 104 64 56 8 25 50 51 1 36 53 47 6 37 36 44 8 58 40 42 2 79 50 41 9 2
10 33 42 9 711 45 45 0 712 61 50 11 413 64 58 6 1014 56 70 14 415 99 97 2 216 128 151 23 2517 228 233 5 3018 313 302 11 1919 310 317 7 2620 342 327 15 1121 359 340 19 822 315 347 32 2423 382 354 28 424 378 362 16 2025 346 367 21 126 345 370 25 2627 374 371 3 2328 359 378 19 4229 400 390 10 3230 378 404 26 5831 457 425 32 2632 468 449 19 733 486 476 10 334 495 506 11 835 543 532 11 336 572 545 27 3037 532 551 19 1138 530 566 36 2539 585 594 9 3440 646 634 12 2241 674 682 8 3042 754 741 13 1743 810 807 3 1444 852 868 16 3045 940 942 2 3246 997 993 4 2847 1064 1042 22 648 1,160 1,109 51 4549 1,194 1,195 1 4450 1,263 1,283 20 2451 1,299 1,350 51 27
AccumulationDeviationAge
47
Comparison of actual and expected deaths in the three years 2005-2007, Australia — males (continued)
Actual ExpectedDeaths Deaths + - + -
52 1,412 1,429 17 4453 1,531 1,536 5 4954 1,642 1,646 4 5355 1,810 1,731 79 2656 1,795 1,858 63 3757 1,970 2,029 59 9658 2,221 2,198 23 7359 2,468 2,348 120 4760 2,487 2,460 27 7461 2,540 2,526 14 8862 2,500 2,652 152 6463 2,752 2,741 11 5364 2,872 2,862 10 4365 3,027 3,045 18 6166 3,216 3,189 27 3467 3,382 3,372 10 2468 3,567 3,572 5 2969 3,729 3,695 34 570 3,825 3,841 16 1171 3,991 3,953 38 2772 4,257 4,232 25 5273 4,559 4,622 63 1174 5,048 5,060 12 2375 5,554 5,548 6 1776 6,059 6,075 16 3377 6,430 6,502 72 10578 6,805 6,767 38 6779 7,046 7,071 25 9280 7,255 7,276 21 11381 7,345 7,267 78 3582 7,335 7,265 70 3583 7,426 7,291 135 17084 7,339 7,237 102 27285 6,930 6,990 60 21286 6,295 6,386 91 12187 5,643 5,779 136 1588 4,925 5,081 156 17189 4,548 4,588 40 21190 4,168 4,142 26 18591 3,676 3,645 31 15492 3,103 3,068 35 11993 2,440 2,428 12 10794 1,898 1,889 9 9895 1,452 1,419 33 6596 1,086 1,017 69 497 728 719 9 1398 490 482 8 2199 326 329 3 18100 224 226 2 16
Total 205,228 205,212
Age Deviation Accumulation
The expected deaths are the number of deaths under the assumption that the graduated rates are correct. Deviation refers to the difference between the actual and expected number of deaths. Accumulation at age x is the sum of the deviations from age 2 to age x. Note that this table only covers the ages for which we can calculate an exposed to risk from the Census data.
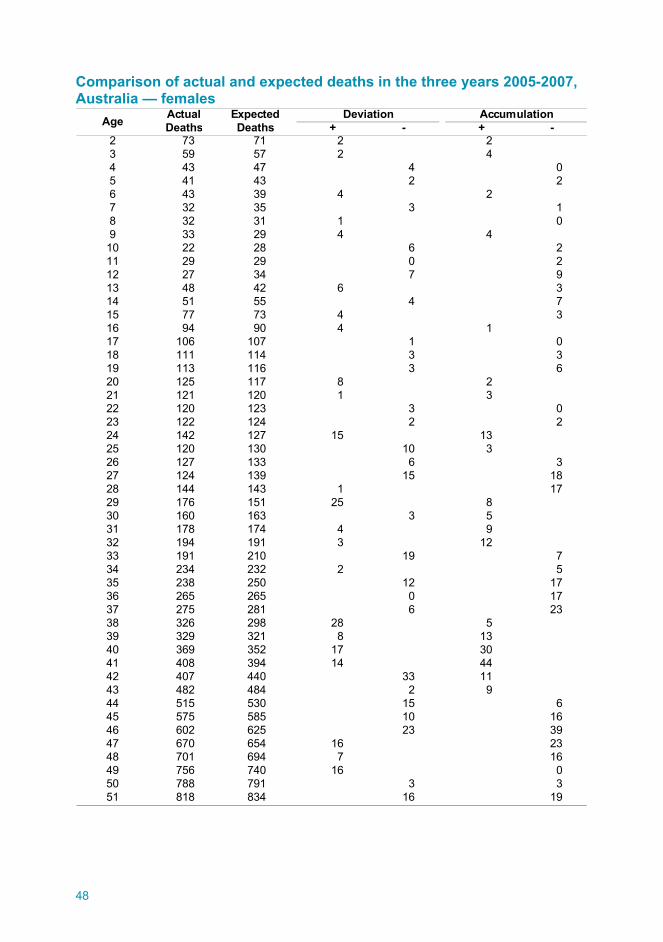
48
Comparison of actual and expected deaths in the three years 2005-2007, Australia — females
Actual ExpectedDeaths Deaths + - + -
2 73 71 2 23 59 57 2 44 43 47 4 05 41 43 2 26 43 39 4 27 32 35 3 18 32 31 1 09 33 29 4 4
10 22 28 6 211 29 29 0 212 27 34 7 913 48 42 6 314 51 55 4 715 77 73 4 316 94 90 4 117 106 107 1 018 111 114 3 319 113 116 3 620 125 117 8 221 121 120 1 322 120 123 3 023 122 124 2 224 142 127 15 1325 120 130 10 326 127 133 6 327 124 139 15 1828 144 143 1 1729 176 151 25 830 160 163 3 531 178 174 4 932 194 191 3 1233 191 210 19 734 234 232 2 535 238 250 12 1736 265 265 0 1737 275 281 6 2338 326 298 28 539 329 321 8 1340 369 352 17 3041 408 394 14 4442 407 440 33 1143 482 484 2 944 515 530 15 645 575 585 10 1646 602 625 23 3947 670 654 16 2348 701 694 7 1649 756 740 16 050 788 791 3 351 818 834 16 19
AccumulationDeviationAge
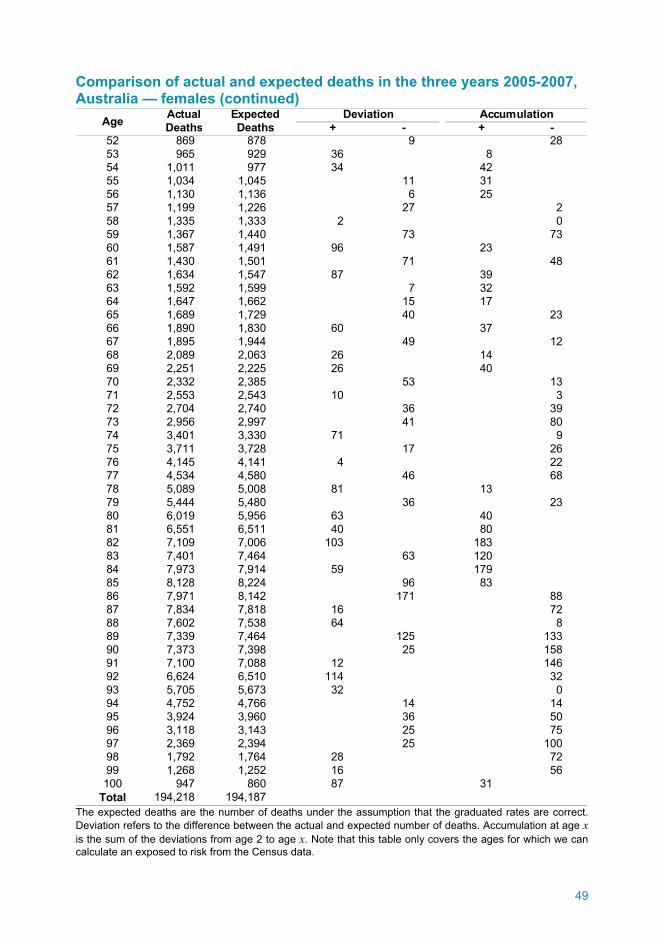
49
Comparison of actual and expected deaths in the three years 2005-2007, Australia — females (continued)
Actual ExpectedDeaths Deaths + - + -
52 869 878 9 2853 965 929 36 854 1,011 977 34 4255 1,034 1,045 11 3156 1,130 1,136 6 2557 1,199 1,226 27 258 1,335 1,333 2 059 1,367 1,440 73 7360 1,587 1,491 96 2361 1,430 1,501 71 4862 1,634 1,547 87 3963 1,592 1,599 7 3264 1,647 1,662 15 1765 1,689 1,729 40 2366 1,890 1,830 60 3767 1,895 1,944 49 1268 2,089 2,063 26 1469 2,251 2,225 26 4070 2,332 2,385 53 1371 2,553 2,543 10 372 2,704 2,740 36 3973 2,956 2,997 41 8074 3,401 3,330 71 975 3,711 3,728 17 2676 4,145 4,141 4 2277 4,534 4,580 46 6878 5,089 5,008 81 1379 5,444 5,480 36 2380 6,019 5,956 63 4081 6,551 6,511 40 8082 7,109 7,006 103 18383 7,401 7,464 63 12084 7,973 7,914 59 17985 8,128 8,224 96 8386 7,971 8,142 171 8887 7,834 7,818 16 7288 7,602 7,538 64 889 7,339 7,464 125 13390 7,373 7,398 25 15891 7,100 7,088 12 14692 6,624 6,510 114 3293 5,705 5,673 32 094 4,752 4,766 14 1495 3,924 3,960 36 5096 3,118 3,143 25 7597 2,369 2,394 25 10098 1,792 1,764 28 7299 1,268 1,252 16 56100 947 860 87 31
Total 194,218 194,187
Age Deviation Accumulation
The expected deaths are the number of deaths under the assumption that the graduated rates are correct. Deviation refers to the difference between the actual and expected number of deaths. Accumulation at age x is the sum of the deviations from age 2 to age x. Note that this table only covers the ages for which we can calculate an exposed to risk from the Census data.
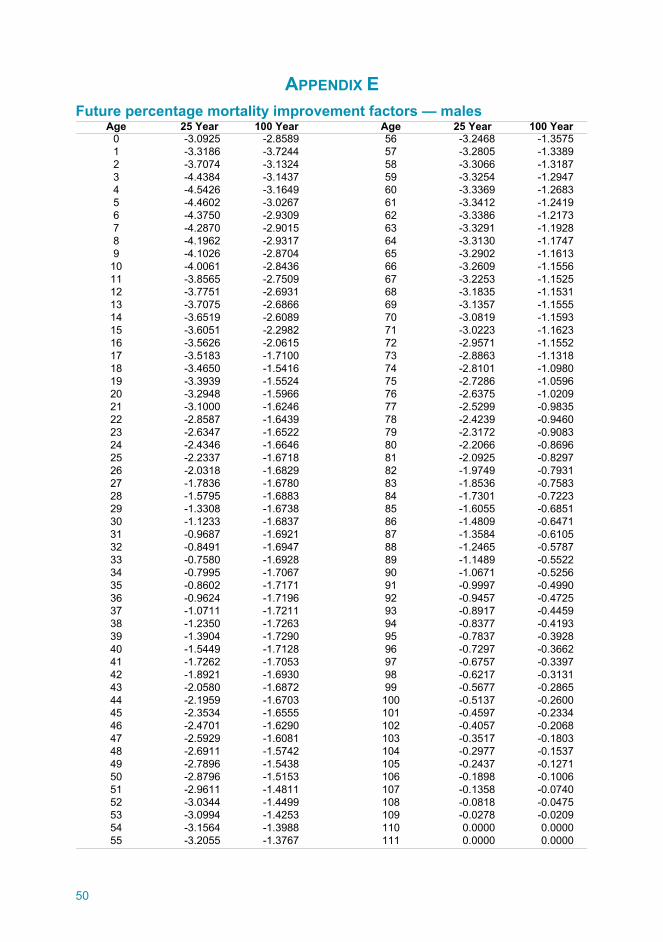
50
APPENDIX E Future percentage mortality improvement factors — males
Age 25 Year 100 Year Age 25 Year 100 Year0 -3.0925 -2.8589 56 -3.2468 -1.35751 -3.3186 -3.7244 57 -3.2805 -1.33892 -3.7074 -3.1324 58 -3.3066 -1.31873 -4.4384 -3.1437 59 -3.3254 -1.29474 -4.5426 -3.1649 60 -3.3369 -1.26835 -4.4602 -3.0267 61 -3.3412 -1.24196 -4.3750 -2.9309 62 -3.3386 -1.21737 -4.2870 -2.9015 63 -3.3291 -1.19288 -4.1962 -2.9317 64 -3.3130 -1.17479 -4.1026 -2.8704 65 -3.2902 -1.1613
10 -4.0061 -2.8436 66 -3.2609 -1.155611 -3.8565 -2.7509 67 -3.2253 -1.152512 -3.7751 -2.6931 68 -3.1835 -1.153113 -3.7075 -2.6866 69 -3.1357 -1.155514 -3.6519 -2.6089 70 -3.0819 -1.159315 -3.6051 -2.2982 71 -3.0223 -1.162316 -3.5626 -2.0615 72 -2.9571 -1.155217 -3.5183 -1.7100 73 -2.8863 -1.131818 -3.4650 -1.5416 74 -2.8101 -1.098019 -3.3939 -1.5524 75 -2.7286 -1.059620 -3.2948 -1.5966 76 -2.6375 -1.020921 -3.1000 -1.6246 77 -2.5299 -0.983522 -2.8587 -1.6439 78 -2.4239 -0.946023 -2.6347 -1.6522 79 -2.3172 -0.908324 -2.4346 -1.6646 80 -2.2066 -0.869625 -2.2337 -1.6718 81 -2.0925 -0.829726 -2.0318 -1.6829 82 -1.9749 -0.793127 -1.7836 -1.6780 83 -1.8536 -0.758328 -1.5795 -1.6883 84 -1.7301 -0.722329 -1.3308 -1.6738 85 -1.6055 -0.685130 -1.1233 -1.6837 86 -1.4809 -0.647131 -0.9687 -1.6921 87 -1.3584 -0.610532 -0.8491 -1.6947 88 -1.2465 -0.578733 -0.7580 -1.6928 89 -1.1489 -0.552234 -0.7995 -1.7067 90 -1.0671 -0.525635 -0.8602 -1.7171 91 -0.9997 -0.499036 -0.9624 -1.7196 92 -0.9457 -0.472537 -1.0711 -1.7211 93 -0.8917 -0.445938 -1.2350 -1.7263 94 -0.8377 -0.419339 -1.3904 -1.7290 95 -0.7837 -0.392840 -1.5449 -1.7128 96 -0.7297 -0.366241 -1.7262 -1.7053 97 -0.6757 -0.339742 -1.8921 -1.6930 98 -0.6217 -0.313143 -2.0580 -1.6872 99 -0.5677 -0.286544 -2.1959 -1.6703 100 -0.5137 -0.260045 -2.3534 -1.6555 101 -0.4597 -0.233446 -2.4701 -1.6290 102 -0.4057 -0.206847 -2.5929 -1.6081 103 -0.3517 -0.180348 -2.6911 -1.5742 104 -0.2977 -0.153749 -2.7896 -1.5438 105 -0.2437 -0.127150 -2.8796 -1.5153 106 -0.1898 -0.100651 -2.9611 -1.4811 107 -0.1358 -0.074052 -3.0344 -1.4499 108 -0.0818 -0.047553 -3.0994 -1.4253 109 -0.0278 -0.020954 -3.1564 -1.3988 110 0.0000 0.000055 -3.2055 -1.3767 111 0.0000 0.0000
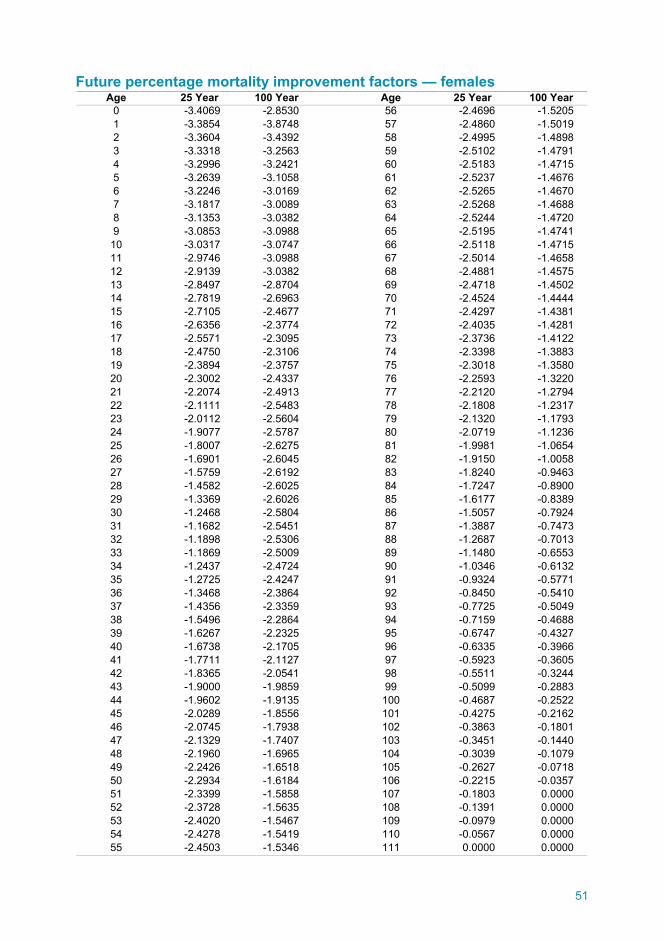
51
Future percentage mortality improvement factors — females Age 25 Year 100 Year Age 25 Year 100 Year
0 -3.4069 -2.8530 56 -2.4696 -1.52051 -3.3854 -3.8748 57 -2.4860 -1.50192 -3.3604 -3.4392 58 -2.4995 -1.48983 -3.3318 -3.2563 59 -2.5102 -1.47914 -3.2996 -3.2421 60 -2.5183 -1.47155 -3.2639 -3.1058 61 -2.5237 -1.46766 -3.2246 -3.0169 62 -2.5265 -1.46707 -3.1817 -3.0089 63 -2.5268 -1.46888 -3.1353 -3.0382 64 -2.5244 -1.47209 -3.0853 -3.0988 65 -2.5195 -1.4741
10 -3.0317 -3.0747 66 -2.5118 -1.471511 -2.9746 -3.0988 67 -2.5014 -1.465812 -2.9139 -3.0382 68 -2.4881 -1.457513 -2.8497 -2.8704 69 -2.4718 -1.450214 -2.7819 -2.6963 70 -2.4524 -1.444415 -2.7105 -2.4677 71 -2.4297 -1.438116 -2.6356 -2.3774 72 -2.4035 -1.428117 -2.5571 -2.3095 73 -2.3736 -1.412218 -2.4750 -2.3106 74 -2.3398 -1.388319 -2.3894 -2.3757 75 -2.3018 -1.358020 -2.3002 -2.4337 76 -2.2593 -1.322021 -2.2074 -2.4913 77 -2.2120 -1.279422 -2.1111 -2.5483 78 -2.1808 -1.231723 -2.0112 -2.5604 79 -2.1320 -1.179324 -1.9077 -2.5787 80 -2.0719 -1.123625 -1.8007 -2.6275 81 -1.9981 -1.065426 -1.6901 -2.6045 82 -1.9150 -1.005827 -1.5759 -2.6192 83 -1.8240 -0.946328 -1.4582 -2.6025 84 -1.7247 -0.890029 -1.3369 -2.6026 85 -1.6177 -0.838930 -1.2468 -2.5804 86 -1.5057 -0.792431 -1.1682 -2.5451 87 -1.3887 -0.747332 -1.1898 -2.5306 88 -1.2687 -0.701333 -1.1869 -2.5009 89 -1.1480 -0.655334 -1.2437 -2.4724 90 -1.0346 -0.613235 -1.2725 -2.4247 91 -0.9324 -0.577136 -1.3468 -2.3864 92 -0.8450 -0.541037 -1.4356 -2.3359 93 -0.7725 -0.504938 -1.5496 -2.2864 94 -0.7159 -0.468839 -1.6267 -2.2325 95 -0.6747 -0.432740 -1.6738 -2.1705 96 -0.6335 -0.396641 -1.7711 -2.1127 97 -0.5923 -0.360542 -1.8365 -2.0541 98 -0.5511 -0.324443 -1.9000 -1.9859 99 -0.5099 -0.288344 -1.9602 -1.9135 100 -0.4687 -0.252245 -2.0289 -1.8556 101 -0.4275 -0.216246 -2.0745 -1.7938 102 -0.3863 -0.180147 -2.1329 -1.7407 103 -0.3451 -0.144048 -2.1960 -1.6965 104 -0.3039 -0.107949 -2.2426 -1.6518 105 -0.2627 -0.071850 -2.2934 -1.6184 106 -0.2215 -0.035751 -2.3399 -1.5858 107 -0.1803 0.000052 -2.3728 -1.5635 108 -0.1391 0.000053 -2.4020 -1.5467 109 -0.0979 0.000054 -2.4278 -1.5419 110 -0.0567 0.000055 -2.4503 -1.5346 111 0.0000 0.0000