Embed Size (px)
Citation preview
MARCH 1993 doc: IEEE 802.11-93/101
IEEE 802.11 802 LAN Access Method for Wireless Physical Medium
DATE: July 12, 1993
AUTHOR: Chandos A. Rypinski,
TITLE:
SUMMARY
Chief Technical Officer LACE, Inc. 655 Redwood Highway #340 Mill Valley, CA 94941 USA
DATA CAPACITY OF RADIO SPECTRUM
Tel: + 01 415 389 6659 Fax: + 01 415 389 6746
E-m: [email protected]
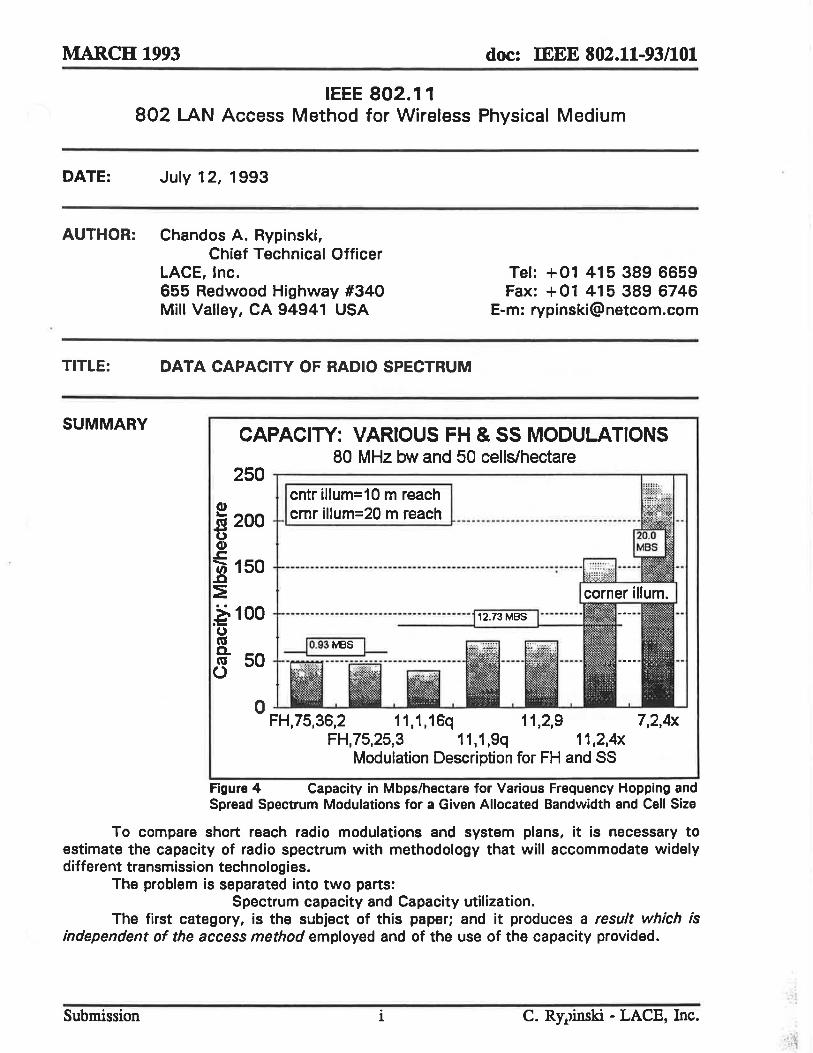
CAPACITY: VARIOUS FH & SS MODULATIONS 80 MHz bw and 50 cells/hectare
250 ~----------------------------~~
CI)
... 200 ~ CI)
.s:::: c;; 150 .c ~
~100 .~
g. 50 U
o
cntr illum=10 m reach cmr iIIum=20 m reach
FH,75,36,2 11,1,16q 11,2,9 7,2,4x FH,75,25,3 11.1,9q 11.2.4x
Modulation Description for FH and SS
Figure 4 Capacity in Mbps/hectare for Various Frequency Hopping and Spread Spectrum Modulations for a Given Allocated Bandwidth and Cell Size
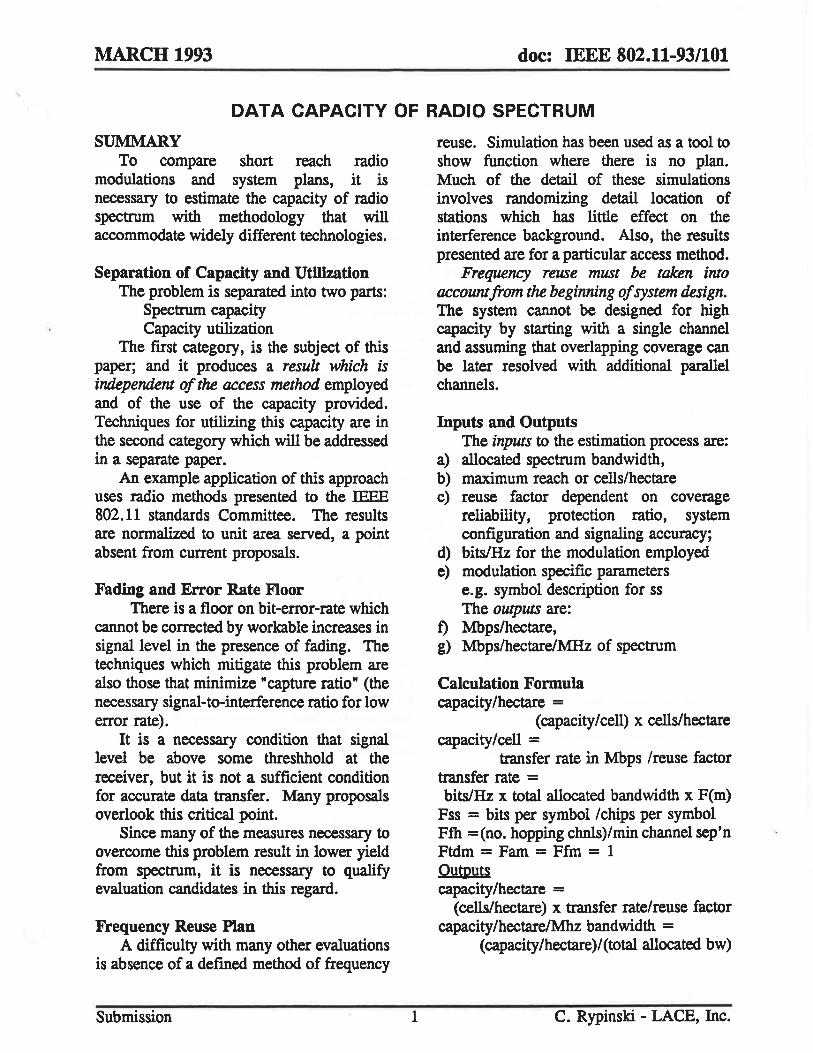
To compare short reach radio modulations and system plans, it is necessary to estimate the capacity of radio spectrum with methodology that will accommodate widely different transmission technologies.
The problem is separated into two parts: Spectrum capacity and Capacity utilization.
The first category, is the subject of this paper; and it produces a result which is independent of the access method employed and of the use of the capacity provided.
Submission i C. RY.t)inski - LACE, Inc.
MARCH 1993 doc: IEEE 802.11-93/101
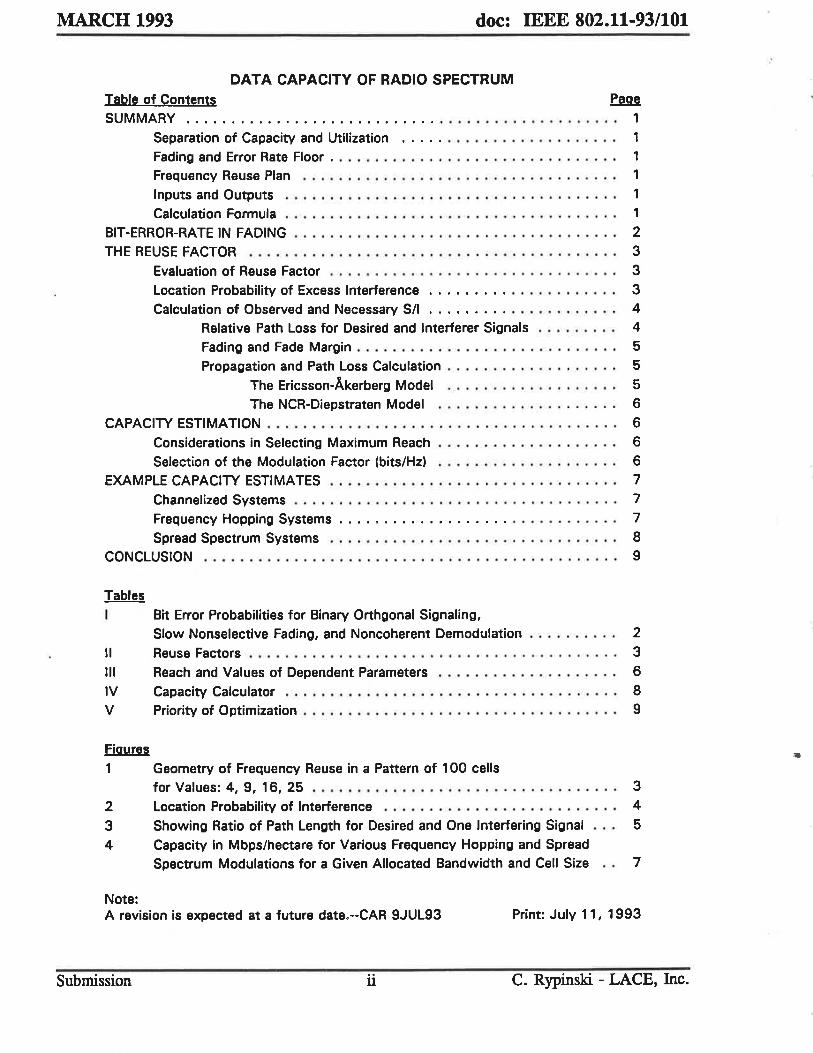
DATA CAPACITY OF RADIO SPECTRUM Table of Contents Page
SUMMARY ............................•..... .............. 1 Separation of Capacity and Utilization ........................ 1 Fading and Error Rate Floor . . . . . . . . . . . . . . . . . . . . . . . . . . . . . . .. 1 Frequency Reuse Plan ................................... 1 Inputs and Outputs ..................................... 1 Calculation Formula . . . . . . . . . . . . . . . . . . . . . . . . . . . . . . . . . . . .. 1
BIT-ERROR-RATE IN FADING. . . . . . . . . . . . . . . . . . . . . . . . . . . . . . . . . . .. 2 THE REUSE FACTOR ......................................... 3
Evaluation of Reuse Factor .. . . . . . . . . . . • . . . . • . . . . • . . . . . . . .. 3
Location Probability of Excess Interference . . . . . . . . . . . . . . . • . . . .. 3 Calculation of Observed and Necessary SII . . . . . . . . . . . . . . . . . . . .. 4
Relative Path Loss for Desired and Interferer Signals ... . . . . .. 4 Fading and Fade Margin . . . . . . . . . . . . . . . . . . . . . . . . . . . .. 5 Propagation and Path Loss Calculation . . . . . . . . . . . . . . . . . .. 5
The Ericsson-Akerberg Model .... ... ... ......... 5 The NCR-Diepstraten Model .................... 6
CAPACITY ESTIMATION . . . . . . . . . . . . . . . . • . . . . . . . . . . . . . . . . . . . . .. 6 Considerations in Selecting Maximum Reach . . . . . . . . . . . . . . . . . . . . 6 Selection of the Modulation Factor (bits/Hz) ...... ....... ....... 6
EXAMPLE CAPACITY ESTIMATES. . . . . . . . . . . . . . . . . . . . . . . . . . . . . . .. 7 Channelized Systems . . . . . . . . . . . • . . . . . . . . . . . . . . . . . . . . . . .. 7 Frequency Hopping Systems . . . . . . . . . . . . . . . . . . . . . • . . . . . . . .. 7
Spread Spectrum Systems ....................... • .....•.. 8 CONCLUSION .............................................. 9
Tables
I
II
III
Bit Error Probabilities for Binary Orthgonal Signaling, Slow Nonselective Fading, and Noncoherent Demodulation 2 Reuse Factors . . . . . . . . . . . . • . . . . . . . . . . . . . • . . . . . . . . . . . . .. 3
Reach and Values of Dependent Parameters ......•.....•....... 6 IV Capacity Calculator ...............•.•. ............ .... .. 8 V Priority of Optimization . . . . . . . • . . . . . . . . . . . . . . . . . . . . . . . . . .. 9
Fiaures
1 Geometry of Frequency Reuse in a Pattern of 100 cells for Values: 4, 9, 16, 25 . . . . . . • • . • . • . . . . . . . . . . . . . . . . . . . . .. 3
2 Location Probability of Interference .......................... 4
3 Showing Ratio of Path Length for Desired and One Interfering Signal . .. 5 4 Capacity in Mbps/hectare for Various Frequency Hopping and Spread
Spectrum Modulations for a Given Allocated Bandwidth and Cell Size .. 7
Note: A revision is expected at a future date.--CAR 9JUL93 Print: July 11, 1993
Submission ii C. Rypinski - LACE, Inc.
MARCH 1993 doc: IEEE 802.11-93/101
DATA CAPACITY OF RADIO SPECTRUM
SUMMARY To compare short reach radio
modulations and system plans, it is necessary to estimate the capacity of radio spectrum with methodology that will accommodate widely different technologies.
Separation of Capacity and Utilization The problem is separated into two parts:
Spectrum capacity Capacity utilization
The first category, is the subject of this paper; and it produces a result which is independent of the access method employed and of the use of the capacity provided. Techniques for utilizing this capacity are in the second category which will be addressed in a separate paper.
An example application of this approach uses radio methods presented to the IEEE 802.11 standards Committee. The results are normalized to unit area served, a point absent from current proposals.
Fading and Error Rate Floor There is a floor on bit-error-rate which
cannot be corrected by workable increases in signal level in the presence of fading. The techniques which mitigate this problem are also those that minimize "capture ratio" (the necessary signal-ta-interference ratio for low error rate).
It is a necessary condition that signal level be above some threshhold at the receiver, but it is not a sufficient condition for accurate data transfer. Many proposals overlook this critical point.
Since many of the measures necessary to overcome this problem result in lower yield from spectrum, it is necessary to qualify evaluation candidates in this regard.
Frequency Reuse Plan A difficulty with many other evaluations
is absence of a defined method of frequency
Submission 1
reuse. Simulation has been used as a tool to show function where there is no plan. Much of the detail of these simulations involves randomizing detail location of stations which has little effect on the interference background. Also, the results presented are for a particular access method.
Frequency reuse must be taken into accountfrom the beginning of system design. The system cannot be designed for high capacity by starting with a single channel and assuming that overlapping coverage can be later resolved with additional parallel channels.
Inputs and Outputs The inputs to the estimation process are:
a) allocated spectrum bandwidth, b) maximum reach or cells/hectare c) reuse factor dependent on coverage
reliability, protection ratio, system configuration and signaling accuracy;
d) bits/Hz for the modulation employed e) modulation specific parameters
e.g. symbol description for ss The outputs are:
f) Mbps/hectare, g) MbpS/hectare/MHz of spectrum
Calculation Formula capacity/hectare =
(capacity/cell) x cells/hectare capacity/cell =
transfer rate in Mbps /reuse factor transfer rate = bits/Hz x total allocated bandwidth x F(m)
Fss = bits per symbol/chips per symbol Ffh =(no. hopping chnls)/min channel sep'n Ftdm = Fam = Ffm = 1 Outputs capacity/hectare =
(cells/hectare) x transfer rate/reuse factor capacity/hectare/Mhz bandwidth =
(capacity/hectare)/(total allocated bw)
C. Rypinski - LACE, Inc.
MARCH 1993
BIT-ERROR-RATE IN FADING Fading of the desired signal is commonly
described by the following probability distributions :
Rician: for short optical paths Rayleigh: for cluttered semi-optical paths log-normal: for large obstacle shadowing
Of these, Rician is less severe, Rayleigh is the most common, and log-normal is used only for area coverage probability.
doc: IEEE 802.11-93/101
The magnitude (standard deviation) of Rician and Rayleigh probabilities is lower for wider bandwidth signals, because the fades are then frequency selective degrading only a fraction of the channel width. The advantage of direct sequence spread-spectrum signal bandwidths of 40 MHz or more shows up as reduced fade margin relative to slow symbol rate narrowband modulations.
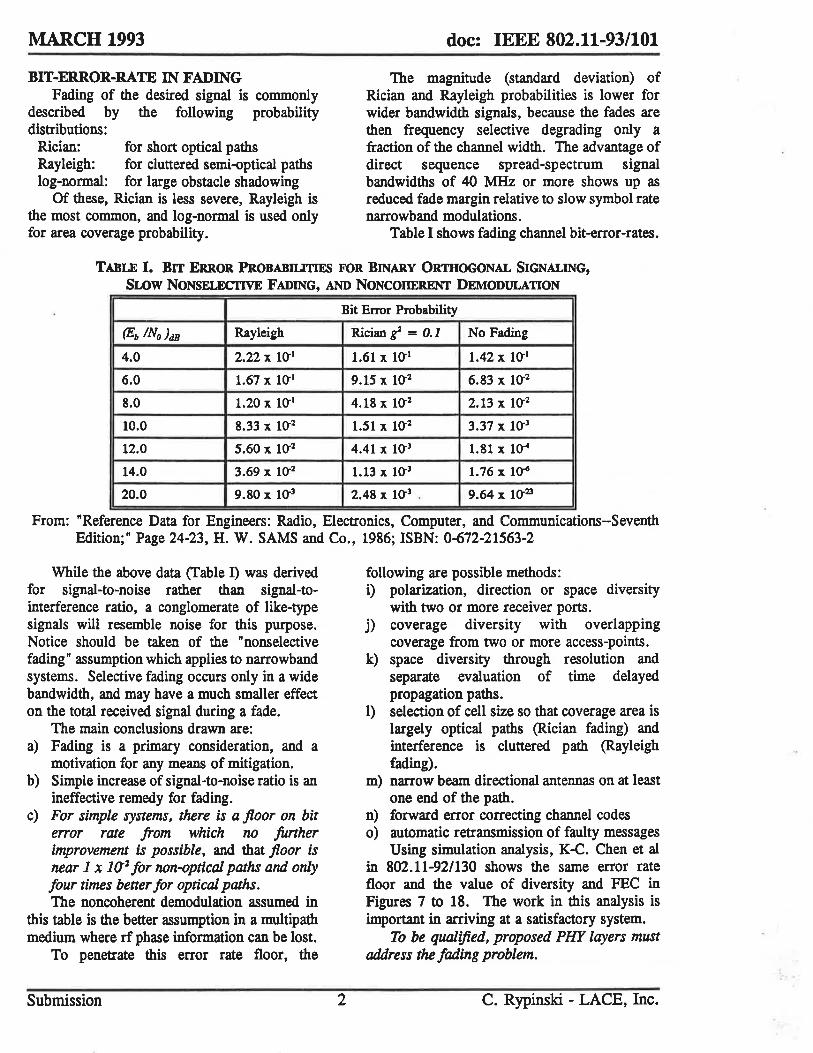
Table I shows fading channel bit-error-rates.
TABLE I. BIT ERROR PROBABILITIES FOR BINARY ORTIIOGONAL SIGNALING, SLOW NONSELECfIVE FADING, AND NONCOHERENT DEMODULATION
Bit Error Probability
(Eb INo).m Rayleigh Rician r = 0.1 No Fading
4.0 2.22 x 1001 1.61 X 1001 1.42 X 10"1
6.0 1.67 X 10"1 9.15x 10"2 6.83 x 10"2
8.0 1.20 X 10"1 4.18 X 10"2 2.13 X 10"2
10.0 8.33 X 10"2 1.51 x 10"2 3.37 X 10"3
12.0 5.60 x 10"2 4.41 X 10"3 1.81 x lQ"4
14.0 3.69 x 1002 1.13 X 10"3 1.76 x lQ"6
20.0 9.80 x 10"3 2.48 X 10"3 . 9.64 X 10"23
From: "Reference Data for Engineers: Radio, Electronics, Computer, and Communications-Seventh Edition;" Page 24-23, H. W. SAMS and Co., 1986; ISBN: 0-672-21563-2
While the above data (Table I) was derived for signal-to-noise rather than signal-tointerference ratio, a conglomerate of like-type signals will resemble noise for this purpose. Notice should be taken of the "nonselective fading" assumption which applies to narrowband systems. Selective fading occurs only in a wide bandwidth, and may have a much smaller effect on the total received signal during a fade.
The main conclusions drawn are: a) Fading is a primary consideration, and a
motivation for any means of mitigation. b) Simple increase of signal-to-noise ratio is an
ineffective remedy for fading. c) For simple systems, there is a floor on bit
error rate from which no funher improvement is possible, and that floor is near 1 x 10"2 for non-optical paths and only four times better for optical paths. The noncoherent demodulation assumed in
this table is the better assumption in a multipath medium where rf phase information can be lost.
To penetrate this error rate floor, the
Submission 2
following are possible methods: i) polarization, direction or space diversity
with two or more receiver ports. j) coverage diversity with overlapping
coverage from two or more access-points. k) space diversity through resolution and
separate evaluation of time delayed propagation paths.
1) selection of cell size so that coverage area is largely optical paths (Rician fading) and interference is cluttered path (Rayleigh fading).
m) narrow beam directional antennas on at least one end of the path.
n) forward error correcting channel codes 0) automatic retransmission of faulty messages
Using simulation analysis, K-C. Chen et al in 802.11-92/130 shows the same error rate floor and the value of diversity and FEC in Figures 7 to 18. The work in this analysis is important in arriving at a satisfactory system.
To be qualified, proposed PHY layers must address the fading problem.
c. Rypinski - LACE, Inc.
MARCH 1993
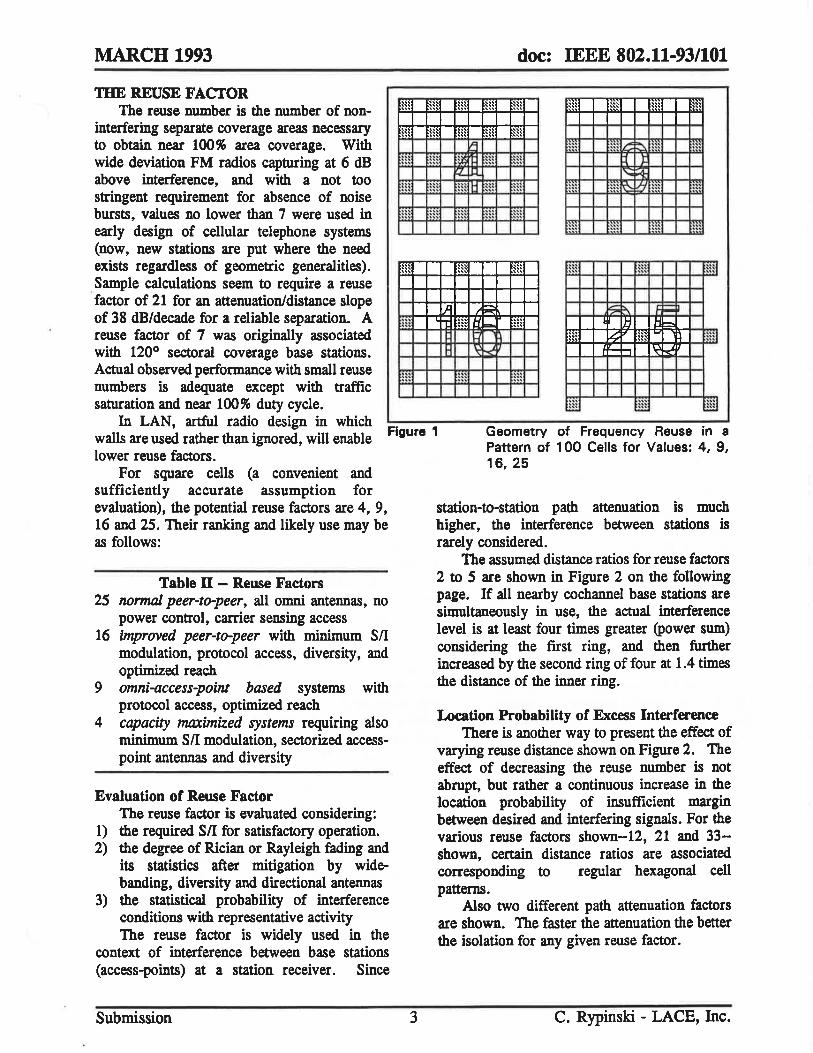
TIlE REUSE FACTOR The reuse number is the number of non
interfering separate coverage areas necessary to obtain near 100% area coverage. With wide deviation FM radios capturing at 6 dB above interference, and with a not too stringent requirement for absence of noise bursts, values no lower than 7 were used in early design of cellular telephone systems (now, new stations are put where the need exists regardless of geometric generalities). Sample calculations seem to require a reuse
. factor of 21 for an attenuation/distance slope of 38 dB/decade for a reliable separation. A reuse factor of 7 was originally associated with 1200 sectoral coverage base stations. Actual observed performance with small reuse numbers is adequate except with traffic saturation and near 100% duty cycle.
~~~
:U
~~~
U:·
'"
ii:
... ~~t
::~
H~
:::
~~~
:~:
'"
IJ h: ~
II
~~: :~:
!H :!: ~
!:l! rt:I ~~1
~ U1 !~~ ff ~H
~~: ~~:
iii
;;;: iHll b.
n ~ h::'
~~~
doc: IEEE 802.11-93/101
::: ~~: ~~~ ~~~ :~~
::: :::IL:;: ~::: ~~~ ...
~:~ ~ I~~
~!~ .. ~::~~ ~:: :!:
". ~~:
" .
Hi :~: ~~~ li:!
~~ for;;;;;;; I 11:1 tJ b ...
~t~
iii ~ m ...... ~ 1m Ir-b I~ R
~~~
In LAN, artful radio design in which Figure 1 walls are used rather than ignored, will enable Geometry of Frequency Reuse in a
Pattern of 100 Cells for Values: 4, 9, 16,25 lower reuse factors.
For square cells (a convenient and sufficiently accurate assumption for evaluation), the potential reuse factors are 4, 9, 16 and 25. Their ranking and likely use may be as follows:
Table n - Reuse Factors 25 normal peer-to-peer, all omni antennas, no
power control, carrier sensing access 16 improved peer-to-peer with minimum SII
modulation, protocol access, diversity, and optimized reach
9 omni-access-point based systems with protocol access, optimized reach
4 capacity maximized systems requiring also minimum SII modulation, sectorized accesspoint antennas and diversity
Evaluation of Reuse Factor The reuse factor is evaluated considering:
1) the required SII for satisfactory operation. 2) the degree of Rician or Rayleigh fading and
its statistics after mitigation by widebanding, diversity and directional antennas
3) the statistical probability of interference conditions with representative activity The reuse factor is widely used in the
context of interference between base stations (access-points) at a station receiver. Since
Submission 3
station-to-station path attenuation is much higher, the interference between stations is rarely considered.
The assumed distance ratios for reuse factors 2 to 5 are shown in Figure 2 on the following page. If all nearby cochannel base stations are simultaneously in use, the actual interference level is at least four times greater (power sum) considering the first ring, and then further increased by the second ring of four at 1.4 times the distance of the inner ring.
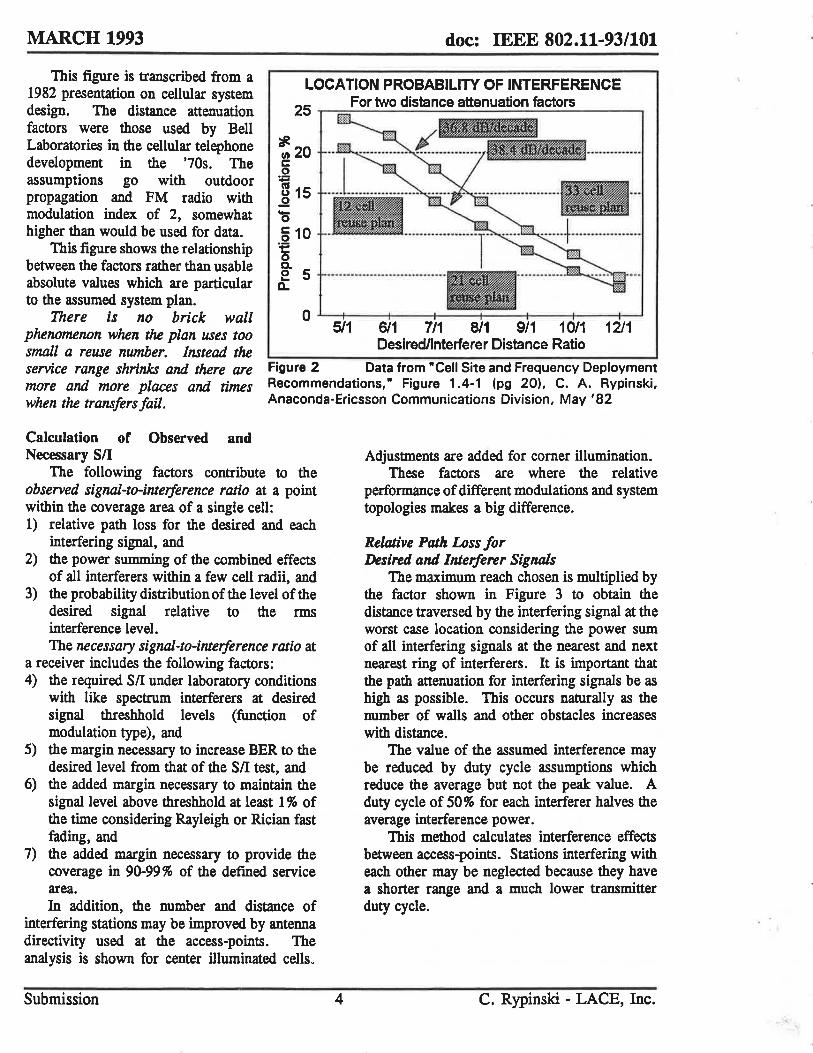
Location Probability of Excess Interference There is another way to present the effect of
varying reuse distance shown on Figure 2.. The effect of decreasing the reuse number IS not abrupt, but rather a continuous increase in ~e location probability of insufficient margm between desired and interfering signals. For the various reuse factors shown-12, 21 and 33-shown, certain distance ratios are associated corresponding to regular hexagonal cell patterns.
Also two different path attenuation factors are shown. The faster the attenuation the better the isolation for any given reuse factor.
C. Rypinski - LACE, Inc.
MARCH 1993 doc: IEEE 802.11-93/101
This figure is transcribed from a 1982 presentation on cellular system design. The distance attenuation factors were those used by Bell Laboratories in the cellular telephone development in the '70s. The assumptions go with outdoor propagation and FM radio with modulation index of 2, somewhat higher than would be used for data.
LOCATION PROBABILITY OF INTERFERENCE For two distance attenuation factors 25 ~~--~--~~~~~----------~
~20 c o :g
rJ15 .2 '0 510 ~ 0.
This figure shows the relationship between the factors rather than usable absolute values which are particular to the assumed system plan.
e 5 .......................... . a..
There is no brick wall phenomenon when the plan uses too small a reuse number. Instead the service range shrinks and there are more and more places and times when the transfers fail.
o ~~--~----;---~----;---~----;-~ 511 6/1 7/1 811 9/1 10/1 1211
Desiredllnterferer Distance Ratio
Figure 2 Data from" Cell Site and Frequency Deployment Recommendations," Figure 1.4-1 (pg 20), C. A. Rypinski, Anaconda-Ericsson Communications Division, May' 82
Calculation or Observed and Necessary SII
The following factors contribute to the observed signal-ta-interference ratio at a point within the coverage area of a single cell: 1) relative path loss for the desired and each
interfering signal, and 2) the power summing of the combined effects
of all interferers within a few cell radii, and 3) the probability distribution of the level of the
desired signal relative to the rms interference level. The necessary signal-to-interference ratio at
a receiver includes the following factors: 4) the required SII under laboratory conditions
with like spectrum interferers at desired signal threshhold levels (function of modulation type), and
5) the margin necessary to increase BER to the desired level from that of the SII test, and
6) the added margin necessary to maintain the signal level above threshhold at least 1 % of the time considering Rayleigh or Rician fast fading, and
7) the added margin necessary to provide the coverage in 90-99 % of the defined service area. In addition, the number and distance of
interfering stations may be improved by antenna directivity used at the access-points. The analysis is shown for center illuminated cells.
Submission 4
Adjustments are added for corner illumination. These factors are where the relative
performance of different modulations and system topologies makes a big difference.
RelDtive Path Loss for Desired and Interferer Signals
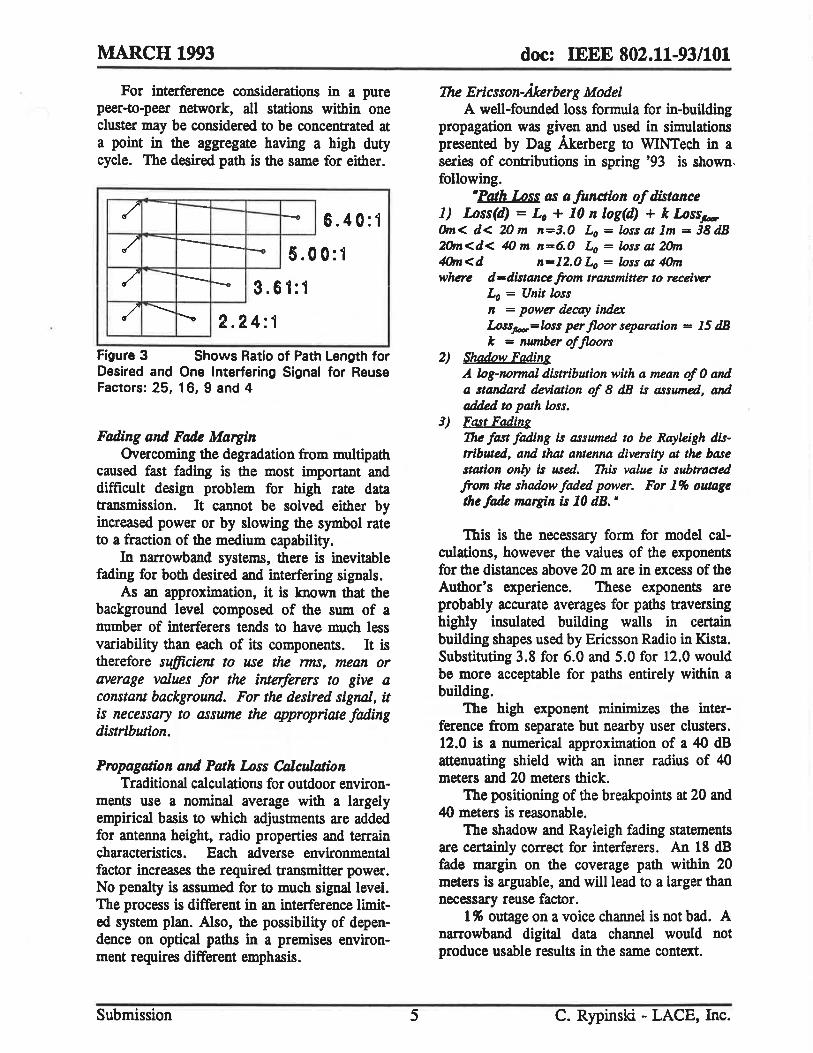
The maximum reach chosen is multiplied by the factor shown in Figure 3 to obtain the distance traversed by the interfering signal at the worst case location considering the power sum of all interfering signals at the nearest and next nearest ring of interferers. It is important that the path attenuation for interfering signals be as high as possible. This occurs naturally as the number of walls and other obstacles increases with distance.
The value of the assumed interference may be reduced by duty cycle assumptions which reduce the average but not the peak value. A duty cycle of 50 % for each interferer halves the average interference power.
This method calculates interference effects between access-points. Stations interfering with each other may be neglected because they have a shorter range and a much lower transmitter duty cycle.
C. Rypinski - LACE, Inc.
MARCH 1993
For interference considerations in a pure peer-to-peer network, all stations within one cluster may be considered to be concentrated at a point in the aggregate having a high duty cycle. The desired path is the same for either.
6.40: 1 r-~~~~~----~-----+----~
5.00:1 r-~~-4----~----~----~
3.61:1 t-----..Io~-I-------+-------l
2.24:1
Figure 3 Shows Ratio of Path Length for Desired and One Interfering Signal for Reuse Factors: 25, 16, 9 and 4
Fading and Fade Margin Overcoming the degradation from multipath
caused fast fading is the most important and difficult design problem for high rate data transmission. It cannot be solved either by increased power or by slowing the symbol rate to a fraction of the medium capability.
In narrowband systems, there is inevitable fading for both desired and interfering signals.
As an approximation, it is known that the background level composed of the sum of a number of interferers tends to have much less variability than each of its components. It is therefore sufficient to use the rms, mean or average values for the interferers to give a constant background. For the desired signal, it is necessary to assume the appropriate fading distribution.
Propagation and Path Loss CDlculation Traditional calculations for outdoor environ
ments use a nominal average with a largely empirical basis to which adjustments are added for antenna height, radio properties and terrain characteristics. Each adverse environmental factor increases the required transmitter power. No penalty is assumed for to much signal level. The process is different in an interference limited system plan. Also, the possibility of dependence on optical paths in a premises environment requires different emphasis.
Submission 5
doc: IEEE 802.11-93/101
The Ericsson-Akerberg Model A well-founded loss formula for in-building
propagation was given and used in simulations presented by ])ag llkerberg to VVI~ech in a series of contributions in spring '93 is shown, following.
"Path Loss as a function of distance 1) Loss(d) = L, + 10 n log(d) + k Loss~ tma< d< 20 m n-3.0 La = loss at 1m = 38 dB 2tma<d< 40 m n=6.0 La = loss at 20m 4Om<d n-12.0 La = loss at 40m where d -distance from transmitter to receiver
La = Unit loss n = power decay index Lossj/oor-loss per floor separation - lS dB k - number of floors
2) Shadow Fading A. log-normal distribution with a mean of 0 and a standard deviation of 8 dB is assumed, and adUd to path loss.
3) Fast Fading 'I'M fast fading is assumed to be Rayleigh distributed, and that antenna diversity at the base station only is used. This value is subtracted from the shadow faded power. For 1 % outage the fath margin is 10 dB. •
This is the necessary form for model calculations, however the values of the exponents for the distances above 20 m are in excess of the Author's experience. These exponents are probably accurate averages for paths traversing highly insulated building walls in certain building shapes used by Ericsson Radio in Kista. Substituting 3.8 for 6.0 and 5.0 for 12.0 would be more acceptable for paths entirely within a building.
The high exponent minimizes the interference from separate but nearby user clusters. 12.0 is a numerical approximation of a 40 dB attenuating shield with an inner radius of 40 meters and 20 meters thick.
The positioning of the breakpoints at 20 and 40 meters is reasonable.
The shadow and Rayleigh fading statements are certainly correct for interferers. An 18 dB fade margin on the coverage path within 20 meters is arguable, and will lead to a larger than necessary reuse factor.
1 % outage on a voice channel is not bad. A narrowband digital data channel would not produce usable results in the same context.
C. Rypinski - LACE, Inc.
MARCH 1993
The NCR-Diepstraten Model The NCR simulation model results presented
in IEEE 802.11-92/51 showed that two clusters of users had to be spaced 10 cluster radii to provide 90% of the total capacity of two clusters. This indicates that a reuse factor of at least 25 would be required for the conditions assumed.
This model assumed that sufficient signalstrength was a measure of low error rate. If this is true, it would be because of skill in implementing the spread spectrum modulation and demodulation; and the conclusion could not be validly extrapolated to slow frequency hopping.
doc: IEEE 802.11-93/101
6. (Frequency hopping only) Number ofhopping channels and number of available channels derived from minimum separation between independently usable channels by unrelated nearby stations. From these inputs, the maximum number of available channel patterns and the number of patterns per coverage are derived. From these inputs a number of necessary
derived values are found including the area of a discrete coverage (now called "cell"), and the fraction of the available bandwidth capacity which can be assigned to each cell.
Considerations in Selecting Maximum Reach The shorter the reach, the higher the
CAPACITY ESTIMATION capacity and the easier the radio function. Cost The necessary inputs ("givens") are: of infrastructure may increase with larger
1. Allocated system spectrum bandwidth (MHz) numbers of access-points per hectare for an 2. Maximum reach (from illumination point to infrastructure based system. Since access-points
diagonal comer of square cell) may be more powerful and complex for longer 3. Reuse factor - number of non-interfering reach and increased multipath, this is not an
independent coverage areas (often separate obvious cost tradeoff. channels) necessary for continuous area The first break in the distance vs. attenuation coverage relationship (this is 20 meters in the Akerberg
4. Modulation factor in bitslHz of: model presented to WINTech) is a good fIrst a. frequency separation between adjacent choice for reach. At this range, the more distant
but independently usable channels, or interfering signals will be attenuated at a higher b. bandwidth in which energy radiation in rate than the desired signal.
an adjacent channel is just within limits Once the maximum reach is selected, the including benefIt from use of quadrature dimensions of the cell are determined. Use of phase comer illumination of cells is an option doubling
5. (Spread spectrum) Length of symbol in the reach required for a given service area. The chips and the number of bits transferred per longer reach is compensated by antenna gain. symbol from which the data throughput rate Shown following are the relationships is derived. . between reach and other dependent parameters.
Table m - Reach and Values or Dependent Parameters
Reach-meters Reach-meters Cell dimension Cell dimension No. of Cells Center Illum. Comer ilIum. Side length-m Area-m2 per hectare
7.07 14.14 10 100 100
10 20 14.4 200 50
14.14 28.8 20 400 25
20 40 28.8 800 12.5
28.8 57.6 40 1600 6.25 Note: Boldface value, uted In cxamp C cVlluaUOQ
Selection or the Modulation Factor out-of-band radiation. In this estimate, a) and b) are not significant. The necessary bandwidth is that where the level of interference created for
The bits per Hz value may be associated with the limiting n db down bandwidth of the
Submission 6 C. Rypinski - LACE, Inc.
MARCH 1993
other users is acceptable considering the spectrum of the transmitting station and the topology in which it is used.
.A. smaller required margin against like-type signals (capture ratio) is an important property of a desirable modulation. Two-level modulations have overall advantage against multi-level modulations for this reason.
Examples of commonly considered digital modulations are: a) 4CPFSK, b) GMSK, c) OQPSK and 2QAM or BPSK ranging from. 7 to 1.8 for this factor. Newer proposals offering improvements in bitslHz would be in the high end of this range.
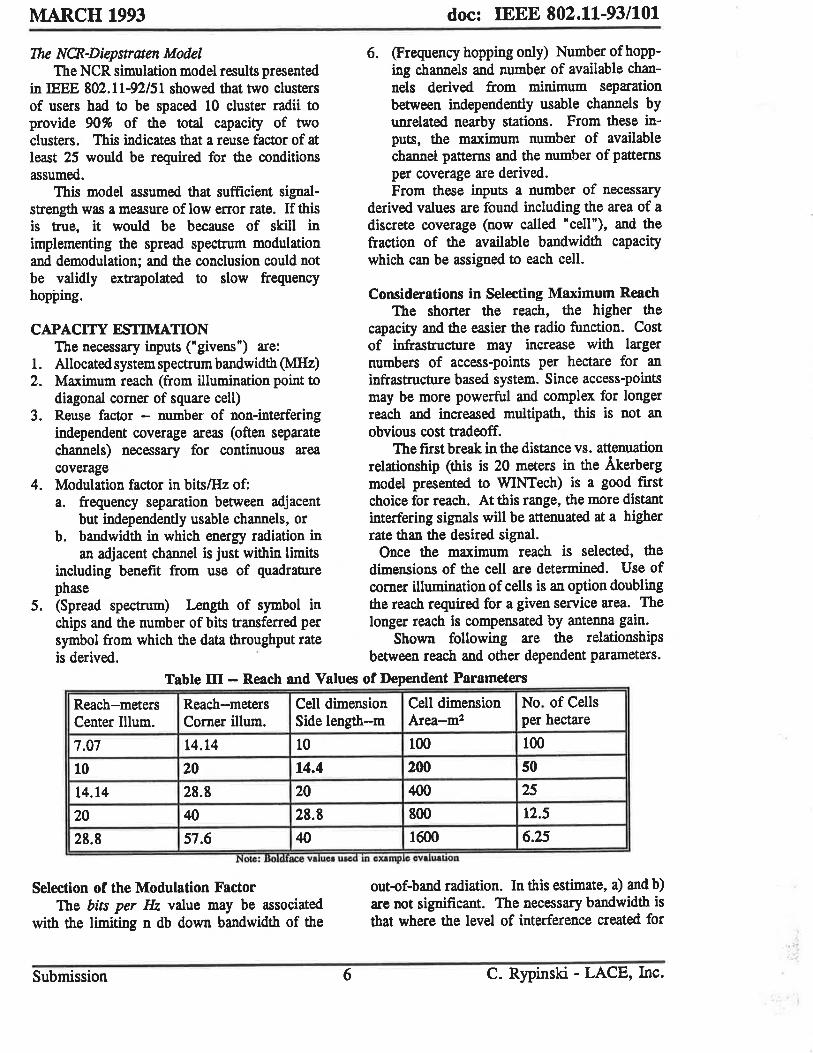
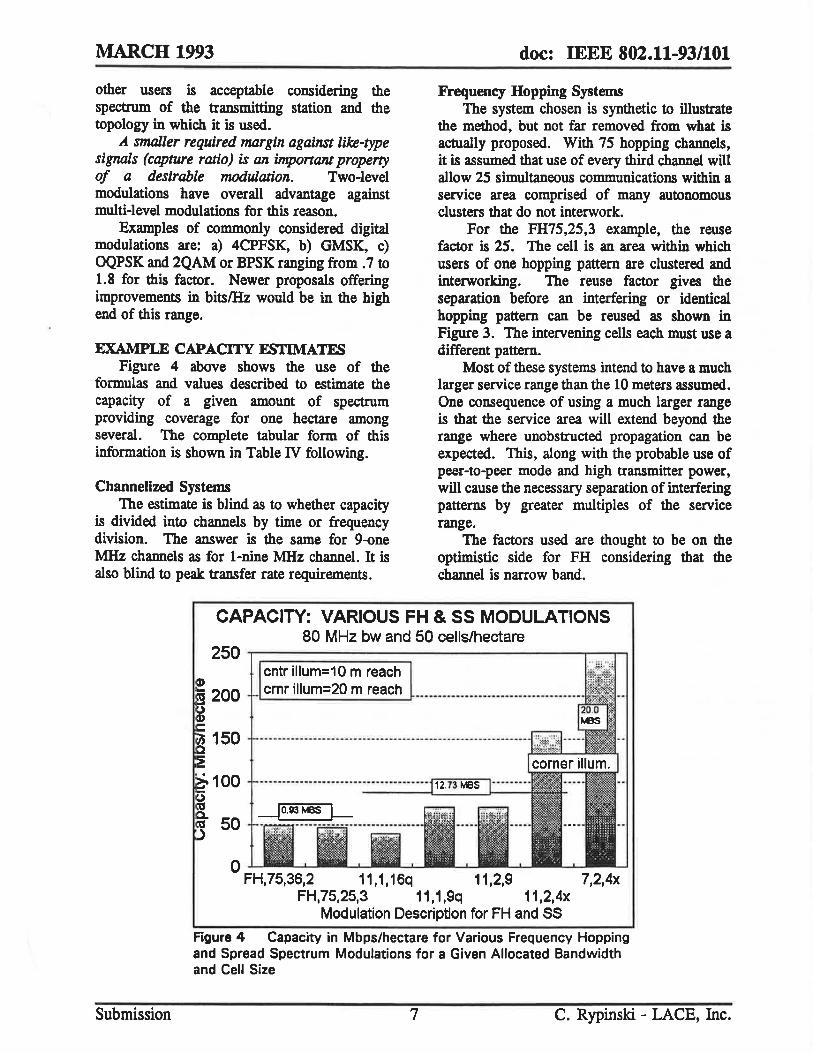
EXAMPLE CAPACITY FSfIMATES Figure 4 above shows the use of the
formulas and values described to estimate the capacity of a given amount of spectrum providing coverage for one hectare among several. The complete tabular form of this information is shown in Table IV following.
Channelized Systems The estimate is blind as to whether capacity
is divided into channels by time or frequency division. The answer is the same for 9-one MHz channels as for I-nine MHz channel. It is also blind to peak transfer rate requirements.
doc: IEEE 802.11-93/101
Frequency Hopping Systems The system chosen is synthetic to illustrate
the method, but not far removed from what is actually proposed. With 75 hopping channels, it is assumed that use of every third channel will allow 25 simultaneous communications within a service area comprised of many autonomous clusters that do not interwork.
For the FH75,25,3 example, the reuse factor is 25. The cell is an area within which users of one hopping pattern are clustered and interworking. The reuse factor gives the separation before an interfering or identical hopping pattern can be reused as shown in Figure 3. The intervening cells each must use a different pattern.
Most of these systems intend to have a much larger service range than the 10 meters assumed. One consequence of using a much larger range is that the service area will extend beyond the range where unobstructed propagation can be expected. This, along with the probable use of peer-to-peer mode and high transmitter power, will cause the necessary separation of interfering patterns by greater multiples of the service range.
The factors used are thought to be on the optimistic side for FH considering that the channel is narrow band.
CAPACITY: VARIOUS FH & SS MODULATIONS
Submission
80 MHz bw and 50 celis/hectare
25°r.=========~------------~n Q)
.... 200
150
.. 100
50
o
cntr illum=10 m reach cmr illum=20 m reach
.. ....... ____ ....... _ ......... ... _ ...... ....... .... .-.............. _ ....... ___ ....... ... ____ ... __ ......... ___ -.... _...1 ''''-, ,-,, -.,_
••••••••••••••••••••••• __ • _ •••••••••• _ S7.:C:::-:=-' __
FH,75,36,2 11,1, 16q 11,2,9 7,2,4x FH,75,25,3 11,1 ,9q 11.2.4x
Modulation Description for FH and SS
Figure 4 Capacity in Mbps/hectare for Various Frequency Hopping and Spread Spectrum Modulations for a Given Allocated Bandwidth and Cell Size
7 c. Rypinski - LACE, Inc.
MARCH 1993
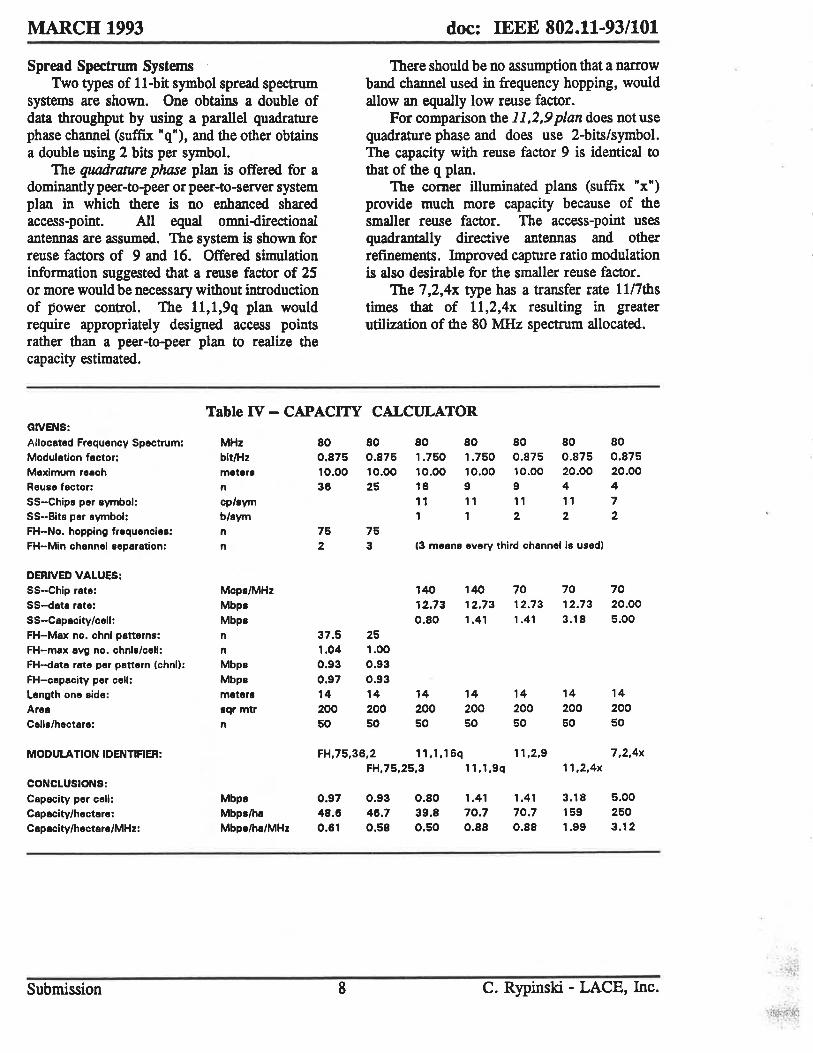
Spread Spectrum Systems Two types of II-bit symbol spread spectrum
systems are shown. One obtains a double of data throughput by using a parallel quadrature phase channel (suffix "q"), and the other obtains a double using 2 bits per symbol.
The quadrature phase plan is offered for a dominantly peer-to-peer or peer-to-server system plan in which there is no enhanced shared access-point. All equal omni-directional antennas are assumed. The system is shown for reuse factors of 9 and 16. Offered simulation information suggested that a reuse factor of 2S or more would be necessary without introduction of power control. The 1l,1,9q plan would require appropriately designed access points rather than a peer-to-peer plan to realize the capacity estimated.
Table IV - CAPACITY GIVENS: Allocated Frequency 5pectrum: MHz 80 Modulation factor: bit/Hz 0.875 Maximum reach meter. 10.00 ReUle factor: n 38 55-Chips per symbol: Cp/lym 55-Bits per 'ymbol: b/lym FH-No. hopping frequencies: n 75 FH-Min chennel ,eparation: n 2
DERIVED VALUES: 55-Chip rate: McpI/MHz 55-data rate: Mbpi 55-Capacity/cell: Mbpi FH-Max no. chnl patterns: n 37.5 FH-max avg no. chnll/cell: n 1.04 FH-data rate per pattern (chnll: Mbpi 0.93 FH-capacity per cell: Mbpi 0.97 Langth one lide: mater, 14 Area Iqr mtr 200 Cells/hectare: n 50
doc: IEEE 802.11-93/101
There should be no assumption that a narrow band channel used in frequency hopping, would allow an equally low reuse factor.
For comparison the 11,2,9 plan does not use quadrature phase and does use 2-bits/symbol. The capacity with reuse factor 9 is identical to that of the q plan.
The comer illuminated plans (suffix "x") provide much more capacity because of the smaller reuse factor. The access-point uses quadrantally directive antennas and other refinements. Improved capture ratio modulation is also desirable for the smaller reuse factor.
The 7,2,4x type has a transfer rate 1117ths times that of 1l,2,4x resulting in greater utilization of the 80 MHz spectrum allocated.
CALCULATOR
80 80 80 80 80 80 0.875 1.750 1.750 0.875 0 .875 0.875 10.00 10.00 10.00 10.00 20.00 20.00 25 18 9 9 4 4
11 11 11 11 7 2 2 2
75 3 (3 mean, every third channel is used)
140 140 70 70 70 12.73 12.73 12.73 12.73 20.00
0.80 1.41 1.41 3.18 5.00 25 1.00 0.93 0.93 14 14 14 14 14 14 200 200 200 200 200 200 50 50 50 50 50 50
MODULAnON IDENnRER: FH.75.36.2 11.1.16q 11.2.9 7.2.4x FH.75.25.3 11.1.9q 11.2.4x
CONCLUSIONS: Capacity per cell: Mbpi 0.97 0.93 0.80 1.41 1.41 3.18 5.00 Capacity/hectare: Mbpi/ha 48.8 48.7 39.8 70.7 70.7 159 250 Capacity/hectare/MHz: Mbpl/ha/MHz 0.81 0.58 0.50 0.88 0.88 1.99 3.12
Submission 8 C. Rypinski - LACE, Inc.
MARCH 1993
CONCLUSION Capacity can be estimated for different
modulations and systems as demonstrated. The methodology is non-judgmental of fading resistance and access method, however the factors affected are identified.
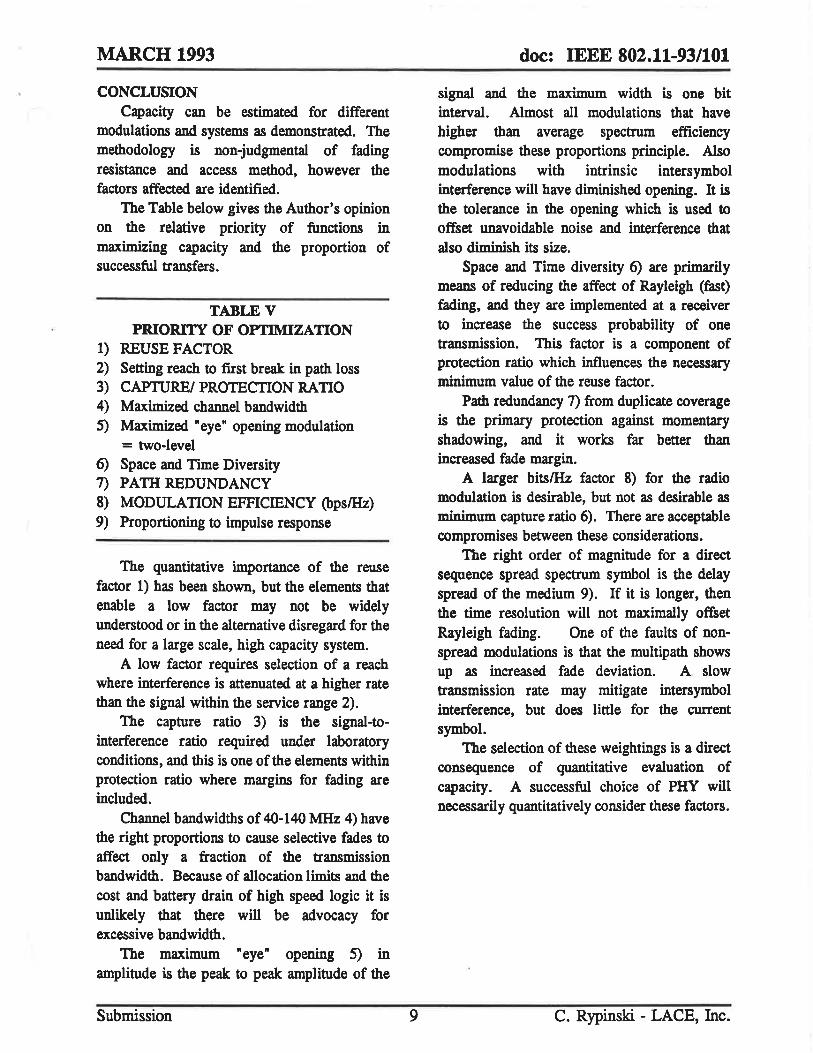
The Table below gives the Author's opinion on the relative priority of functions in maximizing capacity and the proportion of successful transfers.
TABLE V PRIORITY OF OPTIMIZATION
1) REUSE FACTOR 2) Setting reach to first break in path loss 3) CAPTUREI PROTECTION RATIO 4) Maximized channel bandwidth 5) Maximized "eye" opening modulation
= two-level 6) Space and Time Diversity 7) PATH REDUNDANCY 8) MODULATION EFFICIENCY (bpslHz) 9) Proportioning to impulse response
The quantitative importance of the reuse factor 1) has been shown, but the elements that enable a low factor may not be widely understood or in the alternative disregard for the need for a large scale, high capacity system.
A low factor requires selection of a reach where interference is attenuated at a higher rate than the signal within the service range 2).
The capture ratio 3) is the signal-tointerference ratio required under laboratory conditions, and this is one of the elements within protection ratio where margins for fading are included.
Channel bandwidths of 40-140 MHz 4) have the right proportions to cause selective fades to affect only a fraction of the transmission bandwidth. Because of allocation limits and the cost and battery drain of high speed logic it is unlikely that there will be advocacy for excessive bandwidth.
The maximum "eye" opening 5) in amplitude is the peak to peak amplitude of the
Submission 9
doc: IEEE 802.11-93/101
signal and the maximum width is one bit interval. Almost all modulations that have higher than average spectrum efficiency compromise these proportions principle. Also modulations with intrinsic intersymbol interference will have diminished opening. It is the tolerance in the opening which is used to offset unavoidable noise and interference that also diminish its size.
Space and Time diversity 6) are primarily means of reducing the affect of Rayleigh (fast) fading, and they are implemented at a receiver to increase the success probability of one transmission. This factor is a component of protection ratio which influences the necessary minimum value of the reuse factor.
Path redundancy 7) from duplicate coverage is the primary protection against momentary shadowing, and it works far better than increased fade margin.
A larger bitslHz factor 8) for the radio modulation is desirable, but not as desirable as minimum capture ratio 6). There are acceptable compromises between these considerations.
The right order of magnitude for a direct sequence spread spectrum symbol is the delay spread of the medium 9). If it is longer, then the time resolution will not maximally offset Rayleigh fading. One of the faults of nonspread modulations is that the multipath shows up as increased fade deviation. A slow transmission rate may mitigate intersymbol interference, but does little for the current symbol.
The selection of these weightings is a direct consequence of quantitative evaluation of capacity. A successful choice of PHY will necessarily quantitatively consider these factors.
C. Rypinski - LACE, Inc.