Embed Size (px)
Citation preview

Auto-stratification in drying colloidal dispersions:Experimental Investigations
R. E. Trueman1, E. Lago Domingues2, S. N. Emmett2,M. W. Murray2, J. L. Keddie3 and A. F. Routh *1
1Department of Chemical Engineering and Biotechnology,University of Cambridge, Pembroke Street, Cambridge CB2 3RA, UK
2AkzoNobel, Wexham Road, Slough SL2 5DS, UK3 Department of Physics, University of Surrey, Guildford GU2 7XH UK
Corresponding author: [email protected]
Abstract
In films cast from a colloidal dispersion comprised of two particle sizes, we experimen-
tally examine the distribution of particles normal to the substrate. The particle concentrations
at various positions in the film are determined through atomic force microscopy and NMR
profiling. The results are compared to a previously derived diffusional model. Evidence for
diffusional driven stratification is found, but the importance of other flows is also highlighted.
The conditions that enhance particle stratification are found to be a colloidally stable disper-
sion, low initial volume fractions, a low concentration of the stratifying particle and for the
Peclet numbers of the two components to straddle unity.
1
1 Introduction
Drying of latex particle blends can lead to non-uniform particle distributions in the direction
normal to the substrate [1, 2]. Control over the stratification process could lead to multi-functional
coatings. Alternatively there are applications when a uniform particle distribution is required. For
example even distribution of opacifier is required in films to ensure uniform opacity. To create
a latex film the wet dispersion is first applied to a substrate. Evaporation of solvent brings the
particles into close packing, and ideally particle deformation then occurs to create a structure
without voids. Finally diffusion of polymer chains across particle boundaries imparts mechanical
strength and results in the final homogeneous film [3]. The initial drying step allows non-uniform
particle distributions to be created and this is the subject of this work.
Drying of dispersions from an initial wet state to a form of close packing has been studied ex-
tensively. A common observation is of non-uniform drying with fronts of close packed particles
passing laterally across films [4]. The reason for this is packing of particles in regions of lower
height, followed by continued evaporation from these regions after particles have been consoli-
dated. The lateral drying has been termed the coffee ring effect, after the original work by Deegan
et al. [5]. The lateral drying also results in pressure gradients and film cracking [6, 7].
Vertical stratification is seen in films of sufficient lateral dimension, so that horizontal drying is
not dominant. There is a competition between timescales to determine if the well known particle
accumulation at the film surface is observed. The top surface of the film is descending at a rate
governed by evaporation. The particles that are collected by this descending front can either
diffuse away, or, if they are too slow moving, they gather into a descending ”piston”. For a film
of initial thickness H evaporating at a rate E, the balance between the particle diffusion and the
applied convection is captured in the Peclet number, Pe.
Pe =6πηRHE
kT(1)
2
where η is the solvent viscosity, R the particle radius and kT thermal energy. For Pe >> 1,
particle diffusion is irrelevant and a non-uniform particle distribution is seen during drying. For
Pe << 1, diffusion is dominant and a uniform distribution is observed. A diffusional model for
single component dispersions was previously published by Routh and Zimmerman [8] and a scal-
ing prediction that the particle concentration is proportional to Pe1/2 was broadly in agreement
with experimental measurements [9].
1.1 Review of Diffusional Model
Modelling of auto-stratification in drying latex films was carried out by Trueman et al. [10].
In their model, a film is composed of two types of particles dispersed in a continuous solvent.
Evaporation from the top surface reduces the film height and the particles distribute themselves
according to standard diffusional laws. The volume fraction evolution is predicted by writing
the diffusional flux of each component as being driven by the gradient in chemical potential. As
dispersions become more concentrated, the motion of particles become hindered. This effect is
captured within a sedimentation coefficient. The chemical potentials of the different components
(two particle species and the solvent) are linked through the Gibbs-Duhem equation [11]. The
chemical potential of the solvent is related to the osmotic pressure, which diverges as the par-
ticles come into close packing. The functional form of this divergence is contained within the
compressibility. In principle, both the compressibility and the sedimentation coefficient are mea-
surable quantities. The ratio in the chemical potential gradients for the two particle species is
the final piece of information needed to provide solvable equations. In principle, any chemical
potentials are possible with the surface chemistry of the particles being crucial. For a first set
of solutions [10], it was assumed that the particles are non-interacting, with chemical potentials
merely determined by entropy. A follow-up piece of work [12] has shown how particle interac-
tions affect the final particle distributions in films. An implicit assumption in the model is that the
dispersion remains colloidally stable throughout the concentration range.
The derived equations for predicting auto-stratification [10] are complex. As will become ev-
3
ident, we do not know the interaction potential between different particle types in the present
experiments. Furthermore the experimental techniques cannot provide information during the
drying process but are applied only to fully dry films. Quantitative measurements of concentra-
tion of two particle types as a function of position are challenging to obtain in experiments. Hence
a quantitative test of the theory is not feasible and the aim of this paper is to examine experimen-
tally whether stratification in multi-component, colloidal drying films is possible and whether the
derived model is useful for a qualitative understanding.
The model predicted that maximum stratification would be observed in dilute dispersions when
the Peclet numbers of the two particle types straddled unity. This meant Pe2 being larger than
unity and Pe1 being below unity with Pe1Pe2 ≈ 1. Larger particles (with Pe > 1) will accumulate
at the top of the film, whereas there will be a higher concentration of small particles (with Pe <
1) near the bottom. In addition as large a difference in Peclet numbers as possible increases the
concentration gradient of particles. The easiest way to achieve different Peclet numbers in a two
component film is to use differing particle sizes, such that Pe > 1 for one component and Pe < 1
for the other.
In a blend of colloidal particles with two different particle sizes, E, T , and η are the same for both
populations of particle. The ratio in Peclet number for the large and small particles, Pe1/Pe2, is
set by the ratio of the particle radii, R1/R2. As the evaporation rate of a drying colloidal film is
raised or lowered, then the geometric mean,√Pe1Pe2 is raised or lowered in proportion. In our
experiments, the ratio of the particle radii and the evaporation rate are both systematically and
independently adjusted as a means to vary Pe1/Pe2 and√Pe1Pe2 .
4
2 Materials and Methods
2.1 Latex samples
Acrylic latices with a range of sizes were made by emulsion polymerization using a persulphate
initiator. This ensured that the particles all have a similar surface chemistry. The polymer had a
relatively high glass transition temperature (Tg) to minimise artefacts and damage during AFM
imaging and to prevent the acquisition of an NMR signal at room temperature, hence making the
polymer ”invisible” in these experiments. A separate latex was required for imaging in NMR
experiments and it is required to have very high polymer mobility. After experimentation with a
number of samples it was determined that a poly(isodecyl acrylate) colloidal latex synthesized by
M. Rabjohns in the laboratory of Prof. Peter Lovell at the University of Manchester was the most
suitable, considering its particle size and observed signal strength. This latex was produced using
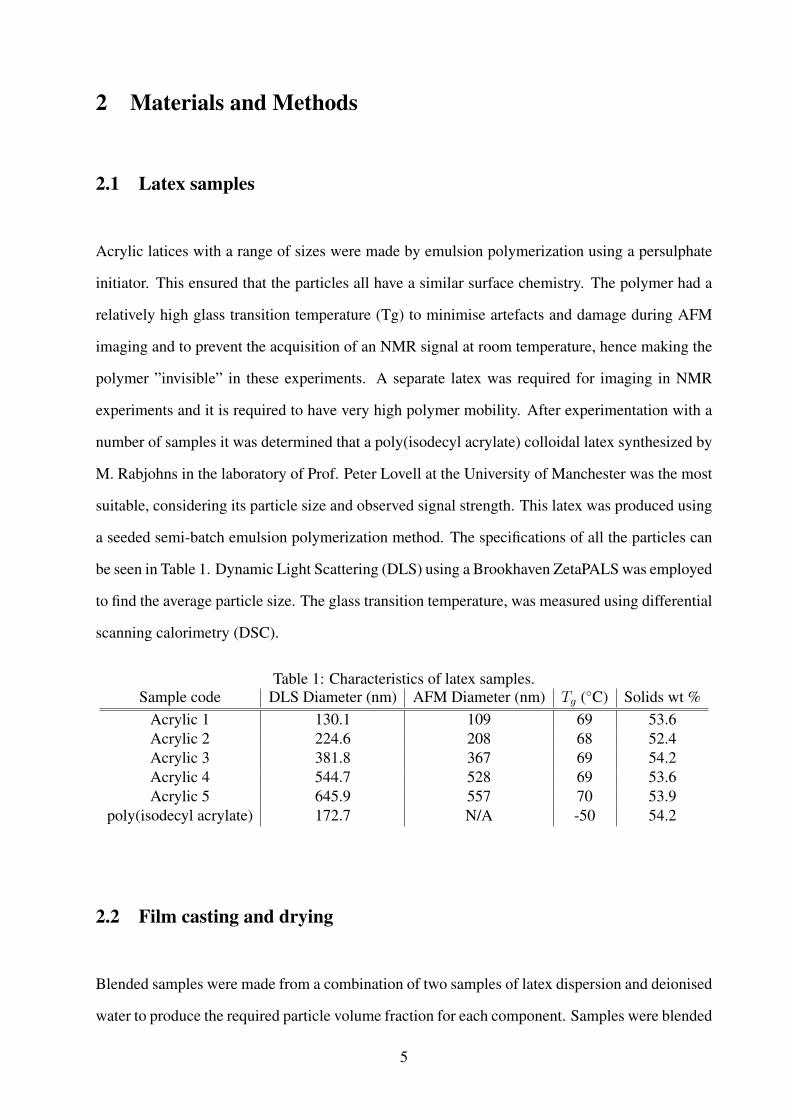
a seeded semi-batch emulsion polymerization method. The specifications of all the particles can
be seen in Table 1. Dynamic Light Scattering (DLS) using a Brookhaven ZetaPALS was employed
to find the average particle size. The glass transition temperature, was measured using differential
scanning calorimetry (DSC).
Table 1: Characteristics of latex samples.Sample code DLS Diameter (nm) AFM Diameter (nm) Tg (◦C) Solids wt %
Acrylic 1 130.1 109 69 53.6Acrylic 2 224.6 208 68 52.4Acrylic 3 381.8 367 69 54.2Acrylic 4 544.7 528 69 53.6Acrylic 5 645.9 557 70 53.9
poly(isodecyl acrylate) 172.7 N/A -50 54.2
2.2 Film casting and drying
Blended samples were made from a combination of two samples of latex dispersion and deionised
water to produce the required particle volume fraction for each component. Samples were blended
5
in glass vials ranging from 2.5 mL to 25 mL in size, depending on the amount required. The
dispersions and water were added via pipette, with the water being added before the dispersions.
Adequate mixing of the blends was ensured through use of a Topmix FB15024 vibrating plate.
The blends were then pipetted onto glass slides, with the pipette tip being used to spread the
dispersion. It was required to dry the films at varying evaporation rates in order to change the
Peclet numbers. Whilst it is possible to speed up the drying process by blowing air across the
top of films [13, 14], for most experiments it was necessary to dry the films at a slower rate than
obtainable under ambient conditions. To facilitate this the films were placed within a chamber
which had holes that had been drilled into the top. These holes were of varying diameter in order
to alter the drying rate. A petri dish of water was also placed in this chamber. This increased the
humidity up to a steady state more quickly, and also facilitated measurement of the evaporation
rate (in m/s) from the water mass loss from the petri-dish. This evaporation rate was then taken to
be the same as that of the drying film.
A perennial problem was edge drying. This was minimised by applying a plastic laminate coating
onto the glass slide substrates. A hole cut into the center formed a walled container that, when a
film is applied, the thickness at the edges does not reduce to zero, thus reducing the propensity of
the film to experience edge drying.
For GARField NMR measurements the films were cast onto Menzel Glaser No.0 18 mm × 18
mm borosilicate glass cover slips using a pipette to measure out the dispersion and the pipette tip
to spread it. A laminate coating containing a punched hole was applied to the cover slips to create
a container for the film to dry in. In this case a 14 mm wad punch was used to cut the holes in the
laminate coating.
2.3 Atomic Force Microscopy
A Digital Instruments Atomic Force Microscope was used together with Veeco Nanoscope soft-
ware to obtain images in tapping mode.
6
Image analysis was performed using the Gwyddion software package [15]. A typical AFM image
is shown in Figure 1 and the number of big and small particles is easily counted. From this a
volume fraction at the top surface is calculated. Typically five areas on each film were analysed.
An alternative is to calculate the percentage of area occupied by each particle type at the top
surface. Although in this case the numerical answers vary, the qualitative results are similar.
It was noticed from surface scans that there was some radial variation in the dried films, specifi-
cally a reduction in the number of larger particles on the surface towards the edges of the samples.
In order to obtain a value that would allow for characterisation of the samples, two methods were
used:
• Perform scans on multiple films, ensuring that they are taken at the same location on each
film, before analysing each one.
• Perform multiple, typically five, scans at different locations on each film, then take an aver-
age value from those.
2.4 Cryogenic Scanning Electron Microscopy
Films of blends of particles were partially dried on 1 cm diameter metal platforms within drying
chambers. Part way through the drying process the films were taken from the drying chamber
and frozen in liquid nitrogen. The films were then placed onto a cold stage at -120 ◦C within the
Cryo-SEM module and fractured using a razor blade. After fracture the sample was sublimated at
-95 ◦C to allow the particles to protrude from the fractured surface. This was then sputtered with
gold and examined by SEM, using a Hitachi S4500 field emission SEM and a Gatan Alto 2500
cryogenic preparation attachment module with cold storage.
7
2.5 GARField NMR
Measurements of the spatial distribution of mobile 1H in the PIDA polymer in the direction normal
to the substrate in dried bimodal latex films was obtained using magnetic resonance 1H profiling
with a GARField magnet. The magnet’s design has been described elsewhere [16]. Blends of
PIDA latex and an acrylic latex with a larger particle size were cast and dried with known Peclet
values. Each dried film was placed in the magnet at a position corresponding to a magnetic field
strength of 0.7 T and a field gradient strength of 17.5 Tm−1. The NMR signal was obtained using
a quadrature echo sequence [17]: (90x- τ -90y- τ -echo- τ -)n for n = 32 echoes and a pulse gap
of τ = 95.0 s. To obtain a profile, the echoes were Fourier-transformed and then summed, thus
giving an NMR signal intensity profile as a function of vertical position. The NMR intensity is
proportional to the density of mobile 1H and was therefore used to determine the distribution of
the PIDA particles. The T2 relaxation time is proportional to the mobility of molecules containing
1H [17, 18]. In these experiments, the glass transition temperature of the acrylic particles was
near to the temperature of the GARField measurement (ca. 25 oC). Consequently, the molecular
mobility - and hence the T2 relaxation time - was relatively low. Hence, no signal was obtained
from the standard acrylic particles, however a signal is obtained from the PIDA, which has a
higher T2 relaxation time. The pixel resolution achieved in these experiments was about 10 µm.
To correct for the sensitivity decline over the film thickness, profile intensities were normalized
by an elastomer standard.
2.5.1 Analysing images
The GARField scan gave a profile of just the small, soft particles. A good measure of the stratifi-
cation is the skewness of this distribution, which is a statistical analysis of the lean of the profile
[19]. The calculation of the skewness was carried out only on signal intensities that were higher
8
than the noise level on either side of the profile. The skewness, Sk, is defined as
Sk =m3/m0
(m2/m0)3/2
, (2)
where mi is the ith moment of the signal intensity. For a distribution in the z-axis of p data points
of signal intensity φ, this is given by
mi =
j=p∑j=1
zijφj∆z. (3)
where zj is the vertical position of the intensity and ∆z is the bin size used to discretise the
data. The point on the vertical-axis from which the moments are calculated was set so that the
1st moment is zero. This ensures that a positive skewness value describes a distribution with the
long tail to the right hand side, whereas a negative value indicates a long tail to the left hand side.
Examples of actual measured profiles with (a) zero, (b) positive and (c) negative skewness are
shown in Figure 2. Because the signal obtained from GARField NMR is from the soft particles, a
positive skewness value indicates an excess of the soft particles near to the substrate. A negative
value indicates an excess of soft particles near to the film/air interface.
3 Results and Discussion
3.1 Particle properties
Using AFM, it was noticed that the particles were somewhat polydisperse, as shown in Figure 1.
All the particles were found to be negatively charged and stable in up to 100 mM sodium chloride
solutions. It was noted however that particle mixtures would aggregate slowly over a period of
days. This is however longer than any of the drying experiments reported here.
9
3.2 Effect of various experimental parameters
In this section we show the effect of various experimental parameters. The results from AFM
and GARField imaging is compared with the theoretical predictions from the diffusional model,
which is described in the previous paper by Trueman et al. [10]. Throughout the results section
subscripts 1 and 2 are used to represent the two particle types and the subscript 2 refers to the
larger particles with the larger Peclet number.
3.2.1 Changing the geometric mean Peclet number
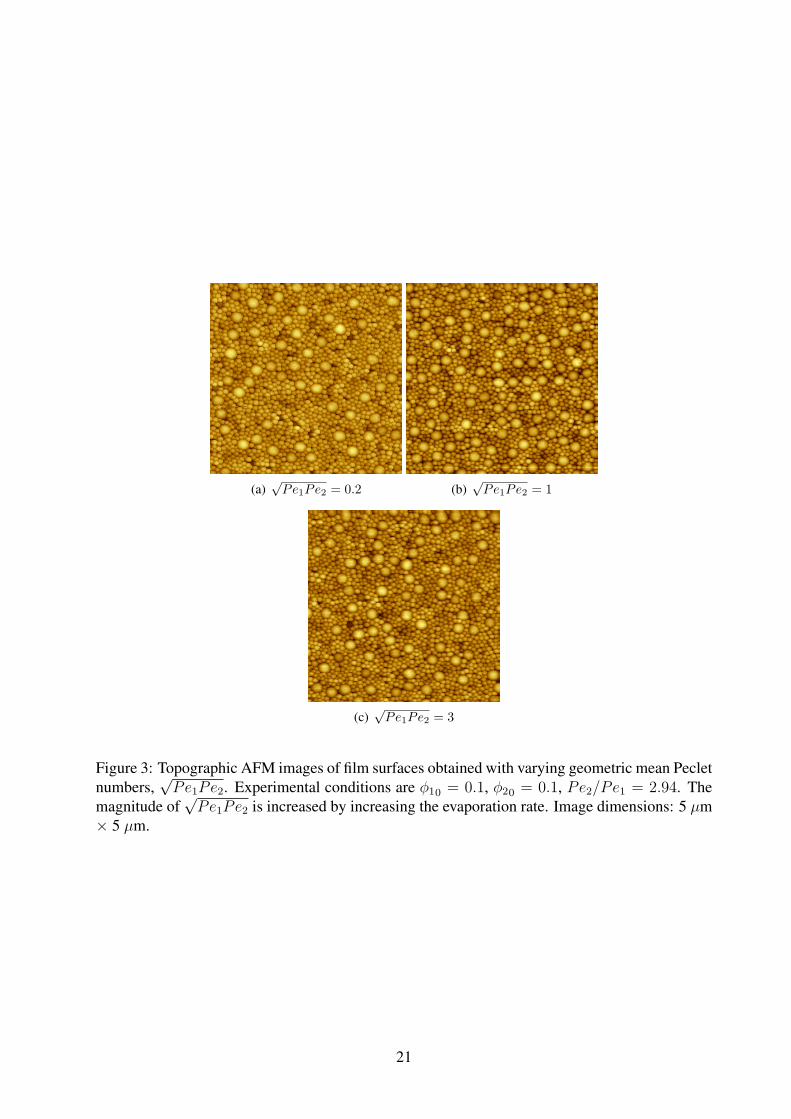
Figure 3 displays example AFM images, obtained from films containing two different particle
sizes (130 and 380 nm) dried over a range of evaporation rates so as to vary√Pe1Pe2. Each of
these surface scans were taken from the centre of the film. It can be seen qualitatively that the
image of the film dried with√Pe1Pe2 = 1 contains more large particles than the others. These
and other images were analysed to obtain particle volume fractions at the top surface. Figure 4
shows the data obtained, with the films always being scanned at their center. It can be seen that a
maximum in the volume fraction of large particles at the surface occurs around a geometric mean
Peclet number of unity. Experimentally, these results show that there is maximum accumulation
of large particles at the top surface when the evaporation rate is intermediate. If the evaporation
rate is too fast or two slow, then the geometric mean Peclet number is too high or low, respectively.
Figure 5 displays the skewness values obtained from GARField NMR profiling of films dried at
varying evaporation rates, which are displayed on the graph as the geometric mean of the Peclet
numbers of the two components. For the sample containing 380 nm acrylic particles (Pe2/Pe1 =
2.21) it can be seen that although no stratification is observed at higher Peclet numbers, when
the evaporation rate is reduced, there are more small particles nearer to the substrate, as expected
from the model. For the sample containing 600 nm acrylic particles (Pe2/Pe1 = 3.15), on the
other hand, as the evaporation rate is reduced there are more of the larger particles near to the
substrate.
10
Theoretical results from the diffusional model predict an accumulation of large, particles near the
substrate when the geometric mean Peclet number is unity. The AFM results seem to conform to
this prediction, although with a lot of noise. The GARField results seem too noisy to make any
definitive prediction. The results for the Peclet ratio of 3.15 seem to suggest an accumulation of
small particles at the top surface with the slowest evaporation rates. The most likely explanation
for this is an onset of colloidal instability during the slowest drying experiments, resulting in flocs
of the large particles and sedimentation, leaving at excess of small, PIDA particles at the top
surface.
3.2.2 Changing the ratio of initial particle volume fractions ϕ10/ (ϕ10 + ϕ20)
In the next set of experiments, Pe1/Pe2 and√Pe1Pe2 was fixed, and the initial volume fraction
of the two components was varied. The volume fraction ratio of the two components was changed,
while ensuring a constant total volume fraction. We use ϕ to refer to the volume fractions and
the subscripts to distinguish between the different components. The further subscript 0 refers
to the initial concentration at time =0. AFM images of four different volume fraction ratios
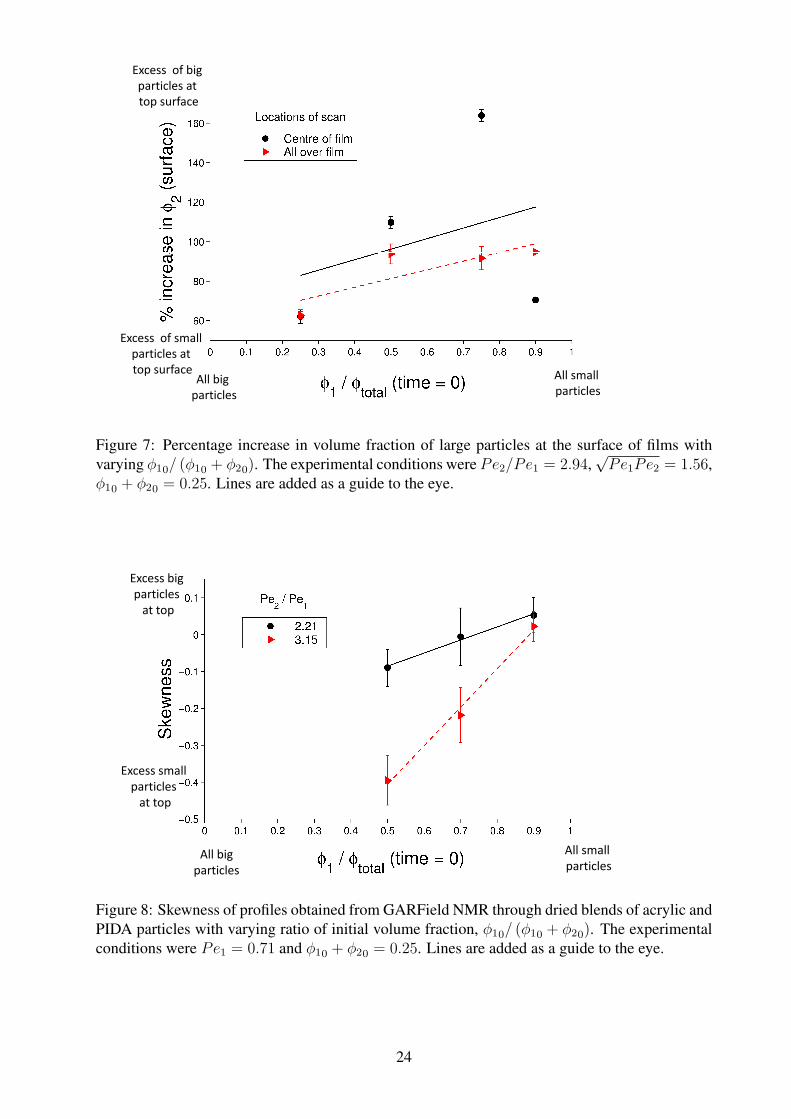
can be seen in Figure 6. Surface volume fractions of these films are shown in Figure 7. To
facilitate a comparison between samples, the vertical axis displays the percentage increase of the
volume fraction of the large particles compared to that which would be expected had the film dried
completely uniformly. The trend shows that the stratification increases as the ratio between initial
volume fractions of the small and large particles in the sample increases. For the sample with
90% of the starting volume fraction being small particles there are very few large particles seen
on the surface. This magnifies the error in the measurement for this point, since one additional
large particle will have a considerable effect of the percentage increase above a uniform value.
When measuring films with GARField NMR it was not possible to obtain a significant signal
above the noise value from films with less than 50 % small particles. The skewness of the profiles
obtained for different volume fraction ratios of the two components are displayed in Figure 8.
For both particle blends the skewness increases as ϕ10/ (ϕ10 + ϕ20) increases. This indicates an
11
increase in the amount of large particles at the top of the film.
The modelling work [10] predicted that as ϕ10/ (ϕ10 + ϕ20) increased, the percentage increase
of the large particles at the surface would increase. This was also seen with both experimental
techniques. It is noticeable that in these experiments the value of√Pe1Pe2 was such that the
sedimentation, expected at the very slowest evaporation rates, was not observed.
3.2.3 Changing the initial volume fraction ϕ10 + ϕ20
In the next set of experiments, the total initial volume fraction of particles was changed. That is,
the ratio of the volume fractions of the two components was fixed while the blends were diluted by
varying amounts. Figure 9 shows the volume fraction of large particles at the surface increasing
as the total initial volume fraction of particles decreases. These samples were dried with constant
Pe2/Pe1, ϕ10/ϕ20 and√Pe1Pe2.
Figure 10 displays the change in skewness as the total initial volume fraction of the dried samples
is varied. The trend is the same for both particle blends – the skewness increases as the total initial
volume fraction decreases.
The observation with each technique was that as the total initial volume fraction was decreased,
the volume fraction of large particles near the top surface of the films increased. This behaviour
was as predicted theoretically [10]. The lower initial volume fractions allow more time for a
diffusional stratification to occur.
3.2.4 Changing Pe2/Pe1 via the size ratio
In a final set of experiments, the evaporation rate and volume fractions were fixed, but the size
ratio of the two components was varied, as a means of adjusting Pe2/Pe1. Images produced from
the surface topography of films dried with different size ratios of the particles are displayed in
12
Figure 11. For a size ratio of R2/R1 = 1.73 it was not possible to sufficiently distinguish the
two particles from one another. For the largest two size ratios very few large particles were seen
on the surface. It is also difficult to tell whether the protrusions from the surface in these images
are large particles or collections of small particles because of the surface inhomogeneities in the
surfaces of the 500 nm and 600 nm particles.
The GARField NMR results can be seen in Figure 12. It is evident that the skewness decreases
as the size ratio between the two components increases. This is indicative of more small particles
towards the top surface as the size ratio increases. This is opposite to the theoretical prediction
of Trueman et al. [10]. The most likely explanation for the discrepancy is again an increase in
dispersion flocculation with larger size disparities. Depletion interactions are stronger with larger
size disparities and the increase in floc size would then lead to an increased sedimentation of the
larger particles and the resulting increase in small particles towards the top surface.
3.3 Cryo-SEM and potential issues with AFM imaging
AFM is a technique that, unless cross-sections of the film are carefully cut, scans only the top
surface of the dried films. In some situations this is the main area of interest, however for a more
complete characterisation it can be useful to obtain data from regions throughout the depth of the
film. One technique that can be used to obtain such data is Cryo-SEM [1]. Figure 13 shows an
image taken of a film containing particles of two differing sizes. It is clear from these images
that the surface composition is different from that immediately beneath, with there being a higher
volume of small particles at the surface than immediately below. Whilst surface techniques such as
AFM and SEM are simple to perform, the reliance on the top surface is a major drawback. Hence
whilst trends in the particle stratification are obtainable, any quantitative information should not
be relied on from the AFM data. As will be shown [12] an attraction for one particle type to the
top surface can lead to complete enrichment of the surface with just those particles, with the layer
immediately below being the value that would have occurred without the surface attraction.
13
Another issue with the AFM method is that the particle counting technique was an automated one.
To ensure that each sample was measured in a consistent manner a cut-off size was chosen which
would discern between large and small particles. This was applied equally to every image taken.
It is clear in some of the images that there are some particles for which it is difficult to ascertain
whether they are small or large, generally because they are obscured by others. The automated
technique usually counts these as small particles, hence the true number of large particles may be
underestimated, although this will be a systematic error.
3.3.1 GARField NMR
The main advantage of GARField NMR is that it produces vertical profiles through the film.
It is also a direct measurement of the soft particles. The resolution of profiles obtained using
GARField NMR is about 10 µm and whilst this is sufficient to observe the presence of a gradient
in composition throughout the film, it is not high enough to observe any layers of just a few
particles. A significant disadvantage of using GARField NMR is that the samples are restricted
to a diameter of 14 mm when the laminate coating is used. This means that any edge drying
effects will be more significant than with the larger radii film in samples prepared for AFM. This
manifested itself visually, as the level of turbidity at the center and edges differed. This type of
behaviour from drying films was also noticed by Yang et al. [20].
3.4 Other sources of particle transport
The experimental results indicate the presence of a diffusional stratification. It is also evident that
these films are far more complex than the simplified diffusional model would hope. There are a
number of other flow mechanisms that need to be considered:
The small particles may have a chemical attraction to the top surface, perhaps due to the surface
chemistry of the particles, which would lead to them becoming enriched at the top surface, yet
14
the rest of the film would dry as normal. Evidence for this type of stratification comes from the
Cryo-SEM image Figure 13. The interactions between particles and attraction for one particle
type to an interface is easily included in the existing model and is the subject of a future paper
[12].
Colloidal stability has been a major issue in this work. Aggregation of the larger particles, fol-
lowed by sedimentation, will lead to the larger particles being found predominantly near the sub-
strate. In a bidisperse system flocculation is likely to occur due to depletion interactions [11]. We
ensured visual colloidal stability for up to 10 days with our particle mixtures. However formation
of small weak aggregates would promote sedimentation and may explain why we consistently
observe an excess of large particles towards the substrate.
Convection currents can form within a drying film due to temperature differences between differ-
ent locations. Any such currents would be likely to drag the small particles more than the large
ones. Care was taken to ensure the films dried in an as undisturbed form as possible, to reduce the
chance of the presence of any convection currents, however their presence is certainly possible.
Any surfactant in the film will inevitably migrate to the film-air interface. This will then lead to
Marangoni flows which will dominate any diffusional stratification. In these experiments the la-
texes were extensively dialysed to try to remove any surfactants although their presence is always
possible.
It was demonstrated by Nikiforow et al. [21] that the charge on the surface of colloids can cause a
mixture of charged and non-charged particles to segregate based on differing diffusion rates. The
zeta potentials of the particles used in this study were found to be similar. It seems likely that
if the surface charge magnitudes were very different then this type of stratification would occur,
however it is not certain whether the small differences in the surface charges of the particles used
in this present work would demonstrate the same phenomena.
Lateral drying was a perennial difficulty. It was minimised by use of the laminate surround, but not
15
completely removed. This means that any experimental measurements are subject to their lateral
location and, especially for AFM measurements, many such measurements need to be averaged.
This introduces an inevitable error into the experiments.
4 Conclusions
We have demonstrated how the particle size ratio can be used to set a ratio of Peclet numbers
for the components in a colloidal blend. The evaporation rate can then be adjusted to vary the
geometric mean Peclet number such that it is near unity.
We have used two different experimental techniques to examine stratification in drying latex films.
AFM cannot distinguish between concentration profiles in the depth of a film and segregation
of particles at a surface. The cryo-SEM analysis has shown definitive evidence for the latter.
GARField NMR provides concentration profiles through the film, and the profile skewness is a
useful measure of stratification.
Irrespective of the technique used, there is clear evidence for stratification in drying films. We
found that greater stratification is observed at lower initial volume fractions and with a low con-
centration of the segregating component. There was some evidence from AFM for enhanced
stratification at a geometric mean Peclet number of unity, although the GARField data was incon-
clusive in this respect.
These experimental results, when combined with the results from the modelling work presented
by Trueman et al. [10], demonstrate that with careful control of the drying environment, the
presence of different sized particles can be used to manipulate the film morphology. In order to
create a system in which stratification is most likely to be encouraged, the following conditions
should therefore be achieved:
• The Peclet numbers of the two components should lie either side of unity.
16
• The total initial volume fraction of the particles should be low enough to enable the particles
to diffuse.
• The size difference should be great enough to have a large difference in diffusivities between
the two components. The particles must not phase separate or aggregate under depletion
flocculation when blended, however, which restricts the maximum size ratio between the
two components.
Acknowledgements
The authors are grateful to Prof. Diethelm Johannsmann (Clausthal University of Technology,
Germany) and Dr. Stuart Clarke (University of Cambridge) for helpful discussions and to Michael
A. Rabjohns and Professor Peter Lovell (University of Manchester) for the PIDA sample. RET
was helped with GARField experiments by Andre Utgenannt, Carolina de las Heras and Radek
Kowalczyk. RET was supported by a CASE award from ICI/AkzoNobel and EPSRC.
17
References
[1] Luo, H.; Scriven, L. E.; Francis, L. F. Journal of Colloid and Interface Science 2007, 316, 500–509.
[2] Luo, H.; Cardinal, C. M.; Scriven, L. E.; Francis, L. F. Langmuir 2008, 24, 5552–5561.
[3] Keddie, J. L.; Routh, A. F. Fundamentals of latex film formation; Processes and Properties; Springer,
2010.
[4] Routh, A. F.; Russel, W. B. AIChE Journal 1998, 44, 2088–2098.
[5] Deegan, R. D.; Bakajin, O.; Dupont, T. F.; Huber, G.; Nagel, S. R.; Witten, T. A. Nature 1997, 389,
827–829.
[6] Goehring, L.; Clegg, W. J.; Routh, A. F. Langmuir 2010, 26, 9269–9275.
[7] Goehring, L.; Clegg, W. J.; Routh, A. F. Soft Matter 2011, 7, 7984–7987.
[8] Routh, A. F.; Zimmerman, W. B. Chemical Engineering Science 2004, 59, 2961–2968.
[9] Ekanayake, P.; McDonald, P. J.; Keddie, J. L. European Physical Journal - Special Topics 2009, 166,
21–27.
[10] Trueman, R. E.; Lago Domingues, E.; Emmett, S. N.; Murray, M.; Routh, A. F. submitted to Langmuir
2011,
[11] Russel, W. B.; Saville, D. A.; Schowalter, W. R. Colloidal Dispersions; Cambridge University Press,
1991.
[12] Atmuri, A.; Bhatia, A. F., S. R. Routh submitted to Langmuir 2011,
[13] Carra, S.; Pinoci, D. Macromolecular Symposia 2002, 187, 585–596.
[14] Gorce, J. P.; Bovey, D.; McDonald, P. J.; Palasz, P.; Taylor, D.; Keddie, J. L. European Physical
Journal E 2002, 8, 421–429.
[15] Klapetek, P.; Neas, D.; Anderson, C. Gwyddion user guide, http://gwyddion.net/. 2004–2009.
[16] Glover, P. M.; Aptaker, P. S.; Bowler, J. R.; Ciampi, E.; McDonald, P. J. Journal of Magnetic Reso-
nance 1999, 139, 90 – 97.
18
[17] McDonald, P. J.; Newling, B. Reports on Progress in Physics 1998, 61, 1441.
[18] Wang, T.; de las Heras Alarcon, C.; Goikoetxea, M.; Beristain, I.; Paulis, M.; Barandiaran, M. J.;
Asua, J. M.; Keddie, J. L. Langmuir 2010, 26, 323–333.
[19] Konig, A. M.; Weerakkody, T. G.; Keddie, J. L.; Johannsmann, D. Langmuir 2008, 24, 7580–7589.
[20] Yang, Z. Z.; Wang, L. J.; Liu, Z. P.; Zhao, D. L. Journal of Applied Polymer Science 2001, 80,
1835–1840.
[21] Nikiforow, I.; Adams, J.; Konig, A. M.; Langhoff, A.; Pohl, K.; Turshatov, A.; Johannsmann, D.
Langmuir 2010, 26, 13162–13167.
19
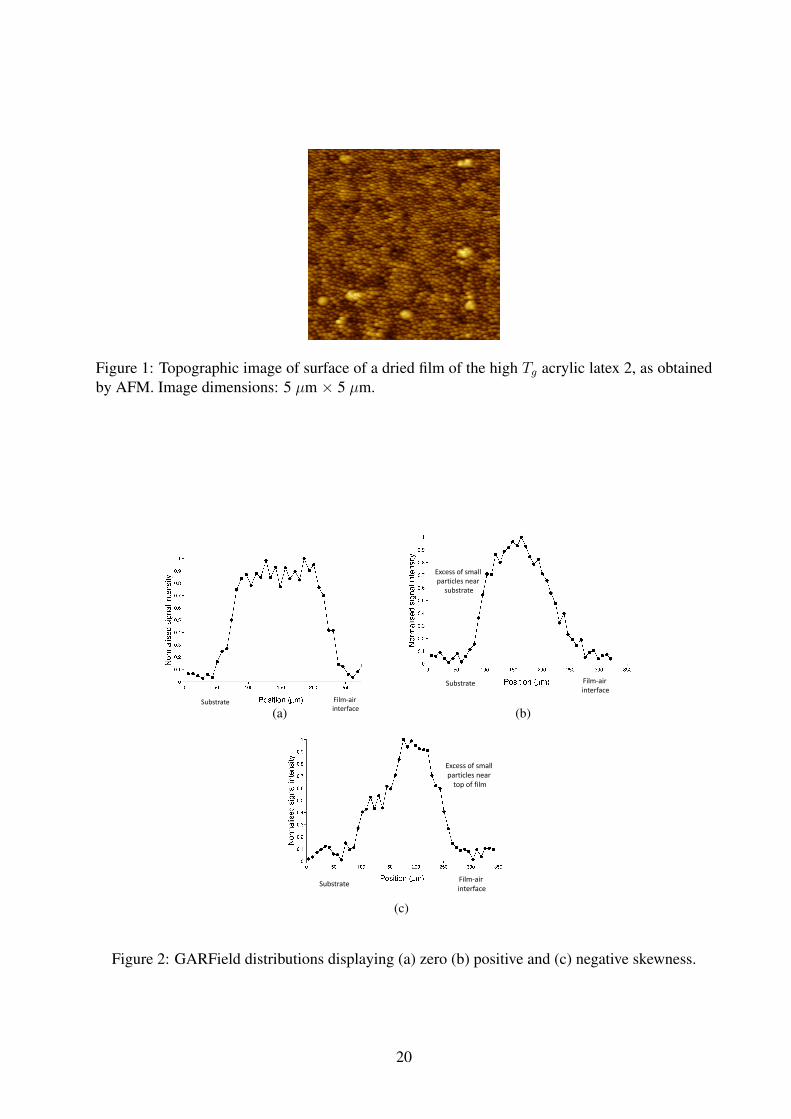
Figure 1: Topographic image of surface of a dried film of the high Tg acrylic latex 2, as obtainedby AFM. Image dimensions: 5 µm × 5 µm.
Substrate Film-air
interface(a)
Excess of small
particles near
substrate
Substrate Film-air
interface
(b)
Excess of small
particles near
top of film
SubstrateFilm-air
interface
(c)
Figure 2: GARField distributions displaying (a) zero (b) positive and (c) negative skewness.
20
(a)√Pe1Pe2 = 0.2 (b)
√Pe1Pe2 = 1
(c)√Pe1Pe2 = 3
Figure 3: Topographic AFM images of film surfaces obtained with varying geometric mean Pecletnumbers,
√Pe1Pe2. Experimental conditions are ϕ10 = 0.1, ϕ20 = 0.1, Pe2/Pe1 = 2.94. The
magnitude of√Pe1Pe2 is increased by increasing the evaporation rate. Image dimensions: 5 µm
× 5 µm.
21
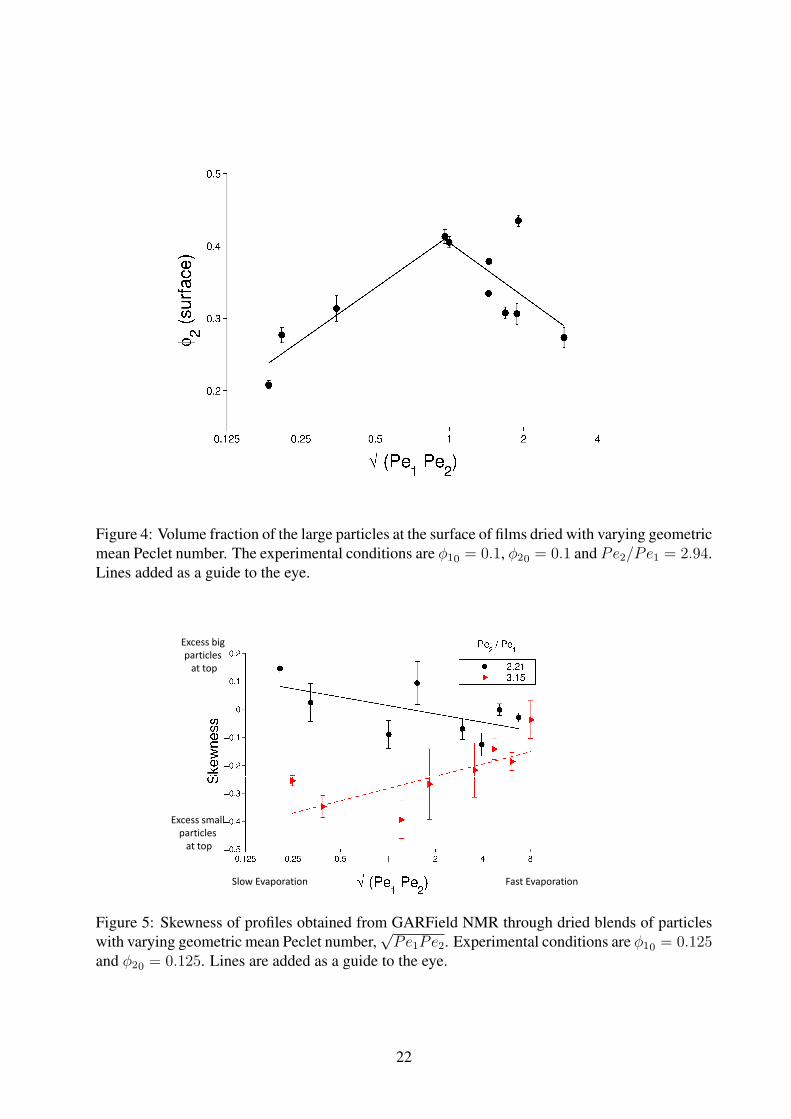
Figure 4: Volume fraction of the large particles at the surface of films dried with varying geometricmean Peclet number. The experimental conditions are ϕ10 = 0.1, ϕ20 = 0.1 and Pe2/Pe1 = 2.94.Lines added as a guide to the eye.
Excess big
particles
at top
Fast EvaporationSlow Evaporation
Excess small
particles
at top
Figure 5: Skewness of profiles obtained from GARField NMR through dried blends of particleswith varying geometric mean Peclet number,
√Pe1Pe2. Experimental conditions are ϕ10 = 0.125
and ϕ20 = 0.125. Lines are added as a guide to the eye.
22
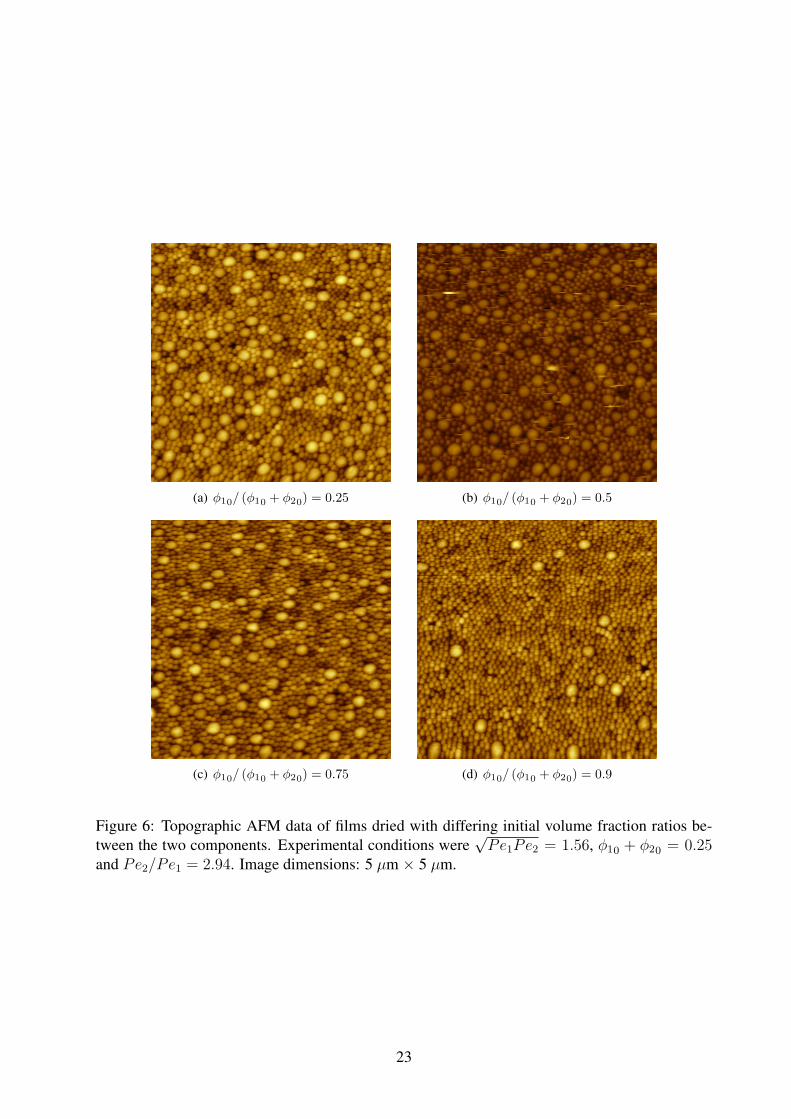
(a) ϕ10/ (ϕ10 + ϕ20) = 0.25 (b) ϕ10/ (ϕ10 + ϕ20) = 0.5
(c) ϕ10/ (ϕ10 + ϕ20) = 0.75 (d) ϕ10/ (ϕ10 + ϕ20) = 0.9
Figure 6: Topographic AFM data of films dried with differing initial volume fraction ratios be-tween the two components. Experimental conditions were
√Pe1Pe2 = 1.56, ϕ10 + ϕ20 = 0.25
and Pe2/Pe1 = 2.94. Image dimensions: 5 µm × 5 µm.
23
Excess of big
particles at
top surface
All small
particlesAll big
particles
Excess of small
particles at
top surface
Figure 7: Percentage increase in volume fraction of large particles at the surface of films withvarying ϕ10/ (ϕ10 + ϕ20). The experimental conditions were Pe2/Pe1 = 2.94,
√Pe1Pe2 = 1.56,
ϕ10 + ϕ20 = 0.25. Lines are added as a guide to the eye.
Excess big
particles
at top
Excess small
particles
at top
All small
particlesAll big
particles
Figure 8: Skewness of profiles obtained from GARField NMR through dried blends of acrylic andPIDA particles with varying ratio of initial volume fraction, ϕ10/ (ϕ10 + ϕ20). The experimentalconditions were Pe1 = 0.71 and ϕ10 + ϕ20 = 0.25. Lines are added as a guide to the eye.
24
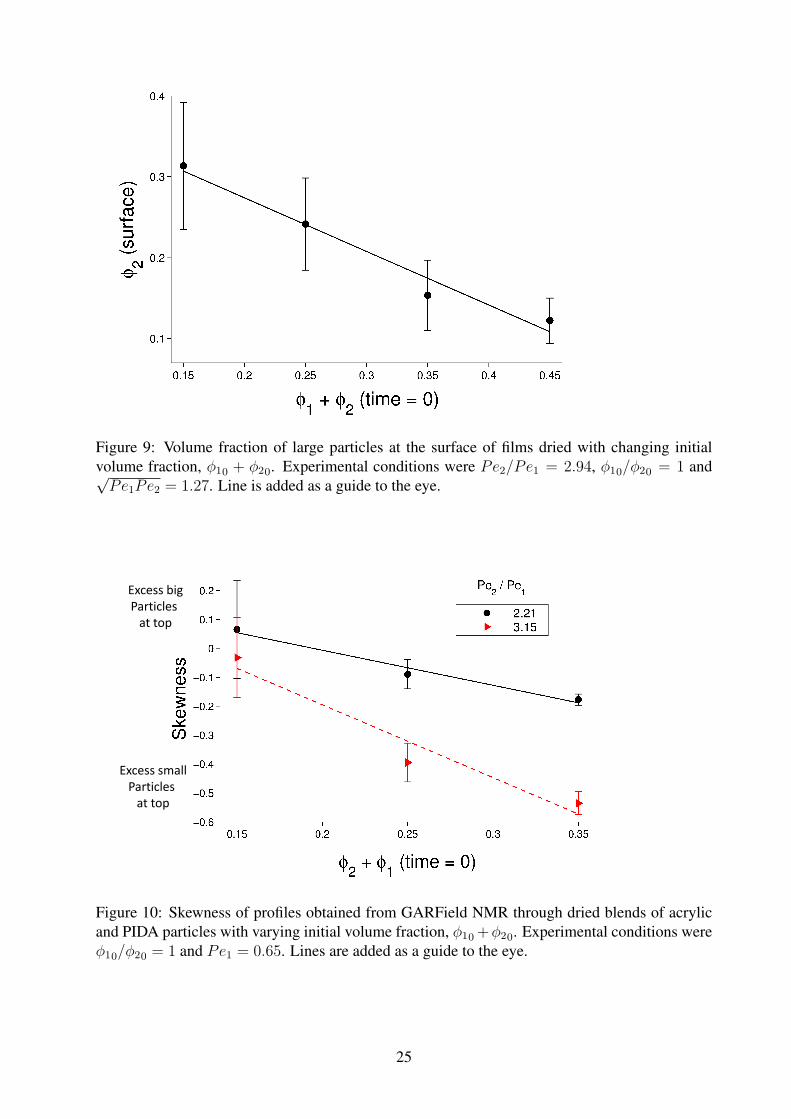
Figure 9: Volume fraction of large particles at the surface of films dried with changing initialvolume fraction, ϕ10 + ϕ20. Experimental conditions were Pe2/Pe1 = 2.94, ϕ10/ϕ20 = 1 and√Pe1Pe2 = 1.27. Line is added as a guide to the eye.
Excess big
Particles
at top
Excess small
Particles
at top
Figure 10: Skewness of profiles obtained from GARField NMR through dried blends of acrylicand PIDA particles with varying initial volume fraction, ϕ10+ϕ20. Experimental conditions wereϕ10/ϕ20 = 1 and Pe1 = 0.65. Lines are added as a guide to the eye.
25
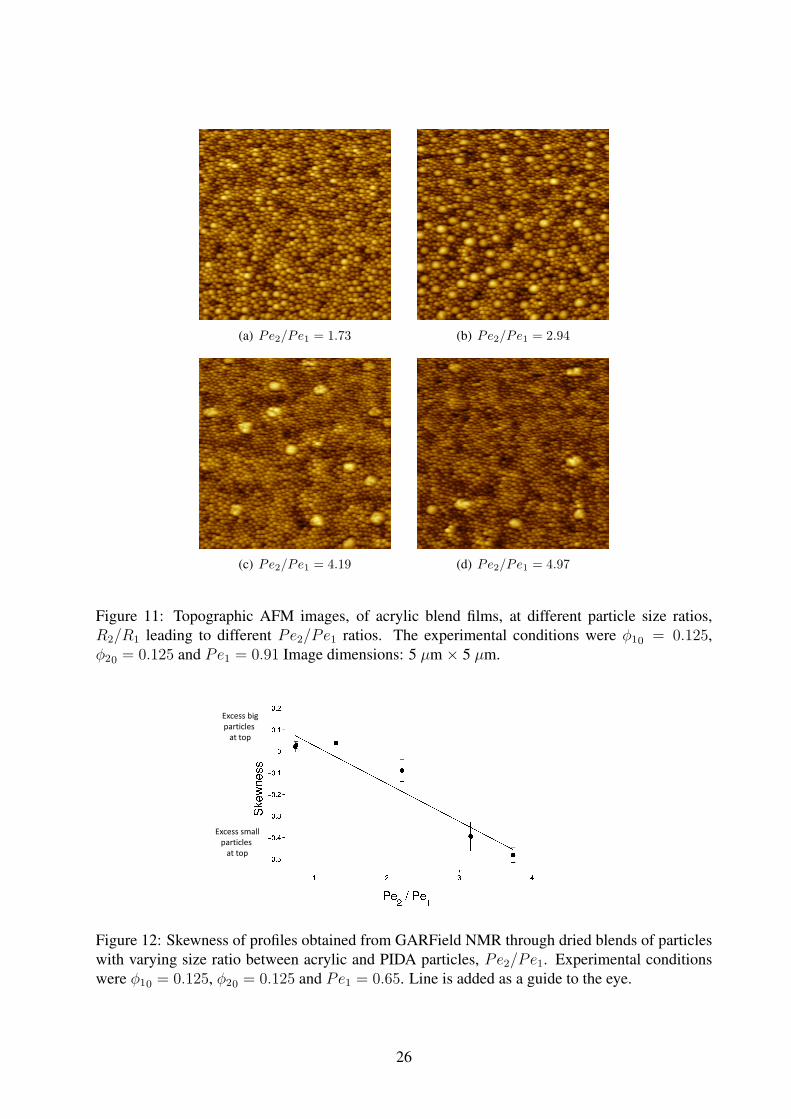
(a) Pe2/Pe1 = 1.73 (b) Pe2/Pe1 = 2.94
(c) Pe2/Pe1 = 4.19 (d) Pe2/Pe1 = 4.97
Figure 11: Topographic AFM images, of acrylic blend films, at different particle size ratios,R2/R1 leading to different Pe2/Pe1 ratios. The experimental conditions were ϕ10 = 0.125,ϕ20 = 0.125 and Pe1 = 0.91 Image dimensions: 5 µm × 5 µm.
Excess big
particles
at top
Excess small
particles
at top
Figure 12: Skewness of profiles obtained from GARField NMR through dried blends of particleswith varying size ratio between acrylic and PIDA particles, Pe2/Pe1. Experimental conditionswere ϕ10 = 0.125, ϕ20 = 0.125 and Pe1 = 0.65. Line is added as a guide to the eye.
26
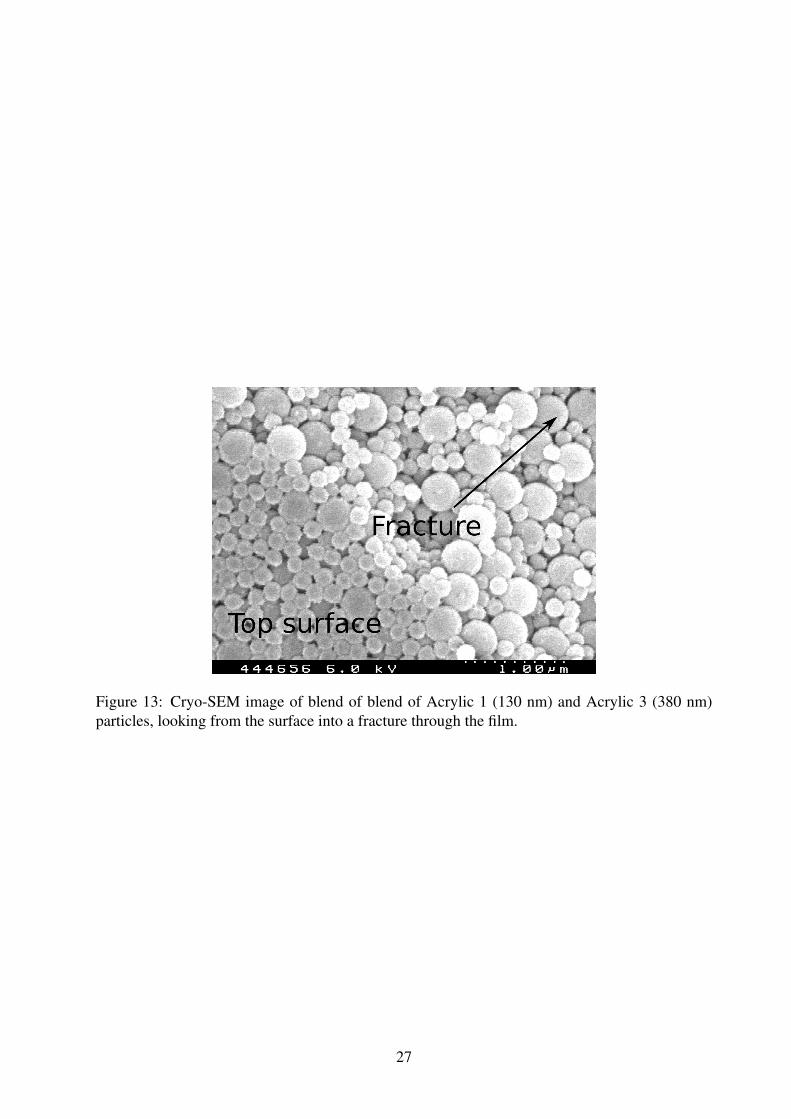
Figure 13: Cryo-SEM image of blend of blend of Acrylic 1 (130 nm) and Acrylic 3 (380 nm)particles, looking from the surface into a fracture through the film.
27
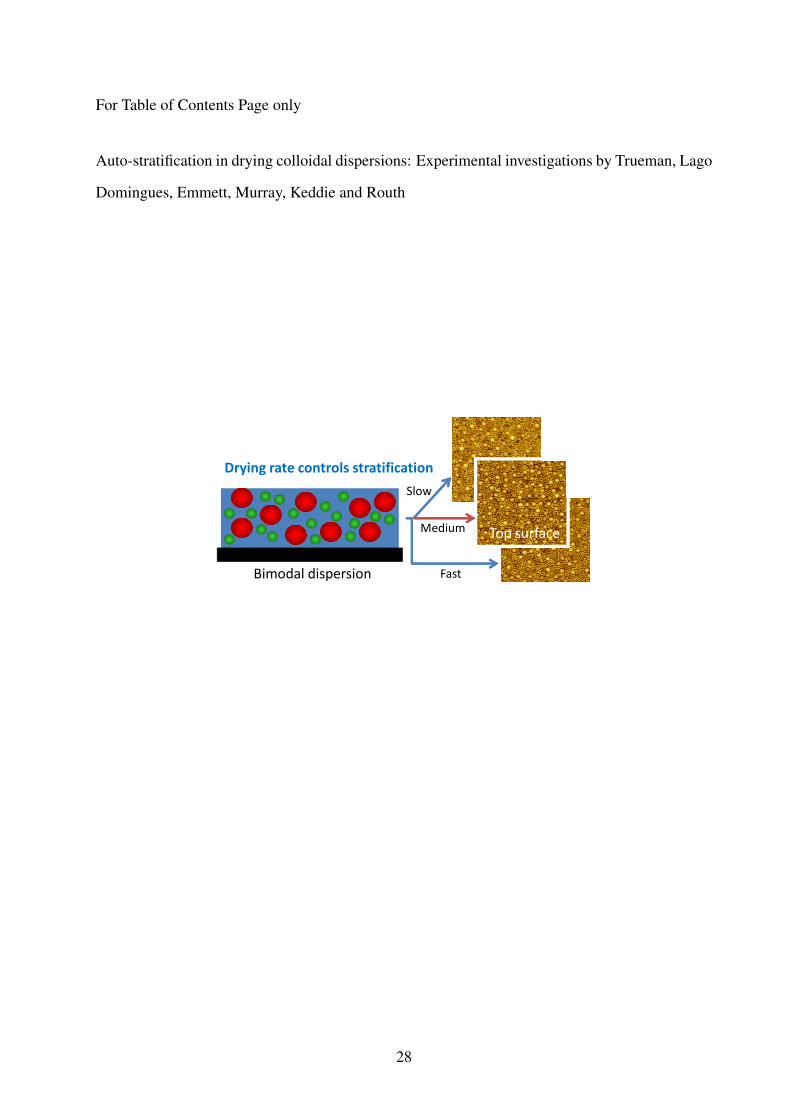
For Table of Contents Page only
Auto-stratification in drying colloidal dispersions: Experimental investigations by Trueman, Lago
Domingues, Emmett, Murray, Keddie and Routh
Bimodal dispersion
Drying rate controls stratification
Slow
Medium
Fast
Top surface
Bimodal dispersion Fast
28


![Lateral surface non-uniformities in drying latex filmsepubs.surrey.ac.uk/138273/1/text-aiche_revision-FINAL.pdf · colloidal dispersions or latex [1]. These dispersions consist of](https://img.pdfslide.net/doc/110x75/605f8b1d4b2cd852af5e3520/lateral-surface-non-uniformities-in-drying-latex-colloidal-dispersions-or-latex.jpg)


![Phase stability of dispersions of hollow silica nanocubes ...theoretically [42], experimental studies on the phase be-haviour of stable dispersions of colloidal nanocubes mixed with](https://img.pdfslide.net/doc/110x75/611b8326f18c574a142c3931/phase-stability-of-dispersions-of-hollow-silica-nanocubes-theoretically-42.jpg)