Embed Size (px)
Citation preview
Automated Detection of Lung Nodules withThree-dimensional Convolutional Neural Networks
Gustavo Perez and Pablo Arbelaez
Universidad de los Andes, Cra 1 N 18A - 12, Bogota, Colombia
ABSTRACT
Lung cancer is the cancer type with highest mortality rate worldwide. It has been shown that early detection withcomputer tomography (CT) scans can reduce deaths caused by this disease. Manual detection of cancer nodulesis costly and time-consuming. We present a general framework for the detection of nodules in lung CT images.Our method consists of the pre-processing of a patient’s CT with filtering and lung extraction from the entirevolume using a previously calculated mask for each patient. From the extracted lungs, we perform a candidategeneration stage using morphological operations, followed by the training of a three-dimensional convolutionalneural network for feature representation and classification of extracted candidates for false positive reduction.We perform experiments on the publicly available LIDC-IDRI dataset. Our candidate extraction approach iseffective to produce precise candidates with a recall of 99.6%. In addition, false positive reduction stage managesto successfully classify candidates and increases precision by a factor of 7.000.
Keywords: Lung cancer, lung nodules, deep learning, computer aided diagnosis
1. INTRODUCTION
Cancer is the main cause of death worldwide, accounting for 8.2 million deaths per year approximately. Lungcancer leads this list with 1.69 million deaths per year.1 Early detection with the aid of CT scans has shownto reduce lung cancer mortality by 16% to 20%, compared to standard chest x-ray among adults.2 In January2013, the American Cancer Society issued guidelines for the early detection of lung cancer based on a systematicreview of the evidence. These guidelines endorse a process of shared decision-making between clinicians whohave access to high-volume lung cancer screening programs.2 However, the consensus in lung-nodule detectionby radiologists is less than 60% when detecting nodules of any size.3 As shown in Figure 1, the difficulty inthe early diagnosis of lung cancer is due to the variability in shape and size of nodules, and the high unbalancebetween the nodules and other lung structures and tissues.
Figure 1. Examples of annotated nodules <3mm on the LIDC-IDRI dataset. Left. Juxtapleural nodule of diameter1.7mm. Right. Parenchymal nodule of diameter 2.7mm surrounded by vessels.
Further author information:Gustavo Perez: E-mail: [email protected]
A great amount of research has been conducted over the past two decades in computer-aided detection (CAD)systems for lung nodules in CT scans.45 A large number of systems for nodule detection have been proposed inthe literature.6 However, low sensitivity and high false-positive rates are still issues that prevent these systemsfrom being used in the daily clinical practice.
Recently, significant research has been done with the use of deep learning techniques, and its recent successfor detection, segmentation, and recognition on natural and medical images like detection of skin cancer7 makesinescapable the application of these machine learning methods for lung cancer CAD systems. Due to the vari-ability and the high unbalance between the nodules and other lung structures, handcrafted feature extractionis a difficult task. Learned features from a convolutional neural network yield conceptual abstractions by eachlayer in a hierarchical way and outperform handcrafted features.
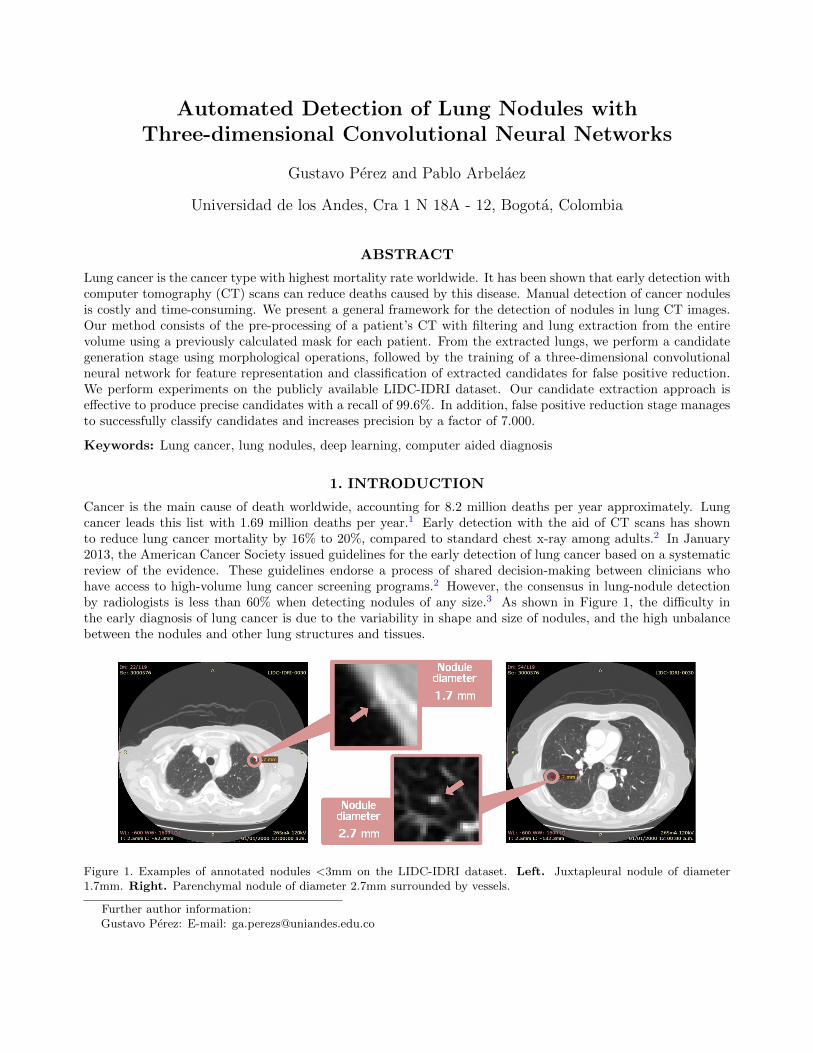
Our general framework is shown in Figure 2. To achieve the goal of nodule detection from a CT scan, weimplement a stage for pre-processing using filtering, and the lungs extraction from the entire volume using amask previously calculated for each patient. From the extracted lungs, we perform a candidate generation usingmorphological operations such as opening by reconstruction, the calculation of regional maxima, etc. We usethe extracted candidates to train a three-dimensional convolutional neural network for nodule classification andfalse positive reduction. We conduct experiments on the currently largest publicly available database for noduledetection, the LIDC-IDRI.3 We develop a computer-aided system for the detection of lung nodules that nearlyreaches human performance.
Figure 2. Proposed method: pre-processing for noise reduction and lung extraction with a mask, candidate generationwith morphological operations, and nodule classification with a three-dimensional convolutional neural network to reducefalse positives and increase precision.
2. RELATED WORK
Several algorithms rely on thresholding methods and morphological operations for nodule segmentation, followedby feature extraction and classification. In 2007, M. Dolejsi et al.8 proposed an algorithm for segmentation ofnodules in two separate ways, morphological closing and thresholding to find juxtapleural nodules and 3D blobdetector with multiscale filtration to locate non-pleural nodule candidates. For classification, linear and multi-threshold classifiers were used. In 2007, Osman et al.9 proposed a CAD system using template matching overthe 3D volume to generate candidates. The false positive reduction was made using connected components andthe sum of differences of densities in the surrounding pixels. In 2012, V. Sudha et al.10 proposed a globalthresholding algorithm following an iterative approach for lung volume extraction. The nodule segmentationstage was made by thresholding and morphological reconstruction. Another method, using template matchingfor nodule segmentation, was proposed by A.Tartar et al.11 in 2013. The false positive reduction was made bydecision trees. More algorithms using morphological operations for candidate extraction and different types ofclassifiers for false positive reduction have been proposed.1213
In the case of deep learning strategies, most of the research has focused on the classification of nodules startingfrom 2D or 3D nodule images using the LIDC-IDRI3 dataset,141516 the LUNA16 challenge dataset (which usesLIDC-IDRI), and the Multicentric Italian Lung Detection (MILD)17 trial.18 In these cases, the problem isaddressed as a classification of nodules from given candidate centroids detected with previously published CAD
systems.1920212223 The number of false positives to be classified is almost 25 times less than our extractedcandidates but the highest sensitivity reached by these methods is around 87% (in the candidate generationstage) for all sized nodules. Since the nodule classification algorithms are evaluated over the total previouslydetected nodules and not over the total ground-truth nodules of each patient, the classification of nodules frompreviously detected algorithms is a problem with a lower difficulty degree.
3. PROPOSED METHOD
3.1 Lung volume filtering and masking
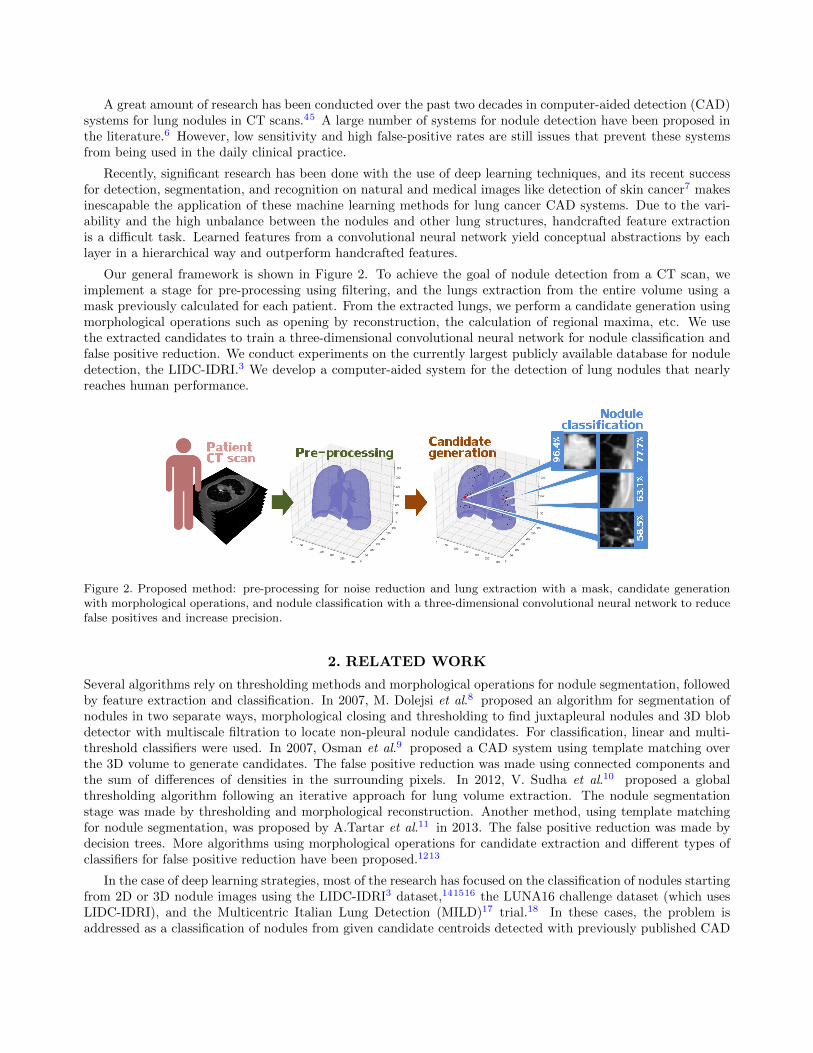
Figure 3. Volume filtering to reduce noise from the original patient’s CT scan. Left. Original volume. Right. Filteredvolume using median filter.
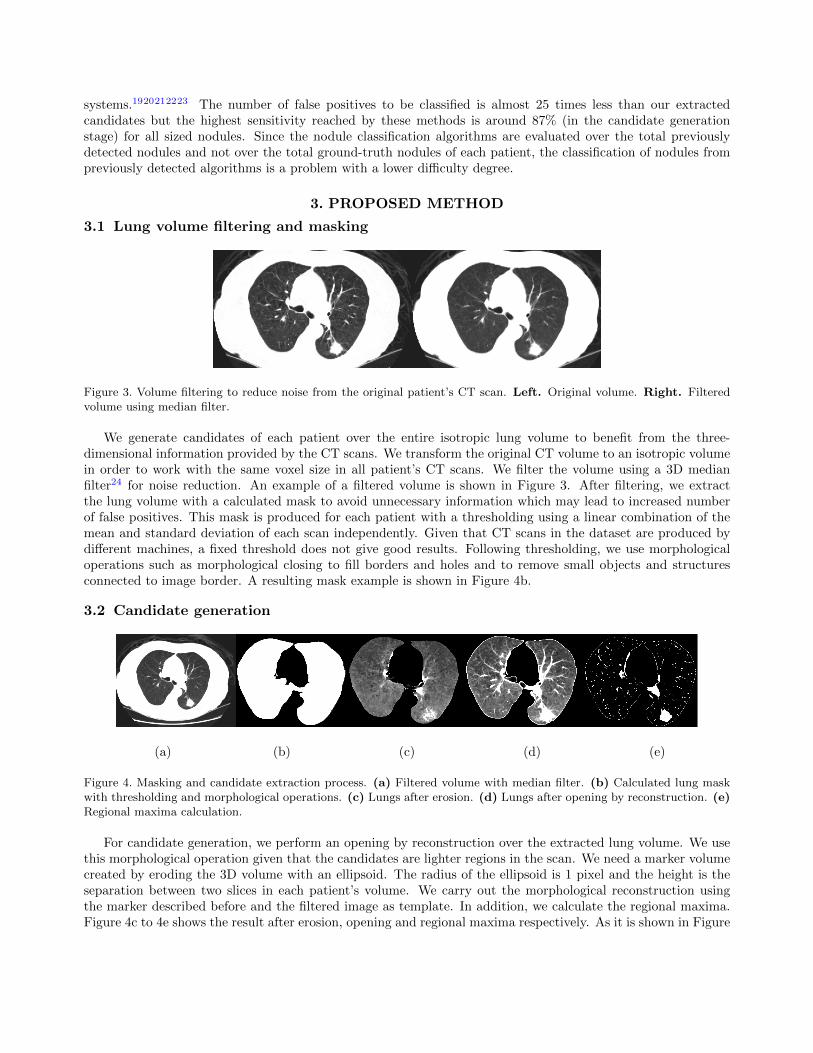
We generate candidates of each patient over the entire isotropic lung volume to benefit from the three-dimensional information provided by the CT scans. We transform the original CT volume to an isotropic volumein order to work with the same voxel size in all patient’s CT scans. We filter the volume using a 3D medianfilter24 for noise reduction. An example of a filtered volume is shown in Figure 3. After filtering, we extractthe lung volume with a calculated mask to avoid unnecessary information which may lead to increased numberof false positives. This mask is produced for each patient with a thresholding using a linear combination of themean and standard deviation of each scan independently. Given that CT scans in the dataset are produced bydifferent machines, a fixed threshold does not give good results. Following thresholding, we use morphologicaloperations such as morphological closing to fill borders and holes and to remove small objects and structuresconnected to image border. A resulting mask example is shown in Figure 4b.
3.2 Candidate generation
(a) (b) (c) (d) (e)
Figure 4. Masking and candidate extraction process. (a) Filtered volume with median filter. (b) Calculated lung maskwith thresholding and morphological operations. (c) Lungs after erosion. (d) Lungs after opening by reconstruction. (e)Regional maxima calculation.
For candidate generation, we perform an opening by reconstruction over the extracted lung volume. We usethis morphological operation given that the candidates are lighter regions in the scan. We need a marker volumecreated by eroding the 3D volume with an ellipsoid. The radius of the ellipsoid is 1 pixel and the height is theseparation between two slices in each patient’s volume. We carry out the morphological reconstruction usingthe marker described before and the filtered image as template. In addition, we calculate the regional maxima.Figure 4c to 4e shows the result after erosion, opening and regional maxima respectively. As it is shown in Figure
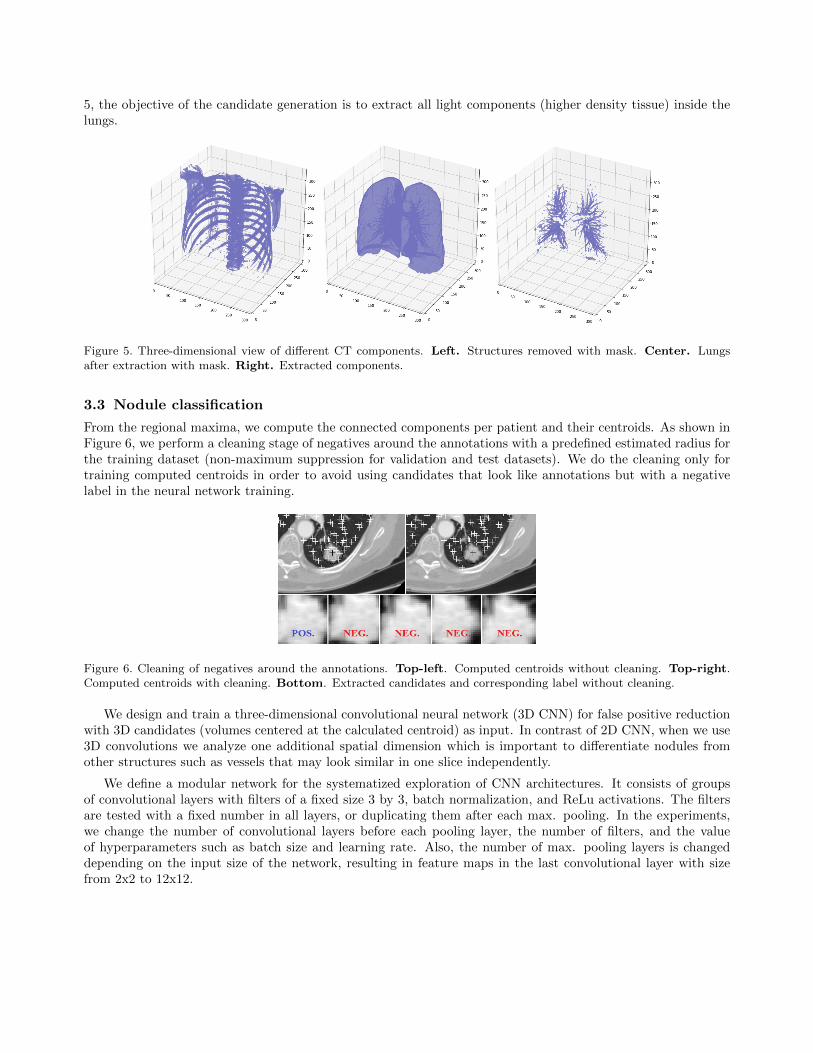
5, the objective of the candidate generation is to extract all light components (higher density tissue) inside thelungs.
Figure 5. Three-dimensional view of different CT components. Left. Structures removed with mask. Center. Lungsafter extraction with mask. Right. Extracted components.
3.3 Nodule classification
From the regional maxima, we compute the connected components per patient and their centroids. As shown inFigure 6, we perform a cleaning stage of negatives around the annotations with a predefined estimated radius forthe training dataset (non-maximum suppression for validation and test datasets). We do the cleaning only fortraining computed centroids in order to avoid using candidates that look like annotations but with a negativelabel in the neural network training.
Figure 6. Cleaning of negatives around the annotations. Top-left. Computed centroids without cleaning. Top-right.Computed centroids with cleaning. Bottom. Extracted candidates and corresponding label without cleaning.
We design and train a three-dimensional convolutional neural network (3D CNN) for false positive reductionwith 3D candidates (volumes centered at the calculated centroid) as input. In contrast of 2D CNN, when we use3D convolutions we analyze one additional spatial dimension which is important to differentiate nodules fromother structures such as vessels that may look similar in one slice independently.
We define a modular network for the systematized exploration of CNN architectures. It consists of groupsof convolutional layers with filters of a fixed size 3 by 3, batch normalization, and ReLu activations. The filtersare tested with a fixed number in all layers, or duplicating them after each max. pooling. In the experiments,we change the number of convolutional layers before each pooling layer, the number of filters, and the valueof hyperparameters such as batch size and learning rate. Also, the number of max. pooling layers is changeddepending on the input size of the network, resulting in feature maps in the last convolutional layer with sizefrom 2x2 to 12x12.
4. EXPERIMENTS
4.1 Dataset
The dataset is produced by the Lung Image Database Consortium (LIDC) and the Image Database ResourceInitiative (IDRI)3 with a total of 1.006 patients. It is publicly available in DICOM format and the radiologists’annotations in XML markup. The annotations are made by 4 radiologists in two stages; a blind stage and asecond unblinded stage where each radiologist is presented with the marks placed by all radiologists in the blindstage. For this project we consider lesions labeled as nodules for at least one specialist and included after theunblinded second stage.
Table 1 shows the consensus in lung-nodule detection by the four radiologists. As we can see, only 51,4% ofthe total included nodules after the unblinded second stage are detected by the 4 specialists, and only 27.8% ofthe total nodules from the blind initial stage. The consensus of 51.4%, which we will use as human performancefor this task, shows the difficulty of detecting lung nodules.
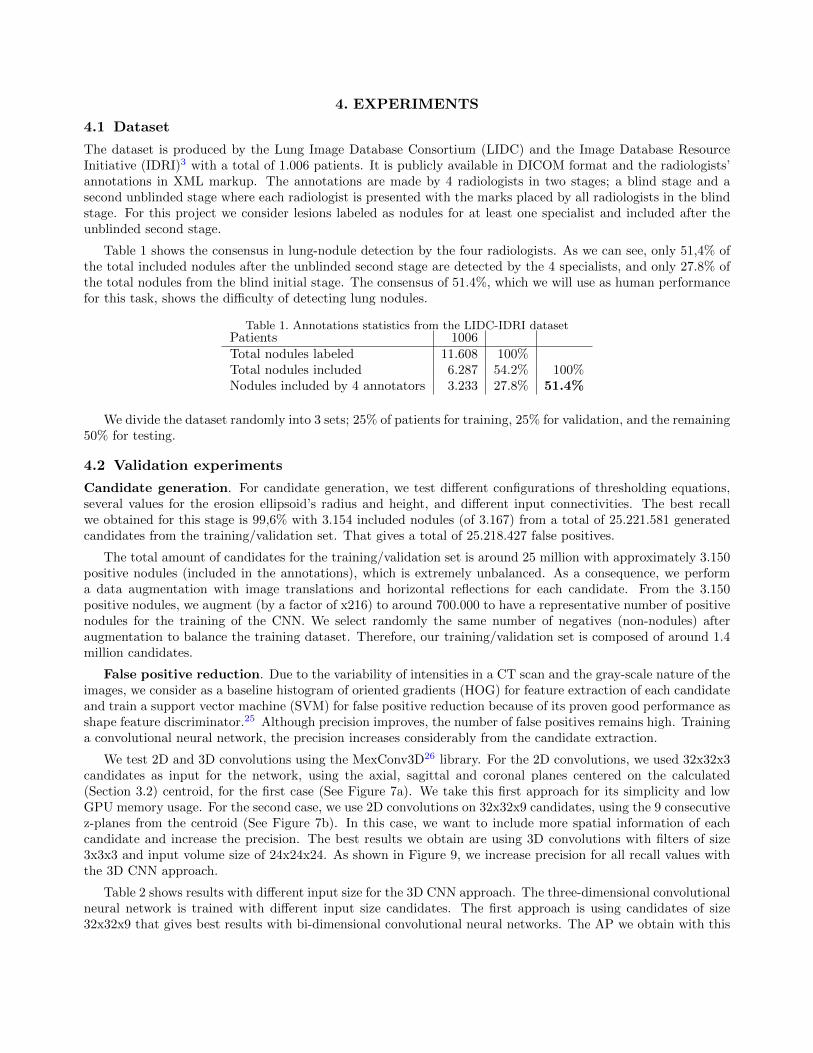
Table 1. Annotations statistics from the LIDC-IDRI datasetPatients 1006Total nodules labeled 11.608 100%Total nodules included 6.287 54.2% 100%Nodules included by 4 annotators 3.233 27.8% 51.4%
We divide the dataset randomly into 3 sets; 25% of patients for training, 25% for validation, and the remaining50% for testing.
4.2 Validation experiments
Candidate generation. For candidate generation, we test different configurations of thresholding equations,several values for the erosion ellipsoid’s radius and height, and different input connectivities. The best recallwe obtained for this stage is 99,6% with 3.154 included nodules (of 3.167) from a total of 25.221.581 generatedcandidates from the training/validation set. That gives a total of 25.218.427 false positives.
The total amount of candidates for the training/validation set is around 25 million with approximately 3.150positive nodules (included in the annotations), which is extremely unbalanced. As a consequence, we performa data augmentation with image translations and horizontal reflections for each candidate. From the 3.150positive nodules, we augment (by a factor of x216) to around 700.000 to have a representative number of positivenodules for the training of the CNN. We select randomly the same number of negatives (non-nodules) afteraugmentation to balance the training dataset. Therefore, our training/validation set is composed of around 1.4million candidates.
False positive reduction. Due to the variability of intensities in a CT scan and the gray-scale nature of theimages, we consider as a baseline histogram of oriented gradients (HOG) for feature extraction of each candidateand train a support vector machine (SVM) for false positive reduction because of its proven good performance asshape feature discriminator.25 Although precision improves, the number of false positives remains high. Traininga convolutional neural network, the precision increases considerably from the candidate extraction.
We test 2D and 3D convolutions using the MexConv3D26 library. For the 2D convolutions, we used 32x32x3candidates as input for the network, using the axial, sagittal and coronal planes centered on the calculated(Section 3.2) centroid, for the first case (See Figure 7a). We take this first approach for its simplicity and lowGPU memory usage. For the second case, we use 2D convolutions on 32x32x9 candidates, using the 9 consecutivez-planes from the centroid (See Figure 7b). In this case, we want to include more spatial information of eachcandidate and increase the precision. The best results we obtain are using 3D convolutions with filters of size3x3x3 and input volume size of 24x24x24. As shown in Figure 9, we increase precision for all recall values withthe 3D CNN approach.
Table 2 shows results with different input size for the 3D CNN approach. The three-dimensional convolutionalneural network is trained with different input size candidates. The first approach is using candidates of size32x32x9 that gives best results with bi-dimensional convolutional neural networks. The AP we obtain with this
(a) (b) (c)
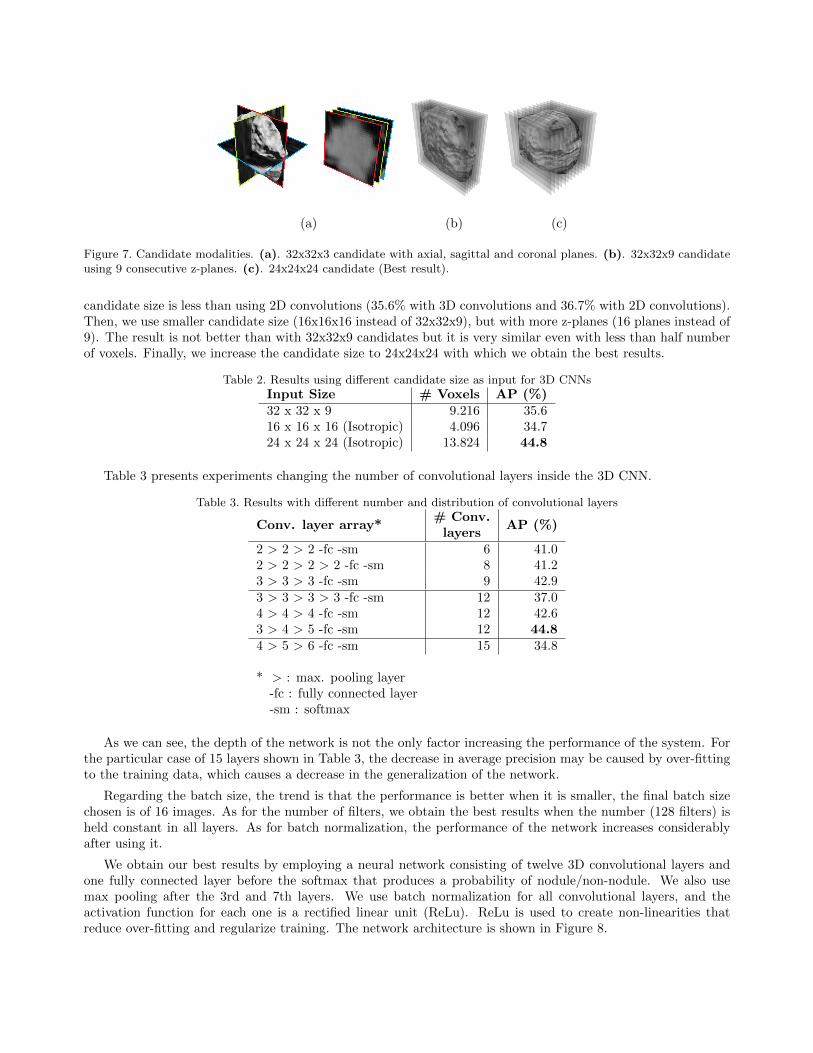
Figure 7. Candidate modalities. (a). 32x32x3 candidate with axial, sagittal and coronal planes. (b). 32x32x9 candidateusing 9 consecutive z-planes. (c). 24x24x24 candidate (Best result).
candidate size is less than using 2D convolutions (35.6% with 3D convolutions and 36.7% with 2D convolutions).Then, we use smaller candidate size (16x16x16 instead of 32x32x9), but with more z-planes (16 planes instead of9). The result is not better than with 32x32x9 candidates but it is very similar even with less than half numberof voxels. Finally, we increase the candidate size to 24x24x24 with which we obtain the best results.
Table 2. Results using different candidate size as input for 3D CNNsInput Size # Voxels AP (%)32 x 32 x 9 9.216 35.616 x 16 x 16 (Isotropic) 4.096 34.724 x 24 x 24 (Isotropic) 13.824 44.8
Table 3 presents experiments changing the number of convolutional layers inside the 3D CNN.
Table 3. Results with different number and distribution of convolutional layers
Conv. layer array*# Conv.
layersAP (%)
2 > 2 > 2 -fc -sm 6 41.02 > 2 > 2 > 2 -fc -sm 8 41.23 > 3 > 3 -fc -sm 9 42.93 > 3 > 3 > 3 -fc -sm 12 37.04 > 4 > 4 -fc -sm 12 42.63 > 4 > 5 -fc -sm 12 44.84 > 5 > 6 -fc -sm 15 34.8
* > : max. pooling layer-fc : fully connected layer-sm : softmax
As we can see, the depth of the network is not the only factor increasing the performance of the system. Forthe particular case of 15 layers shown in Table 3, the decrease in average precision may be caused by over-fittingto the training data, which causes a decrease in the generalization of the network.
Regarding the batch size, the trend is that the performance is better when it is smaller, the final batch sizechosen is of 16 images. As for the number of filters, we obtain the best results when the number (128 filters) isheld constant in all layers. As for batch normalization, the performance of the network increases considerablyafter using it.
We obtain our best results by employing a neural network consisting of twelve 3D convolutional layers andone fully connected layer before the softmax that produces a probability of nodule/non-nodule. We also usemax pooling after the 3rd and 7th layers. We use batch normalization for all convolutional layers, and theactivation function for each one is a rectified linear unit (ReLu). ReLu is used to create non-linearities thatreduce over-fitting and regularize training. The network architecture is shown in Figure 8.
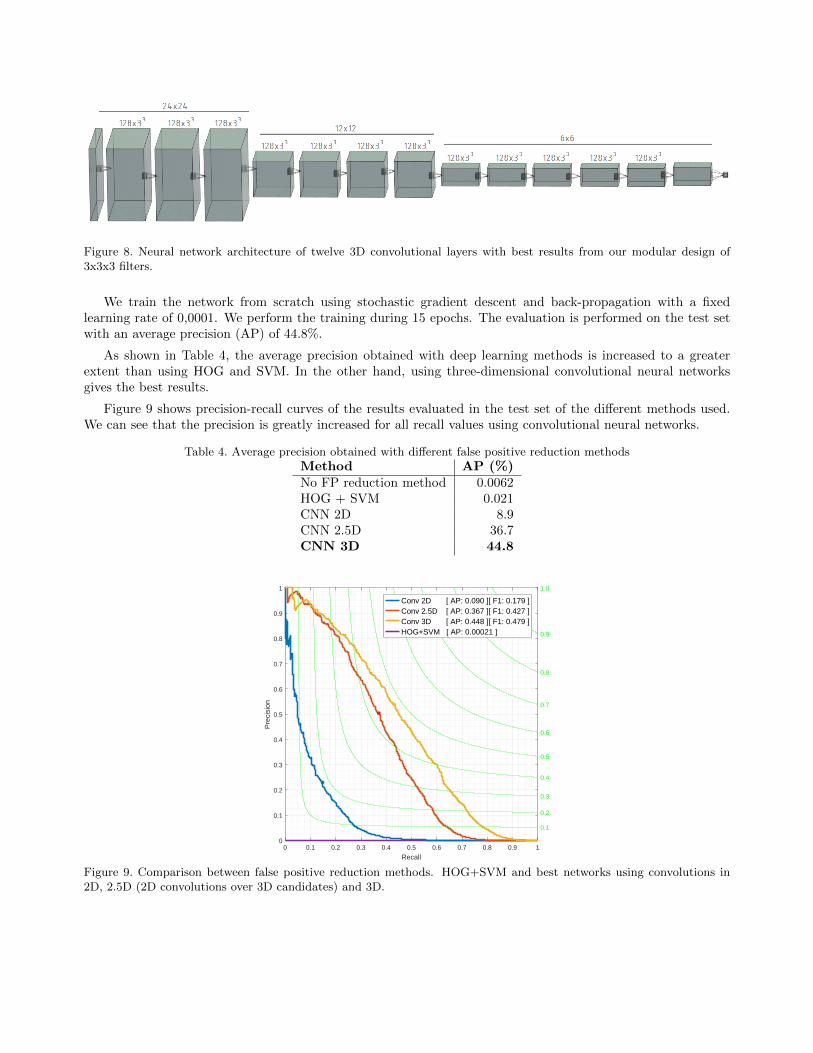
Figure 8. Neural network architecture of twelve 3D convolutional layers with best results from our modular design of3x3x3 filters.
We train the network from scratch using stochastic gradient descent and back-propagation with a fixedlearning rate of 0,0001. We perform the training during 15 epochs. The evaluation is performed on the test setwith an average precision (AP) of 44.8%.
As shown in Table 4, the average precision obtained with deep learning methods is increased to a greaterextent than using HOG and SVM. In the other hand, using three-dimensional convolutional neural networksgives the best results.
Figure 9 shows precision-recall curves of the results evaluated in the test set of the different methods used.We can see that the precision is greatly increased for all recall values using convolutional neural networks.
Table 4. Average precision obtained with different false positive reduction methodsMethod AP (%)No FP reduction method 0.0062HOG + SVM 0.021CNN 2D 8.9CNN 2.5D 36.7CNN 3D 44.8
0 0.1 0.2 0.3 0.4 0.5 0.6 0.7 0.8 0.9 1
Recall
0
0.1
0.2
0.3
0.4
0.5
0.6
0.7
0.8
0.9
1
Pre
cisi
on
0.1
0.2
0.3
0.4
0.5
0.6
0.7
0.8
0.9
1.0
Conv 2D [ AP: 0.090 ][ F1: 0.179 ]Conv 2.5D [ AP: 0.367 ][ F1: 0.427 ]Conv 3D [ AP: 0.448 ][ F1: 0.479 ]HOG+SVM [ AP: 0.00021 ]
Figure 9. Comparison between false positive reduction methods. HOG+SVM and best networks using convolutions in2D, 2.5D (2D convolutions over 3D candidates) and 3D.
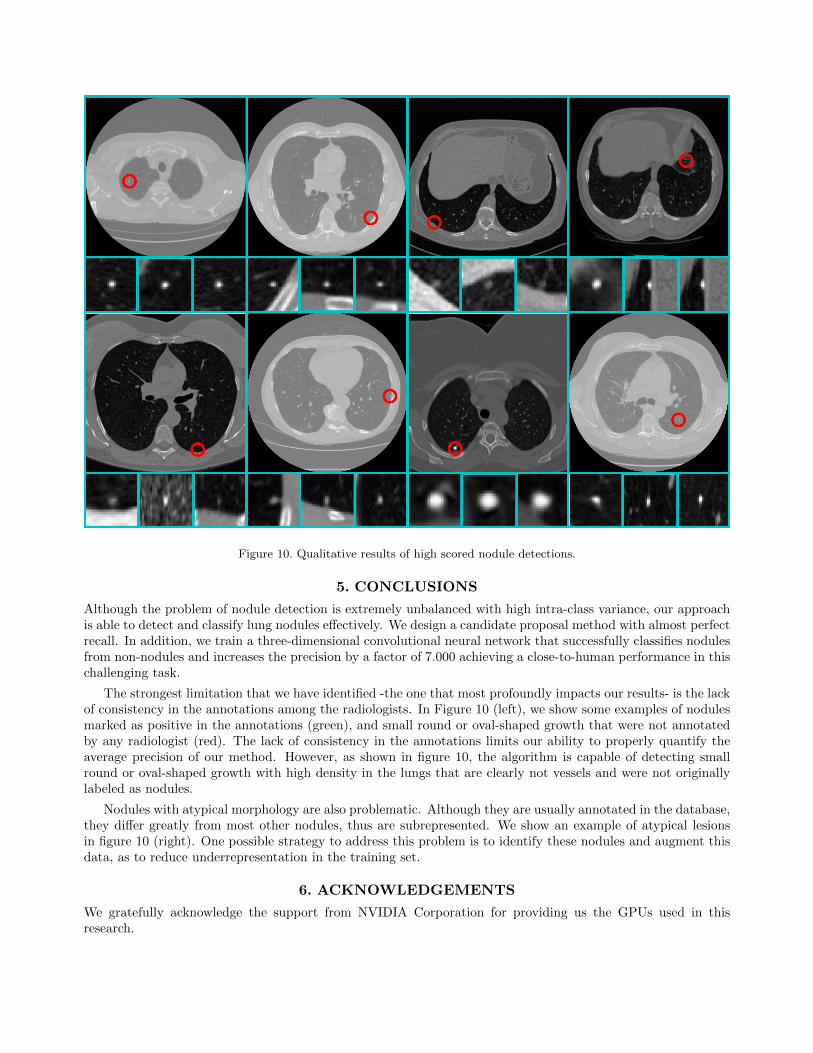
Figure 10. Qualitative results of high scored nodule detections.
5. CONCLUSIONS
Although the problem of nodule detection is extremely unbalanced with high intra-class variance, our approachis able to detect and classify lung nodules effectively. We design a candidate proposal method with almost perfectrecall. In addition, we train a three-dimensional convolutional neural network that successfully classifies nodulesfrom non-nodules and increases the precision by a factor of 7.000 achieving a close-to-human performance in thischallenging task.
The strongest limitation that we have identified -the one that most profoundly impacts our results- is the lackof consistency in the annotations among the radiologists. In Figure 10 (left), we show some examples of nodulesmarked as positive in the annotations (green), and small round or oval-shaped growth that were not annotatedby any radiologist (red). The lack of consistency in the annotations limits our ability to properly quantify theaverage precision of our method. However, as shown in figure 10, the algorithm is capable of detecting smallround or oval-shaped growth with high density in the lungs that are clearly not vessels and were not originallylabeled as nodules.
Nodules with atypical morphology are also problematic. Although they are usually annotated in the database,they differ greatly from most other nodules, thus are subrepresented. We show an example of atypical lesionsin figure 10 (right). One possible strategy to address this problem is to identify these nodules and augment thisdata, as to reduce underrepresentation in the training set.
6. ACKNOWLEDGEMENTS
We gratefully acknowledge the support from NVIDIA Corporation for providing us the GPUs used in thisresearch.
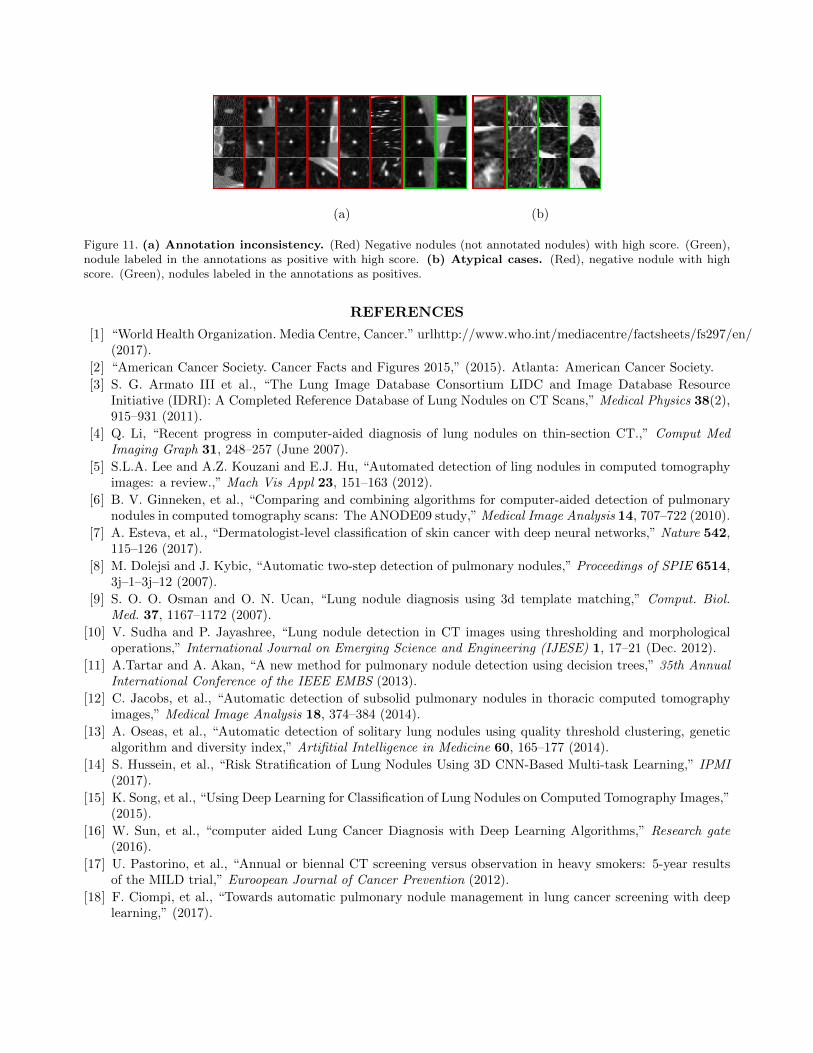
(a) (b)
Figure 11. (a) Annotation inconsistency. (Red) Negative nodules (not annotated nodules) with high score. (Green),nodule labeled in the annotations as positive with high score. (b) Atypical cases. (Red), negative nodule with highscore. (Green), nodules labeled in the annotations as positives.
REFERENCES
[1] “World Health Organization. Media Centre, Cancer.” urlhttp://www.who.int/mediacentre/factsheets/fs297/en/(2017).
[2] “American Cancer Society. Cancer Facts and Figures 2015,” (2015). Atlanta: American Cancer Society.
[3] S. G. Armato III et al., “The Lung Image Database Consortium LIDC and Image Database ResourceInitiative (IDRI): A Completed Reference Database of Lung Nodules on CT Scans,” Medical Physics 38(2),915–931 (2011).
[4] Q. Li, “Recent progress in computer-aided diagnosis of lung nodules on thin-section CT.,” Comput MedImaging Graph 31, 248–257 (June 2007).
[5] S.L.A. Lee and A.Z. Kouzani and E.J. Hu, “Automated detection of ling nodules in computed tomographyimages: a review.,” Mach Vis Appl 23, 151–163 (2012).
[6] B. V. Ginneken, et al., “Comparing and combining algorithms for computer-aided detection of pulmonarynodules in computed tomography scans: The ANODE09 study,” Medical Image Analysis 14, 707–722 (2010).
[7] A. Esteva, et al., “Dermatologist-level classification of skin cancer with deep neural networks,” Nature 542,115–126 (2017).
[8] M. Dolejsi and J. Kybic, “Automatic two-step detection of pulmonary nodules,” Proceedings of SPIE 6514,3j–1–3j–12 (2007).
[9] S. O. O. Osman and O. N. Ucan, “Lung nodule diagnosis using 3d template matching,” Comput. Biol.Med. 37, 1167–1172 (2007).
[10] V. Sudha and P. Jayashree, “Lung nodule detection in CT images using thresholding and morphologicaloperations,” International Journal on Emerging Science and Engineering (IJESE) 1, 17–21 (Dec. 2012).
[11] A.Tartar and A. Akan, “A new method for pulmonary nodule detection using decision trees,” 35th AnnualInternational Conference of the IEEE EMBS (2013).
[12] C. Jacobs, et al., “Automatic detection of subsolid pulmonary nodules in thoracic computed tomographyimages,” Medical Image Analysis 18, 374–384 (2014).
[13] A. Oseas, et al., “Automatic detection of solitary lung nodules using quality threshold clustering, geneticalgorithm and diversity index,” Artifitial Intelligence in Medicine 60, 165–177 (2014).
[14] S. Hussein, et al., “Risk Stratification of Lung Nodules Using 3D CNN-Based Multi-task Learning,” IPMI(2017).
[15] K. Song, et al., “Using Deep Learning for Classification of Lung Nodules on Computed Tomography Images,”(2015).
[16] W. Sun, et al., “computer aided Lung Cancer Diagnosis with Deep Learning Algorithms,” Research gate(2016).
[17] U. Pastorino, et al., “Annual or biennal CT screening versus observation in heavy smokers: 5-year resultsof the MILD trial,” Euroopean Journal of Cancer Prevention (2012).
[18] F. Ciompi, et al., “Towards automatic pulmonary nodule management in lung cancer screening with deeplearning,” (2017).
[19] K. Murphy, et al., “A large scale evaluation of automatic pulmonary nodule detection in chest CT usinglocal image features and k-nearest-neighbour classification,” Medical Image Analysis 13, 757–770 (2009).
[20] C. Jacobs, et al., “Automatic detection of subsolid pulmonary nodules in thoracic computed tomographyimages,” Medical Image Analysis 18, 374–384 (2014).
[21] A. Setio, et al., “Automatic detection of large pulmonary solid nodules in thoracic CT images,” MedicalPhysics 42, 5642–5653 (2015).
[22] M. Tan, et al., “A novel computer-aided lung nodule detection system for CT images,” Medical Physics 38,5630–5645 (2011).
[23] E. Torres, et al., “Large scale validation of the M5L lung CAD on heterogeneous CT datasets,” MedicalPhysics 42, 1477–1489 (2015).
[24] D. Garcia, “”Medfilt3.m”,” (2007).
[25] N. Dalal, et al., “Histograms of Oriented Gradients for Human Detection,” CVPR (2005).
[26] P. Sun, “MexConv3D.” urlhttps://github.com/pengsun/MexConv3D (2015).


![arXiv:1906.04962v2 [cs.CV] 12 Aug 2019 · Synthesizing Diverse Lung Nodules Wherever Massively: 3D Multi-Conditional GAN-based CT Image Augmentation for Object Detection Changhee](https://img.pdfslide.net/doc/110x75/5ffcc55051d7ec07482e017b/arxiv190604962v2-cscv-12-aug-2019-synthesizing-diverse-lung-nodules-wherever.jpg)