Embed Size (px)
Citation preview
Automated detection of pulmonary nodules in PET/CT images: Ensemble false-positive reduction using a convolutional neural network techniqueAtsushi Teramoto, Hiroshi Fujita, Osamu Yamamuro, and Tsuneo Tamaki Citation: Medical Physics 43, 2821 (2016); doi: 10.1118/1.4948498 View online: http://dx.doi.org/10.1118/1.4948498 View Table of Contents: http://scitation.aip.org/content/aapm/journal/medphys/43/6?ver=pdfcov Published by the American Association of Physicists in Medicine Articles you may be interested in Automatic detection of large pulmonary solid nodules in thoracic CT images Med. Phys. 42, 5642 (2015); 10.1118/1.4929562 Computer-aided detection of renal calculi from noncontrast CT images using TV-flow and MSER features Med. Phys. 42, 144 (2015); 10.1118/1.4903056 A novel computer-aided lung nodule detection system for CT images Med. Phys. 38, 5630 (2011); 10.1118/1.3633941 Massive-training support vector regression and Gaussian process for false-positive reduction in computer-aided detection of polyps in CT colonography Med. Phys. 38, 1888 (2011); 10.1118/1.3562898 Computer-aided diagnosis of pulmonary nodules on CT scans: Improvement of classification performancewith nodule surface features Med. Phys. 36, 3086 (2009); 10.1118/1.3140589
Automated detection of pulmonary nodules in PET/CT images: Ensemblefalse-positive reduction using a convolutional neural network technique
Atsushi Teramotoa)
Faculty of Radiological Technology, School of Health Sciences, Fujita Health University, 1-98 Dengakugakubo,Kutsukake, Toyoake, Aichi 470-1192, Japan
Hiroshi FujitaDepartment of Intelligent Image Information, Division of Regeneration and Advanced Medical Sciences,Graduate School of Medicine, Gifu University, 1-1 Yanagido, Gifu 501-1194, Japan
Osamu Yamamuro and Tsuneo TamakiEast Nagoya Imaging Diagnosis Center, 3-4-26 Jiyugaoka, Chikusa-ku, Nagoya, Aichi 464-0044, Japan
(Received 29 December 2015; revised 25 March 2016; accepted for publication 14 April 2016;published 13 May 2016)
Purpose: Automated detection of solitary pulmonary nodules using positron emission tomography(PET) and computed tomography (CT) images shows good sensitivity; however, it is difficult to detectnodules in contact with normal organs, and additional efforts are needed so that the number of falsepositives (FPs) can be further reduced. In this paper, the authors propose an improved FP-reductionmethod for the detection of pulmonary nodules in PET/CT images by means of convolutional neuralnetworks (CNNs).Methods: The overall scheme detects pulmonary nodules using both CT and PET images. In the CTimages, a massive region is first detected using an active contour filter, which is a type of contrastenhancement filter that has a deformable kernel shape. Subsequently, high-uptake regions detected bythe PET images are merged with the regions detected by the CT images. FP candidates are eliminatedusing an ensemble method; it consists of two feature extractions, one by shape/metabolic featureanalysis and the other by a CNN, followed by a two-step classifier, one step being rule based and theother being based on support vector machines.Results: The authors evaluated the detection performance using 104 PET/CT images collected by acancer-screening program. The sensitivity in detecting candidates at an initial stage was 97.2%, with72.8 FPs/case. After performing the proposed FP-reduction method, the sensitivity of detection was90.1%, with 4.9 FPs/case; the proposed method eliminated approximately half the FPs existing in theprevious study.Conclusions: An improved FP-reduction scheme using CNN technique has been developed for thedetection of pulmonary nodules in PET/CT images. The authors’ ensemble FP-reduction methodeliminated 93% of the FPs; their proposed method using CNN technique eliminates approximatelyhalf the FPs existing in the previous study. These results indicate that their method may be useful in thecomputer-aided detection of pulmonary nodules using PET/CT images. C 2016 Author(s). All articlecontent, except where otherwise noted, is licensed under a Creative Commons Attribution (CC BY)license (http://creativecommons.org/licenses/by/4.0/). [http://dx.doi.org/10.1118/1.4948498]
Key words: lung, nodule, computer-aided detection, false-positive reduction, convolutional neuralnetwork, PET/CT
1. INTRODUCTION
Lung cancer is the leading cause of cancer-related deathsamong men.1 Consequently, early detection is essential fordecreasing the number of cancer-related deaths. X-raycomputed tomography (CT) was recently adopted as a mass-screening tool for lung cancer diagnosis,2 enabling rapidimprovement in the ability to detect tumors early. Accord-ing to the results from the National Lung Screening Trial,3
screening using low-dose CT decreases lung cancer-relateddeaths among smokers by 20%. Therefore, it is expected thata greater number of CT examinations will be adopted for lungscreening in the future. Of late, positron emission tomography(PET)/CT is also being used as a cancer screening tool.4,5
PET/CT is an imaging technique that provides both metabolicand anatomical information; therefore, it is also useful forthe early detection of lung cancer. However, radiologists mustexamine a large number of images.
Computer-aided detection () provides a computerizedreport as a second opinion to assist a radiologist in a diagnosisand is expected to assist radiologists who are required to eval-uate a large number of images to identify lesions and arrive at adiagnosis. In this study, we focused on the automated detectionof pulmonary nodules using PET/CT images. PET/CT exam-ination was conducted for both screening and localizationof tumors. Therefore, we first develop the scheme fornodule detection in PET/CT images to be applied for bothobjectives.
2821 Med. Phys. 43 (6), June 2016 0094-2405/2016/43(6)/2821/7 © Author(s) 2016. 2821
2822 Teramoto et al.: FP reduction for pulmonary nodule detection using CNN 2822
1.A. Related works
Many lung tumor segmentation methods have been pro-posed for schemes for PET/CT images.6 Ballangan et al.reported lung tumor segmentation by using graph cuts andshowed that volume measurement error between segmenta-tion result and manual delineations was smaller than those byconventional methods.9 Wang et al. developed a tumor delinea-tion method by using tumor-background likelihood models inPET/CT images.8 As a result of evaluation using 40 patients,dice similarity coefficient (DSC) was 0.80 for simple group(nodules whose boundaries were clear) and 0.77 for complexgroups (nodules abutted or extended into normal tissue). Cuiet al. proposed a lung tumor segmentation method in PET/CTimages by using intensity graphing and topology graphing.7
Shape similarities between segmentation result and manualdelineations using DSC were 0.88 for simple group and 0.87for complex group.
With regard to the automated detection schemes of pulmo-nary diseases using PET/CT images, several schemes werereported.10–12 Cui et al. reported the hot spot detection usingthresholding and found that 96.7% of hot-spots were detectedcorrectly.10 Song et al. studied the lesion detection and charac-terization in the lung by using context driven approximation;out of 158 hot-spot lesions, 157 lesions were detected.12
Most of the methods described in these studies detectedpulmonary nodules and masses from PET images alone; CTimages were only used for identification of the lung regionbecause the image quality of CT images for attenuation correc-tion was insufficient. Improvements in modern PET/CT scan-ning technology have improved the quality of CT images;however, radiologists currently rely on CT images to detectwell-differentiated pulmonary nodules, which can be detectedonly from CT images. Because radiologists currently identifynodules from both PET and CT images, it is better to detectnodules through using both PET and CT images.
In our first study, however, an automated scheme for thedetection of pulmonary nodules making use of both CT andPET images was developed.13 The detection sensitivity was90.0%, and the corresponding number of false-positive (FP)detections per case was 17.0. Furthermore, we improved detec-tion capability by using a nodule enhancing method with anactive contour technique and showed that the sensitivity of
detection was 90.0%, with 9.8 FPs/case.14 However, there stillexists a higher number of FPs. For practical use, therefore, afurther improvement in the FP-reduction technique is stronglyrequired.
1.B. Objective
In this study, we propose an improved FP-reduction schemefor the detection of pulmonary nodules in PET/CT images.A major objective of our study is to develop an ensembleFP-reduction method using a convolutional neural network(CNN), which has attracted attention in the artificial intelli-gence and brain science fields in addition to the conventionalmethod using shape/metabolic features.
In this paper, the architecture of an improved FP-reductionscheme for the detection of pulmonary nodules is described.In addition, the detection performance as evaluated with theoriginal PET/CT image database has also been discussed.
2. METHODOLOGY2.A. Overview
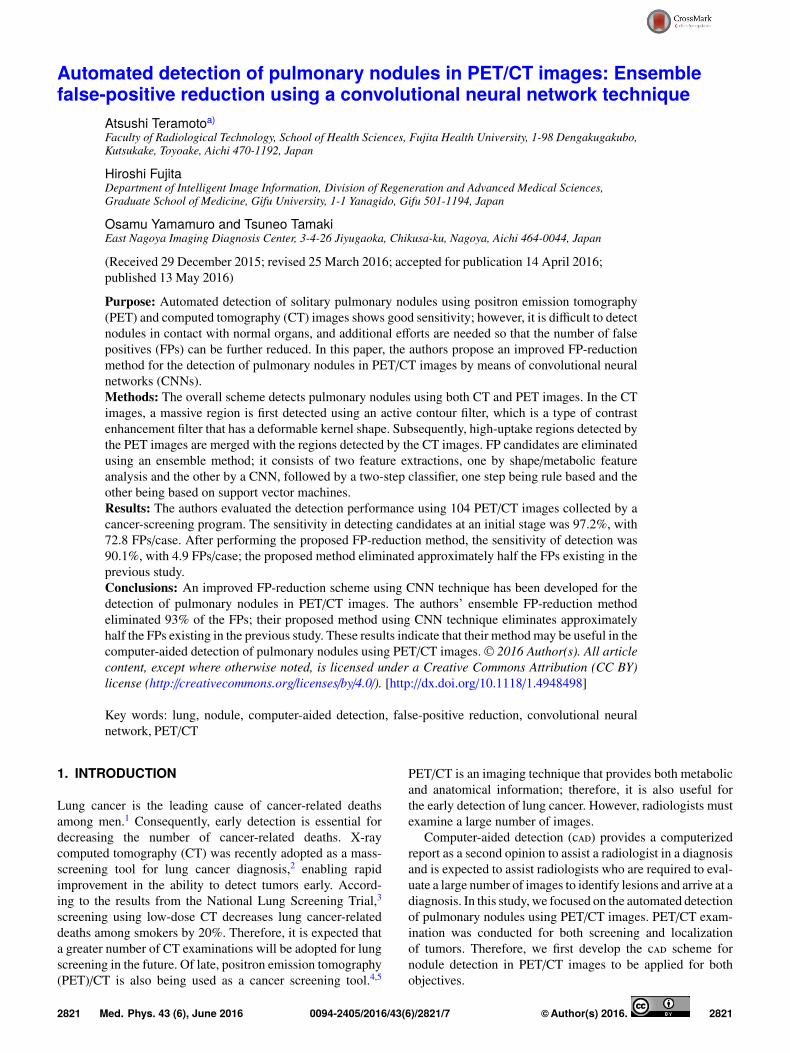
The outline of our overall scheme for the detection ofpulmonary nodules is shown in Fig. 1. First, initial nodulecandidates were identified separately on the PET and CT im-ages using the algorithm specific to each image type. Subse-quently, candidate regions obtained from the two images werecombined. FPs contained in the initial candidates were elim-inated by an ensemble method using multistep classifiers oncharacteristic features obtained by a shape/metabolic analysisand a CNN.
2.B. Initial nodule detection
With regard to the detection in CT images, the massive re-gion was first enhanced using an active contour filter (ACF),14
which is a type of contrast-enhancement filter that has adeformable kernel shape. The active contour involves theseveral nodes that are connected to each other. We define theevaluation function of the active contour as the maximum pixelvalue on the connected lines. The nodes move iteratively inorder to minimize the evaluation function. Thus, the activecontour encloses the nodule without touching normal organs
F. 1. Proposed overall scheme for detecting lung nodules in PET/CT images.
Medical Physics, Vol. 43, No. 6, June 2016
2823 Teramoto et al.: FP reduction for pulmonary nodule detection using CNN 2823
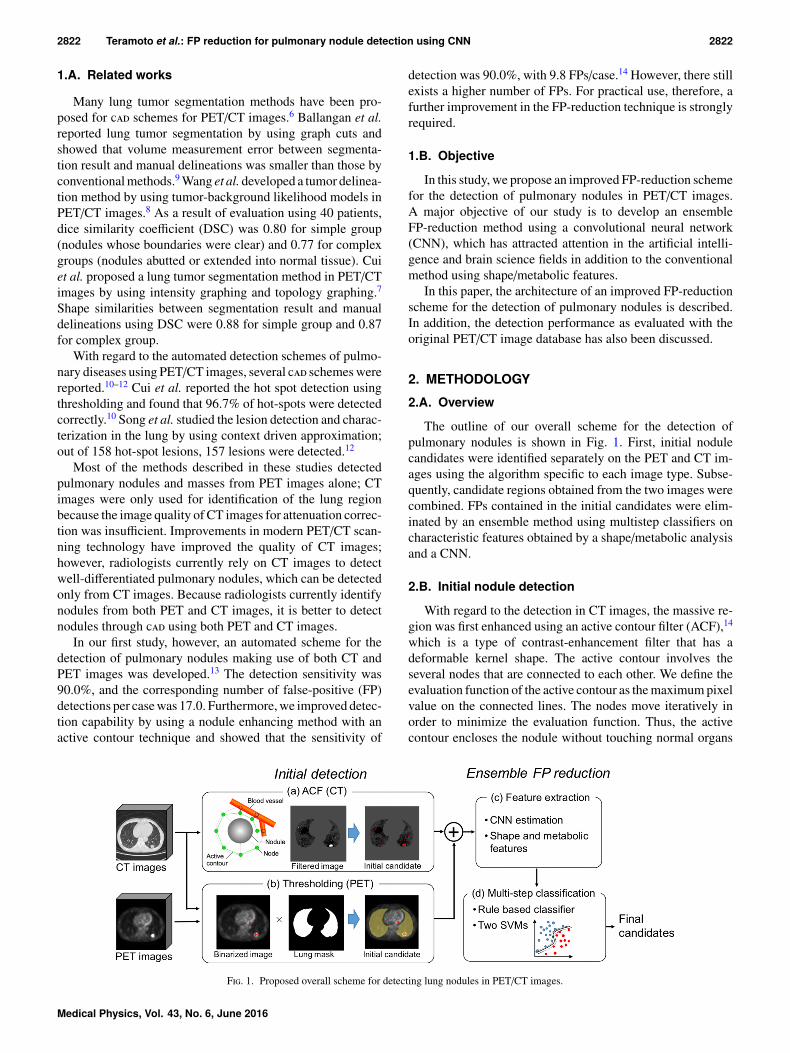
F. 2. Difficult examples of FPs along with their contours, all of which were not removed by our previous FP-reduction method (Ref. 14). However, all of themwere correctly identified as FPs by our new method.
such as blood vessels and lung wall. The final output of theACF is the difference between the maximum pixel value onthe active contour and the pixel value at the center of the filterkernel. Detailed procedures and figures pertaining to ACF areshown in our previous report.14
Applying ACF to the original image causes pixel values torise for massive structures and drop on continuous structures(such as blood vessels and lung walls). The initial noduleregions were segmented by thresholding the enhanced imagesfollowed by labeling.
The PET images were subsequently binarized using a pre-determined threshold to detect regions of increased uptake.Here, candidate regions other than the lungs were eliminatedusing the lung regions obtained by CT images.
Initial candidate regions detected on CT and PET wererepresented as binary images. The two images were then com-bined using the logical OR function. Following pixel-by-pixelconfirmation of regions on both images, a region detected byat least one modality was treated as an initial candidate region.
2.C. Ensemble false-positive reduction
2.C.1. Outline
FPs included in the initial candidates are composed mainlyof narrow bronchi and blood vessels in the lung. In addi-
tion, most of the FPs in the initial candidates in PET im-ages are due to the physiological uptakes in myocardial andliver regions adjacent to the lungs. Therefore, the integrationof both shape features from CT images and metabolic fea-tures from PET images can be considered to eliminate theFPs.13 However, some FPs represent image features that aresimilar to nodules, as shown in Fig. 2; our previous methodcould not represent the valid features sufficiently by usingshape and metabolic features in order to differentiate andeliminate them.
In order to eliminate such FPs while maintaining the valueof true positives (TPs), this study focused on CNN, which isa type of deep learning architecture.15 CNN was inspired bybiological processes and specifically designed to emulate thebehavior of visual systems. CNN has the capability to learnrepresentations of input data by using multiple levels of featureextraction. In some image recognition trials, results weredramatically improved using CNN.16,17 Studies indicated thatCNN might be used to reduce FPs by generating novel validfeatures that were not generated by the shape and metabolicfeatures used in conventional FP-reduction methods. There-fore, the novel ensemble FP-reduction method was developedfor this study by incorporating the CNN technique into our pre-vious FP-reduction technique that used shape and metabolicfeatures.
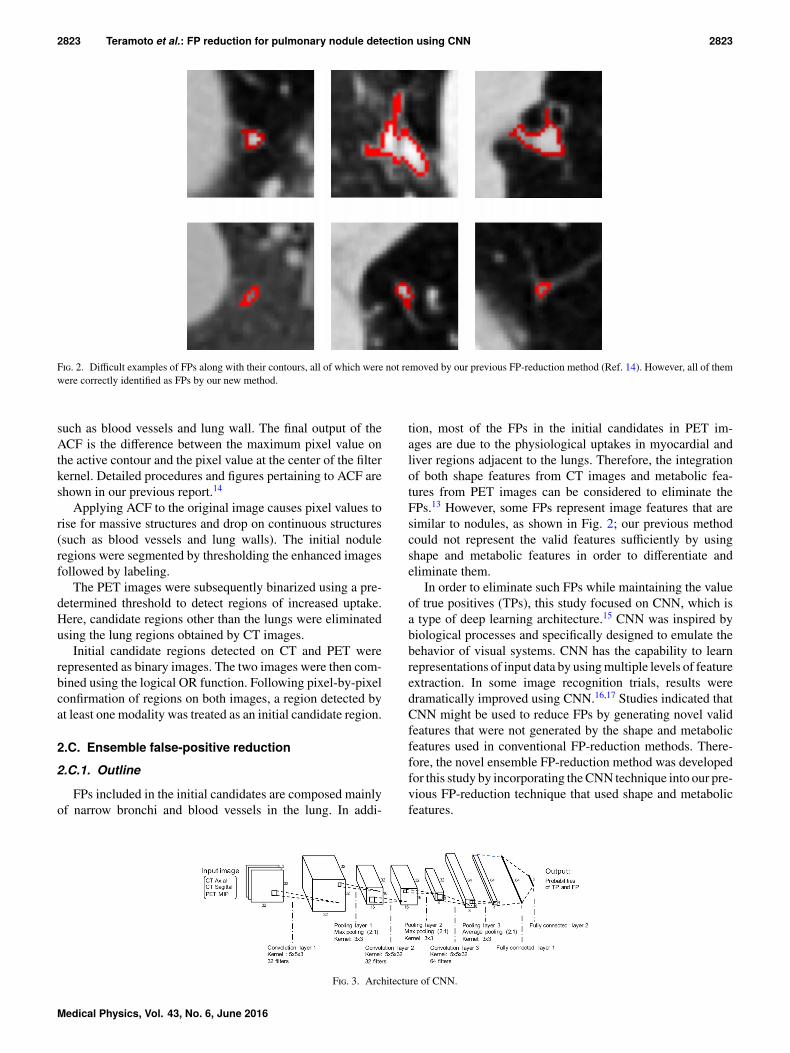
F. 3. Architecture of CNN.
Medical Physics, Vol. 43, No. 6, June 2016
2824 Teramoto et al.: FP reduction for pulmonary nodule detection using CNN 2824
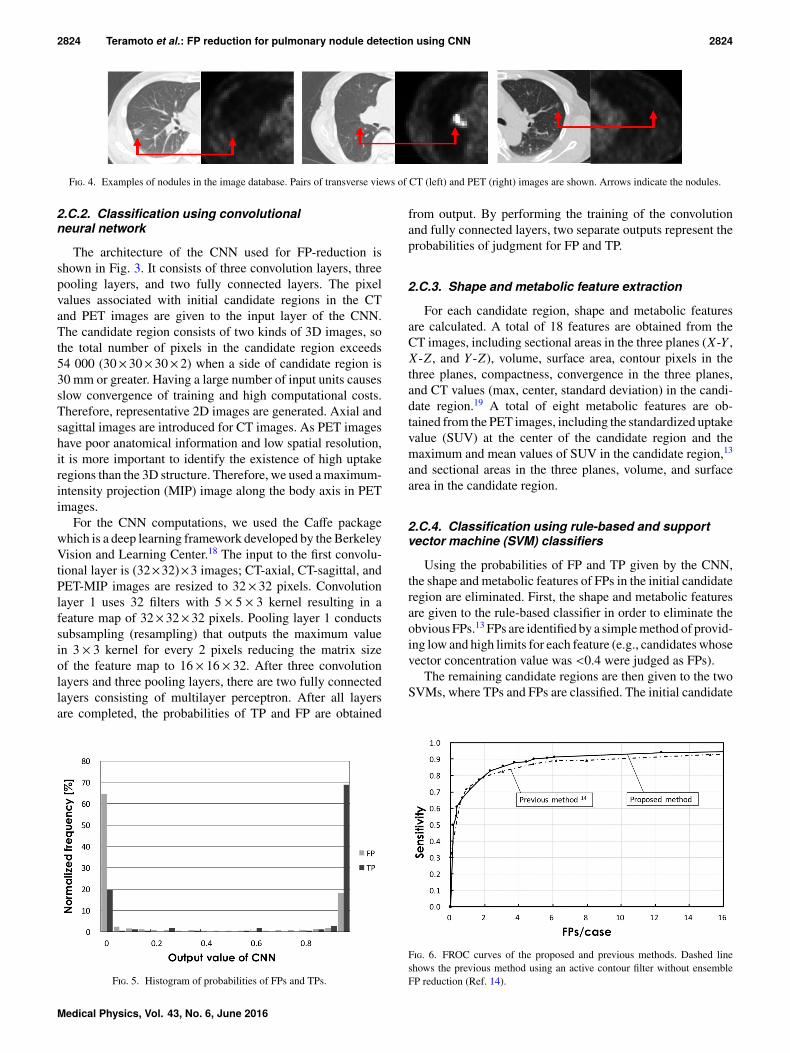
F. 4. Examples of nodules in the image database. Pairs of transverse views of CT (left) and PET (right) images are shown. Arrows indicate the nodules.
2.C.2. Classification using convolutionalneural network
The architecture of the CNN used for FP-reduction isshown in Fig. 3. It consists of three convolution layers, threepooling layers, and two fully connected layers. The pixelvalues associated with initial candidate regions in the CTand PET images are given to the input layer of the CNN.The candidate region consists of two kinds of 3D images, sothe total number of pixels in the candidate region exceeds54 000 (30× 30× 30× 2) when a side of candidate region is30 mm or greater. Having a large number of input units causesslow convergence of training and high computational costs.Therefore, representative 2D images are generated. Axial andsagittal images are introduced for CT images. As PET imageshave poor anatomical information and low spatial resolution,it is more important to identify the existence of high uptakeregions than the 3D structure. Therefore, we used a maximum-intensity projection (MIP) image along the body axis in PETimages.
For the CNN computations, we used the Caffe packagewhich is a deep learning framework developed by the BerkeleyVision and Learning Center.18 The input to the first convolu-tional layer is (32×32)×3 images; CT-axial, CT-sagittal, andPET-MIP images are resized to 32× 32 pixels. Convolutionlayer 1 uses 32 filters with 5 × 5 × 3 kernel resulting in afeature map of 32×32×32 pixels. Pooling layer 1 conductssubsampling (resampling) that outputs the maximum valuein 3 × 3 kernel for every 2 pixels reducing the matrix sizeof the feature map to 16× 16× 32. After three convolutionlayers and three pooling layers, there are two fully connectedlayers consisting of multilayer perceptron. After all layersare completed, the probabilities of TP and FP are obtained
F. 5. Histogram of probabilities of FPs and TPs.
from output. By performing the training of the convolutionand fully connected layers, two separate outputs represent theprobabilities of judgment for FP and TP.
2.C.3. Shape and metabolic feature extraction
For each candidate region, shape and metabolic featuresare calculated. A total of 18 features are obtained from theCT images, including sectional areas in the three planes (X-Y ,X-Z , and Y -Z), volume, surface area, contour pixels in thethree planes, compactness, convergence in the three planes,and CT values (max, center, standard deviation) in the candi-date region.19 A total of eight metabolic features are ob-tained from the PET images, including the standardized uptakevalue (SUV) at the center of the candidate region and themaximum and mean values of SUV in the candidate region,13
and sectional areas in the three planes, volume, and surfacearea in the candidate region.
2.C.4. Classification using rule-based and supportvector machine (SVM) classifiers
Using the probabilities of FP and TP given by the CNN,the shape and metabolic features of FPs in the initial candidateregion are eliminated. First, the shape and metabolic featuresare given to the rule-based classifier in order to eliminate theobvious FPs.13 FPs are identified by a simple method of provid-ing low and high limits for each feature (e.g., candidates whosevector concentration value was <0.4 were judged as FPs).
The remaining candidate regions are then given to the twoSVMs, where TPs and FPs are classified. The initial candidate
F. 6. FROC curves of the proposed and previous methods. Dashed lineshows the previous method using an active contour filter without ensembleFP reduction (Ref. 14).
Medical Physics, Vol. 43, No. 6, June 2016
2825 Teramoto et al.: FP reduction for pulmonary nodule detection using CNN 2825
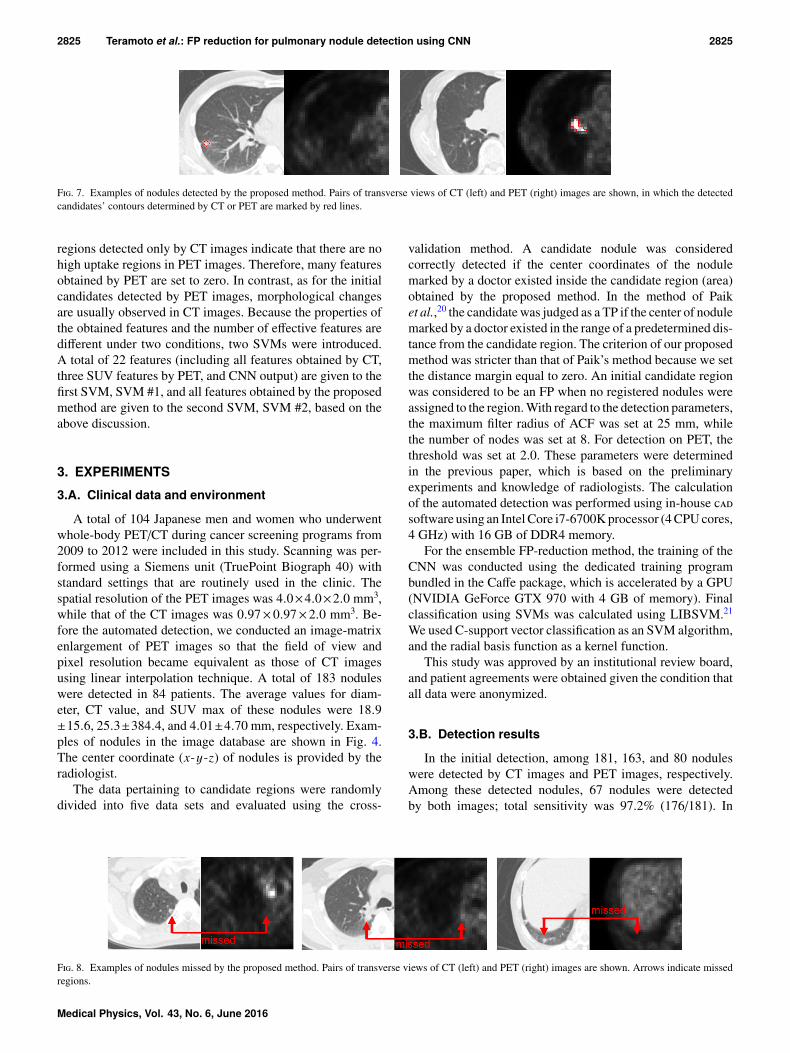
F. 7. Examples of nodules detected by the proposed method. Pairs of transverse views of CT (left) and PET (right) images are shown, in which the detectedcandidates’ contours determined by CT or PET are marked by red lines.
regions detected only by CT images indicate that there are nohigh uptake regions in PET images. Therefore, many featuresobtained by PET are set to zero. In contrast, as for the initialcandidates detected by PET images, morphological changesare usually observed in CT images. Because the properties ofthe obtained features and the number of effective features aredifferent under two conditions, two SVMs were introduced.A total of 22 features (including all features obtained by CT,three SUV features by PET, and CNN output) are given to thefirst SVM, SVM #1, and all features obtained by the proposedmethod are given to the second SVM, SVM #2, based on theabove discussion.
3. EXPERIMENTS3.A. Clinical data and environment
A total of 104 Japanese men and women who underwentwhole-body PET/CT during cancer screening programs from2009 to 2012 were included in this study. Scanning was per-formed using a Siemens unit (TruePoint Biograph 40) withstandard settings that are routinely used in the clinic. Thespatial resolution of the PET images was 4.0×4.0×2.0 mm3,while that of the CT images was 0.97×0.97×2.0 mm3. Be-fore the automated detection, we conducted an image-matrixenlargement of PET images so that the field of view andpixel resolution became equivalent as those of CT imagesusing linear interpolation technique. A total of 183 noduleswere detected in 84 patients. The average values for diam-eter, CT value, and SUV max of these nodules were 18.9±15.6, 25.3±384.4, and 4.01±4.70 mm, respectively. Exam-ples of nodules in the image database are shown in Fig. 4.The center coordinate (x-y-z) of nodules is provided by theradiologist.
The data pertaining to candidate regions were randomlydivided into five data sets and evaluated using the cross-
validation method. A candidate nodule was consideredcorrectly detected if the center coordinates of the nodulemarked by a doctor existed inside the candidate region (area)obtained by the proposed method. In the method of Paiket al.,20 the candidate was judged as a TP if the center of nodulemarked by a doctor existed in the range of a predetermined dis-tance from the candidate region. The criterion of our proposedmethod was stricter than that of Paik’s method because we setthe distance margin equal to zero. An initial candidate regionwas considered to be an FP when no registered nodules wereassigned to the region. With regard to the detection parameters,the maximum filter radius of ACF was set at 25 mm, whilethe number of nodes was set at 8. For detection on PET, thethreshold was set at 2.0. These parameters were determinedin the previous paper, which is based on the preliminaryexperiments and knowledge of radiologists. The calculationof the automated detection was performed using in-house software using an Intel Core i7-6700K processor (4 CPU cores,4 GHz) with 16 GB of DDR4 memory.
For the ensemble FP-reduction method, the training of theCNN was conducted using the dedicated training programbundled in the Caffe package, which is accelerated by a GPU(NVIDIA GeForce GTX 970 with 4 GB of memory). Finalclassification using SVMs was calculated using LIBSVM.21
We used C-support vector classification as an SVM algorithm,and the radial basis function as a kernel function.
This study was approved by an institutional review board,and patient agreements were obtained given the condition thatall data were anonymized.
3.B. Detection results
In the initial detection, among 181, 163, and 80 noduleswere detected by CT images and PET images, respectively.Among these detected nodules, 67 nodules were detectedby both images; total sensitivity was 97.2% (176/181). In
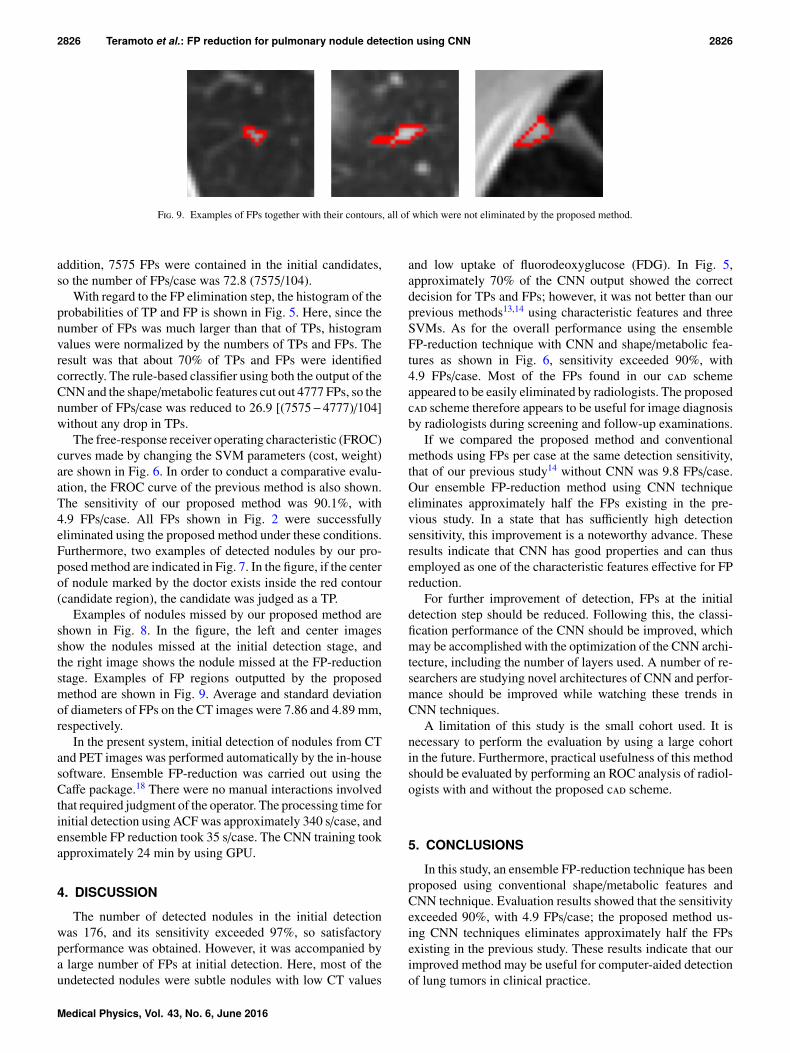
F. 8. Examples of nodules missed by the proposed method. Pairs of transverse views of CT (left) and PET (right) images are shown. Arrows indicate missedregions.
Medical Physics, Vol. 43, No. 6, June 2016
2826 Teramoto et al.: FP reduction for pulmonary nodule detection using CNN 2826
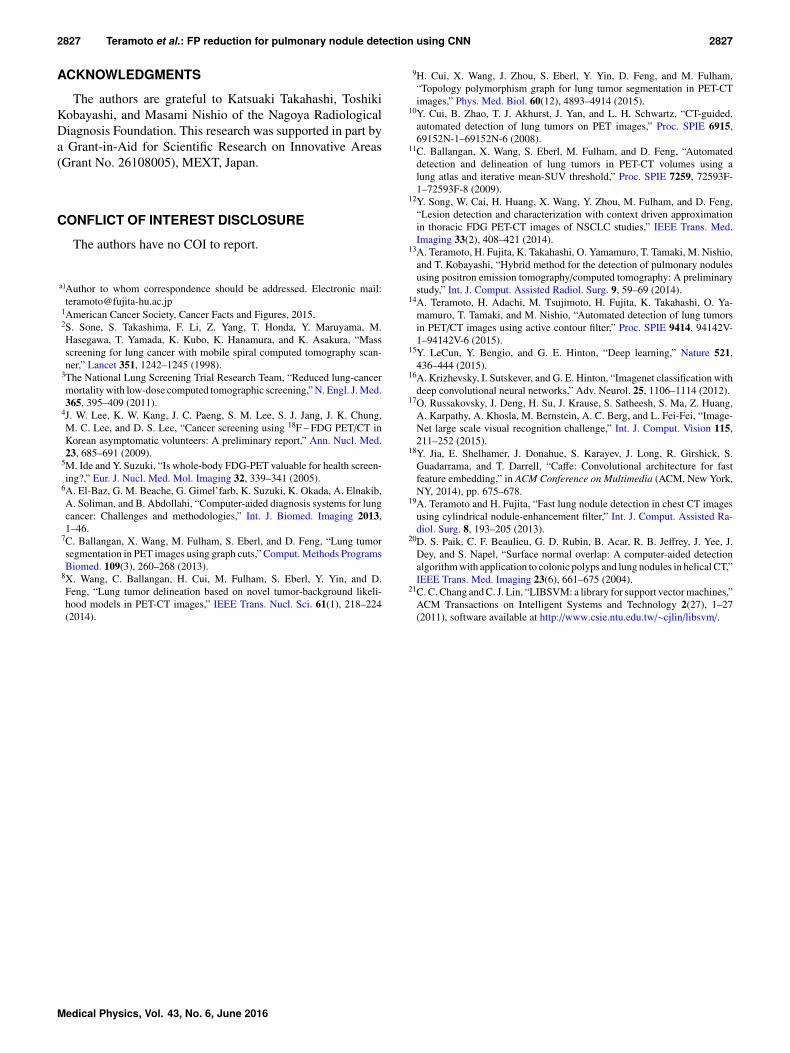
F. 9. Examples of FPs together with their contours, all of which were not eliminated by the proposed method.
addition, 7575 FPs were contained in the initial candidates,so the number of FPs/case was 72.8 (7575/104).
With regard to the FP elimination step, the histogram of theprobabilities of TP and FP is shown in Fig. 5. Here, since thenumber of FPs was much larger than that of TPs, histogramvalues were normalized by the numbers of TPs and FPs. Theresult was that about 70% of TPs and FPs were identifiedcorrectly. The rule-based classifier using both the output of theCNN and the shape/metabolic features cut out 4777 FPs, so thenumber of FPs/case was reduced to 26.9 [(7575−4777)/104]without any drop in TPs.
The free-response receiver operating characteristic (FROC)curves made by changing the SVM parameters (cost, weight)are shown in Fig. 6. In order to conduct a comparative evalu-ation, the FROC curve of the previous method is also shown.The sensitivity of our proposed method was 90.1%, with4.9 FPs/case. All FPs shown in Fig. 2 were successfullyeliminated using the proposed method under these conditions.Furthermore, two examples of detected nodules by our pro-posed method are indicated in Fig. 7. In the figure, if the centerof nodule marked by the doctor exists inside the red contour(candidate region), the candidate was judged as a TP.
Examples of nodules missed by our proposed method areshown in Fig. 8. In the figure, the left and center imagesshow the nodules missed at the initial detection stage, andthe right image shows the nodule missed at the FP-reductionstage. Examples of FP regions outputted by the proposedmethod are shown in Fig. 9. Average and standard deviationof diameters of FPs on the CT images were 7.86 and 4.89 mm,respectively.
In the present system, initial detection of nodules from CTand PET images was performed automatically by the in-housesoftware. Ensemble FP-reduction was carried out using theCaffe package.18 There were no manual interactions involvedthat required judgment of the operator. The processing time forinitial detection using ACF was approximately 340 s/case, andensemble FP reduction took 35 s/case. The CNN training tookapproximately 24 min by using GPU.
4. DISCUSSION
The number of detected nodules in the initial detectionwas 176, and its sensitivity exceeded 97%, so satisfactoryperformance was obtained. However, it was accompanied bya large number of FPs at initial detection. Here, most of theundetected nodules were subtle nodules with low CT values
and low uptake of fluorodeoxyglucose (FDG). In Fig. 5,approximately 70% of the CNN output showed the correctdecision for TPs and FPs; however, it was not better than ourprevious methods13,14 using characteristic features and threeSVMs. As for the overall performance using the ensembleFP-reduction technique with CNN and shape/metabolic fea-tures as shown in Fig. 6, sensitivity exceeded 90%, with4.9 FPs/case. Most of the FPs found in our schemeappeared to be easily eliminated by radiologists. The proposed scheme therefore appears to be useful for image diagnosisby radiologists during screening and follow-up examinations.
If we compared the proposed method and conventionalmethods using FPs per case at the same detection sensitivity,that of our previous study14 without CNN was 9.8 FPs/case.Our ensemble FP-reduction method using CNN techniqueeliminates approximately half the FPs existing in the pre-vious study. In a state that has sufficiently high detectionsensitivity, this improvement is a noteworthy advance. Theseresults indicate that CNN has good properties and can thusemployed as one of the characteristic features effective for FPreduction.
For further improvement of detection, FPs at the initialdetection step should be reduced. Following this, the classi-fication performance of the CNN should be improved, whichmay be accomplished with the optimization of the CNN archi-tecture, including the number of layers used. A number of re-searchers are studying novel architectures of CNN and perfor-mance should be improved while watching these trends inCNN techniques.
A limitation of this study is the small cohort used. It isnecessary to perform the evaluation by using a large cohortin the future. Furthermore, practical usefulness of this methodshould be evaluated by performing an ROC analysis of radiol-ogists with and without the proposed scheme.
5. CONCLUSIONS
In this study, an ensemble FP-reduction technique has beenproposed using conventional shape/metabolic features andCNN technique. Evaluation results showed that the sensitivityexceeded 90%, with 4.9 FPs/case; the proposed method us-ing CNN techniques eliminates approximately half the FPsexisting in the previous study. These results indicate that ourimproved method may be useful for computer-aided detectionof lung tumors in clinical practice.
Medical Physics, Vol. 43, No. 6, June 2016
2827 Teramoto et al.: FP reduction for pulmonary nodule detection using CNN 2827
ACKNOWLEDGMENTS
The authors are grateful to Katsuaki Takahashi, ToshikiKobayashi, and Masami Nishio of the Nagoya RadiologicalDiagnosis Foundation. This research was supported in part bya Grant-in-Aid for Scientific Research on Innovative Areas(Grant No. 26108005), MEXT, Japan.
CONFLICT OF INTEREST DISCLOSURE
The authors have no COI to report.
a)Author to whom correspondence should be addressed. Electronic mail:[email protected]
1American Cancer Society, Cancer Facts and Figures, 2015.2S. Sone, S. Takashima, F. Li, Z. Yang, T. Honda, Y. Maruyama, M.Hasegawa, T. Yamada, K. Kubo, K. Hanamura, and K. Asakura, “Massscreening for lung cancer with mobile spiral computed tomography scan-ner,” Lancet 351, 1242–1245 (1998).
3The National Lung Screening Trial Research Team, “Reduced lung-cancermortality with low-dose computed tomographic screening,” N. Engl. J. Med.365, 395–409 (2011).
4J. W. Lee, K. W. Kang, J. C. Paeng, S. M. Lee, S. J. Jang, J. K. Chung,M. C. Lee, and D. S. Lee, “Cancer screening using 18F−FDG PET/CT inKorean asymptomatic volunteers: A preliminary report,” Ann. Nucl. Med.23, 685–691 (2009).
5M. Ide and Y. Suzuki, “Is whole-body FDG-PET valuable for health screen-ing?,” Eur. J. Nucl. Med. Mol. Imaging 32, 339–341 (2005).
6A. El-Baz, G. M. Beache, G. Gimel’farb, K. Suzuki, K. Okada, A. Elnakib,A. Soliman, and B. Abdollahi, “Computer-aided diagnosis systems for lungcancer: Challenges and methodologies,” Int. J. Biomed. Imaging 2013,1–46.
7C. Ballangan, X. Wang, M. Fulham, S. Eberl, and D. Feng, “Lung tumorsegmentation in PET images using graph cuts,” Comput. Methods ProgramsBiomed. 109(3), 260–268 (2013).
8X. Wang, C. Ballangan, H. Cui, M. Fulham, S. Eberl, Y. Yin, and D.Feng, “Lung tumor delineation based on novel tumor-background likeli-hood models in PET-CT images,” IEEE Trans. Nucl. Sci. 61(1), 218–224(2014).
9H. Cui, X. Wang, J. Zhou, S. Eberl, Y. Yin, D. Feng, and M. Fulham,“Topology polymorphism graph for lung tumor segmentation in PET-CTimages,” Phys. Med. Biol. 60(12), 4893–4914 (2015).
10Y. Cui, B. Zhao, T. J. Akhurst, J. Yan, and L. H. Schwartz, “CT-guided,automated detection of lung tumors on PET images,” Proc. SPIE 6915,69152N-1–69152N-6 (2008).
11C. Ballangan, X. Wang, S. Eberl, M. Fulham, and D. Feng, “Automateddetection and delineation of lung tumors in PET-CT volumes using alung atlas and iterative mean-SUV threshold,” Proc. SPIE 7259, 72593F-1–72593F-8 (2009).
12Y. Song, W. Cai, H. Huang, X. Wang, Y. Zhou, M. Fulham, and D. Feng,“Lesion detection and characterization with context driven approximationin thoracic FDG PET-CT images of NSCLC studies,” IEEE Trans. Med.Imaging 33(2), 408–421 (2014).
13A. Teramoto, H. Fujita, K. Takahashi, O. Yamamuro, T. Tamaki, M. Nishio,and T. Kobayashi, “Hybrid method for the detection of pulmonary nodulesusing positron emission tomography/computed tomography: A preliminarystudy,” Int. J. Comput. Assisted Radiol. Surg. 9, 59–69 (2014).
14A. Teramoto, H. Adachi, M. Tsujimoto, H. Fujita, K. Takahashi, O. Ya-mamuro, T. Tamaki, and M. Nishio, “Automated detection of lung tumorsin PET/CT images using active contour filter,” Proc. SPIE 9414, 94142V-1–94142V-6 (2015).
15Y. LeCun, Y. Bengio, and G. E. Hinton, “Deep learning,” Nature 521,436–444 (2015).
16A. Krizhevsky, I. Sutskever, and G. E. Hinton, “Imagenet classification withdeep convolutional neural networks,” Adv. Neurol. 25, 1106–1114 (2012).
17O. Russakovsky, J. Deng, H. Su, J. Krause, S. Satheesh, S. Ma, Z. Huang,A. Karpathy, A. Khosla, M. Bernstein, A. C. Berg, and L. Fei-Fei, “Image-Net large scale visual recognition challenge,” Int. J. Comput. Vision 115,211–252 (2015).
18Y. Jia, E. Shelhamer, J. Donahue, S. Karayev, J. Long, R. Girshick, S.Guadarrama, and T. Darrell, “Caffe: Convolutional architecture for fastfeature embedding,” in ACM Conference on Multimedia (ACM, New York,NY, 2014), pp. 675–678.
19A. Teramoto and H. Fujita, “Fast lung nodule detection in chest CT imagesusing cylindrical nodule-enhancement filter,” Int. J. Comput. Assisted Ra-diol. Surg. 8, 193–205 (2013).
20D. S. Paik, C. F. Beaulieu, G. D. Rubin, B. Acar, R. B. Jeffrey, J. Yee, J.Dey, and S. Napel, “Surface normal overlap: A computer-aided detectionalgorithm with application to colonic polyps and lung nodules in helical CT,”IEEE Trans. Med. Imaging 23(6), 661–675 (2004).
21C. C. Chang and C. J. Lin, “LIBSVM: a library for support vector machines,”ACM Transactions on Intelligent Systems and Technology 2(27), 1–27(2011), software available at http://www.csie.ntu.edu.tw/∼cjlin/libsvm/.
Medical Physics, Vol. 43, No. 6, June 2016


![Xpert MTB/RIF test for detection of pulmonary tuberculosis ... Cochrane Review... · [Diagnostic Test Accuracy Protocol] Xpert MTB/RIF test for detection of pulmonary tuberculosis](https://img.pdfslide.net/doc/110x75/5b1f73977f8b9a34458b49bc/xpert-mtbrif-test-for-detection-of-pulmonary-tuberculosis-cochrane-review.jpg)
![Accurate Pulmonary Nodule Detection in Computed Tomography ... · Pulmonary cancer, causing 1.3 million deaths annually, is a leading cause of cancer death worldwide [8]. Detection](https://img.pdfslide.net/doc/110x75/5f9882f757fdde3a4377a39c/accurate-pulmonary-nodule-detection-in-computed-tomography-pulmonary-cancer.jpg)