Embed Size (px)
Citation preview
IEEE TRANSACTIONS ON INFORMATION TECHNOLOGY IN BIOMEDICINE, VOL. 12, NO. 1, JANUARY 2008 109
Automatic Segmentation of High-Throughput RNAiFluorescent Cellular Images
Pingkum Yan, Member, IEEE, Xiaobo Zhou, Member, IEEE, Mubarak Shah, Fellow, IEEE, and Stephen T. C. Wong
Abstract—High-throughput genome-wide RNA interference(RNAi) screening is emerging as an essential tool to assist biologistsin understanding complex cellular processes. The large number ofimages produced in each study make manual analysis intractable;hence, automatic cellular image analysis becomes an urgent need,where segmentation is the first and one of the most importantsteps. In this paper, a fully automatic method for segmentation ofcells from genome-wide RNAi screening images is proposed. Nu-clei are first extracted from the DNA channel by using a modifiedwatershed algorithm. Cells are then extracted by modeling the in-teraction between them as well as combining both gradient andregion information in the Actin and Rac channels. A new energyfunctional is formulated based on a novel interaction model for seg-menting tightly clustered cells with significant intensity varianceand specific phenotypes. The energy functional is minimized by us-ing a multiphase level set method, which leads to a highly effectivecell segmentation method. Promising experimental results demon-strate that automatic segmentation of high-throughput genome-wide multichannel screening can be achieved by using the proposedmethod, which may also be extended to other multichannel imagesegmentation problems.
Index Terms—Fluorescent microscopy, high throughput, imagesegmentation, interaction model, level set, multichannel.
I. INTRODUCTION
H IGH-THROUGHPUT screening using automated fluo-rescent microscopy is becoming an essential tool to as-
sist biologists in understanding complex cellular processes andgenetic functions [1]. By using the RNA interference (RNAi)process, the function of a gene can be determined by inspect-ing changes in a biological process caused by the addition ofgene-specific double-stranded RNA (dsRNA) [2], [3]. The de-velopment of Drosophila RNAi technology to systematicallydisrupt gene expression enables screening of the entire genomefor specific cellular functions. In a small-scale study using man-ual analysis of genome-wide screening [4], biologists were able
Manuscript received January 2, 2007; revised April 15, 2007. The work ofX. Zhou was supported by the Harvard Center for Neurodegeneration and Re-pair (HCNR), Center for Bioinformatics Research, Harvard Medical School,Boston, MA. The work of S. T. C. Wong was supported by the HCNR Centerfor Bioinformatics Research, Harvard Medical School, Boston, MA, and alsoby the National Institutes of Health (NIH) under Grant R01 LM008696.
P. Yan and M. Shah are with the School of Electrical Engineering and Com-puter Science, University of Central Florida, Orlando, FL 32816 USA (e-mail:[email protected]; [email protected]).
X. Zhou and S. T. C. Wong were with the Center for Bioinformatics, HarvardCenter for Neurodegeneration and Repair, Harvard Medical School and theFunctional and Molecular Imaging Center, Department of Radiology, Brighamand Women’s Hospital and Harvard Medical School, Boston, MA 02115 USA.They are now with the Center for Bioinformatics, Methodist Hospital, Houston,TX 77030 USA (e-mail: [email protected]; [email protected]).
Color versions of one or more of the figures in this paper are available onlineat http://ieeexplore.ieee.org.
Digital Object Identifier 10.1109/TITB.2007.898006
Fig. 1. Patches of RNAi cell image in the Actin channel with specific pheno-types. (a) Spiky (S-type). (b) Ruffling (R-type). (c) Actin-acceleration-at-edge(A-type).
to observe a wide range of phenotypes with affected cytoskele-tal organization and cell shape. However, without the aid ofcomputerized image analysis, it is almost intractable to quan-titatively characterize morphological phenotypes and identifygenes in high-throughput screening. For instance, in a typicalstudy conducted by our biologists [1], approximately 21 000dsRNAs specific to the predicted Drosophila genes are robot-ically arrayed in 384-well plates. Drosophila cells are plated,and take up dsRNA from culture media. After incubation withthe dsRNA, cells are fixed, stained, and imaged by automatedmicroscopy. Each screen generates more than 400 000 images,or even millions if replicas are included. Clearly, there is agrowing need for automated image analysis as high-throughputtechnologies are being extended to visual screens.
The key problem here is to automatically segment cells fromcell-based assays in a cost-effective manner, since fast screen-ing can generate hundreds of thousands of images in each studywith rather poor image quality. Three main challenges [5], [6]related to this task are as follows. Firstly, cells with specific phe-notypes need to be accurately segmented for further analysis.Samples of the three major phenotypes, S-spikey, R-ruffling,and A-actin acceleration at edge, to be identified in this study,are shown in Fig. 1. They are used for the gene clustering andscoring, and are of particular interest to our biologists. Theseshapes are not always convex, and violate the assumption ofmany algorithms [7], [8]. Secondly, significant intensity vari-ations exist in each cell. Thus, areas inside each cell can nolonger be assumed as homogeneous regions, which cause manyintensity-based segmentation methods fail. Thirdly, cells aretightly clustered and will not likely show a strong border wherethey touch, which makes it difficult to separate the cells.
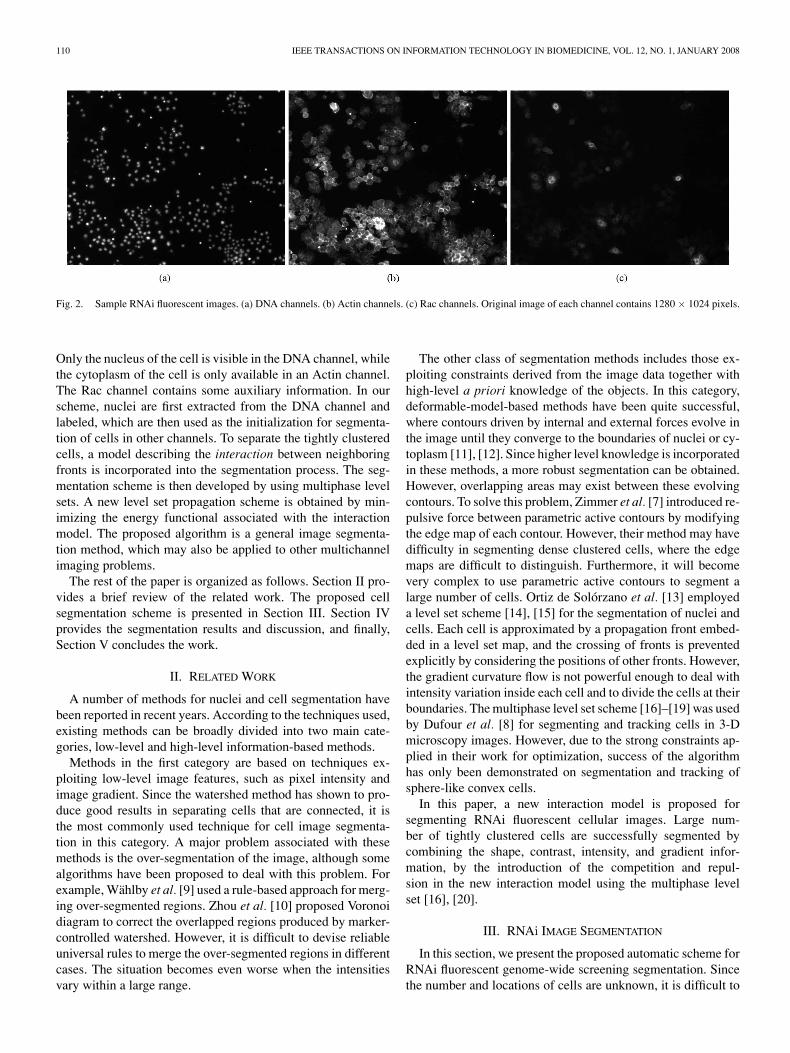
A novel cellular image segmentation scheme for RNAi flu-orescent genome-wide screening is presented to address thesechallenges. In our biological study, cells are fixed and stainedwith different dyes to investigate the different components ofcells. Each staining is captured by one image channel. The threechannels, Actin, Rac, and DNA, are captured, as shown in Fig. 2.
1089-7771/$25.00 © 2008 IEEE
110 IEEE TRANSACTIONS ON INFORMATION TECHNOLOGY IN BIOMEDICINE, VOL. 12, NO. 1, JANUARY 2008
Fig. 2. Sample RNAi fluorescent images. (a) DNA channels. (b) Actin channels. (c) Rac channels. Original image of each channel contains 1280 × 1024 pixels.
Only the nucleus of the cell is visible in the DNA channel, whilethe cytoplasm of the cell is only available in an Actin channel.The Rac channel contains some auxiliary information. In ourscheme, nuclei are first extracted from the DNA channel andlabeled, which are then used as the initialization for segmenta-tion of cells in other channels. To separate the tightly clusteredcells, a model describing the interaction between neighboringfronts is incorporated into the segmentation process. The seg-mentation scheme is then developed by using multiphase levelsets. A new level set propagation scheme is obtained by min-imizing the energy functional associated with the interactionmodel. The proposed algorithm is a general image segmenta-tion method, which may also be applied to other multichannelimaging problems.
The rest of the paper is organized as follows. Section II pro-vides a brief review of the related work. The proposed cellsegmentation scheme is presented in Section III. Section IVprovides the segmentation results and discussion, and finally,Section V concludes the work.
II. RELATED WORK
A number of methods for nuclei and cell segmentation havebeen reported in recent years. According to the techniques used,existing methods can be broadly divided into two main cate-gories, low-level and high-level information-based methods.
Methods in the first category are based on techniques ex-ploiting low-level image features, such as pixel intensity andimage gradient. Since the watershed method has shown to pro-duce good results in separating cells that are connected, it isthe most commonly used technique for cell image segmenta-tion in this category. A major problem associated with thesemethods is the over-segmentation of the image, although somealgorithms have been proposed to deal with this problem. Forexample, Wahlby et al. [9] used a rule-based approach for merg-ing over-segmented regions. Zhou et al. [10] proposed Voronoidiagram to correct the overlapped regions produced by marker-controlled watershed. However, it is difficult to devise reliableuniversal rules to merge the over-segmented regions in differentcases. The situation becomes even worse when the intensitiesvary within a large range.
The other class of segmentation methods includes those ex-ploiting constraints derived from the image data together withhigh-level a priori knowledge of the objects. In this category,deformable-model-based methods have been quite successful,where contours driven by internal and external forces evolve inthe image until they converge to the boundaries of nuclei or cy-toplasm [11], [12]. Since higher level knowledge is incorporatedin these methods, a more robust segmentation can be obtained.However, overlapping areas may exist between these evolvingcontours. To solve this problem, Zimmer et al. [7] introduced re-pulsive force between parametric active contours by modifyingthe edge map of each contour. However, their method may havedifficulty in segmenting dense clustered cells, where the edgemaps are difficult to distinguish. Furthermore, it will becomevery complex to use parametric active contours to segment alarge number of cells. Ortiz de Solorzano et al. [13] employeda level set scheme [14], [15] for the segmentation of nuclei andcells. Each cell is approximated by a propagation front embed-ded in a level set map, and the crossing of fronts is preventedexplicitly by considering the positions of other fronts. However,the gradient curvature flow is not powerful enough to deal withintensity variation inside each cell and to divide the cells at theirboundaries. The multiphase level set scheme [16]–[19] was usedby Dufour et al. [8] for segmenting and tracking cells in 3-Dmicroscopy images. However, due to the strong constraints ap-plied in their work for optimization, success of the algorithmhas only been demonstrated on segmentation and tracking ofsphere-like convex cells.
In this paper, a new interaction model is proposed forsegmenting RNAi fluorescent cellular images. Large num-ber of tightly clustered cells are successfully segmented bycombining the shape, contrast, intensity, and gradient infor-mation, by the introduction of the competition and repul-sion in the new interaction model using the multiphase levelset [16], [20].
III. RNAi IMAGE SEGMENTATION
In this section, we present the proposed automatic scheme forRNAi fluorescent genome-wide screening segmentation. Sincethe number and locations of cells are unknown, it is difficult to
YAN et al.: AUTOMATIC SEGMENTATION OF HIGH-THROUGHPUT RNAi FLUORESCENT CELLULAR IMAGES 111
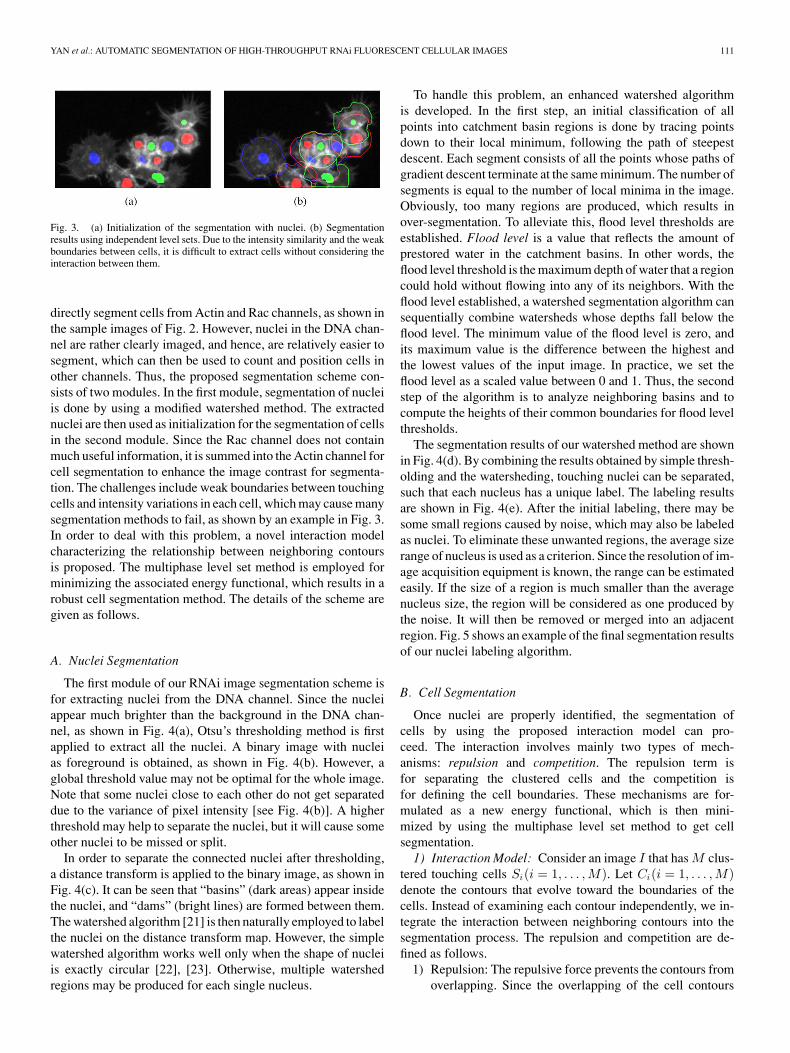
Fig. 3. (a) Initialization of the segmentation with nuclei. (b) Segmentationresults using independent level sets. Due to the intensity similarity and the weakboundaries between cells, it is difficult to extract cells without considering theinteraction between them.
directly segment cells from Actin and Rac channels, as shown inthe sample images of Fig. 2. However, nuclei in the DNA chan-nel are rather clearly imaged, and hence, are relatively easier tosegment, which can then be used to count and position cells inother channels. Thus, the proposed segmentation scheme con-sists of two modules. In the first module, segmentation of nucleiis done by using a modified watershed method. The extractednuclei are then used as initialization for the segmentation of cellsin the second module. Since the Rac channel does not containmuch useful information, it is summed into the Actin channel forcell segmentation to enhance the image contrast for segmenta-tion. The challenges include weak boundaries between touchingcells and intensity variations in each cell, which may cause manysegmentation methods to fail, as shown by an example in Fig. 3.In order to deal with this problem, a novel interaction modelcharacterizing the relationship between neighboring contoursis proposed. The multiphase level set method is employed forminimizing the associated energy functional, which results in arobust cell segmentation method. The details of the scheme aregiven as follows.
A. Nuclei Segmentation
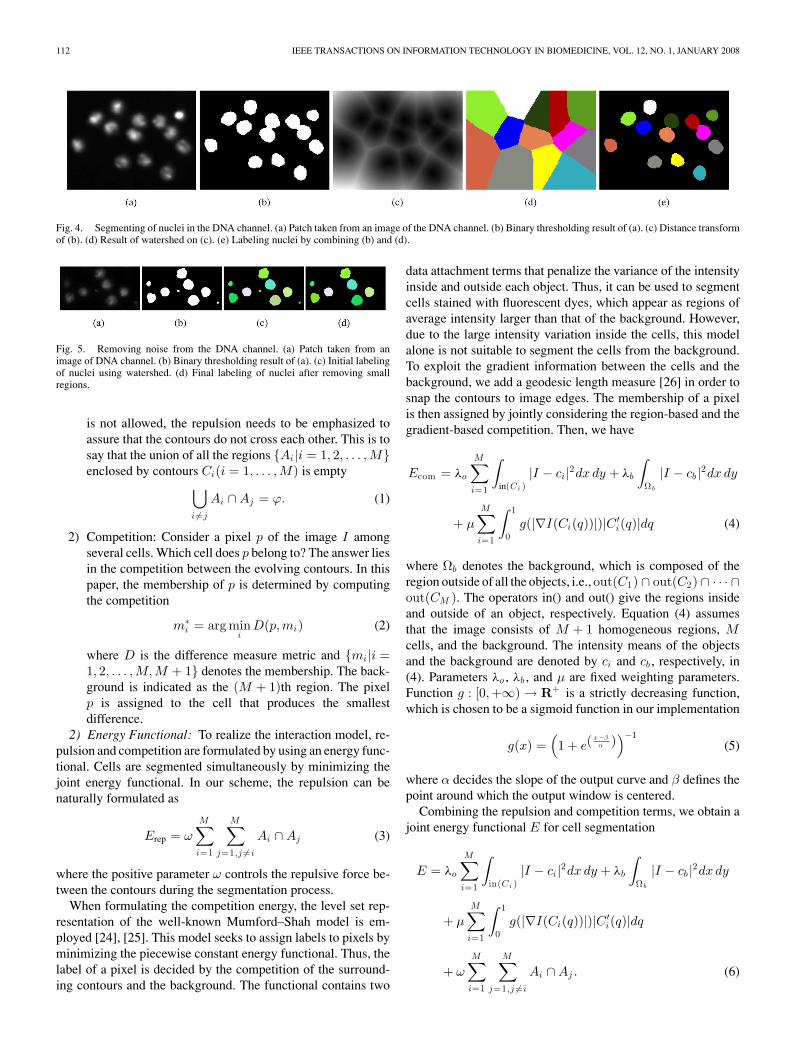
The first module of our RNAi image segmentation scheme isfor extracting nuclei from the DNA channel. Since the nucleiappear much brighter than the background in the DNA chan-nel, as shown in Fig. 4(a), Otsu’s thresholding method is firstapplied to extract all the nuclei. A binary image with nucleias foreground is obtained, as shown in Fig. 4(b). However, aglobal threshold value may not be optimal for the whole image.Note that some nuclei close to each other do not get separateddue to the variance of pixel intensity [see Fig. 4(b)]. A higherthreshold may help to separate the nuclei, but it will cause someother nuclei to be missed or split.
In order to separate the connected nuclei after thresholding,a distance transform is applied to the binary image, as shown inFig. 4(c). It can be seen that “basins” (dark areas) appear insidethe nuclei, and “dams” (bright lines) are formed between them.The watershed algorithm [21] is then naturally employed to labelthe nuclei on the distance transform map. However, the simplewatershed algorithm works well only when the shape of nucleiis exactly circular [22], [23]. Otherwise, multiple watershedregions may be produced for each single nucleus.
To handle this problem, an enhanced watershed algorithmis developed. In the first step, an initial classification of allpoints into catchment basin regions is done by tracing pointsdown to their local minimum, following the path of steepestdescent. Each segment consists of all the points whose paths ofgradient descent terminate at the same minimum. The number ofsegments is equal to the number of local minima in the image.Obviously, too many regions are produced, which results inover-segmentation. To alleviate this, flood level thresholds areestablished. Flood level is a value that reflects the amount ofprestored water in the catchment basins. In other words, theflood level threshold is the maximum depth of water that a regioncould hold without flowing into any of its neighbors. With theflood level established, a watershed segmentation algorithm cansequentially combine watersheds whose depths fall below theflood level. The minimum value of the flood level is zero, andits maximum value is the difference between the highest andthe lowest values of the input image. In practice, we set theflood level as a scaled value between 0 and 1. Thus, the secondstep of the algorithm is to analyze neighboring basins and tocompute the heights of their common boundaries for flood levelthresholds.
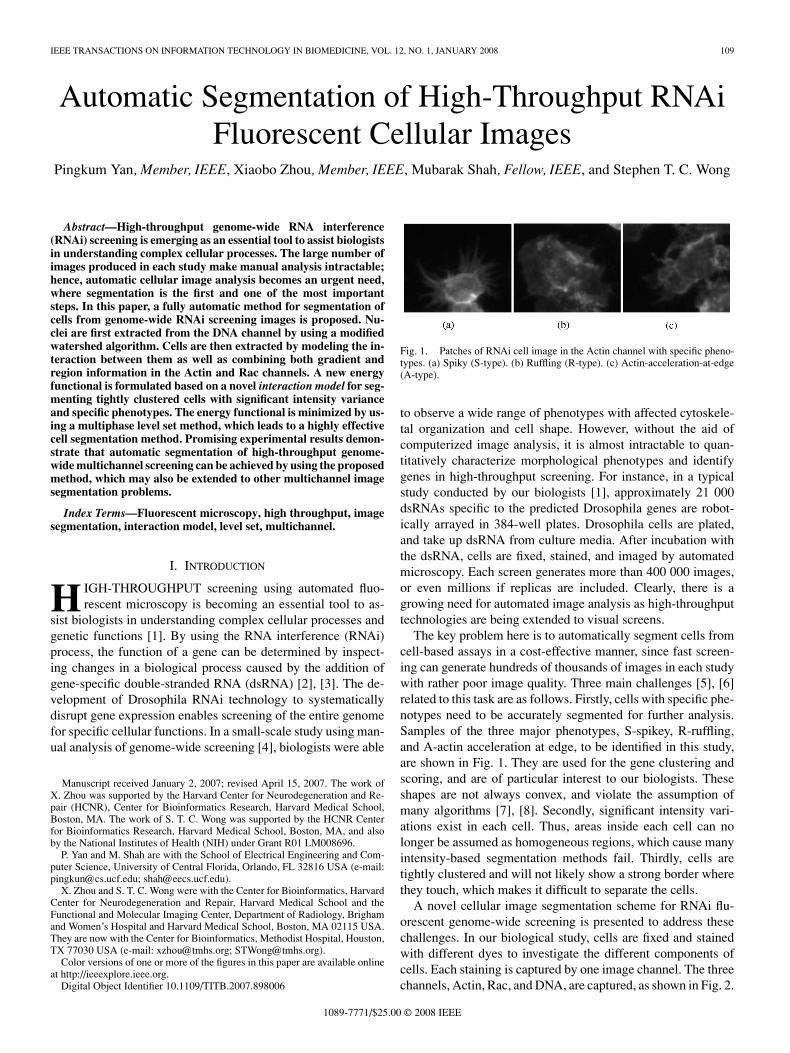
The segmentation results of our watershed method are shownin Fig. 4(d). By combining the results obtained by simple thresh-olding and the watersheding, touching nuclei can be separated,such that each nucleus has a unique label. The labeling resultsare shown in Fig. 4(e). After the initial labeling, there may besome small regions caused by noise, which may also be labeledas nuclei. To eliminate these unwanted regions, the average sizerange of nucleus is used as a criterion. Since the resolution of im-age acquisition equipment is known, the range can be estimatedeasily. If the size of a region is much smaller than the averagenucleus size, the region will be considered as one produced bythe noise. It will then be removed or merged into an adjacentregion. Fig. 5 shows an example of the final segmentation resultsof our nuclei labeling algorithm.
B. Cell Segmentation
Once nuclei are properly identified, the segmentation ofcells by using the proposed interaction model can pro-ceed. The interaction involves mainly two types of mech-anisms: repulsion and competition. The repulsion term isfor separating the clustered cells and the competition isfor defining the cell boundaries. These mechanisms are for-mulated as a new energy functional, which is then mini-mized by using the multiphase level set method to get cellsegmentation.
1) Interaction Model: Consider an image I that has M clus-tered touching cells Si(i = 1, . . . , M). Let Ci(i = 1, . . . ,M)denote the contours that evolve toward the boundaries of thecells. Instead of examining each contour independently, we in-tegrate the interaction between neighboring contours into thesegmentation process. The repulsion and competition are de-fined as follows.
1) Repulsion: The repulsive force prevents the contours fromoverlapping. Since the overlapping of the cell contours
112 IEEE TRANSACTIONS ON INFORMATION TECHNOLOGY IN BIOMEDICINE, VOL. 12, NO. 1, JANUARY 2008
Fig. 4. Segmenting of nuclei in the DNA channel. (a) Patch taken from an image of the DNA channel. (b) Binary thresholding result of (a). (c) Distance transformof (b). (d) Result of watershed on (c). (e) Labeling nuclei by combining (b) and (d).
Fig. 5. Removing noise from the DNA channel. (a) Patch taken from animage of DNA channel. (b) Binary thresholding result of (a). (c) Initial labelingof nuclei using watershed. (d) Final labeling of nuclei after removing smallregions.
is not allowed, the repulsion needs to be emphasized toassure that the contours do not cross each other. This is tosay that the union of all the regions Ai |i = 1, 2, . . . ,Menclosed by contours Ci(i = 1, . . . , M) is empty⋃
i =j
Ai ∩ Aj = ϕ. (1)
2) Competition: Consider a pixel p of the image I amongseveral cells. Which cell does p belong to? The answer liesin the competition between the evolving contours. In thispaper, the membership of p is determined by computingthe competition
m∗i = arg min
iD(p,mi) (2)
where D is the difference measure metric and mi |i =1, 2, . . . ,M,M + 1 denotes the membership. The back-ground is indicated as the (M + 1)th region. The pixelp is assigned to the cell that produces the smallestdifference.
2) Energy Functional: To realize the interaction model, re-pulsion and competition are formulated by using an energy func-tional. Cells are segmented simultaneously by minimizing thejoint energy functional. In our scheme, the repulsion can benaturally formulated as
Erep = ω
M∑i=1
M∑j=1,j =i
Ai ∩ Aj (3)
where the positive parameter ω controls the repulsive force be-tween the contours during the segmentation process.
When formulating the competition energy, the level set rep-resentation of the well-known Mumford–Shah model is em-ployed [24], [25]. This model seeks to assign labels to pixels byminimizing the piecewise constant energy functional. Thus, thelabel of a pixel is decided by the competition of the surround-ing contours and the background. The functional contains two
data attachment terms that penalize the variance of the intensityinside and outside each object. Thus, it can be used to segmentcells stained with fluorescent dyes, which appear as regions ofaverage intensity larger than that of the background. However,due to the large intensity variation inside the cells, this modelalone is not suitable to segment the cells from the background.To exploit the gradient information between the cells and thebackground, we add a geodesic length measure [26] in order tosnap the contours to image edges. The membership of a pixelis then assigned by jointly considering the region-based and thegradient-based competition. Then, we have
Ecom = λo
M∑i=1
∫in(Ci )
|I − ci |2dx dy + λb
∫Ω b
|I − cb |2dx dy
+ µ
M∑i=1
∫ 1
0g(|∇I(Ci(q))|)|C ′
i(q)|dq (4)
where Ωb denotes the background, which is composed of theregion outside of all the objects, i.e., out(C1) ∩ out(C2) ∩ · · · ∩out(CM ). The operators in() and out() give the regions insideand outside of an object, respectively. Equation (4) assumesthat the image consists of M + 1 homogeneous regions, Mcells, and the background. The intensity means of the objectsand the background are denoted by ci and cb , respectively, in(4). Parameters λo , λb , and µ are fixed weighting parameters.Function g : [0,+∞) → R+ is a strictly decreasing function,which is chosen to be a sigmoid function in our implementation
g(x) =(1 + e(
x −βα )
)−1(5)
where α decides the slope of the output curve and β defines thepoint around which the output window is centered.
Combining the repulsion and competition terms, we obtain ajoint energy functional E for cell segmentation
E = λo
M∑i=1
∫in(Ci )
|I − ci |2dx dy + λb
∫Ω b
|I − cb |2dx dy
+ µ
M∑i=1
∫ 1
0g(|∇I(Ci(q))|)|C ′
i(q)|dq
+ ωM∑i=1
M∑j=1,j =i
Ai ∩ Aj . (6)
YAN et al.: AUTOMATIC SEGMENTATION OF HIGH-THROUGHPUT RNAi FLUORESCENT CELLULAR IMAGES 113
The segmentation is achieved by minimizing the energy func-tional (6). Explicit parametric active contours can be used tominimize the energy aforementioned; however, since there arehundreds of cells in each image, it is extremely complex todeal with the interaction between them using parametric ac-tive contours. In this paper, we use an efficient multiphaselevel set scheme for energy minimization, which is detailed asfollows.
3) Evolution of Multiphase Level Set: In the level set formu-lation, Ci , the contour of the ith object, is embedded as the zerolevel set of a level set function Ψi , i.e., Ci = (x, y)|Ψi(x, y) =0. The level set function Ψi is defined to be positive outsideof Ci and negative inside of Ci . The value of the function Ψi ateach point is computed as the Euclidean distance to the nearestpoint on the contour Ci . Each of the M objects being segmentedin the image has its own contour Ci and corresponding Ψi .
In order to express the energy functional (6) using levelsets, we first bring in the Heaviside function H and the Diracfunction δ
H(x) =
1, x ≤ 00, x > 0 and δ(x) =
d
dxH(x). (7)
The inside and outside operators can then be formulated as
in(Ci) = 1 − H(Ψi) and out(Ci) = H(Ψi). (8)
We are then able to express the energy functional (6) using levelsets as
E = λo
M∑i=1
∫Ω|I − ci |2 (1 − H(Ψi)) dx dy
+ λb
∫Ω|I − cb |2
M∏i=1
H(Ψi)dx dy
+ µ
M∑i=1
∫Ω
g(I)|∇Ψi(x, y)|δ(Ψi(x, y))dx dy
+ ωM∑i=1
M∑j=1,j =i
∫Ω
(1 − H(Ψi)) (1 − H(Ψj )) dx dy (9)
where Ω denotes the image domain.The energy functional (9) can be minimized iteratively. In
each iteration, we first fix ci (i = 1, 2, . . . ,M) and cb andminimize the energy functional E with respect to Ψi(x, y)(i = 1, 2, . . . ,M). We employ the gradient descent method forminimization. The evolution equation for each Ψi(t, x, y) is thenobtained by deducing the associated Euler–Lagrange equationas
∂Ψi
∂t= δ(Ψi)
λo |I − ci |2 − λb |I − cb |2
M∏j=1,j =i
H(Ψj )
+ µ∇g · ∇Ψi
|∇Ψi |+ νg div
(∇Ψi
|∇Ψi |
)
+ωM∑
j=1,j =i
(1 − H(Ψj ))
. (10)
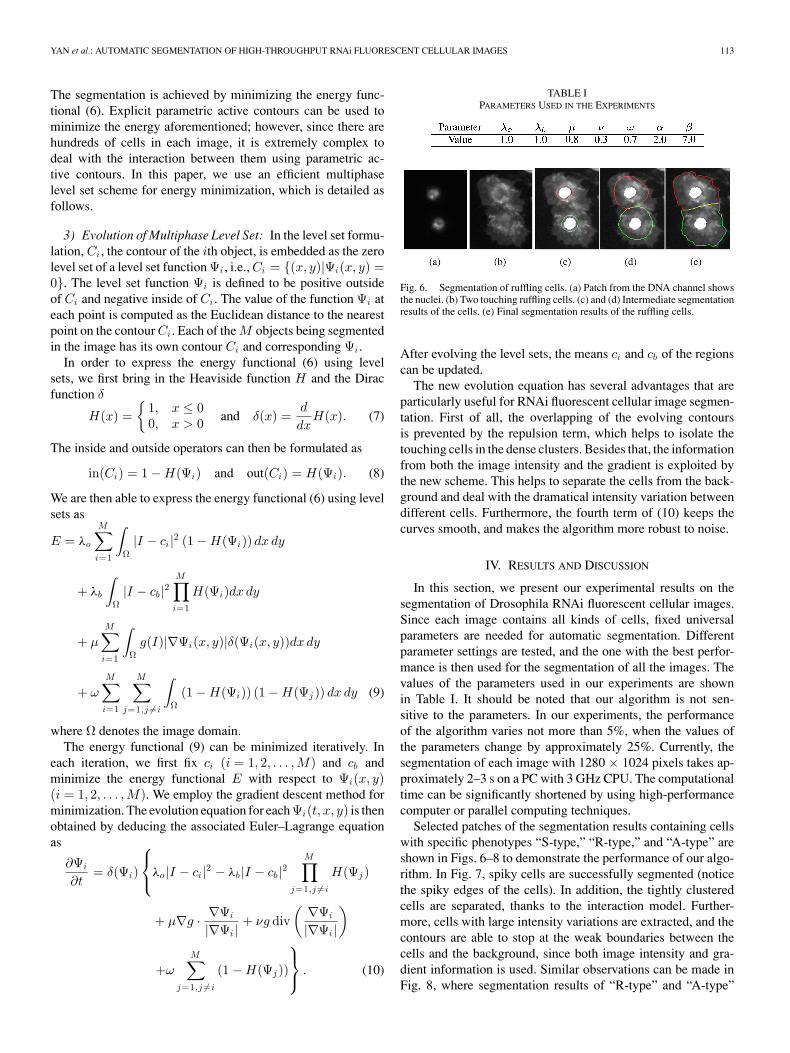
TABLE IPARAMETERS USED IN THE EXPERIMENTS
Fig. 6. Segmentation of ruffling cells. (a) Patch from the DNA channel showsthe nuclei. (b) Two touching ruffling cells. (c) and (d) Intermediate segmentationresults of the cells. (e) Final segmentation results of the ruffling cells.
After evolving the level sets, the means ci and cb of the regionscan be updated.
The new evolution equation has several advantages that areparticularly useful for RNAi fluorescent cellular image segmen-tation. First of all, the overlapping of the evolving contoursis prevented by the repulsion term, which helps to isolate thetouching cells in the dense clusters. Besides that, the informationfrom both the image intensity and the gradient is exploited bythe new scheme. This helps to separate the cells from the back-ground and deal with the dramatical intensity variation betweendifferent cells. Furthermore, the fourth term of (10) keeps thecurves smooth, and makes the algorithm more robust to noise.
IV. RESULTS AND DISCUSSION
In this section, we present our experimental results on thesegmentation of Drosophila RNAi fluorescent cellular images.Since each image contains all kinds of cells, fixed universalparameters are needed for automatic segmentation. Differentparameter settings are tested, and the one with the best perfor-mance is then used for the segmentation of all the images. Thevalues of the parameters used in our experiments are shownin Table I. It should be noted that our algorithm is not sen-sitive to the parameters. In our experiments, the performanceof the algorithm varies not more than 5%, when the values ofthe parameters change by approximately 25%. Currently, thesegmentation of each image with 1280 × 1024 pixels takes ap-proximately 2–3 s on a PC with 3 GHz CPU. The computationaltime can be significantly shortened by using high-performancecomputer or parallel computing techniques.
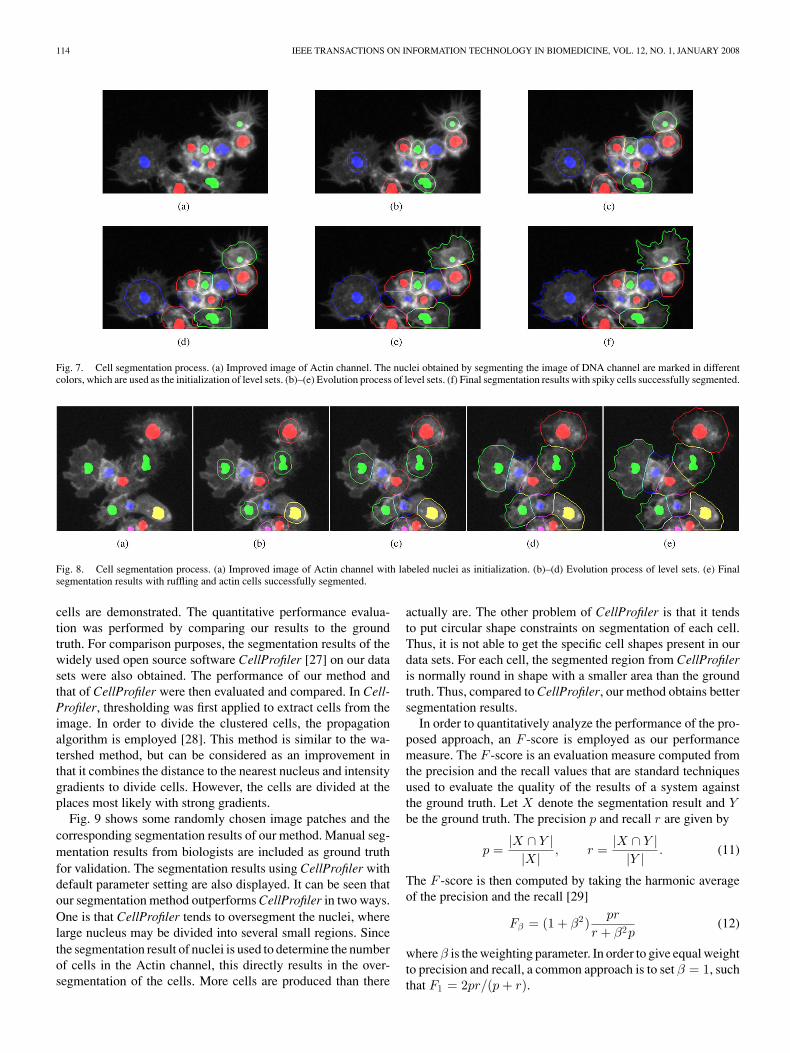
Selected patches of the segmentation results containing cellswith specific phenotypes “S-type,” “R-type,” and “A-type” areshown in Figs. 6–8 to demonstrate the performance of our algo-rithm. In Fig. 7, spiky cells are successfully segmented (noticethe spiky edges of the cells). In addition, the tightly clusteredcells are separated, thanks to the interaction model. Further-more, cells with large intensity variations are extracted, and thecontours are able to stop at the weak boundaries between thecells and the background, since both image intensity and gra-dient information is used. Similar observations can be made inFig. 8, where segmentation results of “R-type” and “A-type”
114 IEEE TRANSACTIONS ON INFORMATION TECHNOLOGY IN BIOMEDICINE, VOL. 12, NO. 1, JANUARY 2008
Fig. 7. Cell segmentation process. (a) Improved image of Actin channel. The nuclei obtained by segmenting the image of DNA channel are marked in differentcolors, which are used as the initialization of level sets. (b)–(e) Evolution process of level sets. (f) Final segmentation results with spiky cells successfully segmented.
Fig. 8. Cell segmentation process. (a) Improved image of Actin channel with labeled nuclei as initialization. (b)–(d) Evolution process of level sets. (e) Finalsegmentation results with ruffling and actin cells successfully segmented.
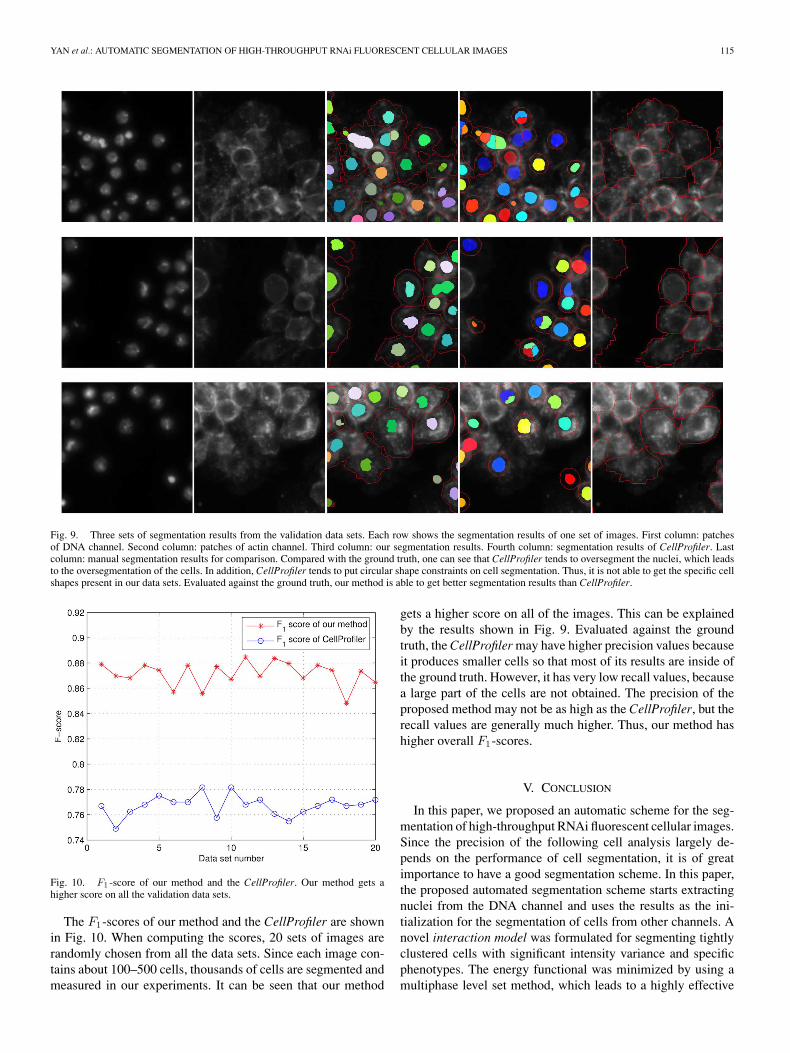
cells are demonstrated. The quantitative performance evalua-tion was performed by comparing our results to the groundtruth. For comparison purposes, the segmentation results of thewidely used open source software CellProfiler [27] on our datasets were also obtained. The performance of our method andthat of CellProfiler were then evaluated and compared. In Cell-Profiler, thresholding was first applied to extract cells from theimage. In order to divide the clustered cells, the propagationalgorithm is employed [28]. This method is similar to the wa-tershed method, but can be considered as an improvement inthat it combines the distance to the nearest nucleus and intensitygradients to divide cells. However, the cells are divided at theplaces most likely with strong gradients.
Fig. 9 shows some randomly chosen image patches and thecorresponding segmentation results of our method. Manual seg-mentation results from biologists are included as ground truthfor validation. The segmentation results using CellProfiler withdefault parameter setting are also displayed. It can be seen thatour segmentation method outperforms CellProfiler in two ways.One is that CellProfiler tends to oversegment the nuclei, wherelarge nucleus may be divided into several small regions. Sincethe segmentation result of nuclei is used to determine the numberof cells in the Actin channel, this directly results in the over-segmentation of the cells. More cells are produced than there
actually are. The other problem of CellProfiler is that it tendsto put circular shape constraints on segmentation of each cell.Thus, it is not able to get the specific cell shapes present in ourdata sets. For each cell, the segmented region from CellProfileris normally round in shape with a smaller area than the groundtruth. Thus, compared to CellProfiler, our method obtains bettersegmentation results.
In order to quantitatively analyze the performance of the pro-posed approach, an F -score is employed as our performancemeasure. The F -score is an evaluation measure computed fromthe precision and the recall values that are standard techniquesused to evaluate the quality of the results of a system againstthe ground truth. Let X denote the segmentation result and Ybe the ground truth. The precision p and recall r are given by
p =|X ∩ Y ||X| , r =
|X ∩ Y ||Y | . (11)
The F -score is then computed by taking the harmonic averageof the precision and the recall [29]
Fβ = (1 + β2)pr
r + β2p(12)
where β is the weighting parameter. In order to give equal weightto precision and recall, a common approach is to set β = 1, suchthat F1 = 2pr/(p + r).
YAN et al.: AUTOMATIC SEGMENTATION OF HIGH-THROUGHPUT RNAi FLUORESCENT CELLULAR IMAGES 115
Fig. 9. Three sets of segmentation results from the validation data sets. Each row shows the segmentation results of one set of images. First column: patchesof DNA channel. Second column: patches of actin channel. Third column: our segmentation results. Fourth column: segmentation results of CellProfiler. Lastcolumn: manual segmentation results for comparison. Compared with the ground truth, one can see that CellProfiler tends to oversegment the nuclei, which leadsto the oversegmentation of the cells. In addition, CellProfiler tends to put circular shape constraints on cell segmentation. Thus, it is not able to get the specific cellshapes present in our data sets. Evaluated against the ground truth, our method is able to get better segmentation results than CellProfiler.
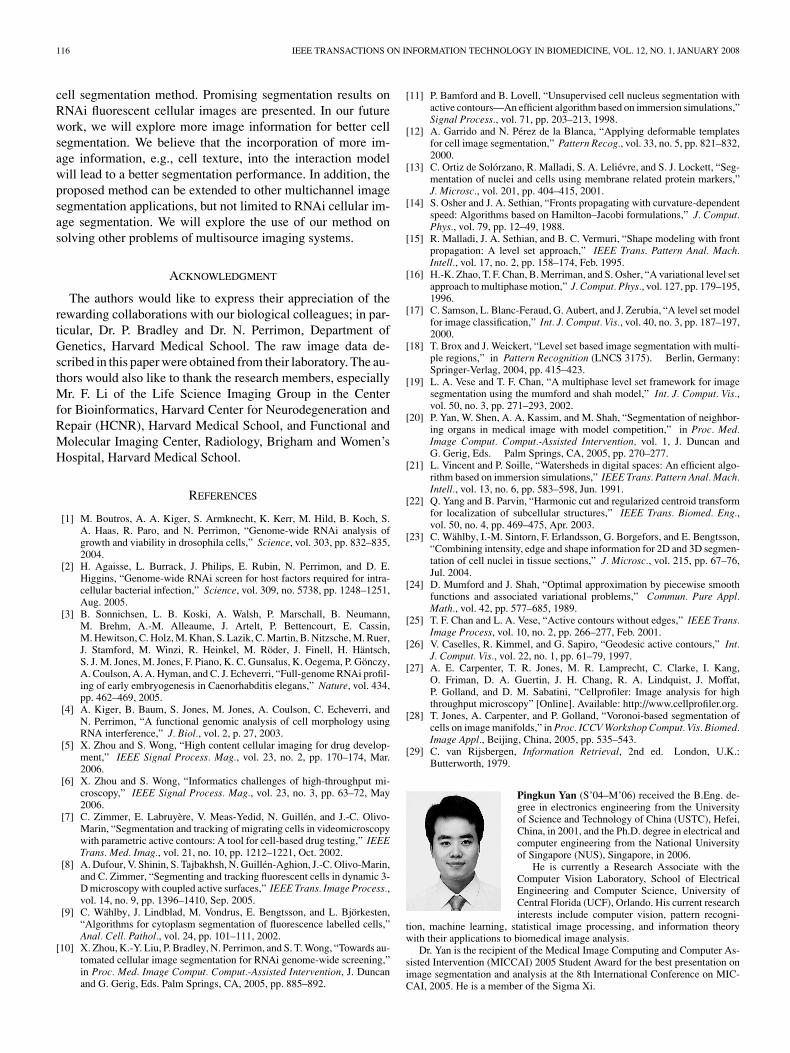
Fig. 10. F1 -score of our method and the CellProfiler. Our method gets ahigher score on all the validation data sets.
The F1-scores of our method and the CellProfiler are shownin Fig. 10. When computing the scores, 20 sets of images arerandomly chosen from all the data sets. Since each image con-tains about 100–500 cells, thousands of cells are segmented andmeasured in our experiments. It can be seen that our method
gets a higher score on all of the images. This can be explainedby the results shown in Fig. 9. Evaluated against the groundtruth, the CellProfiler may have higher precision values becauseit produces smaller cells so that most of its results are inside ofthe ground truth. However, it has very low recall values, becausea large part of the cells are not obtained. The precision of theproposed method may not be as high as the CellProfiler, but therecall values are generally much higher. Thus, our method hashigher overall F1-scores.
V. CONCLUSION
In this paper, we proposed an automatic scheme for the seg-mentation of high-throughput RNAi fluorescent cellular images.Since the precision of the following cell analysis largely de-pends on the performance of cell segmentation, it is of greatimportance to have a good segmentation scheme. In this paper,the proposed automated segmentation scheme starts extractingnuclei from the DNA channel and uses the results as the ini-tialization for the segmentation of cells from other channels. Anovel interaction model was formulated for segmenting tightlyclustered cells with significant intensity variance and specificphenotypes. The energy functional was minimized by using amultiphase level set method, which leads to a highly effective
116 IEEE TRANSACTIONS ON INFORMATION TECHNOLOGY IN BIOMEDICINE, VOL. 12, NO. 1, JANUARY 2008
cell segmentation method. Promising segmentation results onRNAi fluorescent cellular images are presented. In our futurework, we will explore more image information for better cellsegmentation. We believe that the incorporation of more im-age information, e.g., cell texture, into the interaction modelwill lead to a better segmentation performance. In addition, theproposed method can be extended to other multichannel imagesegmentation applications, but not limited to RNAi cellular im-age segmentation. We will explore the use of our method onsolving other problems of multisource imaging systems.
ACKNOWLEDGMENT
The authors would like to express their appreciation of therewarding collaborations with our biological colleagues; in par-ticular, Dr. P. Bradley and Dr. N. Perrimon, Department ofGenetics, Harvard Medical School. The raw image data de-scribed in this paper were obtained from their laboratory. The au-thors would also like to thank the research members, especiallyMr. F. Li of the Life Science Imaging Group in the Centerfor Bioinformatics, Harvard Center for Neurodegeneration andRepair (HCNR), Harvard Medical School, and Functional andMolecular Imaging Center, Radiology, Brigham and Women’sHospital, Harvard Medical School.
REFERENCES
[1] M. Boutros, A. A. Kiger, S. Armknecht, K. Kerr, M. Hild, B. Koch, S.A. Haas, R. Paro, and N. Perrimon, “Genome-wide RNAi analysis ofgrowth and viability in drosophila cells,” Science, vol. 303, pp. 832–835,2004.
[2] H. Agaisse, L. Burrack, J. Philips, E. Rubin, N. Perrimon, and D. E.Higgins, “Genome-wide RNAi screen for host factors required for intra-cellular bacterial infection,” Science, vol. 309, no. 5738, pp. 1248–1251,Aug. 2005.
[3] B. Sonnichsen, L. B. Koski, A. Walsh, P. Marschall, B. Neumann,M. Brehm, A.-M. Alleaume, J. Artelt, P. Bettencourt, E. Cassin,M. Hewitson, C. Holz, M. Khan, S. Lazik, C. Martin, B. Nitzsche, M. Ruer,J. Stamford, M. Winzi, R. Heinkel, M. Roder, J. Finell, H. Hantsch,S. J. M. Jones, M. Jones, F. Piano, K. C. Gunsalus, K. Oegema, P. Gonczy,A. Coulson, A. A. Hyman, and C. J. Echeverri, “Full-genome RNAi profil-ing of early embryogenesis in Caenorhabditis elegans,” Nature, vol. 434,pp. 462–469, 2005.
[4] A. Kiger, B. Baum, S. Jones, M. Jones, A. Coulson, C. Echeverri, andN. Perrimon, “A functional genomic analysis of cell morphology usingRNA interference,” J. Biol., vol. 2, p. 27, 2003.
[5] X. Zhou and S. Wong, “High content cellular imaging for drug develop-ment,” IEEE Signal Process. Mag., vol. 23, no. 2, pp. 170–174, Mar.2006.
[6] X. Zhou and S. Wong, “Informatics challenges of high-throughput mi-croscopy,” IEEE Signal Process. Mag., vol. 23, no. 3, pp. 63–72, May2006.
[7] C. Zimmer, E. Labruyere, V. Meas-Yedid, N. Guillen, and J.-C. Olivo-Marin, “Segmentation and tracking of migrating cells in videomicroscopywith parametric active contours: A tool for cell-based drug testing,” IEEETrans. Med. Imag., vol. 21, no. 10, pp. 1212–1221, Oct. 2002.
[8] A. Dufour, V. Shinin, S. Tajbakhsh, N. Guillen-Aghion, J.-C. Olivo-Marin,and C. Zimmer, “Segmenting and tracking fluorescent cells in dynamic 3-D microscopy with coupled active surfaces,” IEEE Trans. Image Process.,vol. 14, no. 9, pp. 1396–1410, Sep. 2005.
[9] C. Wahlby, J. Lindblad, M. Vondrus, E. Bengtsson, and L. Bjorkesten,“Algorithms for cytoplasm segmentation of fluorescence labelled cells,”Anal. Cell. Pathol., vol. 24, pp. 101–111, 2002.
[10] X. Zhou, K.-Y. Liu, P. Bradley, N. Perrimon, and S. T. Wong, “Towards au-tomated cellular image segmentation for RNAi genome-wide screening,”in Proc. Med. Image Comput. Comput.-Assisted Intervention, J. Duncanand G. Gerig, Eds. Palm Springs, CA, 2005, pp. 885–892.
[11] P. Bamford and B. Lovell, “Unsupervised cell nucleus segmentation withactive contours—An efficient algorithm based on immersion simulations,”Signal Process., vol. 71, pp. 203–213, 1998.
[12] A. Garrido and N. Perez de la Blanca, “Applying deformable templatesfor cell image segmentation,” Pattern Recog., vol. 33, no. 5, pp. 821–832,2000.
[13] C. Ortiz de Solorzano, R. Malladi, S. A. Lelievre, and S. J. Lockett, “Seg-mentation of nuclei and cells using membrane related protein markers,”J. Microsc., vol. 201, pp. 404–415, 2001.
[14] S. Osher and J. A. Sethian, “Fronts propagating with curvature-dependentspeed: Algorithms based on Hamilton–Jacobi formulations,” J. Comput.Phys., vol. 79, pp. 12–49, 1988.
[15] R. Malladi, J. A. Sethian, and B. C. Vermuri, “Shape modeling with frontpropagation: A level set approach,” IEEE Trans. Pattern Anal. Mach.Intell., vol. 17, no. 2, pp. 158–174, Feb. 1995.
[16] H.-K. Zhao, T. F. Chan, B. Merriman, and S. Osher, “A variational level setapproach to multiphase motion,” J. Comput. Phys., vol. 127, pp. 179–195,1996.
[17] C. Samson, L. Blanc-Feraud, G. Aubert, and J. Zerubia, “A level set modelfor image classification,” Int. J. Comput. Vis., vol. 40, no. 3, pp. 187–197,2000.
[18] T. Brox and J. Weickert, “Level set based image segmentation with multi-ple regions,” in Pattern Recognition (LNCS 3175). Berlin, Germany:Springer-Verlag, 2004, pp. 415–423.
[19] L. A. Vese and T. F. Chan, “A multiphase level set framework for imagesegmentation using the mumford and shah model,” Int. J. Comput. Vis.,vol. 50, no. 3, pp. 271–293, 2002.
[20] P. Yan, W. Shen, A. A. Kassim, and M. Shah, “Segmentation of neighbor-ing organs in medical image with model competition,” in Proc. Med.Image Comput. Comput.-Assisted Intervention, vol. 1, J. Duncan andG. Gerig, Eds. Palm Springs, CA, 2005, pp. 270–277.
[21] L. Vincent and P. Soille, “Watersheds in digital spaces: An efficient algo-rithm based on immersion simulations,” IEEE Trans. Pattern Anal. Mach.Intell., vol. 13, no. 6, pp. 583–598, Jun. 1991.
[22] Q. Yang and B. Parvin, “Harmonic cut and regularized centroid transformfor localization of subcellular structures,” IEEE Trans. Biomed. Eng.,vol. 50, no. 4, pp. 469–475, Apr. 2003.
[23] C. Wahlby, I.-M. Sintorn, F. Erlandsson, G. Borgefors, and E. Bengtsson,“Combining intensity, edge and shape information for 2D and 3D segmen-tation of cell nuclei in tissue sections,” J. Microsc., vol. 215, pp. 67–76,Jul. 2004.
[24] D. Mumford and J. Shah, “Optimal approximation by piecewise smoothfunctions and associated variational problems,” Commun. Pure Appl.Math., vol. 42, pp. 577–685, 1989.
[25] T. F. Chan and L. A. Vese, “Active contours without edges,” IEEE Trans.Image Process, vol. 10, no. 2, pp. 266–277, Feb. 2001.
[26] V. Caselles, R. Kimmel, and G. Sapiro, “Geodesic active contours,” Int.J. Comput. Vis., vol. 22, no. 1, pp. 61–79, 1997.
[27] A. E. Carpenter, T. R. Jones, M. R. Lamprecht, C. Clarke, I. Kang,O. Friman, D. A. Guertin, J. H. Chang, R. A. Lindquist, J. Moffat,P. Golland, and D. M. Sabatini, “Cellprofiler: Image analysis for highthroughput microscopy” [Online]. Available: http://www.cellprofiler.org.
[28] T. Jones, A. Carpenter, and P. Golland, “Voronoi-based segmentation ofcells on image manifolds,” in Proc. ICCV Workshop Comput. Vis. Biomed.Image Appl., Beijing, China, 2005, pp. 535–543.
[29] C. van Rijsbergen, Information Retrieval, 2nd ed. London, U.K.:Butterworth, 1979.
Pingkun Yan (S’04–M’06) received the B.Eng. de-gree in electronics engineering from the Universityof Science and Technology of China (USTC), Hefei,China, in 2001, and the Ph.D. degree in electrical andcomputer engineering from the National Universityof Singapore (NUS), Singapore, in 2006.
He is currently a Research Associate with theComputer Vision Laboratory, School of ElectricalEngineering and Computer Science, University ofCentral Florida (UCF), Orlando. His current researchinterests include computer vision, pattern recogni-
tion, machine learning, statistical image processing, and information theorywith their applications to biomedical image analysis.
Dr. Yan is the recipient of the Medical Image Computing and Computer As-sisted Intervention (MICCAI) 2005 Student Award for the best presentation onimage segmentation and analysis at the 8th International Conference on MIC-CAI, 2005. He is a member of the Sigma Xi.
YAN et al.: AUTOMATIC SEGMENTATION OF HIGH-THROUGHPUT RNAi FLUORESCENT CELLULAR IMAGES 117
Xiaobo Zhou (S’98–A’02–M’03) received the B.S.degree in mathematics from Lanzhou University,Lanzhou, China, in 1988, and the M.S. and Ph.Ddegrees in mathematics from Peking University,Beijing, China, in 1995 and 1998, respectively.
From 1988 to 1992, he was a Lecturer at the Train-ing Center, 18th Building Company, Chongqing,China. From 1992 to 1998, he was a Research Assis-tant and a Teaching Assistant with the Department ofMathematics, Peking University. From 1998 to 1999,he was a Postdoctoral Research Fellow in the De-
partment of Automation, Tsinghua University, Beijing. From 1999 to 2000, hewas a Senior Technical Manager with the 3G Wireless Communication Depart-ment, Huawei Technologies Company, Ltd., Beijing. From February 2000 toDecember 2000, he was a Postdoctoral Research Fellow in the Department ofComputer Science, University of Missouri–Columbia, Columbia. From 2001 to2003, he was a Postdoctoral Research Fellow in the Department of ElectricalEngineering, Texas A&M University, College Station. From 2003 to 2006, hewas a Research Scientist and Instructor with the Harvard Center for Neurode-generation and Repair in Harvard Medical School and Radiology Departmentin Brigham and Women’s Hospital, Boston, MA. In 2007, he was an Assis-tant Professor at Harvard University. Since 2007, he has been an AssociateProfessor at Cornell University and Methodist Hospital, Houston, TX. His cur-rent research interests include image and signal processing for high-contentmolecular and cellular imaging analysis, informatics for integrated multiscaleand multimodality biomedical imaging analysis, molecular imaging informat-ics, neuroinformatics, and bioinformatics for genomics and proteomics.
Mubarak Shah (M’81–F’03) received the B.E. de-gree in electronics from Dawood College of Engi-neering and Technology, Karachi, Pakistan, in 1979.He completed the E.D.E. diploma at Philips Inter-national Institute of Technology, Eindhoven, TheNetherlands, in 1980, and received the M.S. andPh.D. degrees in computer engineering from WayneState University, Detroit, MI, in 1982 and 1986,respectively.
He is the Chair Professor of Computer Scienceand the founding Director of the Computer Visions
Laboratory, University of Central Florida (UCF), Orlando. He is a Researcherin a number of computer vision areas. He is a Guest Editor of the special issueof International Journal of Computer Vision on Video Computing. He is anEditor of the international book series on Video Computing, the Editor-in-Chiefof the Machine Vision and Applications Journal, and an Associate Editor of theAssociation for Computer Machinery (ACM) Computing Surveys Journal. Hewas an IEEE Distinguished Visitor Speaker from 1997 to 2000.
Dr. Shah is the recipient of the IEEE Outstanding Engineering EducatorAward in 1997. He also received of the Harris Corporation’s EngineeringAchievement Award in 1999, the Transfer of Knowledge Through Expatri-ate Nationals (TOKTEN) Awards from the United Nations Development Pro-gramme (UNDP) in 1995, 1997, and 2000, the Teaching Incentive ProgramAwards in 1995 and 2003, the Research Incentive Award in 2003, Millionaires’Club Awards in 2005 and 2006, the University Distinguished Researcher Awardin 2007, Honorable Mention for the International Conference on Computer Vi-sion (ICCV) 2005, and was also nominated for the Best Paper Award in theACM Multimedia Conference in 2005. In 2006, he was awarded the PegasusProfessor Award, the highest award at the UCF. He was an Associate Editor ofthe IEEE TRANSACTIONS ON PATTERN ANALYSIS AND MACHINE INTELLIGENCE
(PAMI).
Stephen T. C. Wong received the Ph.D. degree inelectrical engineering and computer science (EECS)from Lehigh University, Bethlehem, PA, in 1991.
He was the Founding Director of the Havard Cen-ter for Neurodegeneration and Repair (HCNR) Cen-ter for Bioinformatics; the Founding Director of theFunctional and Molecular Imaging Center, Depart-ment of Radiology, Brigham and Women’s Hospi-tal; and an Associate Professor of radiology, HarvardMedical School, Boston, MA. He is currently theVice Chairman and the Chief of Medical Physics,
Department of Radiology, Methodist Hospital, Houston, TX, and the ProgramDirector of Bioinformatics, and Senior Member of the Methodist Hospital Re-search Institute, Weill Cornell Medical College of Cornell University, Ithaca,NY. He has over two decades of research and development experience withleading institutions in academia and industry, including Hewlett-Packard (HP),AT&T Bell Laboratories, Japanese Fifth Generation Computing Project, RoyalPhilips Electronics of California, San Francisco (UCSF), Charles Schwab, andHarvard, and has made original contributions in the fields of bioinformatics andbiomedical image computing. He is the author or coauthor of more than 200peer-reviewed articles, two books, and six patents. He has also been a mem-ber of the editorial boards of seven international journals. His current researchinterests include biomedical informatics, biomedical imaging, and molecularimage-guided therapy.
Dr. Wang has been a PE (registered engineer since 1991).