Embed Size (px)
Citation preview
SRK Consulting (Australasia) Pty Ltd Reg’d No ABN 56 074 271 720 Trading as SRK Consulting
Backfill Option Study Interim Report
Weld Range Iron Ore Project
Report Prepared for
Sinosteel Midwest Corporation Limited
Prepared by
SMM001
February 2009
SRK CoBackfill
JB/pr
BacInteWe Pro DocRev Sin
Comp
JeminCons JBha AuthoJemin
SRK
NameTitle: Date:
onsulting Option Study Inte
ckfill Operim Repld Rang
oject Cod
cument vision: R
osteel M
piled by:
ni Bhargava sultant (Minin
ors: ni Bhargava
Approval Sig
e:
:
erim Report – Wel
ption Stuport
ge Iron O
de: SMM
ReferenRev No.3
Midwest
S
ng)
com.au
gnature:
ld Range Iron Ore
udy
Ore Proje
M001
nce: SMM3
Corpor
RK ConsuLevel 1,
Wes
e Project
SMM001__MIN_RP_1
ect
M001_M
ration Li
lting (Aust10 Richard
st Perth WA
C
NaTi
Da
_Rev3
MIN_RP_
mited
tralasia) Ptydson StreeA 6005
lient Approva
ame: tle: ate:
_No.1
y Ltd et
Principal
al Signature:
Peer Revie
Scott MConsultant
Page i
February 2009
ewed by:
McEwing(Mining)
SRK Consulting Backfill Option Study Interim Report – Weld Range Iron Ore Project Page ii
JB/pr SMM001__MIN_RP_1 _Rev3 February 2009
SRK Report Distribution Record
Ref: SMM001_MIN_RP_1: Rev3 Backfill Option Study Interim Report
Copy No: Electronic
Date: 16 March 2009
Name/Title Company
Beng Ko Sinosteel Midwest Corporation Limited
This document is protected by copyright vested in SRK. It may not be reproduced or transmitted in any form or by any means whatsoever to any person without the written permission of the copyright holder, SRK.
Rev No. Date Revised By Revision Details
0 18 Feb. 09 Jemini Bhargava Draft issued to Client 1 26 Feb 09 Jemini Bhargava Revised Draft issued to Client 2 06 March 09 Scott McEwing Revised Final Draft issued to Client with feedback
incorporated 3 16 March 09 Scott McEwing Final Report issued to Client
SRK Consulting Backfill Option Study Interim Report – Weld Range Iron Ore Project Page iii
JB/pr SMM001__MIN_RP_1 _Rev3 February 2009
Executive Summary SRK Consulting (Australasia) Pty Ltd (SRK) has been retained by Sinosteel Midwest Corporation Limited (SMC) to carry out specific technical studies that form part of Bankable Feasibility Study (BFS) of the Weld Range Iron Ore Project. Backfilling of mine waste into the mined out pits is one of the key option studies under the awarded BFS scope of work.
The objective of this report is to provide progress on the ongoing Backfill Study. This study has also highlighted possible improvements to blending options that will be considered in future studies.
The mining schedule presented in the Weld Range Iron Ore Project Pre Feasibility Study (PFS) has been taken as base case to draw comparisons against the backfilling schedule scenarios. Various mining scenarios have been considered by altering the pit mining sequence and varying the Run of Mine (RoM) stockpile capacity. The target product grades have been kept constant and are consistent to those used in PFS.
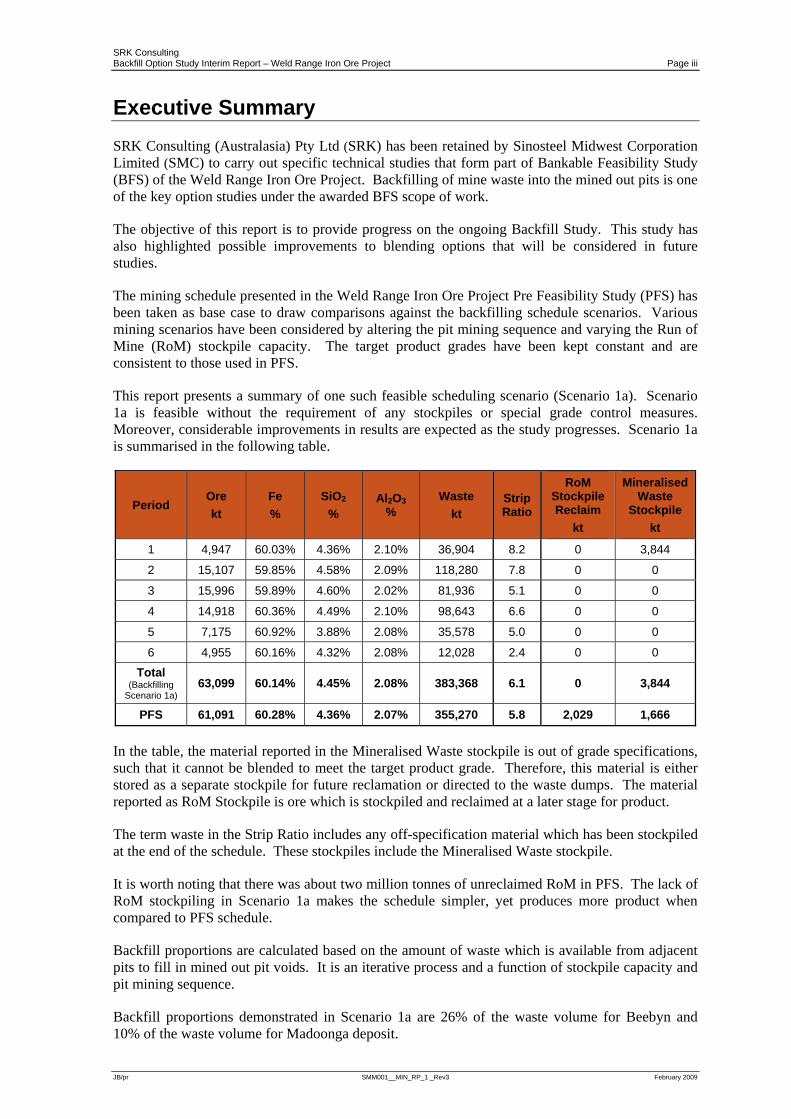
This report presents a summary of one such feasible scheduling scenario (Scenario 1a). Scenario 1a is feasible without the requirement of any stockpiles or special grade control measures. Moreover, considerable improvements in results are expected as the study progresses. Scenario 1a is summarised in the following table.
Period Ore kt
Fe %
SiO2 %
Al2O3 %
Waste kt
StripRatio
RoM Stockpile Reclaim
kt
Mineralised Waste
Stockpile kt
1 4,947 60.03% 4.36% 2.10% 36,904 8.2 0 3,844
2 15,107 59.85% 4.58% 2.09% 118,280 7.8 0 0
3 15,996 59.89% 4.60% 2.02% 81,936 5.1 0 0
4 14,918 60.36% 4.49% 2.10% 98,643 6.6 0 0
5 7,175 60.92% 3.88% 2.08% 35,578 5.0 0 0
6 4,955 60.16% 4.32% 2.08% 12,028 2.4 0 0
Total (Backfilling
Scenario 1a) 63,099 60.14% 4.45% 2.08% 383,368 6.1 0 3,844
PFS 61,091 60.28% 4.36% 2.07% 355,270 5.8 2,029 1,666
In the table, the material reported in the Mineralised Waste stockpile is out of grade specifications, such that it cannot be blended to meet the target product grade. Therefore, this material is either stored as a separate stockpile for future reclamation or directed to the waste dumps. The material reported as RoM Stockpile is ore which is stockpiled and reclaimed at a later stage for product.
The term waste in the Strip Ratio includes any off-specification material which has been stockpiled at the end of the schedule. These stockpiles include the Mineralised Waste stockpile.
It is worth noting that there was about two million tonnes of unreclaimed RoM in PFS. The lack of RoM stockpiling in Scenario 1a makes the schedule simpler, yet produces more product when compared to PFS schedule.
Backfill proportions are calculated based on the amount of waste which is available from adjacent pits to fill in mined out pit voids. It is an iterative process and a function of stockpile capacity and pit mining sequence.
Backfill proportions demonstrated in Scenario 1a are 26% of the waste volume for Beebyn and 10% of the waste volume for Madoonga deposit.

SRK Consulting Backfill Option Study Interim Report – Weld Range Iron Ore Project Page iv
JB/pr SMM001__MIN_RP_1 _Rev3 February 2009
The results from Scenario 1a have demonstrated that maintaining backfilling whilst mining is feasible, but only limited quantities of waste are able to be stowed in-pit. Elevating the backfilling process to be the primary mine production schedule driver and allowing stockpiles to feed the blended grade is expected to show improvement in results. The ongoing scheduling study is in progress with further scenarios being considered.
Recommendations
The timing and sequence of extraction plays an important role in determining the backfilling potential. Backfilling is limited in the Scenario 1a and only some portion of the pits may be opportunistically backfilled, with the major proportion of the waste reporting to external waste dumps. Thus, for this scenario, the dump footprints would not change considerably from those indicated in the Weld Range Iron Ore Project PFS.
SRK Consulting Backfill Option Study Interim Report – Weld Range Iron Ore Project Page v
JB/pr SMM001__MIN_RP_1 _Rev3 February 2009
Table of Contents Executive Summary ................................................................................................... iii List of Abbreviations ................................................................................................... 1
1 Introduction ..................................................................................................... 2
2 Objective ......................................................................................................... 2
3 Backfill Scheduling .......................................................................................... 4 3.1 Software .......................................................................................................... 4 3.2 New variables in block model .......................................................................... 4 3.3 Considerations ................................................................................................ 4 3.4 Scenarios ........................................................................................................ 4 3.5 Scheduling runs ............................................................................................... 5 3.6 Results ............................................................................................................ 5
4 Conclusions and Recommendations ............................................................. 11 4.1 Conclusion ..................................................................................................... 11 4.2 Recommendations ........................................................................................ 11
4.2.1 Quarterly schedule ...................................................................................... 11 4.2.2 Scheduling scenarios .................................................................................. 11 4.2.3 Balance backfill vs stockpile capacity ......................................................... 11 4.2.4 Improve resource to reserve conversion. (63 Mt / 69 Mt in the current
schedule) ..................................................................................................... 12 4.2.5 Smooth waste profile ................................................................................... 12
5 References ................................................................................................... 13
SRK Consulting Backfill Option Study Interim Report – Weld Range Iron Ore Project Page vi
JB/pr SMM001__MIN_RP_1 _Rev3 February 2009
List of Tables Table 2-1: Fines target grade ............................................................................................. 2 Table 2-2: ROM specifications by deposit .......................................................................... 3 Table 2-3: ROM specifications applied ............................................................................... 3 Table 3-1: Summary ........................................................................................................... 5 Table 3-2: Pit by pit Ore by Period (Scenario 1a) ............................................................... 7 Table 3-3: Pit by pit Waste by Period (Scenario 1a) ........................................................... 7 Table 3-4: Backfill percentage by quantity (Scenario 1a) ................................................... 8 Table 3-5: Pit by pit Waste volume by Period (Scenario 1a) .............................................. 9 Table 3-6: Backfill percentage by volume (theoretical calculation only, no swell)
(Scenario 1a) .................................................................................................... 9 Table 3-7: Backfill percentage by volume with a 30% swell factor on waste volume
(Scenario 1a) ......................................................................................................... 9 List of Figures Figure 3-1: Ore and Waste quantity by Period (Scenario 1a) ............................................. 5 Figure 3-2: Average contaminant grades by Period (Scenario 1a) ..................................... 6 Figure 3-3: Average Fe grade by period (Scenario 1a) ..................................................... 6 List of Appendices Appendix 1: Bench by Bench Schedule Appendix 2: Vertical Advance Appendix 3: Combo Variable Codes
SRK Consulting Backfill Option Study Interim Report – Weld Range Iron Ore Project Page vii
JB/pr SMM001__MIN_RP_1 _Rev3 February 2009
Disclaimer The opinions expressed in this Report have been based on the information supplied to SRK Consulting (Australasia) Pty Ltd (SRK) by Sinosteel Midwest Corporation Limited (SMC). The opinions in this Report are provided in response to a specific request from SMC to do so. SRK has exercised all due care in reviewing the supplied information. Whilst SRK has compared key supplied data with expected values, the accuracy of the results and conclusions from the review are entirely reliant on the accuracy and completeness of the supplied data. SRK does not accept responsibility for any errors or omissions in the supplied information and does not accept any consequential liability arising from commercial decisions or actions resulting from them.
SRK Consulting Backfill Option Study Interim Report – Weld Range Iron Ore Project Page 1
JB/pr SMM001__MIN_RP_1 _Rev3 February 2009
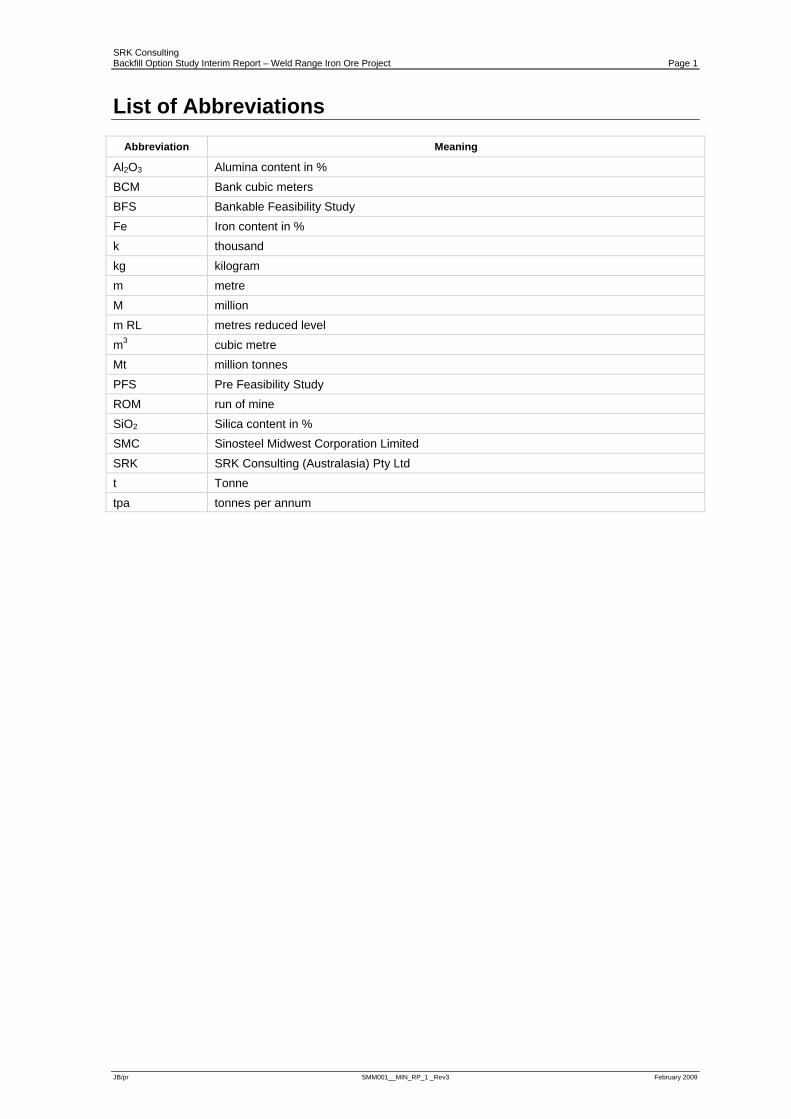
List of Abbreviations
Abbreviation Meaning
Al2O3 Alumina content in % BCM Bank cubic meters BFS Bankable Feasibility Study Fe Iron content in % k thousand kg kilogram m metre M million m RL metres reduced level m3 cubic metre Mt million tonnes PFS Pre Feasibility Study ROM run of mine SiO2 Silica content in % SMC Sinosteel Midwest Corporation Limited SRK SRK Consulting (Australasia) Pty Ltd t Tonne tpa tonnes per annum
SRK Consulting Backfill Option Study Interim Report – Weld Range Iron Ore Project Page 2
JB/pr SMM001__MIN_RP_1 _Rev3 February 2009
1 Introduction SRK Consulting (Australasia) Pty Ltd (SRK) has been retained by Sinosteel Midwest Corporation Limited (SMC) to carry out the Bankable Feasibility Study (BFS) of the Weld Range Iron Ore Project. Backfilling of mine waste into the mined out pits is one of the key option studies under the BFS scope of work.
Backfilling is the process of utilising mined out pit voids to store the waste from adjacent operating pits. Generally, one pit is mined out early in the production schedule so that it can be utilised as a dumping location for other pits. This reduces the external waste dump size and hence the external dump footprint.
Backfilling impacts on the ore mine production schedule. The greater the onus on backfilling, the more constrained the mine production schedule becomes and the more difficult it becomes to achieve the blended grade requirements. Optimising the backfilling scenarios requires considerable schedule manipulation.
The use of external Run of Mine (RoM) stockpiles play an important role in providing the required blend.
This study focuses on achieving the target grade specifications to meet the plant requirements and at the same time, sequencing the pits in a manner such that they can be backfilled.
2 Objective The object of this study is to assess the feasibility of backfilling the mined out pits. The basis for comparison to non backfilling options is the results from the prior Weld Range Iron Ore Project Pre Feasibility Study (PFS) designs and mine production schedules.
A practical mining schedule needs to be generated which caters to the backfilling requirements as well as maintaining the RoM feed grade specifications.
In this study, various scenarios on backfilling sequence are being considered. At the same time the feed grade target specifications were kept constant.
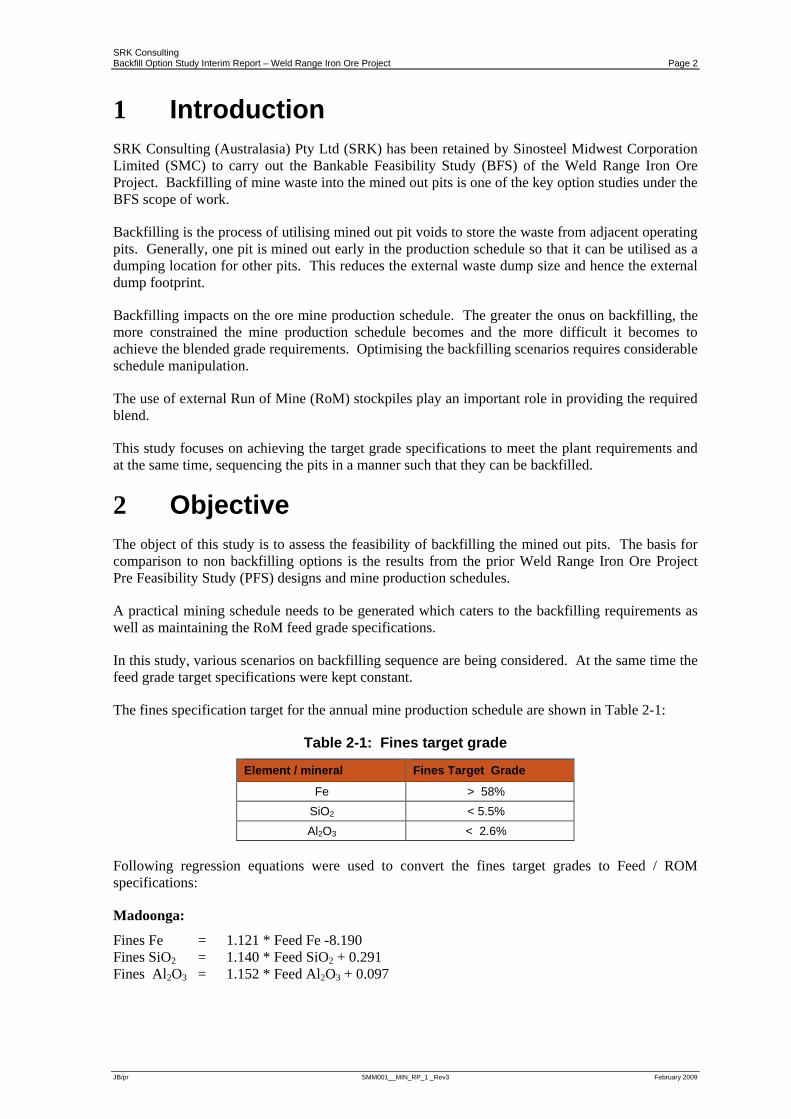
The fines specification target for the annual mine production schedule are shown in Table 2-1:
Table 2-1: Fines target grade
Element / mineral Fines Target Grade
Fe > 58% SiO2 < 5.5% Al2O3 < 2.6%
Following regression equations were used to convert the fines target grades to Feed / ROM specifications:
Madoonga:
Fines Fe = 1.121 * Feed Fe -8.190 Fines SiO2 = 1.140 * Feed SiO2 + 0.291 Fines Al2O3 = 1.152 * Feed Al2O3 + 0.097
SRK Consulting Backfill Option Study Interim Report – Weld Range Iron Ore Project Page 3
JB/pr SMM001__MIN_RP_1 _Rev3 February 2009
Beebyn:
Fines Fe = 1.149 * Feed Fe – 10.061 Fines SiO2 = 1.227 * Feed SiO2 – 0.134 Fines Al2O3 = 1.066 * Feed Al2O3 + 0.487
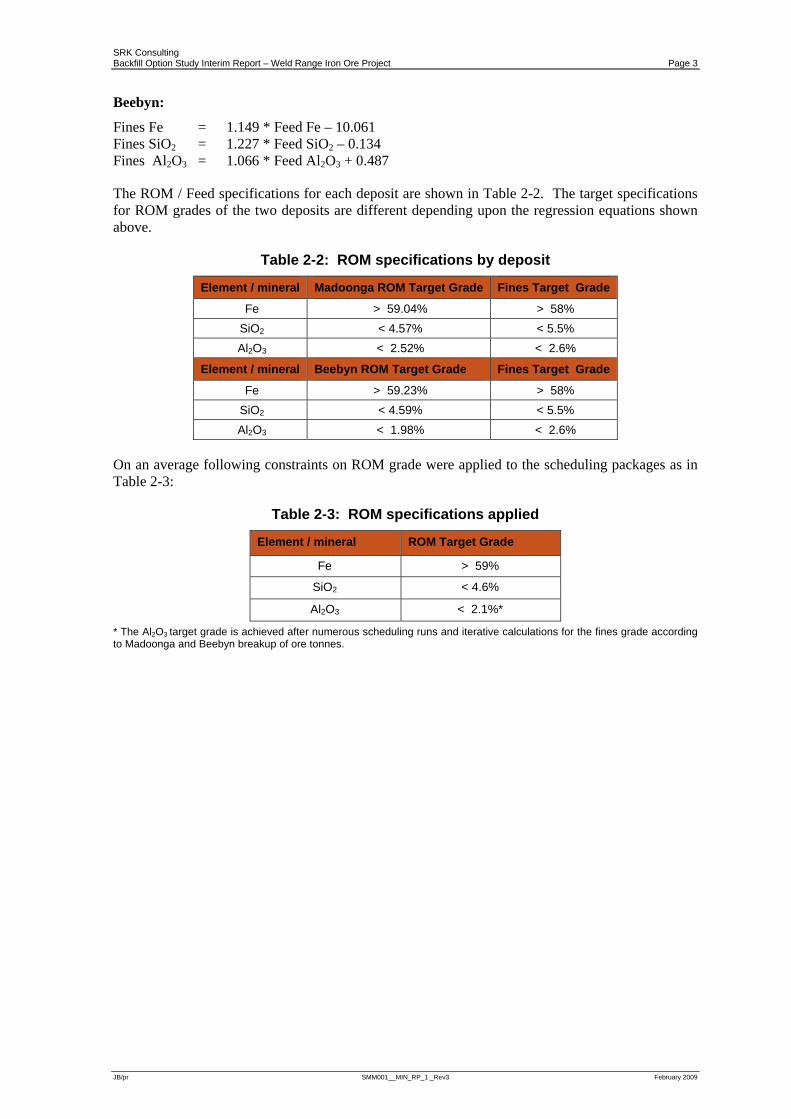
The ROM / Feed specifications for each deposit are shown in Table 2-2. The target specifications for ROM grades of the two deposits are different depending upon the regression equations shown above.
Table 2-2: ROM specifications by deposit
Element / mineral Madoonga ROM Target Grade Fines Target Grade
Fe > 59.04% > 58% SiO2 < 4.57% < 5.5% Al2O3 < 2.52% < 2.6%
Element / mineral Beebyn ROM Target Grade Fines Target Grade
Fe > 59.23% > 58% SiO2 < 4.59% < 5.5% Al2O3 < 1.98% < 2.6%
On an average following constraints on ROM grade were applied to the scheduling packages as in Table 2-3:
Table 2-3: ROM specifications applied
Element / mineral ROM Target Grade
Fe > 59%
SiO2 < 4.6%
Al2O3 < 2.1%*
* The Al2O3 target grade is achieved after numerous scheduling runs and iterative calculations for the fines grade according to Madoonga and Beebyn breakup of ore tonnes.
SRK Consulting Backfill Option Study Interim Report – Weld Range Iron Ore Project Page 4
JB/pr SMM001__MIN_RP_1 _Rev3 February 2009
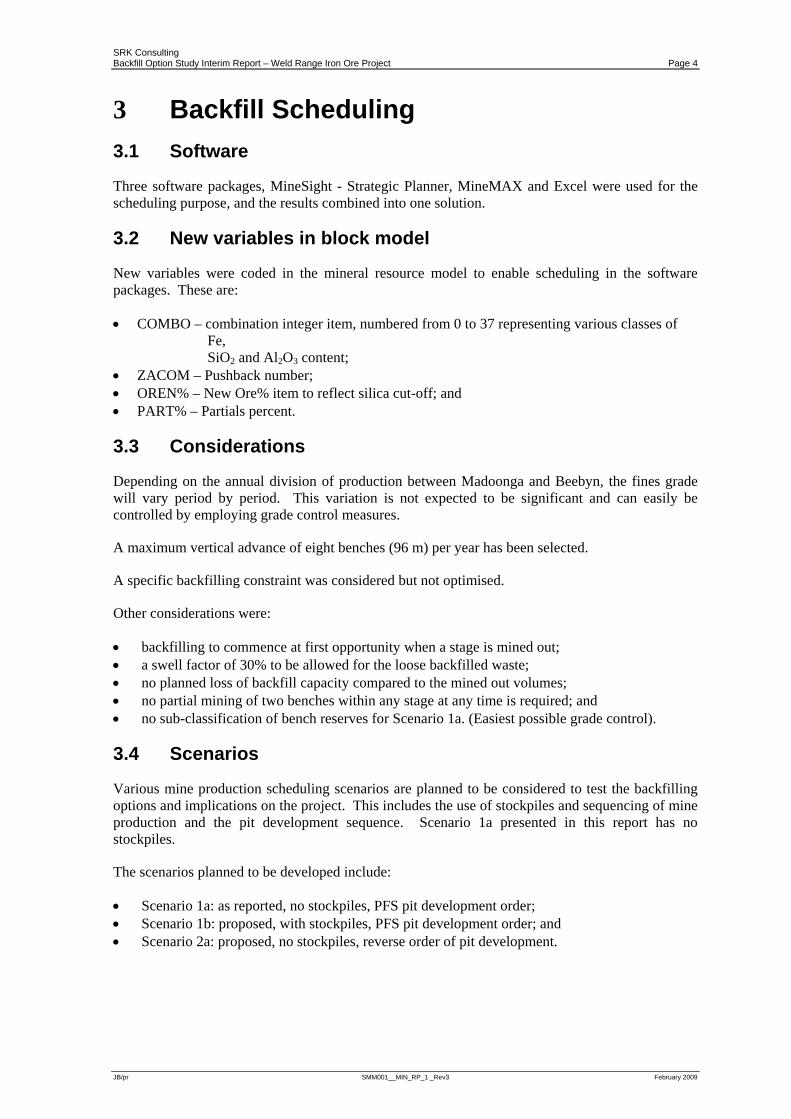
3 Backfill Scheduling 3.1 Software
Three software packages, MineSight - Strategic Planner, MineMAX and Excel were used for the scheduling purpose, and the results combined into one solution.
3.2 New variables in block model
New variables were coded in the mineral resource model to enable scheduling in the software packages. These are:
• COMBO – combination integer item, numbered from 0 to 37 representing various classes of Fe, SiO2 and Al2O3 content;
• ZACOM – Pushback number; • OREN% – New Ore% item to reflect silica cut-off; and • PART% – Partials percent.
3.3 Considerations
Depending on the annual division of production between Madoonga and Beebyn, the fines grade will vary period by period. This variation is not expected to be significant and can easily be controlled by employing grade control measures.
A maximum vertical advance of eight benches (96 m) per year has been selected.
A specific backfilling constraint was considered but not optimised.
Other considerations were:
• backfilling to commence at first opportunity when a stage is mined out; • a swell factor of 30% to be allowed for the loose backfilled waste; • no planned loss of backfill capacity compared to the mined out volumes; • no partial mining of two benches within any stage at any time is required; and • no sub-classification of bench reserves for Scenario 1a. (Easiest possible grade control).
3.4 Scenarios
Various mine production scheduling scenarios are planned to be considered to test the backfilling options and implications on the project. This includes the use of stockpiles and sequencing of mine production and the pit development sequence. Scenario 1a presented in this report has no stockpiles.
The scenarios planned to be developed include:
• Scenario 1a: as reported, no stockpiles, PFS pit development order; • Scenario 1b: proposed, with stockpiles, PFS pit development order; and • Scenario 2a: proposed, no stockpiles, reverse order of pit development.
SRK CoBackfill
JB/pr
3.5
Numeachiewas e
3.6
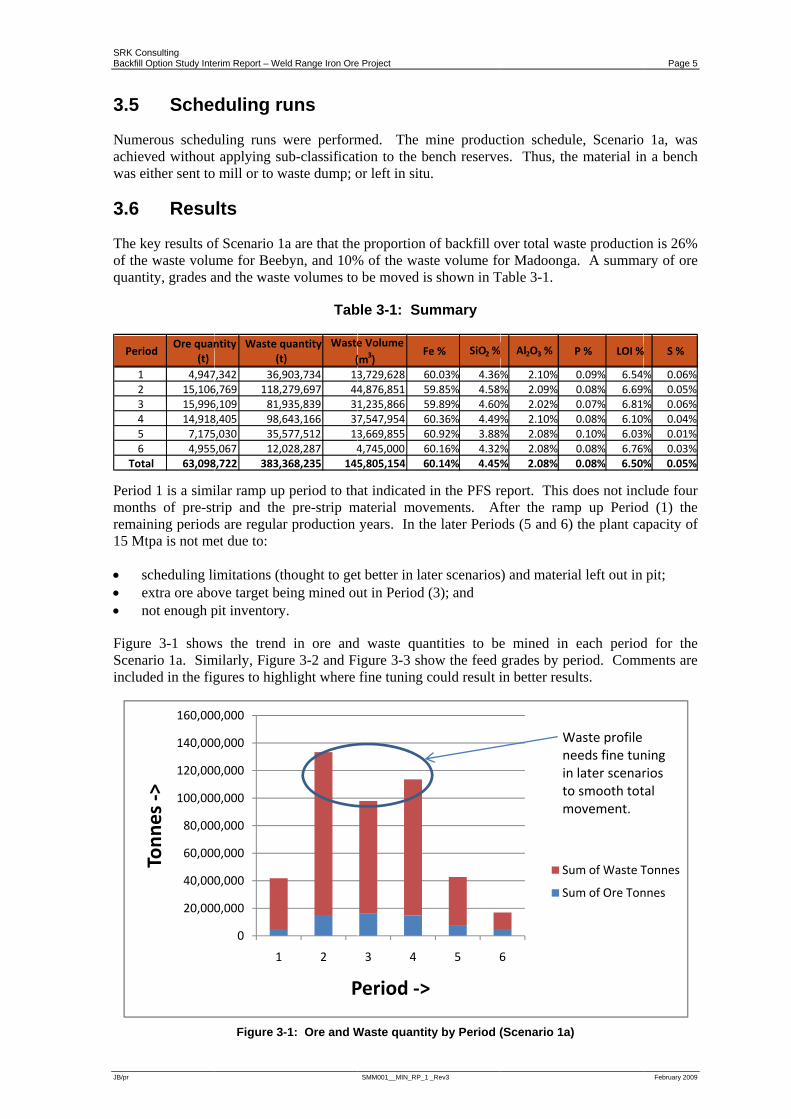
The kof thequant
Periomontremai15 M
• s• e• n
FigurScenainclu
Peri
123456
Tot
onsulting Option Study Inte
Sche
erous schedueved withouteither sent to
Resu
key results ofe waste volutity, grades a
od 1 is a simiths of pre-stining period
Mtpa is not me
scheduling liextra ore abonot enough p
re 3-1 showario 1a. Simded in the fig
20,000
40,000
60,000
80,000
100,000
120,000
140,000
160,000
Tonn
es ‐>
iodOre quan
(t)1 4,9472 15,1063 15,9964 14,9185 7,1756 4,955tal 63,098
erim Report – Wel
duling ru
uling runs wt applying suo mill or to w
lts
f Scenario 1aume for Beeband the waste
ilar ramp up trip and the s are regularet due to:
imitations (thove target bepit inventory
ws the trend milarly, Figurgures to high
Figure 3-
0
0,000
0,000
0,000
0,000
0,000
0,000
0,000
0,000
1
ntity Waste q(t)
7,342 36,96,769 118,26,109 81,98,405 98,65,030 35,55,067 12,08,722 383,3
ld Range Iron Ore
uns
were performub-classificat
waste dump; o
a are that thebyn, and 10%e volumes to
Tab
period to thpre-strip m
r production
hought to geting mined ou.
in ore andre 3-2 and Fihlight where
-1: Ore and W
2
P
uantity )
Waste(
903,734 13279,697 44935,839 3643,166 37577,512 13028,287 4368,235 145
e Project
SMM001__MIN_RP_1
med. The mtion to the bor left in situ
e proportion % of the waso be moved is
ble 3-1: Su
at indicated material mov
years. In th
t better in latut in Period (
d waste quaigure 3-3 shofine tuning c
Waste quantit
3 4
Period ‐>
e Volume(m3)
Fe
3,729,628 64,876,851 51,235,866 57,547,954 63,669,855 64,745,000 65,805,154 6
_Rev3
mine producench reserve
u.
of backfill oste volume fos shown in T
mmary
in the PFS rvements. Afhe later Perio
ter scenarios(3); and
antities to beow the feed could result i
ty by Period (
5 6
>
e % SiO2 %
60.03% 4.36%9.85% 4.58%9.89% 4.60%
60.36% 4.49%60.92% 3.88%60.16% 4.32%0.14% 4.45%
ction schedues. Thus, the
ver total wasor Madoonga
Table 3-1.
report. This fter the ram
ods (5 and 6)
) and materia
e mined in grades by pein better resu
(Scenario 1a)
6
Su
Su
Wneintom
Al2O3 %
% 2.10%% 2.09%% 2.02%% 2.10%% 2.08%% 2.08%% 2.08%
le, Scenarioe material in
ste productioa. A summa
does not incmp up Period) the plant ca
al left out in
each perioderiod. Commults.
)
um of Waste T
um of Ore Ton
Waste profile eeds fine tunn later scenaro smooth totmovement.
P % LOI %
0.09% 6.540.08% 6.690.07% 6.810.08% 6.100.10% 6.030.08% 6.760.08% 6.50%
Page 5
February 2009
1a, was n a bench
on is 26% ary of ore
clude four d (1) the apacity of
pit;
d for the ments are
Tonnes
nnes
ning rios tal
% S %
% 0.06%% 0.05%% 0.06%% 0.04%% 0.01%% 0.03%% 0.05%
SRK Consulting Backfill Option Study Interim Report – Weld Range Iron Ore Project Page 6
JB/pr SMM001__MIN_RP_1 _Rev3 February 2009
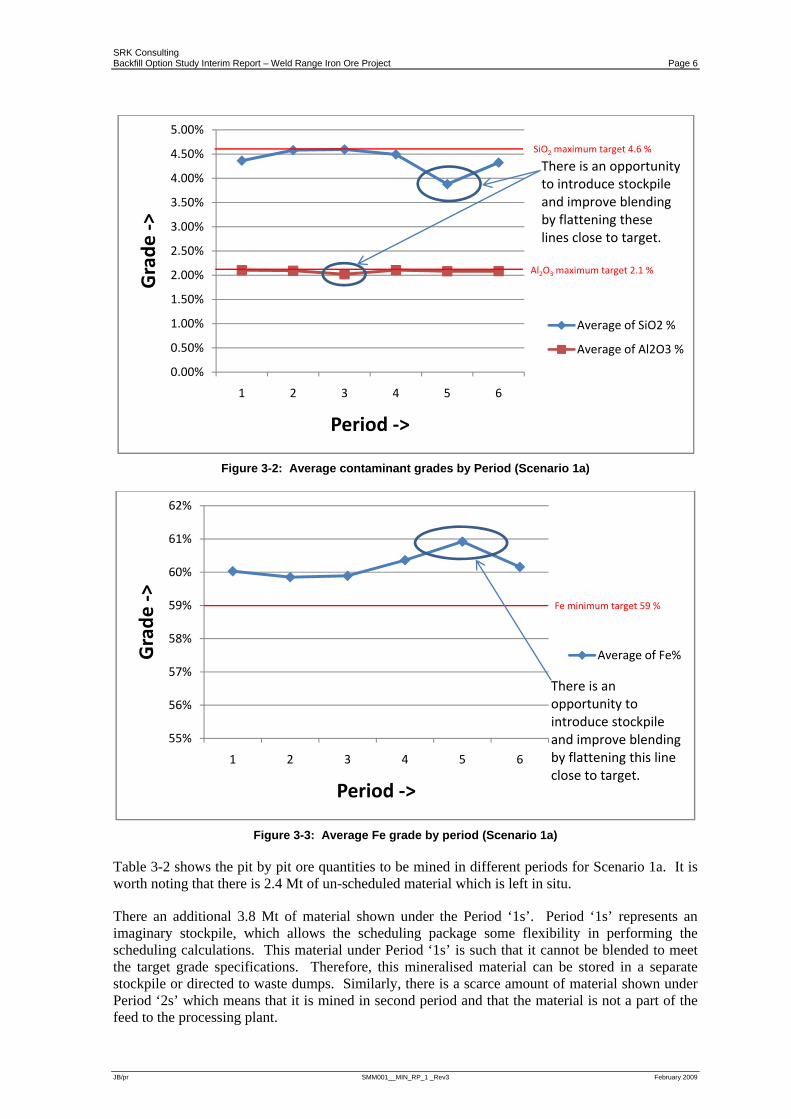
Figure 3-2: Average contaminant grades by Period (Scenario 1a)
Figure 3-3: Average Fe grade by period (Scenario 1a)
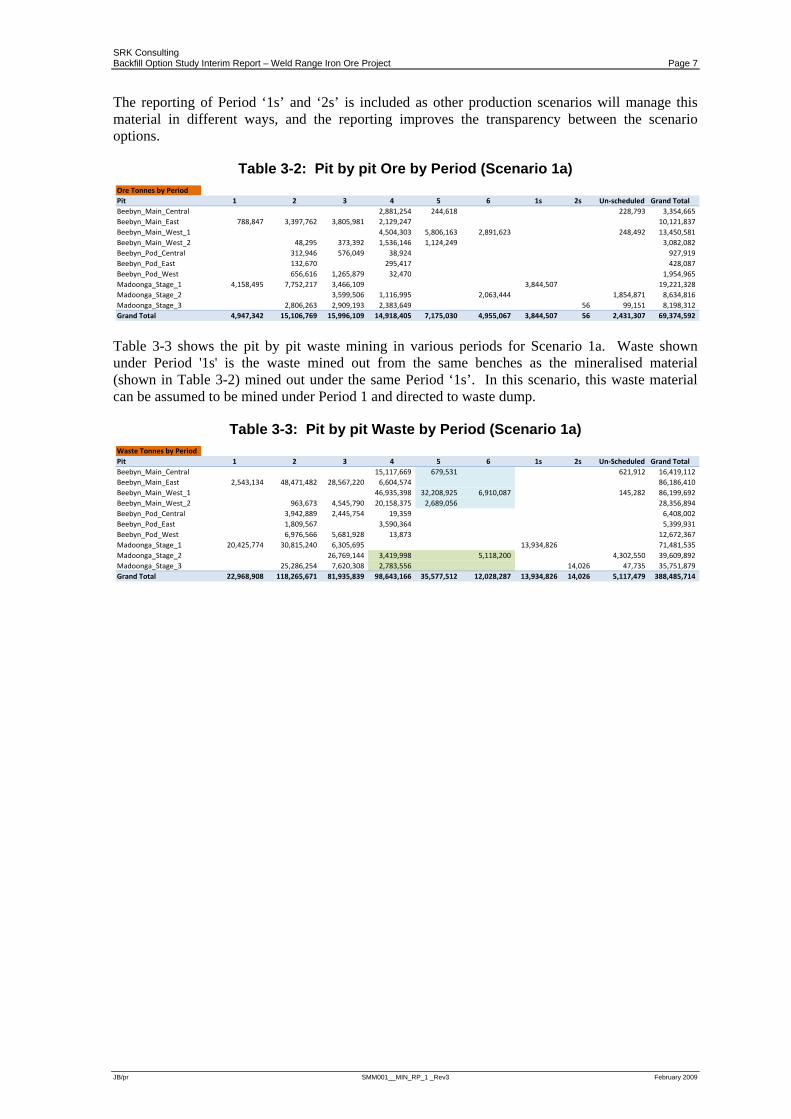
Table 3-2 shows the pit by pit ore quantities to be mined in different periods for Scenario 1a. It is worth noting that there is 2.4 Mt of un-scheduled material which is left in situ.
There an additional 3.8 Mt of material shown under the Period ‘1s’. Period ‘1s’ represents an imaginary stockpile, which allows the scheduling package some flexibility in performing the scheduling calculations. This material under Period ‘1s’ is such that it cannot be blended to meet the target grade specifications. Therefore, this mineralised material can be stored in a separate stockpile or directed to waste dumps. Similarly, there is a scarce amount of material shown under Period ‘2s’ which means that it is mined in second period and that the material is not a part of the feed to the processing plant.
0.00%
0.50%
1.00%
1.50%
2.00%
2.50%
3.00%
3.50%
4.00%
4.50%
5.00%
1 2 3 4 5 6
Grade
‐>
Period ‐>
Average of SiO2 %
Average of Al2O3 %
SiO2 maximum target 4.6 %
Al2O3 maximum target 2.1 %
There is an opportunityto introduce stockpile and improve blending by flattening these lines close to target.
55%
56%
57%
58%
59%
60%
61%
62%
1 2 3 4 5 6
Grade
‐>
Period ‐>
Average of Fe%
Fe minimum target 59 %
There is an opportunity to introduce stockpile and improve blending by flattening this line close to target.
SRK Consulting Backfill Option Study Interim Report – Weld Range Iron Ore Project Page 7
JB/pr SMM001__MIN_RP_1 _Rev3 February 2009
The reporting of Period ‘1s’ and ‘2s’ is included as other production scenarios will manage this material in different ways, and the reporting improves the transparency between the scenario options.
Table 3-2: Pit by pit Ore by Period (Scenario 1a)
Table 3-3 shows the pit by pit waste mining in various periods for Scenario 1a. Waste shown under Period '1s' is the waste mined out from the same benches as the mineralised material (shown in Table 3-2) mined out under the same Period ‘1s’. In this scenario, this waste material can be assumed to be mined under Period 1 and directed to waste dump.
Table 3-3: Pit by pit Waste by Period (Scenario 1a)
Ore Tonnes by PeriodPit 1 2 3 4 5 6 1s 2s Un‐scheduled Grand TotalBeebyn_Main_Central 2,881,254 244,618 228,793 3,354,665 Beebyn_Main_East 788,847 3,397,762 3,805,981 2,129,247 10,121,837 Beebyn_Main_West_1 4,504,303 5,806,163 2,891,623 248,492 13,450,581 Beebyn_Main_West_2 48,295 373,392 1,536,146 1,124,249 3,082,082 Beebyn_Pod_Central 312,946 576,049 38,924 927,919 Beebyn_Pod_East 132,670 295,417 428,087 Beebyn_Pod_West 656,616 1,265,879 32,470 1,954,965 Madoonga_Stage_1 4,158,495 7,752,217 3,466,109 3,844,507 19,221,328 Madoonga_Stage_2 3,599,506 1,116,995 2,063,444 1,854,871 8,634,816 Madoonga_Stage_3 2,806,263 2,909,193 2,383,649 56 99,151 8,198,312 Grand Total 4,947,342 15,106,769 15,996,109 14,918,405 7,175,030 4,955,067 3,844,507 56 2,431,307 69,374,592
Waste Tonnes by PeriodPit 1 2 3 4 5 6 1s 2s Un‐Scheduled Grand TotalBeebyn_Main_Central 15,117,669 679,531 621,912 16,419,112 Beebyn_Main_East 2,543,134 48,471,482 28,567,220 6,604,574 86,186,410 Beebyn_Main_West_1 46,935,398 32,208,925 6,910,087 145,282 86,199,692 Beebyn_Main_West_2 963,673 4,545,790 20,158,375 2,689,056 28,356,894 Beebyn_Pod_Central 3,942,889 2,445,754 19,359 6,408,002 Beebyn_Pod_East 1,809,567 3,590,364 5,399,931 Beebyn_Pod_West 6,976,566 5,681,928 13,873 12,672,367 Madoonga_Stage_1 20,425,774 30,815,240 6,305,695 13,934,826 71,481,535 Madoonga_Stage_2 26,769,144 3,419,998 5,118,200 4,302,550 39,609,892 Madoonga_Stage_3 25,286,254 7,620,308 2,783,556 14,026 47,735 35,751,879 Grand Total 22,968,908 118,265,671 81,935,839 98,643,166 35,577,512 12,028,287 13,934,826 14,026 5,117,479 388,485,714
SRK Consulting Backfill Option Study Interim Report – Weld Range Iron Ore Project Page 8
JB/pr SMM001__MIN_RP_1 _Rev3 February 2009
Backfilling percentage has been calculated based on the amount of material that can be potentially backfilled in the void space created with the view to highlight the amount of material which is potentially available for backfilling in a given scenario. It is the intention to keep the reporting simple, and allow more detailed reporting in the final report when other scenarios are available for comparison and contrast.
Due to the varied ore-waste translation from one scenario to other and the variation in densities from pit to pit, the void created by mining ore has been ignored in this interim report. The void created by waste mining, and loose (swelled) backfilled waste volume is used for calculating the backfilling percentage.
It can be observed from Table 3-2 that Beebyn Main East pit gets completely mined out in Period 4 and that Madoonga Stage 1 pit gets completely mined out in Period 3. Henceforth, these pit voids are available for backfilling. Table 3-3 highlights the amount of waste that would be available from adjacent pits for backfilling these voids.
In Table 3-3, light blue background highlights the material which can be potentially backfilled in Beebyn Main East pit and light green background highlights the material which can be potentially backfilled in Madoonga Stage 1 pit. The sum of the quantities is 42.5 and 11.3 Mt, respectively.
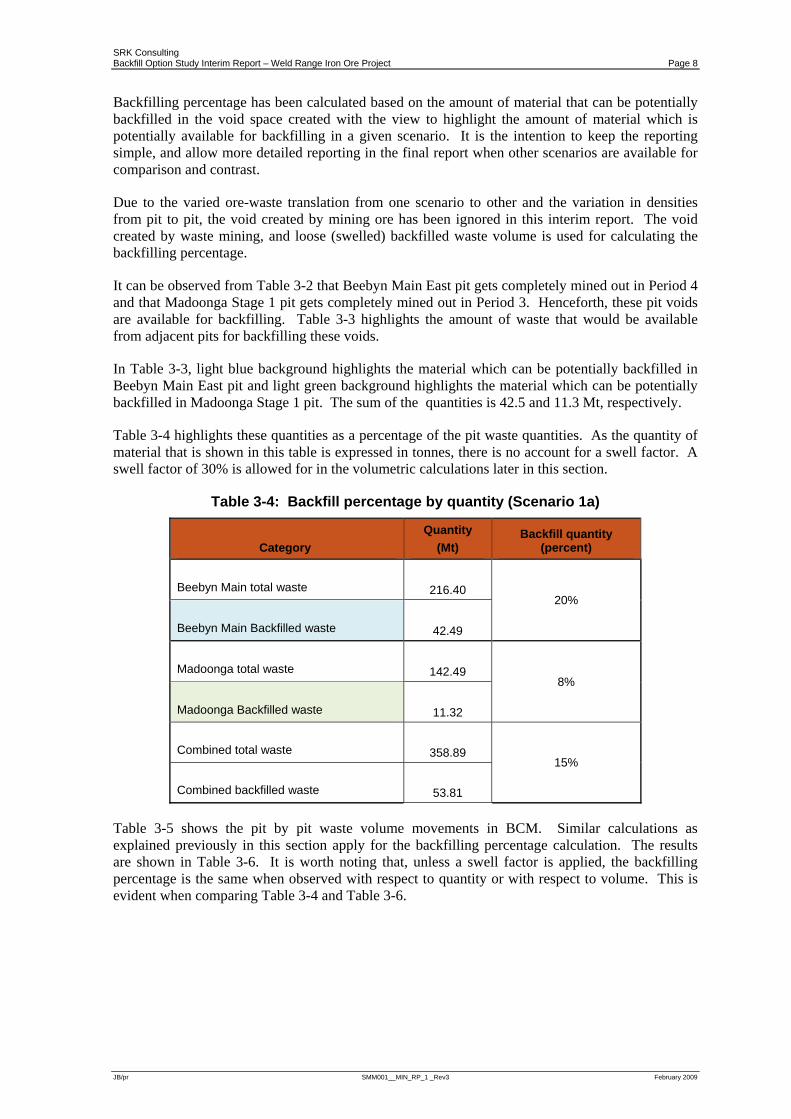
Table 3-4 highlights these quantities as a percentage of the pit waste quantities. As the quantity of material that is shown in this table is expressed in tonnes, there is no account for a swell factor. A swell factor of 30% is allowed for in the volumetric calculations later in this section.
Table 3-4: Backfill percentage by quantity (Scenario 1a)
Category Quantity
(Mt) Backfill quantity
(percent)
Beebyn Main total waste 216.40 20%
Beebyn Main Backfilled waste 42.49
Madoonga total waste 142.49 8%
Madoonga Backfilled waste 11.32
Combined total waste 358.89 15%
Combined backfilled waste 53.81
Table 3-5 shows the pit by pit waste volume movements in BCM. Similar calculations as explained previously in this section apply for the backfilling percentage calculation. The results are shown in Table 3-6. It is worth noting that, unless a swell factor is applied, the backfilling percentage is the same when observed with respect to quantity or with respect to volume. This is evident when comparing Table 3-4 and Table 3-6.
SRK Consulting Backfill Option Study Interim Report – Weld Range Iron Ore Project Page 9
JB/pr SMM001__MIN_RP_1 _Rev3 February 2009
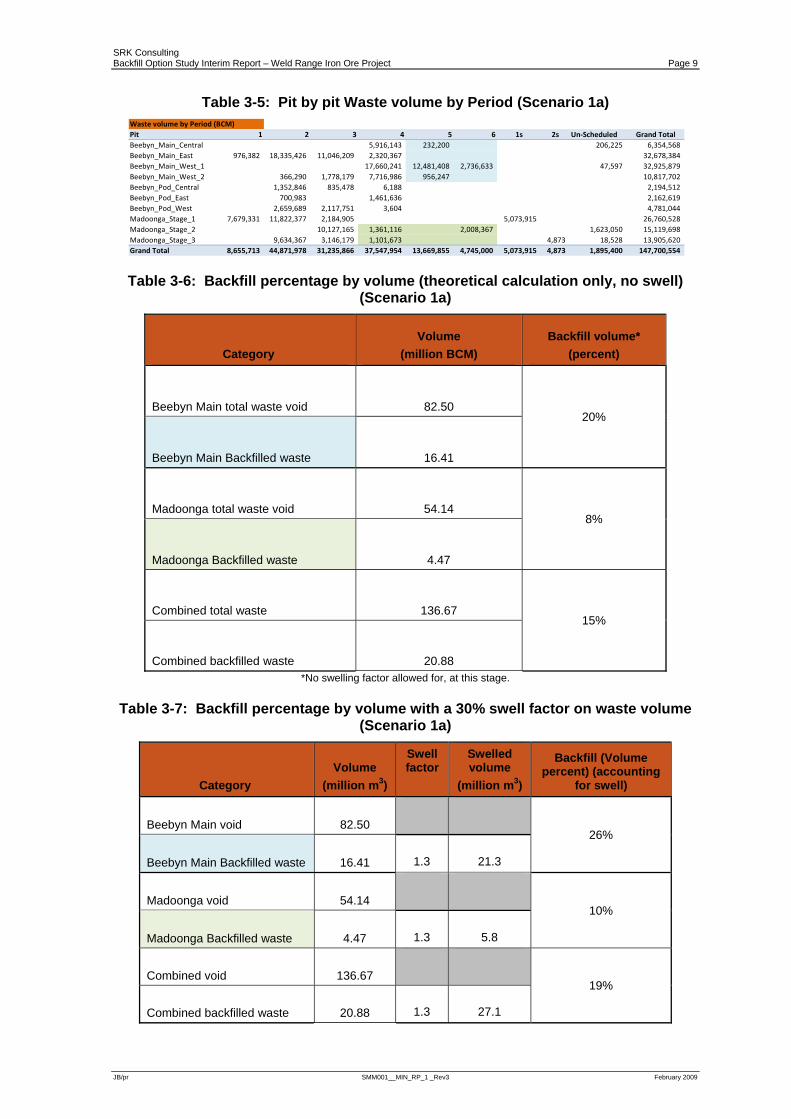
Table 3-5: Pit by pit Waste volume by Period (Scenario 1a)
Table 3-6: Backfill percentage by volume (theoretical calculation only, no swell) (Scenario 1a)
Category Volume
(million BCM) Backfill volume*
(percent)
Beebyn Main total waste void 82.50 20%
Beebyn Main Backfilled waste 16.41
Madoonga total waste void 54.14 8%
Madoonga Backfilled waste 4.47
Combined total waste 136.67 15%
Combined backfilled waste 20.88 *No swelling factor allowed for, at this stage.
Table 3-7: Backfill percentage by volume with a 30% swell factor on waste volume (Scenario 1a)
Category Volume
(million m3)
Swell factor
Swelled volume
(million m3)
Backfill (Volume percent) (accounting
for swell)
Beebyn Main void 82.50
26%
Beebyn Main Backfilled waste 16.41
1.3
21.3
Madoonga void 54.14
10%
Madoonga Backfilled waste 4.47
1.3
5.8
Combined void 136.67
19%
Combined backfilled waste 20.88
1.3
27.1
Pit 1 2 3 4 5 6 1s 2s Un‐Scheduled Grand TotalBeebyn_Main_Central 5,916,143 232,200 206,225 6,354,568 Beebyn_Main_East 976,382 18,335,426 11,046,209 2,320,367 32,678,384 Beebyn_Main_West_1 17,660,241 12,481,408 2,736,633 47,597 32,925,879 Beebyn_Main_West_2 366,290 1,778,179 7,716,986 956,247 10,817,702 Beebyn_Pod_Central 1,352,846 835,478 6,188 2,194,512 Beebyn_Pod_East 700,983 1,461,636 2,162,619 Beebyn_Pod_West 2,659,689 2,117,751 3,604 4,781,044 Madoonga_Stage_1 7,679,331 11,822,377 2,184,905 5,073,915 26,760,528 Madoonga_Stage_2 10,127,165 1,361,116 2,008,367 1,623,050 15,119,698 Madoonga_Stage_3 9,634,367 3,146,179 1,101,673 4,873 18,528 13,905,620 Grand Total 8,655,713 44,871,978 31,235,866 37,547,954 13,669,855 4,745,000 5,073,915 4,873 1,895,400 147,700,554
Waste volume by Period (BCM)
SRK Consulting Backfill Option Study Interim Report – Weld Range Iron Ore Project Page 10
JB/pr SMM001__MIN_RP_1 _Rev3 February 2009
Table 3-7 shows the actual volumetric calculations based on swelled backfilling material volumes. A swell factor of 1.3 (or 30%) is applied. It is to be observed that the backfilled waste swells but not the void volume, so the swelling factor is applied only to the backfilled waste row in the above table. The backfill percent in the last column is calculated as a ratio of swelled backfill volume to the void volume.
SRK Consulting Backfill Option Study Interim Report – Weld Range Iron Ore Project Page 11
JB/pr SMM001__MIN_RP_1 _Rev3 February 2009
4 Conclusions and Recommendations 4.1 Conclusion
The Scenario 1a mine production schedule presented in this report is a feasible backfill solution.
Scenario 1a also indicates a total of 63 of total the 69 million tonnes (or 91%) ore was scheduled, without the need for external RoM stockpiles and with no grade bins to sub-classify the bench reserves. The schedule is not optimised in terms of backfill constraints and stockpile utilisation. Making backfilling the primary schedule driver and allowing stockpiles to feed the blended grade, is expected to show improvement in the results.
At this stage, results from this schedule have demonstrated that backfilling, is feasible but to a limited extent. The ongoing scheduling scenario work outlined below is expected to improve the results.
4.2 Recommendations
Lump / fine grade regressions have been coded into the Resource model to allow for precise ongoing blending and backfilling studies.
SRK recommends future and ongoing work to proceed in the direction indicated below.
4.2.1 Quarterly schedule
The schedule presented here has yearly time periods. Average grades mined in these periods are very close or the same as target grade specifications. There is a concern that although annual target for grade specifications and tonnage be met by the schedule, it might be difficult to feed the target blend in shorter periods of time such as on a quarterly or monthly basis.
SRK recommends generating a quarterly schedule to assess and demonstrate the practicality of feeding the blended grade.
4.2.2 Scheduling scenarios
Various changes in constraints have different impact on the schedule and hence the mining sequence. Therefore, various scenarios are to be considered and the optimal case be selected for fine tuning. Examples of scenarios to be considered are mentioned below.
• Backfill Madoonga Stage 3 first. • Relax backfill constraint on Beebyn. • Consider backfilling Beebyn Pods.
4.2.3 Balance backfill vs stockpile capacity
Waste backfill amount depends on the mining sequence, as pits to be backfilled need to be sequenced earlier in the mining schedule. Also, the sequence has to be such that the target grade specifications are met. To achieve this, some material, which cannot be directly fed to the plant, needs to be stockpiled and blended with appropriate material being mined at a later date. This blend is then fed to the plant. This is a two step iterative process.
• Optimise for backfill, assess variations on backfill constraints. • Optimise Stockpiles capacity for effective blending.
SRK Consulting Backfill Option Study Interim Report – Weld Range Iron Ore Project Page 12
JB/pr SMM001__MIN_RP_1 _Rev3 February 2009
4.2.4 Improve resource to reserve conversion. (63 Mt / 69 Mt in the current schedule)
In the schedule presented here 63 Mt of ore is fed to the plant. The rest is not able to be blended to meet the target grade specifications.
This resource to reserve conversion needs to be improved by sequencing variations and by utilising stockpiles to create the blend. Higher the reserve, higher is the project value.
Although total movement increases as compared to PFS schedule, the project value increases. This is because the PFS designs are optimum on the assumption that all of 69 Mt can be blended and processed.
4.2.5 Smooth waste profile
A smooth waste profile is desirable as it will help better negotiate a mining contract. The equipment required for the movement wouldn’t change much over the years making it logistically easy to carry out the operations.
SRK Consulting Backfill Option Study Interim Report – Weld Range Iron Ore Project Page 13
JB/pr SMM001__MIN_RP_1 _Rev3 February 2009
5 References Murray Carl, Pre Feasibility Mining Study Weld Range Iron Ore Project, SRK Consulting (Perth,
November 2008)

SRK Consulting Backfill Option Study Interim Report – Weld Range Iron Ore Project Appendices
JB/pr SMM001__MIN_RP_1 _Rev3 February 2009
Appendices
SRK Consulting Backfill Option Study Interim Report – Weld Range Iron Ore Project Appendix 1
JB/pr SMM001__MIN_RP_1 _Rev3 February 2009
Appendix 1: Bench by Bench Schedule
SRK Consulting Backfill Option Study Interim Report – Weld Range Iron Ore Project Appendix 1-1
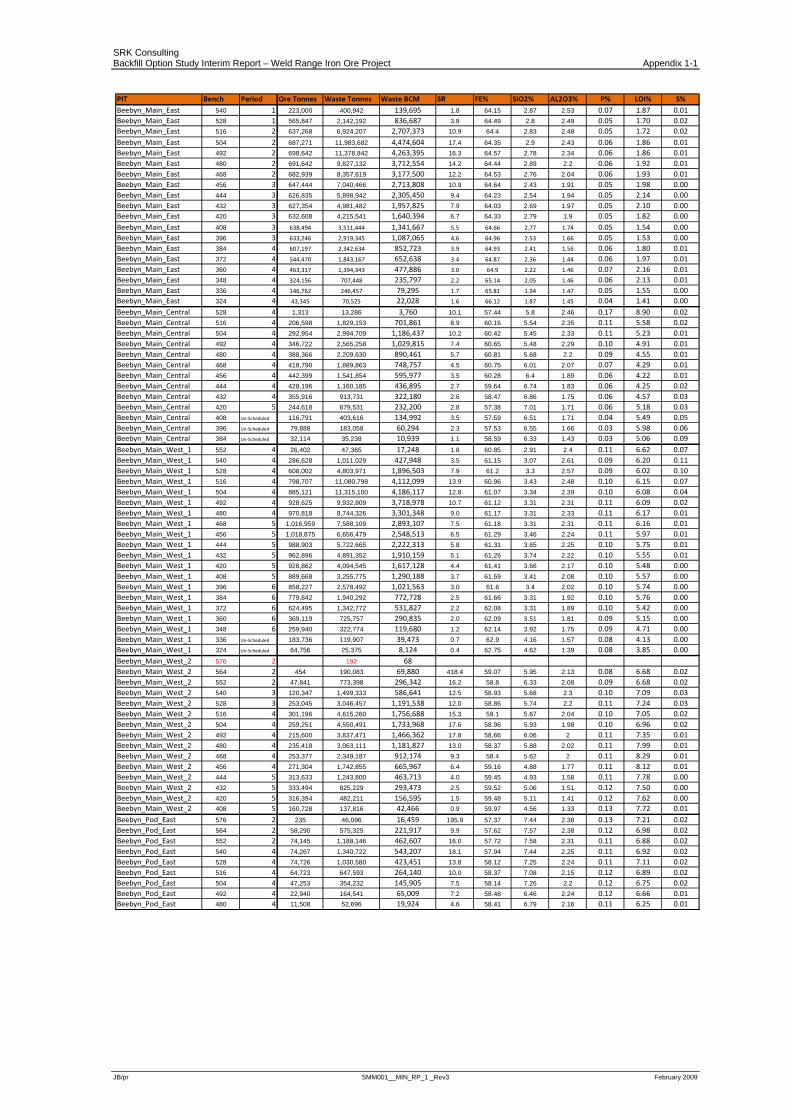
JB/pr SMM001__MIN_RP_1 _Rev3 February 2009
PIT Bench Period Ore Tonnes Waste Tonnes Waste BCM SR FE% SIO2% AL2O3% P% LOI% S%Beebyn_Main_East 540 1 223,000 400,942 139,695 1.8 64.15 2.87 2.53 0.07 1.87 0.01Beebyn_Main_East 528 1 565,847 2,142,192 836,687 3.8 64.49 2.8 2.49 0.05 1.70 0.02Beebyn_Main_East 516 2 637,268 6,924,207 2,707,373 10.9 64.4 2.83 2.48 0.05 1.72 0.02Beebyn_Main_East 504 2 687,271 11,983,682 4,474,604 17.4 64.35 2.9 2.43 0.06 1.86 0.01Beebyn_Main_East 492 2 698,642 11,378,842 4,263,395 16.3 64.57 2.78 2.34 0.06 1.86 0.01Beebyn_Main_East 480 2 691,642 9,827,132 3,712,554 14.2 64.44 2.89 2.2 0.06 1.92 0.01Beebyn_Main_East 468 2 682,939 8,357,619 3,177,500 12.2 64.53 2.76 2.04 0.06 1.93 0.01Beebyn_Main_East 456 3 647,444 7,040,466 2,713,808 10.9 64.64 2.43 1.91 0.05 1.98 0.00Beebyn_Main_East 444 3 626,835 5,898,942 2,305,450 9.4 64.23 2.54 1.94 0.05 2.14 0.00Beebyn_Main_East 432 3 627,354 4,981,482 1,957,825 7.9 64.03 2.69 1.97 0.05 2.10 0.00Beebyn_Main_East 420 3 632,608 4,215,541 1,640,394 6.7 64.33 2.79 1.9 0.05 1.82 0.00Beebyn_Main_East 408 3 638,494 3,511,444 1,341,667 5.5 64.66 2.77 1.74 0.05 1.54 0.00Beebyn_Main_East 396 3 633,246 2,919,345 1,087,065 4.6 64.96 2.53 1.66 0.05 1.53 0.00Beebyn_Main_East 384 4 607,197 2,342,634 852,723 3.9 64.93 2.41 1.56 0.06 1.80 0.01Beebyn_Main_East 372 4 544,470 1,843,167 652,638 3.4 64.87 2.36 1.44 0.06 1.97 0.01Beebyn_Main_East 360 4 463,317 1,394,343 477,886 3.0 64.9 2.22 1.46 0.07 2.16 0.01Beebyn_Main_East 348 4 324,156 707,448 235,797 2.2 65.14 2.05 1.46 0.06 2.13 0.01Beebyn_Main_East 336 4 146,762 246,457 79,295 1.7 65.81 1.94 1.47 0.05 1.55 0.00Beebyn_Main_East 324 4 43,345 70,525 22,028 1.6 66.12 1.87 1.45 0.04 1.41 0.00Beebyn_Main_Central 528 4 1,313 13,286 3,760 10.1 57.44 5.8 2.46 0.17 8.90 0.02Beebyn_Main_Central 516 4 206,598 1,829,153 701,861 8.9 60.16 5.54 2.35 0.11 5.58 0.02Beebyn_Main_Central 504 4 292,954 2,994,709 1,186,437 10.2 60.42 5.45 2.33 0.11 5.23 0.01Beebyn_Main_Central 492 4 346,722 2,565,258 1,029,815 7.4 60.65 5.48 2.29 0.10 4.91 0.01Beebyn_Main_Central 480 4 388,366 2,209,630 890,461 5.7 60.81 5.68 2.2 0.09 4.55 0.01Beebyn_Main_Central 468 4 418,790 1,889,863 748,757 4.5 60.75 6.01 2.07 0.07 4.29 0.01Beebyn_Main_Central 456 4 442,399 1,541,854 595,977 3.5 60.28 6.4 1.89 0.06 4.22 0.01Beebyn_Main_Central 444 4 428,196 1,160,185 436,895 2.7 59.64 6.74 1.83 0.06 4.25 0.02Beebyn_Main_Central 432 4 355,916 913,731 322,180 2.6 58.47 6.86 1.75 0.06 4.57 0.03Beebyn_Main_Central 420 5 244,618 679,531 232,200 2.8 57.38 7.01 1.71 0.06 5.18 0.03Beebyn_Main_Central 408 Un‐Scheduled 116,791 403,616 134,992 3.5 57.59 6.51 1.71 0.04 5.49 0.05Beebyn_Main_Central 396 Un‐Scheduled 79,888 183,058 60,294 2.3 57.53 6.55 1.66 0.03 5.98 0.06Beebyn_Main_Central 384 Un‐Scheduled 32,114 35,238 10,939 1.1 58.59 6.33 1.43 0.03 5.06 0.09Beebyn_Main_West_1 552 4 26,402 47,365 17,248 1.8 60.85 2.91 2.4 0.11 6.62 0.07Beebyn_Main_West_1 540 4 286,628 1,011,029 427,948 3.5 61.15 3.07 2.61 0.09 6.20 0.11Beebyn_Main_West_1 528 4 608,002 4,803,971 1,896,503 7.9 61.2 3.3 2.57 0.09 6.02 0.10Beebyn_Main_West_1 516 4 798,707 11,080,798 4,112,099 13.9 60.96 3.43 2.48 0.10 6.15 0.07Beebyn_Main_West_1 504 4 885,121 11,315,100 4,186,117 12.8 61.07 3.34 2.39 0.10 6.08 0.04Beebyn_Main_West_1 492 4 928,625 9,932,809 3,718,978 10.7 61.12 3.31 2.31 0.11 6.09 0.02Beebyn_Main_West_1 480 4 970,818 8,744,326 3,301,348 9.0 61.17 3.31 2.33 0.11 6.17 0.01Beebyn_Main_West_1 468 5 1,016,959 7,588,109 2,893,107 7.5 61.18 3.31 2.31 0.11 6.16 0.01Beebyn_Main_West_1 456 5 1,018,875 6,656,479 2,548,513 6.5 61.29 3.46 2.24 0.11 5.97 0.01Beebyn_Main_West_1 444 5 988,903 5,722,665 2,222,313 5.8 61.31 3.65 2.25 0.10 5.75 0.01Beebyn_Main_West_1 432 5 962,896 4,891,352 1,910,159 5.1 61.26 3.74 2.22 0.10 5.55 0.01Beebyn_Main_West_1 420 5 928,862 4,094,545 1,617,128 4.4 61.41 3.66 2.17 0.10 5.48 0.00Beebyn_Main_West_1 408 5 889,668 3,255,775 1,290,188 3.7 61.59 3.41 2.08 0.10 5.57 0.00Beebyn_Main_West_1 396 6 858,227 2,578,492 1,021,563 3.0 61.6 3.4 2.02 0.10 5.74 0.00Beebyn_Main_West_1 384 6 779,842 1,940,292 772,728 2.5 61.66 3.31 1.92 0.10 5.76 0.00Beebyn_Main_West_1 372 6 624,495 1,342,772 531,827 2.2 62.08 3.31 1.89 0.10 5.42 0.00Beebyn_Main_West_1 360 6 369,119 725,757 290,835 2.0 62.09 3.51 1.81 0.09 5.15 0.00Beebyn_Main_West_1 348 6 259,940 322,774 119,680 1.2 62.14 3.92 1.75 0.09 4.71 0.00Beebyn_Main_West_1 336 Un‐Scheduled 183,736 119,907 39,473 0.7 62.9 4.16 1.57 0.08 4.13 0.00Beebyn_Main_West_1 324 Un‐Scheduled 64,756 25,375 8,124 0.4 62.75 4.62 1.39 0.08 3.85 0.00Beebyn_Main_West_2 576 2 192 68Beebyn_Main_West_2 564 2 454 190,083 69,880 418.4 59.07 5.95 2.13 0.08 6.68 0.02Beebyn_Main_West_2 552 2 47,841 773,398 296,342 16.2 58.8 6.33 2.08 0.09 6.68 0.02Beebyn_Main_West_2 540 3 120,347 1,499,333 586,641 12.5 58.93 5.68 2.3 0.10 7.09 0.03Beebyn_Main_West_2 528 3 253,045 3,046,457 1,191,538 12.0 58.86 5.74 2.2 0.11 7.24 0.03Beebyn_Main_West_2 516 4 301,196 4,615,260 1,756,688 15.3 59.1 5.67 2.04 0.10 7.05 0.02Beebyn_Main_West_2 504 4 259,251 4,550,491 1,733,968 17.6 58.96 5.93 1.98 0.10 6.96 0.02Beebyn_Main_West_2 492 4 215,600 3,837,471 1,466,362 17.8 58.66 6.06 2 0.11 7.35 0.01Beebyn_Main_West_2 480 4 235,418 3,063,111 1,181,827 13.0 58.37 5.88 2.02 0.11 7.99 0.01Beebyn_Main_West_2 468 4 253,377 2,349,187 912,174 9.3 58.4 5.62 2 0.11 8.29 0.01Beebyn_Main_West_2 456 4 271,304 1,742,855 665,967 6.4 59.16 4.88 1.77 0.11 8.12 0.01Beebyn_Main_West_2 444 5 313,633 1,243,800 463,713 4.0 59.45 4.93 1.58 0.11 7.78 0.00Beebyn_Main_West_2 432 5 333,494 825,229 293,473 2.5 59.52 5.06 1.51 0.12 7.50 0.00Beebyn_Main_West_2 420 5 316,394 482,211 156,595 1.5 59.48 5.11 1.41 0.12 7.62 0.00Beebyn_Main_West_2 408 5 160,728 137,816 42,466 0.9 59.97 4.56 1.33 0.13 7.72 0.01Beebyn_Pod_East 576 2 235 46,096 16,459 195.9 57.37 7.44 2.38 0.13 7.21 0.02Beebyn_Pod_East 564 2 58,290 575,325 221,917 9.9 57.62 7.57 2.38 0.12 6.98 0.02Beebyn_Pod_East 552 2 74,145 1,188,146 462,607 16.0 57.72 7.58 2.31 0.11 6.88 0.02Beebyn_Pod_East 540 4 74,267 1,340,722 543,207 18.1 57.94 7.44 2.25 0.11 6.92 0.02Beebyn_Pod_East 528 4 74,726 1,030,580 423,451 13.8 58.12 7.25 2.24 0.11 7.11 0.02Beebyn_Pod_East 516 4 64,723 647,593 264,140 10.0 58.37 7.08 2.15 0.12 6.89 0.02Beebyn_Pod_East 504 4 47,253 354,232 145,905 7.5 58.14 7.26 2.2 0.12 6.75 0.02Beebyn_Pod_East 492 4 22,940 164,541 65,009 7.2 58.48 6.46 2.24 0.12 6.66 0.01Beebyn_Pod_East 480 4 11,508 52,696 19,924 4.6 58.41 6.79 2.16 0.11 6.25 0.01
SRK Consulting Backfill Option Study Interim Report – Weld Range Iron Ore Project Appendix 1-2
JB/pr SMM001__MIN_RP_1 _Rev3 February 2009
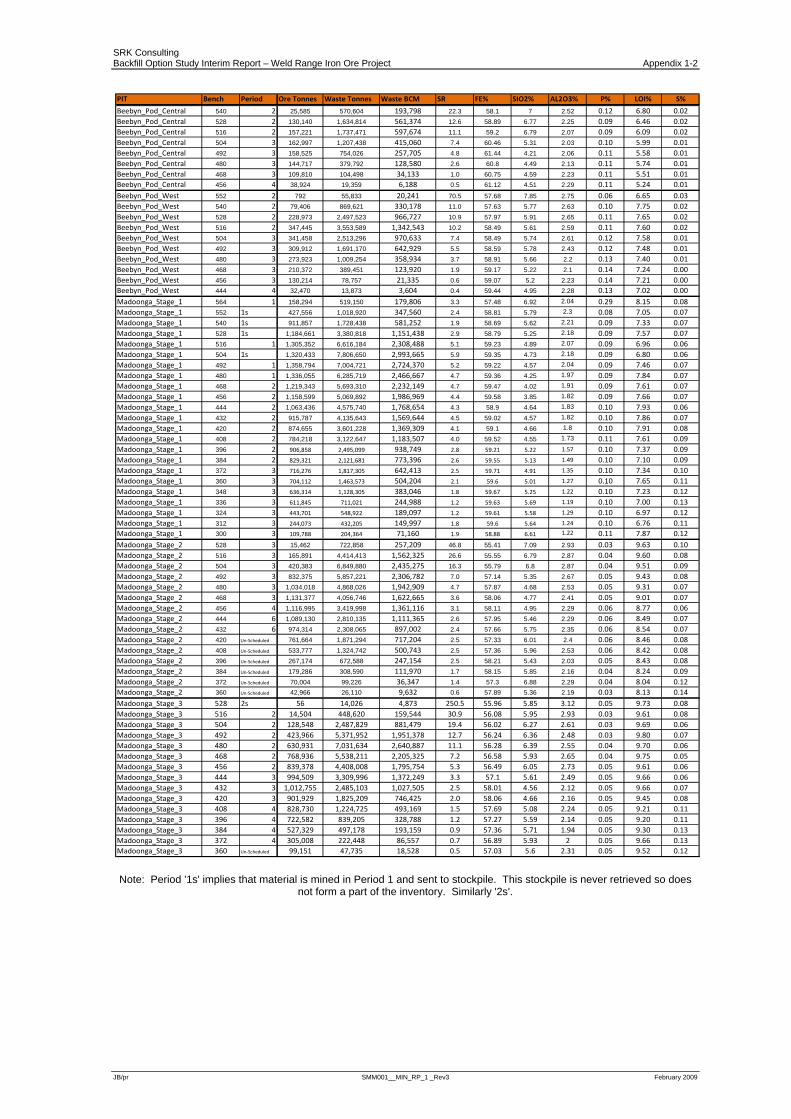
Note: Period '1s' implies that material is mined in Period 1 and sent to stockpile. This stockpile is never retrieved so does not form a part of the inventory. Similarly '2s'.
PIT Bench Period Ore Tonnes Waste Tonnes Waste BCM SR FE% SIO2% AL2O3% P% LOI% S%
Beebyn_Pod_Central 540 2 25,585 570,604 193,798 22.3 58.1 7 2.52 0.12 6.80 0.02Beebyn_Pod_Central 528 2 130,140 1,634,814 561,374 12.6 58.89 6.77 2.25 0.09 6.46 0.02Beebyn_Pod_Central 516 2 157,221 1,737,471 597,674 11.1 59.2 6.79 2.07 0.09 6.09 0.02Beebyn_Pod_Central 504 3 162,997 1,207,438 415,060 7.4 60.46 5.31 2.03 0.10 5.99 0.01Beebyn_Pod_Central 492 3 158,525 754,026 257,705 4.8 61.44 4.21 2.06 0.11 5.58 0.01Beebyn_Pod_Central 480 3 144,717 379,792 128,580 2.6 60.8 4.49 2.13 0.11 5.74 0.01Beebyn_Pod_Central 468 3 109,810 104,498 34,133 1.0 60.75 4.59 2.23 0.11 5.51 0.01Beebyn_Pod_Central 456 4 38,924 19,359 6,188 0.5 61.12 4.51 2.29 0.11 5.24 0.01Beebyn_Pod_West 552 2 792 55,833 20,241 70.5 57.68 7.85 2.75 0.06 6.65 0.03Beebyn_Pod_West 540 2 79,406 869,621 330,178 11.0 57.63 5.77 2.63 0.10 7.75 0.02Beebyn_Pod_West 528 2 228,973 2,497,523 966,727 10.9 57.97 5.91 2.65 0.11 7.65 0.02Beebyn_Pod_West 516 2 347,445 3,553,589 1,342,543 10.2 58.49 5.61 2.59 0.11 7.60 0.02Beebyn_Pod_West 504 3 341,458 2,513,296 970,633 7.4 58.49 5.74 2.61 0.12 7.58 0.01Beebyn_Pod_West 492 3 309,912 1,691,170 642,929 5.5 58.59 5.78 2.43 0.12 7.48 0.01Beebyn_Pod_West 480 3 273,923 1,009,254 358,934 3.7 58.91 5.66 2.2 0.13 7.40 0.01Beebyn_Pod_West 468 3 210,372 389,451 123,920 1.9 59.17 5.22 2.1 0.14 7.24 0.00Beebyn_Pod_West 456 3 130,214 78,757 21,335 0.6 59.07 5.2 2.23 0.14 7.21 0.00Beebyn_Pod_West 444 4 32,470 13,873 3,604 0.4 59.44 4.95 2.28 0.13 7.02 0.00Madoonga_Stage_1 564 1 158,294 519,150 179,806 3.3 57.48 6.92 2.04 0.29 8.15 0.08Madoonga_Stage_1 552 1s 427,556 1,018,920 347,560 2.4 58.81 5.79 2.3 0.08 7.05 0.07Madoonga_Stage_1 540 1s 911,857 1,728,438 581,252 1.9 58.69 5.62 2.21 0.09 7.33 0.07Madoonga_Stage_1 528 1s 1,184,661 3,380,818 1,151,438 2.9 58.79 5.25 2.18 0.09 7.57 0.07Madoonga_Stage_1 516 1 1,305,352 6,616,184 2,308,488 5.1 59.23 4.89 2.07 0.09 6.96 0.06Madoonga_Stage_1 504 1s 1,320,433 7,806,650 2,993,665 5.9 59.35 4.73 2.18 0.09 6.80 0.06Madoonga_Stage_1 492 1 1,358,794 7,004,721 2,724,370 5.2 59.22 4.57 2.04 0.09 7.46 0.07Madoonga_Stage_1 480 1 1,336,055 6,285,719 2,466,667 4.7 59.36 4.25 1.97 0.09 7.84 0.07Madoonga_Stage_1 468 2 1,219,343 5,693,310 2,232,149 4.7 59.47 4.02 1.91 0.09 7.61 0.07Madoonga_Stage_1 456 2 1,158,599 5,069,892 1,986,969 4.4 59.58 3.85 1.82 0.09 7.66 0.07Madoonga_Stage_1 444 2 1,063,436 4,575,740 1,768,654 4.3 58.9 4.64 1.83 0.10 7.93 0.06Madoonga_Stage_1 432 2 915,787 4,135,643 1,569,644 4.5 59.02 4.57 1.82 0.10 7.86 0.07Madoonga_Stage_1 420 2 874,655 3,601,228 1,369,309 4.1 59.1 4.66 1.8 0.10 7.91 0.08Madoonga_Stage_1 408 2 784,218 3,122,647 1,183,507 4.0 59.52 4.55 1.73 0.11 7.61 0.09Madoonga_Stage_1 396 2 906,858 2,495,099 938,749 2.8 59.21 5.22 1.57 0.10 7.37 0.09Madoonga_Stage_1 384 2 829,321 2,121,681 773,396 2.6 59.55 5.13 1.49 0.10 7.10 0.09Madoonga_Stage_1 372 3 716,276 1,817,305 642,413 2.5 59.71 4.91 1.35 0.10 7.34 0.10Madoonga_Stage_1 360 3 704,112 1,463,573 504,204 2.1 59.6 5.01 1.27 0.10 7.65 0.11Madoonga_Stage_1 348 3 636,314 1,128,305 383,046 1.8 59.67 5.25 1.22 0.10 7.23 0.12Madoonga_Stage_1 336 3 611,845 711,021 244,988 1.2 59.63 5.69 1.19 0.10 7.00 0.13Madoonga_Stage_1 324 3 443,701 548,922 189,097 1.2 59.61 5.58 1.29 0.10 6.97 0.12Madoonga_Stage_1 312 3 244,073 432,205 149,997 1.8 59.6 5.64 1.24 0.10 6.76 0.11Madoonga_Stage_1 300 3 109,788 204,364 71,160 1.9 58.88 6.61 1.22 0.11 7.87 0.12Madoonga_Stage_2 528 3 15,462 722,858 257,209 46.8 55.41 7.09 2.93 0.03 9.63 0.10Madoonga_Stage_2 516 3 165,891 4,414,413 1,562,325 26.6 55.55 6.79 2.87 0.04 9.60 0.08Madoonga_Stage_2 504 3 420,383 6,849,880 2,435,275 16.3 55.79 6.8 2.87 0.04 9.51 0.09Madoonga_Stage_2 492 3 832,375 5,857,221 2,306,782 7.0 57.14 5.35 2.67 0.05 9.43 0.08Madoonga_Stage_2 480 3 1,034,018 4,868,026 1,942,909 4.7 57.87 4.68 2.53 0.05 9.31 0.07Madoonga_Stage_2 468 3 1,131,377 4,056,746 1,622,665 3.6 58.06 4.77 2.41 0.05 9.01 0.07Madoonga_Stage_2 456 4 1,116,995 3,419,998 1,361,116 3.1 58.11 4.95 2.29 0.06 8.77 0.06Madoonga_Stage_2 444 6 1,089,130 2,810,135 1,111,365 2.6 57.95 5.46 2.29 0.06 8.49 0.07Madoonga_Stage_2 432 6 974,314 2,308,065 897,002 2.4 57.66 5.75 2.35 0.06 8.54 0.07Madoonga_Stage_2 420 Un‐Scheduled 761,664 1,871,294 717,204 2.5 57.33 6.01 2.4 0.06 8.46 0.08Madoonga_Stage_2 408 Un‐Scheduled 533,777 1,324,742 500,743 2.5 57.36 5.96 2.53 0.06 8.42 0.08Madoonga_Stage_2 396 Un‐Scheduled 267,174 672,588 247,154 2.5 58.21 5.43 2.03 0.05 8.43 0.08Madoonga_Stage_2 384 Un‐Scheduled 179,286 308,590 111,970 1.7 58.15 5.85 2.16 0.04 8.24 0.09Madoonga_Stage_2 372 Un‐Scheduled 70,004 99,226 36,347 1.4 57.3 6.88 2.29 0.04 8.04 0.12Madoonga_Stage_2 360 Un‐Scheduled 42,966 26,110 9,632 0.6 57.89 5.36 2.19 0.03 8.13 0.14Madoonga_Stage_3 528 2s 56 14,026 4,873 250.5 55.96 5.85 3.12 0.05 9.73 0.08Madoonga_Stage_3 516 2 14,504 448,620 159,544 30.9 56.08 5.95 2.93 0.03 9.61 0.08Madoonga_Stage_3 504 2 128,548 2,487,829 881,479 19.4 56.02 6.27 2.61 0.03 9.69 0.06Madoonga_Stage_3 492 2 423,966 5,371,952 1,951,378 12.7 56.24 6.36 2.48 0.03 9.80 0.07Madoonga_Stage_3 480 2 630,931 7,031,634 2,640,887 11.1 56.28 6.39 2.55 0.04 9.70 0.06Madoonga_Stage_3 468 2 768,936 5,538,211 2,205,325 7.2 56.58 5.93 2.65 0.04 9.75 0.05Madoonga_Stage_3 456 2 839,378 4,408,008 1,795,754 5.3 56.49 6.05 2.73 0.05 9.61 0.06Madoonga_Stage_3 444 3 994,509 3,309,996 1,372,249 3.3 57.1 5.61 2.49 0.05 9.66 0.06Madoonga_Stage_3 432 3 1,012,755 2,485,103 1,027,505 2.5 58.01 4.56 2.12 0.05 9.66 0.07Madoonga_Stage_3 420 3 901,929 1,825,209 746,425 2.0 58.06 4.66 2.16 0.05 9.45 0.08Madoonga_Stage_3 408 4 828,730 1,224,725 493,169 1.5 57.69 5.08 2.24 0.05 9.21 0.11Madoonga_Stage_3 396 4 722,582 839,205 328,788 1.2 57.27 5.59 2.14 0.05 9.20 0.11Madoonga_Stage_3 384 4 527,329 497,178 193,159 0.9 57.36 5.71 1.94 0.05 9.30 0.13Madoonga_Stage_3 372 4 305,008 222,448 86,557 0.7 56.89 5.93 2 0.05 9.66 0.13Madoonga_Stage_3 360 Un‐Scheduled 99,151 47,735 18,528 0.5 57.03 5.6 2.31 0.05 9.52 0.12
SRK Consulting Backfill Option Study Interim Report – Weld Range Iron Ore Project Appendix 2
JB/pr SMM001__MIN_RP_1 _Rev3 February 2009
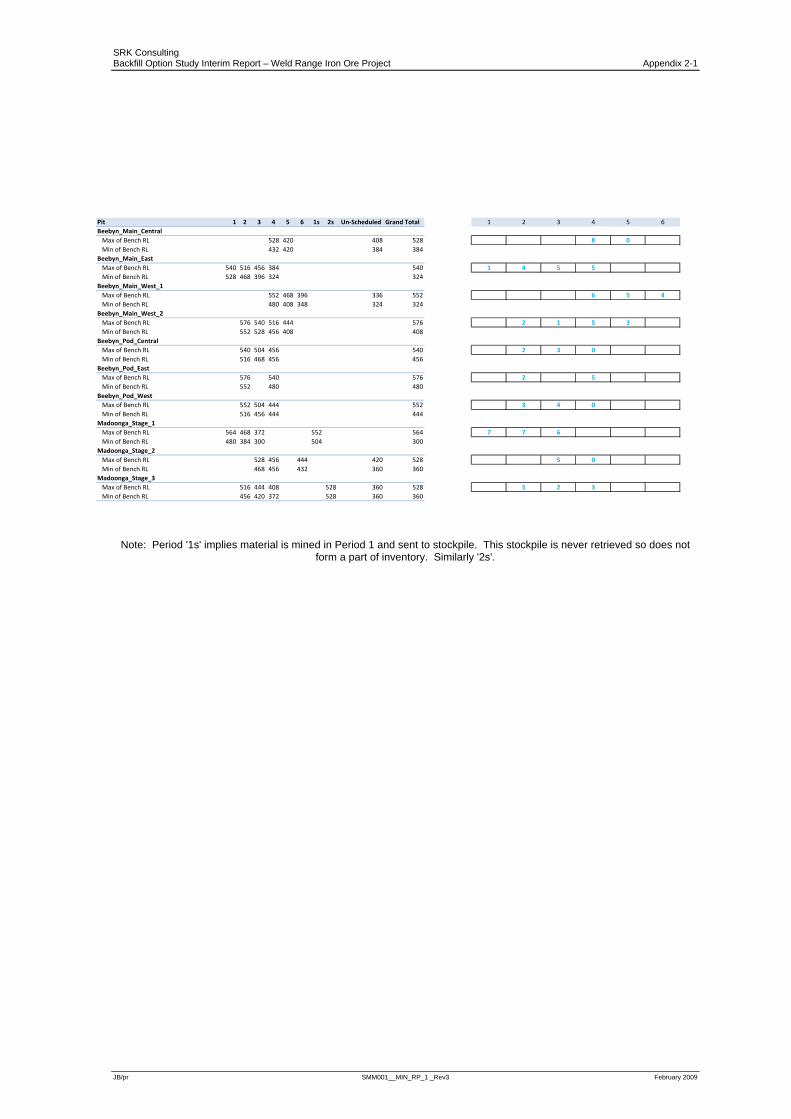
Appendix 2: Vertical Advance
SRK Consulting Backfill Option Study Interim Report – Weld Range Iron Ore Project Appendix 2-1
JB/pr SMM001__MIN_RP_1 _Rev3 February 2009
Pit 1 2 3 4 5 6 1s 2s Un‐Scheduled Grand Total 1 2 3 4 5 6Beebyn_Main_CentralMax of Bench RL 528 420 408 528 8 0Min of Bench RL 432 420 384 384
Beebyn_Main_EastMax of Bench RL 540 516 456 384 540 1 4 5 5Min of Bench RL 528 468 396 324 324
Beebyn_Main_West_1Max of Bench RL 552 468 396 336 552 6 5 4Min of Bench RL 480 408 348 324 324
Beebyn_Main_West_2Max of Bench RL 576 540 516 444 576 2 1 5 3Min of Bench RL 552 528 456 408 408
Beebyn_Pod_CentralMax of Bench RL 540 504 456 540 2 3 0Min of Bench RL 516 468 456 456
Beebyn_Pod_EastMax of Bench RL 576 540 576 2 5Min of Bench RL 552 480 480
Beebyn_Pod_WestMax of Bench RL 552 504 444 552 3 4 0Min of Bench RL 516 456 444 444
Madoonga_Stage_1Max of Bench RL 564 468 372 552 564 7 7 6Min of Bench RL 480 384 300 504 300
Madoonga_Stage_2Max of Bench RL 528 456 444 420 528 5 0Min of Bench RL 468 456 432 360 360
Madoonga_Stage_3Max of Bench RL 516 444 408 528 360 528 5 2 3Min of Bench RL 456 420 372 528 360 360
Note: Period '1s' implies material is mined in Period 1 and sent to stockpile. This stockpile is never retrieved so does not
form a part of inventory. Similarly '2s'.
SRK Consulting Backfill Option Study Interim Report – Weld Range Iron Ore Project Appendix 3
JB/pr SMM001__MIN_RP_1 _Rev3 February 2009
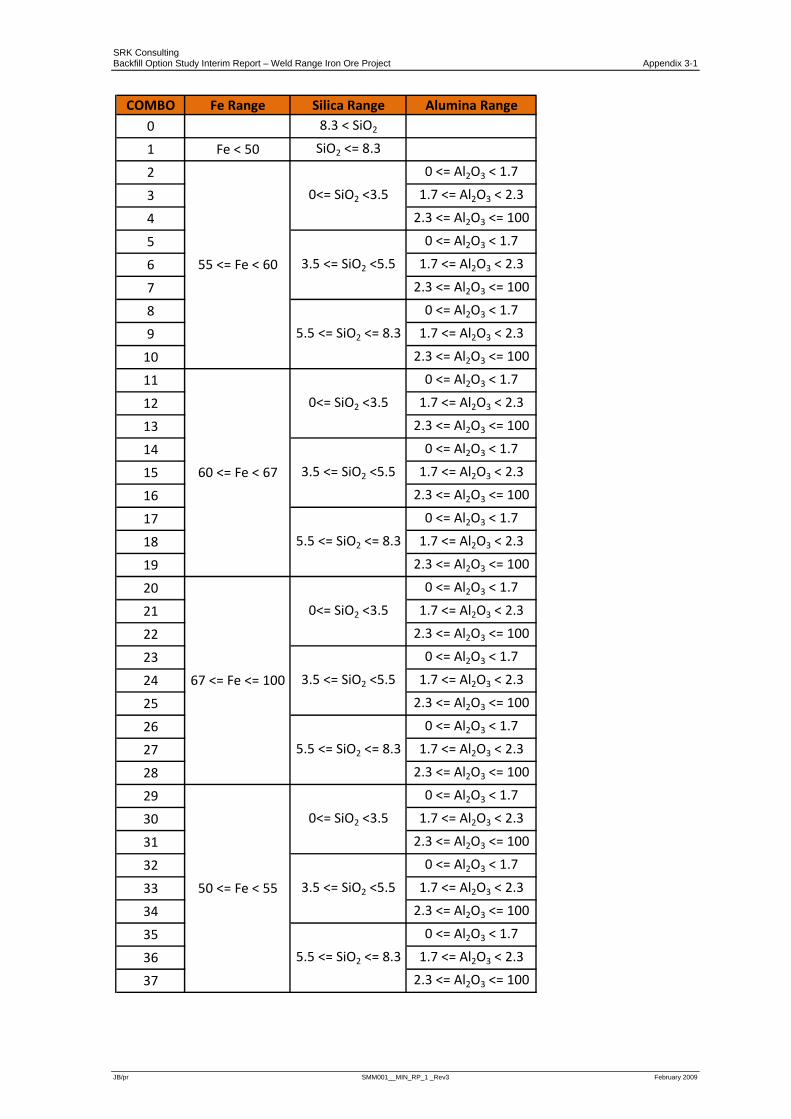
Appendix 3: COMBO Variable Codes
SRK Consulting Backfill Option Study Interim Report – Weld Range Iron Ore Project Appendix 3-1
JB/pr SMM001__MIN_RP_1 _Rev3 February 2009
COMBO Fe Range Silica Range Alumina Range0 8.3 < SiO2
1 Fe < 50 SiO2 <= 8.3
2 0 <= Al2O3 < 1.7
3 1.7 <= Al2O3 < 2.3
4 2.3 <= Al2O3 <= 100
5 0 <= Al2O3 < 1.7
6 1.7 <= Al2O3 < 2.3
7 2.3 <= Al2O3 <= 100
8 0 <= Al2O3 < 1.7
9 1.7 <= Al2O3 < 2.3
10 2.3 <= Al2O3 <= 100
11 0 <= Al2O3 < 1.7
12 1.7 <= Al2O3 < 2.3
13 2.3 <= Al2O3 <= 100
14 0 <= Al2O3 < 1.7
15 1.7 <= Al2O3 < 2.3
16 2.3 <= Al2O3 <= 100
17 0 <= Al2O3 < 1.7
18 1.7 <= Al2O3 < 2.3
19 2.3 <= Al2O3 <= 100
20 0 <= Al2O3 < 1.7
21 1.7 <= Al2O3 < 2.3
22 2.3 <= Al2O3 <= 100
23 0 <= Al2O3 < 1.7
24 1.7 <= Al2O3 < 2.3
25 2.3 <= Al2O3 <= 100
26 0 <= Al2O3 < 1.7
27 1.7 <= Al2O3 < 2.3
28 2.3 <= Al2O3 <= 100
29 0 <= Al2O3 < 1.7
30 1.7 <= Al2O3 < 2.3
31 2.3 <= Al2O3 <= 100
32 0 <= Al2O3 < 1.7
33 1.7 <= Al2O3 < 2.3
34 2.3 <= Al2O3 <= 100
35 0 <= Al2O3 < 1.7
36 1.7 <= Al2O3 < 2.3
37 2.3 <= Al2O3 <= 100
67 <= Fe <= 100
50 <= Fe < 55
0<= SiO2 <3.5
3.5 <= SiO2 <5.5
5.5 <= SiO2 <= 8.3
0<= SiO2 <3.5
3.5 <= SiO2 <5.5
5.5 <= SiO2 <= 8.3
0<= SiO2 <3.5
3.5 <= SiO2 <5.5
5.5 <= SiO2 <= 8.3
0<= SiO2 <3.5
3.5 <= SiO2 <5.5
5.5 <= SiO2 <= 8.3
55 <= Fe < 60
60 <= Fe < 67