Embed Size (px)
Citation preview
Table of Contents
Background 3
Our vision for transport 6
How the strategy was developed 7
Who will deliver the ITS 8
City of Whittlesea – the facts 10
What you told us 11
Risks of inaction 13
Policy Areas and Actions 15
Policy Area 1. Land Use and Transport Integration 16
Policy Area 2. Walking 19
Policy Area 3. Cycling 20
Policy Area 4. Public Transport 23
Policy Area 5. Roads and Freight 26
Policy Area 6. Community Transport 29
Making it happen 30
2
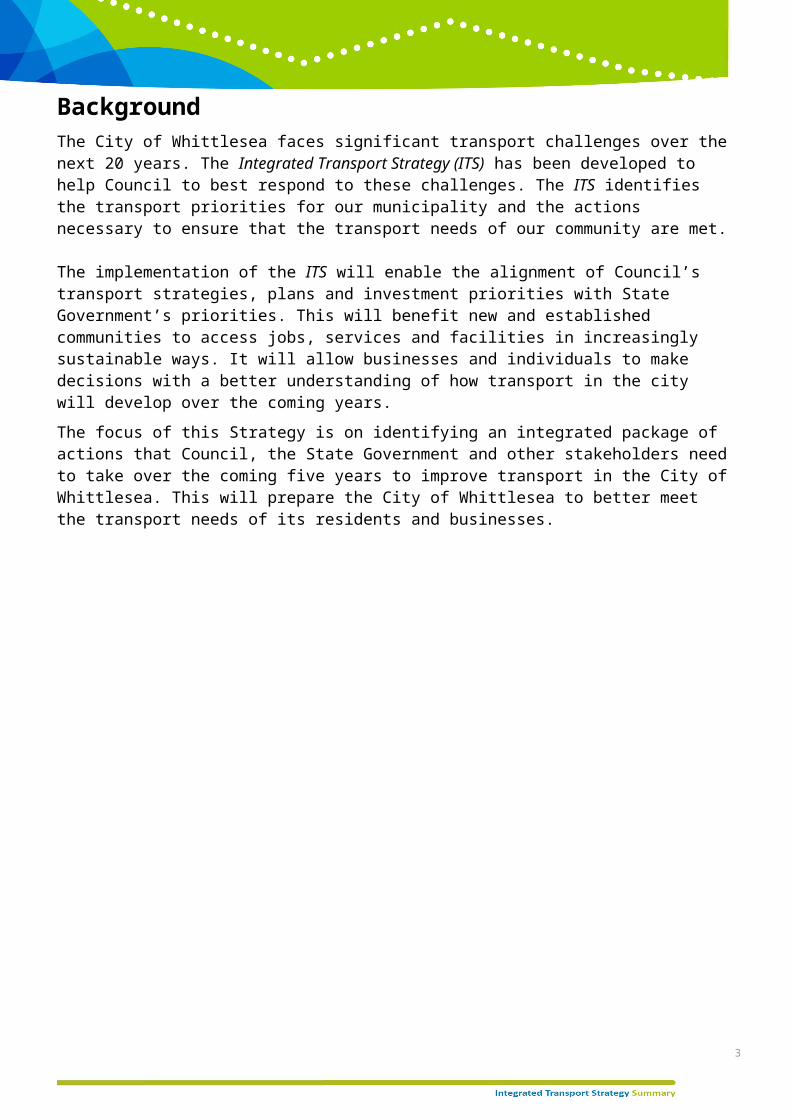
Background The City of Whittlesea faces significant transport challenges over the next 20 years. The Integrated Transport Strategy (ITS) has been developed to help Council to best respond to these challenges. The ITS identifies the transport priorities for our municipality and the actions necessary to ensure that the transport needs of our community are met.
The implementation of the ITS will enable the alignment of Council’s transport strategies, plans and investment priorities with State Government’s priorities. This will benefit new and established communities to access jobs, services and facilities in increasingly sustainable ways. It will allow businesses and individuals to make decisions with a better understanding of how transport in the city will develop over the coming years.
The focus of this Strategy is on identifying an integrated package of actions that Council, the State Government and other stakeholders need to take over the coming five years to improve transport in the City of Whittlesea. This will prepare the City of Whittlesea to better meet the transport needs of its residents and businesses.
3
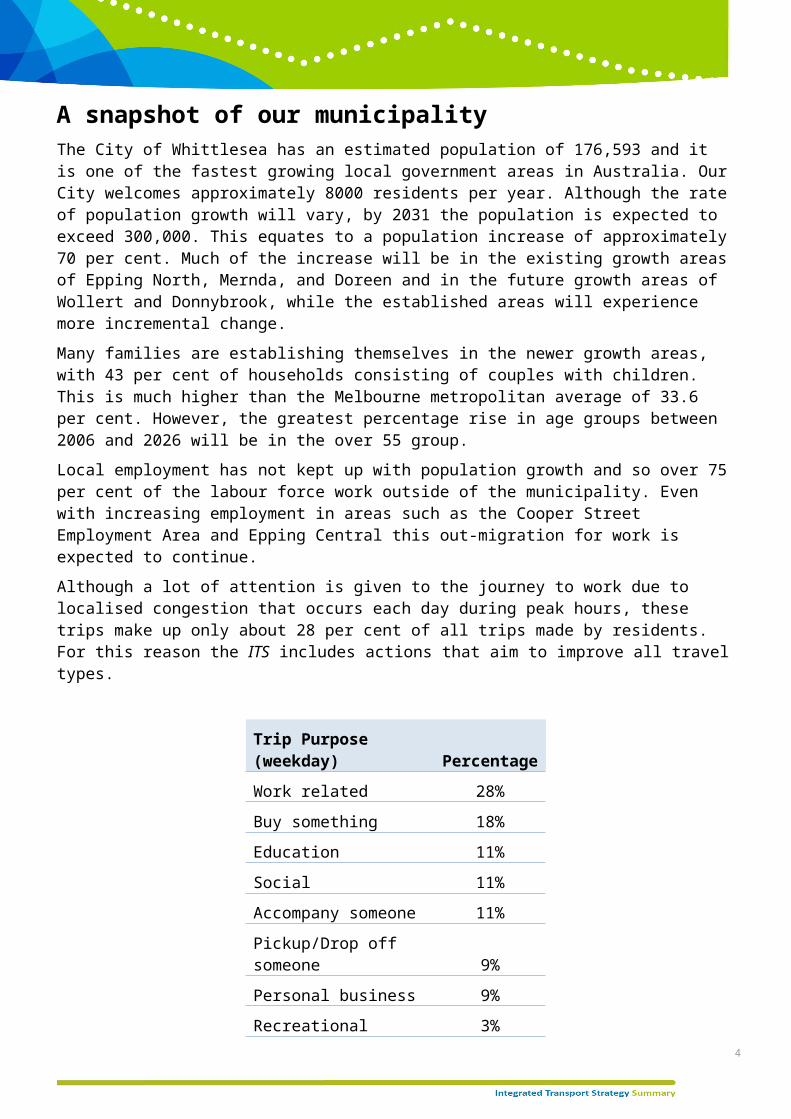
A snapshot of our municipalityThe City of Whittlesea has an estimated population of 176,593 and it is one of the fastest growing local government areas in Australia. Our City welcomes approximately 8000 residents per year. Although the rate of population growth will vary, by 2031 the population is expected to exceed 300,000. This equates to a population increase of approximately 70 per cent. Much of the increase will be in the existing growth areas of Epping North, Mernda, and Doreen and in the future growth areas of Wollert and Donnybrook, while the established areas will experience more incremental change.
Many families are establishing themselves in the newer growth areas, with 43 per cent of households consisting of couples with children. This is much higher than the Melbourne metropolitan average of 33.6 per cent. However, the greatest percentage rise in age groups between 2006 and 2026 will be in the over 55 group.
Local employment has not kept up with population growth and so over 75 per cent of the labour force work outside of the municipality. Even with increasing employment in areas such as the Cooper Street Employment Area and Epping Central this out-migration for work is expected to continue.
Although a lot of attention is given to the journey to work due to localised congestion that occurs each day during peak hours, these trips make up only about 28 per cent of all trips made by residents. For this reason the ITS includes actions that aim to improve all travel types.
Trip Purpose (weekday) Percentage
Work related 28%
Buy something 18%
Education 11%
Social 11%
Accompany someone 11%
Pickup/Drop off someone 9%
Personal business 9%
Recreational 3%
Total 100%
Weekday trip purpose in the City of Whittlesea
4
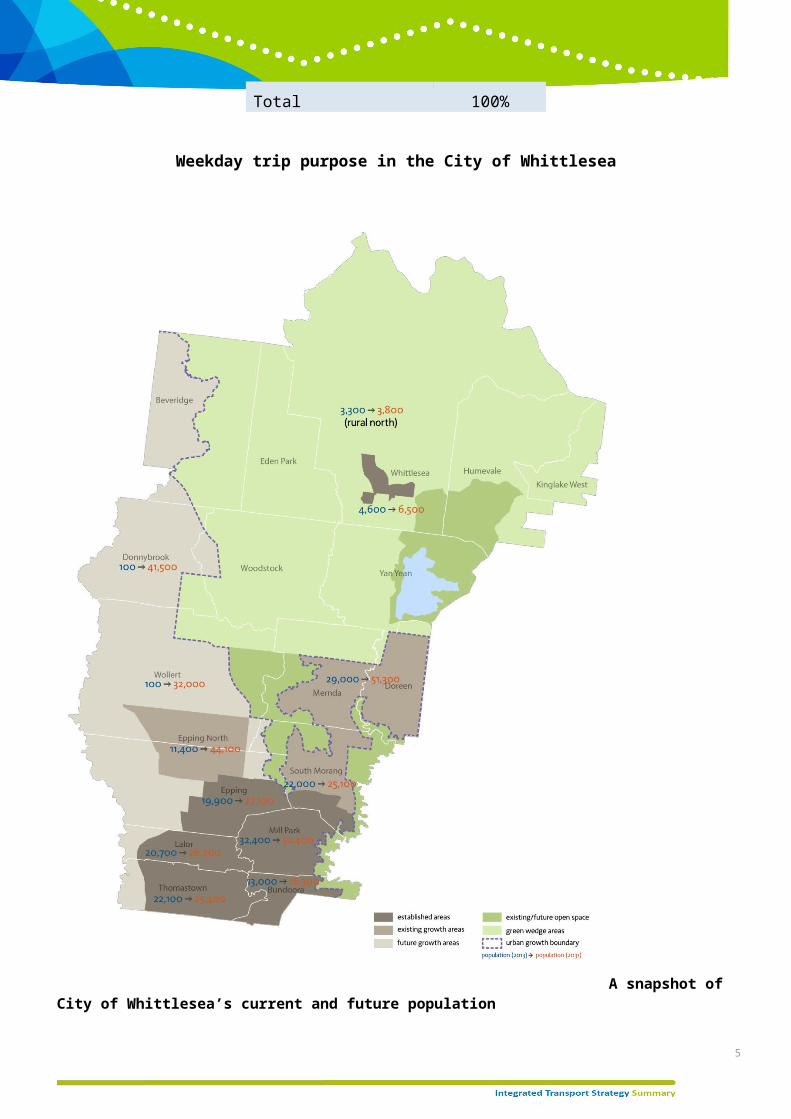
A snapshot of City of Whittlesea’s current and future population
5
Our vision for transportThe City of Whittlesea has an integrated transport system that supports the development of liveable, prosperous and sustainable communities. People and businesses are connected within the municipality and with the rest of Melbourne to access jobs and opportunities in ways that meet their access needs, while minimising the environmental, social and economic costs of their travel.
This vision will be achieved through the development of an accessible and integrated transport system where:
Transport actions best meet user needs, and actions are integrated with Council’s other social, economic, environmental, urban development and urban design policies and actions.
Accessibility to regional and metropolitan activities supports the prosperity of businesses and increases the ability of residents to participate in employment and other metropolitan opportunities.
Accessibility to local activities supports the development of vibrant communities.
The increased use of public transport and sustainable transport modes reduces the reliance on private cars for travel while improving choice and the quality of access to activities.
Where choices are made between different modes or actions, priority will be given to supporting the most sustainable travel mode or action that can deliver the service required by users. This means that getting land use and transport integration right initially is a critical step in developing a sustainable transport system. This integration is underpinned by an effective road network and public transport system, and supported by attractive walking and cycling choices.
6
How the strategy was developedThe ITS started in 2011 when Council commissioned a review of the emerging transport challenges facing the municipality. Two reports were produced: A Background Paper that described the metropolitan and local influences that are shaping transport, and a Transport Directions Paper that analysed the consequences of these shapers and the implications for the municipality from different transport strategy scenarios.
Feedback was invited on this work and several hundred people contributed their ideas on the issues, including valuable community input through a telephone and on-line survey and participation at two community forums. Government agencies, including Pubic Transport Victoria, VicRoads, and the Growth Areas Authority all contributed technical analysis and their ideas.
Within Council, all departments involved in the development of the municipality and its communities contributed ideas on the issues and possible actions.
Opportunities were explored so that synergies between departments could be strengthened and the ITS represents an integrated whole-of-Council response to transport.
The ITS used these valuable inputs to build on transport and land use strategies that have been developed by Council and the State government over the last decade.
Integrating the ITS with Council’s policiesCouncil has a hierarchy of strategies and plans under the framework of its Community Plan. Many of these strategies and plans impact on the transport system and will in turn be impacted by transport choices. The ITS is aligned to Council’s Future Directions and sits beside social and environmental strategies.
Hierarchy of Integrated Planning7
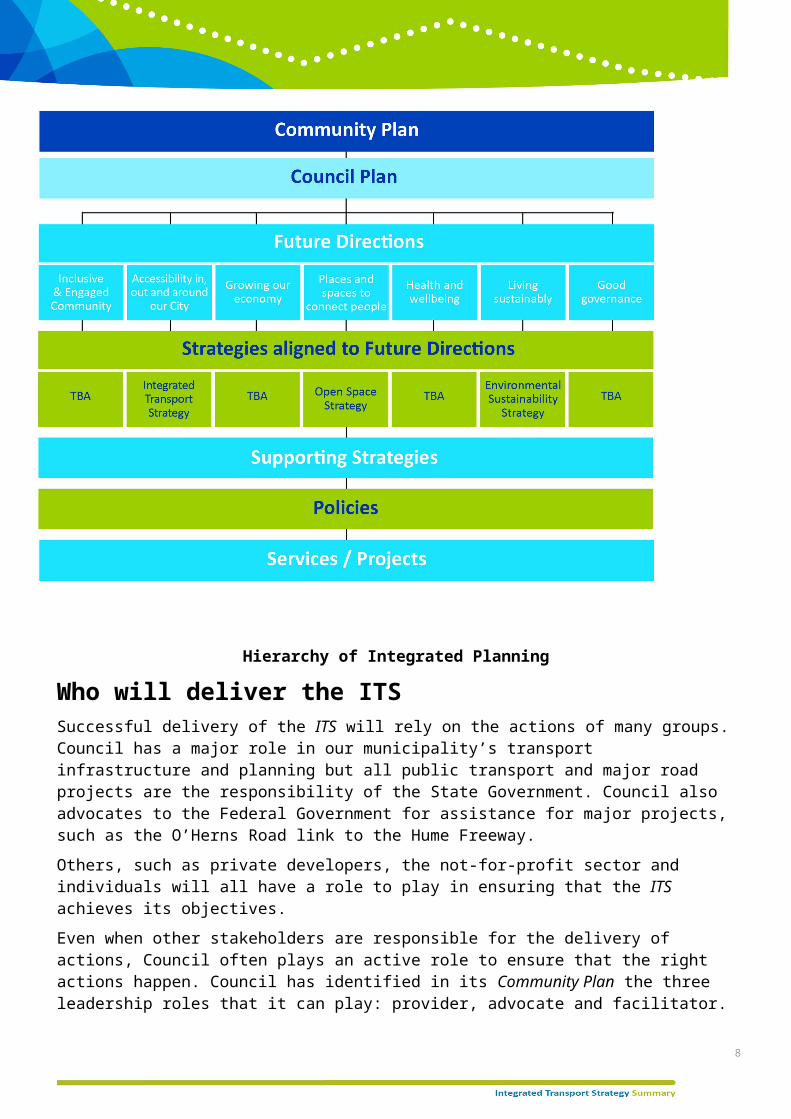
Hierarchy of Integrated Planning
Who will deliver the ITSSuccessful delivery of the ITS will rely on the actions of many groups. Council has a major role in our municipality’s transport infrastructure and planning but all public transport and major road projects are the responsibility of the State Government. Council also advocates to the Federal Government for assistance for major projects, such as the O’Herns Road link to the Hume Freeway.
Others, such as private developers, the not-for-profit sector and individuals will all have a role to play in ensuring that the ITS achieves its objectives.
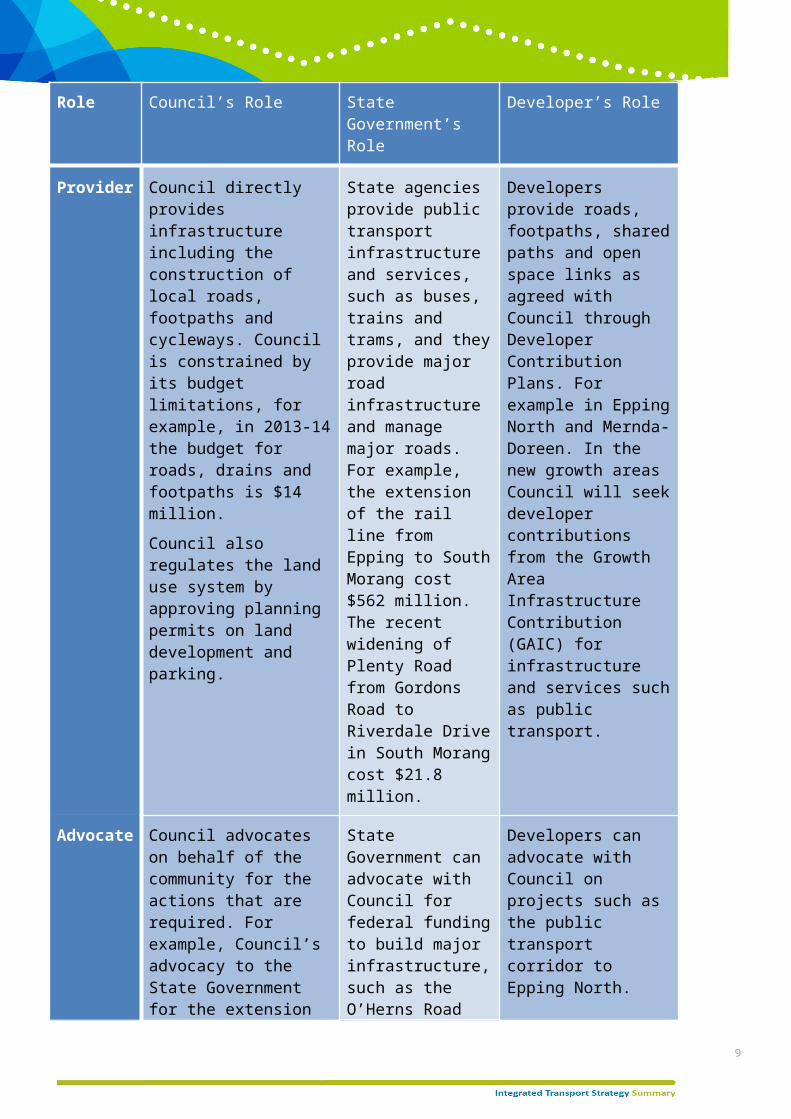
Even when other stakeholders are responsible for the delivery of actions, Council often plays an active role to ensure that the right actions happen. Council has identified in its Community Plan the three leadership roles that it can play: provider, advocate and facilitator.
8
Role Council’s Role State Government’s Role
Developer’s Role
Provider Council directly provides infrastructure including the construction of local roads, footpaths and cycleways. Council is constrained by its budget limitations, for example, in 2013-14 the budget for roads, drains and footpaths is $14 million.
Council also regulates the land use system by approving planning permits on land development and parking.
State agencies provide public transport infrastructure and services, such as buses, trains and trams, and they provide major road infrastructure and manage major roads. For example, the extension of the rail line from Epping to South Morang cost $562 million. The recent widening of Plenty Road from Gordons Road to Riverdale Drive in South Morang cost $21.8 million.
Developers provide roads, footpaths, shared paths and open space links as agreed with Council through Developer Contribution Plans. For example in Epping North and Mernda-Doreen. In the new growth areas Council will seek developer contributions from the Growth Area Infrastructure Contribution (GAIC) for infrastructure and services such as public transport.
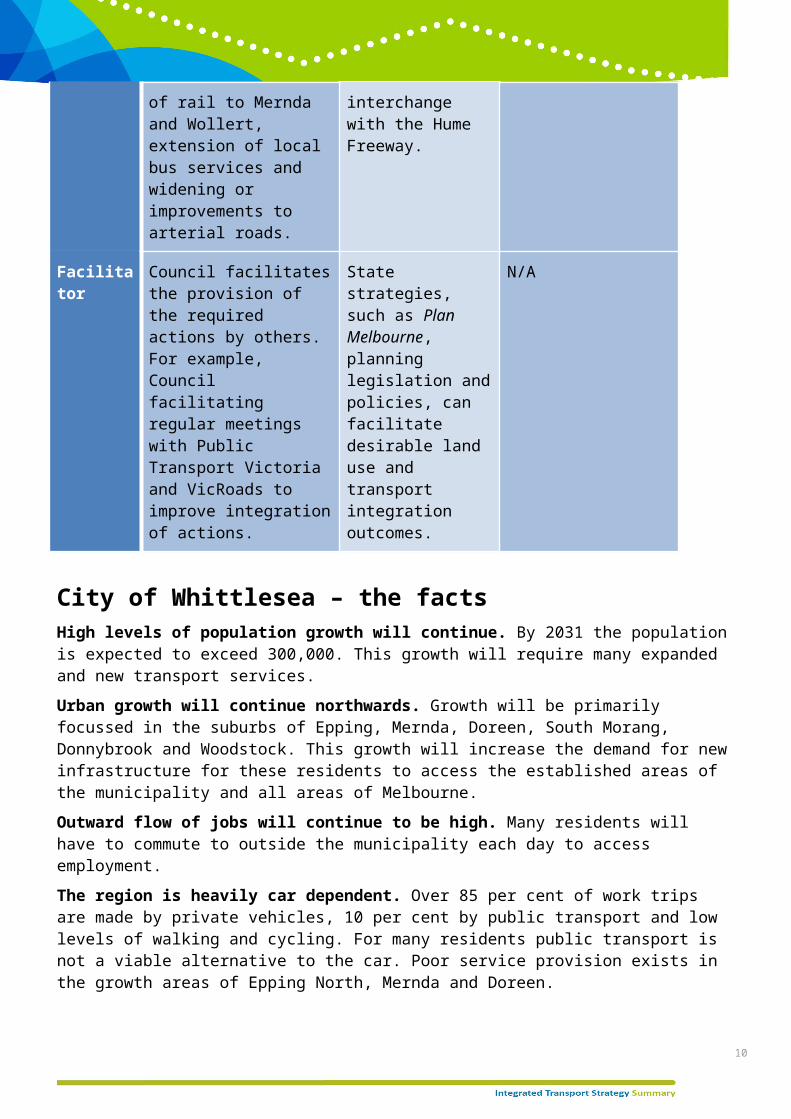
Advocate Council advocates on behalf of the community for the actions that are required. For example, Council’s advocacy to the State Government for the extension of rail to Mernda and Wollert, extension of local bus services and widening or improvements to arterial roads.
State Government can advocate with Council for federal funding to build major infrastructure, such as the O’Herns Road interchange with the Hume Freeway.
Developers can advocate with Council on projects such as the public transport corridor to Epping North.
Facilitator Council facilitates the provision of the required actions by others. For example, Council facilitating regular meetings with Public Transport Victoria and VicRoads to improve integration of actions.
State strategies, such as Plan Melbourne, planning legislation and policies, can facilitate desirable land use and transport integration outcomes.
N/A
City of Whittlesea – the facts9
High levels of population growth will continue. By 2031 the population is expected to exceed 300,000. This growth will require many expanded and new transport services.
Urban growth will continue northwards. Growth will be primarily focussed in the suburbs of Epping, Mernda, Doreen, South Morang, Donnybrook and Woodstock. This growth will increase the demand for new infrastructure for these residents to access the established areas of the municipality and all areas of Melbourne.
Outward flow of jobs will continue to be high. Many residents will have to commute to outside the municipality each day to access employment.
The region is heavily car dependent. Over 85 per cent of work trips are made by private vehicles, 10 per cent by public transport and low levels of walking and cycling. For many residents public transport is not a viable alternative to the car. Poor service provision exists in the growth areas of Epping North, Mernda and Doreen.
Many residents will continue to suffer from social and other disadvantage. The City of Whittlesea is the fifth most disadvantaged Local Government Area (LGA) in the Melbourne metropolitan area according to the Social Economic Indexes for Areas (SEIFA) index.
Environmental impacts of traffic will increase. If current transport policies and investment levels continue then greenhouse gas emissions within the region could increase in the order of 270 per cent by 2031.
Travel patterns. The largest employee outflow is to the south, with approximately 19,000 people travelling to the cities of Moreland, Melbourne, Darebin and Yarra for employment. The next highest is to the City of Hume with over 7000 people going to the Hume/Melbourne Airport corridor.
Transport choices can impact on health outcomes. Residents in the City of Whittlesea have higher than average rates of obesity, heart disease and Type 2 diabetes. Although all of these differences cannot be directly linked to transport choices, they match the high levels of car use and low levels of walking and cycling found in the City of Whittlesea.
Congestion leads to transport costs. From 2011 to 2026 cumulative congestion costs in the growing outer suburbs of Melbourne are estimated to be approximately $42 billion. In contrast, the cost of providing key transport infrastructure over this period ($9.5 billion) represents just 23 per cent of the cumulative congestion costs. The provision of more local jobs, better community services and enhanced public transport options in the interface would be expected to reduce reliance on vehicle-based travel over time.
Delivery of essential infrastructure and service needs are beyond council’s resources and a strong State Government commitment is essential. In 2013/14 the City of Whittlesea had an operating budget of $184 million to deliver over 100 Council services and capital works projects. Of this allocation $14 million will be spent on roads, drains and footpaths. As a comparison, the South Morang Rail Extension Project cost $562 million.
What you told usFeedback was sought from the community on the Transport Directions Paper and via an online and telephone survey. The online survey received 70 responses and 307 telephone surveys were completed. The key findings were:
Residents are heavily reliant on private vehicles for transport
Traffic congestion is the most dominant concern for transport for all trip purposes and people feel that infrastructure has not kept pace with population growth
10
Current public transport provision is insufficient to meet people’s needs. This is in terms of frequency, reliability and general access
Train is the most popular form of public transport but only a minority travel by train regularly
Respondents would be inclined to use public transport more often if accessibility and frequency of service was improved
Cycling is moderately popular as a form of recreation but the majority of respondents do not ride at all
Walking is very popular as a recreation activity
Residents will walk to amenities and facilities when they are within walking distance, if footpaths are adequate and if there are pedestrian crossings
Better footpaths and more bike lanes or off-road paths were the most often cited suggestions for encouraging more cycling and walking in the municipality
Traffic congestion and lack of access to public transport were of greater concern to residents in the northern part of the municipality than the south.
11
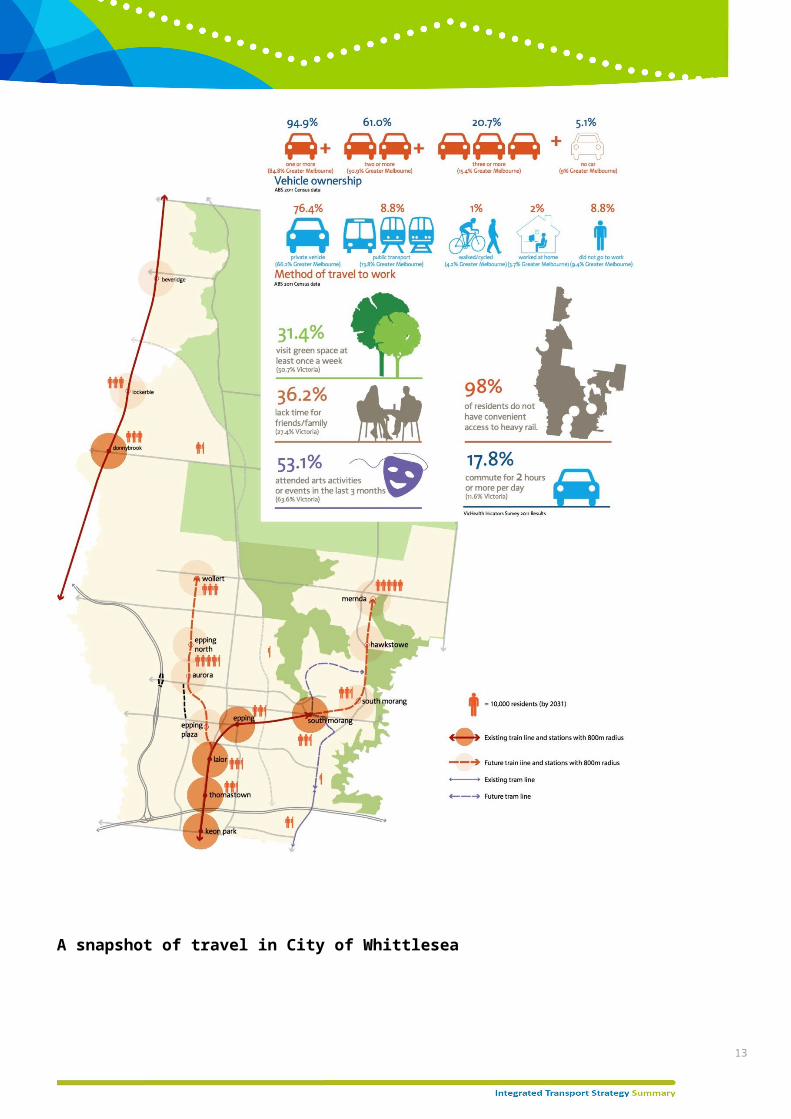
A snapshot of travel in City of Whittlesea
12
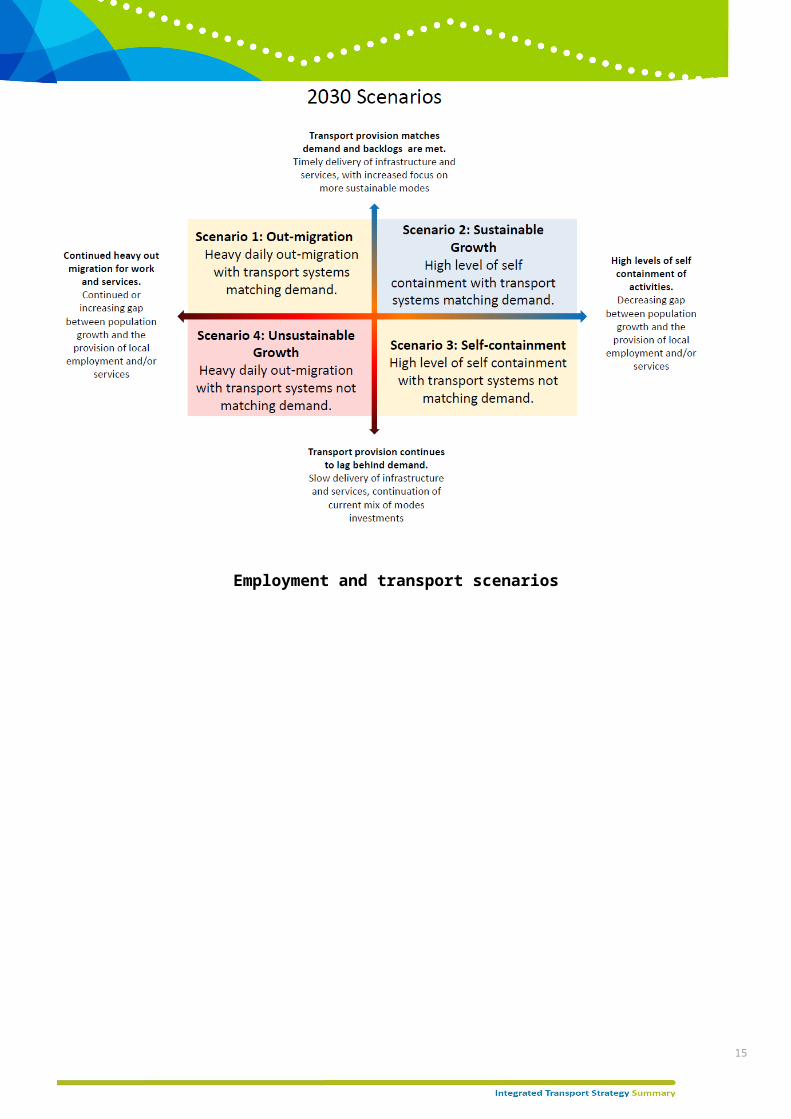
Risks of inactionFour possible futures (scenarios) for transport and land use in the City of Whittlesea were developed in the Transport Directions Paper in 2011 to help understand the implications of the choices that could be made in the ITS.
Depending on which future came to fruition the outcomes for the region vary greatly. For example, over the coming 20 years total travel in the municipality is likely to increase in the order of 2.5 times, with:
Daily trips by car increasing between 1.8 and 2.4 times Daily vehicle kilometres travelled increasing between 1.3 and 2.4 times Greenhouse gas emissions increasing between 1.6 and 2.7 times.
These increases in travel and in particular private vehicle travel will have significant detrimental impacts on businesses, the community and the environment. For example, increased congestion leads to increasing business costs to transport goods and lower attractiveness for businesses to develop locally. Low levels of active travel (walking and cycling) increase the risk of health problems and high energy use leads to increasing greenhouse gas emissions and lower air quality. Increasing reliance on private vehicle travel will increase transport isolation for residents who are unable to access a car.
Private vehicle travel will continue to increase due to the large population increases and so targeted improvements in the road network will be an integral part of any strategy to meet community needs. If the growth in private car use is to be slowed a significantly increasing role must be played by public transport, walking and cycling.
Employment and transport scenarios
13
14
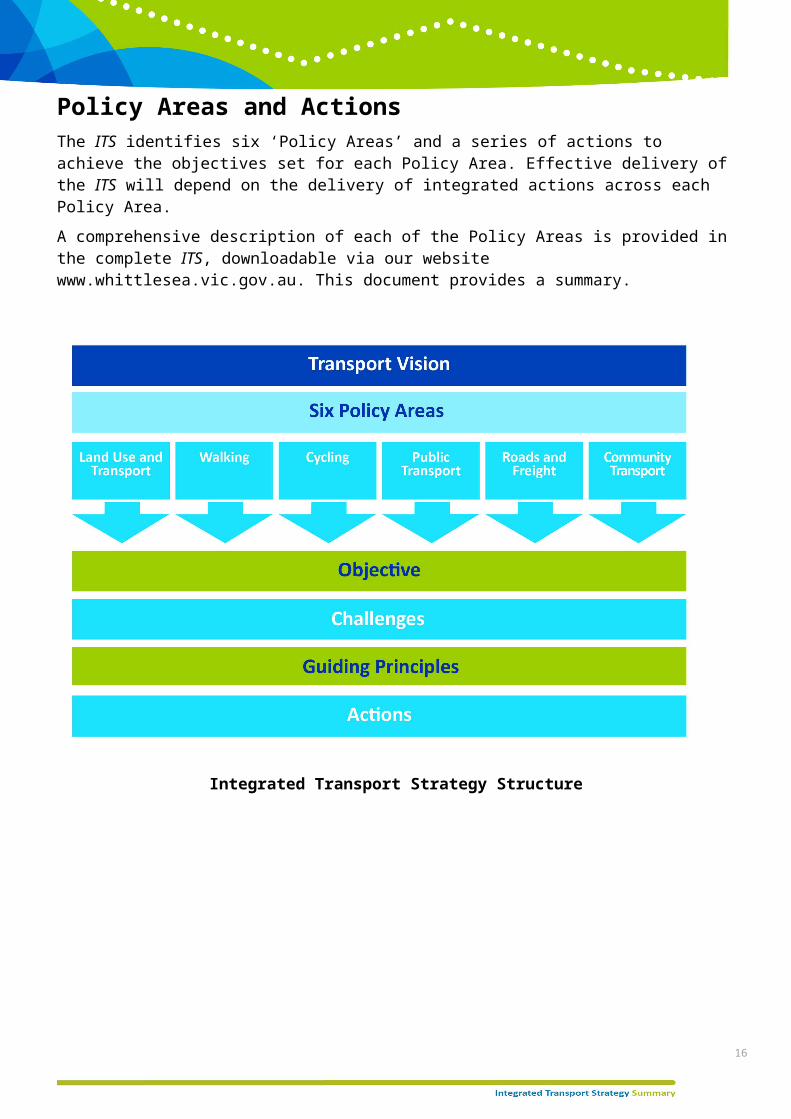
Policy Areas and ActionsThe ITS identifies six ‘Policy Areas’ and a series of actions to achieve the objectives set for each Policy Area. Effective delivery of the ITS will depend on the delivery of integrated actions across each Policy Area.
A comprehensive description of each of the Policy Areas is provided in the complete ITS, downloadable via our website www.whittlesea.vic.gov.au. This document provides a summary.
Integrated Transport Strategy Structure
15
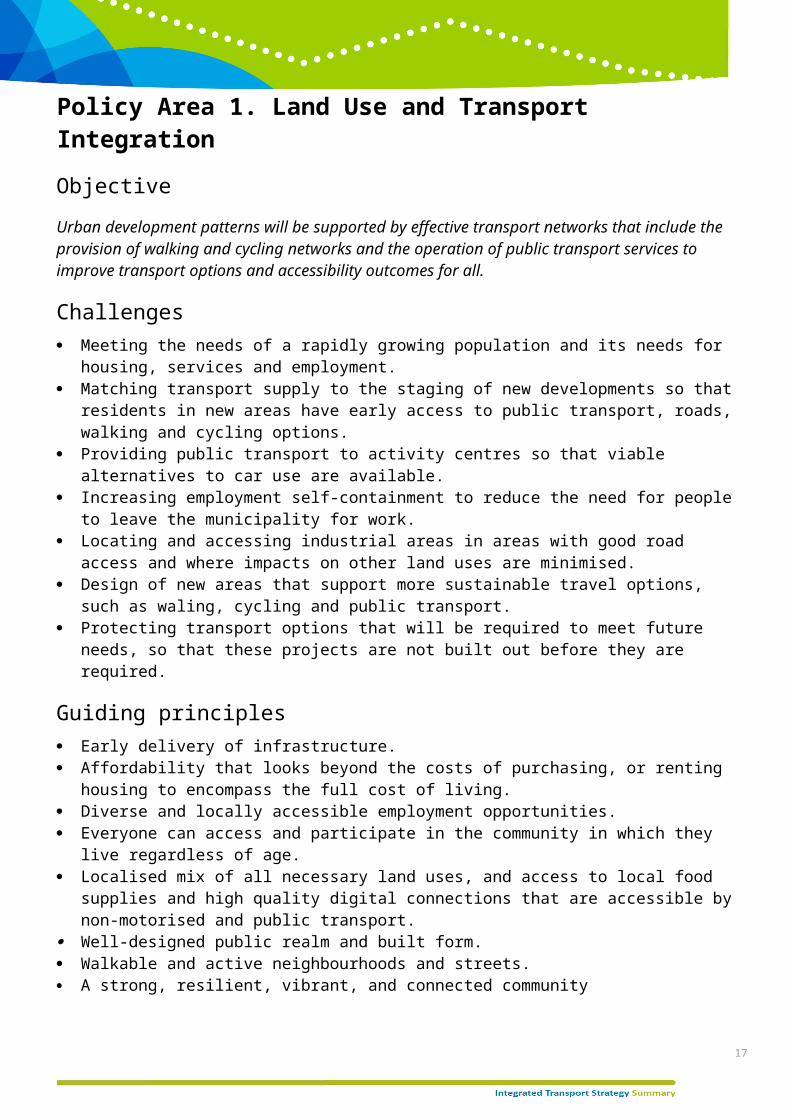
Policy Area 1. Land Use and Transport Integration
Objective
Urban development patterns will be supported by effective transport networks that include the provision of walking and cycling networks and the operation of public transport services to improve transport options and accessibility outcomes for all.
Challenges Meeting the needs of a rapidly growing population and its needs for housing, services and
employment. Matching transport supply to the staging of new developments so that residents in new areas have
early access to public transport, roads, walking and cycling options. Providing public transport to activity centres so that viable alternatives to car use are available. Increasing employment self-containment to reduce the need for people to leave the municipality for
work. Locating and accessing industrial areas in areas with good road access and where impacts on other
land uses are minimised. Design of new areas that support more sustainable travel options, such as waling, cycling and public
transport. Protecting transport options that will be required to meet future needs, so that these projects are
not built out before they are required.
Guiding principles Early delivery of infrastructure. Affordability that looks beyond the costs of purchasing, or renting housing to encompass the full cost
of living. Diverse and locally accessible employment opportunities. Everyone can access and participate in the community in which they live regardless of age. Localised mix of all necessary land uses, and access to local food supplies and high quality digital
connections that are accessible by non-motorised and public transport. Well-designed public realm and built form. Walkable and active neighbourhoods and streets. A strong, resilient, vibrant, and connected community
16
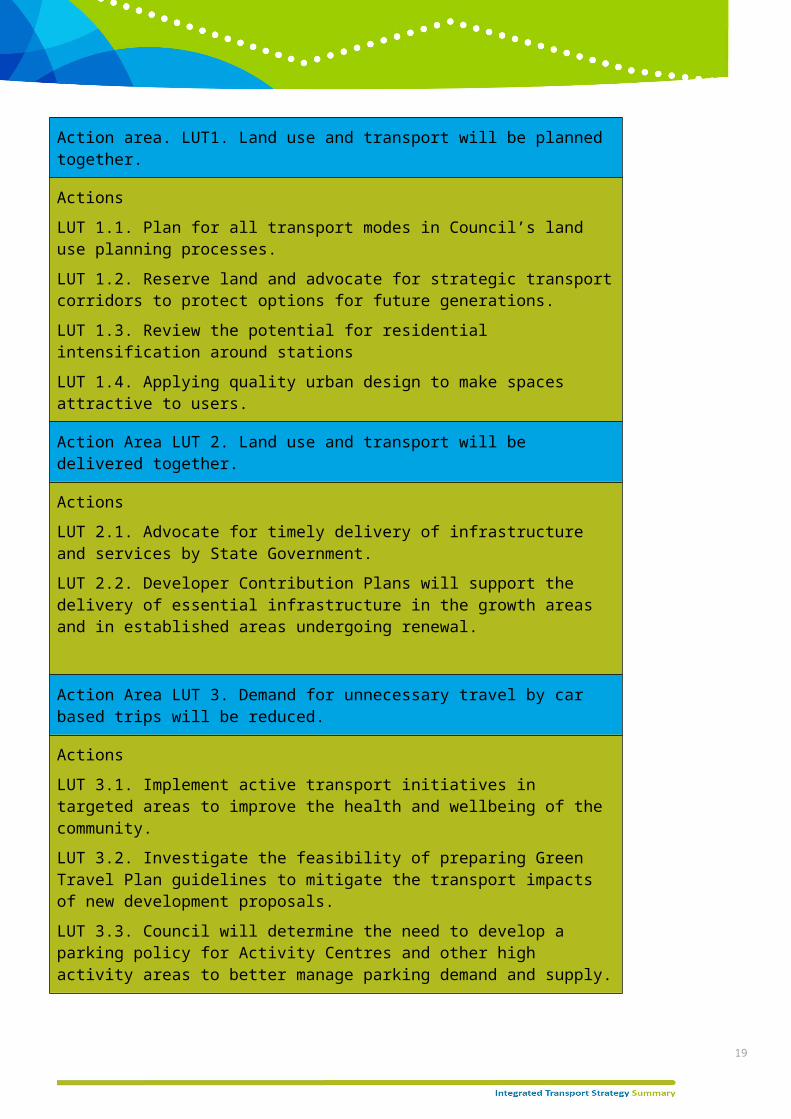
Action area. LUT1. Land use and transport will be planned together.
Actions
LUT 1.1. Plan for all transport modes in Council’s land use planning processes.
LUT 1.2. Reserve land and advocate for strategic transport corridors to protect options for future generations.
LUT 1.3. Review the potential for residential intensification around stations
LUT 1.4. Applying quality urban design to make spaces attractive to users.
Action Area LUT 2. Land use and transport will be delivered together.
Actions
LUT 2.1. Advocate for timely delivery of infrastructure and services by State Government.
LUT 2.2. Developer Contribution Plans will support the delivery of essential infrastructure in the growth areas and in established areas undergoing renewal.
Action Area LUT 3. Demand for unnecessary travel by car based trips will be reduced.
Actions
LUT 3.1. Implement active transport initiatives in targeted areas to improve the health and wellbeing of the community.
LUT 3.2. Investigate the feasibility of preparing Green Travel Plan guidelines to mitigate the transport impacts of new development proposals.
LUT 3.3. Council will determine the need to develop a parking policy for Activity Centres and other high activity areas to better manage parking demand and supply.
17

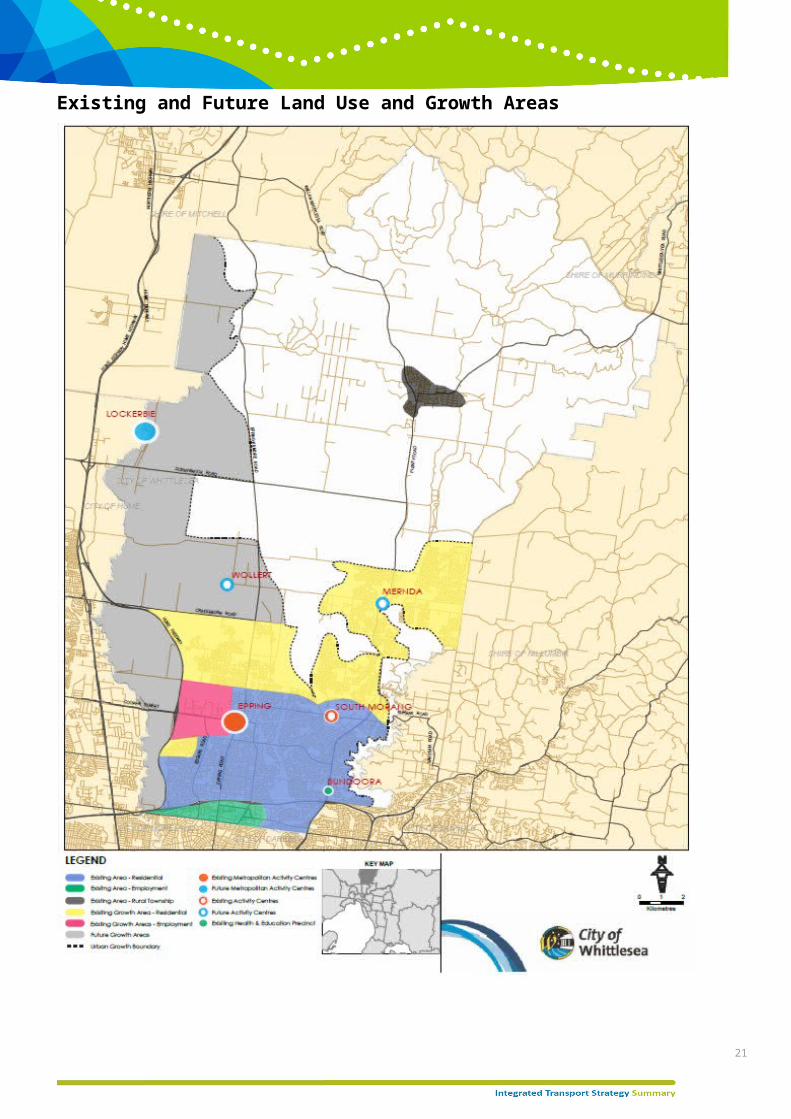
Existing and Future Land Use and Growth Areas
18
Policy Area 2. Walking
ObjectiveCouncil will provide a safe urban environment where walking is encouraged through appropriate infrastructure and a built environment that encourages walking.
Challenges Continuity of walking routes so that people are able to walk to major destinations without major
barriers or diversions. Increase safety levels by providing adequate footpaths, lighting and sight lines. Provision of
pedestrian crossings on high volume roads. Provision of activities within walking distance of homes so that walking becomes a viable transport
option for an increasing range of activities.
Guiding principles Walking networks should be focussed on attractions that support community wellbeing and reduce
social isolation and foster economic and community development. Walking should support the effective operation of public transport. A physical environment should be designed at the human scale which promotes walking, and include
provision for older people, children and mobility and vision impaired. Provide convenient paths with generous widths to encourage walking.
Action Area W 1. Planning for walking will be integrated into all of Council’s activities.
Actions
W 1.1. Review Council’s current Walking Strategy.
Action Area W 2. Walking for local access will be encouraged to improve community health and wellbeing.
Actions
W 2.1. Work with schools to promote walking.
W 2.2. Promote walking by assisting in the establishment of a walking advocacy group(s) and collaborating with agencies.
Action Area W 3. Walking needs will be incorporated into all capital works projects, redevelopment of existing areas and in the planning of new growth areas.
Actions
Action W 3.1 Deliver and advocate for improved walking connectivity to improve access to activity centres, employment areas, schools, community facilities and public transport interchanges.
19

Policy Area 3. Cycling
Objective
Council will enable the community to adopt cycling as a viable alternative to the car for a wide variety of trips within the municipality and our neighbouring municipalities, through provision of infrastructure, encouragement programs and supporting infrastructure.
Challenges Continuity of cycling routes so that people are able to cycle to major destinations without major
barriers or diversions. Increase the actual and perceived safety levels when people are cycling. Reducing the distances to activities so that cycling becomes a viable transport option for an
increasing range of activities. Upgrade signage for cyclists to improve ease of navigation through the municipality.
Guiding principles Cycling should provide a transport option for trips of up to seven kilometres. Cycling should contribute to health, economic and environmental outcomes. Cycling infrastructure should be focussed on facilities suitable to novice or young riders. Supporting infrastructure, in particular signage and bicycle parking, should be provided in key
locations across an entire network. Cycling networks should extend the catchment of public transport stations and interchanges.
20
Action Area C 1. Planning for cycling will be integrated into Council’s activities.
Actions
C 1.1. Develop a Council Cycling Plan and implement the associated projects and initiatives.
Action Area C 2. Bicycle needs will be incorporated into all transport network development and land use planning.
Actions
C 2.1 Prioritise bicycle infrastructure into Council’s capital works program and land use planning to ensure funds are targeted to areas of greatest needs.
C 2.2. Advocate for investment in the Principal Bicycle Network and Metropolitan Trails Network to match Council investment in bicycle infrastructure.
Action Area C 3. Cycling for local and regional access will be encouraged to improve community health and wellbeing.
Actions
C 3.1. Work with schools to promote cycling.
C 3.2. Promote cycling in collaboration with the Whittlesea Bicycle Users Group and Bicycle Network Victoria.
21
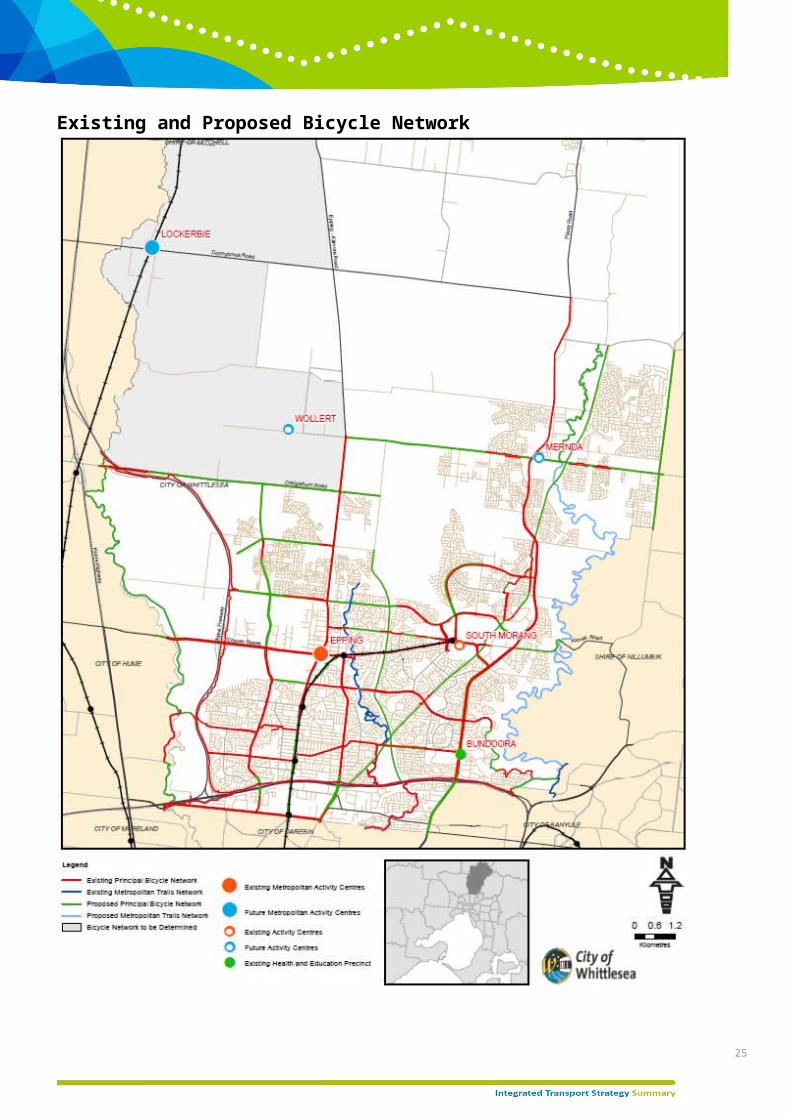
Existing and Proposed Bicycle Network
22
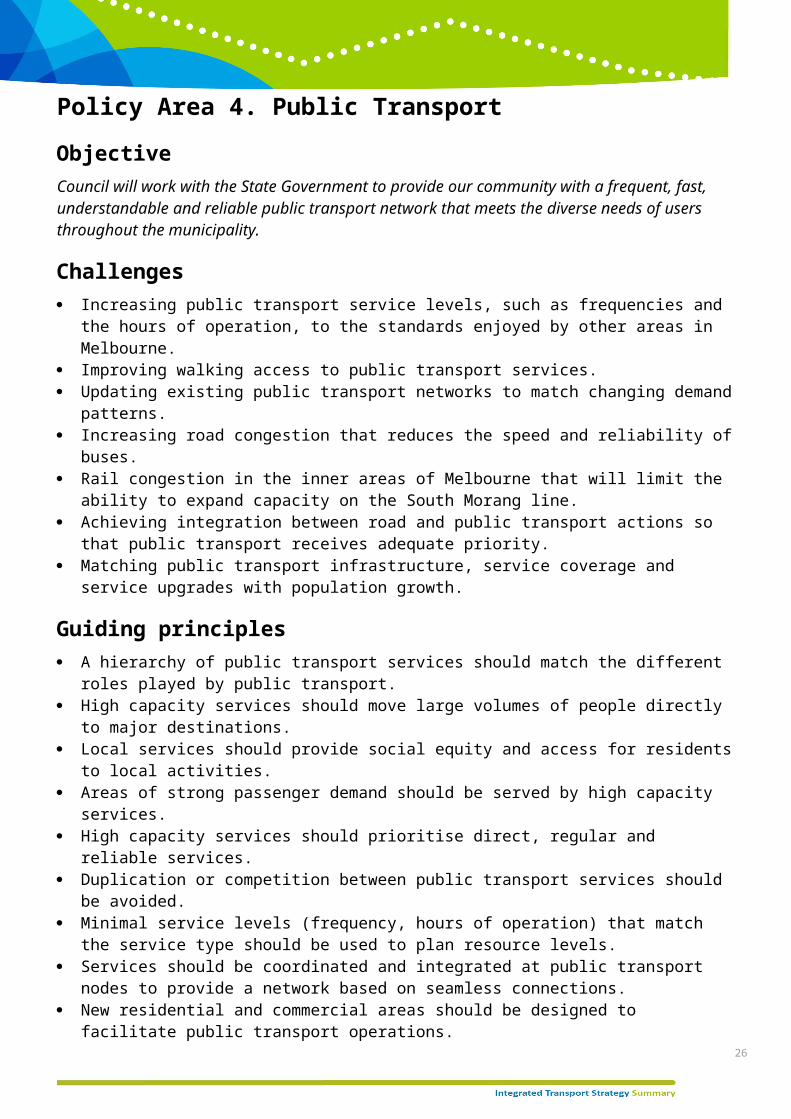
Policy Area 4. Public Transport
ObjectiveCouncil will work with the State Government to provide our community with a frequent, fast, understandable and reliable public transport network that meets the diverse needs of users throughout the municipality.
Challenges Increasing public transport service levels, such as frequencies and the hours of operation, to the
standards enjoyed by other areas in Melbourne. Improving walking access to public transport services. Updating existing public transport networks to match changing demand patterns. Increasing road congestion that reduces the speed and reliability of buses. Rail congestion in the inner areas of Melbourne that will limit the ability to expand capacity on the
South Morang line. Achieving integration between road and public transport actions so that public transport receives
adequate priority. Matching public transport infrastructure, service coverage and service upgrades with population
growth.
Guiding principles A hierarchy of public transport services should match the different roles played by public transport. High capacity services should move large volumes of people directly to major destinations. Local services should provide social equity and access for residents to local activities. Areas of strong passenger demand should be served by high capacity services. High capacity services should prioritise direct, regular and reliable services. Duplication or competition between public transport services should be avoided. Minimal service levels (frequency, hours of operation) that match the service type should be used to
plan resource levels. Services should be coordinated and integrated at public transport nodes to provide a network based
on seamless connections. New residential and commercial areas should be designed to facilitate public transport operations.
23
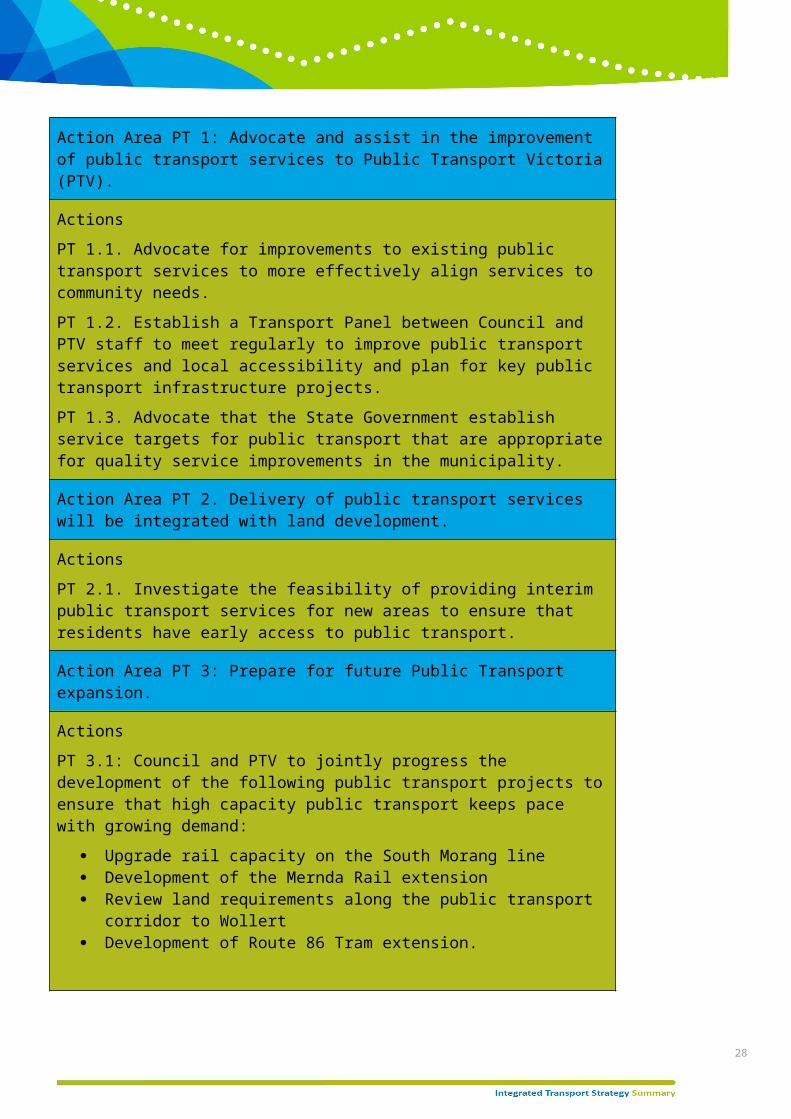
Action Area PT 1: Advocate and assist in the improvement of public transport services to Public Transport Victoria (PTV).
Actions
PT 1.1. Advocate for improvements to existing public transport services to more effectively align services to community needs.
PT 1.2. Establish a Transport Panel between Council and PTV staff to meet regularly to improve public transport services and local accessibility and plan for key public transport infrastructure projects.
PT 1.3. Advocate that the State Government establish service targets for public transport that are appropriate for quality service improvements in the municipality.
Action Area PT 2. Delivery of public transport services will be integrated with land development.
Actions
PT 2.1. Investigate the feasibility of providing interim public transport services for new areas to ensure that residents have early access to public transport.
Action Area PT 3: Prepare for future Public Transport expansion.
Actions
PT 3.1: Council and PTV to jointly progress the development of the following public transport projects to ensure that high capacity public transport keeps pace with growing demand:
Upgrade rail capacity on the South Morang line Development of the Mernda Rail extension Review land requirements along the public transport corridor to Wollert Development of Route 86 Tram extension.
24
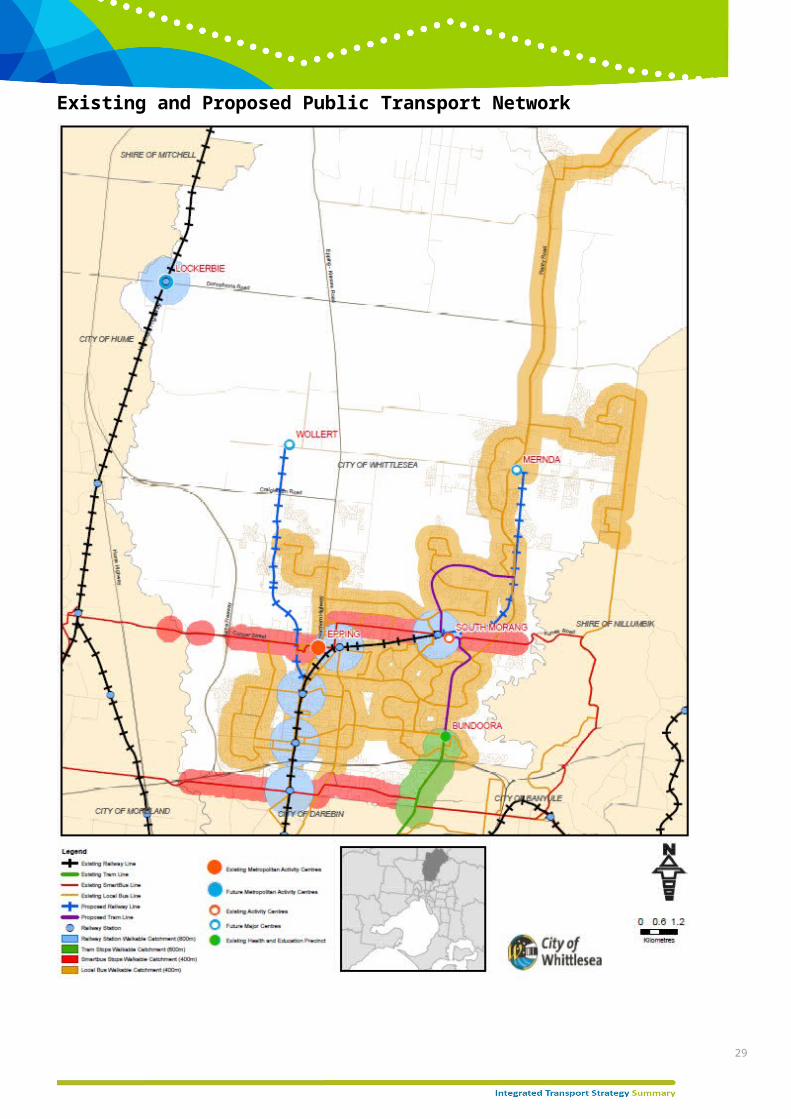
Existing and Proposed Public Transport Network
25
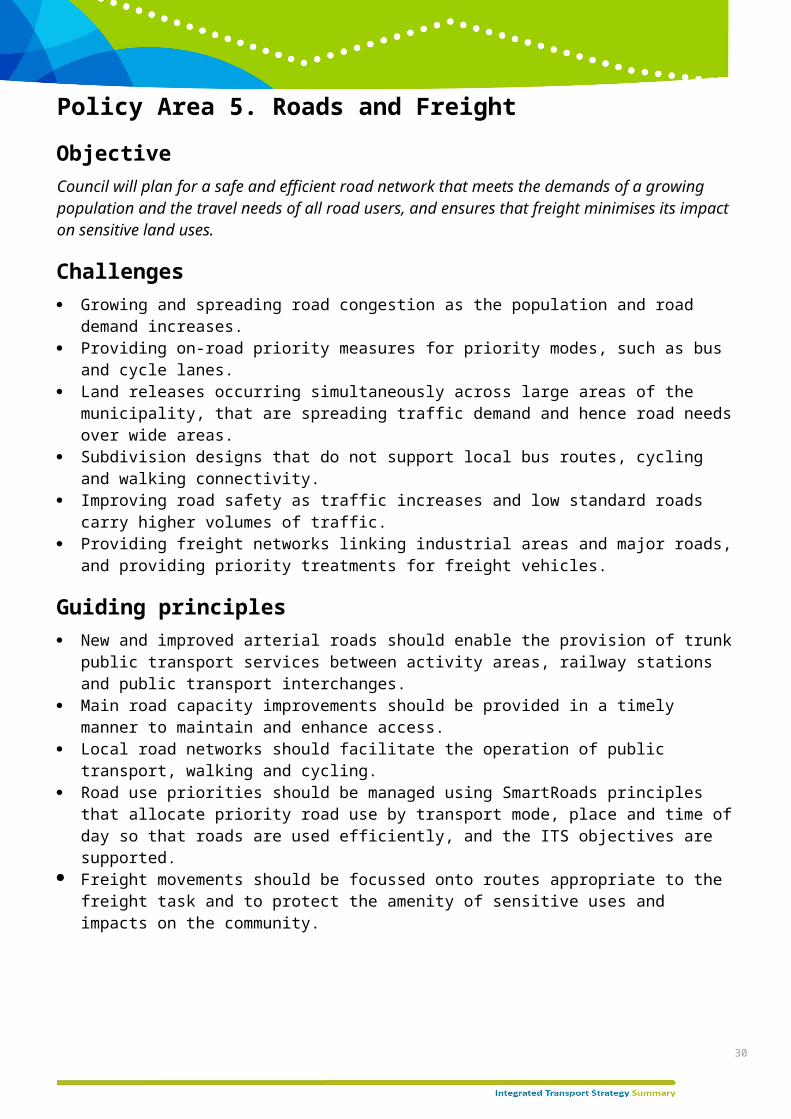
Policy Area 5. Roads and Freight
ObjectiveCouncil will plan for a safe and efficient road network that meets the demands of a growing population and the travel needs of all road users, and ensures that freight minimises its impact on sensitive land uses.
Challenges Growing and spreading road congestion as the population and road demand increases. Providing on-road priority measures for priority modes, such as bus and cycle lanes. Land releases occurring simultaneously across large areas of the municipality, that are spreading
traffic demand and hence road needs over wide areas. Subdivision designs that do not support local bus routes, cycling and walking connectivity. Improving road safety as traffic increases and low standard roads carry higher volumes of traffic. Providing freight networks linking industrial areas and major roads, and providing priority
treatments for freight vehicles.
Guiding principles New and improved arterial roads should enable the provision of trunk public transport services
between activity areas, railway stations and public transport interchanges. Main road capacity improvements should be provided in a timely manner to maintain and enhance
access. Local road networks should facilitate the operation of public transport, walking and cycling. Road use priorities should be managed using SmartRoads principles that allocate priority road use by
transport mode, place and time of day so that roads are used efficiently, and the ITS objectives are supported.
Freight movements should be focussed onto routes appropriate to the freight task and to protect the amenity of sensitive uses and impacts on the community.
26

Action Area RF 1. Essential road links will be progressed by Council, State Government and developers.
Actions
RF 1.1. Undertake municipal wide transport modelling to determine when infrastructure needs are required and the economic, environmental and social benefits that will be provided to the community.
RF 1.2 Develop a Road Network Plan.
RF 1.3 Prepare advocacy plans including the development of business cases on a precinct basis on new and improved road infrastructure and work with State and Federal governments to seek funding opportunities.
Action Area RF 2. The road network will be managed consistently with the ITS to ensure benefits for all road users.
Actions
RF 2.1. Work with VicRoads to plan and implement SmartRoads to manage roads consistent with transport and land use priorities.
RF 2.2. Manage local roads to improve amenity and safety for users and ensure consistency with SmartRoads principles.
RF 2.3. Update Council’s Road Safety Strategy and implement the associated projects and initiatives.
Action Area RF 3. Plan for future road network improvements.
Actions
RF 3.1. Establish a Transport Panel between Council and VicRoads staff to meet regularly on the development of key infrastructure projects and initiatives in the City of Whittlesea.
Action Area RF 4. Manage road freight.
Actions
RF 4.1. Plan and manage freight access networks for efficient freight movement whilst minimising impacts on sensitive land uses.
RF 4.2. Ensure industrial areas are designed to meet current and emerging freight vehicle demands.
Existing and Future Road Network
27
28
Policy Area 6. Community Transport
ObjectiveCouncil will facilitate and support the development and delivery of a sustainable community transport system which provides affordable and accessible transport solutions responsive to people’s individual physical, social, health, financial and support circumstances.
Challenges Achieving sustainable funding for the community transport sector as demand for services grow. Improving service coordination so that community transport resources are used efficiently and the
maximum number of eligible people are serviced. Providing cost effective service delivery whilst maintaining personalised services. Service planning to integrate activities and meet user needs. Council and community leadership to develop the community transport system.
Guiding principles Be flexible and tailored to a person’s individual circumstances and priorities where barriers to
accessing other transport modes exist. Be a key strategy to increase social inclusion and reduce isolation.
Reduce transport barriers to accessing service, programs, education, training employment, community activities and events.
Support people to gain confidence and ability to use mainstream transport options. Give priority to people most vulnerable to isolation and social exclusion. Extend the effectiveness of health and wellbeing infrastructure, programs and services and reduces
rates of demand for costly health and support services. Provide flexibility to the transport system as it can adapt more quickly to changing demographics
than fixed infrastructure transport systems. Provide additional community services and benefits including opportunities for volunteerism, access
to an affordable fleet of vehicles for community groups, and the provision of transport information and coordination.
Action Area CT 1. Build a sustainable community transport sector in the municipality.
Actions
CT 1.1. Seek support from partner stakeholders, including the Regional Management Forum to resource and support an integrated local community transport planning project.
CT 1.2. Develop a Council Policy on community transport.
CT 1.3. Audit Council’s current resourcing, supporting and delivery of community transport.
Making it Happen
Monitoring and ReportingProgress on the ITS will be continually monitored and recorded through Council’s reporting systems.
29
Firstly, actions will be reported quarterly against outputs including cost, timeliness, quantity and quality. Secondly, the impact of the ITS actions will be recognised by monitoring the benefits of positive change over time. This will be reported through the following Key Performance Indicators:
An increase in the proportion of households living in proximity to activity centres and high change areas and high quality transport options
An increase in the proportion of the community engaged in walking An increase in the proportion of the community engaged in cycling An increase in the proportion of the community using public transport A decrease in the proportion of short trips (up to 4 kms) made by motor vehicle An increase in the proportion of transport disadvantaged residents having access to community
transport services.
Action Area MR1. Continually monitor and regularly report on the output and impact of the ITS Actions.
Actions
MR 1.1. Incorporate the ITS actions into relevant Council department’s business plans and report on them quarterly.
MR 1.2. Adapt Council's Customer Request Management (CRM) system to record and provide data relevant to the ITS.
MR 1.3. Adapt the City of Whittlesea Annual Household Survey to capture transport data relevant to the ITS.
MR 1.4. Continue to monitor and analyse relevant transport data including VISTA and ABS Census.
MR 1.5. Undertake a detailed survey of residents regarding transport issues, perceptions and participation, to inform the evaluation and review of the ITS.
MR 1.6. Report annually to Council and the community on the progress of the ITS and undertake a full review after four years.
ImplementationThe implementation of ITS actions will progress in an orderly manner (as set out in the complete ITS) and rely on available Council resources and assistance from State and Federal governments and support from partner groups.
30
31