Embed Size (px)
Citation preview
Bajaj Allianz Life Insurance Company Limited
AUDITORS
S.R. BATLIBOI & CO.
Chartered Accountants
KIRTANE & PANDIT
Chartered Accountants
MAIN BANKERS
Standard Chartered Bank
Syndicate Bank
Deutsche Bank
UTI Bank
REGISTERED OFFICE
Bajaj Allianz Life Insurance Company Limited,
Ground Floor, G.E. Plaza, Airport Road,
Yerawada, Pune - 411 006.
Tel: (020) 6602 6777.
Fax: (020) 6602 6789.
email:[email protected]
Visit us at: www.bajajallianzlife.co.in
Directors’ Report ..................................................................................... 2
Board of Directors ................................................................................... 4
CEO Speak ............................................................................................ 6
Management Team................................................................................... 8
Management Report ................................................................................ 10
Auditors’ Report .................................................................................... 12
Revenue Account : Policyholders’ Account (Technical Account) ............................... 14
Profit & Loss Account : Shareholders’ Account (Non Technical Account) .................... 19
Balance Sheet ........................................................................................ 20
Schedule 1-15 ........................................................................................ 22
Annexure to Revenue Account ..................................................................... 38
Notes to Financial Statements .................................................................... 42
Cash Flow Statement ............................................................................... 88
Balance Sheet abstract & Company’s general business profile ............................... 89
INDEX
1
1. MARKET SCENARIO IN THE LIFE INSURANCE INDUSTRY:
The life insurance market had an unbelievably high growth
of 110% in the year under review measured in terms of
new business. The industry as a whole wrote a first year
premium of Rs. 754 billion in the year 2006-07 compared
to Rs. 359 billion in the previous year; a growth of 110
percent. Unexpectedly LIC contributed the lion’s share
to this growth. After losing market share during each of
the last of 6 years, LIC bucked the past trend and during
2006-07, the new premium market share of LIC increased
from 71% in 2005-06 to 74% in 2006-07. Accordingly market
share of private players reduced from 29 to 26 percent.
In the year forward, private players like your company
are going to face even greater competition from each
other, a resurgent LIC and many new entrants to the
Life insurance business.
Thus the market is growing by leaps and bounds but
the competition is severe.
Unit- linked products continue to be the fancy of the
customers, largely on account of the booming stock
market. Market structure is maturing towards higher
allocation and moderate commissions. Insurance
Regulatory and Development Authority (IRDA) enforced
a 3-year lock-in period for unit-linked products as well
as Anti Money Laundering/ KYC procedures in the
market through the year.
2. SUMMARY OF OPERATIONS FOR THE YEAR:
Your Company continues to be at the second position
amongst the private life insurers on the basis of new
business premium and first position on the basis of the
number of policies. It wrote new business of Rs. 42,698
million compared to Rs. 27,168 million in the previous
year and registered a market share of 5.7% compared
to 7.6% in the previous year. The gross premium written
for the financial year 2006-07 was Rs.53,100 million, as
compared to Rs. 31,336 million in the previous year.
The Company has recorded a profit of Rs. 662 million
during the financial year and is the highest profit making
company in the private sector.
The Agency channel largely contributed to the extra
ordinary growth achieved by the Company. Strength of
agents doubled in the year from 109,000 to 213,000.
The Company has the largest distribution network in
the private sector and has its presence in 876 offices
across the country. Alternate channels have also picked
up with a good performance of the corporate agents
and other distribution networks. Our Bancassurance
channel has also performed well and has tied up with
pan-India financial institutions, various Co-Operative
banks and Regional Rural Banks. The Company has
successfully developed a comprehensive product range
covering individual life and group business by introducing
a number of products during the year.
Your Company has been monitoring its solvency margins,
which have been maintained in accordance with IRDA
requirements.
2.1 Capital:
The Shareholders contributed Rs. 2,007 million to
the Company’s capital during the year. With this,
the total funds infused by shareholders in the
Company amount to Rs. 7,005 million.
2.2.IRDA Registration:
The Certificate of Registration from the IRDA to
carry on the life insurance business has been
renewed for the year 2007-08.
3. PARTICULARS REGARDING CONSERVATION OF ENERGY
AND TECHNOLOGY ABSORPTION:
Since the Company does not carry out any
manufacturing activity, the Companies (Disclosure of
Particulars in the report of the Board of Directors)
Rules, 1988 are not applicable.
4. FOREIGN EXCHANGE EARNINGS AND EXPENDITURE:
Earnings in foreign currency NIL
Expenditure in foreign currency Rs. 30,135,414/-
DIRECTORS’ REPORTThe Directors have pleasure in presenting their SixthAnnual Report & Audited Statements of Accounts for theyear 2006- 2007
2
5. PARTICULARS OF EMPLOYEES:
As required by the provisions of sub-section 2A of
Section 217 of the Companies Act, 1956 read with the
Companies (Particulars of Employees) as amended, the
names and other particulars of the employees are set
out in the annexure to the Directors’ Report. However,
as per the provisions of sub-section 1(b)(iv) of Section
219 of the Companies Act, 1956, the Report and
Accounts are being sent to the shareholders of the
Company excluding the aforesaid information. Any
shareholder interested in obtaining such particulars
may write to the Company Secretary at the Registered
Office of the Company.
6. DIRECTORS:
Mr. Rahul Bajaj, Mr. Sanjiv Bajaj and Mr. Heinz Dollberg
retire by rotation and being eligible, offer themselves
for re-appointment as Directors.
7. DIRECTORS’ RESPONSIBILITY STATEMENT:
In accordance with the requirements of sub-section
2AA of Section 217 of the Companies Act, 1956, the
Board of Directors wish to confirm the following:
(i) that in preparation of the annual accounts, the
applicable accounting standards have been
followed along with proper explanation relating to
material departures;
(ii) that such accounting policies have been selected
and applied consistently and made judgments and
estimates that are reasonable and prudent so as
to give a true and fair view of the state of affairs of
the Company as on 31st March 2007 and of the profit
or loss of the Company for that period;
(iii) that proper and sufficient care has been taken for
the maintenance of adequate accounting records
in accordance with the provisions of the Act for
safeguarding the assets of the Company and for
preventing and detecting fraud and other
irregularities;
(iv) that the annual accounts have been prepared on a
going concern basis.
8. AUDIT COMMITTEE:
The Audit Committee of Board of Directors constituted
in accordance with the provisions of Section 292A of
the Companies Act, 1956 held their meetings on 5th May
2006 and 27 th November 2006 and reviewed the
operations and accounts of the Company.
9. AUDITORS:
In accordance with the IRDA Regulations/Guidelines,
the Company appointed M/s. Kirtane & Pandit,
Chartered Accountants and M/s. S R Batliboi & Co,
Chartered Accountants, as joint statutory auditors of
the Company in the last Annual General Meeting. They
hold office up to the conclusion of the Sixth Annual
General Meeting of the Company.
The shareholders are requested to appoint the auditors
for the period from the conclusion of the ensuing
Annual General Meeting till the conclusion of the next
Annual General Meeting and to fix their remuneration.
10. APPRECIATION:
The Board is grateful to the IRDA and other regulatory
authorities for their continued support. The Board is
also grateful to its Policyholders’, Bankers’,
Intermediaries’ and Channel Partners for their
continued support.
The Directors take this opportunity to thank the
concerned employees of Bajaj Auto Limited and Allianz
SE for their invaluable contribution in guiding the
working of the Company.
The Directors also take this opportunity to thank the
employees at all levels for their hard work, dedication
and commitment.
On behalf of Board of Directors of
Bajaj Allianz Life Insurance Company Ltd.
Pune Heinz Dollberg Sanjiv Bajaj
11th May 2007 Director Director
3

BOARD OF DIRECTORS
Rahul BajajChairman
Dr. Werner ZedeliusDirector
Sanjay AsherDirector
Heinz DollbergDirector
Craig EllisDirector
Sanjiv BajajDirector
4
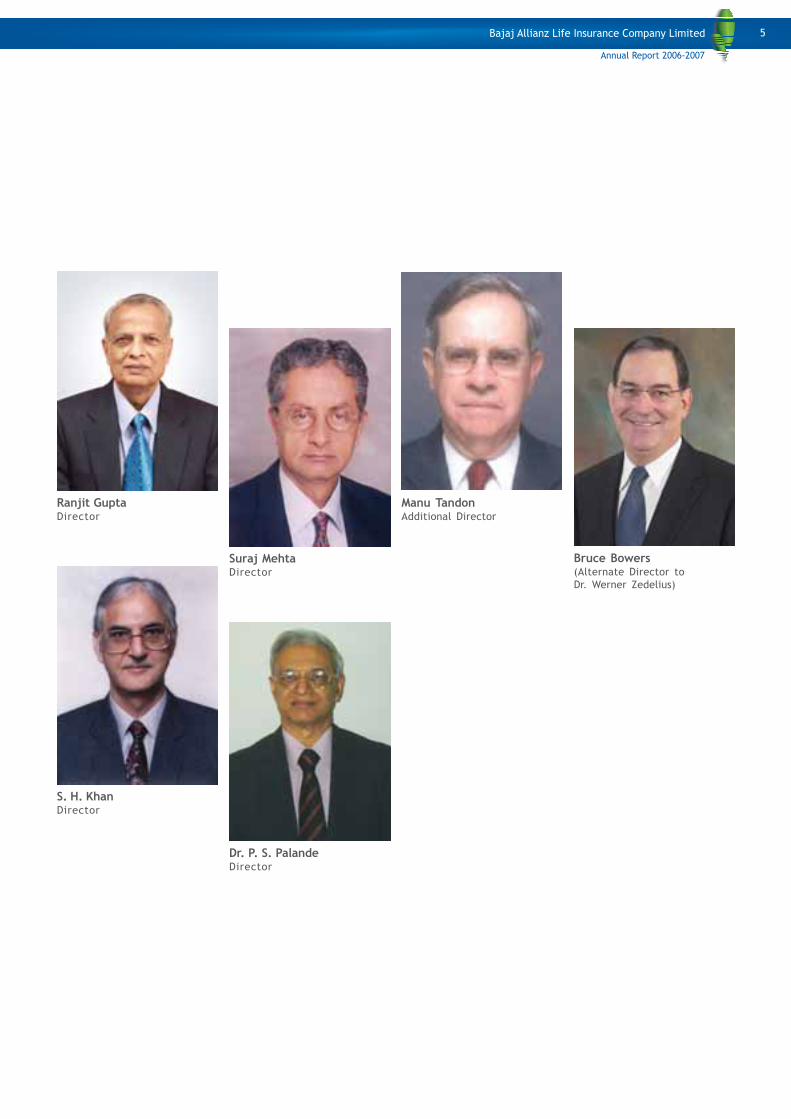
Bruce Bowers(Alternate Director to
Dr. Werner Zedelius)
Manu TandonAdditional Director
Suraj MehtaDirector
Ranjit GuptaDirector
S. H. KhanDirector
Dr. P. S. PalandeDirector
5
CEO SPEAK
Dear friends,
Financial year 2006-07 was very satisfying as we crossed
many milestones and set few records. The year has been a
rewarding one for us on profitability as well as growth. I am
pleased to announce that the Company has emerged as
one of the leading private life insurance companies with a
strong brand name and mutli-channel pan-India distribution
network.
Some of the key performance indicators are:
• The Company posted a healthy profit of Rs. 662 million
as compared to a loss of Rs. 367 million in the previous
year.
• The Gross Written Premiums grew to Rs. 53 billion showing
a growth of 70% over the previous year.
• The Company sold over 2 million individual policies during
the current year.
• The Company is the largest private life insurer in the
country in terms of number of policies sold during the
year and is ranked 2nd among private life insurers in terms
of new business premium.
• Among the ‘Top 50 Service Brands’ in Brand Equity, as
per survey conducted by AC Neilson ORG-MARG.
6
A significant portion of current year’s new business premium
– 72% came from regular premium policies as compared to
45% in the previous year. This change of strategy to
concentrate on regular premium will result in a steady
renewal premium stream and help in stabilizing the long-
term future of the Company.
Our strength lies in a wide distribution network comprising
of 876 offices all across the country supported by one of
the largest network of individual agents, corporate agents,
brokers and bancasssurance partners.
The Company plans to further develop its distribution
network in the coming financial year and lay stress on
product development so that new generation products can
be launched on an ongoing basis. Continuous upgradation
of information technology systems and back office
processes will ensure maintaining and improving the quality
of services to the customers.
We see huge opportunities lying ahead and I am confident
that my team is prepared to capture all this so that we
maintain and increase the lead and create a stronger brand
name across the country.
I thank all our policyholders, business partners and
employees for their continued support and look forward
to further strengthen our relationship.
Warm regards
Sam Ghosh
7

8
MANAGEMENT TEAM
Sam GhoshChief Executive Officer
Rajesh ViswanathanChief Financial Officer
Anil SinghChief Actuary
Malay GhoshHead of Sales
Niraj KumarHead Alternate Channels
G. B. LaddhaChief Investment Officer
Andrew WakelingAppointed Actuary

9
Sameer BakshiCompany Secretary &
Compliance Officer
J. B. BhaskarHead Information Technology
Saji GeorgeHead Operations &
Administration
ECJ AugustineHead Strategic Initiatives,
Zonal Head Sales (South) &
Head Product Lines
A.S. NarayananHead Bancassurance
Sanjay JainHead Marketing
Neeraj JainHead Internal Audit
10
With respect to the operations of Bajaj Allianz Life Insurance
Company Limited (‘the Company’) for the financial year
1 April 2006 to 31 March 2007 and results thereof, the
Management of the Company confirms and declares that:
1. The registration certificate granted by Insurance
Regulatory and Development Authority (IRDA) is valid and
the same has been renewed for the year 2007-2008.
2. All relevant statutory dues payable by the Company have
been generally deposited on time.
3. There has been no transfer of shares during the year
and the shareholding pattern is in accordance with the
statutory and regulatory requirement.
4. The management has not directly or indirectly invested
outside India, the funds of the holders of policies issued
in India.
5. The required solvency margins have been maintained as
required by the IRDA.
6. We certify that the values of all the assets have been
reviewed on the date of Balance Sheet and in the
management’s belief, the assets set forth under each
of the headings in the Balance Sheet are shown in the
aggregate at amounts not exceeding their realizable or
market value under their related headings - “Loans”,
“Investments”, “Agents balances”, “Outstanding
Premiums”, “Income accrued on investments”, “Amounts
due from other entities carrying on insurance business
(including amounts due from reinsurers)”, “Cash” and
the several items specified under “Other Accounts”.
Market value of investment in debt securities (other
than unit linked funds) which are valued at amortized
cost as per IRDA regulations, is lower than their carrying
amount.
7. We certify that, no part of the life insurance fund has
been directly or indirectly applied in contravention of
the Insurance Act, 1938 (4 of 1938) relating to the
application and investment of the life insurance fund.
8. The Company recognizes the risks associated with the
life insurance business and manages the risks by adopting
prudent policies to counter the key risks of the Company
– namely underwriting and investment risks.
The Company has established robust underwriting
procedures to mitigate underwriting risks. Additionally
the Company has entered into reinsurance arrangements
wherein it reinsures risk in excess of its retention limits
to mitigate its risk exposure.
The investment risk is managed by laying down
appropriate guidelines in the Investment Policy.
The Investment Policy is formulated by the Investment
Committee and approved by the Board of Directors.
The investment policy is reviewed at least once a year
for alignment with the Company’s latest business plan
and other developments during the year.
9. The Company does not have operations in any other
country.
10. Claim settlement time for the claims lodged has been
around 7 days from the date of receipt of complete
requirements. Ageing of claims indicating the trends in
average claim settlement time is given below.
Year Days
2006-07 7
2005-06 7
2004-05 3
2003-04 3
2002-03 5
11. We certify that the values, as shown in the Balance
Sheet, of the investments (other than unit linked
investments), which consists of fixed income securities,
equity shares and mutual fund units that have been
valued as per accounting policies prescribed by IRDA.
Market values have been ascertained for equities on
the basis of lower of the closing prices as on the balance
sheet date on The National Stock Exchange of India
Ltd. and The Stock Exchange, Mumbai. For fixed income
securities, valuation is based on procedure issued by
Fixed Income and Money Market and Derivative Dealers
Association (FIMMDA). The investments in the Mutual
Funds are valued at the Net Asset Values (NAV) of these
Mutual funds as on the Balance Sheet date.
We certify that the unit linked investments have been
valued on the basis as stated below:
Equities have been valued at market values which have
been ascertained on the basis of the last quoted closing
price on the NSE. In case the equity shares are not
listed on the NSE, then they are valued on the last
quoted closing price on BSE. Government securities are
valued at prices obtained from Credit Rating Information
Services of India Ltd. (CRISIL). Corporate bonds and
debentures are valued on the basis of CRISIL Bond Valuer.
Treasury bills, certificate of deposits and commercial
papers are valued at cost plus accretion at yield to
maturity. Mutual fund units have been valued at the
last available Net Asset Value declared by the respective
mutual fund.
MANAGEMENT REPORT
11
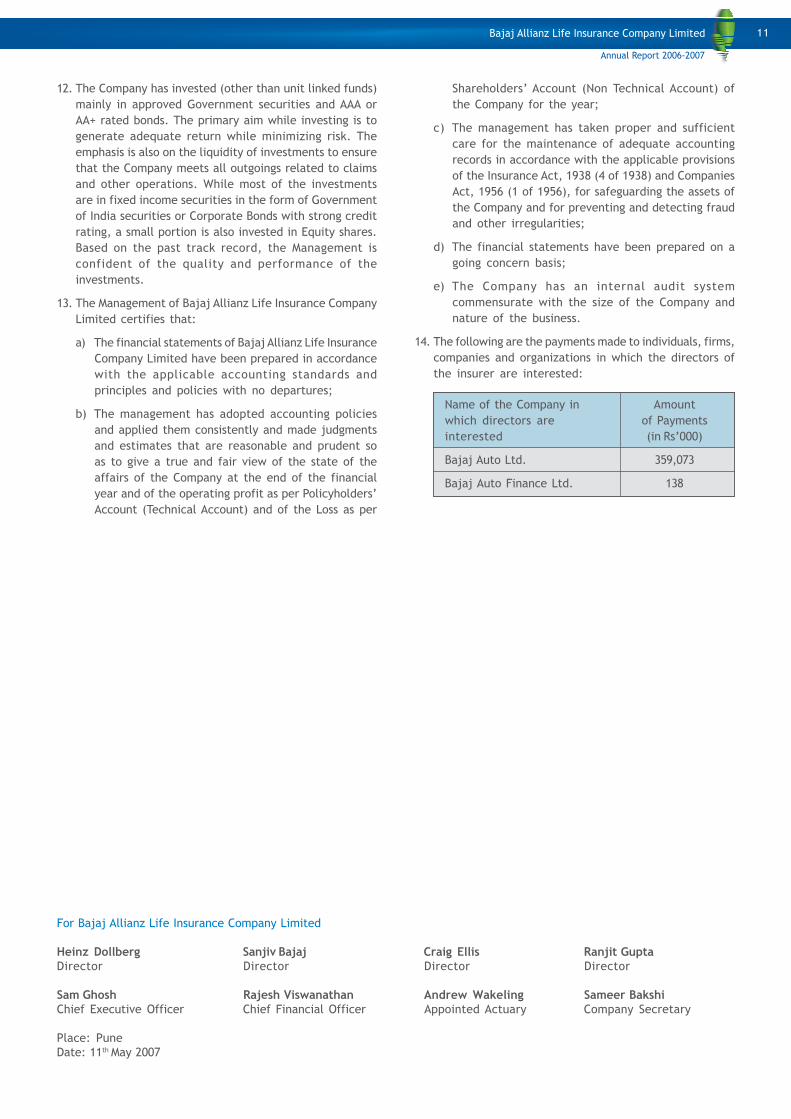
12. The Company has invested (other than unit linked funds)
mainly in approved Government securities and AAA or
AA+ rated bonds. The primary aim while investing is to
generate adequate return while minimizing risk. The
emphasis is also on the liquidity of investments to ensure
that the Company meets all outgoings related to claims
and other operations. While most of the investments
are in fixed income securities in the form of Government
of India securities or Corporate Bonds with strong credit
rating, a small portion is also invested in Equity shares.
Based on the past track record, the Management is
confident of the quality and performance of the
investments.
13. The Management of Bajaj Allianz Life Insurance Company
Limited certifies that:
a) The financial statements of Bajaj Allianz Life Insurance
Company Limited have been prepared in accordance
with the applicable accounting standards and
principles and policies with no departures;
b) The management has adopted accounting policies
and applied them consistently and made judgments
and estimates that are reasonable and prudent so
as to give a true and fair view of the state of the
affairs of the Company at the end of the financial
year and of the operating profit as per Policyholders’
Account (Technical Account) and of the Loss as per
For Bajaj Allianz Life Insurance Company Limited
Heinz Dollberg Sanjiv Bajaj Craig Ellis Ranjit GuptaDirector Director Director Director
Sam Ghosh Rajesh Viswanathan Andrew Wakeling Sameer BakshiChief Executive Officer Chief Financial Officer Appointed Actuary Company Secretary
Place: Pune
Date: 11th
May 2007
Shareholders’ Account (Non Technical Account) of
the Company for the year;
c) The management has taken proper and sufficient
care for the maintenance of adequate accounting
records in accordance with the applicable provisions
of the Insurance Act, 1938 (4 of 1938) and Companies
Act, 1956 (1 of 1956), for safeguarding the assets of
the Company and for preventing and detecting fraud
and other irregularities;
d) The financial statements have been prepared on a
going concern basis;
e) The Company has an internal audit system
commensurate with the size of the Company and
nature of the business.
14. The following are the payments made to individuals, firms,
companies and organizations in which the directors of
the insurer are interested:
Name of the Company in Amount
which directors are of Payments
interested (in Rs’000)
Bajaj Auto Ltd. 359,073
Bajaj Auto Finance Ltd. 138
12
We have audited the attached Balance Sheet of Bajaj Allianz
Life Insurance Company Limited (‘the Company’) as at
31 March 2007, and the related Policyholders’ Revenue
Account, the Shareholders’ Profit and Loss Account and
the Receipts and Payments Account for the year ended on
that date, annexed thereto.
These financial statements are the responsibility of the
management of the Company. Our responsibility is to express
an opinion on these financial statements based on our audit.
We conducted our audit in accordance with auditing
standards generally accepted in India. These standards
require that we plan and perform the audit to obtain
reasonable assurance as to whether the financial statements
are free of material misstatement. An audit includes
examining on a test basis, evidence supporting the amounts
and disclosures in the financial statements. An audit also
includes assessing the accounting principles used and
significant estimates made by management, as well as
evaluating the overall financial statement presentation. We
believe that our audit provides a reasonable basis for our
opinion.
The Balance Sheet, the Policyholders’ Revenue Account,
the Shareholders’ Profit and Loss Account and the Receipts
and Payments Account have been drawn up in accordance
with the Insurance Act, 1938 (Act 4 of 1938), Insurance
Regulatory and Development Act, 1999, Insurance Regulatory
and Development Authority (Preparation of Financial
Statements and Auditor’s Report of Insurance Companies)
Regulations 2002 (‘the Regulations’) read with Section 211
of the Companies Act, 1956.
As required by the Regulations, we set out in the Annexure,
a statement certifying the matters specified in paragraph 4
of Schedule C to the Regulations.
Further to our comments in the Annexure referred to above,
we report that:
• We have obtained all the information and explanations
which, to the best of our knowledge and belief were
necessary for the purposes of the audit and have found
them to be satisfactory;
• In our opinion and to the best of our information and
according to the explanations given to us, proper books
of account as required by law have been maintained by
the Company so far as appears from our examination of
those books;
• As the Company’s accounting system is centralised at
the head office, no returns for the purposes of our
audit are prepared at the branches and other offices
of the Company;
AUDITORS’ REPORT
To
The Members of Bajaj Allianz Life Insurance Company Limited
• The Balance Sheet, the Policyholders’ Revenue Account,
the Shareholders’ Profit and Loss Account and the
Receipts and Payments Account referred to in this report
are in agreement with the books of account;
• The actuarial valuation of liabilities for life policies in
force is the responsibility of the Company’s Appointed
Actuary (‘the Appointed Actuary’). The actuarial valuation
of liabilities for policies in force as at 31 March 2007 has
been duly certified by the Appointed Actuary. The
Appointed Actuary has also certified that, in his opinion,
the assumptions for such valuation are in accordance
with the guidelines and norms, if any, issued by the
Insurance Regulatory and Development Authority (‘IRDA’)
and the Actuarial Society of India in concurrence with
the authority. We have relied upon the Appointed
Actuary’s certificate in this regard in forming our
opinion.
• On the basis of the written representations received
from the Directors of the Company, as on 31 March
2007 and taken on record by the Board of Directors, no
Director of the Company is disqualified as on 31 March
2007 from being appointed as Director under clause (g)
of sub section (1) of Section 274 to the Companies Act,
1956.
In our opinion and to the best of our information and
according to the explanations given to us, we further report
that:
• Investments have been valued in accordance with the
provisions of the Insurance Act, 1938 and the Regulations
or orders / directions issued by IRDA in this behalf;
• The accounting policies selected by the Company are
appropriate and are in compliance with applicable
accounting standards and with accounting principles,
as prescribed in the Regulations and orders or directions
issued by IRDA in this behalf;
• The Balance Sheet, the Policyholders’ Revenue Account,
the Shareholders’ Profit and Loss Account and the
Receipts and Payments Account referred to in this report
are in compliance with the accounting standards
referred to in Section 211 (3C) of the Companies Act,
1956; and
• The Balance Sheet, the Policyholders’ Revenue Account,
the Shareholders’ Profit and Loss Account and the
Receipts and Payments Account together with the notes
thereon and attached thereto are prepared in
accordance with the requirements of the Regulations,
the Insurance Act, 1938, the Insurance Regulatory and
Development Act, 1999 and the Companies Act, 1956, to
13
the extent applicable and in the manner so required
and give a true and fair view in conformity with
accounting principles generally accepted in India as
applicable to insurance companies:
(i) in the case of the Balance Sheet, of the state of
affairs of the Company as at 31 March 2007;
(ii) in the case of the Policyholders’ Revenue Account,
of the surplus for the year ended 31 March 2007;
(iii) in the case of the Shareholders’ Profit and Loss
Account, of the loss for the year ended 31 March
2007; and
(iv) in the case of the Receipts and Payments Account,
of the receipts and payments for the year ended
31 March 2007.
Further, on the basis of examination of books and records
of the Company and according to the information and
explanations given to us and to the best of our knowledge
and belief, we certify that:
• We have reviewed the management report attached to
the financial statements for the year ended 31st March
2007, and there is no apparent mistake or material
inconsistencies with the financial statements; and
• Based on information and explanations received during
the normal course of our audit, management’s
representations made to us and the compliance
certificate submitted to the Board by the officers of
the Company charged with compliance and the same
being noted by the Board, nothing has come to our
attention which causes us to believe that the Company
has not complied with the terms and conditions of
registration as per subsection 4 of section 3 of the
Insurance Act, 1938.
Auditor’s Certificate
To the Members of Bajaj Allianz Life Insurance Company Limited
Based on the information and explanations given to us and to the best of our knowledge and belief, we certify that:
• We have verified the cash balances, to the extent considered necessary, securities relating to the Company’s loans and
investments by actual inspection or on the basis of certificates / confirmations received from custodians and / or
Depository Participants appointed by the Company, as the case may be. At 31st March 2007, none of the Company’s assets
involve reversion or life interests;
• The Company is not the trustee of any trust; and
• No part of the assets of the policyholders’ funds has been directly or indirectly applied in contravention to the provisions
of the Insurance Act, 1938 relating to the application and investments of the policyholders funds.
• This certificate is issued to comply with the requirements of Schedule ‘C’ of Insurance Regulatory and Development
Authority (Preparation of Financial Statements and Auditor’s Report of Insurance Companies) Regulations 2002
(‘the Accounting Regulations’) read with Regulation 3 of the Accounting Regulations and may not be suitable for any
other purpose.
Annexure to the Auditors Report
(Referred to in the Auditors’ Report to the members of Bajaj Allianz Life Insurance Company Limited (‘the Company’) on the
accounts for the year ended 31 March 2007)
KIRTANE & PANDIT S.R. BATLIBOI & CO.Chartered Accountants Chartered Accountants
Suhas Deshpande per Hemal Shah11th May 2007 Partner Partner
Pune Membership No. 31787 Membership No. 42650
KIRTANE & PANDIT S.R. BATLIBOI & CO.Chartered Accountants Chartered Accountants
Suhas Deshpande per Hemal Shah11th May 2007 Partner Partner
Pune Membership No. 31787 Membership No. 42650
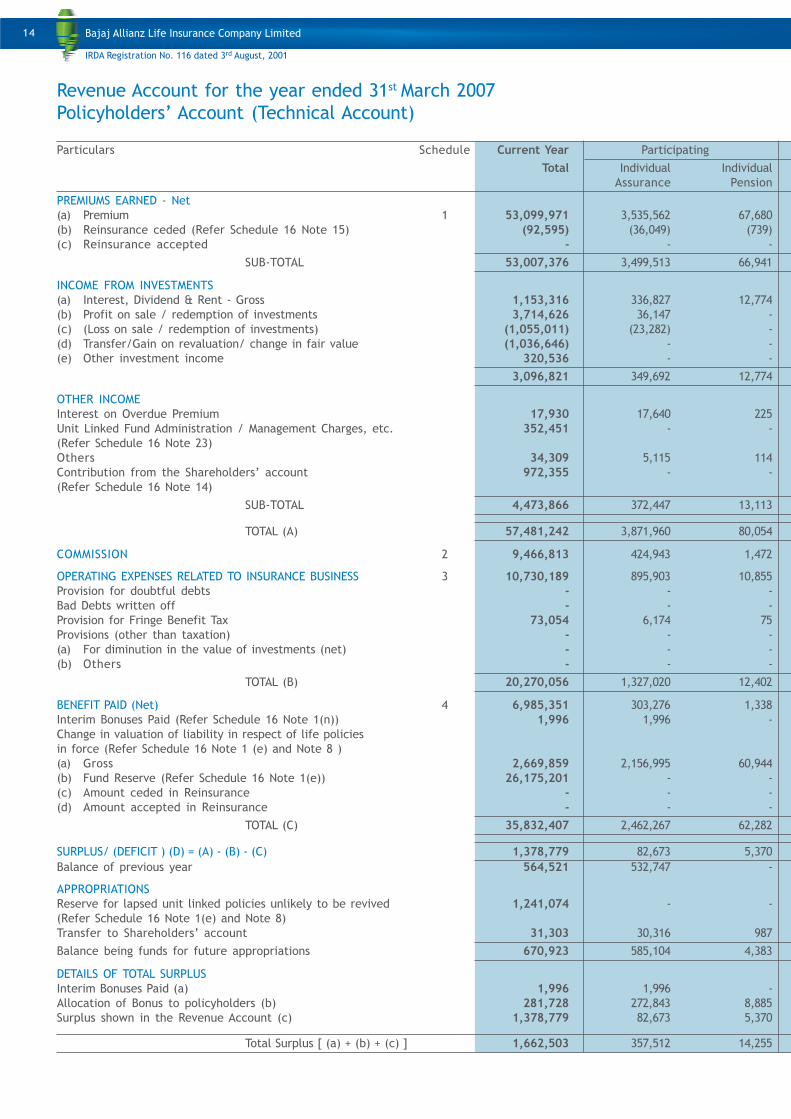
Revenue Account for the year ended 31st March 2007
Policyholders’ Account (Technical Account)
Particulars Schedule Current Year Participating
Total Individual Individual
Assurance Pension
PREMIUMS EARNED - Net
(a) Premium 1 53,099,971 3,535,562 67,680
(b) Reinsurance ceded (Refer Schedule 16 Note 15) (92,595) (36,049) (739)
(c) Reinsurance accepted - - -
SUB-TOTAL 53,007,376 3,499,513 66,941
INCOME FROM INVESTMENTS
(a) Interest, Dividend & Rent - Gross 1,153,316 336,827 12,774
(b) Profit on sale / redemption of investments 3,714,626 36,147 -
(c) (Loss on sale / redemption of investments) (1,055,011) (23,282) -
(d) Transfer/Gain on revaluation/ change in fair value (1,036,646) - -
(e) Other investment income 320,536 - -
3,096,821 349,692 12,774
OTHER INCOME
Interest on Overdue Premium 17,930 17,640 225
Unit Linked Fund Administration / Management Charges, etc. 352,451 - -
(Refer Schedule 16 Note 23)
Others 34,309 5,115 114
Contribution from the Shareholders’ account 972,355 - -
(Refer Schedule 16 Note 14)
SUB-TOTAL 4,473,866 372,447 13,113
TOTAL (A) 57,481,242 3,871,960 80,054
COMMISSION 2 9,466,813 424,943 1,472
OPERATING EXPENSES RELATED TO INSURANCE BUSINESS 3 10,730,189 895,903 10,855
Provision for doubtful debts - - -
Bad Debts written off - - -
Provision for Fringe Benefit Tax 73,054 6,174 75
Provisions (other than taxation) - - -
(a) For diminution in the value of investments (net) - - -
(b) Others - - -
TOTAL (B) 20,270,056 1,327,020 12,402
BENEFIT PAID (Net) 4 6,985,351 303,276 1,338
Interim Bonuses Paid (Refer Schedule 16 Note 1(n)) 1,996 1,996 -
Change in valuation of liability in respect of life policies
in force (Refer Schedule 16 Note 1 (e) and Note 8 )
(a) Gross 2,669,859 2,156,995 60,944
(b) Fund Reserve (Refer Schedule 16 Note 1(e)) 26,175,201 - -
(c) Amount ceded in Reinsurance - - -
(d) Amount accepted in Reinsurance - - -
TOTAL (C) 35,832,407 2,462,267 62,282
SURPLUS/ (DEFICIT ) (D) = (A) - (B) - (C) 1,378,779 82,673 5,370
Balance of previous year 564,521 532,747 -
APPROPRIATIONS
Reserve for lapsed unit linked policies unlikely to be revived 1,241,074 - -
(Refer Schedule 16 Note 1(e) and Note 8)
Transfer to Shareholders’ account 31,303 30,316 987
Balance being funds for future appropriations 670,923 585,104 4,383
DETAILS OF TOTAL SURPLUS
Interim Bonuses Paid (a) 1,996 1,996 -
Allocation of Bonus to policyholders (b) 281,728 272,843 8,885
Surplus shown in the Revenue Account (c) 1,378,779 82,673 5,370
Total Surplus [ (a) + (b) + (c) ] 1,662,503 357,512 14,255
14
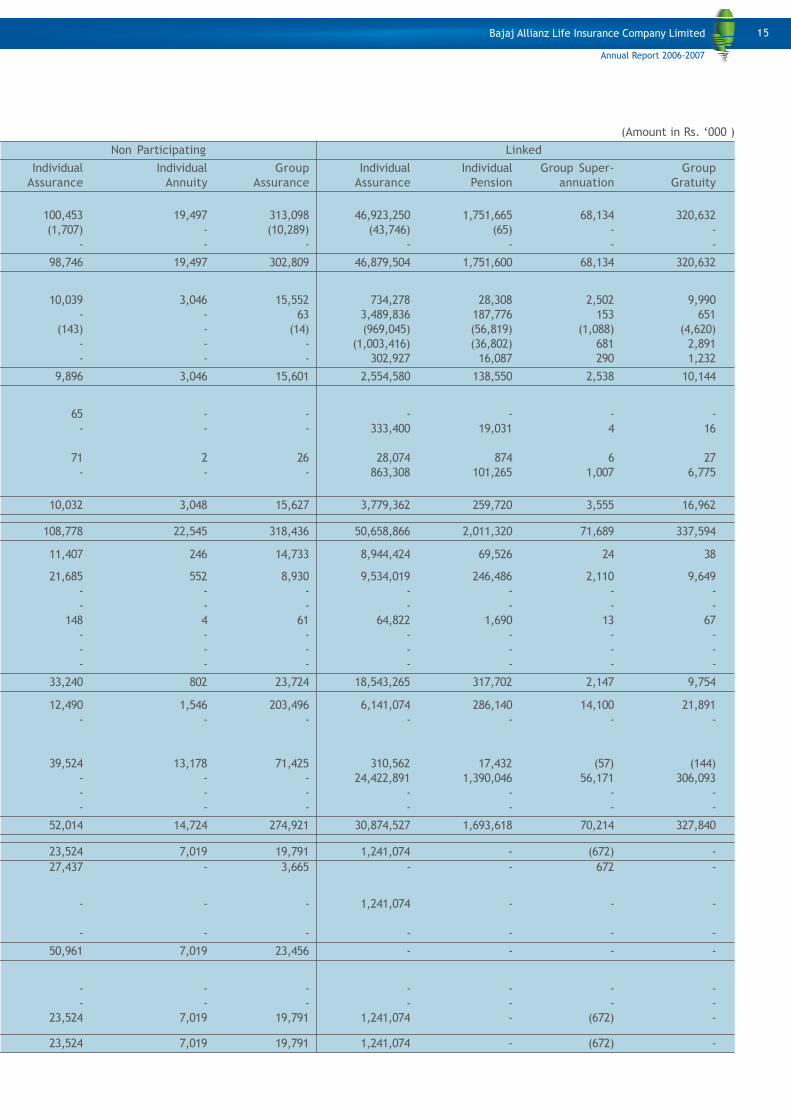
(Amount in Rs. ‘000 )
Non Participating Linked
Individual Individual Group Individual Individual Group Super- Group
Assurance Annuity Assurance Assurance Pension annuation Gratuity
100,453 19,497 313,098 46,923,250 1,751,665 68,134 320,632
(1,707) - (10,289) (43,746) (65) - -
- - - - - - -
98,746 19,497 302,809 46,879,504 1,751,600 68,134 320,632
10,039 3,046 15,552 734,278 28,308 2,502 9,990
- - 63 3,489,836 187,776 153 651
(143) - (14) (969,045) (56,819) (1,088) (4,620)
- - - (1,003,416) (36,802) 681 2,891
- - - 302,927 16,087 290 1,232
9,896 3,046 15,601 2,554,580 138,550 2,538 10,144
65 - - - - - -
- - - 333,400 19,031 4 16
71 2 26 28,074 874 6 27
- - - 863,308 101,265 1,007 6,775
10,032 3,048 15,627 3,779,362 259,720 3,555 16,962
108,778 22,545 318,436 50,658,866 2,011,320 71,689 337,594
11,407 246 14,733 8,944,424 69,526 24 38
21,685 552 8,930 9,534,019 246,486 2,110 9,649
- - - - - - -
- - - - - - -
148 4 61 64,822 1,690 13 67
- - - - - - -
- - - - - - -
- - - - - - -
33,240 802 23,724 18,543,265 317,702 2,147 9,754
12,490 1,546 203,496 6,141,074 286,140 14,100 21,891
- - - - - - -
39,524 13,178 71,425 310,562 17,432 (57) (144)
- - - 24,422,891 1,390,046 56,171 306,093
- - - - - - -
- - - - - - -
52,014 14,724 274,921 30,874,527 1,693,618 70,214 327,840
23,524 7,019 19,791 1,241,074 - (672) -
27,437 - 3,665 - - 672 -
- - - 1,241,074 - - -
- - - - - - -
50,961 7,019 23,456 - - - -
- - - - - - -
- - - - - - -
23,524 7,019 19,791 1,241,074 - (672) -
23,524 7,019 19,791 1,241,074 - (672) -
15
Revenue Account for the year ended 31st March 2007
Policyholders’ Account (Technical Account)
Particulars Schedule Previous Year Participating
Total Individual Individual
Assurance Pension
PREMIUMS EARNED - Net
(a) Premium 1 31,335,778 3,288,070 67,521
(b) Reinsurance ceded (Refer Schedule 16 Note 15) (53,565) (27,773) (570)
(c) Reinsurance accepted - - -
SUB-TOTAL 31,282,213 3,260,297 66,951
INCOME FROM INVESTMENTS
(a) Interest, Dividend & Rent - Gross 211,084 186,494 6,225
(b) Profit on sale / redemption of investments 106,640 106,623 6
(c) (Loss on sale / redemption of investments) (5,307) (5,307) -
(d) Transfer/Gain on revaluation/ change in fair value - - - -
(e) Other investment income - - -
312,417 287,810 6,231
OTHER INCOME
Interest on Overdue Premium 12,808 12,552 30
Unit Linked Fund Administration / Management Charges, etc. 218,070 - -
(Refer Schedule 16 Note 23)
Others 59,354 19,301 533
Contribution from the Shareholders’ account 1,085,539 - 2,748
(Refer Schedule 16 Note 14)
SUB-TOTAL 1,688,188 319,663 9,542
TOTAL (A) 32,970,401 3,579,960 76,493
COMMISSION 2 3,418,670 511,174 1,635
OPERATING EXPENSES RELATED TO INSURANCE BUSINESS 3 4,868,110 1,053,774 11,965
Provision for doubtful debts - - -
Bad Debts written off - - -
Provision for Fringe Benefit Tax 41,020 8,935 103
Provisions (other than taxation)
(a) For diminution in the value of investments (net) - - -
(b) Others - - -
TOTAL (B) 8,327,800 1,573,883 13,703
BENEFIT PAID (Net) 4 6,534,838 111,899 716
Interim Bonuses Paid (Refer Schedule 16 Note 1(n)) 1,210 1,161 49
Change in valuation of liability in respect of life policies
in force (Refer Schedule 16 Note 1 (e) and Note 8 )
(a) Gross 1,912,292 1,405,336 62,506
(b) Fund Reserve (Refer Schedule 16 Note 1(e)) 15,576,070 - -
(c) Amount ceded in Reinsurance - - -
(d) Amount accepted in Reinsurance - - -
TOTAL (C) 24,024,410 1,518,396 63,271
SURPLUS/ (DEFICIT ) (D) = (A) - (B) - (C) 618,191 487,681 (481)
Balance of previous year 64,069 45,066 481
APPROPRIATIONS
Reserve for lapsed unit linked policies unlikely to be revived 117,739 - -
(Refer Schedule 16 Note 1(e) and Note 8)
Transfer to Shareholders’ account - - -
Balance being funds for future appropriations 564,521 532,747 -
DETAILS OF TOTAL SURPLUS
Interim Bonuses Paid (a) 1,210 1,161 49
Allocation of Bonus to policyholders (b) 217,860 210,140 7,720
Surplus shown in the Revenue Account (c) 618,191 487,681 (481)
Total Surplus [ (a) + (b) + (c) ] 837,261 698,982 7,288
16
(Amount in Rs. ‘000 )
Non Participating Linked
Individual Individual Group Individual Individual Group Super- Group
Assurance Annuity Assurance Assurance Pension annuation Gratuity
115,793 18,143 160,853 26,769,800 787,609 37,954 90,035
(208) (33) (3,243) (21,463) (275) - -
- - - - - - -
115,585 18,110 157,610 26,748,337 787,334 37,954 90,035
4,467 803 1,343 11,487 222 28 15
11 - - - - - -
- - - - - - -
- - - - - - -
- - - - - - -
4,478 803 1,343 11,487 222 28 15
60 166 - - - - -
- - - 207,031 9,762 888 389
149 4 34 37,438 1,862 8 25
- 8,584 - 1,006,762 64,709 929 1,807
4,687 9,557 1,377 1,262,718 76,555 1,853 2,236
120,272 27,667 158,987 28,011,055 863,889 39,807 92,271
14,496 197 3,988 2,848,592 38,491 62 35
21,407 485 4,878 3,656,303 115,487 953 2,858
- - - - - - -
- - - - - - -
180 4 41 30,740 984 8 25
- - - - - - -
- - - - - - -
36,083 686 8,907 6,535,635 154,962 1,023 2,918
4,865 515 41,738 6,275,572 71,361 7,413 20,759
- - - - - - -
65,274 26,740 109,538 239,837 2,919 44 98
- - - 14,842,272 634,647 30,655 68,496
- - - - - - -
- - - - - - -
70,139 27,255 151,276 21,357,681 708,927 38,112 89,353
14,050 (274) (1,196) 117,739 - 672 -
13,387 274 4,861 - - - -
- - - 117,739 - - -
- - - - - - -
27,437 - 3,665 - - 672 -
- - - - - - -
- - - - - - -
14,050 (274) (1,196) 117,739 - 672 -
14,050 (274) (1,196) 117,739 - 672 -
17
Revenue Account for the year ended 31st March 2007
Policyholders’ Account (Technical Account)
Notes to Financial statements 16
As required by Section 40-B of the Insurance Act, 1938, we certify that all expenses of Management in respect of Life
Insurance business transacted in India by the Company have been fully debited to the Policyholders’ Revenue Account as
expenses.
The accompanying notes and schedules form an integral part of the financial statements.
As per our report of even date attached
For Kirtane & Pandit For S. R. Batliboi & Co. For Bajaj Allianz Life Insurance Company LimitedChartered Accountants Chartered Accountants
Suhas Deshpande Hemal Shah Heinz Dollberg Sanjiv BajajPartner Partner Director Director
Membership No. 31787 Membership No. 42650
Craig Ellis Ranjit GuptaDirector Director
Sam Ghosh Rajesh ViswanathanChief Executive Officer Chief Financial Officer
Andrew Wakeling Sameer BakshiAppointed Actuary Company Secretary
Place : Pune Place : Pune
Date : 11th May 2007 Date : 11th May 2007
18
Form A- PL
Profit & Loss account for the year ended 31st March 2007
Shareholders’ Account (Non Technical Account)(Amount in Rs. ‘000)
Particulars Current Current Previous Previous
Year Year Year Year
Amounts transferred from the 31,303 -
Policyholders’ Account (Technical Account)
INCOME FROM INVESTMENTS
(a) Interest, Dividends & Rent - Gross 273,062 113,589
(b) Profit on sale / redemption of investments 23,824 7,236
(c) (Loss on sale / redemption of investments) (19,763) (13,946)
(d) Transfer/Gain on revaluation / change in fair value - -
OTHER INCOME - -
TOTAL(A) 277,123 106,879
Expenses other than those directly related to the
insurance business (Refer Schedule 16 Note 11)
Preliminary Expenses written-off - 3,180
Others 53,077 3,566
Provisions (Other than Taxation) - -
Contribution to the Policyholders’ Fund
(Refer Schedule 16 Note 14)
Participating
Individual Assurance - -
Individual Pension - 2,748
Non Participating
Individual Assurance - -
Individual Annuity - 8,584
Group Assurance - -
Linked
Individual Assurance 863,308 1,006,762
Individual Pension 101,265 64,709
Group Superannuation 1,007 929
Group Gratuity 6,775 972,355 1,807 1,085,539
TOTAL(B) 1,025,432 1,092,285
PROFIT / (LOSS) before Tax (717,006) (985,406)
Provision for Taxation including Wealth Tax 27 36
PROFIT / (LOSS) after Tax (717,033) (985,442)
Balance at the beginning of the year (2,043,096) (1,057,654)
PROFIT/(LOSS) CARRIED FORWARD TO BALANCE SHEET (2,760,129) (2,043,096)
Earning Per Share (Basic & Diluted) (Refer Schedule 16 Note 17) (4.77) (6.56)
Notes to Financial statements 16
The accompanying notes and schedules form an integral part of the financial statements.
As per our report of even date attached
For Kirtane & Pandit For S. R. Batliboi & Co. For Bajaj Allianz Life Insurance Company LimitedChartered Accountants Chartered Accountants
Suhas Deshpande Hemal Shah Heinz Dollberg Sanjiv Bajaj Craig Ellis Ranjit GuptaPartner Partner Director Director Director Director
Membership No. 31787 Membership No. 42650
Place : Pune Sam Ghosh Rajesh Viswanathan Andrew Wakeling Sameer BakshiDate : 11th May 2007 Chief Executive Officer Chief Financial Officer Appointed Actuary Company Secretary
19
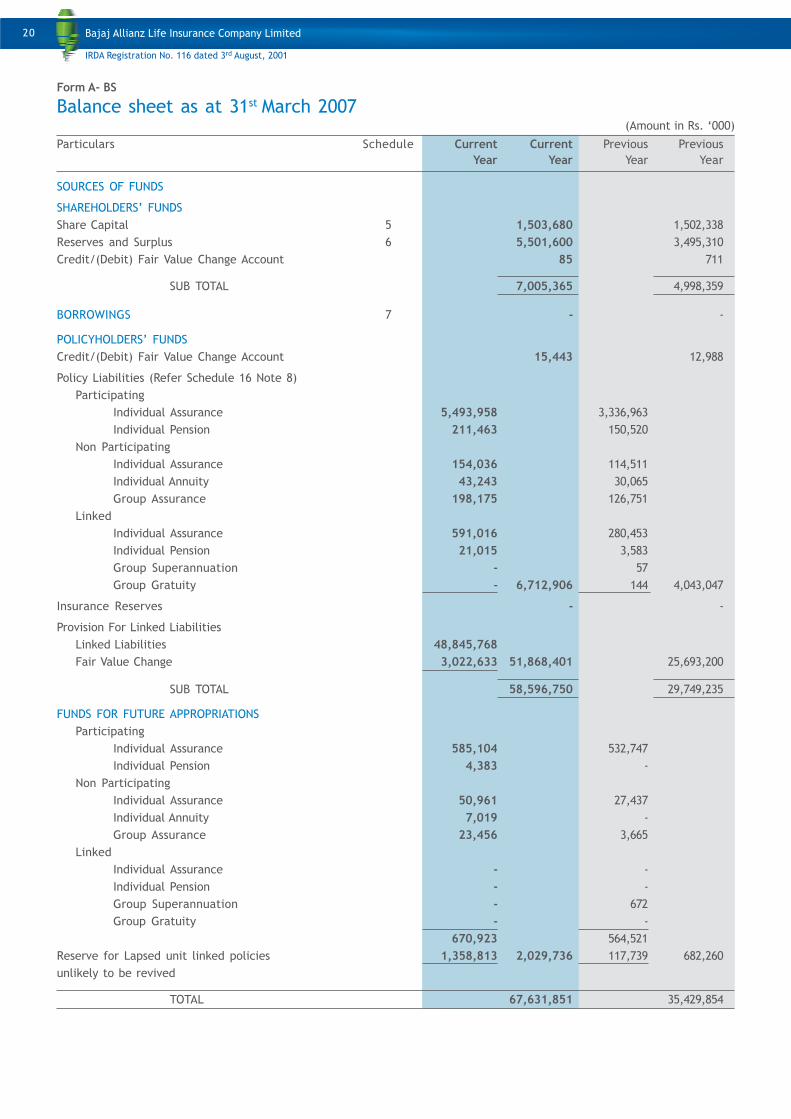
Form A- BS
Balance sheet as at 31st March 2007(Amount in Rs. ‘000)
Particulars Schedule Current Current Previous Previous
Year Year Year Year
SOURCES OF FUNDS
SHAREHOLDERS’ FUNDS
Share Capital 5 1,503,680 1,502,338
Reserves and Surplus 6 5,501,600 3,495,310
Credit/(Debit) Fair Value Change Account 85 711
SUB TOTAL 7,005,365 4,998,359
BORROWINGS 7 - -
POLICYHOLDERS’ FUNDS
Credit/(Debit) Fair Value Change Account 15,443 12,988
Policy Liabilities (Refer Schedule 16 Note 8)
Participating
Individual Assurance 5,493,958 3,336,963
Individual Pension 211,463 150,520
Non Participating
Individual Assurance 154,036 114,511
Individual Annuity 43,243 30,065
Group Assurance 198,175 126,751
Linked
Individual Assurance 591,016 280,453
Individual Pension 21,015 3,583
Group Superannuation - 57
Group Gratuity - 6,712,906 144 4,043,047
Insurance Reserves - -
Provision For Linked Liabilities
Linked Liabilities 48,845,768
Fair Value Change 3,022,633 51,868,401 25,693,200
SUB TOTAL 58,596,750 29,749,235
FUNDS FOR FUTURE APPROPRIATIONS
Participating
Individual Assurance 585,104 532,747
Individual Pension 4,383 -
Non Participating
Individual Assurance 50,961 27,437
Individual Annuity 7,019 -
Group Assurance 23,456 3,665
Linked
Individual Assurance - -
Individual Pension - -
Group Superannuation - 672
Group Gratuity - -
670,923 564,521
Reserve for Lapsed unit linked policies 1,358,813 2,029,736 117,739 682,260
unlikely to be revived
TOTAL 67,631,851 35,429,854
20
Notes to Financial statements 16
The accompanying notes and schedules form an integral part of the financial statements.
As per our report of even date attached
For Kirtane & Pandit For S. R. Batliboi & Co. For Bajaj Allianz Life Insurance Company LimitedChartered Accountants Chartered Accountants
Suhas Deshpande Hemal Shah Heinz Dollberg Sanjiv Bajaj Craig Ellis Ranjit GuptaPartner Partner Director Director Director Director
Membership No. 31787 Membership No. 42650
Place : Pune Sam Ghosh Rajesh Viswanathan Andrew Wakeling Sameer BakshiDate : 11th May 2007 Chief Executive Officer Chief Financial Officer Appointed Actuary Company Secretary
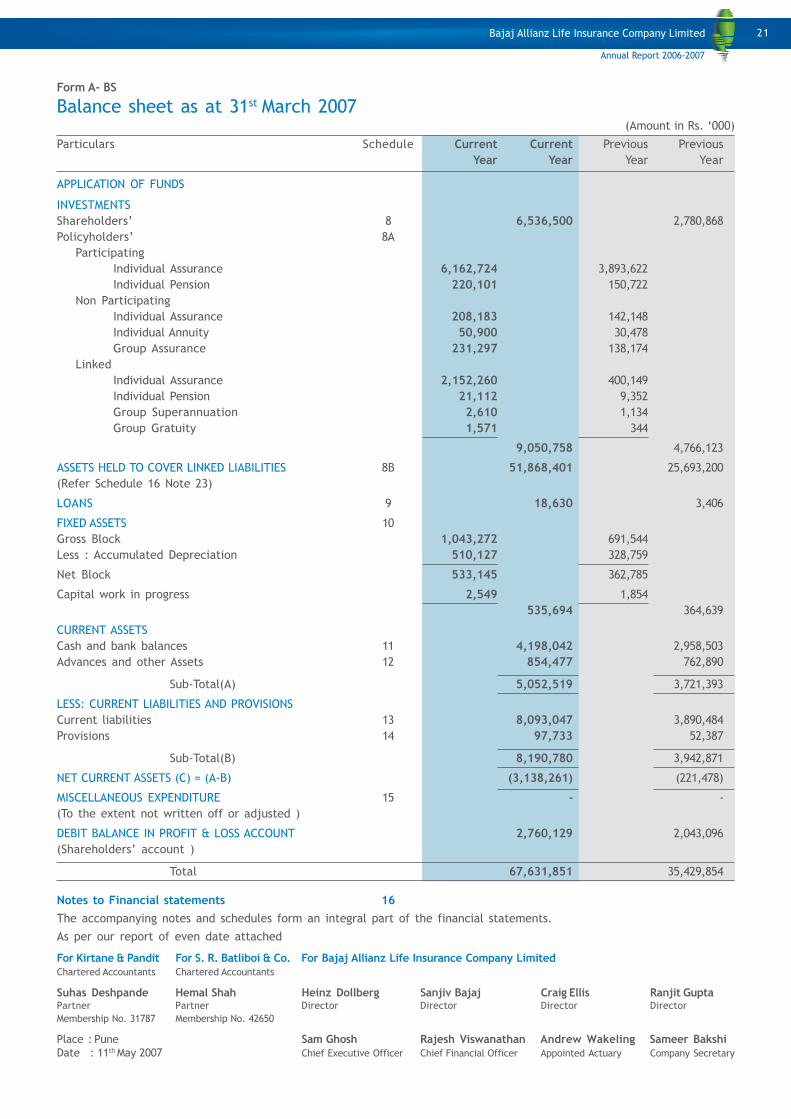
Form A- BS
Balance sheet as at 31st March 2007(Amount in Rs. ‘000)
Particulars Schedule Current Current Previous Previous
Year Year Year Year
APPLICATION OF FUNDS
INVESTMENTS
Shareholders’ 8 6,536,500 2,780,868
Policyholders’ 8A
Participating
Individual Assurance 6,162,724 3,893,622
Individual Pension 220,101 150,722
Non Participating
Individual Assurance 208,183 142,148
Individual Annuity 50,900 30,478
Group Assurance 231,297 138,174
Linked
Individual Assurance 2,152,260 400,149
Individual Pension 21,112 9,352
Group Superannuation 2,610 1,134
Group Gratuity 1,571 344
9,050,758 4,766,123
ASSETS HELD TO COVER LINKED LIABILITIES 8B 51,868,401 25,693,200
(Refer Schedule 16 Note 23)
LOANS 9 18,630 3,406
FIXED ASSETS 10
Gross Block 1,043,272 691,544
Less : Accumulated Depreciation 510,127 328,759
Net Block 533,145 362,785
Capital work in progress 2,549 1,854
535,694 364,639
CURRENT ASSETS
Cash and bank balances 11 4,198,042 2,958,503
Advances and other Assets 12 854,477 762,890
Sub-Total(A) 5,052,519 3,721,393
LESS: CURRENT LIABILITIES AND PROVISIONS
Current liabilities 13 8,093,047 3,890,484
Provisions 14 97,733 52,387
Sub-Total(B) 8,190,780 3,942,871
NET CURRENT ASSETS (C) = (A-B) (3,138,261) (221,478)
MISCELLANEOUS EXPENDITURE 15 - -
(To the extent not written off or adjusted )
DEBIT BALANCE IN PROFIT & LOSS ACCOUNT 2,760,129 2,043,096
(Shareholders’ account )
Total 67,631,851 35,429,854
21
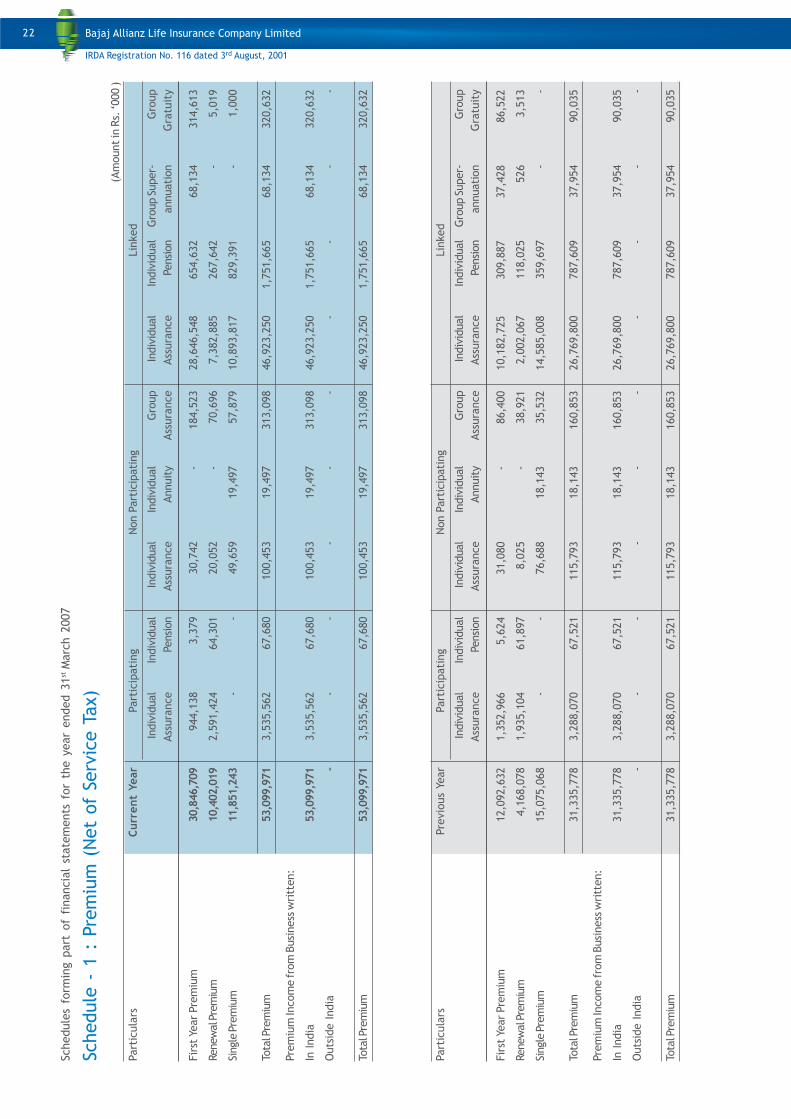
Schedule
s fo
rmin
g p
art
of
financia
l st
ate
ments
for
the y
ear
ended 3
1st M
arc
h 2
007
Schedule
- 1
: P
rem
ium
(N
et
of
Serv
ice T
ax)
(Am
ount in
Rs.
‘000 )
Part
icula
rsC
urr
en
t Year
Part
icip
ati
ng
Non P
art
icip
ati
ng
Lin
ked
Indiv
idual
Indiv
idual
Indiv
idual
Indiv
idual
Gro
up
Indiv
idual
Indiv
idual
Gro
up S
uper-
Gro
up
Ass
ura
nce
Pensi
on
Ass
ura
nce
Annuit
yAss
ura
nce
Ass
ura
nce
Pensi
on
annuati
on
Gra
tuit
y
Fir
st Y
ear
Pre
miu
m30,8
46,7
09
944,1
38
3,3
79
30,7
42
-184,5
23
28,6
46,5
48
654,6
32
68,1
34
314,6
13
Renew
al P
rem
ium
10,4
02,0
19
2,5
91,4
24
64,3
01
20,0
52
-70,6
96
7,3
82,8
85
267,6
42
-5,0
19
Singl
e P
rem
ium
11,8
51,2
43
--
49,6
59
19,4
97
57,8
79
10,8
93,8
17
829,3
91
-1,0
00
Tota
l Pre
miu
m53,0
99,9
71
3,5
35,5
62
67,6
80
100,4
53
19,4
97
313,0
98
46,9
23,2
50
1,7
51,6
65
68,1
34
320,6
32
Pre
miu
m In
com
e fro
m B
usi
ness
wri
tten:
In India
53,0
99,9
71
3,5
35,5
62
67,6
80
100,4
53
19,4
97
313,0
98
46,9
23,2
50
1,7
51,6
65
68,1
34
320,6
32
Outs
ide I
ndia
--
--
--
--
--
Tota
l Pre
miu
m53,0
99,9
71
3,5
35,5
62
67,6
80
100,4
53
19,4
97
313,0
98
46,9
23,2
50
1,7
51,6
65
68,1
34
320,6
32
Part
icula
rsPre
vio
us
Year
Part
icip
ati
ng
Non P
art
icip
ati
ng
Lin
ked
Indiv
idual
Indiv
idual
Indiv
idual
Indiv
idual
Gro
up
Indiv
idual
Indiv
idual
Gro
up S
uper-
Gro
up
Ass
ura
nce
Pensi
on
Ass
ura
nce
Annuit
yAss
ura
nce
Ass
ura
nce
Pensi
on
annuati
on
Gra
tuit
y
Fir
st Y
ear
Pre
miu
m12,0
92,6
32
1,3
52,9
66
5,6
24
31,0
80
-86,4
00
10,1
82,7
25
309,8
87
37,4
28
86,5
22
Renew
al P
rem
ium
4,1
68,0
78
1,9
35,1
04
61,8
97
8,0
25
-38,9
21
2,0
02,0
67
118,0
25
526
3,5
13
Singl
e P
rem
ium
15,0
75,0
68
--
76,6
88
18,1
43
35,5
32
14,5
85,0
08
359,6
97
--
Tota
l Pre
miu
m31,3
35,7
78
3,2
88,0
70
67,5
21
115,7
93
18,1
43
160,8
53
26,7
69,8
00
787,6
09
37,9
54
90,0
35
Pre
miu
m In
com
e fro
m B
usi
ness
wri
tten:
In India
31,3
35,7
78
3,2
88,0
70
67,5
21
115,7
93
18,1
43
160,8
53
26,7
69,8
00
787,6
09
37,9
54
90,0
35
Outs
ide I
ndia
--
--
--
--
--
Tota
l Pre
miu
m31,3
35,7
78
3,2
88,0
70
67,5
21
115,7
93
18,1
43
160,8
53
26,7
69,8
00
787,6
09
37,9
54
90,0
35
22
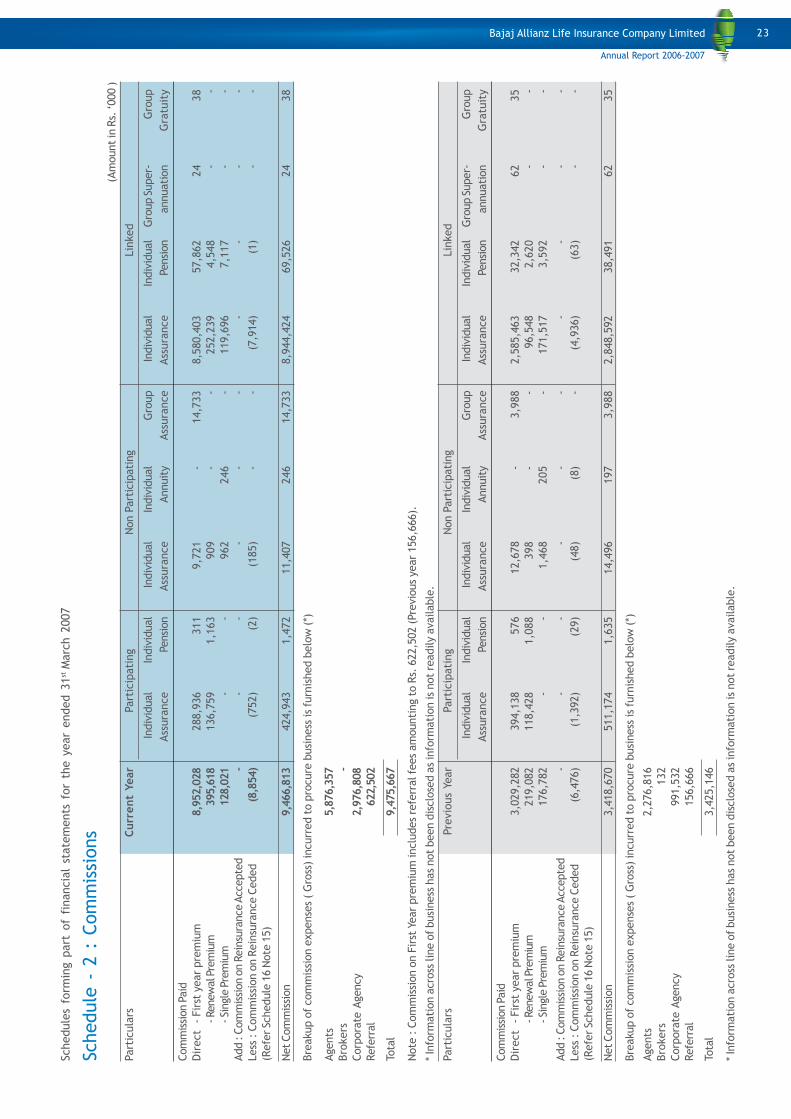
Schedule
s fo
rmin
g p
art
of
financia
l st
ate
ments
for
the y
ear
ended 3
1st M
arc
h 2
007
Schedule
- 2
: C
om
mis
sions
(Am
ount in
Rs.
‘000 )
Part
icula
rsC
urr
en
t Year
Part
icip
ati
ng
Non P
art
icip
ati
ng
Lin
ked
Indiv
idual
Indiv
idual
Indiv
idual
Indiv
idual
Gro
up
Indiv
idual
Indiv
idual
Gro
up S
uper-
Gro
up
Ass
ura
nce
Pensi
on
Ass
ura
nce
Annuit
yAss
ura
nce
Ass
ura
nce
Pensi
on
annuati
on
Gra
tuit
y
Com
mis
sion P
aid
Dir
ect
- Fir
st y
ear
pre
miu
m8,9
52,0
28
288,9
36
311
9,7
21
-14,7
33
8,5
80,4
03
57,8
62
24
38
- Renew
al P
rem
ium
395,6
18
136,7
59
1,1
63
909
--
252,2
39
4,5
48
--
- Si
ngl
e P
rem
ium
128,0
21
--
962
246
-119,6
96
7,1
17
--
Add : C
om
mis
sion o
n R
ein
sura
nce
Acc
epte
d-
--
--
--
--
-
Less
: C
om
mis
sion o
n R
ein
sura
nce C
eded
(8,8
54)
(752)
(2)
(185)
--
(7,9
14)
(1)
--
(Refe
r Sc
hedule
16 N
ote
15)
Net Com
mis
sion
9,4
66,8
13
424,9
43
1,4
72
11,4
07
246
14,7
33
8,9
44,4
24
69,5
26
24
38
Bre
akup o
f com
mis
sion e
xpense
s (
Gro
ss)
incurr
ed t
o p
rocure
busi
ness
is
furn
ished b
elo
w (
*)
Agents
5,8
76,3
57
Bro
kers
-
Corp
ora
te A
gency
2,9
76,8
08
Refe
rral
622,5
02
Tota
l9,4
75,6
67
Note
: C
om
mis
sion o
n F
irst
Year
pre
miu
m inclu
des
refe
rral fe
es
am
ounti
ng t
o R
s. 6
22,5
02 (
Pre
vio
us
year
156,6
66).
* In
form
ati
on a
cro
ss lin
e o
f busi
ness
has
not
been d
isclo
sed a
s in
form
ati
on is
not
readily a
vailable
.
Part
icula
rsPre
vio
us
Year
Part
icip
ati
ng
Non P
art
icip
ati
ng
Lin
ked
Indiv
idual
Indiv
idual
Indiv
idual
Indiv
idual
Gro
up
Indiv
idual
Indiv
idual
Gro
up S
uper-
Gro
up
Ass
ura
nce
Pensi
on
Ass
ura
nce
Annuit
yAss
ura
nce
Ass
ura
nce
Pensi
on
annuati
on
Gra
tuit
y
Com
mis
sion P
aid
Dir
ect
- Fir
st y
ear
pre
miu
m3,0
29,2
82
394,1
38
576
12,6
78
-3,9
88
2,5
85,4
63
32,3
42
62
35
- Renew
al P
rem
ium
219,0
82
118,4
28
1,0
88
398
--
96,5
48
2,6
20
--
- Si
ngl
e P
rem
ium
176,7
82
--
1,4
68
205
-171,5
17
3,5
92
--
Add : C
om
mis
sion o
n R
ein
sura
nce
Acc
epte
d-
--
--
--
--
-
Less
: C
om
mis
sion o
n R
ein
sura
nce C
eded
(6,4
76)
(1,3
92)
(29)
(48)
(8)
-(4
,936)
(63)
--
(Refe
r Sc
hedule
16 N
ote
15)
Net Com
mis
sion
3,4
18,6
70
511,1
74
1,6
35
14,4
96
197
3,9
88
2,8
48,5
92
38,4
91
62
35
Bre
akup o
f com
mis
sion e
xpense
s (
Gro
ss)
incurr
ed t
o p
rocure
busi
ness
is
furn
ished b
elo
w (
*)
Agents
2,2
76,8
16
Bro
kers
132
Corp
ora
te A
gency
991,5
32
Refe
rral
156,6
66
Tota
l3,4
25,1
46
* In
form
ati
on a
cro
ss lin
e o
f busi
ness
has
not
been d
isclo
sed a
s in
form
ati
on is
not
readily a
vailable
.
23
Schedule
s fo
rmin
g p
art
of
financia
l st
ate
ments
for
the y
ear
ended 3
1st M
arc
h 2
007
Schedule
- 3
: O
pera
ting E
xpense
s Rela
ted T
o I
nsu
rance B
usi
ness
(Refe
r Sc
hedule
16 N
ote
10)
(Am
ount in
Rs.
‘000 )
Part
icula
rsC
urr
en
t Year
Part
icip
ati
ng
Non P
art
icip
ati
ng
Lin
ked
Indiv
idual
Indiv
idual
Indiv
idual
Indiv
idual
Gro
up
Indiv
idual
Indiv
idual
Gro
up S
uper-
Gro
up
Ass
ura
nce
Pensi
on
Ass
ura
nce
Annuit
yAss
ura
nce
Ass
ura
nce
Pensi
on
annuati
on
Gra
tuit
y
Em
plo
yees’
rem
unera
tion, w
elf
are
benefits
and o
ther
manpow
er
cost
s4,4
39,4
39
375,2
09
4,5
85
9,0
12
230
3,6
90
3,9
39,1
61
102,6
87
803
4,0
62
Travel,
conveyance a
nd v
ehic
le r
unnin
g316,6
00
26,7
58
327
643
16
263
280,9
23
7,3
23
57
290
expense
s
Train
ing e
xpense
s578,3
48
48,8
80
597
1,1
74
30
481
513,1
74
13,3
78
105
529
Rents
, ra
tes
and t
axes
1,3
13,9
17
113,2
41
1,2
39
2,7
83
68
1,1
90
1,1
66,1
35
28,0
10
206
1,0
45
Repair
s93,8
14
7,9
29
97
190
578
83,2
42
2,1
70
17
86
Pri
nti
ng a
nd S
tati
onery
216,1
36
18,2
67
223
439
11
180
191,7
80
4,9
99
39
198
Com
munic
ati
on e
xpense
s1,0
37,0
40
87,6
48
1,0
71
2,1
05
54
862
920,1
76
23,9
87
188
949
Legal and p
rofe
ssio
nal charg
es
13,4
23
1,1
35
14
27
111
11,9
11
310
212
Medic
al fe
es
49,4
86
4,1
82
51
100
341
43,9
10
1,1
45
945
Audit
ors
’ fe
es,
expense
s, e
tc.
a)
as
audit
or
1,5
00
126
23
-1
1,3
32
35
-1
b)
as
advis
or
or
in a
ny o
ther
capacit
y,
in r
esp
ect
of
(i)
Taxati
on M
att
ers
--
--
--
--
--
(ii)
Insu
rance M
att
ers
--
--
--
--
--
(iii)M
anagem
ent
Serv
ices;
and
--
--
--
--
--
c)
in a
ny o
ther
capacit
y-
--
--
--
--
-
d)
out
of
expense
s376
32
--
--
335
9-
-
Adve
rtis
em
ent and p
ublicit
y164,6
74
13,9
17
170
334
9137
146,1
17
3,8
09
30
151
Inte
rest
and b
ank c
harg
es
119,2
84
10,0
82
123
242
699
105,8
42
2,7
59
22
109
Oth
ers
a)
Info
rmati
on t
echnolo
gy e
xpense
s227,6
93
19,2
44
235
462
12
189
202,0
35
5,2
67
41
208
b)
Insu
rance,
wate
r and e
lectr
icit
y96,2
17
8,1
32
99
195
580
85,3
75
2,2
26
17
88
charg
es
c)
Policy sta
mps
78,6
97
6,6
51
81
160
465
69,8
30
1,8
20
14
72
d)
Securi
ty a
nd h
ouse
keepin
g68,3
92
5,7
80
70
139
457
60,6
85
1,5
82
12
63
e)
Mark
eti
ng e
xpense
s1,3
32,7
95
112,6
44
1,3
77
2,7
06
69
1,1
08
1,1
82,6
02
30,8
28
241
1,2
20
f)M
iscellaneous expense
s396,0
87
20,3
03
302
593
15
243
364,1
74
9,8
33
273
351
Depre
cia
tion (Refe
r Sc
hedule
10)
186,2
71
15,7
43
192
378
10
155
165,2
80
4,3
09
34
170
Tota
l10,7
30,1
89
895,9
03
10,8
55
21,6
85
552
8,9
30
9,5
34,0
19
246,4
86
2,1
10
9,6
49
24
Schedule
s fo
rmin
g p
art
of
financia
l st
ate
ments
for
the y
ear
ended 3
1st M
arc
h 2
007
Schedule
- 3
: O
pera
ting E
xpense
s Rela
ted t
o I
nsu
rance B
usi
ness
(Refe
r Sc
hedule
16 N
ote
10)
(Am
ount in
Rs.
‘000 )
Part
icula
rsPre
vio
us
Year
Part
icip
ati
ng
Non P
art
icip
ati
ng
Lin
ked
Indiv
idual
Indiv
idual
Indiv
idual
Indiv
idual
Gro
up
Indiv
idual
Indiv
idual
Gro
up S
uper-
Gro
up
Ass
ura
nce
Pensi
on
Ass
ura
nce
Annuit
yAss
ura
nce
Ass
ura
nce
Pensi
on
annuati
on
Gra
tuit
y
Em
plo
yees’
rem
unera
tion, w
elf
are
benefits
and o
ther
manpow
er
cost
s2,0
95,6
28
456,4
28
5,2
42
9,2
21
210
2,0
96
1,5
70,4
56
50,2
99
419
1,2
57
Travel,
conveyance a
nd v
ehic
le r
unnin
g
expense
s243,3
37
52,9
99
608
1,0
71
24
243
182,3
57
5,8
40
49
146
Train
ing e
xpense
s339,6
02
73,9
65
849
1,4
94
34
340
254,4
98
8,1
50
68
204
Rents
, ra
tes
and t
axes
242,8
36
46,3
56
401
1,0
56
21
256
190,1
55
4,4
79
29
83
Repair
s58,4
61
12,7
33
146
257
658
43,8
11
1,4
03
12
35
Pri
nti
ng a
nd S
tati
onery
92,2
11
20,0
84
231
406
992
69,1
03
2,2
13
18
55
Com
munic
ati
on e
xpense
s226,3
87
49,3
07
566
996
23
226
169,6
55
5,4
33
45
136
Legal and p
rofe
ssio
nal charg
es
9,1
25
1,9
87
23
40
19
6,8
39
219
25
Medic
al fe
es
30,6
42
6,6
74
77
135
331
22,9
63
735
618
Audit
ors
’ fe
es,
expense
s, e
tc.
(a)
as
audit
or
1,0
00
218
25
-1
749
24
-1
(b)
as
advis
or
or
in a
ny o
ther
capacit
y,
in r
esp
ect
of
(i)
Taxati
on M
att
ers
200
44
1-
--
150
5-
-
(ii)
Insu
rance M
att
ers
--
--
--
--
--
(iii)M
anagem
ent
Serv
ices;
and
--
--
--
--
--
(c)
in a
ny o
ther
capacit
y-
--
--
--
--
-
(d)
Out
of
expense
s372
81
12
--
279
9-
-
Adve
rtis
em
ent and p
ublicit
y176,8
96
38,5
28
442
778
18
177
132,5
66
4,2
46
35
106
Inte
rest
and B
ank C
harg
es
60,7
11
13,2
23
152
267
661
45,4
97
1,4
57
12
36
Oth
ers
a)
Info
rmati
on t
echnolo
gy e
xpense
s110,9
82
24,1
72
277
488
11
111
83,1
70
2,6
64
22
67
b)
Insu
rance,
wate
r and e
lectr
icit
y56,5
06
12,3
07
141
249
657
42,3
45
1,3
56
11
34
charg
es
c)
Policy sta
mps
38,5
07
8,3
87
96
169
439
28,8
57
924
823
d)
Securi
ty a
nd h
ouse
keepin
g28,3
12
6,1
66
71
125
328
21,2
17
679
617
e)
Mark
eti
ng e
xpense
s489,7
43
106,6
66
1,2
24
2,1
55
49
490
367,0
13
11,7
54
98
294
f)M
iscellaneous expense
s458,4
88
99,8
91
1,1
45
2,0
17
46
455
343,5
65
11,0
02
91
276
Depre
cia
tion (Refe
r Sc
hedule
10)
108,1
64
23,5
58
270
476
11
108
81,0
58
2,5
96
22
65
4,8
68,1
10
1,0
53,7
74
11,9
65
21,4
07
485
4,8
78
3,6
56,3
03
115,4
87
953
2,8
58
25
Schedule
s fo
rmin
g p
art
of
financia
l st
ate
ments
for
the y
ear
ended 3
1st M
arc
h 2
007
Schedule
- 4
: B
enefi
ts p
aid
(net)
(Am
ount in
Rs.
‘000 )
Part
icula
rsC
urr
en
t Year
Part
icip
ati
ng
Non P
art
icip
ati
ng
Lin
ked
Indiv
idual
Indiv
idual
Indiv
idual
Indiv
idual
Gro
up
Indiv
idual
Indiv
idual
Gro
up S
uper-
Gro
up
Ass
ura
nce
Pensi
on
Ass
ura
nce
Annuit
yAss
ura
nce
Ass
ura
nce
Pensi
on
annuati
on
Gra
tuit
y
Insu
rance C
laim
s:(a
)Cla
ims by D
eath
601,2
22
120,7
50
1,2
16
10,0
67
-205,9
01
192,4
66
62,1
73
1,6
49
7,0
00
(b)
Cla
ims
by M
atu
rity
184,1
54
183,9
35
-219
--
--
--
(c)
Annuit
ies/
Pensi
ons paym
ent
1,8
36
7-
283
1,5
46
--
--
-(d
)U
L W
ithdra
wals
/Su
rrenders
&O
ther
Benefi
ts6,2
28,6
62
22,1
22
480
2,8
05
--
5,9
51,9
46
223,9
67
12,4
51
14,8
91
(Am
ount
ceded in rein
sura
nce):
(a)
Cla
ims by D
eath
(19,4
43)
(12,7
78)
(358)
(564)
-(2
,405)
(3,3
38)
--
-(b
)Cla
ims
by M
atu
rity
--
--
--
--
--
(c)
Annuit
ies/
Pensi
ons paym
ent
--
--
--
--
--
(d)
UL W
ithdra
wals
/Su
rrenders
&O
ther
Benefi
ts(1
1,0
80)
(10,7
60)
-(3
20)
--
--
--
Am
ount
accepte
d in r
ein
sura
nce:
(a)
Cla
ims by D
eath
--
--
--
--
--
(b)
Cla
ims
by M
atu
rity
--
--
--
--
--
(c)
Annuit
ies/
Pensi
ons paym
ent,
--
--
--
--
--
(d)
UL W
ithdra
wals
/Su
rrenders
&O
ther
Benefi
ts-
--
--
--
--
-
Tota
l6,9
85,3
51
303,2
76
1,3
38
12,4
90
1,5
46
203,4
96
6,1
41,0
74
286,1
40
14,1
00
21,8
91
Benefi
ts p
aid
to c
laim
ants
:In
India
6,9
85,3
51
303,2
76
1,3
38
12,4
90
1,5
46
203,4
96
6,1
41,0
74
286,1
40
14,1
00
21,8
91
Outs
ide I
ndia
--
--
--
--
--
Tota
l6,9
85,3
51
303,2
76
1,3
38
12,4
90
1,5
46
203,4
96
6,1
41,0
74
286,1
40
14,1
00
21,8
91
Part
icula
rsPre
vio
us
Year
Part
icip
ati
ng
Non P
art
icip
ati
ng
Lin
ked
Indiv
idual
Indiv
idual
Indiv
idual
Indiv
idual
Gro
up
Indiv
idual
Indiv
idual
Gro
up S
uper-
Gro
up
Ass
ura
nce
Pensi
on
Ass
ura
nce
Annuit
yAss
ura
nce
Ass
ura
nce
Pensi
on
annuati
on
Gra
tuit
y
Insu
rance C
laim
s:(a
)Cla
ims by D
eath
162,8
14
48,7
52
636
5,6
78
-41,7
88
64,7
35
1,2
25
--
(b)
Cla
ims
by M
atu
rity
59,9
69
59,9
69
--
--
--
--
(c)
Annuit
ies/
Pensi
ons paym
ent
551
--
36
515
--
--
-(d
)U
L W
ithdra
wals
/Su
rrenders
&O
ther
Benefi
ts6,3
33,9
50
12,3
19
80
262
--
6,2
22,8
81
70,2
36
7,4
13
20,7
59
(Am
ount
ceded in rein
sura
nce):
(a)
Cla
ims by D
eath
(16,3
43)
(3,6
19)
-(5
30)
-(5
0)
(12,0
44)
(100)
--
(b)
Cla
ims
by M
atu
rity
--
--
--
--
--
(c)
Annuit
ies/
Pensi
ons paym
ent
--
--
--
--
--
(d)
UL W
ithdra
wals
/Su
rrenders
&O
ther
Benefi
ts(6
,103)
(5,5
22)
-(5
81)
--
--
--
Am
ount
accepte
d in r
ein
sura
nce:
(a)
Cla
ims by D
eath
--
--
--
--
--
(b)
Cla
ims
by M
atu
rity
--
--
--
--
--
(c)
Annuit
ies/
Pensi
ons paym
ent
--
--
--
--
--
(d)
UL W
ithdra
wals
/Su
rrenders
&O
ther
Benefi
ts-
--
--
--
--
-
Tota
l6,5
34,8
38
111,8
99
716
4,8
65
515
41,7
38
6,2
75,5
72
71,3
61
7,4
13
20,7
59
Benefi
ts p
aid
to c
laim
ants
:In
India
6,5
34,8
38
111,8
99
716
4,8
65
515
41,7
38
6,2
75,5
72
71,3
61
7,4
13
20,7
59
Outs
ide I
ndia
--
--
--
--
--
Tota
l6,5
34,8
38
111,8
99
716
4,8
65
515
41,7
38
6,2
75,5
72
71,3
61
7,4
13
20,7
59
26
Schedules forming part of financial statements for the year ended 31st March 2007
Schedule - 5A : Pattern of Shareholding (As Certified by Management)
Shareholder Current Year Previous Year
Number of % of Number of % of
Shares Holding Shares Holding
PROMOTERS:
Indian
Bajaj Auto Limited 111,272,320 74 111,173,012 74
Foreign
Allianz SE 39,095,680 26 39,060,788 26
TOTAL 150,368,000 100 150,233,800 100
Schedules forming part of financial statements for the year ended 31st March 2007
Schedule - 5 : Share Capital
(Amount in Rs. ‘000 )
Particulars Current Year Previous Year
Authorised Capital
200,000,000 Equity Shares of Rs. 10/- Each 2,000,000 2,000,000
Issued, Subscribed, Called and Paid up Capital 1,503,680 1,502,338
Equity Shares of Rs. 10/- Each
150,368,000 (Previous Year 150,233,800) Equity Shares of Rs.10/- Each
Less : Preliminary Expenses (to the extent not written off) - -
Total 1,503,680 1,502,338
Note : Of the above share capital as of 31st March 2007, 111,272,320 (Previous year: 111,173,012) equity shares are held by the
holding company, Bajaj Auto Ltd.
27
Schedules forming part of financial statements for the year ended 31st March 2007
Schedule - 7 : Borrowings
(Amount in Rs. ‘000 )
Particulars Current Year Previous Year
Debentures/Bonds - -
Banks - -
Financial Institutions - -
Others - -
TOTAL - -
Schedules forming part of financial statements for the year ended 31st March 2007
Schedule - 6 : Reserves and Surplus
(Amount in Rs. ‘000 )
Particulars Current Year Current Year Previous Year Previous Year
Capital Reserve - -
Capital Redemption Reserve - -
Share Premium - -
Opening balance 3,495,310 1,176,565
Add: Share Premium received during the year 2,006,290 5,501,600 2,318,745 3,495,310
Revaluation Reserve - -
General Reserve - -
Catastrophe Reserve - -
Other Reserve - -
Balance of Profit & Loss Account - -
Total 5,501,600 3,495,310
28
Schedules forming part of financial statements for the year ended 31st March 2007
Schedule - 8 : Investments - Shareholders’
(Amount in Rs. ‘000 )
Particulars Current Year Previous Year
LONG TERM INVESTMENTS
Government securities and Government 910,129 472,900
guaranteed bonds including Treasury Bills
(Refer Note 1 below)
Other Approved Securities - -
Other Investments
(a) Shares
(aa) Equity - -
(bb)Preference - -
(b) Mutual Funds - -
(c) Derivative Instruments - -
(d) Debentures / Bonds 473,914 200,041
(e) Other Securities
(aa) Fixed Deposit with banks 250,000 -
(f) Subsidiaries - -
Investment Properties - Real Estate - -
Investments in Infrastructure and Social Sector Bonds 789,598 463,767
Other than Approved Investments 169,102 134,775
SHORT TERM INVESTMENTS
Government securities and Government 1,722,015 345,167
guaranteed bonds including Treasury Bills
Other Approved Securities - -
Other Investments - -
(a) Shares
(aa) Equity - -
(bb)Preference - -
(b) Mutual Funds 235,902 155,953
(c) Derivative Instruments - -
(d) Debentures / Bonds 1,269,615 694,092
(e) Other Securities
(aa) Fixed Deposit with banks 200,000 -
(f) Subsidiaries - -
Investment Properties - Real Estate - -
Investments in Infrastructure and Social Sector Bonds 491,089 314,173
Other than Approved Investments 25,136 -
Total 6,536,500 2,780,868
INVESTMENTS
In India 6,536,500 2,780,868
Outside India - -
Total 6,536,500 2,780,868
Notes :
1. Includes Rs. 106,040 (Previous Year Rs. 108,576 ) deposited with Deutsche Bank AG, pursuant to Section 7 of the Insurance
Act 1938 (Refer Schedule 16 Note 6 )
2. Market Value of the above total investments of Rs. 6,536,500 (Previous Year Rs.27,80,868 ) is Rs. 6,480,926 (Previous Year
Rs. 2,762,263)
3. Historical cost of investment valued on fair value basis is Rs. 235,817 ( Previous Year Rs. 155,242)
29
Schedule
s fo
rmin
g p
art
of
financia
l st
ate
ments
for
the y
ear
ended 3
1st M
arc
h 2
007
Schedule
- 8
A :
Invest
ments
- P
olicyhold
ers
’(A
mount in
Rs.
‘000 )
Part
icula
rsC
urr
en
t Year
Part
icip
ati
ng
Non P
art
icip
ati
ng
Lin
ked
Indiv
idual
Indiv
idual
Indiv
idual
Indiv
idual
Gro
up
Indiv
idual
Indiv
idual
Gro
up S
uper-
Gro
up
Ass
ura
nce
Pensi
on
Ass
ura
nce
Annuit
yAss
ura
nce
Ass
ura
nce
Pensi
on
annuati
on
Gra
tuit
y
LO
NG
TERM
INVEST
MEN
TS
Govern
ment
securi
ties
and G
overn
ment
5,0
56,8
45
3,6
89,6
42
185,1
01
147,8
71
50,9
00
155,9
32
817,4
60
8,5
63
1,0
36
340
guara
nte
ed b
onds
inclu
din
g T
reasu
ry B
ills
Oth
er
Appro
ved S
ecuri
ties
(a)
Share
s(a
a)
Equit
y597,8
47
597,8
47
--
--
--
--
(bb) Pre
fere
nce
--
--
--
--
--
(b)
Mutu
al fu
nds
--
--
--
--
--
(c)
Deri
vati
ve I
nst
rum
ents
--
--
--
--
--
(d)
Debentu
res
/ B
onds
776,9
43
736,9
43
10,0
00
--
-30,0
00
--
-(e
)O
ther
Securi
ties
(aa)
Fix
ed D
eposi
ts w
ith B
anks
50,0
00
--
--
-50,0
00
--
-(f
)Su
bsi
dia
ries
--
--
--
--
--
(g)
Invest
ment
Pro
pert
ies
- Real Est
ate
167,4
65
167,4
65
--
--
--
--
Invest
ments
in I
nfr
ast
ructu
re &
Socia
l Se
cto
r Bonds
1,0
00,5
77
770,6
00
25,0
00
35,0
00
-3,8
93
165,5
00
-195
389
Oth
er
than A
ppro
ved Invest
ments
- Bonds
100,0
00
100,0
00
--
--
--
--
- Equit
y-
--
--
--
--
-
SHO
RT T
ERM
INVEST
MEN
TS
Govern
ment
securi
ties
and G
overn
ment
435,5
24
--
25,3
12
-55,4
83
339,9
59
12,5
49
1,3
79
842
guara
nte
ed b
onds
inclu
din
g T
reasu
ry B
ills
Oth
er
Appro
ved S
ecuri
ties
--
--
--
--
--
(a)
Share
s(a
a)
Equit
y-
--
--
--
--
-(b
b) Pre
fere
nce
--
--
--
--
--
(b)
Mutu
al Funds
--
--
--
--
--
(c)
Deri
vati
ve I
nst
rum
ents
--
--
--
--
--
(d)
Debentu
res
/ B
onds
664,9
55
50,0
00
--
-15,9
89
598,9
66
--
-(e
)O
ther
Securi
ties
--
--
--
--
--
(f)
Subsi
dia
ries
--
--
--
--
--
(g)
Invest
ment
Pro
pert
ies
- Real Est
ate
--
--
--
--
--
Invest
ments
in I
nfr
ast
ructu
re &
Socia
l Se
cto
r Bonds
200,6
02
50,2
27
--
--
150,3
75
--
-
Oth
er
than A
ppro
ved Invest
ments
--
--
--
--
--
TO
TAL
9,0
50,7
58
6,1
62,7
24
220,1
01
208,1
83
50,9
00
231,2
97
2,1
52,2
60
21,1
12
2,6
10
1,5
71
In India
9,0
50,7
58
6,1
62,7
24
220,1
01
208,1
83
50,9
00
231,2
97
2,1
52,2
60
21,1
12
2,6
10
1,5
71
Outs
ide I
ndia
--
--
--
--
--
Tota
l9,0
50,7
58
6,1
62,7
24
220,1
01
208,1
83
50,9
00
231,2
97
2,1
52,2
60
21,1
12
2,6
10
1,5
71
Note
:1.
Mark
et
Valu
e o
f th
e a
bove t
ota
l in
vest
ments
of
Rs.
9,0
50,7
58 (
Pre
vio
us
year
Rs.
4,7
66,1
23)
is R
s. 8
,751,3
12 (
Pre
vio
us
year
Rs.
4,6
71,9
56)
2.
His
tori
cal cost
of
invest
ment
valu
ed o
n f
air
valu
e b
asi
s is
Rs.
582,4
04 (
Pre
vio
us
year
Rs.
175,9
27)
30
Schedule
s fo
rmin
g p
art
of
financia
l st
ate
ments
for
the y
ear
ended 3
1st M
arc
h 2
007
Schedule
- 8
A :
Invest
ments
- P
olicyhold
ers
’(A
mount in
Rs.
‘000 )
Part
icula
rsPre
vio
us
Year
Part
icip
ati
ng
Non P
art
icip
ati
ng
Lin
ked
Indiv
idual
Indiv
idual
Indiv
idual
Indiv
idual
Gro
up
Indiv
idual
Indiv
idual
Gro
up S
uper-
Gro
up
Ass
ura
nce
Pensi
on
Ass
ura
nce
Annuit
yAss
ura
nce
Ass
ura
nce
Pensi
on
annuati
on
Gra
tuit
y
LO
NG
TERM
INVEST
MEN
TS
Govern
ment
securi
ties
and G
overn
ment
3,4
23,8
49
2,8
97,9
57
150,7
22
133,4
09
30,4
78
30,3
82
170,7
74
8,8
49
1,0
34
244
guara
nte
ed b
onds
inclu
din
g T
reasu
ry B
ills
Oth
er
Appro
ved S
ecuri
ties
(a)
Share
s(a
a)
Equit
y188,9
15
188,9
15
--
--
--
--
(bb) Pre
fere
nce
--
--
--
--
--
(b)
Mutu
al fu
nds
--
--
--
--
--
(c)
Deri
vati
ve I
nst
rum
ents
--
--
--
--
--
(d)
Debentu
res
/ B
onds
352,6
43
302,9
98
--
--
49,6
45
--
-(e
)O
ther
Securi
ties
--
--
--
--
--
(f)
Subsi
dia
ries
--
--
--
--
--
(g)
Invest
ment
Pro
pert
ies
- Real Est
ate
--
--
--
--
--
Invest
ments
in I
nfr
ast
ructu
re &
641,1
68
467,2
52
-8,7
39
--
165,1
77
--
-So
cia
l Se
cto
r Bonds
Oth
er
than A
ppro
ved Invest
ments
- Equit
y-
--
--
--
--
--
Bonds
--
--
--
--
--
SHO
RT T
ERM
INVEST
MEN
TS
Govern
ment
securi
ties
and G
overn
ment
49,6
40
--
--
49,6
40
--
--
guara
nte
ed b
onds
inclu
din
g T
reasu
ry B
ills
Oth
er
Appro
ved S
ecuri
ties
(a)
Share
s(a
a)
Equit
y-
--
--
--
--
-(b
b) Pre
fere
nce
--
--
--
--
--
(b)
Mutu
al Funds
--
--
--
--
--
(c)
Deri
vati
ve I
nst
rum
ents
--
--
--
--
--
(d)
Debentu
res
/ B
onds
84,8
09
36,5
00
--
-33,0
53
14,5
53
503
100
100
(e)
Oth
er
Securi
ties
--
--
--
--
--
(f)
Subsi
dia
ries
--
--
--
--
--
(g)
Invest
ment
Pro
pert
ies
- Real Est
ate
--
--
--
--
--
Invest
ments
in I
nfr
ast
ructu
re &
25,0
99
--
--
25,0
99
--
--
Socia
l Se
cto
r Bonds
Oth
er
than A
ppro
ved Invest
ments
--
--
--
--
--
TO
TAL
4,7
66,1
23
3,8
93,6
22
150,7
22
142,1
48
30,4
78
138,1
74
400,1
49
9,3
52
1,1
34
344
In India
4,7
66,1
23
3,8
93,6
22
150,7
22
142,1
48
30,4
78
138,1
74
400,1
49
9,3
52
1,1
34
344
Outs
ide I
ndia
--
--
--
--
--
Tota
l4,7
66,1
23
3,8
93,6
22
150,7
22
142,1
48
30,4
78
138,1
74
400,1
49
9,3
52
1,1
34
344
Note
:1.
Mark
et
Valu
e o
f th
e a
bove t
ota
l in
vest
ments
of
Rs.
9,0
50,7
58 (
Pre
vio
us
year
Rs.
4,7
66,1
23)
is R
s. 8
,751,3
12 (
Pre
vio
us
year
Rs.
4,6
71,9
56)
2.
His
tori
cal cost
of
invest
ment
valu
ed o
n f
air
valu
e b
asi
s is
Rs.
582,4
04 (
Pre
vio
us
year
Rs.
175,9
27)
31
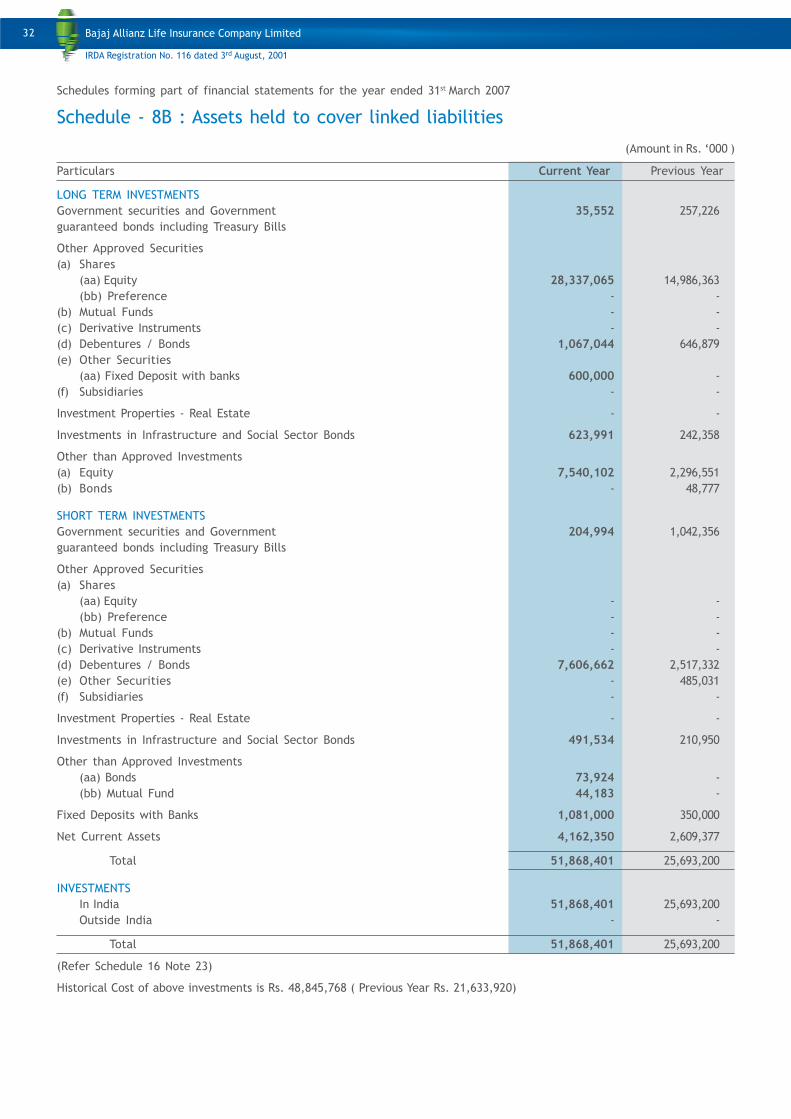
Schedules forming part of financial statements for the year ended 31st March 2007
Schedule - 8B : Assets held to cover linked liabilities
(Amount in Rs. ‘000 )
Particulars Current Year Previous Year
LONG TERM INVESTMENTS
Government securities and Government 35,552 257,226
guaranteed bonds including Treasury Bills
Other Approved Securities
(a) Shares
(aa) Equity 28,337,065 14,986,363
(bb) Preference - -
(b) Mutual Funds - -
(c) Derivative Instruments - -
(d) Debentures / Bonds 1,067,044 646,879
(e) Other Securities
(aa) Fixed Deposit with banks 600,000 -
(f) Subsidiaries - -
Investment Properties - Real Estate - -
Investments in Infrastructure and Social Sector Bonds 623,991 242,358
Other than Approved Investments
(a) Equity 7,540,102 2,296,551
(b) Bonds - 48,777
SHORT TERM INVESTMENTS
Government securities and Government 204,994 1,042,356
guaranteed bonds including Treasury Bills
Other Approved Securities
(a) Shares
(aa) Equity - -
(bb) Preference - -
(b) Mutual Funds - -
(c) Derivative Instruments - -
(d) Debentures / Bonds 7,606,662 2,517,332
(e) Other Securities - 485,031
(f) Subsidiaries - -
Investment Properties - Real Estate - -
Investments in Infrastructure and Social Sector Bonds 491,534 210,950
Other than Approved Investments
(aa) Bonds 73,924 -
(bb) Mutual Fund 44,183 -
Fixed Deposits with Banks 1,081,000 350,000
Net Current Assets 4,162,350 2,609,377
Total 51,868,401 25,693,200
INVESTMENTS
In India 51,868,401 25,693,200
Outside India - -
Total 51,868,401 25,693,200
(Refer Schedule 16 Note 23)
Historical Cost of above investments is Rs. 48,845,768 ( Previous Year Rs. 21,633,920)
32
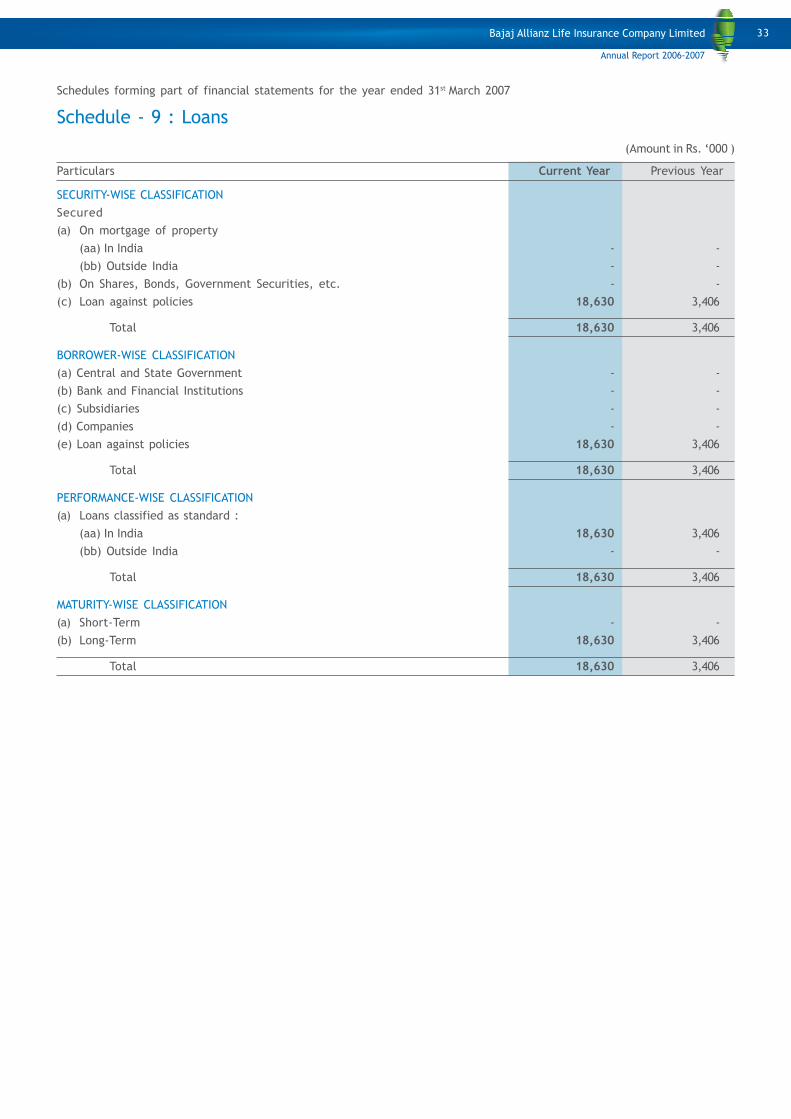
Schedules forming part of financial statements for the year ended 31st March 2007
Schedule - 9 : Loans
(Amount in Rs. ‘000 )
Particulars Current Year Previous Year
SECURITY-WISE CLASSIFICATION
Secured
(a) On mortgage of property
(aa) In India - -
(bb) Outside India - -
(b) On Shares, Bonds, Government Securities, etc. - -
(c) Loan against policies 18,630 3,406
Total 18,630 3,406
BORROWER-WISE CLASSIFICATION
(a) Central and State Government - -
(b) Bank and Financial Institutions - -
(c) Subsidiaries - -
(d) Companies - -
(e) Loan against policies 18,630 3,406
Total 18,630 3,406
PERFORMANCE-WISE CLASSIFICATION
(a) Loans classified as standard :
(aa) In India 18,630 3,406
(bb) Outside India - -
Total 18,630 3,406
MATURITY-WISE CLASSIFICATION
(a) Short-Term - -
(b) Long-Term 18,630 3,406
Total 18,630 3,406
33
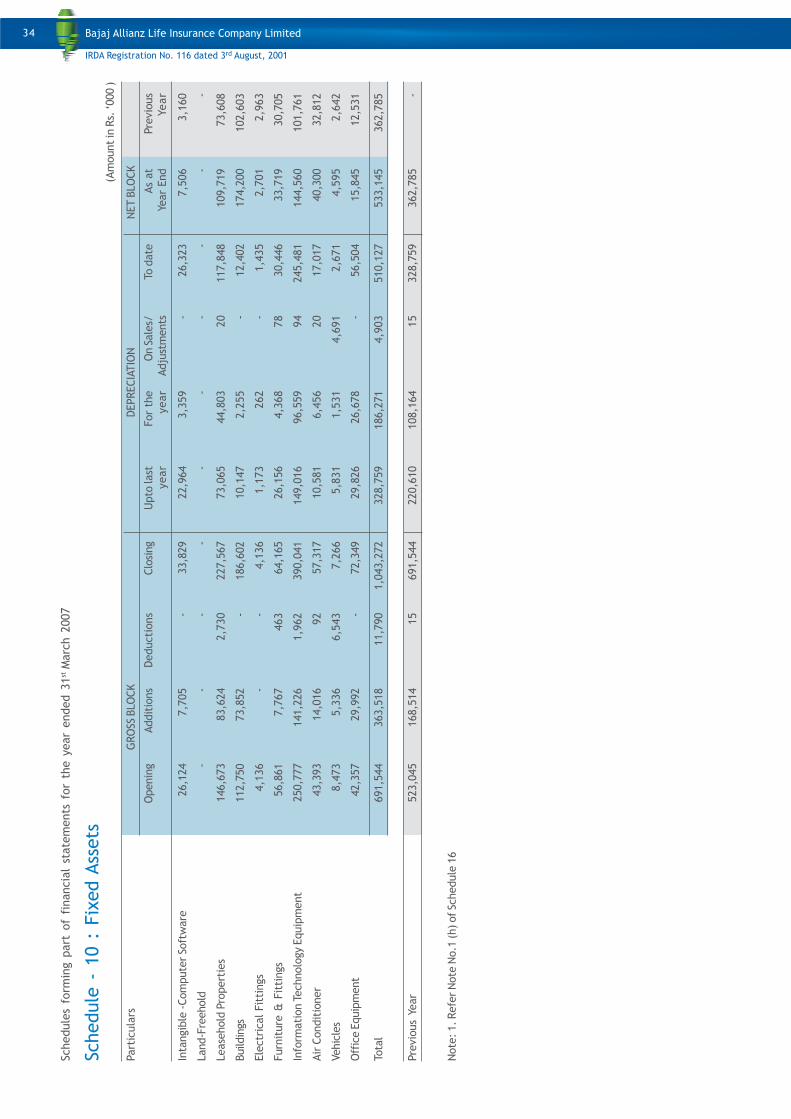
34
Schedule
s fo
rmin
g p
art
of
financia
l st
ate
ments
for
the y
ear
ended 3
1st M
arc
h 2
007
Schedule
- 1
0 :
Fix
ed A
ssets
(Am
ount in
Rs.
‘000 )
Part
icula
rsG
RO
SS B
LO
CK
DEPRECIA
TIO
NN
ET B
LO
CK
Openin
gAddit
ions
Deducti
ons
Clo
sing
Upto
last
For
the
On S
ale
s/To
date
As
at
Pre
vio
us
year
year
Adju
stm
ents
Year
End
Year
Inta
ngib
le -Com
pute
r So
ftw
are
26,1
24
7,7
05
-33,8
29
22,9
64
3,3
59
-26,3
23
7,5
06
3,1
60
Land-F
reehold
--
--
--
--
--
Lease
hold
Pro
pert
ies
146,6
73
83,6
24
2,7
30
227,5
67
73,0
65
44,8
03
20
117,8
48
109,7
19
73,6
08
Buildin
gs112,7
50
73,8
52
-186,6
02
10,1
47
2,2
55
-12,4
02
174,2
00
102,6
03
Ele
ctr
ical Fit
tings
4,1
36
--
4,1
36
1,1
73
262
-1,4
35
2,7
01
2,9
63
Furn
iture
& F
itti
ngs
56,8
61
7,7
67
463
64,1
65
26,1
56
4,3
68
78
30,4
46
33,7
19
30,7
05
Info
rmati
on T
echnolo
gy E
quip
ment
250,7
77
141,2
26
1,9
62
390,0
41
149,0
16
96,5
59
94
245,4
81
144,5
60
101,7
61
Air
Condit
ioner
43,3
93
14,0
16
92
57,3
17
10,5
81
6,4
56
20
17,0
17
40,3
00
32,8
12
Vehic
les
8,4
73
5,3
36
6,5
43
7,2
66
5,8
31
1,5
31
4,6
91
2,6
71
4,5
95
2,6
42
Off
ice E
quip
ment
42,3
57
29,9
92
-72,3
49
29,8
26
26,6
78
-56,5
04
15,8
45
12,5
31
Tota
l691,5
44
363,5
18
11,7
90
1,0
43,2
72
328,7
59
186,2
71
4,9
03
510,1
27
533,1
45
362,7
85
Pre
vio
us
Year
523,0
45
168,5
14
15
691,5
44
220,6
10
108,1
64
15
328,7
59
362,7
85
-
Note
: 1. Refe
r N
ote
No.1
(h) of Sc
hedule
16
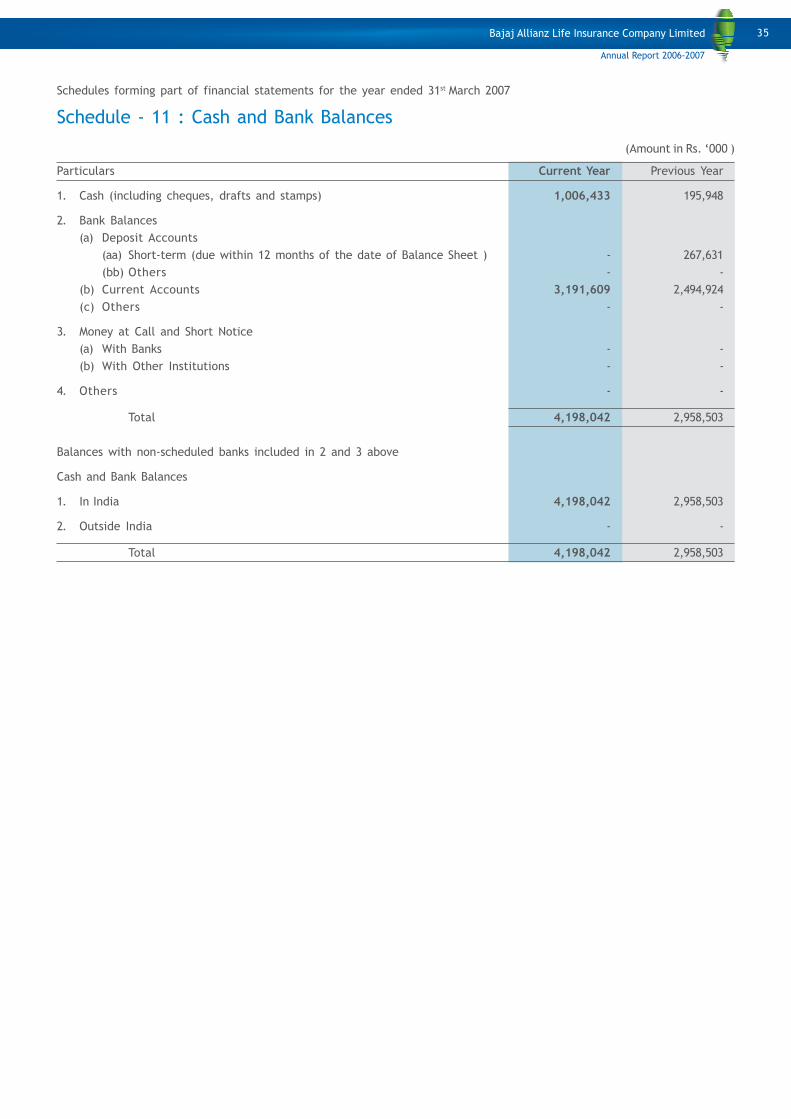
Schedules forming part of financial statements for the year ended 31st March 2007
Schedule - 11 : Cash and Bank Balances
(Amount in Rs. ‘000 )
Particulars Current Year Previous Year
1. Cash (including cheques, drafts and stamps) 1,006,433 195,948
2. Bank Balances
(a) Deposit Accounts
(aa) Short-term (due within 12 months of the date of Balance Sheet ) - 267,631
(bb) Others - -
(b) Current Accounts 3,191,609 2,494,924
(c) Others - -
3. Money at Call and Short Notice
(a) With Banks - -
(b) With Other Institutions - -
4. Others - -
Total 4,198,042 2,958,503
Balances with non-scheduled banks included in 2 and 3 above
Cash and Bank Balances
1. In India 4,198,042 2,958,503
2. Outside India - -
Total 4,198,042 2,958,503
35
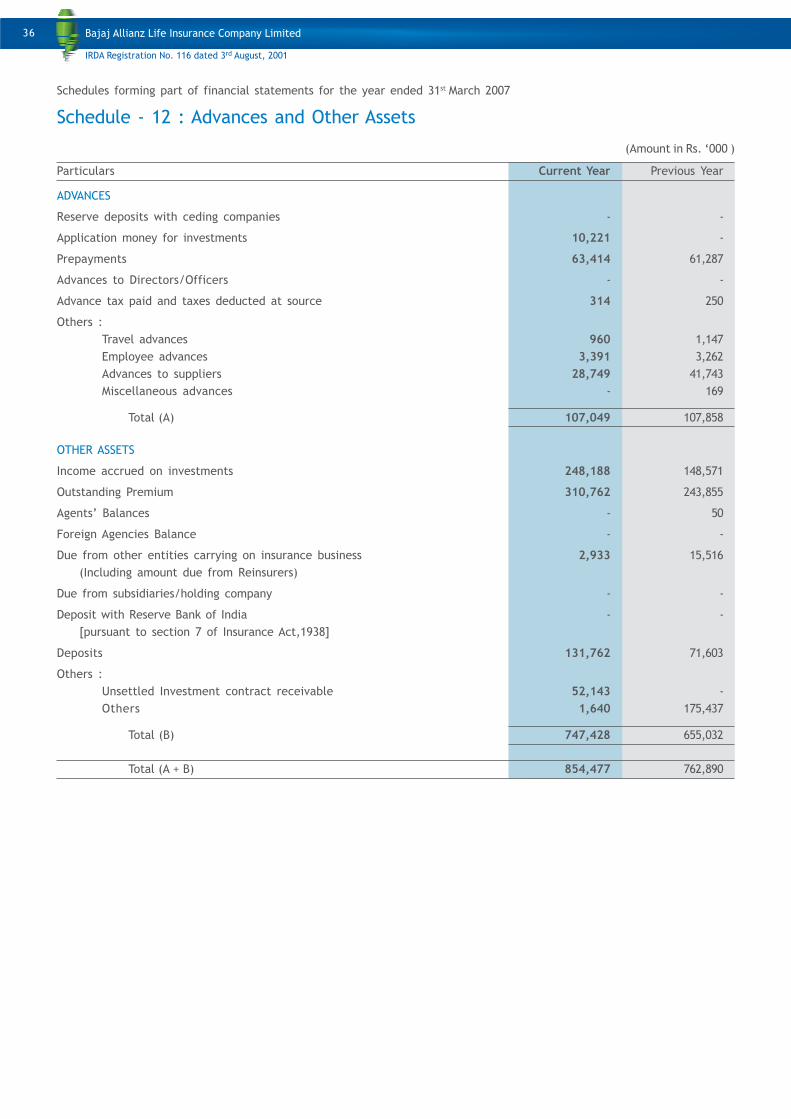
Schedules forming part of financial statements for the year ended 31st March 2007
Schedule - 12 : Advances and Other Assets
(Amount in Rs. ‘000 )
Particulars Current Year Previous Year
ADVANCES
Reserve deposits with ceding companies - -
Application money for investments 10,221 -
Prepayments 63,414 61,287
Advances to Directors/Officers - -
Advance tax paid and taxes deducted at source 314 250
Others :
Travel advances 960 1,147
Employee advances 3,391 3,262
Advances to suppliers 28,749 41,743
Miscellaneous advances - 169
Total (A) 107,049 107,858
OTHER ASSETS
Income accrued on investments 248,188 148,571
Outstanding Premium 310,762 243,855
Agents’ Balances - 50
Foreign Agencies Balance - -
Due from other entities carrying on insurance business 2,933 15,516
(Including amount due from Reinsurers)
Due from subsidiaries/holding company - -
Deposit with Reserve Bank of India - -
[pursuant to section 7 of Insurance Act,1938]
Deposits 131,762 71,603
Others :
Unsettled Investment contract receivable 52,143 -
Others 1,640 175,437
Total (B) 747,428 655,032
Total (A + B) 854,477 762,890
36
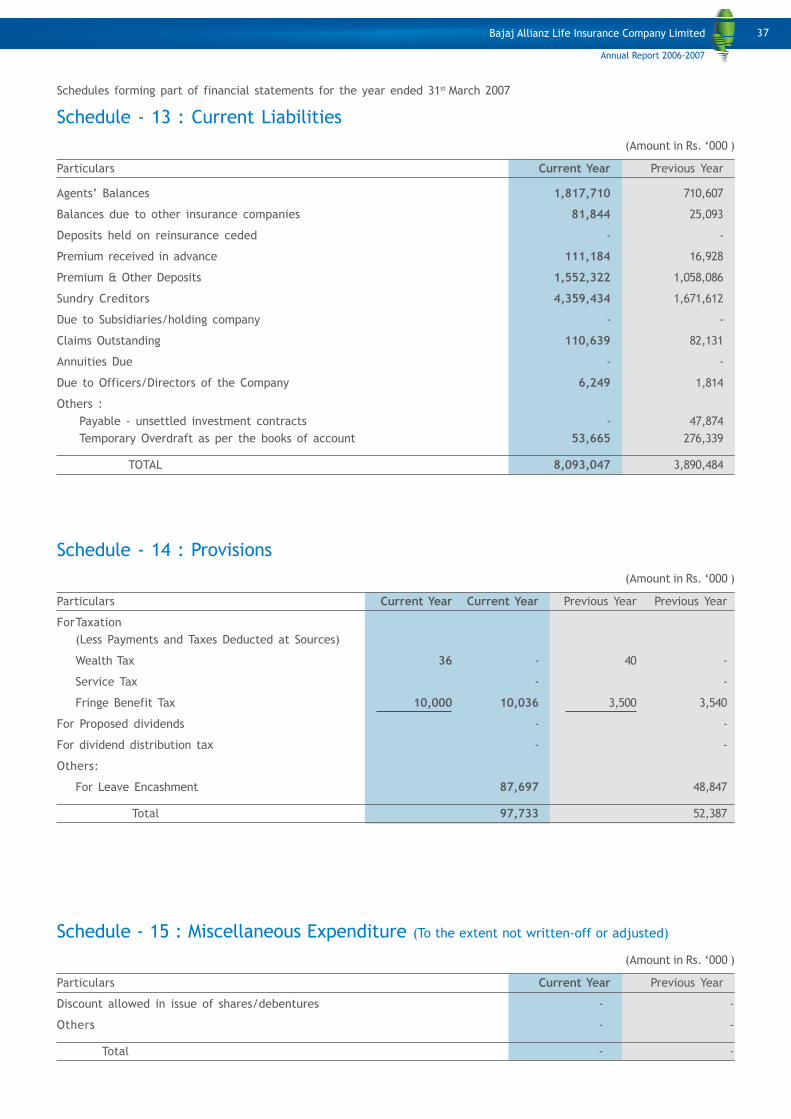
Schedules forming part of financial statements for the year ended 31st March 2007
Schedule - 13 : Current Liabilities
(Amount in Rs. ‘000 )
Particulars Current Year Previous Year
Agents’ Balances 1,817,710 710,607
Balances due to other insurance companies 81,844 25,093
Deposits held on reinsurance ceded - -
Premium received in advance 111,184 16,928
Premium & Other Deposits 1,552,322 1,058,086
Sundry Creditors 4,359,434 1,671,612
Due to Subsidiaries/holding company - -
Claims Outstanding 110,639 82,131
Annuities Due - -
Due to Officers/Directors of the Company 6,249 1,814
Others :
Payable - unsettled investment contracts - 47,874
Temporary Overdraft as per the books of account 53,665 276,339
TOTAL 8,093,047 3,890,484
Schedule - 14 : Provisions
(Amount in Rs. ‘000 )
Particulars Current Year Current Year Previous Year Previous Year
ForTaxation
(Less Payments and Taxes Deducted at Sources)
Wealth Tax 36 - 40 -
Service Tax - -
Fringe Benefit Tax 10,000 10,036 3,500 3,540
For Proposed dividends - -
For dividend distribution tax - -
Others:
For Leave Encashment 87,697 48,847
Total 97,733 52,387
Schedule - 15 : Miscellaneous Expenditure (To the extent not written-off or adjusted)
(Amount in Rs. ‘000 )
Particulars Current Year Previous Year
Discount allowed in issue of shares/debentures - -
Others - -
Total - -
37
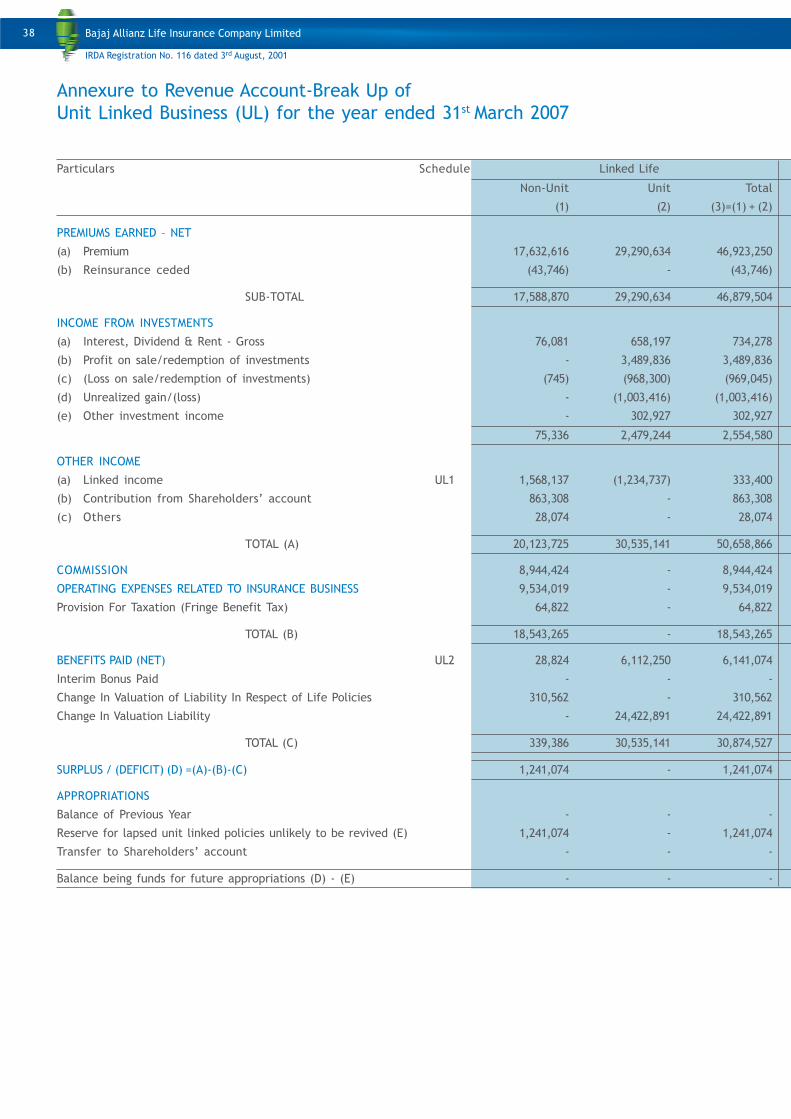
Annexure to Revenue Account-Break Up of
Unit Linked Business (UL) for the year ended 31st March 2007
Particulars Schedule Linked Life
Non-Unit Unit Total
(1) (2) (3)=(1) + (2)
PREMIUMS EARNED – NET
(a) Premium 17,632,616 29,290,634 46,923,250
(b) Reinsurance ceded (43,746) - (43,746)
SUB-TOTAL 17,588,870 29,290,634 46,879,504
INCOME FROM INVESTMENTS
(a) Interest, Dividend & Rent - Gross 76,081 658,197 734,278
(b) Profit on sale/redemption of investments - 3,489,836 3,489,836
(c) (Loss on sale/redemption of investments) (745) (968,300) (969,045)
(d) Unrealized gain/(loss) - (1,003,416) (1,003,416)
(e) Other investment income - 302,927 302,927
75,336 2,479,244 2,554,580
OTHER INCOME
(a) Linked income UL1 1,568,137 (1,234,737) 333,400
(b) Contribution from Shareholders’ account 863,308 - 863,308
(c) Others 28,074 - 28,074
TOTAL (A) 20,123,725 30,535,141 50,658,866
COMMISSION 8,944,424 - 8,944,424
OPERATING EXPENSES RELATED TO INSURANCE BUSINESS 9,534,019 - 9,534,019
Provision For Taxation (Fringe Benefit Tax) 64,822 - 64,822
TOTAL (B) 18,543,265 - 18,543,265
BENEFITS PAID (NET) UL2 28,824 6,112,250 6,141,074
Interim Bonus Paid - - -
Change In Valuation of Liability In Respect of Life Policies 310,562 - 310,562
Change In Valuation Liability - 24,422,891 24,422,891
TOTAL (C) 339,386 30,535,141 30,874,527
SURPLUS / (DEFICIT) (D) =(A)-(B)-(C) 1,241,074 - 1,241,074
APPROPRIATIONS
Balance of Previous Year - - -
Reserve for lapsed unit linked policies unlikely to be revived (E) 1,241,074 - 1,241,074
Transfer to Shareholders’ account - - -
Balance being funds for future appropriations (D) - (E) - - -
38
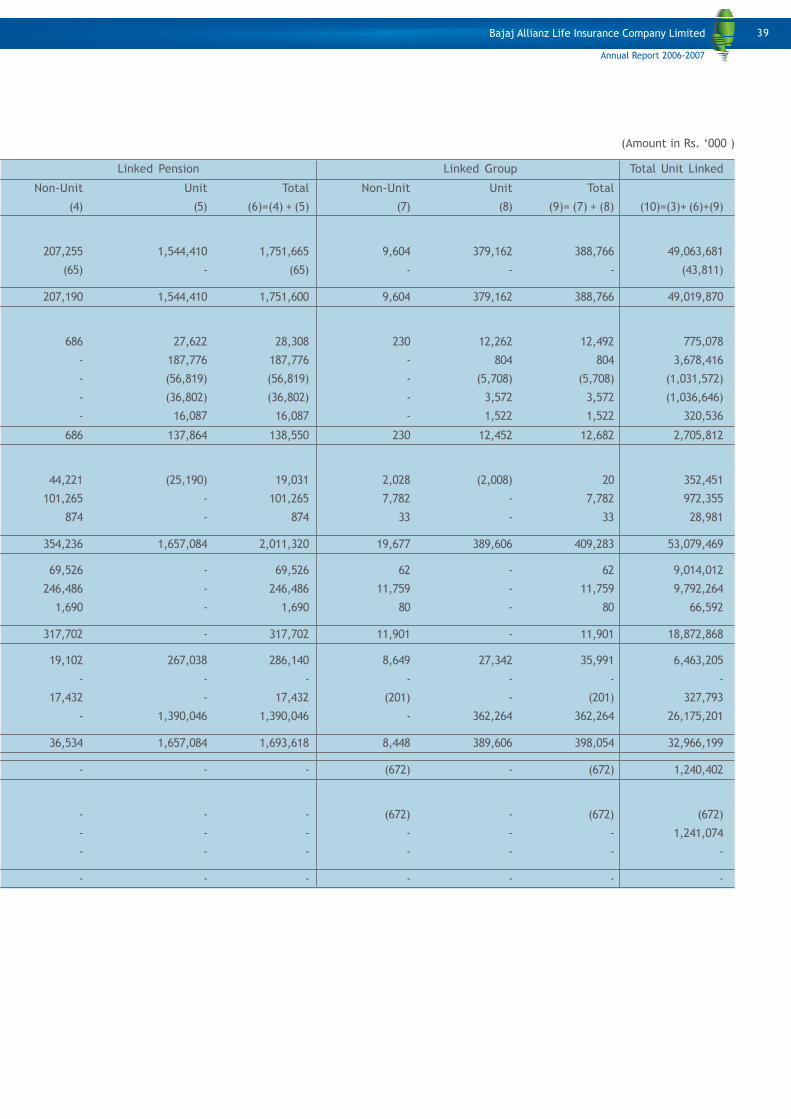
(Amount in Rs. ‘000 )
Linked Pension Linked Group Total Unit Linked
Non-Unit Unit Total Non-Unit Unit Total
(4) (5) (6)=(4) + (5) (7) (8) (9)= (7) + (8) (10)=(3)+ (6)+(9)
207,255 1,544,410 1,751,665 9,604 379,162 388,766 49,063,681
(65) - (65) - - - (43,811)
207,190 1,544,410 1,751,600 9,604 379,162 388,766 49,019,870
686 27,622 28,308 230 12,262 12,492 775,078
- 187,776 187,776 - 804 804 3,678,416
- (56,819) (56,819) - (5,708) (5,708) (1,031,572)
- (36,802) (36,802) - 3,572 3,572 (1,036,646)
- 16,087 16,087 - 1,522 1,522 320,536
686 137,864 138,550 230 12,452 12,682 2,705,812
44,221 (25,190) 19,031 2,028 (2,008) 20 352,451
101,265 - 101,265 7,782 - 7,782 972,355
874 - 874 33 - 33 28,981
354,236 1,657,084 2,011,320 19,677 389,606 409,283 53,079,469
69,526 - 69,526 62 - 62 9,014,012
246,486 - 246,486 11,759 - 11,759 9,792,264
1,690 - 1,690 80 - 80 66,592
317,702 - 317,702 11,901 - 11,901 18,872,868
19,102 267,038 286,140 8,649 27,342 35,991 6,463,205
- - - - - - -
17,432 - 17,432 (201) - (201) 327,793
- 1,390,046 1,390,046 - 362,264 362,264 26,175,201
36,534 1,657,084 1,693,618 8,448 389,606 398,054 32,966,199
- - - (672) - (672) 1,240,402
- - - (672) - (672) (672)
- - - - - - 1,241,074
- - - - - - -
- - - - - - -
39
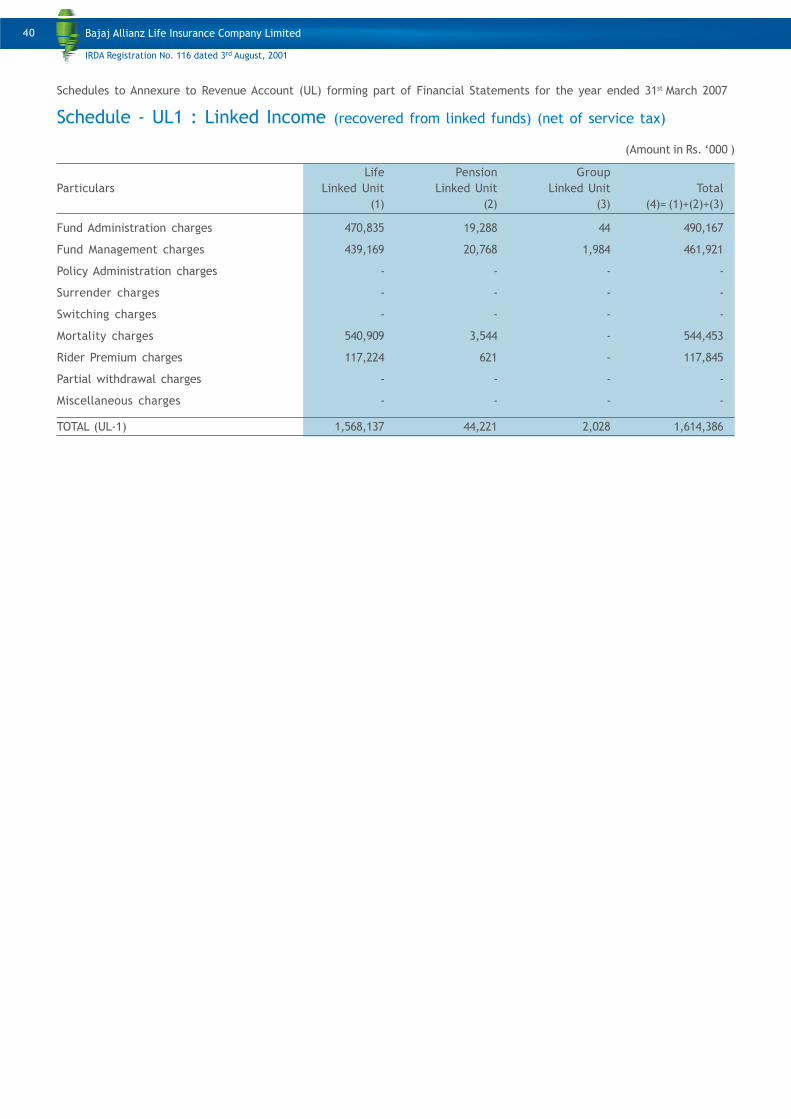
Schedules to Annexure to Revenue Account (UL) forming part of Financial Statements for the year ended 31st March 2007
Schedule - UL1 : Linked Income (recovered from linked funds) (net of service tax)
(Amount in Rs. ‘000 )
Life Pension Group
Particulars Linked Unit Linked Unit Linked Unit Total
(1) (2) (3) (4)= (1)+(2)+(3)
Fund Administration charges 470,835 19,288 44 490,167
Fund Management charges 439,169 20,768 1,984 461,921
Policy Administration charges - - - -
Surrender charges - - - -
Switching charges - - - -
Mortality charges 540,909 3,544 - 544,453
Rider Premium charges 117,224 621 - 117,845
Partial withdrawal charges - - - -
Miscellaneous charges - - - -
TOTAL (UL-1) 1,568,137 44,221 2,028 1,614,386
40
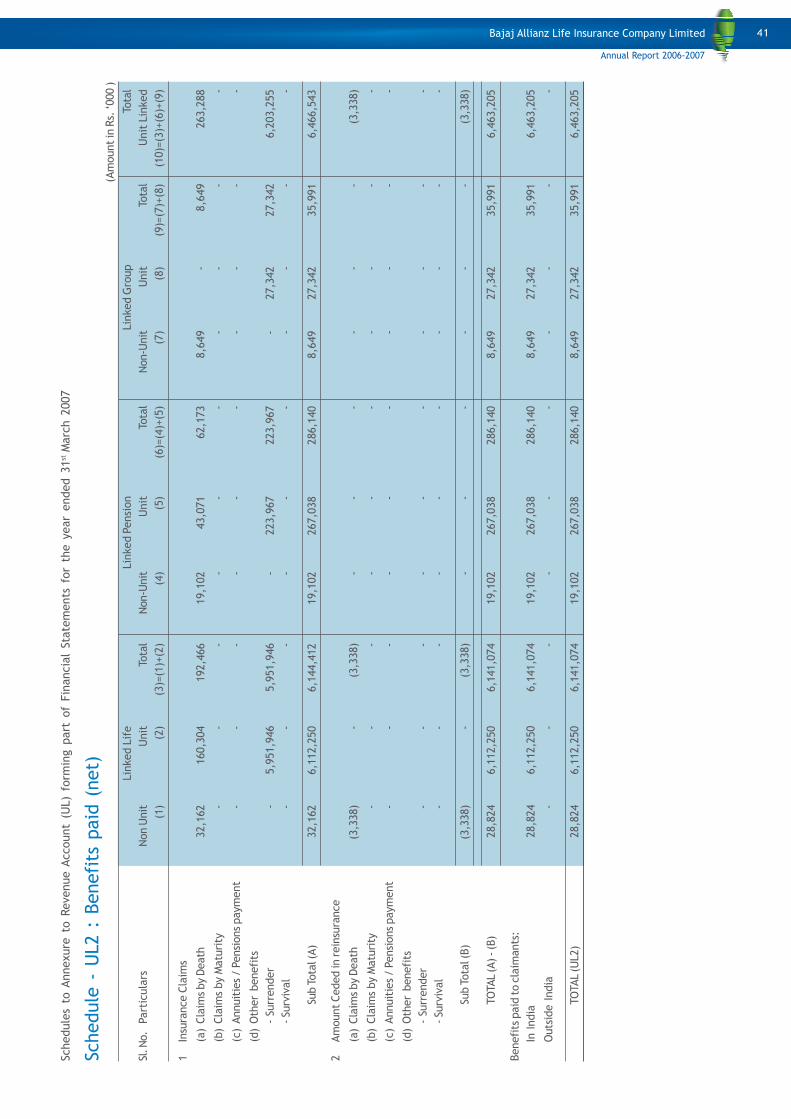
Schedule
s to
Annexure
to R
evenue A
ccount
(UL)
form
ing p
art
of
Fin
ancia
l Sta
tem
ents
for
the y
ear
ended 3
1st M
arc
h 2
007
Schedule
- U
L2 :
Benefi
ts p
aid
(net)
(Am
ount in
Rs.
‘000 )
Lin
ked L
ife
Lin
ked P
ensi
on
Lin
ked G
roup
Tota
l
Sl. No.
Part
icula
rsN
on U
nit
Unit
Tota
lN
on-U
nit
Unit
Tota
lN
on-U
nit
Unit
Tota
lU
nit
Lin
ked
(1)
(2)
(3)=
(1)+
(2)
(4)
(5)
(6)=
(4)+
(5)
(7)
(8)
(9)=
(7)+
(8)
(10)=
(3)+
(6)+
(9)
1In
sura
nce C
laim
s
(a)
Cla
ims by D
eath
32,1
62
160,3
04
192,4
66
19,1
02
43,0
71
62,1
73
8,6
49
-8,6
49
263,2
88
(b)
Cla
ims
by M
atu
rity
--
--
--
--
--
(c)
Annuit
ies / P
ensi
ons paym
ent
--
--
--
--
--
(d)
Oth
er
benefi
ts
- Su
rrender
-5,9
51,9
46
5,9
51,9
46
-223,9
67
223,9
67
-27,3
42
27,3
42
6,2
03,2
55
- Su
rviv
al
--
--
--
--
--
Sub T
ota
l (A
)32,1
62
6,1
12,2
50
6,1
44,4
12
19,1
02
267,0
38
286,1
40
8,6
49
27,3
42
35,9
91
6,4
66,5
43
2Am
ount
Ceded in rein
sura
nce
(a)
Cla
ims by D
eath
(3,3
38)
-(3
,338)
--
--
--
(3,3
38)
(b)
Cla
ims
by M
atu
rity
--
--
--
--
--
(c)
Annuit
ies / P
ensi
ons paym
ent
--
--
--
--
--
(d)
Oth
er
benefi
ts
- Su
rrender
--
--
--
--
--
- Su
rviv
al
--
--
--
--
--
Sub T
ota
l (B
)(3
,338)
-(3
,338)
--
--
--
(3,3
38)
TO
TAL
(A) - (B
)28,8
24
6,1
12,2
50
6,1
41,0
74
19,1
02
267,0
38
286,1
40
8,6
49
27,3
42
35,9
91
6,4
63,2
05
Benefi
ts p
aid
to c
laim
ants
:
In India
28,8
24
6,1
12,2
50
6,1
41,0
74
19,1
02
267,0
38
286,1
40
8,6
49
27,3
42
35,9
91
6,4
63,2
05
Outs
ide I
ndia
--
--
--
--
--
TO
TAL
(UL2)
28,8
24
6,1
12,2
50
6,1
41,0
74
19,1
02
267,0
38
286,1
40
8,6
49
27,3
42
35,9
91
6,4
63,2
05
41
Background
Bajaj Allianz Life Insurance Company Limited (“the Company”)
was incorporated on 12th March 2001 as a Company under
the Companies Act, 1956. The Company obtained a license
from the Insurance Regulatory and Development Authority
(“IRDA”) for carrying on the business of life insurance on
3rd August 2001. The license has been renewed for the
financial year ended 31 March 2007.
The Company is a joint venture between Bajaj Auto Ltd.
(74 percent) and Allianz SE (26 percent). The Company has
a wide range of products in traditional and unit-linked
insurance business.
1. Significant Accounting Policies followed by the
Company
Basis of Preparation
The accompanying financial statements have been prepared
and presented under the historical cost convention, on
the accrual basis of accounting, in compliance with the
accounting standards (‘AS’) issued by the Institute of
Chartered Accountants of India (‘ICAI’), to the extent
applicable, and in accordance with the provisions of the
Insurance Act, 1938, the Insurance Regulatory and
Development Authority (Preparation of Financial Statements
and Auditor’s Report of Insurance Companies) Regulations,
2002 (‘the Regulations’), Insurance Regulatory and
Development Authority Act, 1999, various circulars issued
by IRDA and the Companies Act, 1956 to the extent
applicable and the practices prevailing in the insurance
industry. The accounting policies have been consistently
applied by the company and except for changes in
accounting policy discussed in (j) below are consistent with
those used in the previous year.
Use of Estimates
The preparation of financial statements in conformity with
generally accepted accounting principles requires
management to make estimates and assumptions that affect
the reported amounts of assets, liabilities, revenue and
expenses and disclosure of contingent liabilities as on the
date of financial statements. The estimates and assumptions
used in the accompanying financial statements are based
upon management’s evaluation of the relevant facts and
circumstances as of the date of the financial statements.
Actual results could differ from those estimates. Any revision
to accounting estimates is recognized prospectively in
current and future periods.
a) Revenue Recognition
Revenues are recognised as under. However recognition is
postponed where ultimate collectibility lacks reasonable
certainty.
Premium Income
Premium (net of service tax), is recognised as income when
due. For linked business, premium is recognized when the
associated units are allotted.
Premium on lapsed policies is recognized as income when
such policies are reinstated.
In case of linked business, top up premiums paid by
policyholders are entirely unitized and considered as single
premium. This premium is recognised when associated units
are allotted.
Commission received on reinsurance ceded is recognized
as income in the period in which reinsurance premium is
ceded.
Income earned on investments
Interest income is recognised on an accrual basis.
Dividend income is recognized when the right to receive
dividend is established.
Premium or discount on acquisition, as the case may be, in
respect of fixed income securities, pertaining to non-linked
investments is amortized on constant yield to maturity basis
over the period of maturity/holding and offset against
interest income.
Profit/loss on sale/redemption of securities other than
linked investments is recognized on trade/redemption date
and includes effects of accumulated fair value changes, as
applicable previously recognised, for specific investments
sold/redeemed during the year. Cost of security is
determined on first in first out cost basis.
The realized gains or losses on the debt securities for other
than linked business is the difference between the net
sale consideration and the amortized cost in the books of
the Company as on date of sale.
The realized gains or loss on equity shares and mutual fund
units for other than linked business is the difference
between the net sale consideration and the cost in the
books of the Company.
The realized gains or losses on securities held for linked
business is the difference between the net sale
consideration and the weighted average cost as on the
date of sale.
Fund Management Charges, Fund Administration Charges
and cost of Insurance are accounted for on accrual basis
in accordance with terms and conditions described in the
issued policies.
b) Reinsurance premium
Reinsurance premium ceded is accounted in accordance
with the treaty with reinsurers.
c) Benefits Paid (Including Claims)
Death and surrender claims are accounted for on receipt
of intimation. Maturity claims are accounted when due for
payment. Reinsurance recoveries are accounted for in the
same period as the related claims and netted off against
the claim expense incurred.
Repudiated claims disputed before judicial authorities are
provided for based on the best judgment of the management
Schedules forming part of financial statements for the year ended 31st March 2007
Schedule - 16 : Notes to financial statements
42
considering the facts and evidence in respect of each such
claim.
Withdrawals under unit linked policies are accounted in
respective schemes when the associated units are cancelled.
d) Acquisition Costs
Acquisition costs such as commission, policy issue expenses
etc. are costs that vary with and are primarily relatable to
the acquisition of new and renewal insurance contracts.
Such costs are expensed in the year in which they are
incurred. Accounting for additional first year commission is
done on an accrual basis, after considering estimated
lapsation. Claw back of the first year commission paid, in
future, if any, will be accounted for in the year in which it
is recovered.
e) Liability for life policies
i) The Company provides for liabilities in respect of all “in
force” policies and lapsed policies that are likely to be
revived in future, based on actuarial valuation done by
the Appointed Actuary as per gross premium method in
accordance with accepted actuarial practices,
requirements of IRDA and Actuarial Society of India.
ii) Liabilities in respect of unit linked policies which have
lapsed and are not likely to be revived, are shown as a
separate item under the head “funds for future
appropriations”, until expiry of the revival period. This
is as per IRDA Circular No. 041/IRDA/ACTL/MAR-2006
dated 29 March 2006.
iii) Linked liabilities comprise of unit liability representing
the fund value of policies and non-unit liability for
meeting insurance claims etc. which is based on
actuarial valuation done by the Appointed Actuary.
Actuarial policies and assumptions are given in Note 8 below.
f) Investments
Investments are made in accordance with the Insurance
Act, 1938, the Insurance Regulatory and Development
Authority (Investment) Regulations, 2000, as amended and
circulars / notifications issued by IRDA from time to time.
Investments are recorded on trade date at cost, which
includes brokerage and related taxes, if any and excludes
pre-acquisition interest, if any.
i) Classification
Investments maturing within twelve months from the Balance
Sheet date and investments made with the specific intention
to dispose of within twelve months from Balance Sheet
date are classified as short-term. Investments other than
short term are classified as long-term investments.
Investments are specifically procured and held for
policyholders and shareholders independently. The income
relating to these investments is recognized in the respective
policyholders / shareholders account.
ii) Valuation – Shareholders’ investments and non-linked
policyholders’ investments
All debt securities are considered as ‘held to maturity’ and
accordingly stated at historical cost adjusted for
amortization of premium or accretion of discount on
constant yield to maturity basis over the period held to
maturity / sale.
Listed equity shares and mutual fund units are stated at
fair value, in accordance with IRDA Investment (Amendment)
Regulations 2001. Fair value for listed equity shares is the
lowest last quoted closing price on the National Stock
Exchange (NSE) and The Stock Exchange, Mumbai (BSE).
Fair value for mutual fund units is the net asset value on
the Balance Sheet date. Unrealized gains/losses on changes
in fair values of listed equity shares and mutual funds are
taken to the Fair Value Change Account and carried forward
in the Balance Sheet.
Investment in real estate properties is valued at cost.
iii) Valuation – linked business
Listed equity shares are valued at fair value, being the last
quoted closing price on the NSE. In case the equity shares
are not listed on the NSE, then they are valued on the last
quoted closing price on BSE.
Government securities are valued at prices obtained from
Credit Rating Information Services of India Ltd. (CRISIL).
Corporate bonds and debentures are valued on the basis
of CRISIL Bond Valuer.
Treasury bills, certificate of deposits and commercial papers
are valued at cost plus accretion at constant yield to
maturity.
Mutual fund units have been valued at the last available
Net Asset Value declared by the respective mutual fund.
iv) Transfer of investments
Transfer of investments from Shareholders’ Fund to the
Policyholders’ Fund is at book value or market price;
whichever is lower.
Transfer of debt securities is at lower of amortized cost or
market price.
Inter fund transfer of Treasury Bills, Certificate of Deposits
and Commercial Papers between unit linked funds is done
at cost plus accretion. All other transfer of investments
between unit linked funds is done at market price.
g) Loans
Loans are stated at historical cost, subject to provision for
impairment, if any.
h) Fixed Assets and Depreciation
Fixed assets are stated at cost of acquisition less
accumulated depreciation. Cost of acquisition includes
incidental expenses relating to acquisition and installation.
In respect of liabilities incurred in acquisition of fixed assets
in foreign exchange, the net gain or loss arising on
conversion/settlement is adjusted in the carrying value of
the respective asset.
Intangible assets comprising software are stated at cost
less amortization.
Depreciation / amortization is provided on Straight Line
Method (SLM) with reference to the management’s
assessment of the estimated useful life of the assets or the
rates and in the manner specified by the Schedule XIV of
the Companies Act, 1956, whichever is higher.
43
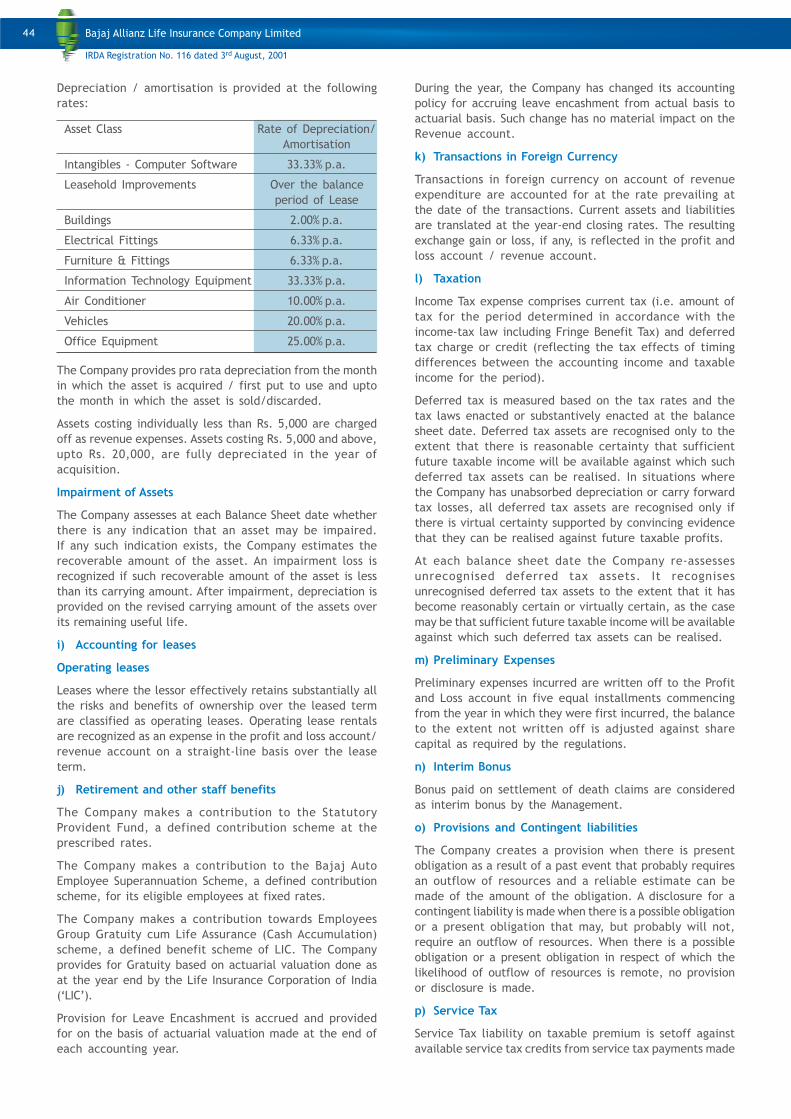
Depreciation / amortisation is provided at the following
rates:
Asset Class Rate of Depreciation/
Amortisation
Intangibles - Computer Software 33.33% p.a.
Leasehold Improvements Over the balance
period of Lease
Buildings 2.00% p.a.
Electrical Fittings 6.33% p.a.
Furniture & Fittings 6.33% p.a.
Information Technology Equipment 33.33% p.a.
Air Conditioner 10.00% p.a.
Vehicles 20.00% p.a.
Office Equipment 25.00% p.a.
The Company provides pro rata depreciation from the month
in which the asset is acquired / first put to use and upto
the month in which the asset is sold/discarded.
Assets costing individually less than Rs. 5,000 are charged
off as revenue expenses. Assets costing Rs. 5,000 and above,
upto Rs. 20,000, are fully depreciated in the year of
acquisition.
Impairment of Assets
The Company assesses at each Balance Sheet date whether
there is any indication that an asset may be impaired.
If any such indication exists, the Company estimates the
recoverable amount of the asset. An impairment loss is
recognized if such recoverable amount of the asset is less
than its carrying amount. After impairment, depreciation is
provided on the revised carrying amount of the assets over
its remaining useful life.
i) Accounting for leases
Operating leases
Leases where the lessor effectively retains substantially all
the risks and benefits of ownership over the leased term
are classified as operating leases. Operating lease rentals
are recognized as an expense in the profit and loss account/
revenue account on a straight-line basis over the lease
term.
j) Retirement and other staff benefits
The Company makes a contribution to the Statutory
Provident Fund, a defined contribution scheme at the
prescribed rates.
The Company makes a contribution to the Bajaj Auto
Employee Superannuation Scheme, a defined contribution
scheme, for its eligible employees at fixed rates.
The Company makes a contribution towards Employees
Group Gratuity cum Life Assurance (Cash Accumulation)
scheme, a defined benefit scheme of LIC. The Company
provides for Gratuity based on actuarial valuation done as
at the year end by the Life Insurance Corporation of India
(‘LIC’).
Provision for Leave Encashment is accrued and provided
for on the basis of actuarial valuation made at the end of
each accounting year.
During the year, the Company has changed its accounting
policy for accruing leave encashment from actual basis to
actuarial basis. Such change has no material impact on the
Revenue account.
k) Transactions in Foreign Currency
Transactions in foreign currency on account of revenue
expenditure are accounted for at the rate prevailing at
the date of the transactions. Current assets and liabilities
are translated at the year-end closing rates. The resulting
exchange gain or loss, if any, is reflected in the profit and
loss account / revenue account.
l) Taxation
Income Tax expense comprises current tax (i.e. amount of
tax for the period determined in accordance with the
income-tax law including Fringe Benefit Tax) and deferred
tax charge or credit (reflecting the tax effects of timing
differences between the accounting income and taxable
income for the period).
Deferred tax is measured based on the tax rates and the
tax laws enacted or substantively enacted at the balance
sheet date. Deferred tax assets are recognised only to the
extent that there is reasonable certainty that sufficient
future taxable income will be available against which such
deferred tax assets can be realised. In situations where
the Company has unabsorbed depreciation or carry forward
tax losses, all deferred tax assets are recognised only if
there is virtual certainty supported by convincing evidence
that they can be realised against future taxable profits.
At each balance sheet date the Company re-assesses
unrecognised deferred tax assets. It recognises
unrecognised deferred tax assets to the extent that it has
become reasonably certain or virtually certain, as the case
may be that sufficient future taxable income will be available
against which such deferred tax assets can be realised.
m) Preliminary Expenses
Preliminary expenses incurred are written off to the Profit
and Loss account in five equal installments commencing
from the year in which they were first incurred, the balance
to the extent not written off is adjusted against share
capital as required by the regulations.
n) Interim Bonus
Bonus paid on settlement of death claims are considered
as interim bonus by the Management.
o) Provisions and Contingent liabilities
The Company creates a provision when there is present
obligation as a result of a past event that probably requires
an outflow of resources and a reliable estimate can be
made of the amount of the obligation. A disclosure for a
contingent liability is made when there is a possible obligation
or a present obligation that may, but probably will not,
require an outflow of resources. When there is a possible
obligation or a present obligation in respect of which the
likelihood of outflow of resources is remote, no provision
or disclosure is made.
p) Service Tax
Service Tax liability on taxable premium is setoff against
available service tax credits from service tax payments made
44
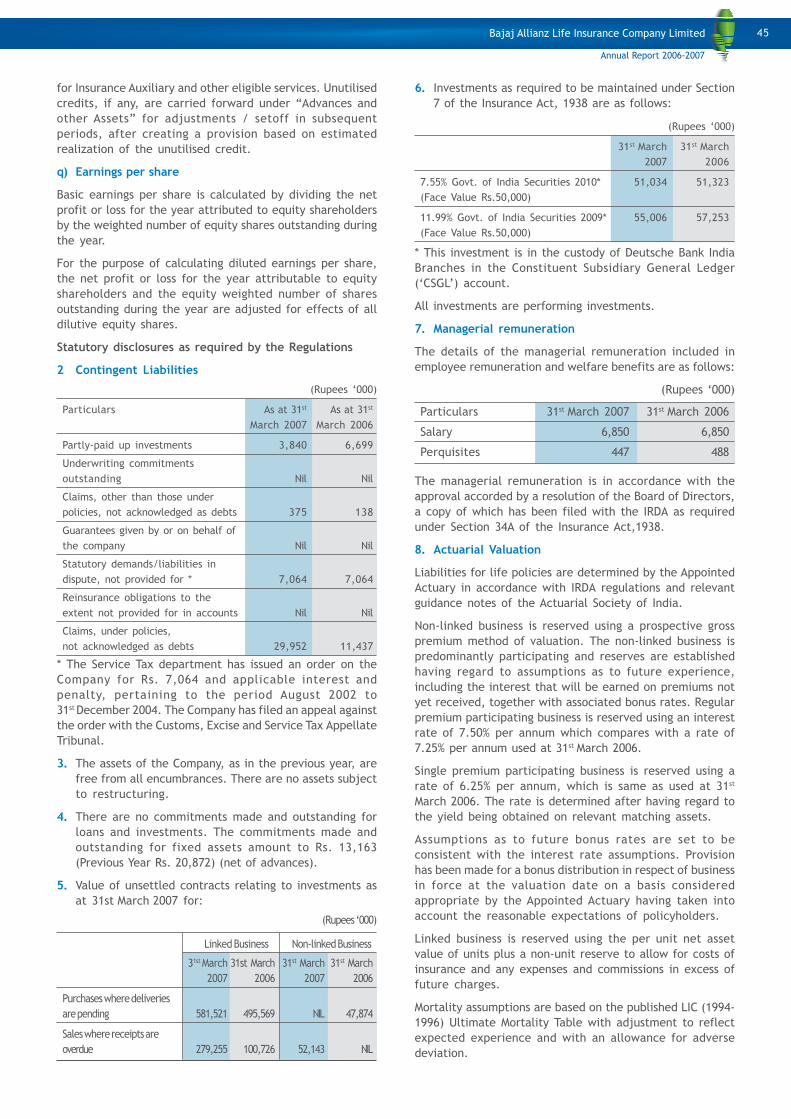
for Insurance Auxiliary and other eligible services. Unutilised
credits, if any, are carried forward under “Advances and
other Assets” for adjustments / setoff in subsequent
periods, after creating a provision based on estimated
realization of the unutilised credit.
q) Earnings per share
Basic earnings per share is calculated by dividing the net
profit or loss for the year attributed to equity shareholders
by the weighted number of equity shares outstanding during
the year.
For the purpose of calculating diluted earnings per share,
the net profit or loss for the year attributable to equity
shareholders and the equity weighted number of shares
outstanding during the year are adjusted for effects of all
dilutive equity shares.
Statutory disclosures as required by the Regulations
2 Contingent Liabilities
(Rupees ‘000)
Particulars As at 31st As at 31st
March 2007 March 2006
Partly-paid up investments 3,840 6,699
Underwriting commitments
outstanding Nil Nil
Claims, other than those under
policies, not acknowledged as debts 375 138
Guarantees given by or on behalf of
the company Nil Nil
Statutory demands/liabilities in
dispute, not provided for * 7,064 7,064
Reinsurance obligations to the
extent not provided for in accounts Nil Nil
Claims, under policies,
not acknowledged as debts 29,952 11,437
* The Service Tax department has issued an order on the
Company for Rs. 7,064 and applicable interest and
penalty, pertaining to the period August 2002 to
31st December 2004. The Company has filed an appeal against
the order with the Customs, Excise and Service Tax Appellate
Tribunal.
3. The assets of the Company, as in the previous year, are
free from all encumbrances. There are no assets subject
to restructuring.
4. There are no commitments made and outstanding for
loans and investments. The commitments made and
outstanding for fixed assets amount to Rs. 13,163
(Previous Year Rs. 20,872) (net of advances).
5. Value of unsettled contracts relating to investments as
at 31st March 2007 for:
(Rupees ‘000)
Linked Business Non-linked Business
31st March 31st March 31st March 31st March
2007 2006 2007 2006
Purchases where deliveries
are pending 581,521 495,569 NIL 47,874
Sales where receipts are
overdue 279,255 100,726 52,143 NIL
6. Investments as required to be maintained under Section
7 of the Insurance Act, 1938 are as follows:
(Rupees ‘000)
31st March 31st March
2007 2006
7.55% Govt. of India Securities 2010* 51,034 51,323
(Face Value Rs.50,000)
11.99% Govt. of India Securities 2009* 55,006 57,253
(Face Value Rs.50,000)
* This investment is in the custody of Deutsche Bank India
Branches in the Constituent Subsidiary General Ledger
(‘CSGL’) account.
All investments are performing investments.
7. Managerial remuneration
The details of the managerial remuneration included in
employee remuneration and welfare benefits are as follows:
(Rupees ‘000)
Particulars 31st March 2007 31st March 2006
Salary 6,850 6,850
Perquisites 447 488
The managerial remuneration is in accordance with the
approval accorded by a resolution of the Board of Directors,
a copy of which has been filed with the IRDA as required
under Section 34A of the Insurance Act,1938.
8. Actuarial Valuation
Liabilities for life policies are determined by the Appointed
Actuary in accordance with IRDA regulations and relevant
guidance notes of the Actuarial Society of India.
Non-linked business is reserved using a prospective gross
premium method of valuation. The non-linked business is
predominantly participating and reserves are established
having regard to assumptions as to future experience,
including the interest that will be earned on premiums not
yet received, together with associated bonus rates. Regular
premium participating business is reserved using an interest
rate of 7.50% per annum which compares with a rate of
7.25% per annum used at 31st March 2006.
Single premium participating business is reserved using a
rate of 6.25% per annum, which is same as used at 31st
March 2006. The rate is determined after having regard to
the yield being obtained on relevant matching assets.
Assumptions as to future bonus rates are set to be
consistent with the interest rate assumptions. Provision
has been made for a bonus distribution in respect of business
in force at the valuation date on a basis considered
appropriate by the Appointed Actuary having taken into
account the reasonable expectations of policyholders.
Linked business is reserved using the per unit net asset
value of units plus a non-unit reserve to allow for costs of
insurance and any expenses and commissions in excess of
future charges.
Mortality assumptions are based on the published LIC (1994-
1996) Ultimate Mortality Table with adjustment to reflect
expected experience and with an allowance for adverse
deviation.
45
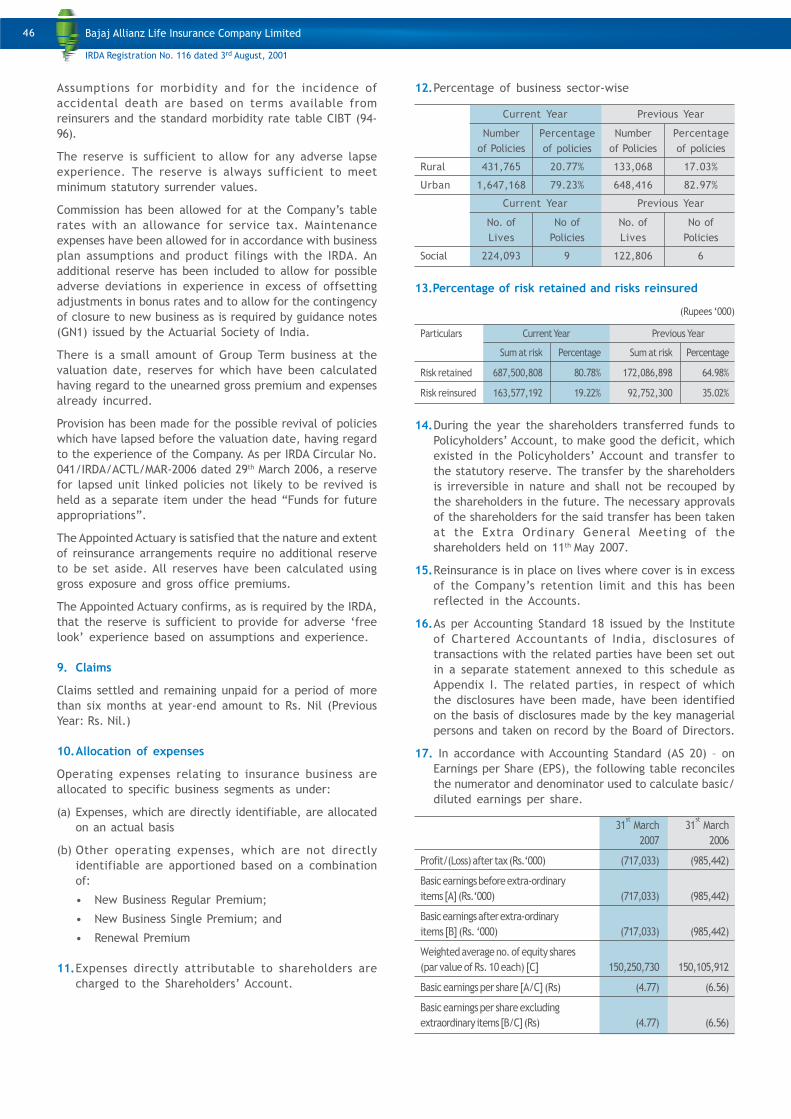
Assumptions for morbidity and for the incidence of
accidental death are based on terms available from
reinsurers and the standard morbidity rate table CIBT (94-
96).
The reserve is sufficient to allow for any adverse lapse
experience. The reserve is always sufficient to meet
minimum statutory surrender values.
Commission has been allowed for at the Company’s table
rates with an allowance for service tax. Maintenance
expenses have been allowed for in accordance with business
plan assumptions and product filings with the IRDA. An
additional reserve has been included to allow for possible
adverse deviations in experience in excess of offsetting
adjustments in bonus rates and to allow for the contingency
of closure to new business as is required by guidance notes
(GN1) issued by the Actuarial Society of India.
There is a small amount of Group Term business at the
valuation date, reserves for which have been calculated
having regard to the unearned gross premium and expenses
already incurred.
Provision has been made for the possible revival of policies
which have lapsed before the valuation date, having regard
to the experience of the Company. As per IRDA Circular No.
041/IRDA/ACTL/MAR-2006 dated 29th March 2006, a reserve
for lapsed unit linked policies not likely to be revived is
held as a separate item under the head “Funds for future
appropriations”.
The Appointed Actuary is satisfied that the nature and extent
of reinsurance arrangements require no additional reserve
to be set aside. All reserves have been calculated using
gross exposure and gross office premiums.
The Appointed Actuary confirms, as is required by the IRDA,
that the reserve is sufficient to provide for adverse ‘free
look’ experience based on assumptions and experience.
9. Claims
Claims settled and remaining unpaid for a period of more
than six months at year-end amount to Rs. Nil (Previous
Year: Rs. Nil.)
10.Allocation of expenses
Operating expenses relating to insurance business are
allocated to specific business segments as under:
(a) Expenses, which are directly identifiable, are allocated
on an actual basis
(b) Other operating expenses, which are not directly
identifiable are apportioned based on a combination
of:
• New Business Regular Premium;
• New Business Single Premium; and
• Renewal Premium
11.Expenses directly attributable to shareholders are
charged to the Shareholders’ Account.
12.Percentage of business sector-wise
Current Year Previous Year
Number Percentage Number Percentage
of Policies of policies of Policies of policies
Rural 431,765 20.77% 133,068 17.03%
Urban 1,647,168 79.23% 648,416 82.97%
Current Year Previous Year
No. of No of No. of No of
Lives Policies Lives Policies
Social 224,093 9 122,806 6
13.Percentage of risk retained and risks reinsured
(Rupees ‘000)
Particulars Current Year Previous Year
Sum at risk Percentage Sum at risk Percentage
Risk retained 687,500,808 80.78% 172,086,898 64.98%
Risk reinsured 163,577,192 19.22% 92,752,300 35.02%
14.During the year the shareholders transferred funds to
Policyholders’ Account, to make good the deficit, which
existed in the Policyholders’ Account and transfer to
the statutory reserve. The transfer by the shareholders
is irreversible in nature and shall not be recouped by
the shareholders in the future. The necessary approvals
of the shareholders for the said transfer has been taken
at the Extra Ordinary General Meeting of the
shareholders held on 11th
May 2007.
15.Reinsurance is in place on lives where cover is in excess
of the Company’s retention limit and this has been
reflected in the Accounts.
16.As per Accounting Standard 18 issued by the Institute
of Chartered Accountants of India, disclosures of
transactions with the related parties have been set out
in a separate statement annexed to this schedule as
Appendix I. The related parties, in respect of which
the disclosures have been made, have been identified
on the basis of disclosures made by the key managerial
persons and taken on record by the Board of Directors.
17. In accordance with Accounting Standard (AS 20) – on
Earnings per Share (EPS), the following table reconciles
the numerator and denominator used to calculate basic/
diluted earnings per share.
31st
March 31st
March
2007 2006
Profit/(Loss) after tax (Rs.‘000) (717,033) (985,442)
Basic earnings before extra-ordinary
items [A] (Rs.‘000) (717,033) (985,442)
Basic earnings after extra-ordinary
items [B] (Rs. ‘000) (717,033) (985,442)
Weighted average no. of equity shares
(par value of Rs. 10 each) [C] 150,250,730 150,105,912
Basic earnings per share [A/C] (Rs) (4.77) (6.56)
Basic earnings per share excluding
extraordinary items [B/C] (Rs) (4.77) (6.56)
46
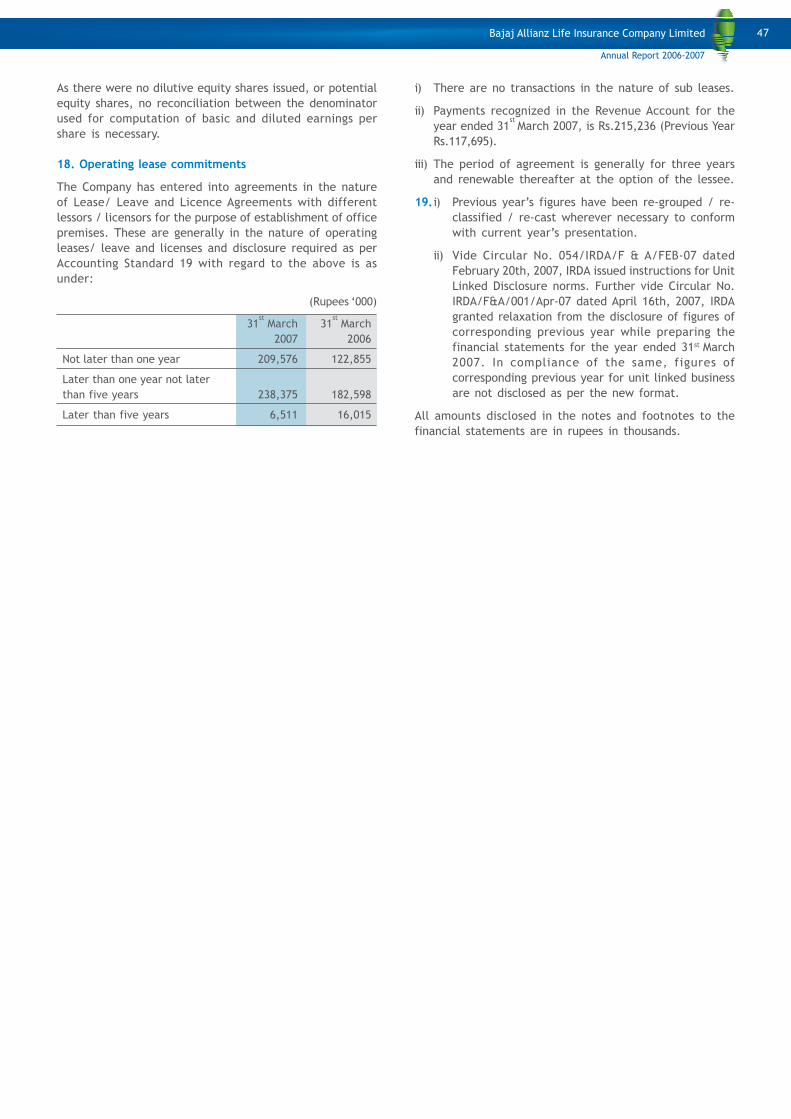
As there were no dilutive equity shares issued, or potential
equity shares, no reconciliation between the denominator
used for computation of basic and diluted earnings per
share is necessary.
18. Operating lease commitments
The Company has entered into agreements in the nature
of Lease/ Leave and Licence Agreements with different
lessors / licensors for the purpose of establishment of office
premises. These are generally in the nature of operating
leases/ leave and licenses and disclosure required as per
Accounting Standard 19 with regard to the above is as
under:
(Rupees ‘000)
31st
March 31st
March
2007 2006
Not later than one year 209,576 122,855
Later than one year not later
than five years 238,375 182,598
Later than five years 6,511 16,015
i) There are no transactions in the nature of sub leases.
ii) Payments recognized in the Revenue Account for the
year ended 31st
March 2007, is Rs.215,236 (Previous Year
Rs.117,695).
iii) The period of agreement is generally for three years
and renewable thereafter at the option of the lessee.
19.i) Previous year’s figures have been re-grouped / re-
classified / re-cast wherever necessary to conform
with current year’s presentation.
ii) Vide Circular No. 054/IRDA/F & A/FEB-07 dated
February 20th, 2007, IRDA issued instructions for Unit
Linked Disclosure norms. Further vide Circular No.
IRDA/F&A/001/Apr-07 dated April 16th, 2007, IRDA
granted relaxation from the disclosure of figures of
corresponding previous year while preparing the
financial statements for the year ended 31st
March
2007. In compliance of the same, figures of
corresponding previous year for unit linked business
are not disclosed as per the new format.
All amounts disclosed in the notes and footnotes to the
financial statements are in rupees in thousands.
47
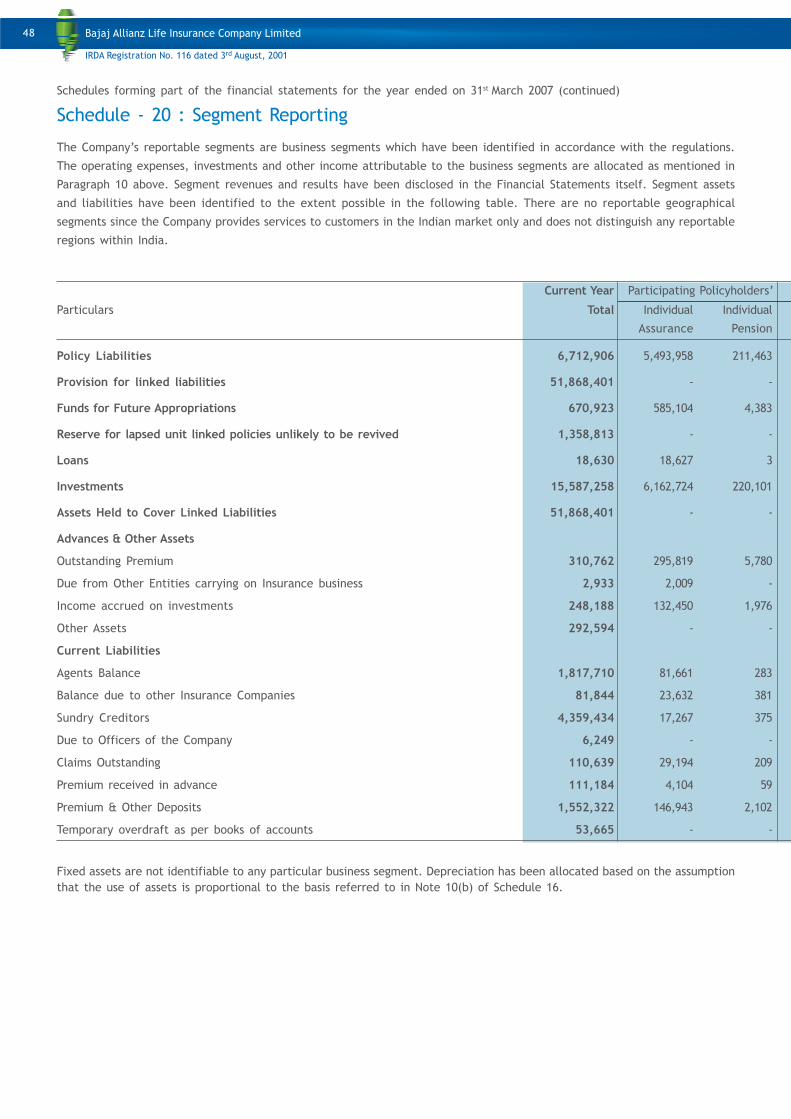
Schedules forming part of the financial statements for the year ended on 31st March 2007 (continued)
Schedule - 20 : Segment Reporting
The Company’s reportable segments are business segments which have been identified in accordance with the regulations.
The operating expenses, investments and other income attributable to the business segments are allocated as mentioned in
Paragraph 10 above. Segment revenues and results have been disclosed in the Financial Statements itself. Segment assets
and liabilities have been identified to the extent possible in the following table. There are no reportable geographical
segments since the Company provides services to customers in the Indian market only and does not distinguish any reportable
regions within India.
Current Year Participating Policyholders’
Particulars Total Individual Individual
Assurance Pension
Policy Liabilities 6,712,906 5,493,958 211,463
Provision for linked liabilities 51,868,401 - -
Funds for Future Appropriations 670,923 585,104 4,383
Reserve for lapsed unit linked policies unlikely to be revived 1,358,813 - -
Loans 18,630 18,627 3
Investments 15,587,258 6,162,724 220,101
Assets Held to Cover Linked Liabilities 51,868,401 - -
Advances & Other Assets
Outstanding Premium 310,762 295,819 5,780
Due from Other Entities carrying on Insurance business 2,933 2,009 -
Income accrued on investments 248,188 132,450 1,976
Other Assets 292,594 - -
Current Liabilities
Agents Balance 1,817,710 81,661 283
Balance due to other Insurance Companies 81,844 23,632 381
Sundry Creditors 4,359,434 17,267 375
Due to Officers of the Company 6,249 - -
Claims Outstanding 110,639 29,194 209
Premium received in advance 111,184 4,104 59
Premium & Other Deposits 1,552,322 146,943 2,102
Temporary overdraft as per books of accounts 53,665 - -
Fixed assets are not identifiable to any particular business segment. Depreciation has been allocated based on the assumption
that the use of assets is proportional to the basis referred to in Note 10(b) of Schedule 16.
48
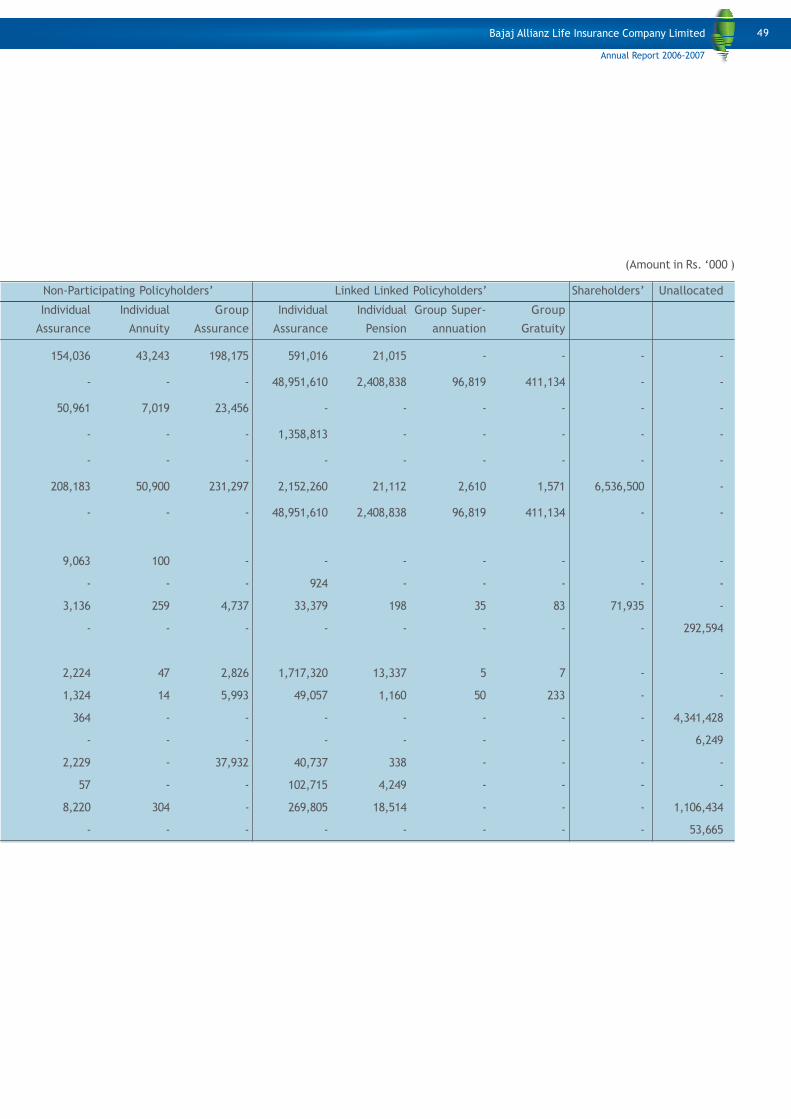
(Amount in Rs. ‘000 )
Non-Participating Policyholders’ Linked Linked Policyholders’ Shareholders’ Unallocated
Individual Individual Group Individual Individual Group Super- Group
Assurance Annuity Assurance Assurance Pension annuation Gratuity
154,036 43,243 198,175 591,016 21,015 - - - -
- - - 48,951,610 2,408,838 96,819 411,134 - -
50,961 7,019 23,456 - - - - - -
- - - 1,358,813 - - - - -
- - - - - - - - -
208,183 50,900 231,297 2,152,260 21,112 2,610 1,571 6,536,500 -
- - - 48,951,610 2,408,838 96,819 411,134 - -
9,063 100 - - - - - - -
- - - 924 - - - - -
3,136 259 4,737 33,379 198 35 83 71,935 -
- - - - - - - - 292,594
2,224 47 2,826 1,717,320 13,337 5 7 - -
1,324 14 5,993 49,057 1,160 50 233 - -
364 - - - - - - - 4,341,428
- - - - - - - - 6,249
2,229 - 37,932 40,737 338 - - - -
57 - - 102,715 4,249 - - - -
8,220 304 - 269,805 18,514 - - - 1,106,434
- - - - - - - - 53,665
49
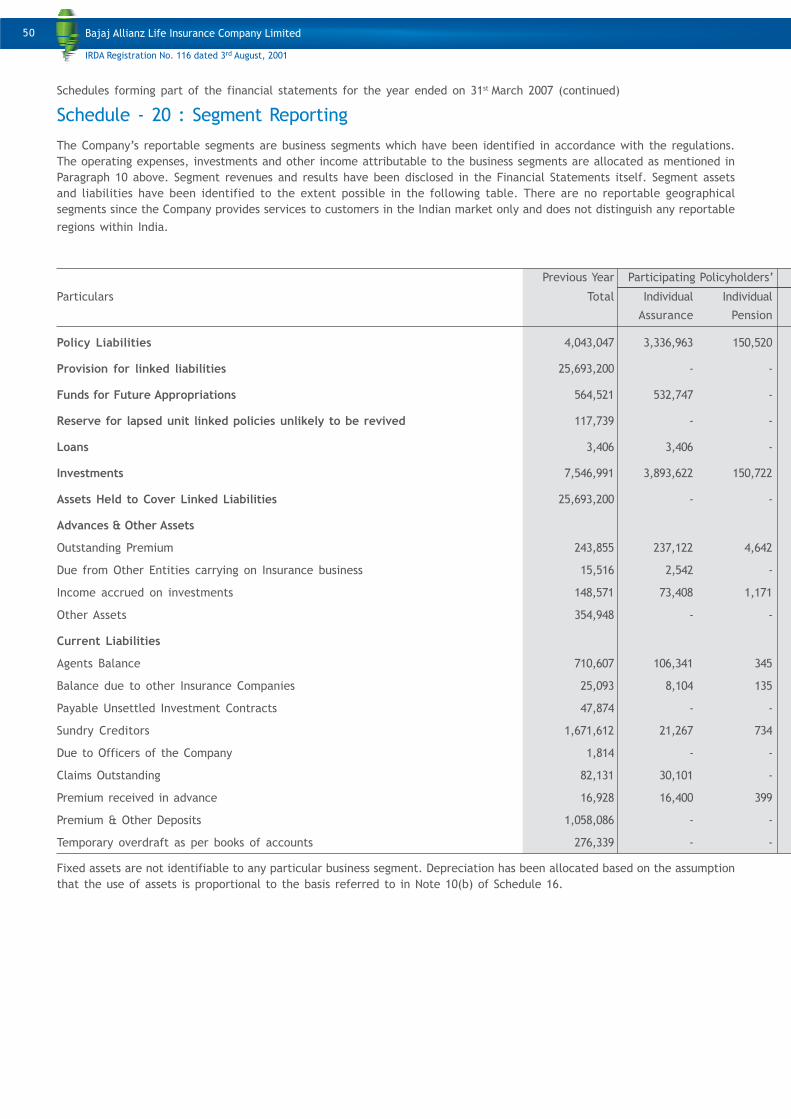
Schedules forming part of the financial statements for the year ended on 31st March 2007 (continued)
Schedule - 20 : Segment Reporting
The Company’s reportable segments are business segments which have been identified in accordance with the regulations.
The operating expenses, investments and other income attributable to the business segments are allocated as mentioned in
Paragraph 10 above. Segment revenues and results have been disclosed in the Financial Statements itself. Segment assets
and liabilities have been identified to the extent possible in the following table. There are no reportable geographical
segments since the Company provides services to customers in the Indian market only and does not distinguish any reportable
regions within India.
Previous Year Participating Policyholders’
Particulars Total Individual Individual
Assurance Pension
Policy Liabilities 4,043,047 3,336,963 150,520
Provision for linked liabilities 25,693,200 - -
Funds for Future Appropriations 564,521 532,747 -
Reserve for lapsed unit linked policies unlikely to be revived 117,739 - -
Loans 3,406 3,406 -
Investments 7,546,991 3,893,622 150,722
Assets Held to Cover Linked Liabilities 25,693,200 - -
Advances & Other Assets
Outstanding Premium 243,855 237,122 4,642
Due from Other Entities carrying on Insurance business 15,516 2,542 -
Income accrued on investments 148,571 73,408 1,171
Other Assets 354,948 - -
Current Liabilities
Agents Balance 710,607 106,341 345
Balance due to other Insurance Companies 25,093 8,104 135
Payable Unsettled Investment Contracts 47,874 - -
Sundry Creditors 1,671,612 21,267 734
Due to Officers of the Company 1,814 - -
Claims Outstanding 82,131 30,101 -
Premium received in advance 16,928 16,400 399
Premium & Other Deposits 1,058,086 - -
Temporary overdraft as per books of accounts 276,339 - -
Fixed assets are not identifiable to any particular business segment. Depreciation has been allocated based on the assumption
that the use of assets is proportional to the basis referred to in Note 10(b) of Schedule 16.
50
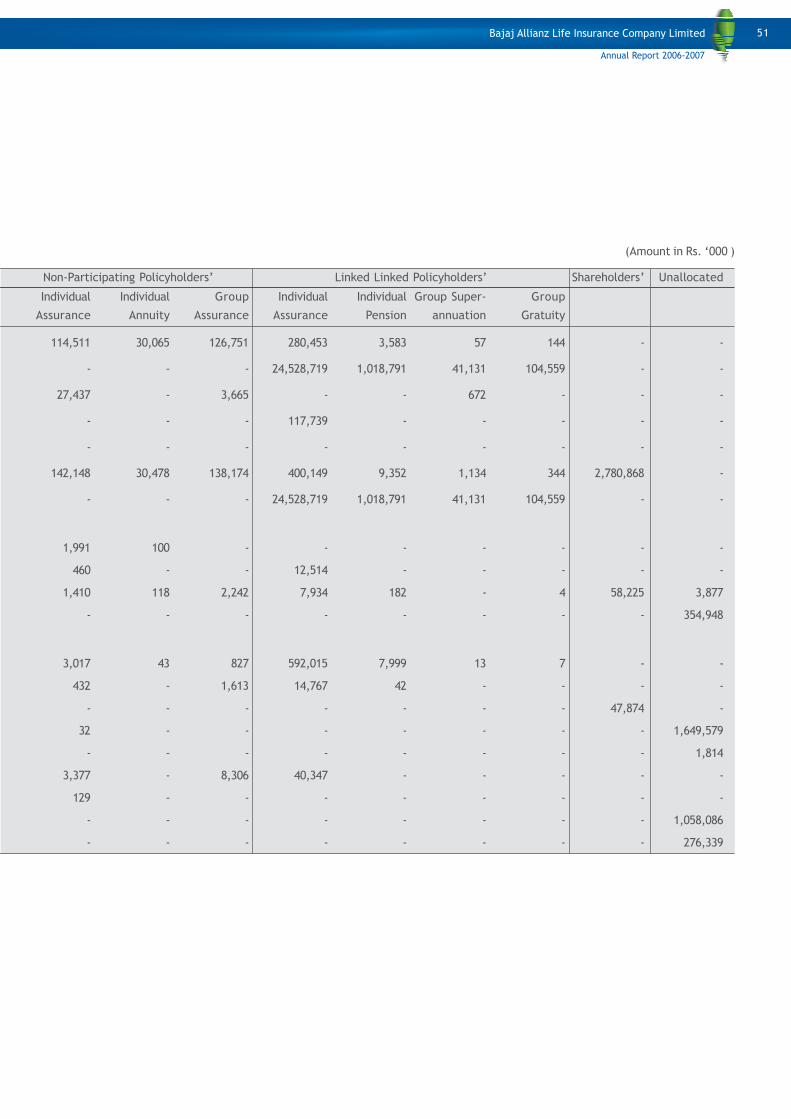
(Amount in Rs. ‘000 )
Non-Participating Policyholders’ Linked Linked Policyholders’ Shareholders’ Unallocated
Individual Individual Group Individual Individual Group Super- Group
Assurance Annuity Assurance Assurance Pension annuation Gratuity
114,511 30,065 126,751 280,453 3,583 57 144 - -
- - - 24,528,719 1,018,791 41,131 104,559 - -
27,437 - 3,665 - - 672 - - -
- - - 117,739 - - - - -
- - - - - - - - -
142,148 30,478 138,174 400,149 9,352 1,134 344 2,780,868 -
- - - 24,528,719 1,018,791 41,131 104,559 - -
1,991 100 - - - - - - -
460 - - 12,514 - - - - -
1,410 118 2,242 7,934 182 - 4 58,225 3,877
- - - - - - - - 354,948
3,017 43 827 592,015 7,999 13 7 - -
432 - 1,613 14,767 42 - - - -
- - - - - - - 47,874 -
32 - - - - - - - 1,649,579
- - - - - - - - 1,814
3,377 - 8,306 40,347 - - - - -
129 - - - - - - - -
- - - - - - - - 1,058,086
- - - - - - - - 276,339
51
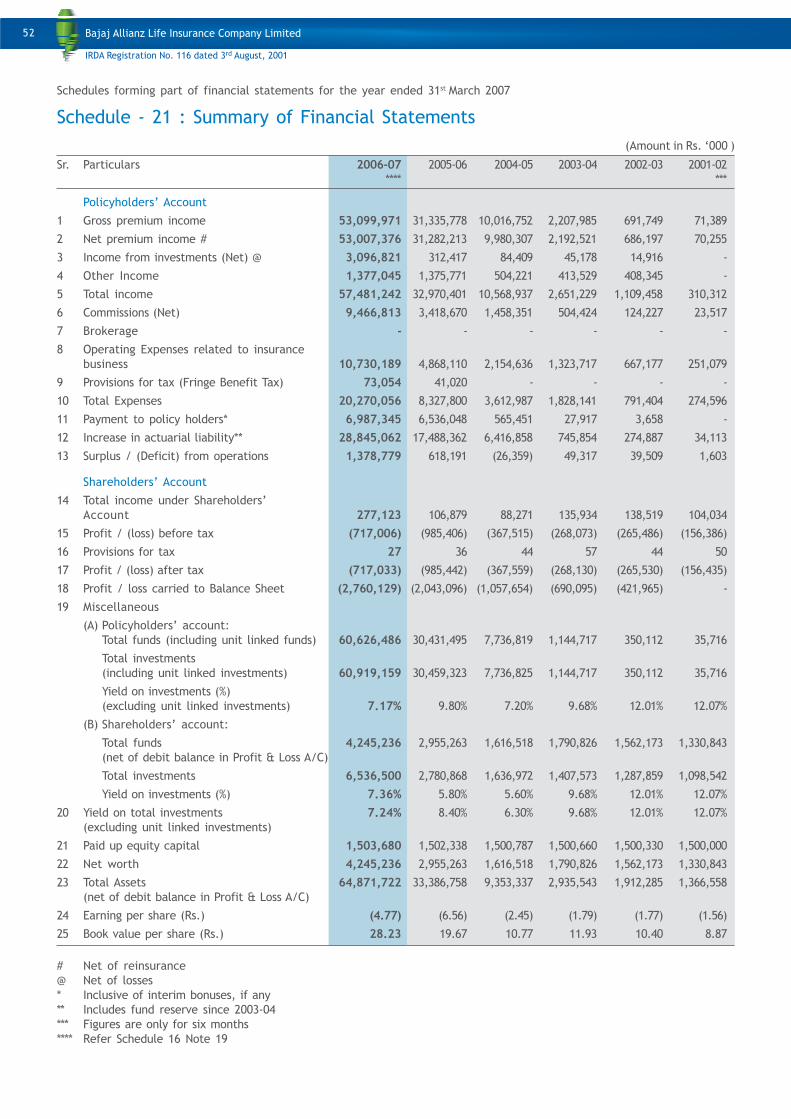
Schedules forming part of financial statements for the year ended 31st March 2007
Schedule - 21 : Summary of Financial Statements
(Amount in Rs. ‘000 )
Sr. Particulars 2006-07 2005-06 2004-05 2003-04 2002-03 2001-02
**** ***
Policyholders’ Account
1 Gross premium income 53,099,971 31,335,778 10,016,752 2,207,985 691,749 71,389
2 Net premium income # 53,007,376 31,282,213 9,980,307 2,192,521 686,197 70,255
3 Income from investments (Net) @ 3,096,821 312,417 84,409 45,178 14,916 -
4 Other Income 1,377,045 1,375,771 504,221 413,529 408,345 -
5 Total income 57,481,242 32,970,401 10,568,937 2,651,229 1,109,458 310,312
6 Commissions (Net) 9,466,813 3,418,670 1,458,351 504,424 124,227 23,517
7 Brokerage - - - - - -
8 Operating Expenses related to insurance
business 10,730,189 4,868,110 2,154,636 1,323,717 667,177 251,079
9 Provisions for tax (Fringe Benefit Tax) 73,054 41,020 - - - -
10 Total Expenses 20,270,056 8,327,800 3,612,987 1,828,141 791,404 274,596
11 Payment to policy holders* 6,987,345 6,536,048 565,451 27,917 3,658 -
12 Increase in actuarial liability** 28,845,062 17,488,362 6,416,858 745,854 274,887 34,113
13 Surplus / (Deficit) from operations 1,378,779 618,191 (26,359) 49,317 39,509 1,603
Shareholders’ Account
14 Total income under Shareholders’
Account 277,123 106,879 88,271 135,934 138,519 104,034
15 Profit / (loss) before tax (717,006) (985,406) (367,515) (268,073) (265,486) (156,386)
16 Provisions for tax 27 36 44 57 44 50
17 Profit / (loss) after tax (717,033) (985,442) (367,559) (268,130) (265,530) (156,435)
18 Profit / loss carried to Balance Sheet (2,760,129) (2,043,096) (1,057,654) (690,095) (421,965) -
19 Miscellaneous
(A) Policyholders’ account:
Total funds (including unit linked funds) 60,626,486 30,431,495 7,736,819 1,144,717 350,112 35,716
Total investments
(including unit linked investments) 60,919,159 30,459,323 7,736,825 1,144,717 350,112 35,716
Yield on investments (%)
(excluding unit linked investments) 7.17% 9.80% 7.20% 9.68% 12.01% 12.07%
(B) Shareholders’ account:
Total funds 4,245,236 2,955,263 1,616,518 1,790,826 1,562,173 1,330,843
(net of debit balance in Profit & Loss A/C)
Total investments 6,536,500 2,780,868 1,636,972 1,407,573 1,287,859 1,098,542
Yield on investments (%) 7.36% 5.80% 5.60% 9.68% 12.01% 12.07%
20 Yield on total investments 7.24% 8.40% 6.30% 9.68% 12.01% 12.07%
(excluding unit linked investments)
21 Paid up equity capital 1,503,680 1,502,338 1,500,787 1,500,660 1,500,330 1,500,000
22 Net worth 4,245,236 2,955,263 1,616,518 1,790,826 1,562,173 1,330,843
23 Total Assets 64,871,722 33,386,758 9,353,337 2,935,543 1,912,285 1,366,558
(net of debit balance in Profit & Loss A/C)
24 Earning per share (Rs.) (4.77) (6.56) (2.45) (1.79) (1.77) (1.56)
25 Book value per share (Rs.) 28.23 19.67 10.77 11.93 10.40 8.87
# Net of reinsurance
@ Net of losses
* Inclusive of interim bonuses, if any
** Includes fund reserve since 2003-04
*** Figures are only for six months
**** Refer Schedule 16 Note 19
52
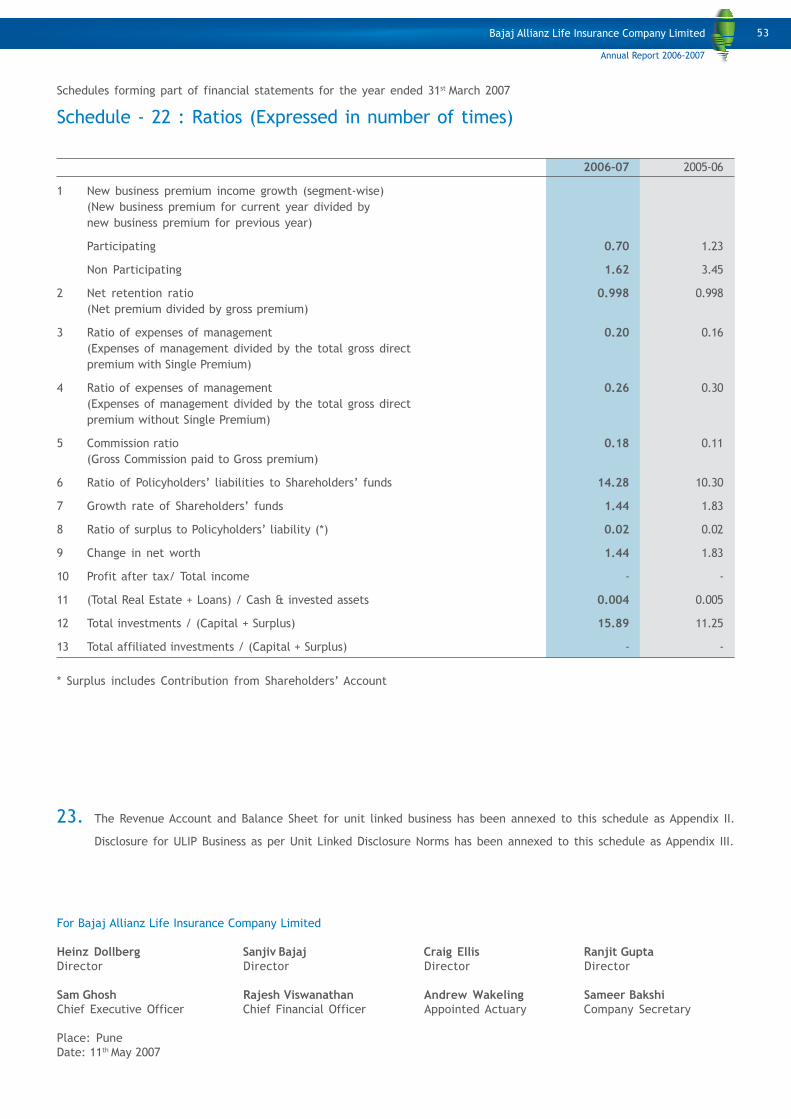
Schedules forming part of financial statements for the year ended 31st March 2007
Schedule - 22 : Ratios (Expressed in number of times)
2006-07 2005-06
1 New business premium income growth (segment-wise)
(New business premium for current year divided by
new business premium for previous year)
Participating 0.70 1.23
Non Participating 1.62 3.45
2 Net retention ratio 0.998 0.998
(Net premium divided by gross premium)
3 Ratio of expenses of management 0.20 0.16
(Expenses of management divided by the total gross direct
premium with Single Premium)
4 Ratio of expenses of management 0.26 0.30
(Expenses of management divided by the total gross direct
premium without Single Premium)
5 Commission ratio 0.18 0.11
(Gross Commission paid to Gross premium)
6 Ratio of Policyholders’ liabilities to Shareholders’ funds 14.28 10.30
7 Growth rate of Shareholders’ funds 1.44 1.83
8 Ratio of surplus to Policyholders’ liability (*) 0.02 0.02
9 Change in net worth 1.44 1.83
10 Profit after tax/ Total income - -
11 (Total Real Estate + Loans) / Cash & invested assets 0.004 0.005
12 Total investments / (Capital + Surplus) 15.89 11.25
13 Total affiliated investments / (Capital + Surplus) - -
* Surplus includes Contribution from Shareholders’ Account
23. The Revenue Account and Balance Sheet for unit linked business has been annexed to this schedule as Appendix II.
Disclosure for ULIP Business as per Unit Linked Disclosure Norms has been annexed to this schedule as Appendix III.
For Bajaj Allianz Life Insurance Company Limited
Heinz Dollberg Sanjiv Bajaj Craig Ellis Ranjit GuptaDirector Director Director Director
Sam Ghosh Rajesh Viswanathan Andrew Wakeling Sameer BakshiChief Executive Officer Chief Financial Officer Appointed Actuary Company Secretary
Place: Pune
Date: 11th
May 2007
53
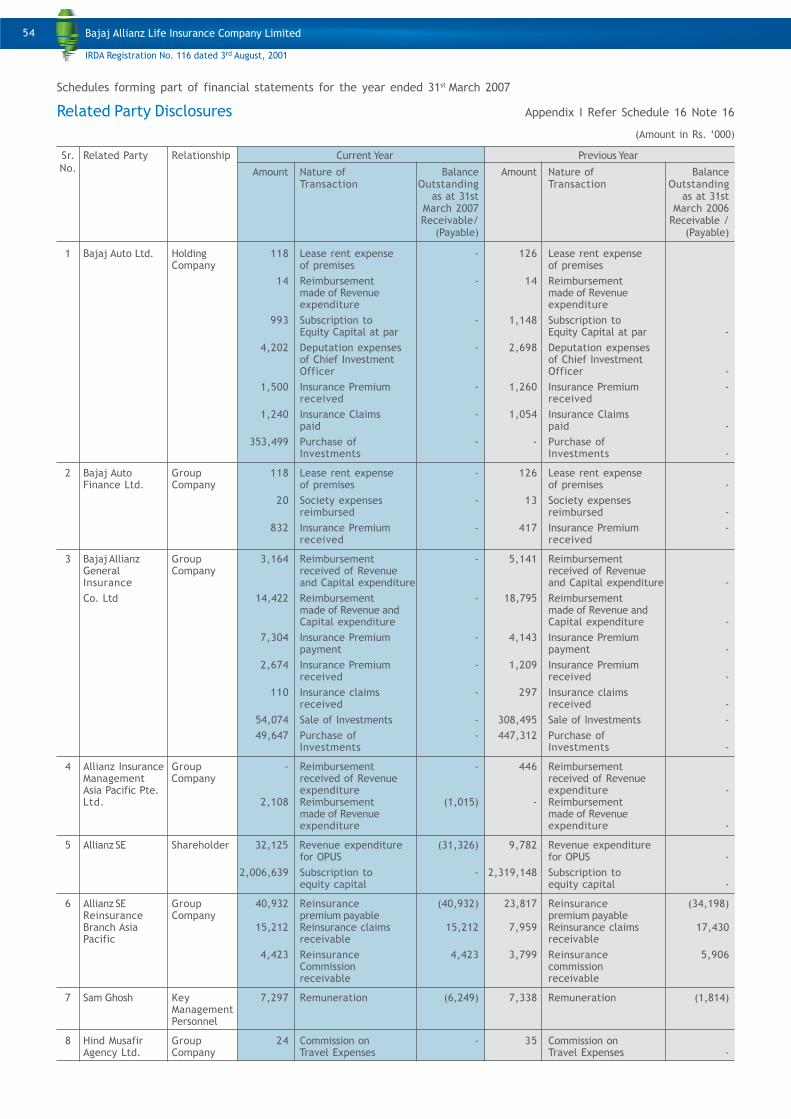
Schedules forming part of financial statements for the year ended 31st March 2007
Related Party Disclosures Appendix I Refer Schedule 16 Note 16
(Amount in Rs. ‘000)
Sr. Related Party Relationship Current Year Previous Year
No. Amount Nature of Balance Amount Nature of BalanceTransaction Outstanding Transaction Outstanding
as at 31st as at 31stMarch 2007 March 2006Receivable/ Receivable / (Payable) (Payable)
1 Bajaj Auto Ltd. Holding 118 Lease rent expense - 126 Lease rent expenseCompany of premises of premises
14 Reimbursement - 14 Reimbursementmade of Revenue made of Revenueexpenditure expenditure
993 Subscription to - 1,148 Subscription toEquity Capital at par Equity Capital at par -
4,202 Deputation expenses - 2,698 Deputation expensesof Chief Investment of Chief InvestmentOfficer Officer -
1,500 Insurance Premium - 1,260 Insurance Premium -received received
1,240 Insurance Claims - 1,054 Insurance Claimspaid paid -
353,499 Purchase of - - Purchase ofInvestments Investments -
2 Bajaj Auto Group 118 Lease rent expense - 126 Lease rent expenseFinance Ltd. Company of premises of premises -
20 Society expenses - 13 Society expensesreimbursed reimbursed -
832 Insurance Premium - 417 Insurance Premium -received received
3 Bajaj Allianz Group 3,164 Reimbursement - 5,141 ReimbursementGeneral Company received of Revenue received of RevenueInsurance and Capital expenditure and Capital expenditure -
Co. Ltd 14,422 Reimbursement - 18,795 Reimbursementmade of Revenue and made of Revenue andCapital expenditure Capital expenditure -
7,304 Insurance Premium - 4,143 Insurance Premiumpayment payment -
2,674 Insurance Premium - 1,209 Insurance Premiumreceived received -
110 Insurance claims - 297 Insurance claimsreceived received -
54,074 Sale of Investments - 308,495 Sale of Investments -
49,647 Purchase of - 447,312 Purchase ofInvestments Investments -
4 Allianz Insurance Group - Reimbursement - 446 ReimbursementManagement Company received of Revenue received of RevenueAsia Pacific Pte. expenditure expenditure -Ltd. 2,108 Reimbursement (1,015) - Reimbursement
made of Revenue made of Revenueexpenditure expenditure -
5 Allianz SE Shareholder 32,125 Revenue expenditure (31,326) 9,782 Revenue expenditurefor OPUS for OPUS -
2,006,639 Subscription to - 2,319,148 Subscription toequity capital equity capital -
6 Allianz SE Group 40,932 Reinsurance (40,932) 23,817 Reinsurance (34,198)Reinsurance Company premium payable premium payableBranch Asia 15,212 Reinsurance claims 15,212 7,959 Reinsurance claims 17,430Pacific receivable receivable
4,423 Reinsurance 4,423 3,799 Reinsurance 5,906Commission commissionreceivable receivable
7 Sam Ghosh Key 7,297 Remuneration (6,249) 7,338 Remuneration (1,814)ManagementPersonnel
8 Hind Musafir Group 24 Commission on - 35 Commission onAgency Ltd. Company Travel Expenses Travel Expenses -
54
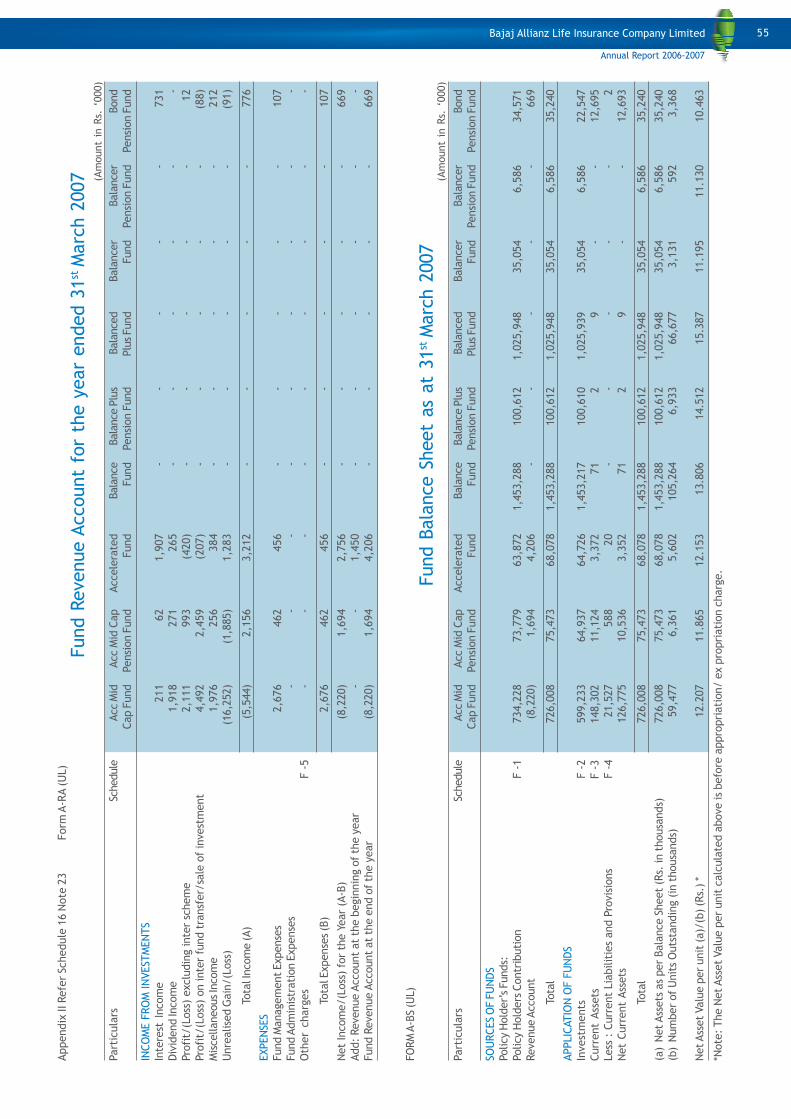
Appendix
II Refe
r Schedule
16 N
ote
23 Form
A-R
A (
UL)
Fund R
evenue A
ccount
for
the y
ear
ended 3
1st M
arc
h 2
007
Part
icula
rsSc
hedule
Acc M
idAcc M
id C
ap
Accele
rate
dBala
nce
Bala
nce
Plu
sBala
nce
dBala
nce
rBala
nce
rBond
Cap F
und
Pensi
on F
und
Fund
Fund
Pensi
on F
und
Plu
s Fund
Fund
Pensi
on F
und
Pensi
on F
und
INCO
ME F
RO
M IN
VEST
MEN
TS
Inte
rest
Incom
e211
62
1,9
07
--
--
-731
Div
idend In
com
e1,9
18
271
265
--
--
--
Pro
fit/
(Loss
) exclu
din
g inte
r sc
hem
e2,1
11
993
(420)
--
--
-12
Pro
fit/
(Loss
) on inte
r fu
nd t
ransf
er/
sale
of
invest
ment
4,4
92
2,4
59
(207)
--
--
-(8
8)
Mis
cellaneous In
com
e1,9
76
256
384
--
--
-212
Unre
alise
d G
ain
/(L
oss
)(1
6,2
52)
(1,8
85)
1,2
83
--
--
-(9
1)
Tota
l In
com
e (A)
(5,5
44)
2,1
56
3,2
12
--
--
-776
EXPEN
SES
Fund M
anagem
ent Expense
s2,6
76
462
456
--
--
-107
Fund A
dm
inis
trati
on E
xpense
s-
--
--
--
--
Oth
er
charg
es
F -
5-
--
--
--
--
Tota
l Expense
s (B
)2,6
76
462
456
--
--
-107
Net
Incom
e/(L
oss
) fo
r th
e Y
ear
(A-B
)(8
,220)
1,6
94
2,7
56
--
--
-669
Add:
Revenue A
ccount
at
the b
egin
nin
g o
f th
e y
ear
--
1,4
50
--
--
--
Fund R
evenue A
ccount
at
the e
nd o
f th
e y
ear
(8,2
20)
1,6
94
4,2
06
--
--
-669
FO
RM
A-B
S (U
L)
Fund B
ala
nce S
heet
as
at
31
st M
arc
h 2
007
Part
icula
rsSc
hedule
Acc M
idAcc M
id C
ap
Accele
rate
dBala
nce
Bala
nce
Plu
sBala
nce
dBala
nce
rBala
nce
rBond
Cap F
und
Pensi
on F
und
Fund
Fund
Pensi
on F
und
Plu
s Fund
Fund
Pensi
on F
und
Pensi
on F
und
SOU
RCES
OF F
UN
DS
Policy H
old
er’
s Funds:
Policy H
old
ers
Contr
ibuti
on
F -
1734,2
28
73,7
79
63,8
72
1,4
53,2
88
100,6
12
1,0
25,9
48
35,0
54
6,5
86
34,5
71
Reve
nue A
ccount
(8,2
20)
1,6
94
4,2
06
--
--
-669
Tota
l726,0
08
75,4
73
68,0
78
1,4
53,2
88
100,6
12
1,0
25,9
48
35,0
54
6,5
86
35,2
40
APPLIC
ATIO
N O
F F
UN
DS
Invest
ments
F -
2599,2
33
64,9
37
64,7
26
1,4
53,2
17
100,6
10
1,0
25,9
39
35,0
54
6,5
86
22,5
47
Curr
ent
Ass
ets
F -
3148,3
02
11,1
24
3,3
72
71
29
--
12,6
95
Less
: C
urr
ent
Lia
bilit
ies
and P
rovis
ions
F -
421,5
27
588
20
--
--
-2
Net
Curr
ent
Ass
ets
126,7
75
10,5
36
3,3
52
71
29
--
12,6
93
Tota
l726,0
08
75,4
73
68,0
78
1,4
53,2
88
100,6
12
1,0
25,9
48
35,0
54
6,5
86
35,2
40
(a)
Net Ass
ets
as
per
Bala
nce S
heet
(Rs.
in t
housa
nds)
726,0
08
75,4
73
68,0
78
1,4
53,2
88
100,6
12
1,0
25,9
48
35,0
54
6,5
86
35,2
40
(b)
Num
ber
of
Unit
s O
uts
tandin
g (
in t
housa
nds)
59,4
77
6,3
61
5,6
02
105,2
64
6,9
33
66,6
77
3,1
31
592
3,3
68
Net Ass
et
Valu
e p
er
unit
(a)/
(b) (R
s.) *
12.2
07
11.8
65
12.1
53
13.8
06
14.5
12
15.3
87
11.1
95
11.1
30
10.4
63
*Note
: The N
et
Ass
et
Valu
e p
er
unit
calc
ula
ted a
bove is
befo
re a
ppro
pri
ati
on/ e
x p
ropri
ati
on c
harg
e.
55
(Am
ount
in R
s. ‘
000)
(Am
ount
in R
s. ‘
000)
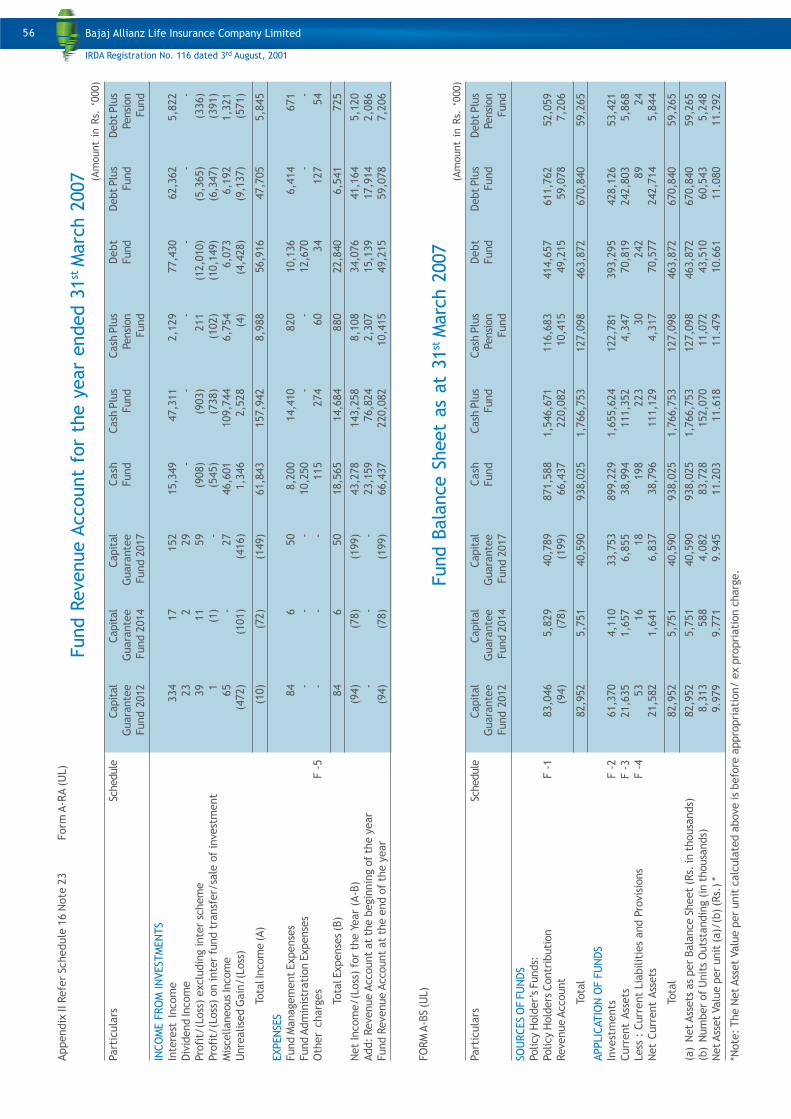
56
Appendix
II Refe
r Schedule
16 N
ote
23 Form
A-R
A (
UL)
Fund R
evenue A
ccount
for
the y
ear
ended 3
1st M
arc
h 2
007
Part
icula
rsSc
hedule
Capit
al
Capit
al
Capit
al
Cash
Cash
Plu
sCash
Plu
sD
ebt
Debt Plu
sDebt Plu
s
Guara
nte
e G
uara
nte
e G
uara
nte
eFund
Fund
Pensi
on
Fund
Fund
Pensi
on
Fund 2
012
Fund 2
014
Fund 2
017
Fund
Fund
INCO
ME F
RO
M IN
VEST
MEN
TS
Inte
rest
Incom
e334
17
152
15,3
49
47,3
11
2,1
29
77,4
30
62,3
62
5,8
22
Div
idend In
com
e23
229
--
--
--
Pro
fit/
(Loss
) exclu
din
g inte
r sc
hem
e39
11
59
(908)
(903)
211
(12,0
10)
(5,3
65)
(336)
Pro
fit/
(Loss
) on inte
r fu
nd t
ransf
er/
sale
of
invest
ment
1(1
)-
(545)
(738)
(102)
(10,1
49)
(6,3
47)
(391)
Mis
cellaneous In
com
e65
-27
46,6
01
109,7
44
6,7
54
6,0
73
6,1
92
1,3
21
Unre
alise
d G
ain
/(L
oss
)(4
72)
(101)
(416)
1,3
46
2,5
28
(4)
(4,4
28)
(9,1
37)
(571)
Tota
l Incom
e (A)
(10)
(72)
(149)
61,8
43
157,9
42
8,9
88
56,9
16
47,7
05
5,8
45
EXPEN
SES
Fund M
anagem
ent
Expense
s84
650
8,2
00
14,4
10
820
10,1
36
6,4
14
671
Fund A
dm
inis
trati
on E
xpense
s-
--
10,2
50
--
12,6
70
--
Oth
er
charg
es
F -
5-
--
115
274
60
34
127
54
Tota
l Expense
s (B
)84
650
18,5
65
14,6
84
880
22,8
40
6,5
41
725
Net
Incom
e/(L
oss
) fo
r th
e Y
ear
(A-B
)(9
4)
(78)
(199)
43,2
78
143,2
58
8,1
08
34,0
76
41,1
64
5,1
20
Add:
Revenue A
ccount
at
the b
egin
nin
g o
f th
e y
ear
--
-23,1
59
76,8
24
2,3
07
15,1
39
17,9
14
2,0
86
Fund R
evenue A
ccount
at
the e
nd o
f th
e y
ear
(94)
(78)
(199)
66,4
37
220,0
82
10,4
15
49,2
15
59,0
78
7,2
06
FO
RM
A-B
S (U
L)
Fund B
ala
nce S
heet
as
at
31
st M
arc
h 2
007
Part
icula
rsSc
hedule
Capit
al
Capit
al
Capit
al
Cash
Cash
Plu
sCash
Plu
sD
ebt
Debt Plu
sDebt Plu
s
Guara
nte
e G
uara
nte
e G
uara
nte
eFund
Fund
Pensi
on
Fund
Fund
Pensi
on
Fund 2
012
Fund 2
014
Fund 2
017
Fund
Fund
SOU
RCES
OF F
UN
DS
Policy H
old
er’
s Funds:
Policy H
old
ers
Contr
ibuti
on
F -
183,0
46
5,8
29
40,7
89
871,5
88
1,5
46,6
71
116,6
83
414,6
57
611,7
62
52,0
59
Reve
nue A
ccount
(94)
(78)
(199)
66,4
37
220,0
82
10,4
15
49,2
15
59,0
78
7,2
06
Tota
l82,9
52
5,7
51
40,5
90
938,0
25
1,7
66,7
53
127,0
98
463,8
72
670,8
40
59,2
65
APPLIC
ATIO
N O
F F
UN
DS
Invest
ments
F -
261,3
70
4,1
10
33,7
53
899,2
29
1,6
55,6
24
122,7
81
393,2
95
428,1
26
53,4
21
Curr
ent
Ass
ets
F -
321,6
35
1,6
57
6,8
55
38,9
94
111,3
52
4,3
47
70,8
19
242,8
03
5,8
68
Less
: C
urr
ent
Lia
bilit
ies
and P
rovis
ions
F -
453
16
18
198
223
30
242
89
24
Net
Curr
ent
Ass
ets
21,5
82
1,6
41
6,8
37
38,7
96
111,1
29
4,3
17
70,5
77
242,7
14
5,8
44
Tota
l82,9
52
5,7
51
40,5
90
938,0
25
1,7
66,7
53
127,0
98
463,8
72
670,8
40
59,2
65
(a)
Net Ass
ets
as
per
Bala
nce S
heet
(Rs.
in t
housa
nds)
82,9
52
5,7
51
40,5
90
938,0
25
1,7
66,7
53
127,0
98
463,8
72
670,8
40
59,2
65
(b)
Num
ber
of
Unit
s O
uts
tandin
g (
in t
housa
nds)
8,3
13
588
4,0
82
83,7
28
152,0
70
11,0
72
43,5
10
60,5
43
5,2
48
Net Ass
et
Valu
e p
er
unit
(a)/
(b) (R
s.) *
9.9
79
9.7
71
9.9
45
11.2
03
11.6
18
11.4
79
10.6
61
11.0
80
11.2
92
*Note
: The N
et
Ass
et
Valu
e p
er
unit
calc
ula
ted a
bove is
befo
re a
ppro
pri
ati
on/ e
x p
ropri
ati
on c
harg
e.
(Am
ount
in R
s. ‘
000)
(Am
ount
in R
s. ‘
000)
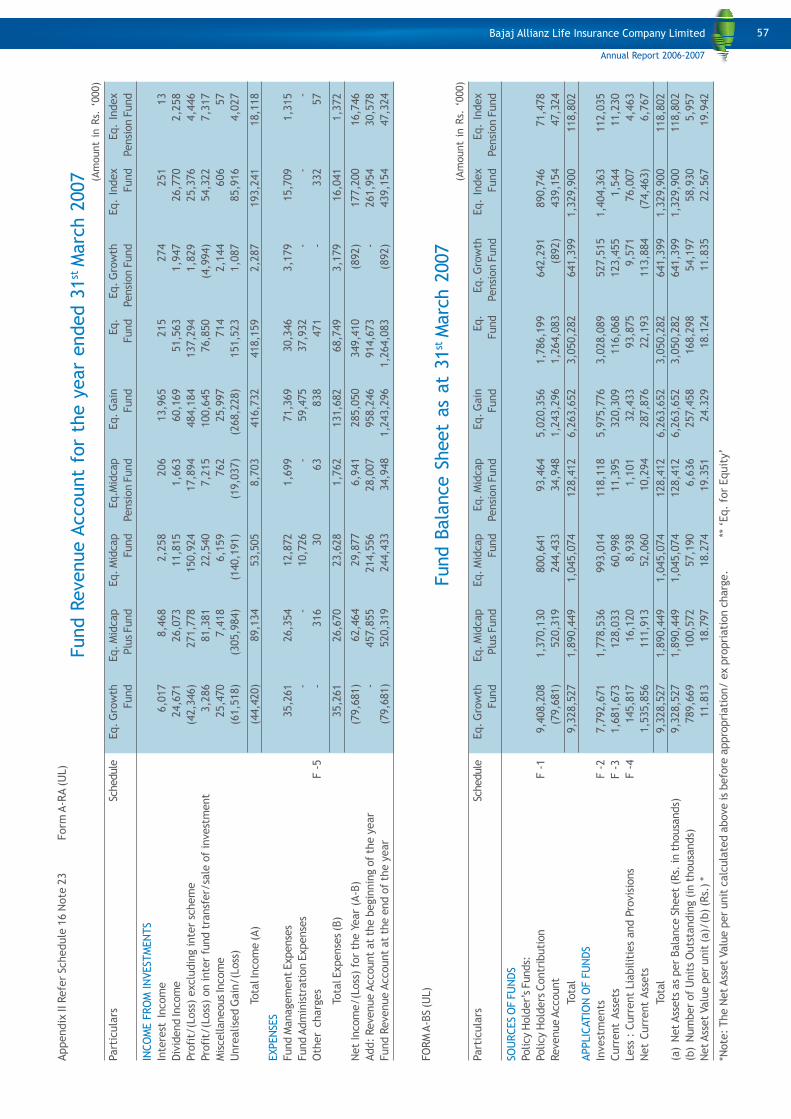
57
Appendix
II Refe
r Schedule
16 N
ote
23 Form
A-R
A (
UL)
Fund R
evenue A
ccount
for
the y
ear
ended 3
1st M
arc
h 2
007
Part
icula
rsSc
hedule
Eq. G
row
thEq. M
idcap
Eq. M
idcap
Eq.M
idcap
Eq. G
ain
Eq.
Eq. G
row
thEq.
Index
Eq.
Index
Fund
Plu
s Fund
Fund
Pensi
on F
und
Fund
Fund
Pensi
on F
und
Fund
Pensi
on F
und
INCO
ME F
RO
M IN
VEST
MEN
TS
Inte
rest
Incom
e6,0
17
8,4
68
2,2
58
206
13,9
65
215
274
251
13
Div
idend In
com
e24,6
71
26,0
73
11,8
15
1,6
63
60,1
69
51,5
63
1,9
47
26,7
70
2,2
58
Pro
fit/
(Loss
) exclu
din
g inte
r sc
hem
e(4
2,3
46)
271,7
78
150,9
24
17,8
94
484,1
84
137,2
94
1,8
29
25,3
76
4,4
46
Pro
fit/
(Loss
) on inte
r fu
nd t
ransf
er/
sale
of
invest
ment
3,2
86
81,3
81
22,5
40
7,2
15
100,6
45
76,8
50
(4,9
94)
54,3
22
7,3
17
Mis
cellaneous In
com
e25,4
70
7,4
18
6,1
59
762
25,9
97
714
2,1
44
606
57
Unre
alise
d G
ain
/(L
oss
)(6
1,5
18)
(305,9
84)
(140,1
91)
(19,0
37)
(268,2
28)
151,5
23
1,0
87
85,9
16
4,0
27
Tota
l In
com
e (A)
(44,4
20)
89,1
34
53,5
05
8,7
03
416,7
32
418,1
59
2,2
87
193,2
41
18,1
18
EXPEN
SES
Fund M
anagem
ent
Expense
s35,2
61
26,3
54
12,8
72
1,6
99
71,3
69
30,3
46
3,1
79
15,7
09
1,3
15
Fund A
dm
inis
trati
on E
xpense
s-
-10,7
26
-59,4
75
37,9
32
--
-
Oth
er
charg
es
F -
5-
316
30
63
838
471
-332
57
Tota
l Expense
s (B
)35,2
61
26,6
70
23,6
28
1,7
62
131,6
82
68,7
49
3,1
79
16,0
41
1,3
72
Net
Incom
e/(L
oss
) fo
r th
e Y
ear
(A-B
)(7
9,6
81)
62,4
64
29,8
77
6,9
41
285,0
50
349,4
10
(892)
177,2
00
16,7
46
Add:
Revenue A
ccount
at
the b
egin
nin
g o
f th
e y
ear
-457,8
55
214,5
56
28,0
07
958,2
46
914,6
73
-261,9
54
30,5
78
Fund R
evenue A
ccount
at
the e
nd o
f th
e y
ear
(79,6
81)
520,3
19
244,4
33
34,9
48
1,2
43,2
96
1,2
64,0
83
(892)
439,1
54
47,3
24
FO
RM
A-B
S (U
L)
Fund B
ala
nce S
heet
as
at
31
st M
arc
h 2
007
Part
icula
rsSc
hedule
Eq. G
row
thEq. M
idcap
Eq. M
idcap
Eq. M
idcap
Eq. G
ain
Eq.
Eq. G
row
thEq.
Index
Eq.
Index
Fund
Plu
s Fund
Fund
Pensi
on F
und
Fund
Fund
Pensi
on F
und
Fund
Pensi
on F
und
SOU
RCES
OF F
UN
DS
Policy H
old
er’
s Funds:
Policy H
old
ers
Contr
ibuti
on
F -
19,4
08,2
08
1,3
70,1
30
800,6
41
93,4
64
5,0
20,3
56
1,7
86,1
99
642,2
91
890,7
46
71,4
78
Revenue A
ccount
(79,6
81)
520,3
19
244,4
33
34,9
48
1,2
43,2
96
1,2
64,0
83
(892)
439,1
54
47,3
24
Tota
l9,3
28,5
27
1,8
90,4
49
1,0
45,0
74
128,4
12
6,2
63,6
52
3,0
50,2
82
641,3
99
1,3
29,9
00
118,8
02
APPLIC
ATIO
N O
F F
UN
DS
Invest
ments
F -
27,7
92,6
71
1,7
78,5
36
993,0
14
118,1
18
5,9
75,7
76
3,0
28,0
89
527,5
15
1,4
04,3
63
112,0
35
Curr
ent
Ass
ets
F -
31,6
81,6
73
128,0
33
60,9
98
11,3
95
320,3
09
116,0
68
123,4
55
1,5
44
11,2
30
Less
: C
urr
ent
Lia
bilit
ies
and P
rovis
ions
F -
4145,8
17
16,1
20
8,9
38
1,1
01
32,4
33
93,8
75
9,5
71
76,0
07
4,4
63
Net
Curr
ent
Ass
ets
1,5
35,8
56
111,9
13
52,0
60
10,2
94
287,8
76
22,1
93
113,8
84
(74,4
63)
6,7
67
Tota
l9,3
28,5
27
1,8
90,4
49
1,0
45,0
74
128,4
12
6,2
63,6
52
3,0
50,2
82
641,3
99
1,3
29,9
00
118,8
02
(a)
Net Ass
ets
as
per
Bala
nce S
heet
(Rs.
in t
housa
nds)
9,3
28,5
27
1,8
90,4
49
1,0
45,0
74
128,4
12
6,2
63,6
52
3,0
50,2
82
641,3
99
1,3
29,9
00
118,8
02
(b)
Num
ber
of
Unit
s O
uts
tandin
g (
in t
housa
nds)
789,6
69
100,5
72
57,1
90
6,6
36
257,4
58
168,2
98
54,1
97
58,9
30
5,9
57
Net Ass
et
Valu
e p
er
unit
(a)/
(b) (R
s.) *
11.8
13
18.7
97
18.2
74
19.3
51
24.3
29
18.1
24
11.8
35
22.5
67
19.9
42
*Note
: The N
et Ass
et
Valu
e p
er
unit
calc
ula
ted a
bove is
befo
re a
ppro
pri
ati
on/ e
x p
ropri
ati
on c
harg
e.
**
‘Eq.
for
Equit
y’
(Am
ount
in R
s. ‘
000)
(Am
ount
in R
s. ‘
000)
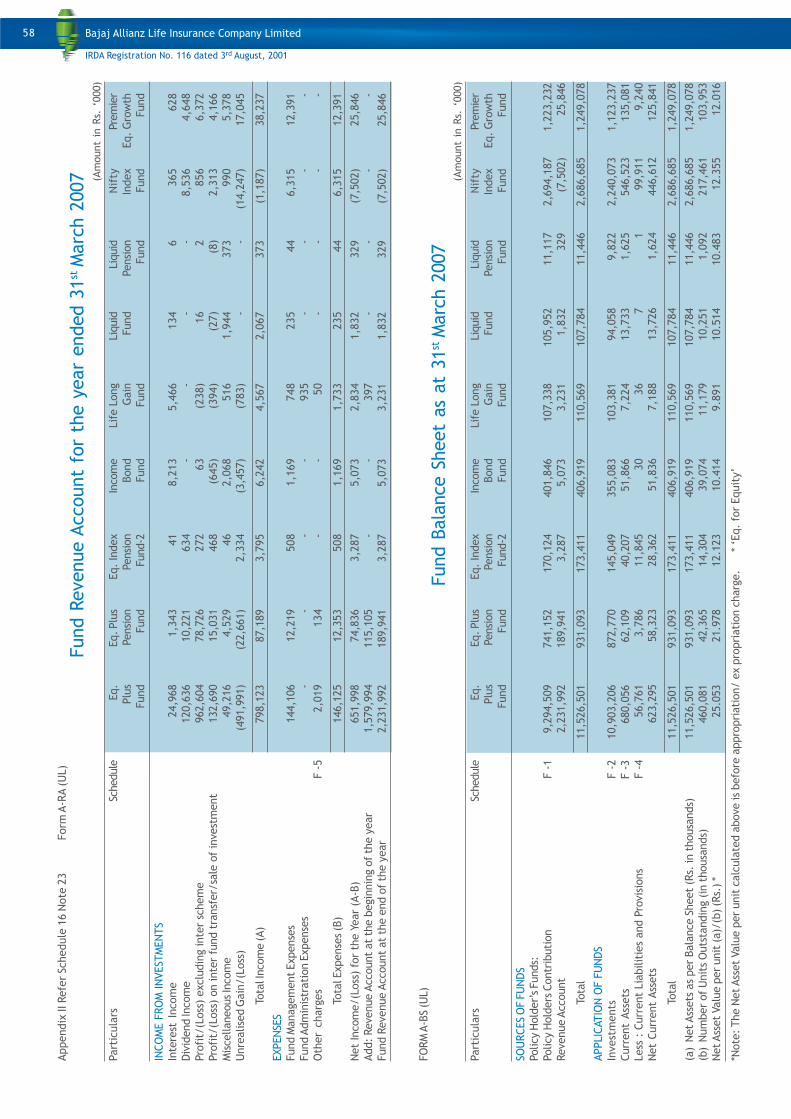
58
Appendix
II Refe
r Schedule
16 N
ote
23 Form
A-R
A (
UL)
Fund R
evenue A
ccount
for
the y
ear
ended 3
1st M
arc
h 2
007
Part
icula
rsSc
hedule
Eq.
Eq. Plu
sEq.
Index
Inco
me
Lif
e L
ong
Liquid
Liquid
Nif
tyPre
mie
r
Plu
s P
ensi
on
Pensi
on
Bond
Gain
Fund
Pensi
on
Index
Eq.
Gro
wth
Fund
Fund
Fund-2
Fund
Fund
Fund
Fund
Fund
INCO
ME F
RO
M IN
VEST
MEN
TS
Inte
rest
Incom
e24,9
68
1,3
43
41
8,2
13
5,4
66
134
6365
628
Div
idend In
com
e120,6
36
10,2
21
634
--
--
8,5
36
4,6
48
Pro
fit/
(Loss
) exclu
din
g inte
r sc
hem
e962,6
04
78,7
26
272
63
(238)
16
2856
6,3
72
Pro
fit/
(Loss
) on inte
r fu
nd t
ransf
er/
sale
of
invest
ment
132,6
90
15,0
31
468
(645)
(394)
(27)
(8)
2,3
13
4,1
66
Mis
cellaneous In
com
e49,2
16
4,5
29
46
2,0
68
516
1,9
44
373
990
5,3
78
Unre
alise
d G
ain
/(L
oss
)(4
91,9
91)
(22,6
61)
2,3
34
(3,4
57)
(783)
--
(14,2
47)
17,0
45
Tota
l Incom
e (A)
798,1
23
87,1
89
3,7
95
6,2
42
4,5
67
2,0
67
373
(1,1
87)
38,2
37
EXPEN
SES
Fund M
anagem
ent
Expense
s144,1
06
12,2
19
508
1,1
69
748
235
44
6,3
15
12,3
91
Fund A
dm
inis
trati
on E
xpense
s-
--
-935
--
--
Oth
er
charg
es
F -
52,0
19
134
--
50
--
--
Tota
l Expense
s (B
)146,1
25
12,3
53
508
1,1
69
1,7
33
235
44
6,3
15
12,3
91
Net
Incom
e/(L
oss
) fo
r th
e Y
ear
(A-B
)651,9
98
74,8
36
3,2
87
5,0
73
2,8
34
1,8
32
329
(7,5
02)
25,8
46
Add:
Revenue A
ccount
at
the b
egin
nin
g o
f th
e y
ear
1,5
79,9
94
115,1
05
--
397
--
--
Fund R
evenue A
ccount
at
the e
nd o
f th
e y
ear
2,2
31,9
92
189,9
41
3,2
87
5,0
73
3,2
31
1,8
32
329
(7,5
02)
25,8
46
FO
RM
A-B
S (U
L)
Fund B
ala
nce S
heet
as
at
31
st M
arc
h 2
007
Part
icula
rsSc
hedule
Eq.
Eq. Plu
sEq.
Index
Inco
me
Lif
e L
ong
Liquid
Liquid
Nif
tyPre
mie
r
Plu
s P
ensi
on
Pensi
on
Bond
Gain
Fund
Pensi
on
Index
Eq.
Gro
wth
Fund
Fund
Fund-2
Fund
Fund
Fund
Fund
Fund
SOU
RCES
OF F
UN
DS
Policy H
old
er’
s Funds:
Policy H
old
ers
Contr
ibuti
on
F -
19,2
94,5
09
741,1
52
170,1
24
401,8
46
107,3
38
105,9
52
11,1
17
2,6
94,1
87
1,2
23,2
32
Revenue A
ccount
2,2
31,9
92
189,9
41
3,2
87
5,0
73
3,2
31
1,8
32
329
(7,5
02)
25,8
46
Tota
l11,5
26,5
01
931,0
93
173,4
11
406,9
19
110,5
69
107,7
84
11,4
46
2,6
86,6
85
1,2
49,0
78
APPLIC
ATIO
N O
F F
UN
DS
Invest
ments
F -
210,9
03,2
06
872,7
70
145,0
49
355,0
83
103,3
81
94,0
58
9,8
22
2,2
40,0
73
1,1
23,2
37
Curr
ent
Ass
ets
F -
3680,0
56
62,1
09
40,2
07
51,8
66
7,2
24
13,7
33
1,6
25
546,5
23
135,0
81
Less
: C
urr
ent
Lia
bilit
ies
and P
rovis
ions
F -
456,7
61
3,7
86
11,8
45
30
36
71
99,9
11
9,2
40
Net
Curr
ent
Ass
ets
623,2
95
58,3
23
28,3
62
51,8
36
7,1
88
13,7
26
1,6
24
446,6
12
125,8
41
Tota
l11,5
26,5
01
931,0
93
173,4
11
406,9
19
110,5
69
107,7
84
11,4
46
2,6
86,6
85
1,2
49,0
78
(a)
Net Ass
ets
as
per
Bala
nce S
heet
(Rs.
in t
housa
nds)
11,5
26,5
01
931,0
93
173,4
11
406,9
19
110,5
69
107,7
84
11,4
46
2,6
86,6
85
1,2
49,0
78
(b)
Num
ber
of
Unit
s O
uts
tandin
g (
in t
housa
nds)
460,0
81
42,3
65
14,3
04
39,0
74
11,1
79
10,2
51
1,0
92
217,4
61
103,9
53
Net Ass
et
Valu
e p
er
unit
(a)/
(b) (R
s.) *
25.0
53
21.9
78
12.1
23
10.4
14
9.8
91
10.5
14
10.4
83
12.3
55
12.0
16
*Note
: The N
et Ass
et
Valu
e p
er
unit
calc
ula
ted a
bove is
befo
re a
ppro
pri
ati
on/ e
x p
ropri
ati
on c
harg
e.
*
‘Eq.
for
Equit
y’
(Am
ount
in R
s. ‘
000)
(Am
ount
in R
s. ‘
000)
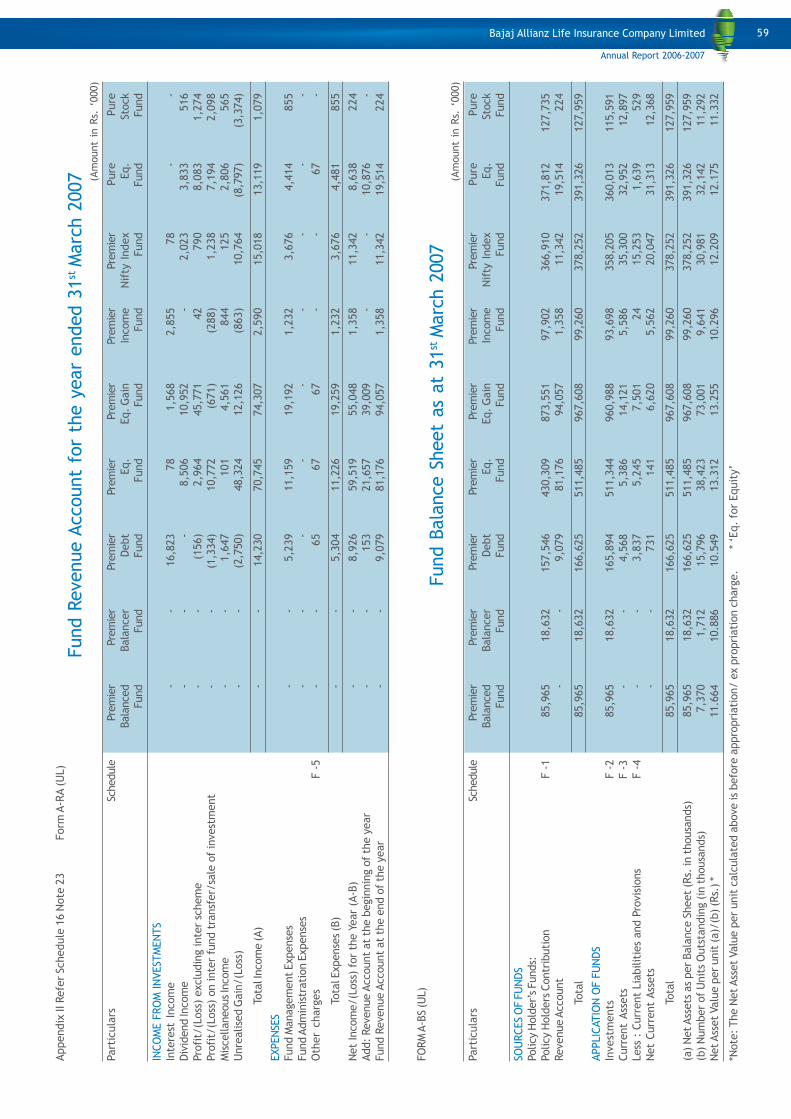
59
Appendix
II Refe
r Schedule
16 N
ote
23 Form
A-R
A (
UL)
Fund R
evenue A
ccount
for
the y
ear
ended 3
1st M
arc
h 2
007
Part
icula
rsSc
hedule
Pre
mie
rPre
mie
rPre
mie
rPre
mie
rPre
mie
rPre
mie
rPre
mie
rPure
Pure
Bala
nce
d B
ala
ncer
Debt
Eq.
Eq. G
ain
Incom
eN
ifty
Index
Eq.
Sto
ck
Fund
Fund
Fund
Fund
Fund
Fund
Fund
Fund
Fund
INCO
ME F
RO
M IN
VEST
MEN
TS
Inte
rest
Incom
e-
-16,8
23
78
1,5
68
2,8
55
78
--
Div
idend In
com
e-
--
8,5
06
10,9
52
-2,0
23
3,8
33
516
Pro
fit/
(Loss
) exclu
din
g inte
r sc
hem
e-
-(1
56)
2,9
64
45,7
71
42
790
8,0
83
1,2
74
Pro
fit/
(Loss
) on inte
r fu
nd t
ransf
er/
sale
of
invest
ment
--
(1,3
34)
10,7
72
(671)
(288)
1,2
38
7,1
94
2,0
98
Mis
cellaneous In
com
e-
-1,6
47
101
4,5
61
844
125
2,8
06
565
Unre
alise
d G
ain
/(L
oss
)-
-(2
,750)
48,3
24
12,1
26
(863)
10,7
64
(8,7
97)
(3,3
74)
Tota
l Incom
e (A)
--
14,2
30
70,7
45
74,3
07
2,5
90
15,0
18
13,1
19
1,0
79
EXPEN
SES
Fund M
anagem
ent
Expense
s-
-5,2
39
11,1
59
19,1
92
1,2
32
3,6
76
4,4
14
855
Fund A
dm
inis
trati
on E
xpense
s-
--
--
--
--
Oth
er
charg
es
F -
5-
-65
67
67
--
67
-
Tota
l Expense
s (B
)-
-5,3
04
11,2
26
19,2
59
1,2
32
3,6
76
4,4
81
855
Net
Incom
e/(L
oss
) fo
r th
e Y
ear
(A-B
)-
-8,9
26
59,5
19
55,0
48
1,3
58
11,3
42
8,6
38
224
Add:
Revenue A
ccount
at
the b
egin
nin
g o
f th
e y
ear
--
153
21,6
57
39,0
09
--
10,8
76
-
Fund R
evenue A
ccount
at
the e
nd o
f th
e y
ear
--
9,0
79
81,1
76
94,0
57
1,3
58
11,3
42
19,5
14
224
FO
RM
A-B
S (U
L)
Fund B
ala
nce S
heet
as
at
31
st M
arc
h 2
007
Part
icula
rsSc
hedule
Pre
mie
rPre
mie
rPre
mie
rPre
mie
rPre
mie
rPre
mie
rPre
mie
rPure
Pure
Bala
nce
d B
ala
ncer
Debt
Eq.
Eq. G
ain
Incom
eN
ifty
Index
Eq.
Sto
ck
Fund
Fund
Fund
Fund
Fund
Fund
Fund
Fund
Fund
SOU
RCES
OF F
UN
DS
Policy H
old
er’
s Funds:
Policy H
old
ers
Contr
ibuti
on
F -
185,9
65
18,6
32
157,5
46
430,3
09
873,5
51
97,9
02
366,9
10
371,8
12
127,7
35
Revenue A
ccount
--
9,0
79
81,1
76
94,0
57
1,3
58
11,3
42
19,5
14
224
Tota
l85,9
65
18,6
32
166,6
25
511,4
85
967,6
08
99,2
60
378,2
52
391,3
26
127,9
59
APPLIC
ATIO
N O
F F
UN
DS
Invest
ments
F -
285,9
65
18,6
32
165,8
94
511,3
44
960,9
88
93,6
98
358,2
05
360,0
13
115,5
91
Curr
ent
Ass
ets
F -
3-
-4,5
68
5,3
86
14,1
21
5,5
86
35,3
00
32,9
52
12,8
97
Less
: C
urr
ent
Lia
bilit
ies
and P
rovis
ions
F -
4-
-3,8
37
5,2
45
7,5
01
24
15,2
53
1,6
39
529
Net
Curr
ent
Ass
ets
--
731
141
6,6
20
5,5
62
20,0
47
31,3
13
12,3
68
Tota
l85,9
65
18,6
32
166,6
25
511,4
85
967,6
08
99,2
60
378,2
52
391,3
26
127,9
59
(a)
Net Ass
ets
as
per
Bala
nce S
heet
(Rs.
in t
housa
nds)
85,9
65
18,6
32
166,6
25
511,4
85
967,6
08
99,2
60
378,2
52
391,3
26
127,9
59
(b)
Num
ber
of
Unit
s O
uts
tandin
g (
in t
housa
nds)
7,3
70
1,7
12
15,7
96
38,4
23
73,0
01
9,6
41
30,9
81
32,1
42
11,2
92
Net Ass
et
Valu
e p
er
unit
(a)/
(b) (R
s.) *
11.6
64
10.8
86
10.5
49
13.3
12
13.2
55
10.2
96
12.2
09
12.1
75
11.3
32
*Note
: The N
et Ass
et
Valu
e p
er
unit
calc
ula
ted a
bove is
befo
re a
ppro
pri
ati
on/ e
x p
ropri
ati
on c
harg
e.
*
‘Eq.
for
Equit
y’
(Am
ount
in R
s. ‘
000)
(Am
ount
in R
s. ‘
000)
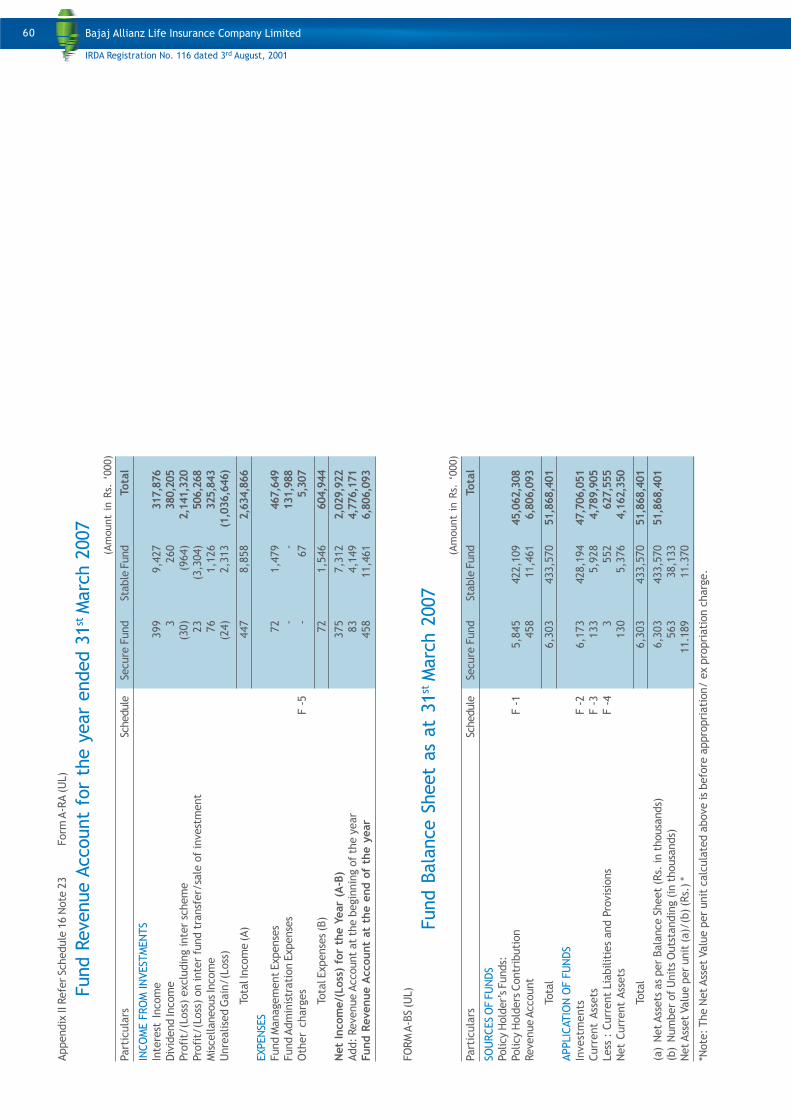
60
(Am
ount
in R
s. ‘
000)
Appendix
II Refe
r Sc
hedule
16 N
ote
23
Form
A-R
A (U
L)
Fund R
evenue A
ccount
for
the y
ear
ended 3
1st M
arc
h 2
007
Part
icula
rsSc
hedule
Secure
Fund
Stable
Fund
Tota
l
INCO
ME F
RO
M IN
VEST
MEN
TS
Inte
rest
Incom
e399
9,4
27
317,8
76
Div
idend In
com
e3
260
380,2
05
Pro
fit/
(Loss
) exclu
din
g inte
r sc
hem
e(3
0)
(964)
2,1
41,3
20
Pro
fit/
(Loss
) on inte
r fu
nd t
ransf
er/
sale
of
invest
ment
23
(3,3
04)
506,2
68
Mis
cellaneous In
com
e76
1,1
26
325,8
43
Unre
alise
d G
ain
/(L
oss
)(2
4)
2,3
13
(1,0
36,6
46)
Tota
l Incom
e (A)
447
8,8
58
2,6
34,8
66
EXPEN
SES
Fund M
anagem
ent Expense
s72
1,4
79
467,6
49
Fund A
dm
inis
trati
on E
xpense
s-
-131,9
88
Oth
er
charg
es
F -
5-
67
5,3
07
Tota
l Expense
s (B
)72
1,5
46
604,9
44
Net
Incom
e/(
Loss
) fo
r th
e Y
ear
(A-B
)375
7,3
12
2,0
29,9
22
Add:
Revenue A
ccount
at
the b
egin
nin
g o
f th
e y
ear
83
4,1
49
4,7
76,1
71
Fund R
evenue A
ccount
at
the e
nd o
f th
e y
ear
458
11,4
61
6,8
06,0
93
FO
RM
A-B
S (U
L)
Fund B
ala
nce S
heet
as
at
31
st M
arc
h 2
007
Part
icula
rsSc
hedule
Secure
Fund
Stable
Fund
Tota
l
SOU
RCES
OF F
UN
DS
Policy H
old
er’
s Funds:
Policy H
old
ers
Contr
ibuti
on
F -
15,8
45
422,1
09
45,0
62,3
08
Revenue A
ccount
458
11,4
61
6,8
06,0
93
Tota
l6,3
03
433,5
70
51,8
68,4
01
APPLIC
ATIO
N O
F F
UN
DS
Invest
ments
F -
26,1
73
428,1
94
47,7
06,0
51
Curr
ent
Ass
ets
F -
3133
5,9
28
4,7
89,9
05
Less
: C
urr
ent
Lia
bilit
ies
and P
rovis
ions
F -
43
552
627,5
55
Net
Curr
ent
Ass
ets
130
5,3
76
4,1
62,3
50
Tota
l6,3
03
433,5
70
51,8
68,4
01
(a)
Net Ass
ets
as
per
Bala
nce S
heet
(Rs.
in t
housa
nds)
6,3
03
433,5
70
51,8
68,4
01
(b)
Num
ber
of
Unit
s O
uts
tandin
g (
in t
housa
nds)
563
38,1
33
Net Ass
et
Valu
e p
er
unit
(a)/
(b) (R
s.) *
11.1
89
11.3
70
*Note
: The N
et Ass
et
Valu
e p
er
unit
calc
ula
ted a
bove is
befo
re a
ppro
pri
ati
on/ e
x p
ropri
ati
on c
harg
e.
(Am
ount
in R
s. ‘
000)
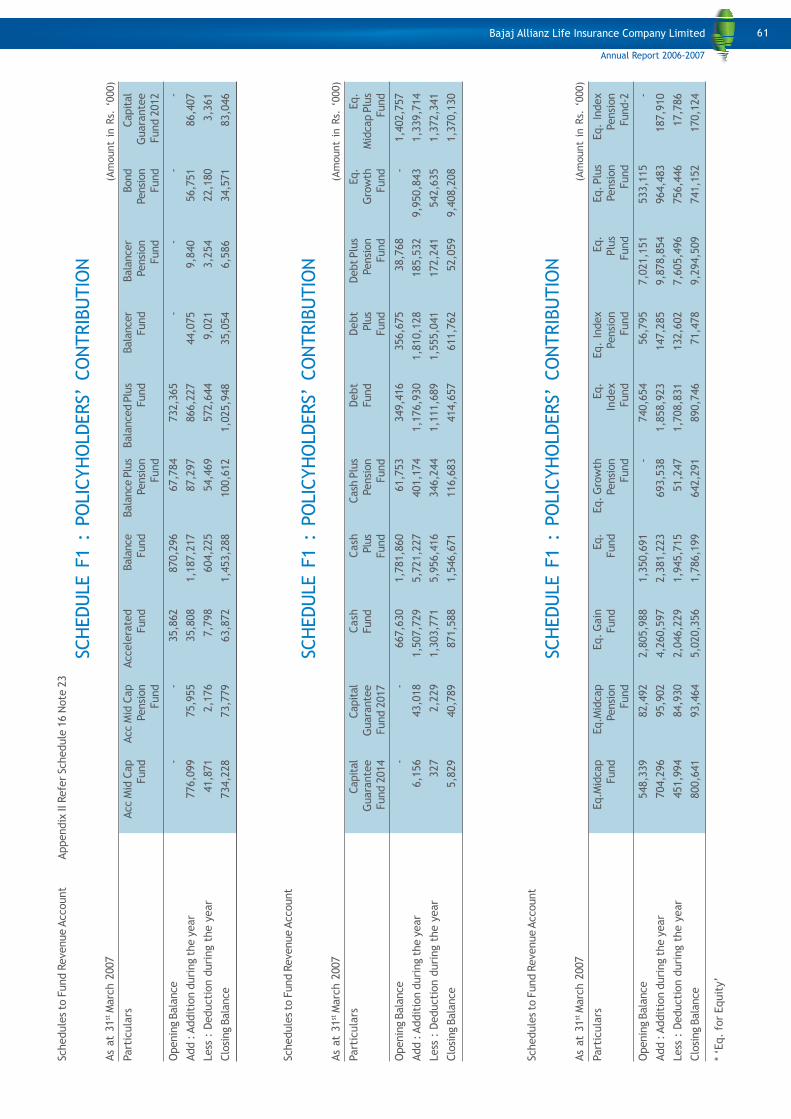
61
Schedule
s to
Fund R
evenue A
ccount
A
ppendix
II Refe
r Sc
hedule
16 N
ote
23
SCH
EDU
LE F
1 :
PO
LIC
YH
OLDERS’
CO
NTRIB
UTIO
N
As
at
31
st M
arc
h 2
007
Part
icula
rsAcc M
id C
ap
Acc M
id C
ap
Accele
rate
dBala
nce
Bala
nce
Plu
sBala
nce
d P
lus
Bala
nce
rBala
nce
rBond
Capit
al
Fund
Pensi
on
Fund
Fund
Pensi
on
Fund
Fund
Pensi
on
Pensi
on
Guara
nte
e
Fund
Fund
Fund
Fund
Fund 2
012
Openin
g B
ala
nce
--
35,8
62
870,2
96
67,7
84
732,3
65
--
--
Add : A
ddit
ion d
uri
ng t
he y
ear
776,0
99
75,9
55
35,8
08
1,1
87,2
17
87,2
97
866,2
27
44,0
75
9,8
40
56,7
51
86,4
07
Less
: D
educti
on d
uri
ng t
he y
ear
41,8
71
2,1
76
7,7
98
604,2
25
54,4
69
572,6
44
9,0
21
3,2
54
22,1
80
3,3
61
Clo
sing B
ala
nce
734,2
28
73,7
79
63,8
72
1,4
53,2
88
100,6
12
1,0
25,9
48
35,0
54
6,5
86
34,5
71
83,0
46
Schedule
s to
Fund R
evenue A
ccount
SCH
EDU
LE F
1 :
PO
LIC
YH
OLDERS’
CO
NTRIB
UTIO
N
As
at
31
st M
arc
h 2
007
Part
icula
rsCapit
al
Capit
al
Cash
Cash
Cash
Plu
sD
ebt
Debt
Debt Plu
sEq.
Eq.
Guara
nte
e G
uara
nte
eFund
Plu
s P
ensi
on
Fund
Plu
s P
ensi
on
Gro
wth
Mid
cap P
lus
Fund 2
014
Fund 2
017
Fund
Fund
Fund
Fund
Fund
Fund
Openin
g B
ala
nce
--
667,6
30
1,7
81,8
60
61,7
53
349,4
16
356,6
75
38,7
68
-1,4
02,7
57
Add : A
ddit
ion d
uri
ng t
he y
ear
6,1
56
43,0
18
1,5
07,7
29
5,7
21,2
27
401,1
74
1,1
76,9
30
1,8
10,1
28
185,5
32
9,9
50,8
43
1,3
39,7
14
Less
: D
educti
on d
uri
ng t
he y
ear
327
2,2
29
1,3
03,7
71
5,9
56,4
16
346,2
44
1,1
11,6
89
1,5
55,0
41
172,2
41
542,6
35
1,3
72,3
41
Clo
sing B
ala
nce
5,8
29
40,7
89
871,5
88
1,5
46,6
71
116,6
83
414,6
57
611,7
62
52,0
59
9,4
08,2
08
1,3
70,1
30
Schedule
s to
Fund R
evenue A
ccount
SCH
EDU
LE F
1 :
PO
LIC
YH
OLDERS’
CO
NTRIB
UTIO
N
As
at
31
st M
arc
h 2
007
Part
icula
rsEq.M
idcap
Eq.M
idcap
Eq. G
ain
Eq.
Eq. G
row
thEq.
Eq.
Index
Eq.
Eq. Plu
sEq.
Index
Fund
Pensi
on
Fund
Fund
Pensi
on
Index
Pensi
on
Plu
s P
ensi
on
Pensi
on
Fund
Fund
Fund
Fund
Fund
Fund
Fund-2
Openin
g B
ala
nce
548,3
39
82,4
92
2,8
05,9
88
1,3
50,6
91
-740,6
54
56,7
95
7,0
21,1
51
533,1
15
-
Add : A
ddit
ion d
uri
ng t
he y
ear
704,2
96
95,9
02
4,2
60,5
97
2,3
81,2
23
693,5
38
1,8
58,9
23
147,2
85
9,8
78,8
54
964,4
83
187,9
10
Less
: D
educti
on d
uri
ng t
he y
ear
451,9
94
84,9
30
2,0
46,2
29
1,9
45,7
15
51,2
47
1,7
08,8
31
132,6
02
7,6
05,4
96
756,4
46
17,7
86
Clo
sing B
ala
nce
800,6
41
93,4
64
5,0
20,3
56
1,7
86,1
99
642,2
91
890,7
46
71,4
78
9,2
94,5
09
741,1
52
170,1
24
* ‘E
q.
for
Equit
y’
(Am
ount
in R
s. ‘
000)
(Am
ount
in R
s. ‘
000)
(Am
ount
in R
s. ‘
000)
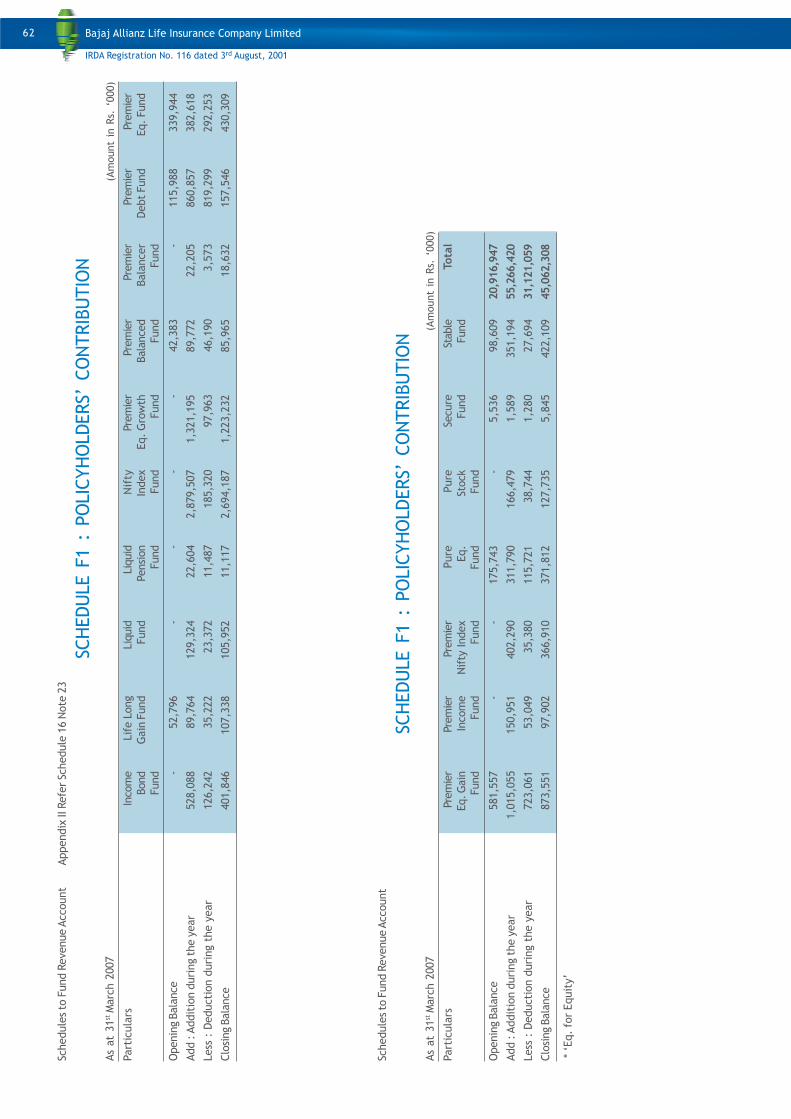
62
Schedule
s to
Fund R
evenue A
ccount
SCH
EDU
LE F
1 :
PO
LIC
YH
OLDERS’
CO
NTRIB
UTIO
N
As
at
31
st M
arc
h 2
007
Part
icula
rsPre
mie
rPre
mie
rPre
mie
rPure
Pure
Secure
Stable
Tota
lEq. G
ain
Incom
e N
ifty
Index
Eq.
Sto
ck
Fund
Fund
Fund
Fund
Fund
Fund
Fund
Openin
g B
ala
nce
581,5
57
--
175,7
43
-5,5
36
98,6
09
20,9
16,9
47
Add : A
ddit
ion d
uri
ng t
he y
ear
1,0
15,0
55
150,9
51
402,2
90
311,7
90
166,4
79
1,5
89
351,1
94
55,2
66,4
20
Less
: D
educti
on d
uri
ng t
he y
ear
723,0
61
53,0
49
35,3
80
115,7
21
38,7
44
1,2
80
27,6
94
31,1
21,0
59
Clo
sing B
ala
nce
873,5
51
97,9
02
366,9
10
371,8
12
127,7
35
5,8
45
422,1
09
45,0
62,3
08
Schedule
s to
Fund R
evenue A
ccount
A
ppendix
II Refe
r Sc
hedule
16 N
ote
23
SCH
EDU
LE F
1 :
PO
LIC
YH
OLDERS’
CO
NTRIB
UTIO
N
As
at
31
st M
arc
h 2
007
Part
icula
rsIn
com
eLif
e L
ong
Liquid
Liquid
Nif
tyPre
mie
rPre
mie
rPre
mie
rPre
mie
rPre
mie
r
Bond
Gain
Fund
Fund
Pensi
on
Index
Eq.
Gro
wth
Bala
nce
d B
ala
ncer
Debt
Fund
Eq.
Fund
Fund
Fund
Fund
Fund
Fund
Fund
Openin
g B
ala
nce
-52,7
96
--
--
42,3
83
-115,9
88
339,9
44
Add : A
ddit
ion d
uri
ng t
he y
ear
528,0
88
89,7
64
129,3
24
22,6
04
2,8
79,5
07
1,3
21,1
95
89,7
72
22,2
05
860,8
57
382,6
18
Less
: D
educti
on d
uri
ng t
he y
ear
126,2
42
35,2
22
23,3
72
11,4
87
185,3
20
97,9
63
46,1
90
3,5
73
819,2
99
292,2
53
Clo
sing B
ala
nce
401,8
46
107,3
38
105,9
52
11,1
17
2,6
94,1
87
1,2
23,2
32
85,9
65
18,6
32
157,5
46
430,3
09
* ‘
Eq.
for
Equit
y’
(Am
ount
in R
s. ‘
000)
(Am
ount
in R
s. ‘
000)
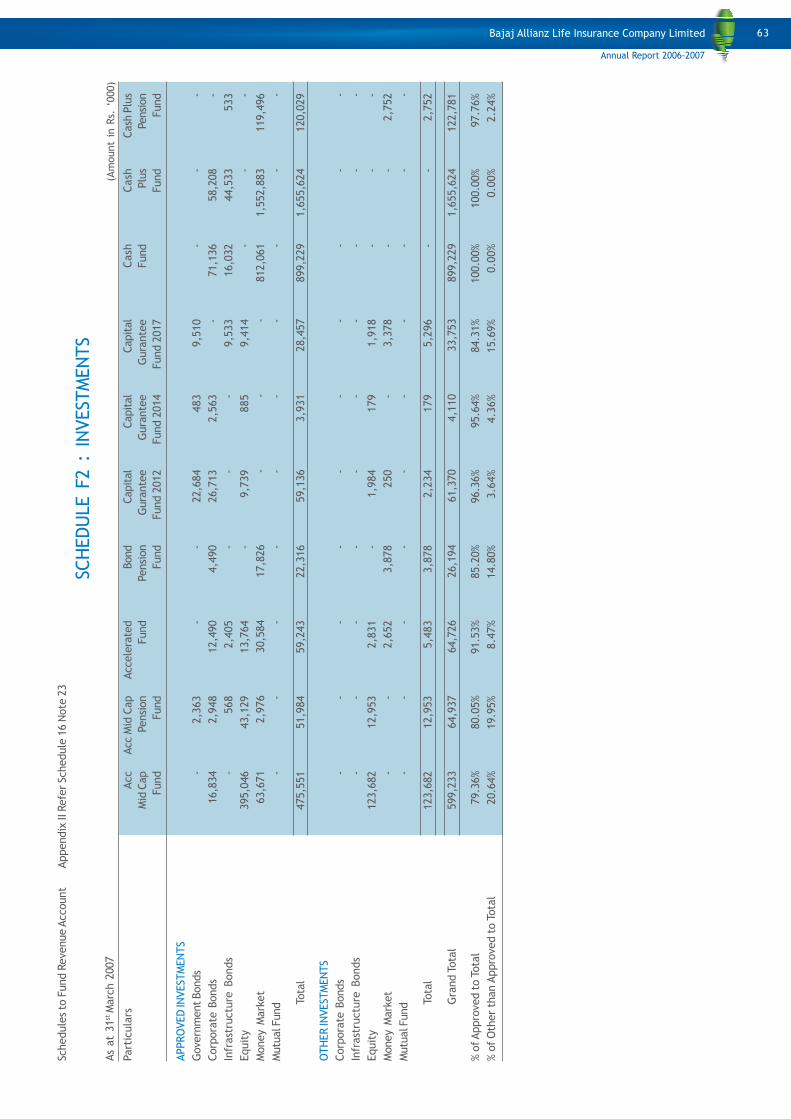
63
Schedule
s to
Fund R
evenue A
ccount
A
ppendix
II Refe
r Sc
hedule
16 N
ote
23
SCH
EDU
LE F
2 :
IN
VEST
MEN
TS
As
at
31
st M
arc
h 2
007
Part
icula
rsAcc
Acc M
id C
ap
Accele
rate
dBond
Capit
al
Capit
al
Capit
al
Cash
Cash
Cash
Plu
s
Mid
Cap
Pensi
on
Fund
Pensi
on
Gura
nte
e G
ura
nte
e G
ura
nte
eFund
Plu
sPensi
on
Fund
Fund
Fund
Fund 2
012
Fund 2
014
Fund 2
017
Fund
Fund
APPRO
VED IN
VEST
MEN
TS
Gove
rnm
ent Bonds
-2,3
63
--
22,6
84
483
9,5
10
--
-
Corp
ora
te B
onds
16,8
34
2,9
48
12,4
90
4,4
90
26,7
13
2,5
63
-71,1
36
58,2
08
-
Infr
ast
ructu
re B
onds
-568
2,4
05
--
-9,5
33
16,0
32
44,5
33
533
Equit
y395,0
46
43,1
29
13,7
64
-9,7
39
885
9,4
14
--
-
Money M
ark
et
63,6
71
2,9
76
30,5
84
17,8
26
--
-812,0
61
1,5
52,8
83
119,4
96
Mutu
al F
und
--
--
--
--
--
Tota
l475,5
51
51,9
84
59,2
43
22,3
16
59,1
36
3,9
31
28,4
57
899,2
29
1,6
55,6
24
120,0
29
OTH
ER IN
VEST
MEN
TS
Corp
ora
te B
onds
--
--
--
--
--
Infr
ast
ructu
re B
onds
--
--
--
--
--
Equit
y123,6
82
12,9
53
2,8
31
-1,9
84
179
1,9
18
--
-
Money M
ark
et
--
2,6
52
3,8
78
250
-3,3
78
--
2,7
52
Mutu
al F
und
--
--
--
--
--
Tota
l123,6
82
12,9
53
5,4
83
3,8
78
2,2
34
179
5,2
96
--
2,7
52
Gra
nd T
ota
l599,2
33
64,9
37
64,7
26
26,1
94
61,3
70
4,1
10
33,7
53
899,2
29
1,6
55,6
24
122,7
81
% o
f Appro
ved t
o T
ota
l79.3
6%
80.0
5%
91.5
3%
85.2
0%
96.3
6%
95.6
4%
84.3
1%
100.0
0%
100.0
0%
97.7
6%
% o
f O
ther
than A
ppro
ved t
o T
ota
l20.6
4%
19.9
5%
8.4
7%
14.8
0%
3.6
4%
4.3
6%
15.6
9%
0.0
0%
0.0
0%
2.2
4%
(Am
ount
in R
s. ‘
000)
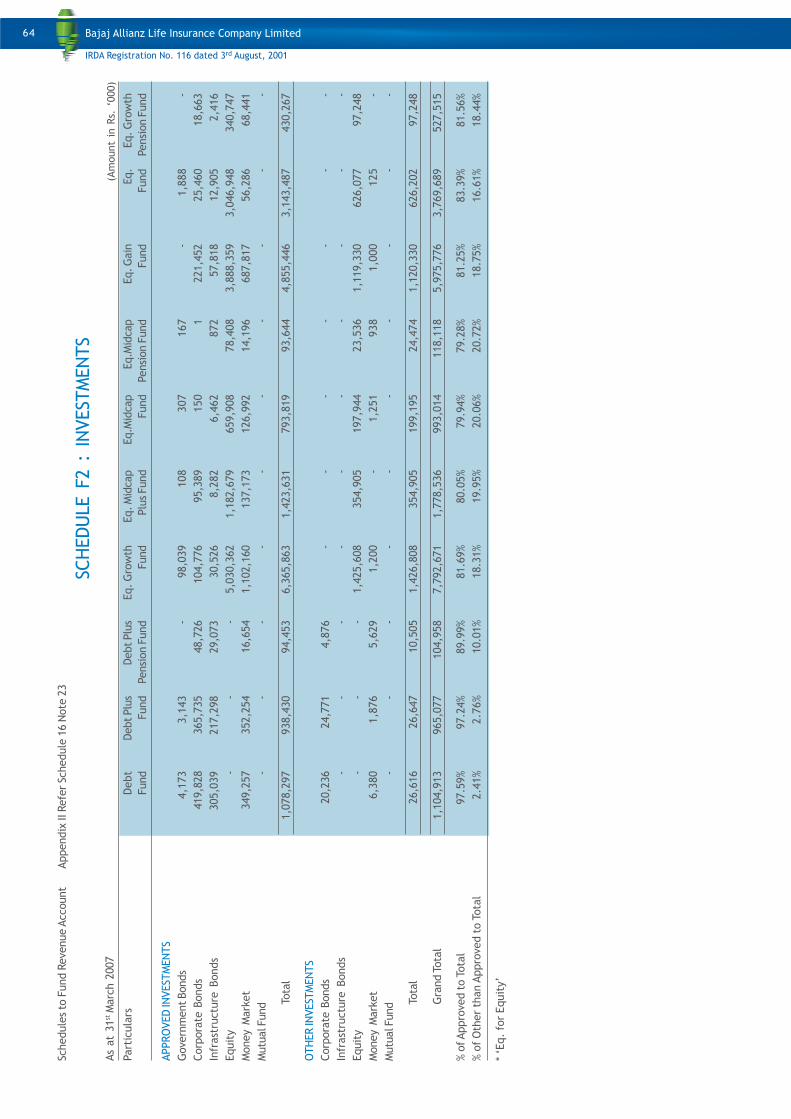
64
Schedule
s to
Fund R
evenue A
ccount
A
ppendix
II Refe
r Sc
hedule
16 N
ote
23
SCH
EDU
LE F
2 :
IN
VEST
MEN
TS
As
at
31
st M
arc
h 2
007
Part
icula
rsD
ebt
Debt Plu
sDebt Plu
sEq. G
row
thEq. M
idcap
Eq.M
idcap
Eq.M
idcap
Eq. G
ain
Eq.
Eq. G
row
th
Fund
Fund
Pensi
on F
und
Fund
Plu
s Fund
Fund
Pensi
on F
und
Fund
Fund
Pensi
on F
und
APPRO
VED IN
VEST
MEN
TS
Gove
rnm
ent Bonds
4,1
73
3,1
43
-98,0
39
108
307
167
-1,8
88
-
Corp
ora
te B
onds
419,8
28
365,7
35
48,7
26
104,7
76
95,3
89
150
1221,4
52
25,4
60
18,6
63
Infr
ast
ructu
re B
onds
305,0
39
217,2
98
29,0
73
30,5
26
8,2
82
6,4
62
872
57,8
18
12,9
05
2,4
16
Equit
y-
--
5,0
30,3
62
1,1
82,6
79
659,9
08
78,4
08
3,8
88,3
59
3,0
46,9
48
340,7
47
Money M
ark
et
349,2
57
352,2
54
16,6
54
1,1
02,1
60
137,1
73
126,9
92
14,1
96
687,8
17
56,2
86
68,4
41
Mutu
al F
und
--
--
--
--
--
Tota
l1,0
78,2
97
938,4
30
94,4
53
6,3
65,8
63
1,4
23,6
31
793,8
19
93,6
44
4,8
55,4
46
3,1
43,4
87
430,2
67
OTH
ER IN
VEST
MEN
TS
Corp
ora
te B
onds
20,2
36
24,7
71
4,8
76
--
--
--
-
Infr
ast
ructu
re B
onds
--
--
--
--
--
Equit
y-
--
1,4
25,6
08
354,9
05
197,9
44
23,5
36
1,1
19,3
30
626,0
77
97,2
48
Money M
ark
et
6,3
80
1,8
76
5,6
29
1,2
00
-1,2
51
938
1,0
00
125
-
Mutu
al F
und
--
--
--
--
--
Tota
l26,6
16
26,6
47
10,5
05
1,4
26,8
08
354,9
05
199,1
95
24,4
74
1,1
20,3
30
626,2
02
97,2
48
Gra
nd T
ota
l1,1
04,9
13
965,0
77
104,9
58
7,7
92,6
71
1,7
78,5
36
993,0
14
118,1
18
5,9
75,7
76
3,7
69,6
89
527,5
15
% o
f Appro
ved t
o T
ota
l97.5
9%
97.2
4%
89.9
9%
81.6
9%
80.0
5%
79.9
4%
79.2
8%
81.2
5%
83.3
9%
81.5
6%
% o
f O
ther
than A
ppro
ved t
o T
ota
l2.4
1%
2.7
6%
10.0
1%
18.3
1%
19.9
5%
20.0
6%
20.7
2%
18.7
5%
16.6
1%
18.4
4%
* ‘E
q.
for
Equit
y’
(Am
ount
in R
s. ‘
000)
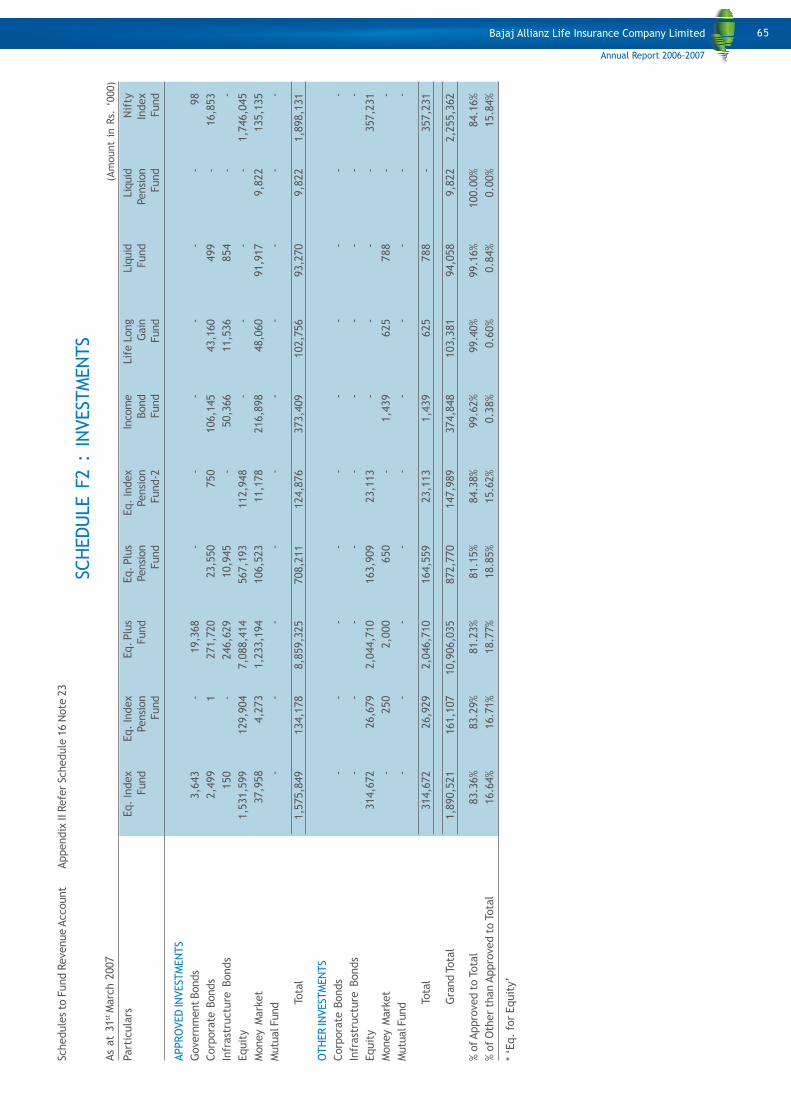
65
Schedule
s to
Fund R
evenue A
ccount
A
ppendix
II Refe
r Sc
hedule
16 N
ote
23
SCH
EDU
LE F
2 :
IN
VEST
MEN
TS
As
at
31
st M
arc
h 2
007
Part
icula
rsEq.
Index
Eq.
Index
Eq. Plu
sEq. Plu
sEq.
Index
Inco
me
Lif
e L
ong
Liquid
Liquid
Nif
ty
Fund
Pensi
on
Fund
Pensi
on
Pensi
on
Bond
Gain
Fund
Pensi
on
Index
Fund
Fund
Fund-2
Fund
Fund
Fund
Fund
APPRO
VED IN
VEST
MEN
TS
Gove
rnm
ent Bonds
3,6
43
-19,3
68
--
--
--
98
Corp
ora
te B
onds
2,4
99
1271,7
20
23,5
50
750
106,1
45
43,1
60
499
-16,8
53
Infr
ast
ructu
re B
onds
150
-246,6
29
10,9
45
-50,3
66
11,5
36
854
--
Equit
y1,5
31,5
99
129,9
04
7,0
88,4
14
567,1
93
112,9
48
--
--
1,7
46,0
45
Money M
ark
et
37,9
58
4,2
73
1,2
33,1
94
106,5
23
11,1
78
216,8
98
48,0
60
91,9
17
9,8
22
135,1
35
Mutu
al F
und
--
--
--
--
--
Tota
l1,5
75,8
49
134,1
78
8,8
59,3
25
708,2
11
124,8
76
373,4
09
102,7
56
93,2
70
9,8
22
1,8
98,1
31
OTH
ER IN
VEST
MEN
TS
Corp
ora
te B
onds
--
--
--
--
--
Infr
ast
ructu
re B
onds
--
--
--
--
--
Equit
y314,6
72
26,6
79
2,0
44,7
10
163,9
09
23,1
13
--
--
357,2
31
Money M
ark
et
-250
2,0
00
650
-1,4
39
625
788
--
Mutu
al F
und
--
--
--
--
--
Tota
l314,6
72
26,9
29
2,0
46,7
10
164,5
59
23,1
13
1,4
39
625
788
-357,2
31
Gra
nd T
ota
l1,8
90,5
21
161,1
07
10,9
06,0
35
872,7
70
147,9
89
374,8
48
103,3
81
94,0
58
9,8
22
2,2
55,3
62
% o
f Appro
ved t
o T
ota
l83.3
6%
83.2
9%
81.2
3%
81.1
5%
84.3
8%
99.6
2%
99.4
0%
99.1
6%
100.0
0%
84.1
6%
% o
f O
ther
than A
ppro
ved t
o T
ota
l16.6
4%
16.7
1%
18.7
7%
18.8
5%
15.6
2%
0.3
8%
0.6
0%
0.8
4%
0.0
0%
15.8
4%
* ‘E
q.
for
Equit
y’
(Am
ount
in R
s. ‘
000)
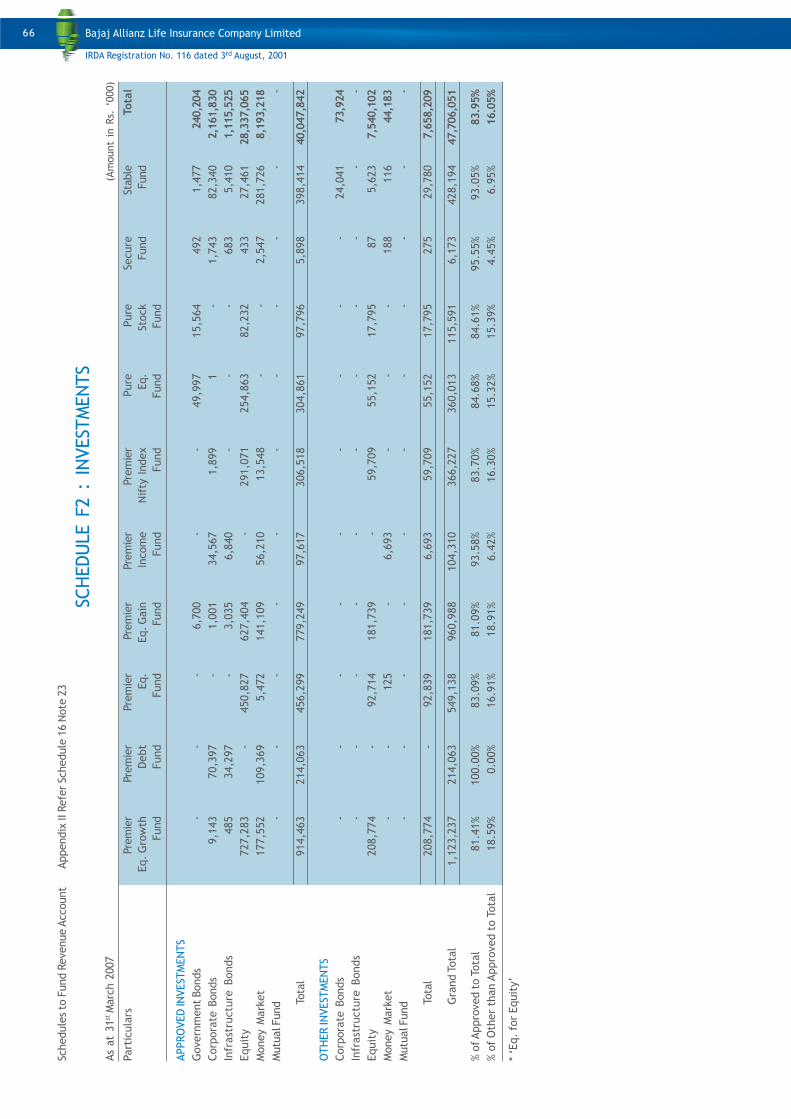
66
Schedule
s to
Fund R
evenue A
ccount
A
ppendix
II Refe
r Sc
hedule
16 N
ote
23
SCH
EDU
LE F
2 :
IN
VEST
MEN
TS
As
at
31
st M
arc
h 2
007
Part
icula
rsPre
mie
rPre
mie
rPre
mie
rPre
mie
rPre
mie
rPre
mie
rPure
Pure
Secure
Stable
Tota
l
Eq. G
row
thD
ebt
Eq.
Eq. G
ain
Incom
eN
ifty
Index
Eq.
Sto
ck
Fund
Fund
Fund
Fund
Fund
Fund
Fund
Fund
Fund
Fund
APPRO
VED
IN
VEST
MEN
TS
Govern
ment
Bonds
- -
- 6
,700
- -
49,9
97
15,5
64
492
1,4
77
240,2
04
Corp
ora
te B
onds
9,1
43
70,3
97
- 1
,001
34,5
67
1,8
99
1-
1,7
43
82,3
40
2,1
61,8
30
Infr
ast
ructu
re B
onds
485
34,2
97
- 3
,035
6,8
40
--
-683
5,4
10
1,1
15,5
25
Equit
y727,2
83
-450,8
27
627,4
04
- 2
91,0
71
254,8
63
82,2
32
433
27,4
61
28,3
37,0
65
Money M
ark
et
177,5
52
109,3
69
5,4
72
141,1
09
56,2
10
13,5
48
--
2,5
47
281,7
26
8,1
93,2
18
Mutu
al Fund
- -
- -
- -
--
--
-
Tota
l914,4
63
214,0
63
456,2
99
779,2
49
97,6
17
306,5
18
304,8
61
97,7
96
5,8
98
398,4
14
40,0
47,8
42
OTH
ER IN
VEST
MEN
TS
Corp
ora
te B
onds
- -
- -
- -
--
-24,0
41
73,9
24
Infr
ast
ructu
re B
onds
- -
- -
- -
--
--
-
Equit
y208,7
74
-92,7
14
181,7
39
- 5
9,7
09
55,1
52
17,7
95
87
5,6
23
7,5
40,1
02
Money M
ark
et
- -
125
-6,6
93
--
-188
116
44,1
83
Mutu
al Fund
- -
- -
- -
--
--
-
Tota
l208,7
74
-92,8
39
181,7
39
6,6
93
59,7
09
55,1
52
17,7
95
275
29,7
80
7,6
58,2
09
Gra
nd T
ota
l1,1
23,2
37
214,0
63
549,1
38
960,9
88
104,3
10
366,2
27
360,0
13
115,5
91
6,1
73
428,1
94
47,7
06,0
51
% o
f Appro
ved t
o T
ota
l81.4
1%
100.0
0%
83.0
9%
81.0
9%
93.5
8%
83.7
0%
84.6
8%
84.6
1%
95.5
5%
93.0
5%
83.9
5%
% o
f O
ther
than A
ppro
ved t
o T
ota
l18.5
9%
0.0
0%
16.9
1%
18.9
1%
6.4
2%
16.3
0%
15.3
2%
15.3
9%
4.4
5%
6.9
5%
16.0
5%
* ‘E
q.
for
Equit
y’
(Am
ount
in R
s. ‘
000)
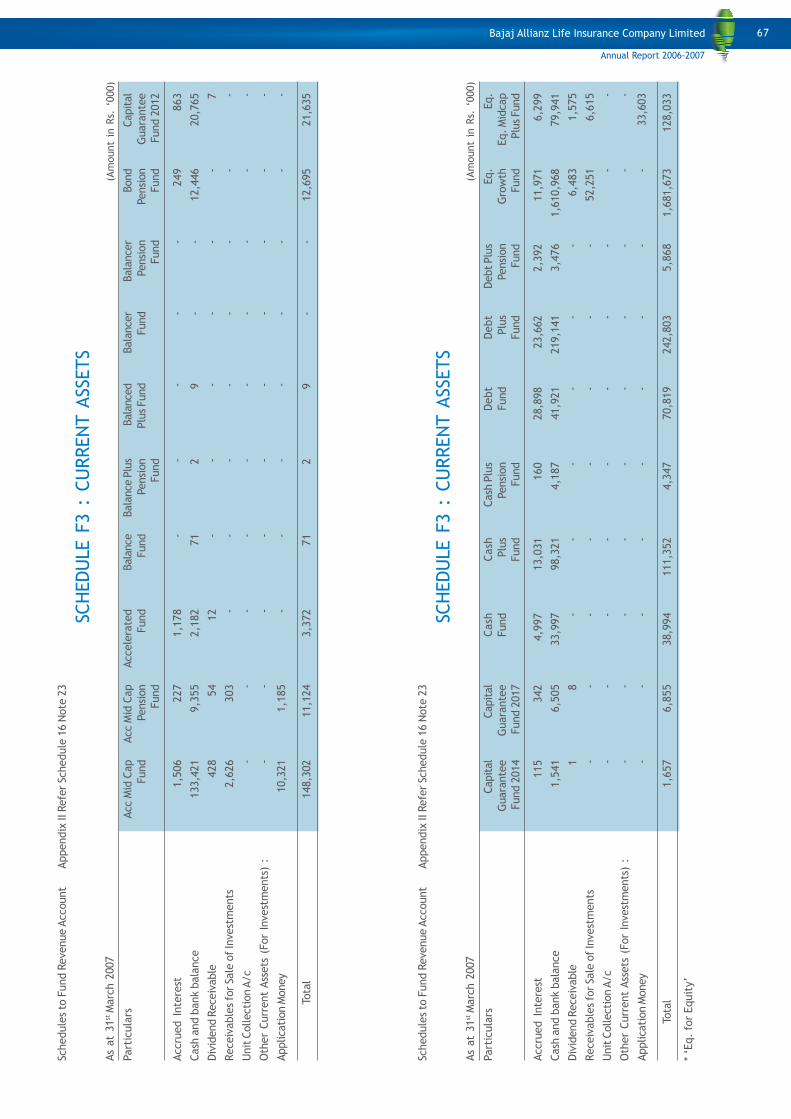
67
Schedule
s to
Fund R
evenue A
ccount
A
ppendix
II Refe
r Sc
hedule
16 N
ote
23
SCH
EDU
LE F
3 :
CU
RREN
T A
SSETS
As
at
31
st M
arc
h 2
007
Part
icula
rsAcc M
id C
ap
Acc M
id C
ap
Accele
rate
dBala
nce
Bala
nce
Plu
sBala
nce
dBala
nce
rBala
nce
rBond
Capit
al
Fund
Pensi
on
Fund
Fund
Pensi
on
Plu
s Fund
Fund
Pensi
on
Pensi
on
Guara
nte
e
Fund
Fund
Fund
Fund
Fund 2
012
Accru
ed I
nte
rest
1,5
06
227
1,1
78
--
--
-249
863
Cash
and b
ank b
ala
nce
133,4
21
9,3
55
2,1
82
71
29
--
12,4
46
20,7
65
Div
idend R
ece
ivable
428
54
12
--
--
--
7
Receiv
able
s fo
r Sa
le o
f In
vest
ments
2,6
26
303
--
--
--
--
Unit
Collecti
on A
/c
--
--
--
--
--
Oth
er
Curr
ent
Ass
ets
(For
Invest
ments
) :
--
--
--
--
--
Applicati
on M
oney
10,3
21
1,1
85
--
--
--
--
Tota
l148,3
02
11,1
24
3,3
72
71
29
--
12,6
95
21,6
35
Schedule
s to
Fund R
evenue A
ccount
A
ppendix
II Refe
r Sc
hedule
16 N
ote
23
SCH
EDU
LE F
3 :
CU
RREN
T A
SSETS
As
at
31
st M
arc
h 2
007
Part
icula
rsCapit
al
Capit
al
Cash
Cash
Cash
Plu
sD
ebt
Debt
Debt Plu
sEq.
Eq.
Guara
nte
e G
uara
nte
eFund
Plu
s P
ensi
on
Fund
Plu
s P
ensi
on
Gro
wth
Eq. M
idcap
Fund 2
014
Fund 2
017
Fund
Fund
Fund
Fund
Fund
Plu
s Fund
Accru
ed I
nte
rest
115
342
4,9
97
13,0
31
160
28,8
98
23,6
62
2,3
92
11,9
71
6,2
99
Cash
and b
ank b
ala
nce
1,5
41
6,5
05
33,9
97
98,3
21
4,1
87
41,9
21
219,1
41
3,4
76
1,6
10,9
68
79,9
41
Div
idend R
ece
ivable
18
--
--
--
6,4
83
1,5
75
Receiv
able
s fo
r Sa
le o
f In
vest
ments
--
--
--
--
52,2
51
6,6
15
Unit
Collecti
on A
/c
--
--
--
--
--
Oth
er
Curr
ent
Ass
ets
(For
Invest
ments
) :
--
--
--
--
--
Applicati
on M
oney
--
--
--
--
-33,6
03
Tota
l1,6
57
6,8
55
38,9
94
111,3
52
4,3
47
70,8
19
242,8
03
5,8
68
1,6
81,6
73
128,0
33
* ‘E
q.
for
Equit
y’
(Am
ount
in R
s. ‘
000)
(Am
ount
in R
s. ‘
000)
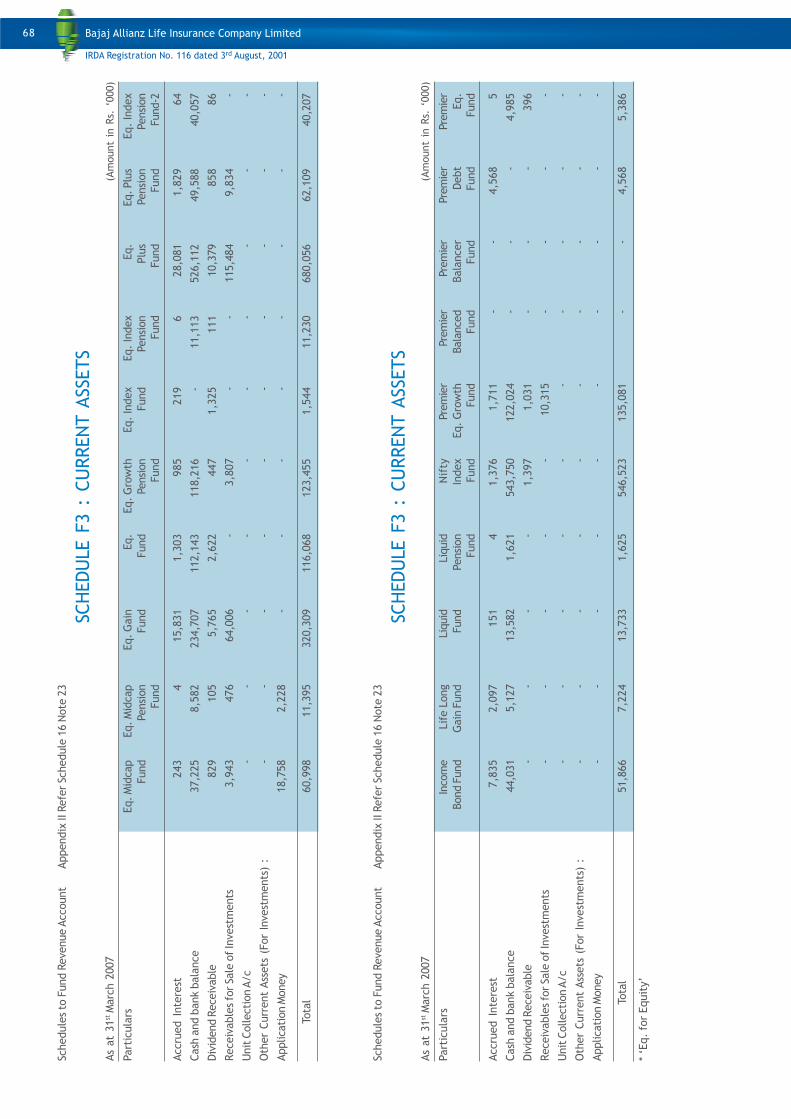
68
Schedule
s to
Fund R
evenue A
ccount
A
ppendix
II Refe
r Sc
hedule
16 N
ote
23
SCH
EDU
LE F
3 :
CU
RREN
T A
SSETS
As
at
31
st M
arc
h 2
007
Part
icula
rsEq. M
idcap
Eq. M
idcap
Eq. G
ain
Eq.
Eq. G
row
thEq.
Index
Eq.
Index
Eq.
Eq. Plu
sEq.
Index
Fund
Pensi
on
Fund
Fund
Pensi
on
Fund
Pensi
on
Plu
s P
ensi
on
Pensi
on
Fund
Fund
Fund
Fund
Fund
Fund-2
Accru
ed I
nte
rest
243
415,8
31
1,3
03
985
219
628,0
81
1,8
29
64
Cash
and b
ank b
ala
nce
37,2
25
8,5
82
234,7
07
112,1
43
118,2
16
-11,1
13
526,1
12
49,5
88
40,0
57
Div
idend R
ece
ivable
829
105
5,7
65
2,6
22
447
1,3
25
111
10,3
79
858
86
Receiv
able
s fo
r Sa
le o
f In
vest
ments
3,9
43
476
64,0
06
-3,8
07
--
115,4
84
9,8
34
-
Unit
Collecti
on A
/c
--
--
--
--
--
Oth
er
Curr
ent
Ass
ets
(For
Invest
ments
) :
--
--
--
--
--
Applicati
on M
oney
18,7
58
2,2
28
--
--
--
--
Tota
l60,9
98
11,3
95
320,3
09
116,0
68
123,4
55
1,5
44
11,2
30
680,0
56
62,1
09
40,2
07
Schedule
s to
Fund R
evenue A
ccount
A
ppendix
II Refe
r Sc
hedule
16 N
ote
23
SCH
EDU
LE F
3 :
CU
RREN
T A
SSETS
As
at
31
st M
arc
h 2
007
Part
icula
rsIn
com
eLif
e L
ong
Liquid
Liquid
Nif
tyPre
mie
rPre
mie
rPre
mie
rPre
mie
rPre
mie
r
Bond F
und
Gain
Fund
Fund
Pensi
on
Index
Eq.
Gro
wth
Bala
nce
d B
ala
ncer
Debt
Eq.
Fund
Fund
Fund
Fund
Fund
Fund
Fund
Accru
ed I
nte
rest
7,8
35
2,0
97
151
41,3
76
1,7
11
--
4,5
68
5
Cash
and b
ank b
ala
nce
44,0
31
5,1
27
13,5
82
1,6
21
543,7
50
122,0
24
--
-4,9
85
Div
idend R
ece
ivable
--
--
1,3
97
1,0
31
--
-396
Receiv
able
s fo
r Sa
le o
f In
vest
ments
--
--
-10,3
15
--
--
Unit
Collecti
on A
/c
--
--
--
--
--
Oth
er
Curr
ent
Ass
ets
(For
Invest
ments
) :
--
--
--
--
--
Applicati
on M
oney
--
--
--
--
--
Tota
l51,8
66
7,2
24
13,7
33
1,6
25
546,5
23
135,0
81
--
4,5
68
5,3
86
* ‘E
q.
for
Equit
y’
(Am
ount
in R
s. ‘
000)
(Am
ount
in R
s. ‘
000)
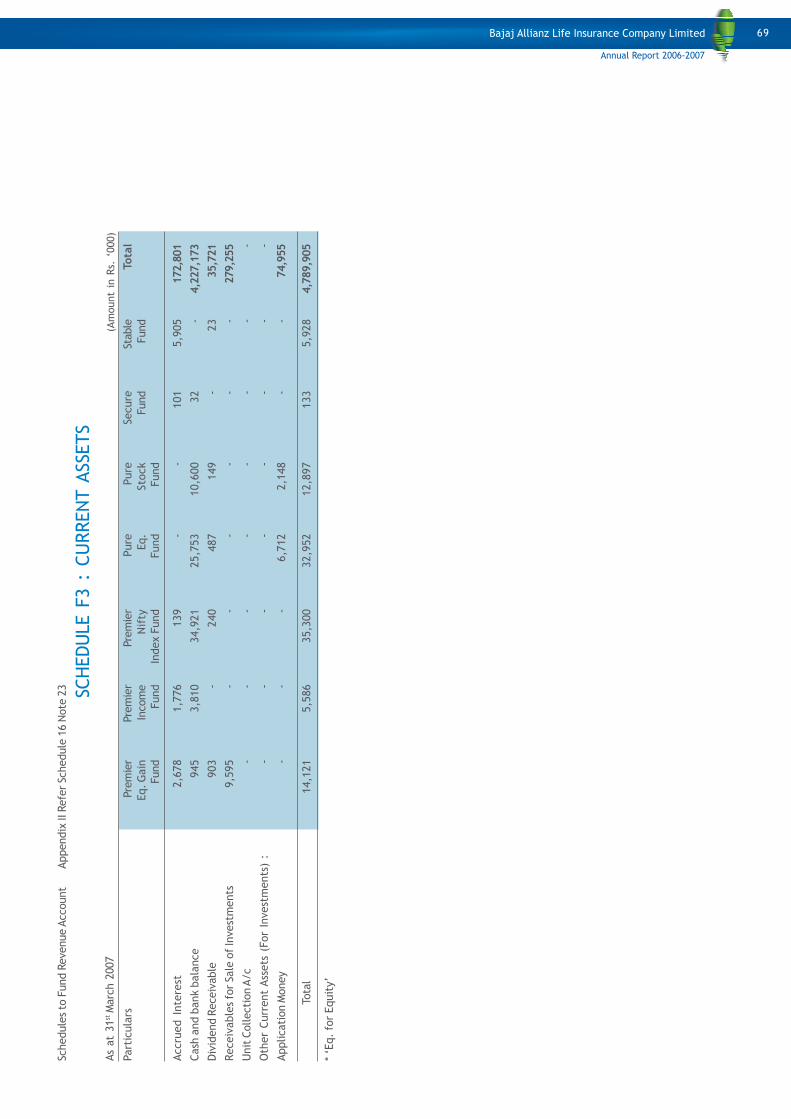
69
Schedule
s to
Fund R
evenue A
ccount
A
ppendix
II Refe
r Sc
hedule
16 N
ote
23 SC
HEDU
LE F
3 :
CU
RREN
T A
SSETS
As
at
31
st M
arc
h 2
007
Part
icula
rsPre
mie
rPre
mie
rPre
mie
rPure
Pure
Secure
Stable
Tota
l
Eq. G
ain
Incom
eN
ifty
Eq.
Sto
ck
Fund
Fund
Fund
Fund
In
dex F
und
Fund
Fund
Accru
ed I
nte
rest
2,6
78
1,7
76
139
--
101
5,9
05
172,8
01
Cash
and b
ank b
ala
nce
945
3,8
10
34,9
21
25,7
53
10,6
00
32
-4,2
27,1
73
Div
idend R
eceiv
able
903
-240
487
149
-23
35,7
21
Receiv
able
s fo
r Sale
of
Invest
ments
9,5
95
--
--
--
279,2
55
Unit
Collecti
on A
/c
--
--
--
--
Oth
er
Curr
ent
Ass
ets
(For
Invest
ments
) :
--
--
--
--
Applicati
on M
oney
--
-6,7
12
2,1
48
--
74,9
55
Tota
l14,1
21
5,5
86
35,3
00
32,9
52
12,8
97
133
5,9
28
4,7
89,9
05
* ‘E
q.
for
Equit
y’
(Am
ount
in R
s. ‘
000)
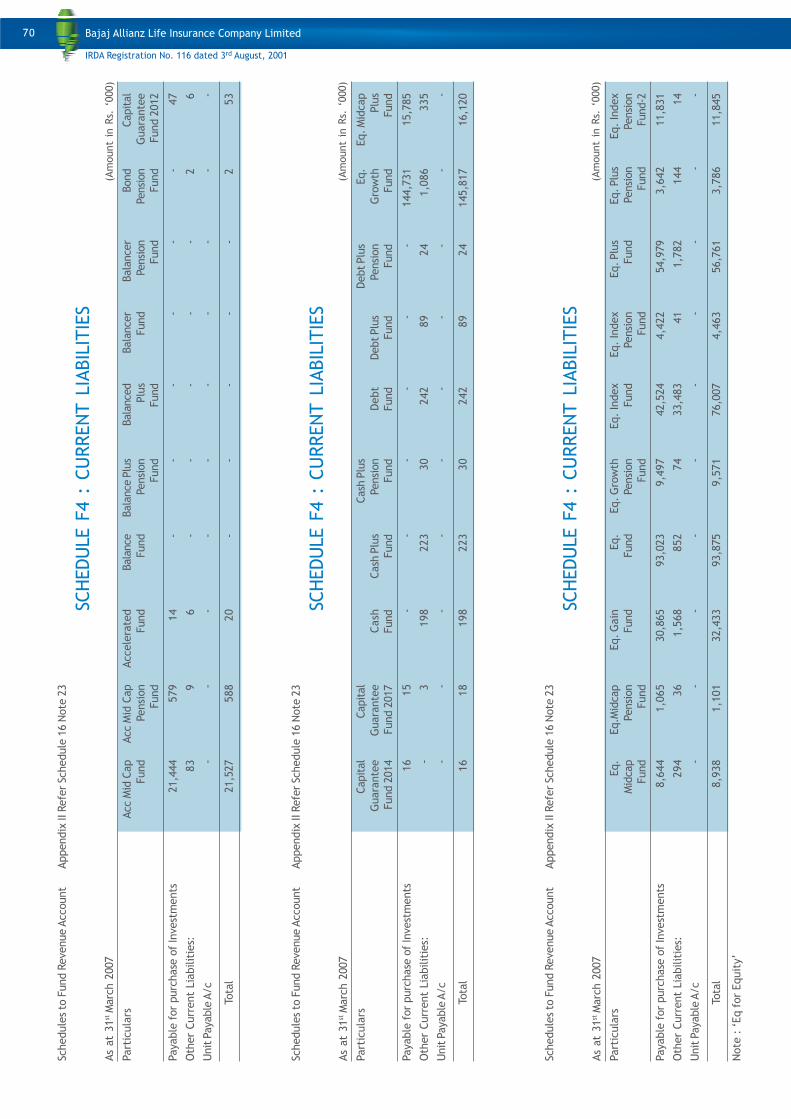
70
Schedule
s to
Fund R
evenue A
ccount
A
ppendix
II Refe
r Sc
hedule
16 N
ote
23
SCH
EDU
LE F
4 :
CU
RREN
T L
IABIL
ITIE
S
As
at
31
st M
arc
h 2
007
Part
icula
rsAcc M
id C
ap
Acc M
id C
ap
Accele
rate
dBala
nce
Bala
nce
Plu
sBala
nce
dBala
nce
rBala
nce
rBond
Capit
al
Fund
Pensi
on
Fund
Fund
Pensi
on
Plu
s F
und
Pensi
on
Pensi
on
Guara
nte
e
Fund
Fund
Fund
Fund
Fund
Fund 2
012
Payable
for
purc
hase
of
Invest
ments
21,4
44
579
14
--
--
--
47
Oth
er
Curr
ent
Lia
bilit
ies:
83
96
--
--
-2
6
Unit
Paya
ble
A/c
--
--
--
--
--
Tota
l21,5
27
588
20
--
--
-2
53
Schedule
s to
Fund R
evenue A
ccount
A
ppendix
II Refe
r Sc
hedule
16 N
ote
23
SCH
EDU
LE F
4 :
CU
RREN
T L
IABIL
ITIE
S
As
at
31
st M
arc
h 2
007
Part
icula
rsCapit
al
Capit
al
Cash
Plu
sDebt Plu
sEq.
Eq. M
idcap
Guara
nte
e G
uara
nte
eC
ash
Cash
Plu
s P
ensi
on
Debt
Debt Plu
s P
ensi
on
Gro
wth
Plu
s
Fund 2
014
Fund 2
017
Fund
Fund
Fund
Fund
Fund
Fund
Fund
Fund
Payable
for
purc
hase
of
Invest
ments
16
15
--
--
--
144,7
31
15,7
85
Oth
er
Curr
ent
Lia
bilit
ies:
-3
198
223
30
242
89
24
1,0
86
335
Unit
Paya
ble
A/c
--
--
--
--
--
Tota
l16
18
198
223
30
242
89
24
145,8
17
16,1
20
Schedule
s to
Fund R
evenue A
ccount
A
ppendix
II Refe
r Sc
hedule
16 N
ote
23
SCH
EDU
LE F
4 :
CU
RREN
T L
IABIL
ITIE
S
As
at
31
st M
arc
h 2
007
Part
icula
rsEq.
Eq.M
idcap
Eq. G
ain
Eq.
Eq. G
row
thEq.
Index
Eq.
Index
Eq. Plu
sEq. Plu
sEq.
Index
Mid
cap
Pensi
on
Fund
Fund
Pensi
on
Fund
Pensi
on
Fund
Pensi
on
Pensi
on
Fund
Fund
Fund
Fund
Fund
Fund-2
Payable
for
purc
hase
of
Invest
ments
8,6
44
1,0
65
30,8
65
93,0
23
9,4
97
42,5
24
4,4
22
54,9
79
3,6
42
11,8
31
Oth
er
Curr
ent
Lia
bilit
ies:
294
36
1,5
68
852
74
33,4
83
41
1,7
82
144
14
Unit
Paya
ble
A/c
--
--
--
--
--
Tota
l8,9
38
1,1
01
32,4
33
93,8
75
9,5
71
76,0
07
4,4
63
56,7
61
3,7
86
11,8
45
Note
: ‘
Eq f
or
Equit
y’
(Am
ount
in R
s. ‘
000)
(Am
ount
in R
s. ‘
000)
(Am
ount
in R
s. ‘
000)
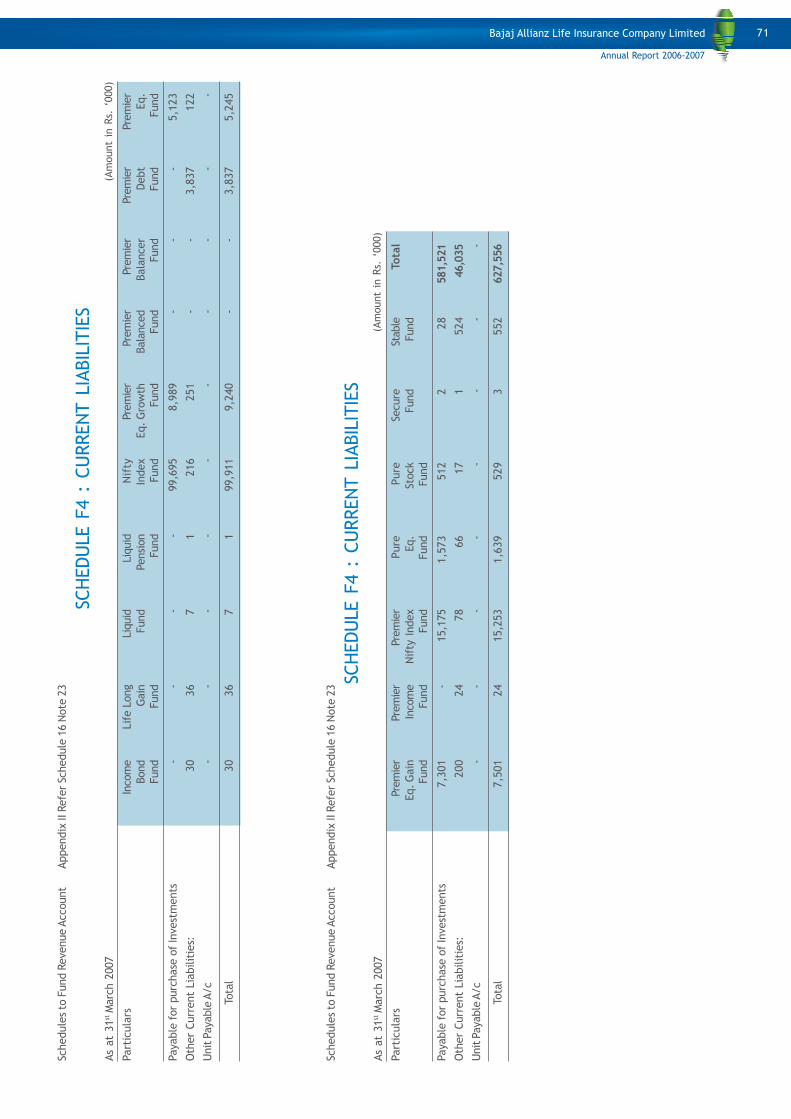
71
Schedule
s to
Fund R
evenue A
ccount
A
ppendix
II Refe
r Sc
hedule
16 N
ote
23
SCH
EDU
LE F
4 :
CU
RREN
T L
IABIL
ITIE
S
As
at
31
st M
arc
h 2
007
Part
icula
rsIn
com
eLif
e L
ong
Liquid
Liquid
Nif
tyPre
mie
rPre
mie
rPre
mie
rPre
mie
rPre
mie
r
Bond
Gain
Fund
Pensi
on
Index
Eq. G
row
th B
ala
nce
d B
ala
ncer
Debt
Eq.
Fund
Fund
Fund
Fund
Fund
Fund
Fund
Fund
Fund
Payable
for
purc
hase
of
Invest
ments
--
--
99,6
95
8,9
89
--
-5,1
23
Oth
er
Curr
ent
Lia
bilit
ies:
30
36
71
216
251
--
3,8
37
122
Unit
Paya
ble
A/c
--
--
--
--
--
Tota
l30
36
71
99,9
11
9,2
40
--
3,8
37
5,2
45
Schedule
s to
Fund R
evenue A
ccount
A
ppendix
II Refe
r Sc
hedule
16 N
ote
23
SCH
EDU
LE F
4 :
CU
RREN
T L
IABIL
ITIE
S
As
at
31
st M
arc
h 2
007
Part
icula
rsPre
mie
rPre
mie
rPre
mie
rPure
Pure
Secure
Stable
Tota
l
Eq. G
ain
Inco
me
Nif
ty I
ndex
Eq.
Sto
ck
Fund
Fund
Fund
Fund
Fund
Fund
Fund
Payable
for
purc
hase
of
Invest
ments
7,3
01
-15,1
75
1,5
73
512
228
581,5
21
Oth
er
Curr
ent
Lia
bilit
ies:
200
24
78
66
17
1524
46,0
35
Unit
Paya
ble
A/c
--
--
--
--
Tota
l7,5
01
24
15,2
53
1,6
39
529
3552
627,5
56
(Am
ount
in R
s. ‘
000)
(Am
ount
in R
s. ‘
000)
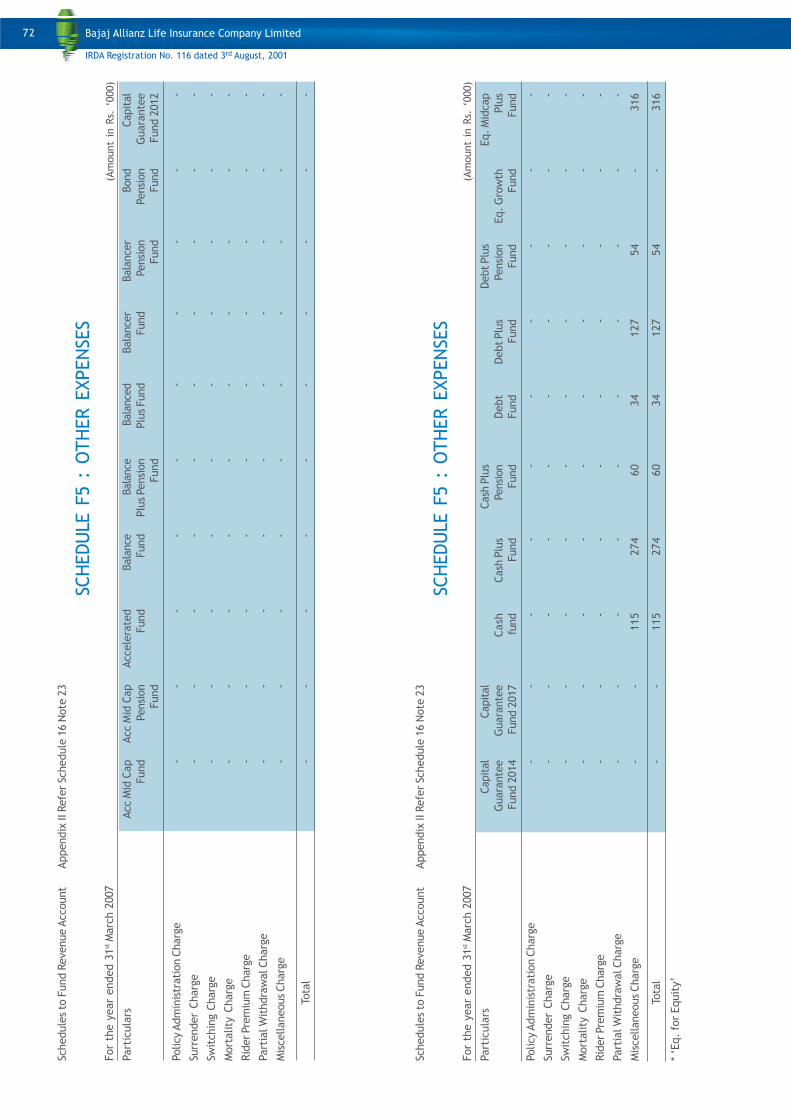
72
Schedule
s to
Fund R
evenue A
ccount
A
ppendix
II Refe
r Sc
hedule
16 N
ote
23
SCH
EDU
LE F
5 :
OTH
ER E
XPEN
SES
For
the y
ear
ended 3
1st M
arc
h 2
007
Part
icula
rsCapit
al
Capit
al
Cash
Plu
sDebt Plu
sEq. M
idcap
Guara
nte
e G
uara
nte
eC
ash
Cash
Plu
sPensi
on
Debt
Debt Plu
s P
ensi
on
Eq. G
row
th P
lus
Fund 2
014
Fund 2
017
fund
Fund
Fund
Fund
Fund
Fund
Fund
Fund
Policy A
dm
inis
trati
on C
harg
e-
--
--
--
--
-
Surr
ender
Charg
e-
--
--
--
--
-
Swit
chin
g C
harg
e-
--
--
--
--
-
Mort
ality
Charg
e-
--
--
--
--
-
Rid
er Pre
miu
m C
harg
e-
--
--
--
--
-
Part
ial W
ithdra
wal Charg
e-
--
--
--
--
-
Mis
cellaneous Charg
e-
-115
274
60
34
127
54
-316
Tota
l-
-115
274
60
34
127
54
-316
Schedule
s to
Fund R
evenue A
ccount
A
ppendix
II Refe
r Sc
hedule
16 N
ote
23
SCH
EDU
LE F
5 :
OTH
ER E
XPEN
SES
For
the y
ear
ended 3
1st M
arc
h 2
007
Part
icula
rsAcc M
id C
ap
Acc M
id C
ap
Accele
rate
dBala
nce
Bala
nce
Bala
nce
dBala
nce
rBala
nce
rBond
Capit
al
Fund
Pensi
on
Fund
Fund
Plu
s Pensi
on
Plu
s Fund
Fund
Pensi
on
Pensi
on
Guara
nte
e
Fund
Fund
Fund
Fund
Fund 2
012
Policy A
dm
inis
trati
on C
harg
e-
--
--
--
--
-
Surr
ender
Charg
e-
--
--
--
--
-
Swit
chin
g C
harg
e-
--
--
--
--
-
Mort
ality
Charg
e-
--
--
--
--
-
Rid
er Pre
miu
m C
harg
e-
--
--
--
--
-
Part
ial W
ithdra
wal Charg
e-
--
--
--
--
-
Mis
cellaneous
Charg
e-
--
--
--
--
-
Tota
l-
--
--
--
--
-
* ‘E
q.
for
Equit
y’
(Am
ount
in R
s. ‘
000)
(Am
ount
in R
s. ‘
000)
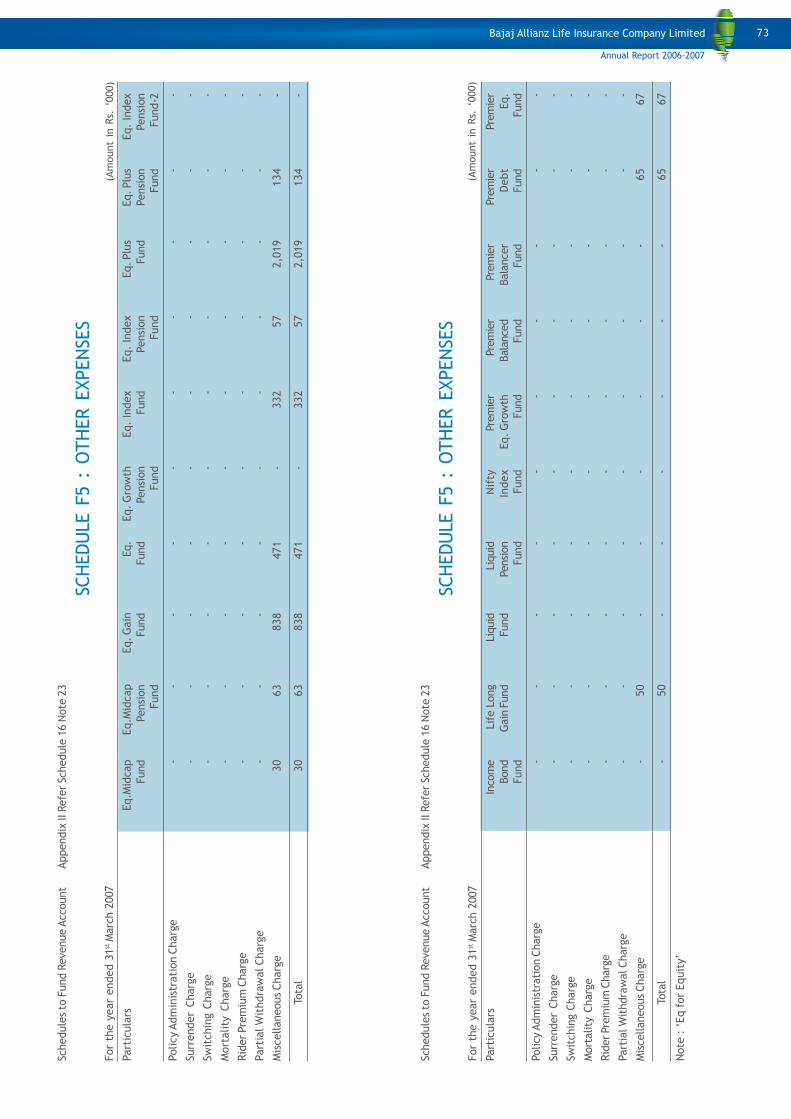
73
Schedule
s to
Fund R
evenue A
ccount
A
ppendix
II Refe
r Sc
hedule
16 N
ote
23
SCH
EDU
LE F
5 :
OTH
ER E
XPEN
SES
For
the y
ear
ended 3
1st M
arc
h 2
007
Part
icula
rsEq.M
idcap
Eq.M
idcap
Eq. G
ain
Eq.
Eq. G
row
thEq.
Index
Eq.
Index
Eq. Plu
sEq. Plu
sEq.
Index
Fund
Pensi
on
Fund
Fund
Pensi
on
Fund
Pensi
on
Fund
Pensi
on
Pensi
on
Fund
Fund
Fund
Fund
Fund-2
Policy A
dm
inis
trati
on C
harg
e-
--
--
--
--
-
Surr
ender
Charg
e-
--
--
--
--
-
Swit
chin
g C
harg
e-
--
--
--
--
-
Mort
ality
Charg
e-
--
--
--
--
-
Rid
er Pre
miu
m C
harg
e-
--
--
--
--
-
Part
ial W
ithdra
wal Charg
e-
--
--
--
--
-
Mis
cellaneous
Charg
e30
63
838
471
-332
57
2,0
19
134
-
Tota
l30
63
838
471
-332
57
2,0
19
134
-
Schedule
s to
Fund R
evenue A
ccount
A
ppendix
II Refe
r Sc
hedule
16 N
ote
23
SCH
EDU
LE F
5 :
OTH
ER E
XPEN
SES
For
the y
ear
ended 3
1st M
arc
h 2
007
Part
icula
rsIn
com
eLif
e L
ong
Liquid
Liquid
Nif
tyPre
mie
rPre
mie
rPre
mie
rPre
mie
rPre
mie
r
Bond
Gain
Fund
Fund
Pensi
on
Index
Eq. G
row
thBala
nce
dBala
nce
rD
ebt
Eq.
Fund
Fund
Fund
Fund
Fund
Fund
Fund
Fund
Policy A
dm
inis
trati
on C
harg
e-
--
--
--
--
-
Surr
ender
Charg
e-
--
--
--
--
-
Swit
chin
g C
harg
e-
--
--
--
--
-
Mort
ality
Charg
e-
--
--
--
--
-
Rid
er Pre
miu
m C
harg
e-
--
--
--
--
-
Part
ial W
ithdra
wal Charg
e-
--
--
--
--
-
Mis
cellaneous Charg
e-
50
--
--
--
65
67
Tota
l-
50
--
--
--
65
67
Note
: ‘
Eq f
or
Equit
y’
(Am
ount
in R
s. ‘
000)
(Am
ount
in R
s. ‘
000)
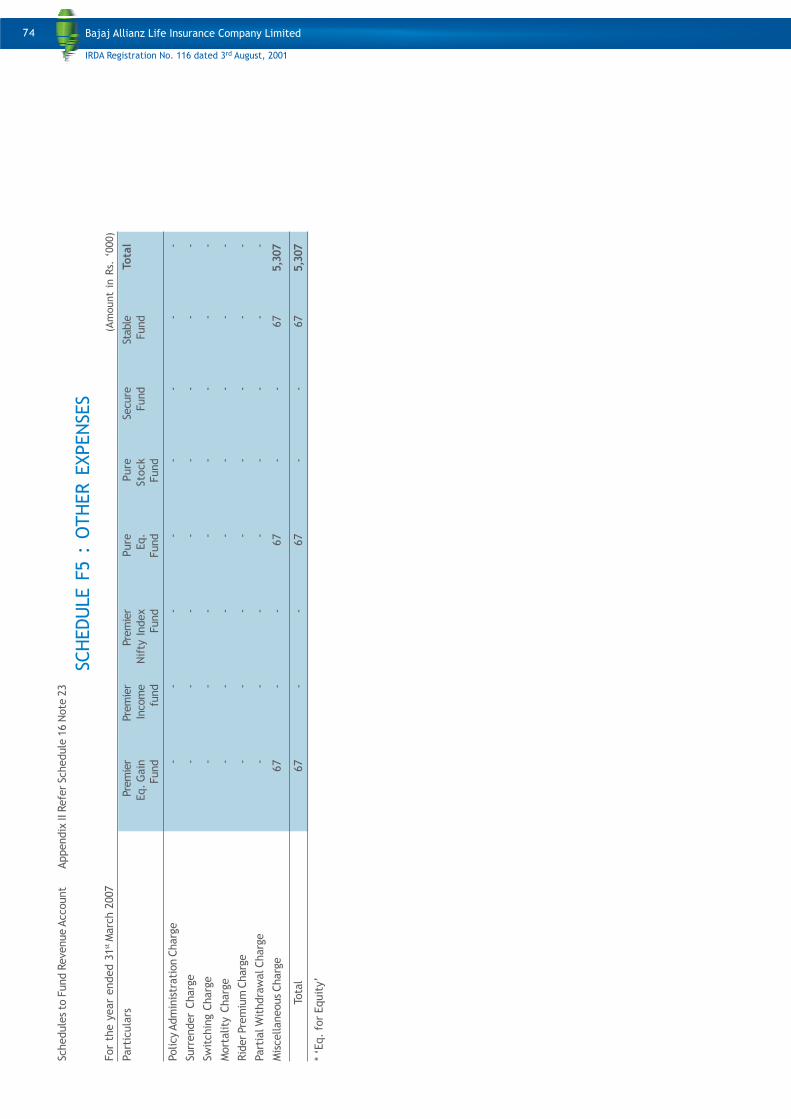
74
Schedule
s to
Fund R
evenue A
ccount
A
ppendix
II Refe
r Sc
hedule
16 N
ote
23
SCH
EDU
LE F
5 :
OTH
ER E
XPEN
SES
For
the y
ear
ended 3
1st M
arc
h 2
007
Part
icula
rsPre
mie
rPre
mie
rPre
mie
rPure
Pure
Secure
Stable
Tota
l
Eq. G
ain
Inco
me
Nif
ty I
ndex
Eq.
Sto
ck
Fund
Fund
Fund
fund
Fund
Fund
Fund
Policy A
dm
inis
trati
on C
harg
e-
--
--
--
-
Surr
ender
Charg
e-
--
--
--
-
Swit
chin
g C
harg
e-
--
--
--
-
Mort
ality
Charg
e-
--
--
--
-
Rid
er Pre
miu
m C
harg
e-
--
--
--
-
Part
ial W
ithdra
wal Charg
e-
--
--
--
-
Mis
cellaneous
Charg
e67
--
67
--
67
5,3
07
Tota
l67
--
67
--
67
5,3
07
* ‘E
q.
for
Equit
y’
(Am
ount
in R
s. ‘
000)
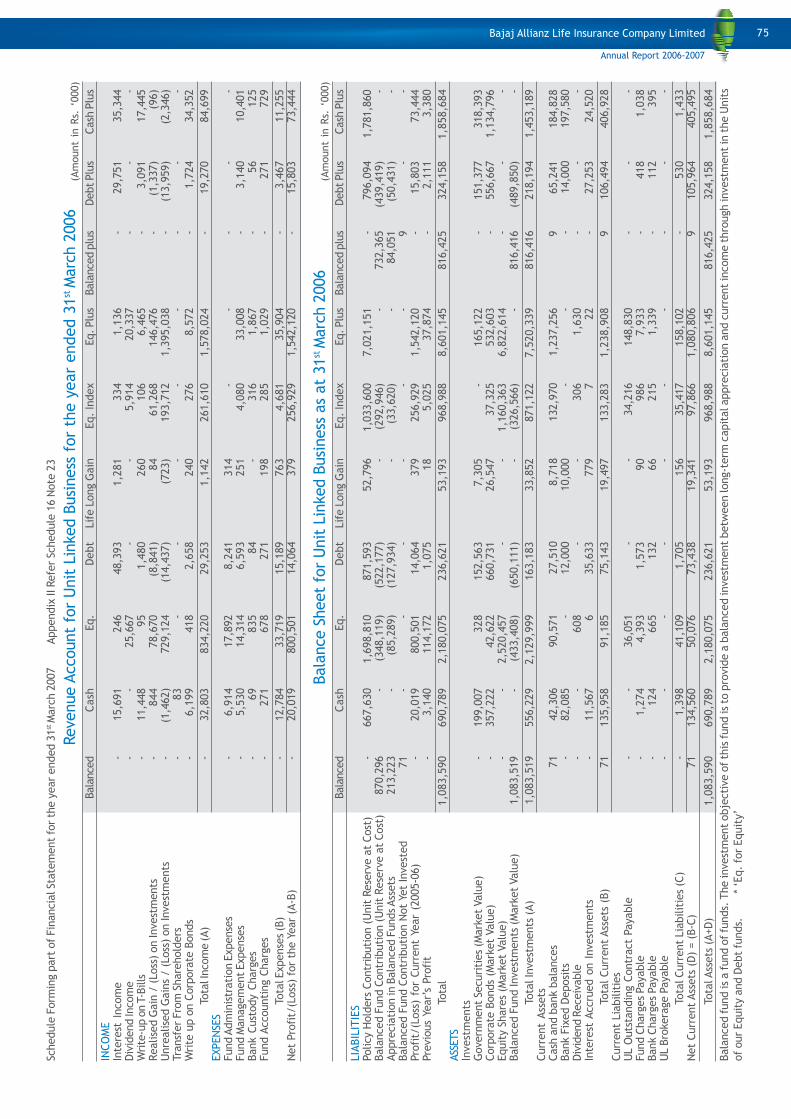
75
Schedule
Form
ing p
art
of
Fin
ancia
l St
ate
ment
for
the y
ear
ended 3
1st M
arc
h 2
007 Appendix
II Refe
r Sc
hedule
16 N
ote
23
Revenue A
ccount
for
Unit
Lin
ked B
usi
ness
for
the y
ear
ended 3
1st M
arc
h 2
006
Bala
nce
dC
ash
Eq.
Debt
Lif
e L
ong G
ain
Eq.
Index
Eq. Plu
sBala
nce
d p
lus
Debt Plu
sCash
Plu
s
INCO
ME
Inte
rest
Incom
e-
15,6
91
246
48,3
93
1,2
81
334
1,1
36
-29,7
51
35,3
44
Div
idend In
com
e-
-25,6
67
--
5,9
14
20,3
37
--
-W
rite
-up o
n T
-Bills
-11,4
48
95
1,4
80
260
106
6,4
65
-3,0
91
17,4
45
Realise
d G
ain
/ (Loss
) on Invest
ments
-844
78,6
70
(8,8
41)
84
61,2
68
146,4
76
-(1
,337)
(96)
Unre
alise
d G
ain
s / (
Loss
) on Invest
ments
-(1
,462)
729,1
24
(14,4
37)
(723)
193,7
12
1,3
95,0
38
-(1
3,9
59)
(2,3
46)
Transf
er
Fro
m S
hare
hold
ers
-83
--
--
--
--
Wri
te u
p o
n C
orp
ora
te B
onds
-6,1
99
418
2,6
58
240
276
8,5
72
-1,7
24
34,3
52
Tota
l Incom
e (A)
-32,8
03
834,2
20
29,2
53
1,1
42
261,6
10
1,5
78,0
24
-19,2
70
84,6
99
EXPEN
SES
Fund A
dm
inis
trati
on E
xpense
s-
6,9
14
17,8
92
8,2
41
314
--
--
-Fund M
anagem
ent
Expense
s-
5,5
30
14,3
14
6,5
93
251
4,0
80
33,0
08
-3,1
40
10,4
01
Bank C
ust
ody C
harg
es
-69
835
84
-316
1,8
67
-56
125
Fund A
ccounti
ng C
harg
es
-271
678
271
198
285
1,0
29
-271
729
Tota
l Expense
s (B
)-
12,7
84
33,7
19
15,1
89
763
4,6
81
35,9
04
-3,4
67
11,2
55
Net
Pro
fit/
(Loss
) fo
r th
e Y
ear
(A-B
)-
20,0
19
800,5
01
14,0
64
379
256,9
29
1,5
42,1
20
-15,8
03
73,4
44
Bala
nce S
heet
for
Unit
Lin
ked B
usi
ness
as
at
31
st M
arc
h 2
006
Bala
nce
dC
ash
Eq.
Debt
Lif
e L
ong G
ain
Eq.
Index
Eq. Plu
sBala
nce
d p
lus
Debt Plu
sCash
Plu
s
LIA
BIL
ITIE
SPolicy H
old
ers
Contr
ibuti
on (
Unit
Rese
rve a
t Cost
)-
667,6
30
1,6
98,8
10
871,5
93
52,7
96
1,0
33,6
00
7,0
21,1
51
-796,0
94
1,7
81,8
60
Bala
nced F
und C
ontr
ibuti
on (
Unit
Rese
rve a
t Cost
)870,2
96
-(3
48,1
19)
(522,1
77)
-(2
92,9
46)
-732,3
65
(439,4
19)
-Appre
cia
tion in B
ala
nced F
unds Ass
ets
213,2
23
-(8
5,2
89)
(127,9
34)
-(3
3,6
20)
-84,0
51
(50,4
31)
-Bala
nced F
und C
ontr
ibuti
on N
ot
Yet
Invest
ed
71
--
--
--
9-
-Pro
fit/
(Loss
) fo
r Curr
ent
Year
(2005-0
6)
-20,0
19
800,5
01
14,0
64
379
256,9
29
1,5
42,1
20
-15,8
03
73,4
44
Pre
vious
Year’
s Pro
fit
-3,1
40
114,1
72
1,0
75
18
5,0
25
37,8
74
-2,1
11
3,3
80
Tota
l1,0
83,5
90
690,7
89
2,1
80,0
75
236,6
21
53,1
93
968,9
88
8,6
01,1
45
816,4
25
324,1
58
1,8
58,6
84
ASS
ETS
Invest
ments
Govern
ment
Securi
ties
(Mark
et
Valu
e)
-199,0
07
328
152,5
63
7,3
05
-165,1
22
-151,3
77
318,3
93
Corp
ora
te B
onds
(Mark
et
Valu
e)
-357,2
22
42,6
22
660,7
31
26,5
47
37,3
25
532,6
03
-556,6
67
1,1
34,7
96
Equit
y S
hare
s (M
ark
et
Valu
e)
--
2,5
20,4
57
--
1,1
60,3
63
6,8
22,6
14
--
-Bala
nced F
und Invest
ments
(M
ark
et
Valu
e)
1,0
83,5
19
-(4
33,4
08)
(650,1
11)
-(3
26,5
66)
-816,4
16
(489,8
50)
-
Tota
l In
vest
ments
(A)
1,0
83,5
19
556,2
29
2,1
29,9
99
163,1
83
33,8
52
871,1
22
7,5
20,3
39
816,4
16
218,1
94
1,4
53,1
89
Curr
ent
Ass
ets
Cash
and b
ank b
ala
nces
71
42,3
06
90,5
71
27,5
10
8,7
18
132,9
70
1,2
37,2
56
965,2
41
184,8
28
Bank F
ixed D
eposi
ts-
82,0
85
-12,0
00
10,0
00
--
-14,0
00
197,5
80
Div
idend R
ece
ivable
--
608
--
306
1,6
30
--
-In
tere
st A
ccru
ed o
n I
nvest
ments
-11,5
67
635,6
33
779
722
-27,2
53
24,5
20
Tota
l Curr
ent
Ass
ets
(B)
71
135,9
58
91,1
85
75,1
43
19,4
97
133,2
83
1,2
38,9
08
9106,4
94
406,9
28
Curr
ent
Lia
bilit
ies
UL
Outs
tandin
g C
ontr
act
Payable
--
36,0
51
--
34,2
16
148,8
30
--
-Fund C
harg
es
Payable
-1,2
74
4,3
93
1,5
73
90
986
7,9
33
-418
1,0
38
Bank C
harg
es
Payable
-124
665
132
66
215
1,3
39
-112
395
UL
Bro
kera
ge P
ayable
--
--
--
--
--
Tota
l Curr
ent
Lia
bilit
ies
(C)
-1,3
98
41,1
09
1,7
05
156
35,4
17
158,1
02
-530
1,4
33
Net
Curr
ent
Ass
ets
(D)
= (
B-C
)71
134,5
60
50,0
76
73,4
38
19,3
41
97,8
66
1,0
80,8
06
9105,9
64
405,4
95
Tota
l Ass
ets
(A+D)
1,0
83,5
90
690,7
89
2,1
80,0
75
236,6
21
53,1
93
968,9
88
8,6
01,1
45
816,4
25
324,1
58
1,8
58,6
84
Bala
nced fund is
a fund o
f fu
nds.
The invest
ment
obje
cti
ve o
f th
is fund is
to p
rovid
e a
bala
nced invest
ment
betw
een long-t
erm
capit
al appre
cia
tion a
nd c
urr
ent
incom
e t
hro
ugh invest
ment
in t
he U
nit
s
of
our
Equit
y a
nd D
ebt
funds.
*
‘Eq.
for
Equit
y’
(Am
ount
in R
s. ‘
000)
(Am
ount
in R
s. ‘
000)
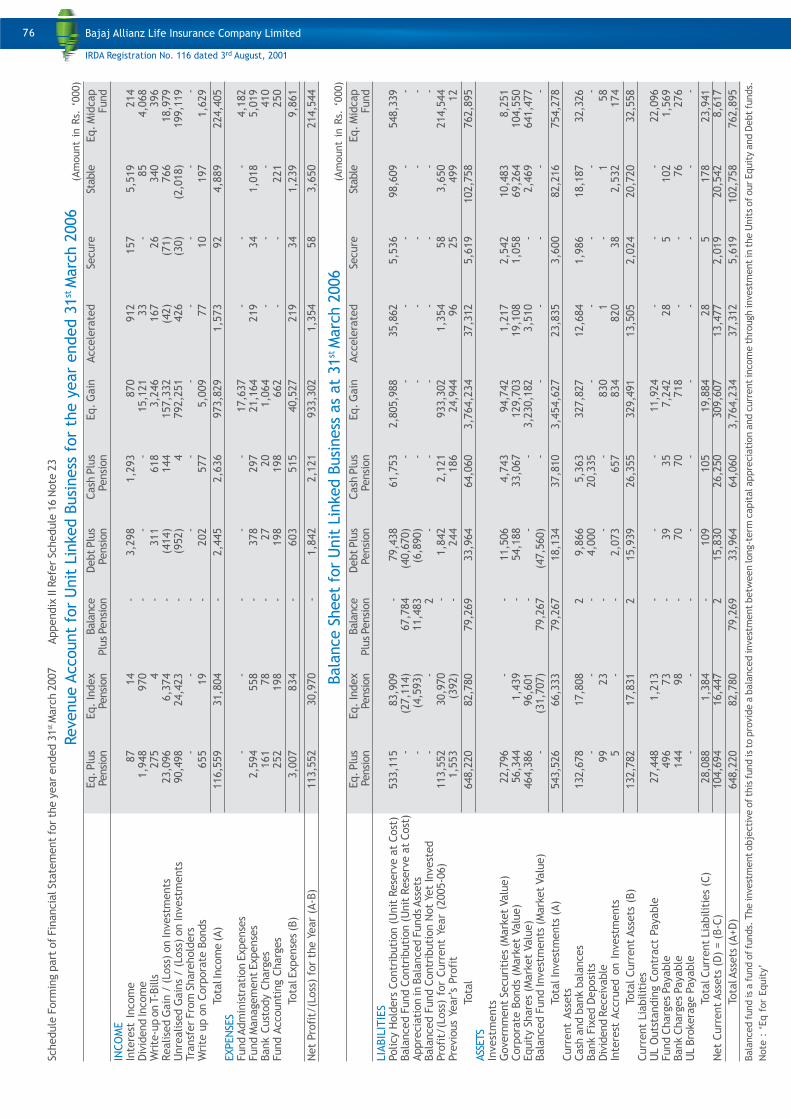
76
Schedule
Form
ing p
art
of
Fin
ancia
l St
ate
ment
for
the y
ear
ended 3
1st M
arc
h 2
007 Appendix
II Refe
r Sc
hedule
16 N
ote
23
Revenue A
ccount
for
Unit
Lin
ked B
usi
ness
for
the y
ear
ended 3
1st M
arc
h 2
006
Eq. Plu
sEq.
Index
Bala
nce
Debt Plu
sCash
Plu
sEq. G
ain
Accele
rate
dSe
cure
Stable
Eq. M
idcap
Pensi
on
Pensi
on
Plu
s Pensi
on
Pensi
on
Pensi
on
Fund
INCO
ME
Inte
rest
Incom
e87
14
-3,2
98
1,2
93
870
912
157
5,5
19
214
Div
idend In
com
e1,9
48
970
--
-15,1
21
33
-85
4,0
68
Wri
te-u
p o
n T
-Bills
275
4-
311
618
3,2
46
167
26
340
396
Realise
d G
ain
/ (Loss
) on Invest
ments
23,0
96
6,3
74
-(4
14)
144
157,3
32
(42)
(71)
766
18,9
79
Unre
alise
d G
ain
s / (
Loss
) on Invest
ments
90,4
98
24,4
23
-(9
52)
4792,2
51
426
(30)
(2,0
18)
199,1
19
Transf
er
Fro
m S
hare
hold
ers
--
--
--
--
--
Wri
te u
p o
n C
orp
ora
te B
onds
655
19
-202
577
5,0
09
77
10
197
1,6
29
Tota
l Incom
e (A)
116,5
59
31,8
04
-2,4
45
2,6
36
973,8
29
1,5
73
92
4,8
89
224,4
05
EXPEN
SES
Fund A
dm
inis
trati
on E
xpense
s-
--
--
17,6
37
--
-4,1
82
Fund M
anagem
ent
Expense
s2,5
94
558
-378
297
21,1
64
219
34
1,0
18
5,0
19
Bank C
ust
ody C
harg
es
161
78
-27
20
1,0
64
--
-410
Fund A
ccounti
ng C
harg
es
252
198
-198
198
662
--
221
250
Tota
l Expense
s (B
)3,0
07
834
-603
515
40,5
27
219
34
1,2
39
9,8
61
Net
Pro
fit/
(Loss
) fo
r th
e Y
ear
(A-B
)113,5
52
30,9
70
-1,8
42
2,1
21
933,3
02
1,3
54
58
3,6
50
214,5
44
Bala
nce S
heet
for
Unit
Lin
ked B
usi
ness
as
at
31
st M
arc
h 2
006
Eq. Plu
sEq.
Index
Bala
nce
Debt Plu
sCash
Plu
sEq. G
ain
Accele
rate
dSe
cure
Stable
Eq. M
idcap
Pensi
on
Pensi
on
Plu
s Pensi
on
Pensi
on
Pensi
on
Fund
LIA
BIL
ITIE
SPolicy H
old
ers
Contr
ibuti
on (
Unit
Rese
rve a
t Cost
)533,1
15
83,9
09
-79,4
38
61,7
53
2,8
05,9
88
35,8
62
5,5
36
98,6
09
548,3
39
Bala
nced F
und C
ontr
ibuti
on (
Unit
Rese
rve a
t Cost
)-
(27,1
14)
67,7
84
(40,6
70)
--
--
--
Appre
cia
tion in B
ala
nced F
unds Ass
ets
-(4
,593)
11,4
83
(6,8
90)
--
--
--
Bala
nced F
und C
ontr
ibuti
on N
ot
Yet
Invest
ed
--
2-
--
--
--
Pro
fit/
(Loss
) fo
r Curr
ent
Year
(2005-0
6)
113,5
52
30,9
70
-1,8
42
2,1
21
933,3
02
1,3
54
58
3,6
50
214,5
44
Pre
vious
Year’
s Pro
fit
1,5
53
(392)
-244
186
24,9
44
96
25
499
12
Tota
l648,2
20
82,7
80
79,2
69
33,9
64
64,0
60
3,7
64,2
34
37,3
12
5,6
19
102,7
58
762,8
95
ASS
ETS
Invest
ments
Govern
ment
Securi
ties
(Mark
et
Valu
e)
22,7
96
--
11,5
06
4,7
43
94,7
42
1,2
17
2,5
42
10,4
83
8,2
51
Corp
ora
te B
onds
(Mark
et
Valu
e)
56,3
44
1,4
39
-54,1
88
33,0
67
129,7
03
19,1
08
1,0
58
69,2
64
104,5
50
Equit
y S
hare
s (M
ark
et
Valu
e)
464,3
86
96,6
01
--
-3,2
30,1
82
3,5
10
-2,4
69
641,4
77
Bala
nced F
und Invest
ments
(M
ark
et
Valu
e)
-(3
1,7
07)
79,2
67
(47,5
60)
--
--
--
Tota
l In
vest
ments
(A)
543,5
26
66,3
33
79,2
67
18,1
34
37,8
10
3,4
54,6
27
23,8
35
3,6
00
82,2
16
754,2
78
Curr
ent
Ass
ets
Cash
and b
ank b
ala
nces
132,6
78
17,8
08
29,8
66
5,3
63
327,8
27
12,6
84
1,9
86
18,1
87
32,3
26
Bank F
ixed D
eposi
ts-
--
4,0
00
20,3
35
--
--
-Div
idend R
ece
ivable
99
23
--
-830
1-
158
Inte
rest
Accru
ed o
n I
nvest
ments
5-
-2,0
73
657
834
820
38
2,5
32
174
Tota
l Curr
ent
Ass
ets
(B)
132,7
82
17,8
31
215,9
39
26,3
55
329,4
91
13,5
05
2,0
24
20,7
20
32,5
58
Curr
ent
Lia
bilit
ies
UL
Outs
tandin
g C
ontr
act
Payable
27,4
48
1,2
13
--
-11,9
24
--
-22,0
96
Fund C
harg
es
Payable
496
73
-39
35
7,2
42
28
5102
1,5
69
Bank C
harg
es
Payable
144
98
-70
70
718
--
76
276
UL
Bro
kera
ge P
ayable
--
--
--
--
--
Tota
l Curr
ent
Lia
bilit
ies
(C)
28,0
88
1,3
84
-109
105
19,8
84
28
5178
23,9
41
Net
Curr
ent
Ass
ets
(D)
= (
B-C
)104,6
94
16,4
47
215,8
30
26,2
50
309,6
07
13,4
77
2,0
19
20,5
42
8,6
17
Tota
l Ass
ets
(A+D)
648,2
20
82,7
80
79,2
69
33,9
64
64,0
60
3,7
64,2
34
37,3
12
5,6
19
102,7
58
762,8
95
Bala
nced fund is
a fund o
f fu
nds.
The invest
ment
obje
cti
ve o
f th
is fund is
to p
rovid
e a
bala
nced invest
ment
betw
een long-t
erm
capit
al appre
cia
tion a
nd c
urr
ent
incom
e t
hro
ugh invest
ment
in t
he U
nit
s of our Equit
y a
nd D
ebt
funds.
Note
: ‘
Eq f
or
Equit
y’
(Am
ount
in R
s. ‘
000)
(Am
ount
in R
s. ‘
000)
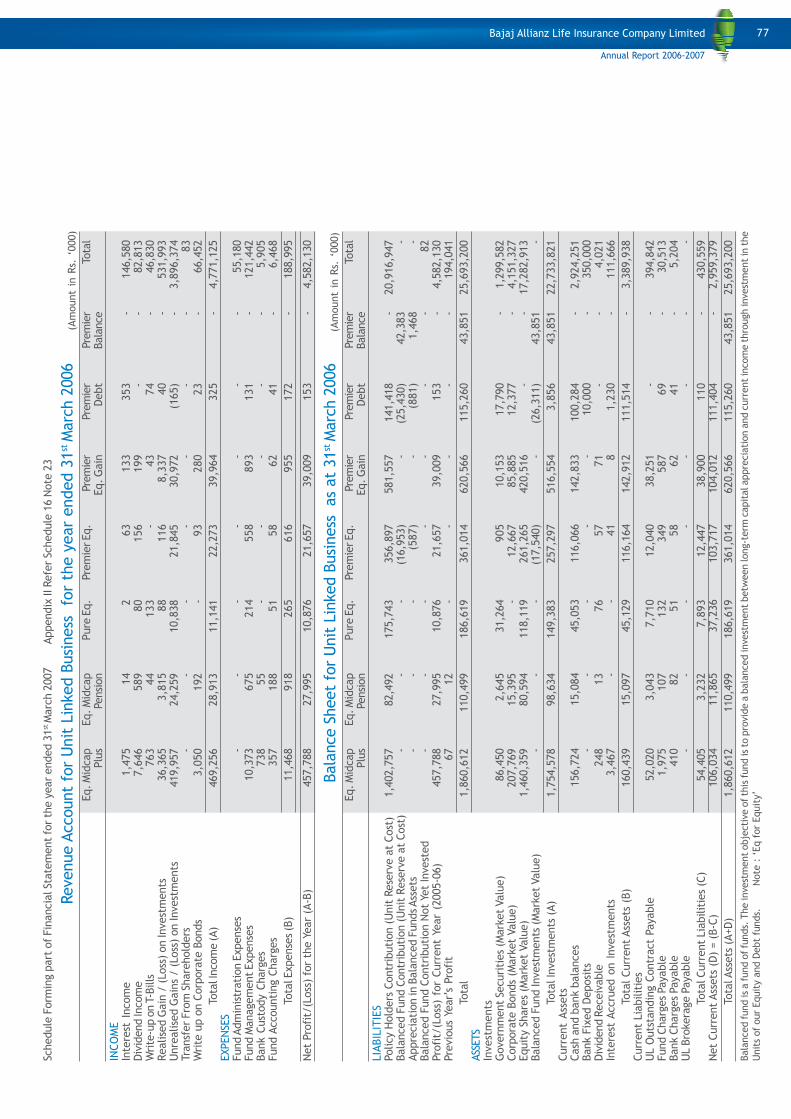
77
Schedule
Form
ing p
art
of
Fin
ancia
l St
ate
ment
for
the y
ear
ended 3
1st M
arc
h 2
007 Appendix
II Refe
r Sc
hedule
16 N
ote
23
Revenue A
ccount
for
Unit
Lin
ked B
usi
ness
fo
r th
e y
ear
ended 3
1st M
arc
h 2
006
Eq. M
idcap
Eq. M
idcap
Pure
Eq.
Pre
mie
r Eq.
Pre
mie
rPre
mie
rPre
mie
rTo
tal
Plu
sPensi
on
Eq. G
ain
Debt
Bala
nce
INCO
ME
Inte
rest
Incom
e1,4
75
14
263
133
353
-146,5
80
Div
idend In
com
e7,6
46
589
80
156
199
--
82,8
13
Wri
te-u
p o
n T
-Bills
763
44
133
-43
74
-46,8
30
Realise
d G
ain
/ (Loss
) on Invest
ments
36,3
65
3,8
15
88
116
8,3
37
40
-531,9
93
Unre
alise
d G
ain
s / (
Loss
) on Invest
ments
419,9
57
24,2
59
10,8
38
21,8
45
30,9
72
(165)
-3,8
96,3
74
Transf
er
Fro
m S
hare
hold
ers
--
--
--
-83
Wri
te u
p o
n C
orp
ora
te B
onds
3,0
50
192
-93
280
23
-66,4
52
Tota
l Incom
e (A)
469,2
56
28,9
13
11,1
41
22,2
73
39,9
64
325
-4,7
71,1
25
EXPEN
SES
Fund A
dm
inis
trati
on E
xpense
s-
--
--
--
55,1
80
Fund M
anagem
ent
Expense
s10,3
73
675
214
558
893
131
-121,4
42
Bank C
ust
ody C
harg
es
738
55
--
--
-5,9
05
Fund A
ccounti
ng C
harg
es
357
188
51
58
62
41
-6,4
68
Tota
l Expense
s (B
)11,4
68
918
265
616
955
172
-188,9
95
Net
Pro
fit/
(Loss
) fo
r th
e Y
ear
(A-B
)457,7
88
27,9
95
10,8
76
21,6
57
39,0
09
153
-4,5
82,1
30
Bala
nce S
heet
for
Unit
Lin
ked B
usi
ness
as
at
31
st M
arc
h 2
006
Eq. M
idcap
Eq. M
idcap
Pure
Eq.
Pre
mie
r Eq.
Pre
mie
rPre
mie
rPre
mie
rTo
tal
Plu
sPensi
on
Eq. G
ain
Debt
Bala
nce
LIA
BIL
ITIE
SPolicy H
old
ers
Contr
ibuti
on (
Unit
Rese
rve a
t Cost
)1,4
02,7
57
82,4
92
175,7
43
356,8
97
581,5
57
141,4
18
-20,9
16,9
47
Bala
nced F
und C
ontr
ibuti
on (
Unit
Rese
rve a
t Cost
)-
--
(16,9
53)
-(2
5,4
30)
42,3
83
-Appre
cia
tion in B
ala
nced F
unds Ass
ets
--
-(5
87)
-(8
81)
1,4
68
-Bala
nced F
und C
ontr
ibuti
on N
ot
Yet
Invest
ed
--
--
--
-82
Pro
fit/
(Loss
) fo
r Curr
ent
Year
(2005-0
6)
457,7
88
27,9
95
10,8
76
21,6
57
39,0
09
153
-4,5
82,1
30
Pre
vious
Year’
s Pro
fit
67
12
--
--
-194,0
41
Tota
l1,8
60,6
12
110,4
99
186,6
19
361,0
14
620,5
66
115,2
60
43,8
51
25,6
93,2
00
ASS
ETS
Invest
ments
Govern
ment
Securi
ties
(Mark
et
Valu
e)
86,4
50
2,6
45
31,2
64
905
10,1
53
17,7
90
-1,2
99,5
82
Corp
ora
te B
onds
(Mark
et
Valu
e)
207,7
69
15,3
95
-12,6
67
85,8
85
12,3
77
-4,1
51,3
27
Equit
y S
hare
s (M
ark
et
Valu
e)
1,4
60,3
59
80,5
94
118,1
19
261,2
65
420,5
16
--
17,2
82,9
13
Bala
nced F
und Invest
ments
(M
ark
et
Valu
e)
--
-(1
7,5
40)
-(2
6,3
11)
43,8
51
-
Tota
l In
vest
ments
(A)
1,7
54,5
78
98,6
34
149,3
83
257,2
97
516,5
54
3,8
56
43,8
51
22,7
33,8
21
Curr
ent
Ass
ets
Cash
and b
ank b
ala
nces
156,7
24
15,0
84
45,0
53
116,0
66
142,8
33
100,2
84
-2,9
24,2
51
Bank F
ixed D
eposi
ts-
--
--
10,0
00
-350,0
00
Div
idend R
ece
ivable
248
13
76
57
71
--
4,0
21
Inte
rest
Accru
ed o
n I
nvest
ments
3,4
67
--
41
81,2
30
-111,6
66
Tota
l Curr
ent
Ass
ets
(B)
160,4
39
15,0
97
45,1
29
116,1
64
142,9
12
111,5
14
-3,3
89,9
38
Curr
ent
Lia
bilit
ies
UL
Outs
tandin
g C
ontr
act
Payable
52,0
20
3,0
43
7,7
10
12,0
40
38,2
51
--
394,8
42
Fund C
harg
es
Payable
1,9
75
107
132
349
587
69
-30,5
13
Bank C
harg
es
Payable
410
82
51
58
62
41
-5,2
04
UL
Bro
kera
ge P
ayable
--
--
--
--
Tota
l Curr
ent
Lia
bilit
ies
(C)
54,4
05
3,2
32
7,8
93
12,4
47
38,9
00
110
-430,5
59
Net
Curr
ent
Ass
ets
(D
) = (
B-C
)106,0
34
11,8
65
37,2
36
103,7
17
104,0
12
111,4
04
-2,9
59,3
79
Tota
l Ass
ets
(A+D)
1,8
60,6
12
110,4
99
186,6
19
361,0
14
620,5
66
115,2
60
43,8
51
25,6
93,2
00
Bala
nced fund is
a fund o
f fu
nds.
The invest
ment
obje
cti
ve o
f th
is fund is
to p
rovid
e a
bala
nced invest
ment
betw
een long-t
erm
capit
al appre
cia
tion a
nd c
urr
ent
incom
e t
hro
ugh invest
ment
in t
he
Unit
s of
our
Equit
y a
nd D
ebt
funds.
Note
: ‘
Eq f
or
Equit
y’
(Am
ount
in R
s. ‘
000)
(Am
ount
in R
s. ‘
000)
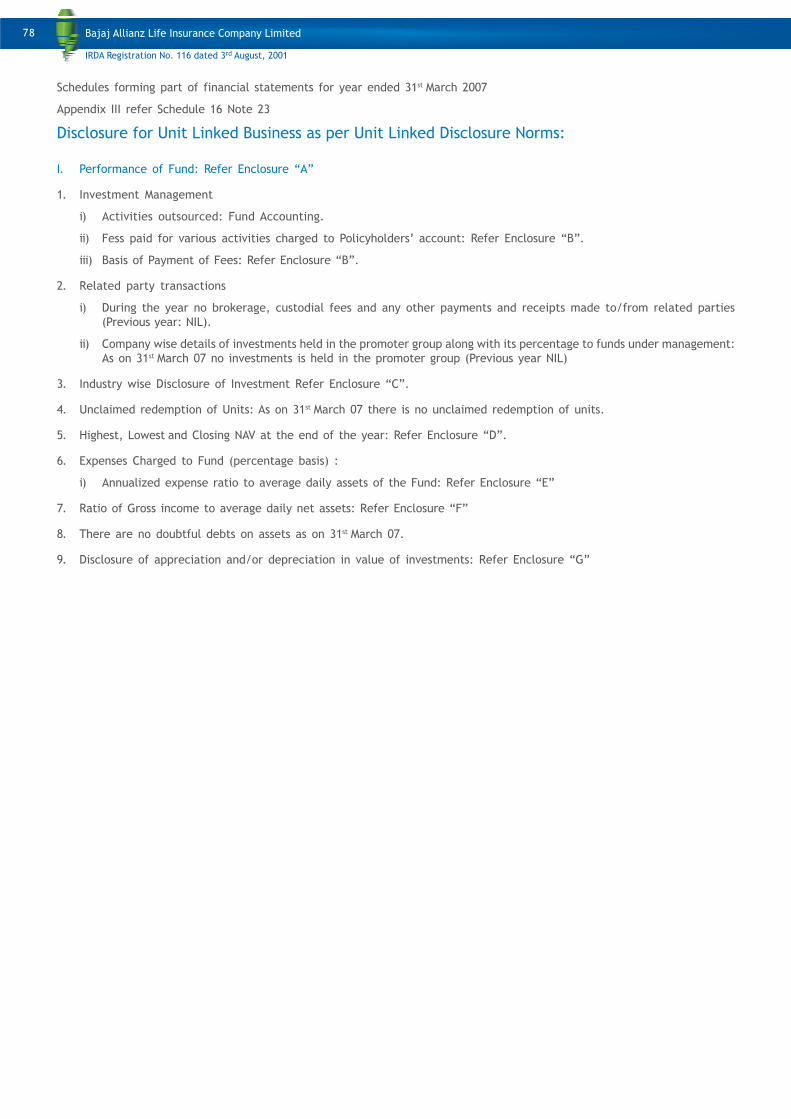
Schedules forming part of financial statements for year ended 31st March 2007
Appendix III refer Schedule 16 Note 23
Disclosure for Unit Linked Business as per Unit Linked Disclosure Norms:
I. Performance of Fund: Refer Enclosure “A”
1. Investment Management
i) Activities outsourced: Fund Accounting.
ii) Fess paid for various activities charged to Policyholders’ account: Refer Enclosure “B”.
iii) Basis of Payment of Fees: Refer Enclosure “B”.
2. Related party transactions
i) During the year no brokerage, custodial fees and any other payments and receipts made to/from related parties
(Previous year: NIL).
ii) Company wise details of investments held in the promoter group along with its percentage to funds under management:
As on 31st March 07 no investments is held in the promoter group (Previous year NIL)
3. Industry wise Disclosure of Investment Refer Enclosure “C”.
4. Unclaimed redemption of Units: As on 31st March 07 there is no unclaimed redemption of units.
5. Highest, Lowest and Closing NAV at the end of the year: Refer Enclosure “D”.
6. Expenses Charged to Fund (percentage basis) :
i) Annualized expense ratio to average daily assets of the Fund: Refer Enclosure “E”
7. Ratio of Gross income to average daily net assets: Refer Enclosure “F”
8. There are no doubtful debts on assets as on 31st March 07.
9. Disclosure of appreciation and/or depreciation in value of investments: Refer Enclosure “G”
78
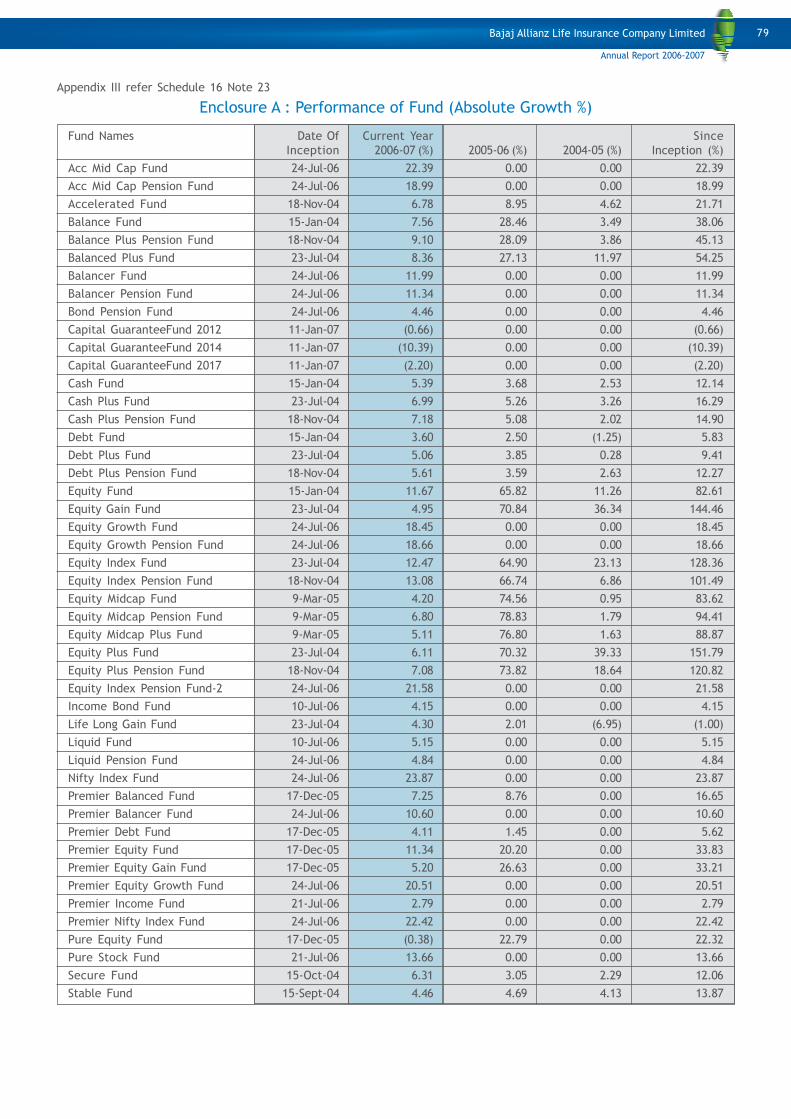
Appendix III refer Schedule 16 Note 23
Enclosure A : Performance of Fund (Absolute Growth %)
Fund Names Date Of Current Year Since
Inception 2006-07 (%) 2005-06 (%) 2004-05 (%) Inception (%)
Acc Mid Cap Fund 24-Jul-06 22.39 0.00 0.00 22.39
Acc Mid Cap Pension Fund 24-Jul-06 18.99 0.00 0.00 18.99
Accelerated Fund 18-Nov-04 6.78 8.95 4.62 21.71
Balance Fund 15-Jan-04 7.56 28.46 3.49 38.06
Balance Plus Pension Fund 18-Nov-04 9.10 28.09 3.86 45.13
Balanced Plus Fund 23-Jul-04 8.36 27.13 11.97 54.25
Balancer Fund 24-Jul-06 11.99 0.00 0.00 11.99
Balancer Pension Fund 24-Jul-06 11.34 0.00 0.00 11.34
Bond Pension Fund 24-Jul-06 4.46 0.00 0.00 4.46
Capital GuaranteeFund 2012 11-Jan-07 (0.66) 0.00 0.00 (0.66)
Capital GuaranteeFund 2014 11-Jan-07 (10.39) 0.00 0.00 (10.39)
Capital GuaranteeFund 2017 11-Jan-07 (2.20) 0.00 0.00 (2.20)
Cash Fund 15-Jan-04 5.39 3.68 2.53 12.14
Cash Plus Fund 23-Jul-04 6.99 5.26 3.26 16.29
Cash Plus Pension Fund 18-Nov-04 7.18 5.08 2.02 14.90
Debt Fund 15-Jan-04 3.60 2.50 (1.25) 5.83
Debt Plus Fund 23-Jul-04 5.06 3.85 0.28 9.41
Debt Plus Pension Fund 18-Nov-04 5.61 3.59 2.63 12.27
Equity Fund 15-Jan-04 11.67 65.82 11.26 82.61
Equity Gain Fund 23-Jul-04 4.95 70.84 36.34 144.46
Equity Growth Fund 24-Jul-06 18.45 0.00 0.00 18.45
Equity Growth Pension Fund 24-Jul-06 18.66 0.00 0.00 18.66
Equity Index Fund 23-Jul-04 12.47 64.90 23.13 128.36
Equity Index Pension Fund 18-Nov-04 13.08 66.74 6.86 101.49
Equity Midcap Fund 9-Mar-05 4.20 74.56 0.95 83.62
Equity Midcap Pension Fund 9-Mar-05 6.80 78.83 1.79 94.41
Equity Midcap Plus Fund 9-Mar-05 5.11 76.80 1.63 88.87
Equity Plus Fund 23-Jul-04 6.11 70.32 39.33 151.79
Equity Plus Pension Fund 18-Nov-04 7.08 73.82 18.64 120.82
Equity Index Pension Fund-2 24-Jul-06 21.58 0.00 0.00 21.58
Income Bond Fund 10-Jul-06 4.15 0.00 0.00 4.15
Life Long Gain Fund 23-Jul-04 4.30 2.01 (6.95) (1.00)
Liquid Fund 10-Jul-06 5.15 0.00 0.00 5.15
Liquid Pension Fund 24-Jul-06 4.84 0.00 0.00 4.84
Nifty Index Fund 24-Jul-06 23.87 0.00 0.00 23.87
Premier Balanced Fund 17-Dec-05 7.25 8.76 0.00 16.65
Premier Balancer Fund 24-Jul-06 10.60 0.00 0.00 10.60
Premier Debt Fund 17-Dec-05 4.11 1.45 0.00 5.62
Premier Equity Fund 17-Dec-05 11.34 20.20 0.00 33.83
Premier Equity Gain Fund 17-Dec-05 5.20 26.63 0.00 33.21
Premier Equity Growth Fund 24-Jul-06 20.51 0.00 0.00 20.51
Premier Income Fund 21-Jul-06 2.79 0.00 0.00 2.79
Premier Nifty Index Fund 24-Jul-06 22.42 0.00 0.00 22.42
Pure Equity Fund 17-Dec-05 (0.38) 22.79 0.00 22.32
Pure Stock Fund 21-Jul-06 13.66 0.00 0.00 13.66
Secure Fund 15-Oct-04 6.31 3.05 2.29 12.06
Stable Fund 15-Sept-04 4.46 4.69 4.13 13.87
79
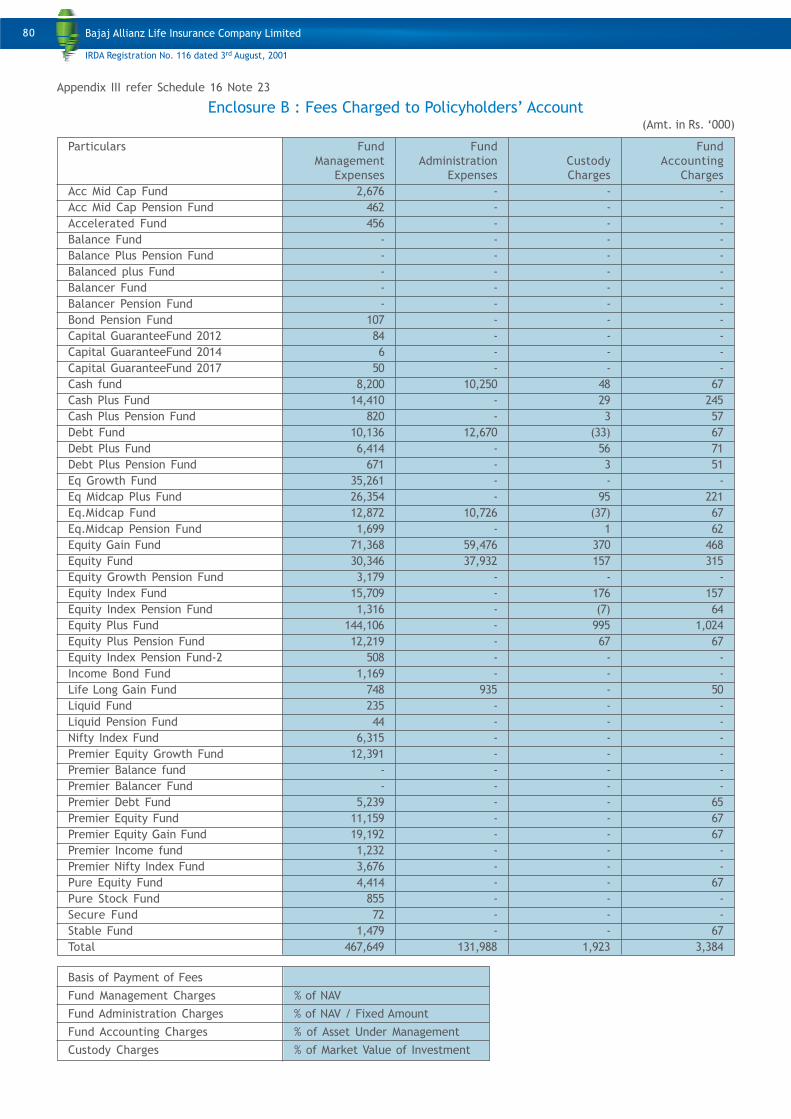
Appendix III refer Schedule 16 Note 23
Enclosure B : Fees Charged to Policyholders’ Account(Amt. in Rs. ‘000)
Particulars Fund Fund Fund
Management Administration Custody Accounting
Expenses Expenses Charges Charges
Acc Mid Cap Fund 2,676 - - -
Acc Mid Cap Pension Fund 462 - - -
Accelerated Fund 456 - - -
Balance Fund - - - -
Balance Plus Pension Fund - - - -
Balanced plus Fund - - - -
Balancer Fund - - - -
Balancer Pension Fund - - - -
Bond Pension Fund 107 - - -
Capital GuaranteeFund 2012 84 - - -
Capital GuaranteeFund 2014 6 - - -
Capital GuaranteeFund 2017 50 - - -
Cash fund 8,200 10,250 48 67
Cash Plus Fund 14,410 - 29 245
Cash Plus Pension Fund 820 - 3 57
Debt Fund 10,136 12,670 (33) 67
Debt Plus Fund 6,414 - 56 71
Debt Plus Pension Fund 671 - 3 51
Eq Growth Fund 35,261 - - -
Eq Midcap Plus Fund 26,354 - 95 221
Eq.Midcap Fund 12,872 10,726 (37) 67
Eq.Midcap Pension Fund 1,699 - 1 62
Equity Gain Fund 71,368 59,476 370 468
Equity Fund 30,346 37,932 157 315
Equity Growth Pension Fund 3,179 - - -
Equity Index Fund 15,709 - 176 157
Equity Index Pension Fund 1,316 - (7) 64
Equity Plus Fund 144,106 - 995 1,024
Equity Plus Pension Fund 12,219 - 67 67
Equity Index Pension Fund-2 508 - - -
Income Bond Fund 1,169 - - -
Life Long Gain Fund 748 935 - 50
Liquid Fund 235 - - -
Liquid Pension Fund 44 - - -
Nifty Index Fund 6,315 - - -
Premier Equity Growth Fund 12,391 - - -
Premier Balance fund - - - -
Premier Balancer Fund - - - -
Premier Debt Fund 5,239 - - 65
Premier Equity Fund 11,159 - - 67
Premier Equity Gain Fund 19,192 - - 67
Premier Income fund 1,232 - - -
Premier Nifty Index Fund 3,676 - - -
Pure Equity Fund 4,414 - - 67
Pure Stock Fund 855 - - -
Secure Fund 72 - - -
Stable Fund 1,479 - - 67
Total 467,649 131,988 1,923 3,384
Basis of Payment of Fees
Fund Management Charges % of NAV
Fund Administration Charges % of NAV / Fixed Amount
Fund Accounting Charges % of Asset Under Management
Custody Charges % of Market Value of Investment
80
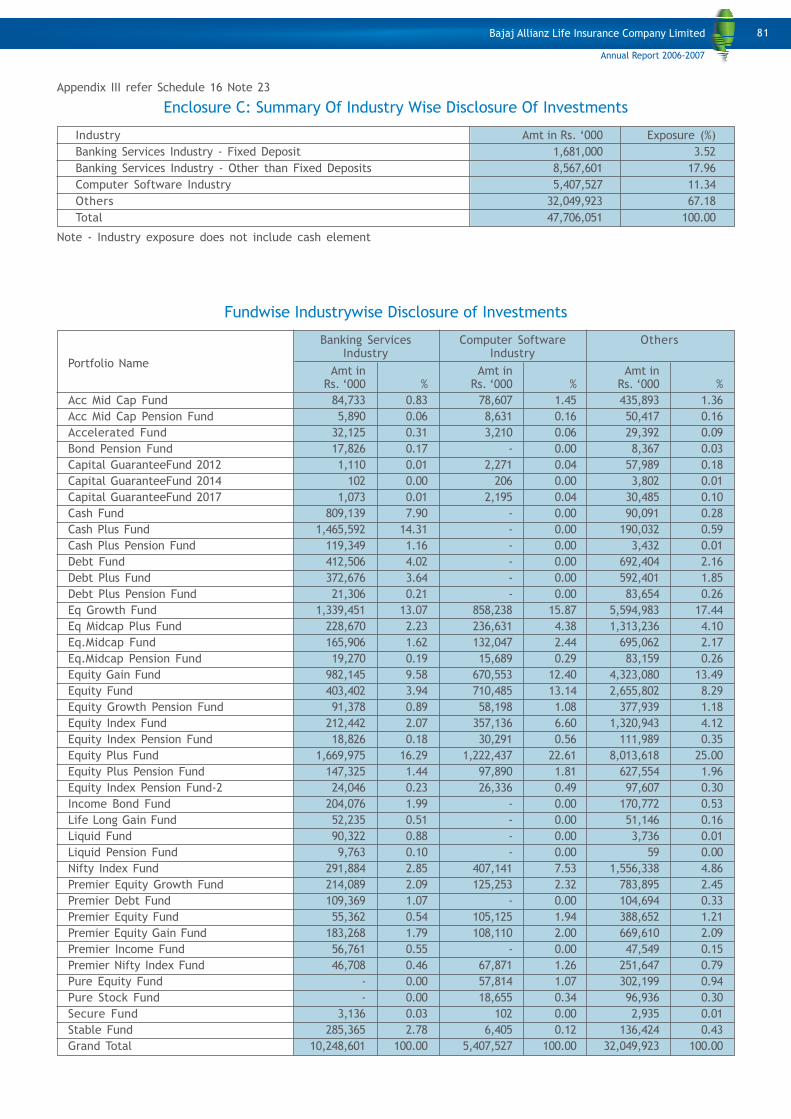
Appendix III refer Schedule 16 Note 23
Enclosure C: Summary Of Industry Wise Disclosure Of Investments
Industry Amt in Rs. ‘000 Exposure (%)
Banking Services Industry - Fixed Deposit 1,681,000 3.52
Banking Services Industry - Other than Fixed Deposits 8,567,601 17.96
Computer Software Industry 5,407,527 11.34
Others 32,049,923 67.18
Total 47,706,051 100.00
Note - Industry exposure does not include cash element
Fundwise Industrywise Disclosure of Investments
Banking Services Computer Software OthersIndustry Industry
Portfolio NameAmt in Amt in Amt in
Rs. ‘000 % Rs. ‘000 % Rs. ‘000 %
Acc Mid Cap Fund 84,733 0.83 78,607 1.45 435,893 1.36
Acc Mid Cap Pension Fund 5,890 0.06 8,631 0.16 50,417 0.16
Accelerated Fund 32,125 0.31 3,210 0.06 29,392 0.09
Bond Pension Fund 17,826 0.17 - 0.00 8,367 0.03
Capital GuaranteeFund 2012 1,110 0.01 2,271 0.04 57,989 0.18
Capital GuaranteeFund 2014 102 0.00 206 0.00 3,802 0.01
Capital GuaranteeFund 2017 1,073 0.01 2,195 0.04 30,485 0.10
Cash Fund 809,139 7.90 - 0.00 90,091 0.28
Cash Plus Fund 1,465,592 14.31 - 0.00 190,032 0.59
Cash Plus Pension Fund 119,349 1.16 - 0.00 3,432 0.01
Debt Fund 412,506 4.02 - 0.00 692,404 2.16
Debt Plus Fund 372,676 3.64 - 0.00 592,401 1.85
Debt Plus Pension Fund 21,306 0.21 - 0.00 83,654 0.26
Eq Growth Fund 1,339,451 13.07 858,238 15.87 5,594,983 17.44
Eq Midcap Plus Fund 228,670 2.23 236,631 4.38 1,313,236 4.10
Eq.Midcap Fund 165,906 1.62 132,047 2.44 695,062 2.17
Eq.Midcap Pension Fund 19,270 0.19 15,689 0.29 83,159 0.26
Equity Gain Fund 982,145 9.58 670,553 12.40 4,323,080 13.49
Equity Fund 403,402 3.94 710,485 13.14 2,655,802 8.29
Equity Growth Pension Fund 91,378 0.89 58,198 1.08 377,939 1.18
Equity Index Fund 212,442 2.07 357,136 6.60 1,320,943 4.12
Equity Index Pension Fund 18,826 0.18 30,291 0.56 111,989 0.35
Equity Plus Fund 1,669,975 16.29 1,222,437 22.61 8,013,618 25.00
Equity Plus Pension Fund 147,325 1.44 97,890 1.81 627,554 1.96
Equity Index Pension Fund-2 24,046 0.23 26,336 0.49 97,607 0.30
Income Bond Fund 204,076 1.99 - 0.00 170,772 0.53
Life Long Gain Fund 52,235 0.51 - 0.00 51,146 0.16
Liquid Fund 90,322 0.88 - 0.00 3,736 0.01
Liquid Pension Fund 9,763 0.10 - 0.00 59 0.00
Nifty Index Fund 291,884 2.85 407,141 7.53 1,556,338 4.86
Premier Equity Growth Fund 214,089 2.09 125,253 2.32 783,895 2.45
Premier Debt Fund 109,369 1.07 - 0.00 104,694 0.33
Premier Equity Fund 55,362 0.54 105,125 1.94 388,652 1.21
Premier Equity Gain Fund 183,268 1.79 108,110 2.00 669,610 2.09
Premier Income Fund 56,761 0.55 - 0.00 47,549 0.15
Premier Nifty Index Fund 46,708 0.46 67,871 1.26 251,647 0.79
Pure Equity Fund - 0.00 57,814 1.07 302,199 0.94
Pure Stock Fund - 0.00 18,655 0.34 96,936 0.30
Secure Fund 3,136 0.03 102 0.00 2,935 0.01
Stable Fund 285,365 2.78 6,405 0.12 136,424 0.43
Grand Total 10,248,601 100.00 5,407,527 100.00 32,049,923 100.00
81
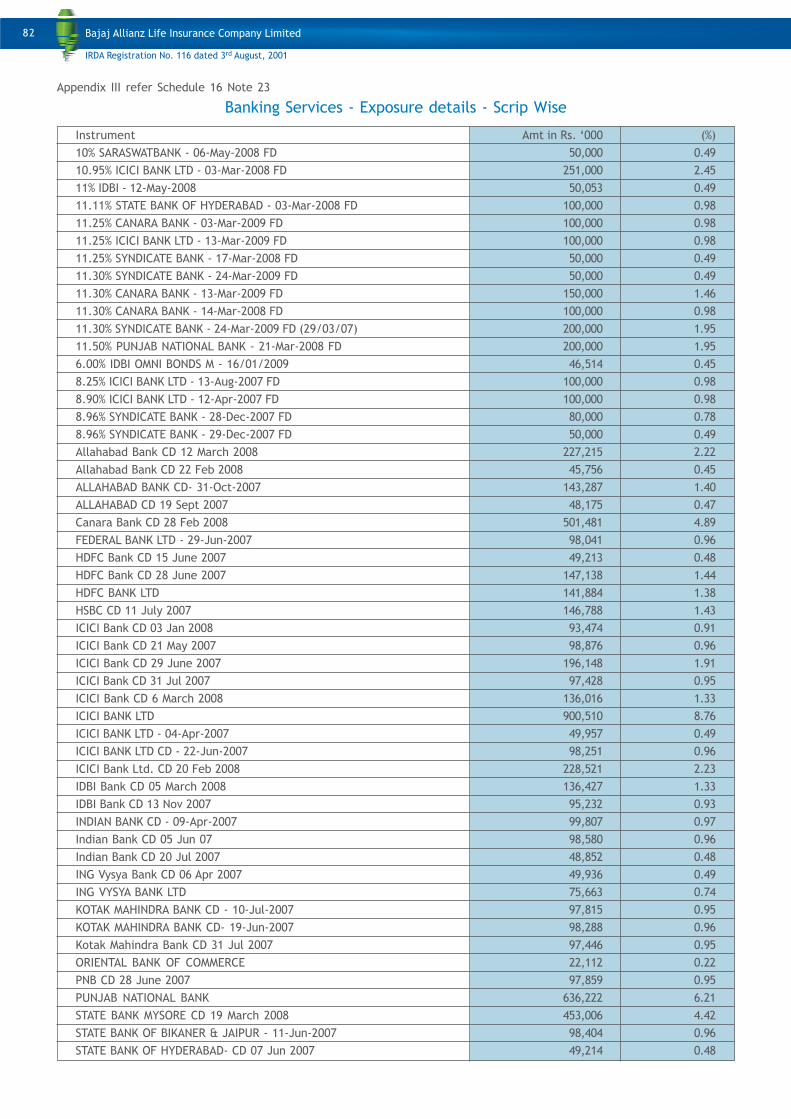
Appendix III refer Schedule 16 Note 23
Banking Services - Exposure details - Scrip Wise
Instrument Amt in Rs. ‘000 (%)
10% SARASWATBANK - 06-May-2008 FD 50,000 0.49
10.95% ICICI BANK LTD - 03-Mar-2008 FD 251,000 2.45
11% IDBI - 12-May-2008 50,053 0.49
11.11% STATE BANK OF HYDERABAD - 03-Mar-2008 FD 100,000 0.98
11.25% CANARA BANK - 03-Mar-2009 FD 100,000 0.98
11.25% ICICI BANK LTD - 13-Mar-2009 FD 100,000 0.98
11.25% SYNDICATE BANK - 17-Mar-2008 FD 50,000 0.49
11.30% SYNDICATE BANK - 24-Mar-2009 FD 50,000 0.49
11.30% CANARA BANK - 13-Mar-2009 FD 150,000 1.46
11.30% CANARA BANK - 14-Mar-2008 FD 100,000 0.98
11.30% SYNDICATE BANK - 24-Mar-2009 FD (29/03/07) 200,000 1.95
11.50% PUNJAB NATIONAL BANK - 21-Mar-2008 FD 200,000 1.95
6.00% IDBI OMNI BONDS M - 16/01/2009 46,514 0.45
8.25% ICICI BANK LTD - 13-Aug-2007 FD 100,000 0.98
8.90% ICICI BANK LTD - 12-Apr-2007 FD 100,000 0.98
8.96% SYNDICATE BANK - 28-Dec-2007 FD 80,000 0.78
8.96% SYNDICATE BANK - 29-Dec-2007 FD 50,000 0.49
Allahabad Bank CD 12 March 2008 227,215 2.22
Allahabad Bank CD 22 Feb 2008 45,756 0.45
ALLAHABAD BANK CD- 31-Oct-2007 143,287 1.40
ALLAHABAD CD 19 Sept 2007 48,175 0.47
Canara Bank CD 28 Feb 2008 501,481 4.89
FEDERAL BANK LTD - 29-Jun-2007 98,041 0.96
HDFC Bank CD 15 June 2007 49,213 0.48
HDFC Bank CD 28 June 2007 147,138 1.44
HDFC BANK LTD 141,884 1.38
HSBC CD 11 July 2007 146,788 1.43
ICICI Bank CD 03 Jan 2008 93,474 0.91
ICICI Bank CD 21 May 2007 98,876 0.96
ICICI Bank CD 29 June 2007 196,148 1.91
ICICI Bank CD 31 Jul 2007 97,428 0.95
ICICI Bank CD 6 March 2008 136,016 1.33
ICICI BANK LTD 900,510 8.76
ICICI BANK LTD - 04-Apr-2007 49,957 0.49
ICICI BANK LTD CD - 22-Jun-2007 98,251 0.96
ICICI Bank Ltd. CD 20 Feb 2008 228,521 2.23
IDBI Bank CD 05 March 2008 136,427 1.33
IDBI Bank CD 13 Nov 2007 95,232 0.93
INDIAN BANK CD - 09-Apr-2007 99,807 0.97
Indian Bank CD 05 Jun 07 98,580 0.96
Indian Bank CD 20 Jul 2007 48,852 0.48
ING Vysya Bank CD 06 Apr 2007 49,936 0.49
ING VYSYA BANK LTD 75,663 0.74
KOTAK MAHINDRA BANK CD - 10-Jul-2007 97,815 0.95
KOTAK MAHINDRA BANK CD- 19-Jun-2007 98,288 0.96
Kotak Mahindra Bank CD 31 Jul 2007 97,446 0.95
ORIENTAL BANK OF COMMERCE 22,112 0.22
PNB CD 28 June 2007 97,859 0.95
PUNJAB NATIONAL BANK 636,222 6.21
STATE BANK MYSORE CD 19 March 2008 453,006 4.42
STATE BANK OF BIKANER & JAIPUR - 11-Jun-2007 98,404 0.96
STATE BANK OF HYDERABAD- CD 07 Jun 2007 49,214 0.48
82
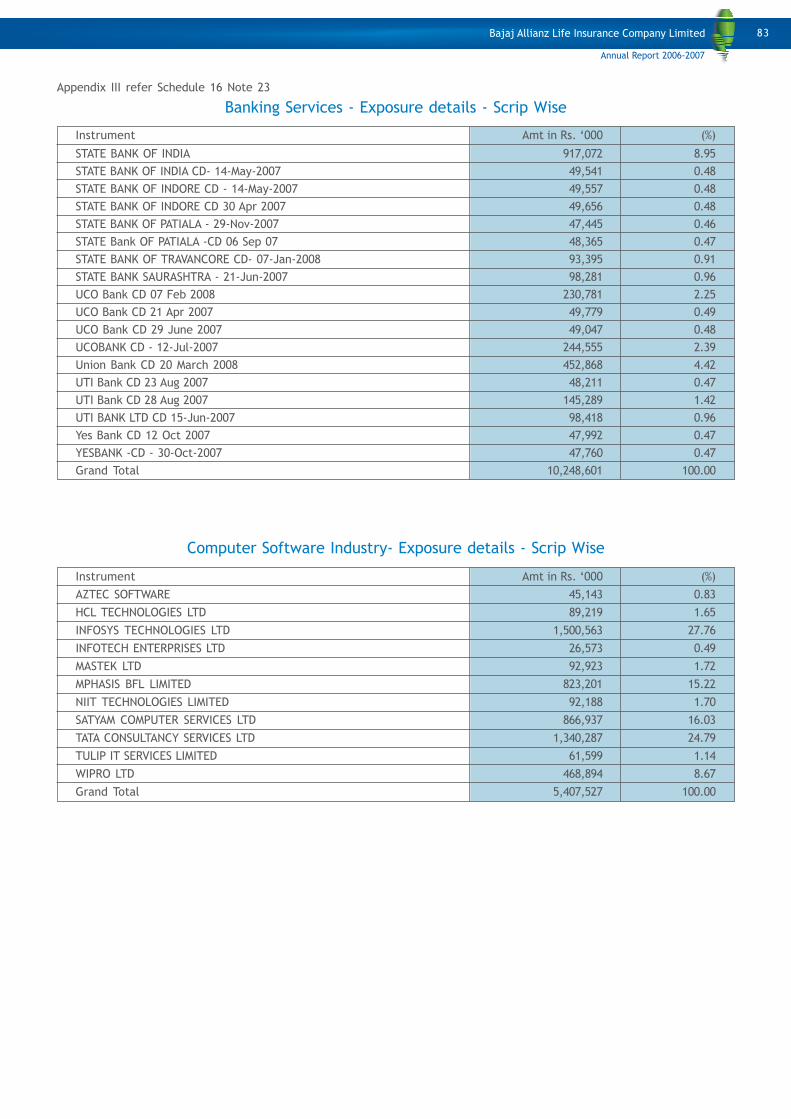
STATE BANK OF INDIA 917,072 8.95
STATE BANK OF INDIA CD- 14-May-2007 49,541 0.48
STATE BANK OF INDORE CD - 14-May-2007 49,557 0.48
STATE BANK OF INDORE CD 30 Apr 2007 49,656 0.48
STATE BANK OF PATIALA - 29-Nov-2007 47,445 0.46
STATE Bank OF PATIALA -CD 06 Sep 07 48,365 0.47
STATE BANK OF TRAVANCORE CD- 07-Jan-2008 93,395 0.91
STATE BANK SAURASHTRA - 21-Jun-2007 98,281 0.96
UCO Bank CD 07 Feb 2008 230,781 2.25
UCO Bank CD 21 Apr 2007 49,779 0.49
UCO Bank CD 29 June 2007 49,047 0.48
UCOBANK CD - 12-Jul-2007 244,555 2.39
Union Bank CD 20 March 2008 452,868 4.42
UTI Bank CD 23 Aug 2007 48,211 0.47
UTI Bank CD 28 Aug 2007 145,289 1.42
UTI BANK LTD CD 15-Jun-2007 98,418 0.96
Yes Bank CD 12 Oct 2007 47,992 0.47
YESBANK -CD - 30-Oct-2007 47,760 0.47
Grand Total 10,248,601 100.00
Computer Software Industry- Exposure details - Scrip Wise
Instrument Amt in Rs. ‘000 (%)
AZTEC SOFTWARE 45,143 0.83
HCL TECHNOLOGIES LTD 89,219 1.65
INFOSYS TECHNOLOGIES LTD 1,500,563 27.76
INFOTECH ENTERPRISES LTD 26,573 0.49
MASTEK LTD 92,923 1.72
MPHASIS BFL LIMITED 823,201 15.22
NIIT TECHNOLOGIES LIMITED 92,188 1.70
SATYAM COMPUTER SERVICES LTD 866,937 16.03
TATA CONSULTANCY SERVICES LTD 1,340,287 24.79
TULIP IT SERVICES LIMITED 61,599 1.14
WIPRO LTD 468,894 8.67
Grand Total 5,407,527 100.00
Appendix III refer Schedule 16 Note 23
Banking Services - Exposure details - Scrip Wise
Instrument Amt in Rs. ‘000 (%)
83
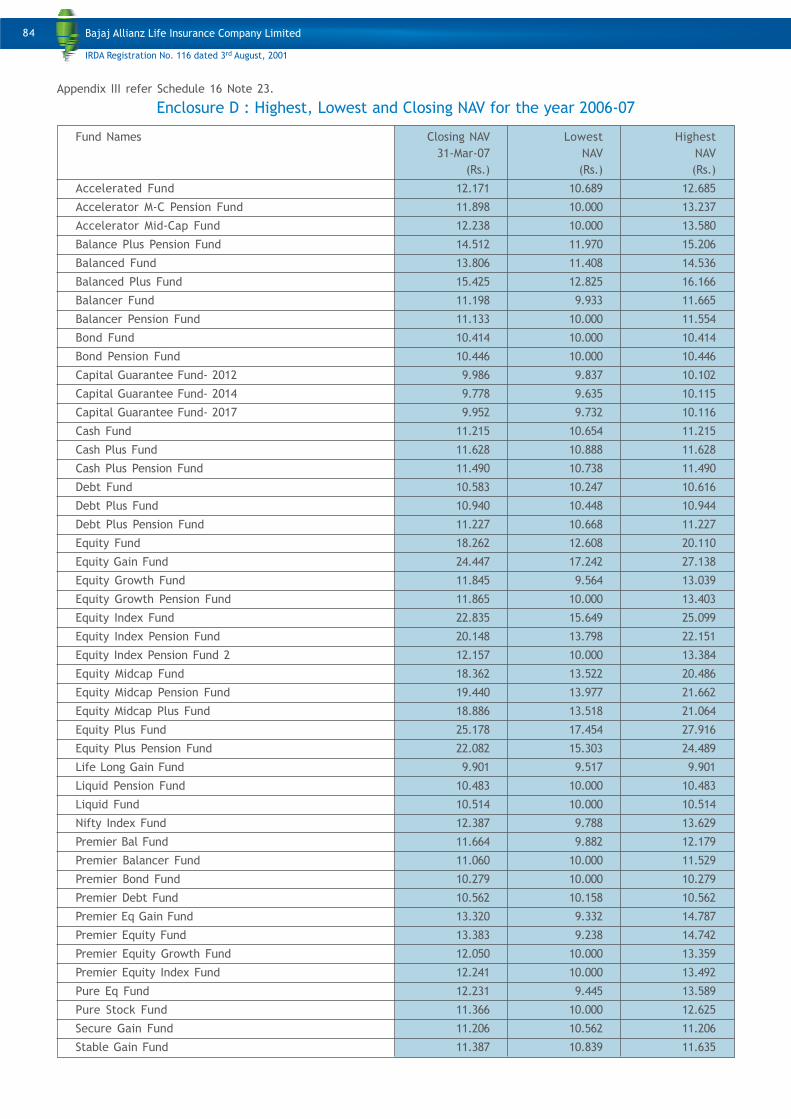
Appendix III refer Schedule 16 Note 23.
Enclosure D : Highest, Lowest and Closing NAV for the year 2006-07
Fund Names Closing NAV Lowest Highest
31-Mar-07 NAV NAV
(Rs.) (Rs.) (Rs.)
Accelerated Fund 12.171 10.689 12.685
Accelerator M-C Pension Fund 11.898 10.000 13.237
Accelerator Mid-Cap Fund 12.238 10.000 13.580
Balance Plus Pension Fund 14.512 11.970 15.206
Balanced Fund 13.806 11.408 14.536
Balanced Plus Fund 15.425 12.825 16.166
Balancer Fund 11.198 9.933 11.665
Balancer Pension Fund 11.133 10.000 11.554
Bond Fund 10.414 10.000 10.414
Bond Pension Fund 10.446 10.000 10.446
Capital Guarantee Fund- 2012 9.986 9.837 10.102
Capital Guarantee Fund- 2014 9.778 9.635 10.115
Capital Guarantee Fund- 2017 9.952 9.732 10.116
Cash Fund 11.215 10.654 11.215
Cash Plus Fund 11.628 10.888 11.628
Cash Plus Pension Fund 11.490 10.738 11.490
Debt Fund 10.583 10.247 10.616
Debt Plus Fund 10.940 10.448 10.944
Debt Plus Pension Fund 11.227 10.668 11.227
Equity Fund 18.262 12.608 20.110
Equity Gain Fund 24.447 17.242 27.138
Equity Growth Fund 11.845 9.564 13.039
Equity Growth Pension Fund 11.865 10.000 13.403
Equity Index Fund 22.835 15.649 25.099
Equity Index Pension Fund 20.148 13.798 22.151
Equity Index Pension Fund 2 12.157 10.000 13.384
Equity Midcap Fund 18.362 13.522 20.486
Equity Midcap Pension Fund 19.440 13.977 21.662
Equity Midcap Plus Fund 18.886 13.518 21.064
Equity Plus Fund 25.178 17.454 27.916
Equity Plus Pension Fund 22.082 15.303 24.489
Life Long Gain Fund 9.901 9.517 9.901
Liquid Pension Fund 10.483 10.000 10.483
Liquid Fund 10.514 10.000 10.514
Nifty Index Fund 12.387 9.788 13.629
Premier Bal Fund 11.664 9.882 12.179
Premier Balancer Fund 11.060 10.000 11.529
Premier Bond Fund 10.279 10.000 10.279
Premier Debt Fund 10.562 10.158 10.562
Premier Eq Gain Fund 13.320 9.332 14.787
Premier Equity Fund 13.383 9.238 14.742
Premier Equity Growth Fund 12.050 10.000 13.359
Premier Equity Index Fund 12.241 10.000 13.492
Pure Eq Fund 12.231 9.445 13.589
Pure Stock Fund 11.366 10.000 12.625
Secure Gain Fund 11.206 10.562 11.206
Stable Gain Fund 11.387 10.839 11.635
84
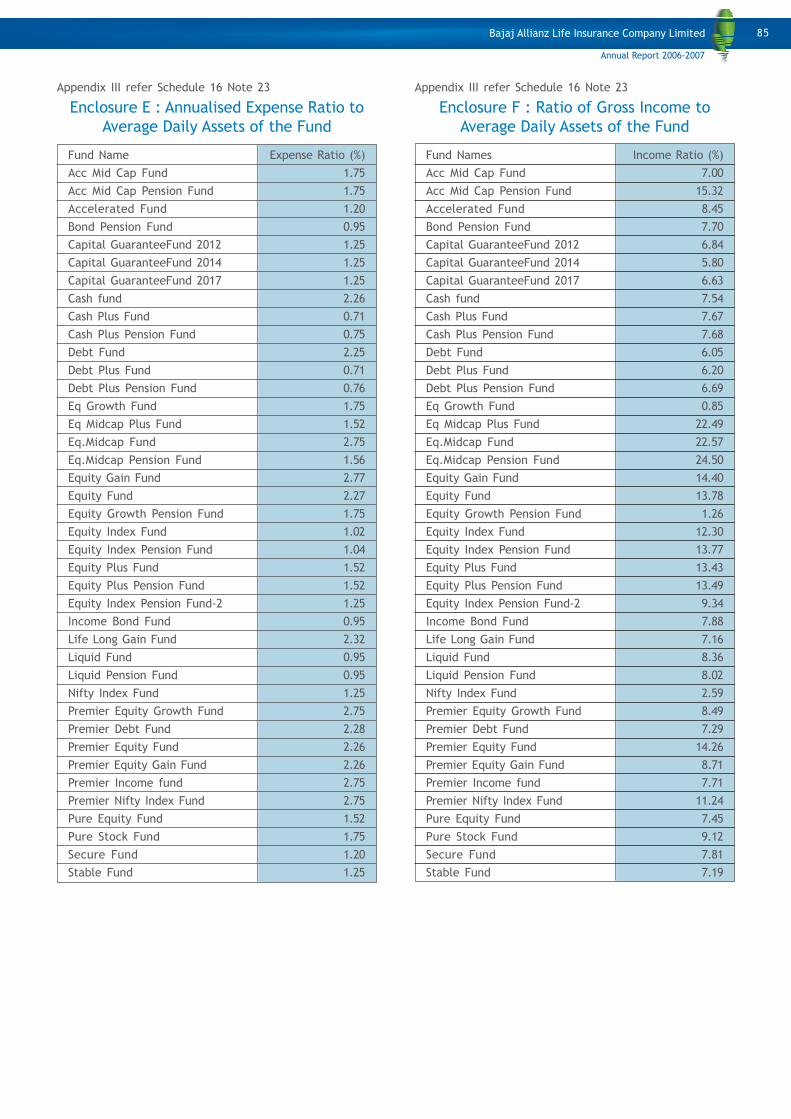
Appendix III refer Schedule 16 Note 23
Enclosure F : Ratio of Gross Income to
Average Daily Assets of the Fund
Fund Names Income Ratio (%)
Acc Mid Cap Fund 7.00
Acc Mid Cap Pension Fund 15.32
Accelerated Fund 8.45
Bond Pension Fund 7.70
Capital GuaranteeFund 2012 6.84
Capital GuaranteeFund 2014 5.80
Capital GuaranteeFund 2017 6.63
Cash fund 7.54
Cash Plus Fund 7.67
Cash Plus Pension Fund 7.68
Debt Fund 6.05
Debt Plus Fund 6.20
Debt Plus Pension Fund 6.69
Eq Growth Fund 0.85
Eq Midcap Plus Fund 22.49
Eq.Midcap Fund 22.57
Eq.Midcap Pension Fund 24.50
Equity Gain Fund 14.40
Equity Fund 13.78
Equity Growth Pension Fund 1.26
Equity Index Fund 12.30
Equity Index Pension Fund 13.77
Equity Plus Fund 13.43
Equity Plus Pension Fund 13.49
Equity Index Pension Fund-2 9.34
Income Bond Fund 7.88
Life Long Gain Fund 7.16
Liquid Fund 8.36
Liquid Pension Fund 8.02
Nifty Index Fund 2.59
Premier Equity Growth Fund 8.49
Premier Debt Fund 7.29
Premier Equity Fund 14.26
Premier Equity Gain Fund 8.71
Premier Income fund 7.71
Premier Nifty Index Fund 11.24
Pure Equity Fund 7.45
Pure Stock Fund 9.12
Secure Fund 7.81
Stable Fund 7.19
Appendix III refer Schedule 16 Note 23
Enclosure E : Annualised Expense Ratio to
Average Daily Assets of the Fund
Fund Name Expense Ratio (%)
Acc Mid Cap Fund 1.75
Acc Mid Cap Pension Fund 1.75
Accelerated Fund 1.20
Bond Pension Fund 0.95
Capital GuaranteeFund 2012 1.25
Capital GuaranteeFund 2014 1.25
Capital GuaranteeFund 2017 1.25
Cash fund 2.26
Cash Plus Fund 0.71
Cash Plus Pension Fund 0.75
Debt Fund 2.25
Debt Plus Fund 0.71
Debt Plus Pension Fund 0.76
Eq Growth Fund 1.75
Eq Midcap Plus Fund 1.52
Eq.Midcap Fund 2.75
Eq.Midcap Pension Fund 1.56
Equity Gain Fund 2.77
Equity Fund 2.27
Equity Growth Pension Fund 1.75
Equity Index Fund 1.02
Equity Index Pension Fund 1.04
Equity Plus Fund 1.52
Equity Plus Pension Fund 1.52
Equity Index Pension Fund-2 1.25
Income Bond Fund 0.95
Life Long Gain Fund 2.32
Liquid Fund 0.95
Liquid Pension Fund 0.95
Nifty Index Fund 1.25
Premier Equity Growth Fund 2.75
Premier Debt Fund 2.28
Premier Equity Fund 2.26
Premier Equity Gain Fund 2.26
Premier Income fund 2.75
Premier Nifty Index Fund 2.75
Pure Equity Fund 1.52
Pure Stock Fund 1.75
Secure Fund 1.20
Stable Fund 1.25
85
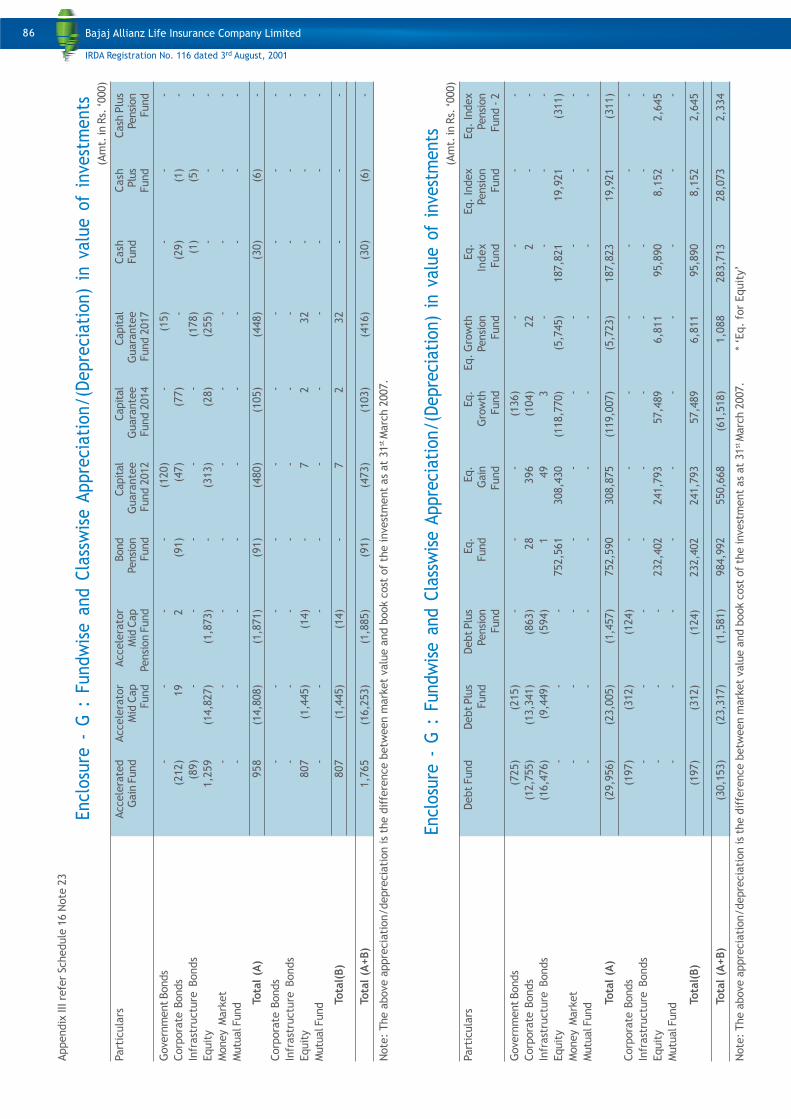
Appendix
III r
efe
r Sc
hedule
16 N
ote
23
Encl
osu
re -
G :
Fundw
ise a
nd C
lass
wis
e A
ppre
ciati
on/(D
epre
ciati
on)
in v
alu
e o
f in
vest
ments
(Am
t. in R
s. ‘000)
Part
icula
rsAccele
rate
dAccele
rato
rAccele
rato
rBond
Capit
al
Capit
al
Capit
al
Cash
Cash
Cash
Plu
sG
ain
Fund
Mid
Cap
Mid
Cap
Pensi
on
Guara
nte
e G
uara
nte
e G
uara
nte
eFund
Plu
sPensi
on
Fund
Pensi
on F
und
Fund
Fund 2
012
Fund 2
014
Fund 2
017
Fund
Fund
Gove
rnm
ent Bonds
--
--
(120)
-(1
5)
--
-
Corp
ora
te B
onds
(212)
19
2(9
1)
(47)
(77)
-(2
9)
(1)
-
Infr
ast
ructu
re B
onds
(89)
--
--
-(1
78)
(1)
(5)
-
Equit
y1,2
59
(14,8
27)
(1,8
73)
-(3
13)
(28)
(255)
--
-
Money M
ark
et
--
--
--
--
--
Mutu
al F
und
--
--
--
--
--
Tota
l (A
)958
(14,8
08)
(1,8
71)
(91)
(480)
(105)
(448)
(30)
(6)
-
Corp
ora
te B
onds
--
--
--
--
--
Infr
ast
ructu
re B
onds
--
--
--
--
--
Equit
y807
(1,4
45)
(14)
-7
232
--
-
Mutu
al F
und
--
--
--
--
--
Tota
l(B)
807
(1,4
45)
(14)
-7
232
--
-
Tota
l (A
+B)
1,7
65
(16,2
53)
(1,8
85)
(91)
(473)
(103)
(416)
(30)
(6)
-
Note
: The a
bove a
ppre
cia
tion/depre
cia
tion is
the d
iffe
rence b
etw
een m
ark
et
valu
e a
nd b
ook c
ost
of
the invest
ment
as
at
31
st M
arc
h 2
007.
Encl
osu
re -
G :
Fundw
ise a
nd C
lass
wis
e A
ppre
ciat
ion/(
Depre
ciat
ion)
in v
alue o
f in
vest
ments
(Am
t. in R
s. ‘000)
Part
icula
rsDebt
Fund
Debt Plu
sDebt Plu
sEq.
Eq.
Eq.
Eq. G
row
thEq.
Eq.
Index
Eq.
Index
Fund
Pensi
on
Fund
Gain
Gro
wth
Pensi
on
Index
Pensi
on
Pensi
on
Fund
Fund
Fund
Fund
Fund
Fund
Fund - 2
Gove
rnm
ent Bonds
(725)
(215)
--
-(1
36)
--
--
Corp
ora
te B
onds
(12,7
55)
(13,3
41)
(863)
28
396
(104)
22
2-
-
Infr
ast
ructu
re B
onds
(16,4
76)
(9,4
49)
(594)
149
3-
--
-
Equit
y-
--
752,5
61
308,4
30
(118,7
70)
(5,7
45)
187,8
21
19,9
21
(311)
Money M
ark
et
--
--
--
--
--
Mutu
al F
und
--
--
--
--
--
Tota
l (A
)(2
9,9
56)
(23,0
05)
(1,4
57)
752,5
90
308,8
75
(119,0
07)
(5,7
23)
187,8
23
19,9
21
(311)
Corp
ora
te B
onds
(197)
(312)
(124)
--
--
--
-
Infr
ast
ructu
re B
onds
--
--
--
--
--
Equit
y-
--
232,4
02
241,7
93
57,4
89
6,8
11
95,8
90
8,1
52
2,6
45
Mutu
al F
und
--
--
--
--
--
Tota
l(B)
(197)
(312)
(124)
232,4
02
241,7
93
57,4
89
6,8
11
95,8
90
8,1
52
2,6
45
Tota
l (A
+B)
(30,1
53)
(23,3
17)
(1,5
81)
984,9
92
550,6
68
(61,5
18)
1,0
88
283,7
13
28,0
73
2,3
34
Note
: The a
bove a
ppre
cia
tion/depre
cia
tion is
the d
iffe
rence b
etw
een m
ark
et
valu
e a
nd b
ook c
ost
of
the invest
ment
as
at
31
st M
arc
h 2
007.
*
‘Eq.
for
Equit
y’
86
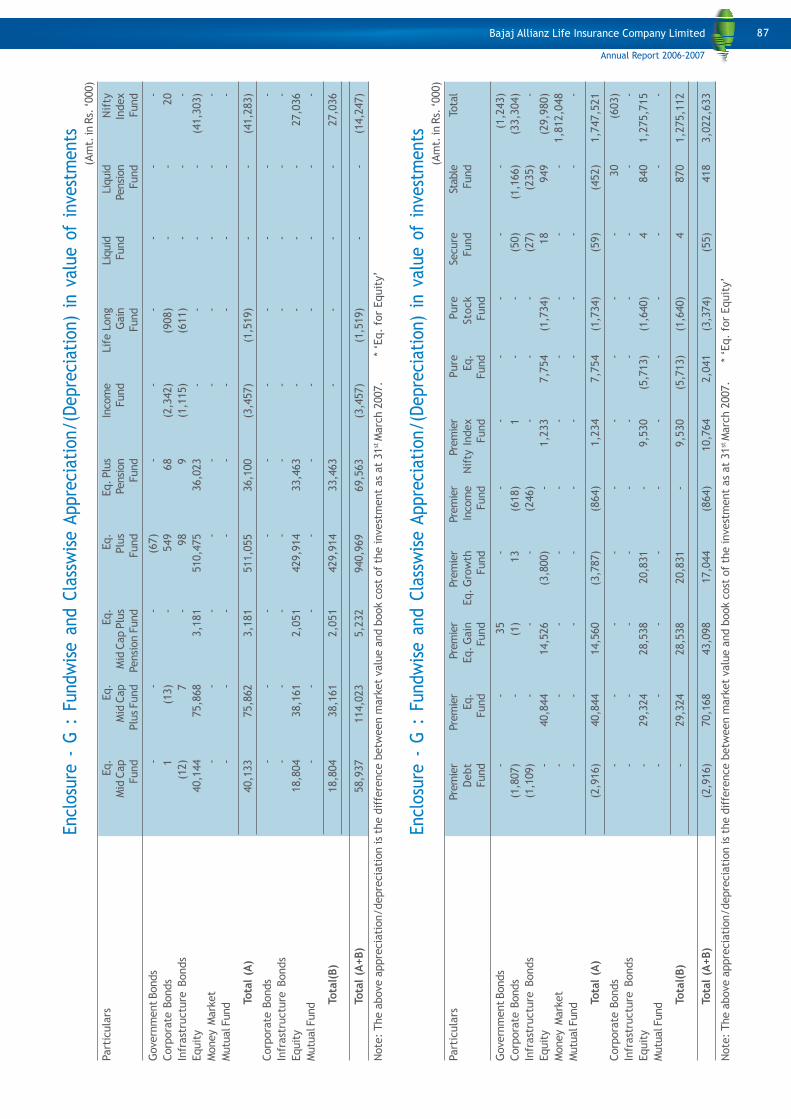
Encl
osu
re -
G :
Fundw
ise a
nd C
lass
wis
e A
ppre
ciat
ion/(
Depre
ciat
ion)
in v
alue o
f in
vest
ments
(Am
t. in R
s. ‘000)
Part
icula
rsEq.
Eq.
Eq.
Eq.
Eq. Plu
sIn
com
eLif
e L
ong
Liquid
Liquid
Nif
ty
Mid
Cap
Mid
Cap
Mid
Cap P
lus
Plu
sPensi
on
Fund
Gain
Fund
Pensi
on
Index
Fund
Plu
s Fund
Pensi
on F
und
Fund
Fund
Fund
Fund
Fund
Gove
rnm
ent Bonds
--
-(6
7)
--
--
--
Corp
ora
te B
onds
1(1
3)
-549
68
(2,3
42)
(908)
--
20
Infr
ast
ructu
re B
onds
(12)
7-
98
9(1
,115)
(611)
--
-
Equit
y40,1
44
75,8
68
3,1
81
510,4
75
36,0
23
--
--
(41,3
03)
Money M
ark
et
--
--
--
--
--
Mutu
al F
und
--
--
--
--
--
Tota
l (A
)40,1
33
75,8
62
3,1
81
511,0
55
36,1
00
(3,4
57)
(1,5
19)
--
(41,2
83)
Corp
ora
te B
onds
--
--
--
--
--
Infr
ast
ructu
re B
onds
--
--
--
--
--
Equit
y18,8
04
38,1
61
2,0
51
429,9
14
33,4
63
--
--
27,0
36
Mutu
al F
und
--
--
--
--
--
Tota
l(B)
18,8
04
38,1
61
2,0
51
429,9
14
33,4
63
--
--
27,0
36
Tota
l (A
+B)
58,9
37
114,0
23
5,2
32
940,9
69
69,5
63
(3,4
57)
(1,5
19)
--
(14,2
47)
Note
: The a
bove a
ppre
cia
tion/depre
cia
tion is
the d
iffe
rence b
etw
een m
ark
et
valu
e a
nd b
ook c
ost
of
the invest
ment
as
at
31
st M
arc
h 2
007.
*
‘Eq.
for
Equit
y’
Encl
osu
re -
G :
Fundw
ise a
nd C
lass
wis
e A
ppre
ciat
ion/(
Depre
ciat
ion)
in v
alue o
f in
vest
ments
(Am
t. in R
s. ‘000)
Part
icula
rsPre
mie
rPre
mie
rPre
mie
rPre
mie
rPre
mie
rPre
mie
rPure
Pure
Secure
Stable
Tota
l
Debt
Eq.
Eq. G
ain
Eq. G
row
thIn
com
eN
ifty
Index
Eq.
Sto
ck
Fund
Fund
Fund
Fund
Fund
Fund
Fund
Fund
Fund
Fund
Gove
rnm
ent Bonds
--
35
--
--
--
-(1
,243)
Corp
ora
te B
onds
(1,8
07)
-(1
)13
(618)
1-
-(5
0)
(1,1
66)
(33,3
04)
Infr
ast
ructu
re B
onds
(1,1
09)
--
-(2
46)
--
-(2
7)
(235)
-
Equit
y-
40,8
44
14,5
26
(3,8
00)
-1,2
33
7,7
54
(1,7
34)
18
949
(29,9
80)
Money M
ark
et
--
--
--
--
--
1,8
12,0
48
Mutu
al F
und
--
--
--
--
--
-
Tota
l (A
)(2
,916)
40,8
44
14,5
60
(3,7
87)
(864)
1,2
34
7,7
54
(1,7
34)
(59)
(452)
1,7
47,5
21
Corp
ora
te B
onds
--
--
--
--
-30
(603)
Infr
ast
ructu
re B
onds
--
--
--
--
--
-
Equit
y-
29,3
24
28,5
38
20,8
31
-9,5
30
(5,7
13)
(1,6
40)
4840
1,2
75,7
15
Mutu
al F
und
--
--
--
--
--
-
Tota
l(B)
-29,3
24
28,5
38
20,8
31
-9,5
30
(5,7
13)
(1,6
40)
4870
1,2
75,1
12
Tota
l (A
+B)
(2,9
16)
70,1
68
43,0
98
17,0
44
(864)
10,7
64
2,0
41
(3,3
74)
(55)
418
3,0
22,6
33
Note
: The a
bove a
ppre
cia
tion/depre
cia
tion is
the d
iffe
rence b
etw
een m
ark
et
valu
e a
nd b
ook c
ost
of
the invest
ment
as
at
31
st M
arc
h 2
007.
*
‘Eq.
for
Equit
y’
87
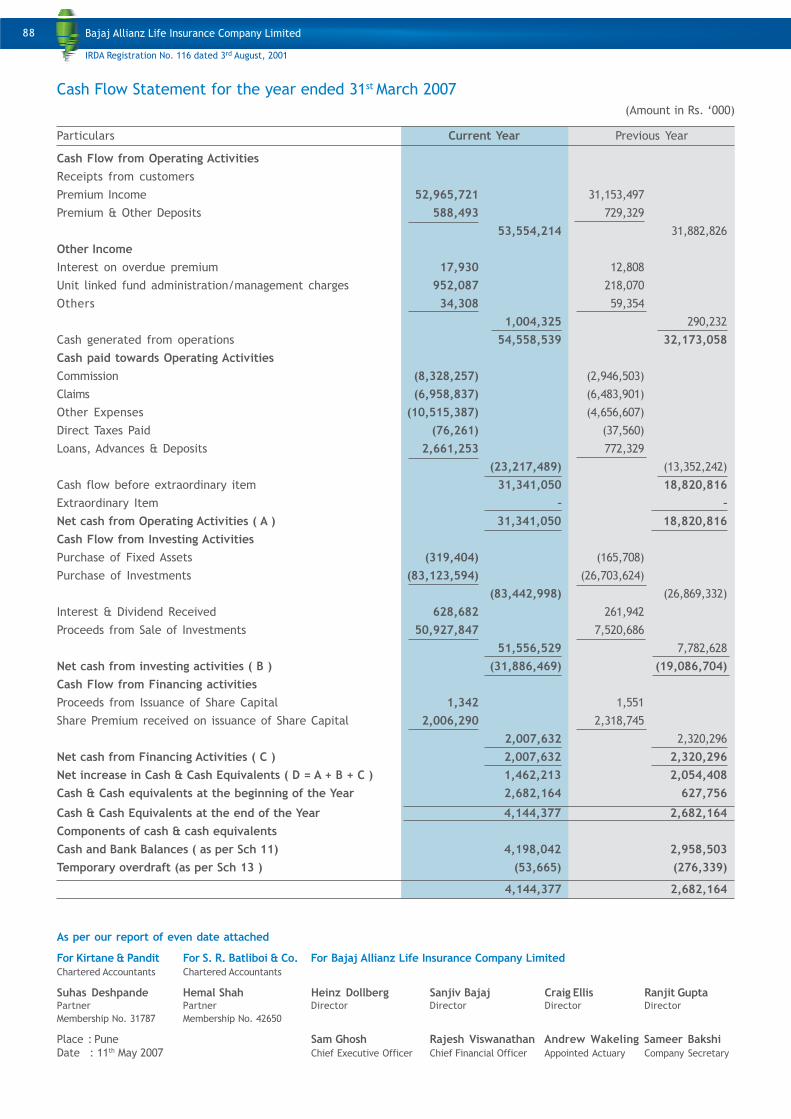
Cash Flow Statement for the year ended 31st March 2007
(Amount in Rs. ‘000)
Particulars Current Year Previous Year
Cash Flow from Operating Activities
Receipts from customers
Premium Income 52,965,721 31,153,497
Premium & Other Deposits 588,493 729,329
53,554,214 31,882,826
Other Income
Interest on overdue premium 17,930 12,808
Unit linked fund administration/management charges 952,087 218,070
Others 34,308 59,354
1,004,325 290,232
Cash generated from operations 54,558,539 32,173,058
Cash paid towards Operating Activities
Commission (8,328,257) (2,946,503)
Claims (6,958,837) (6,483,901)
Other Expenses (10,515,387) (4,656,607)
Direct Taxes Paid (76,261) (37,560)
Loans, Advances & Deposits 2,661,253 772,329
(23,217,489) (13,352,242)
Cash flow before extraordinary item 31,341,050 18,820,816
Extraordinary Item – –
Net cash from Operating Activities ( A ) 31,341,050 18,820,816
Cash Flow from Investing Activities
Purchase of Fixed Assets (319,404) (165,708)
Purchase of Investments (83,123,594) (26,703,624)
(83,442,998) (26,869,332)
Interest & Dividend Received 628,682 261,942
Proceeds from Sale of Investments 50,927,847 7,520,686
51,556,529 7,782,628
Net cash from investing activities ( B ) (31,886,469) (19,086,704)
Cash Flow from Financing activities
Proceeds from Issuance of Share Capital 1,342 1,551
Share Premium received on issuance of Share Capital 2,006,290 2,318,745
2,007,632 2,320,296
Net cash from Financing Activities ( C ) 2,007,632 2,320,296
Net increase in Cash & Cash Equivalents ( D = A + B + C ) 1,462,213 2,054,408
Cash & Cash equivalents at the beginning of the Year 2,682,164 627,756
Cash & Cash Equivalents at the end of the Year 4,144,377 2,682,164
Components of cash & cash equivalents
Cash and Bank Balances ( as per Sch 11) 4,198,042 2,958,503
Temporary overdraft (as per Sch 13 ) (53,665) (276,339)
4,144,377 2,682,164
As per our report of even date attached
For Kirtane & Pandit For S. R. Batliboi & Co. For Bajaj Allianz Life Insurance Company LimitedChartered Accountants Chartered Accountants
Suhas Deshpande Hemal Shah Heinz Dollberg Sanjiv Bajaj Craig Ellis Ranjit GuptaPartner Partner Director Director Director Director
Membership No. 31787 Membership No. 42650
Place : Pune Sam Ghosh Rajesh Viswanathan Andrew Wakeling Sameer BakshiDate : 11th May 2007 Chief Executive Officer Chief Financial Officer Appointed Actuary Company Secretary
88
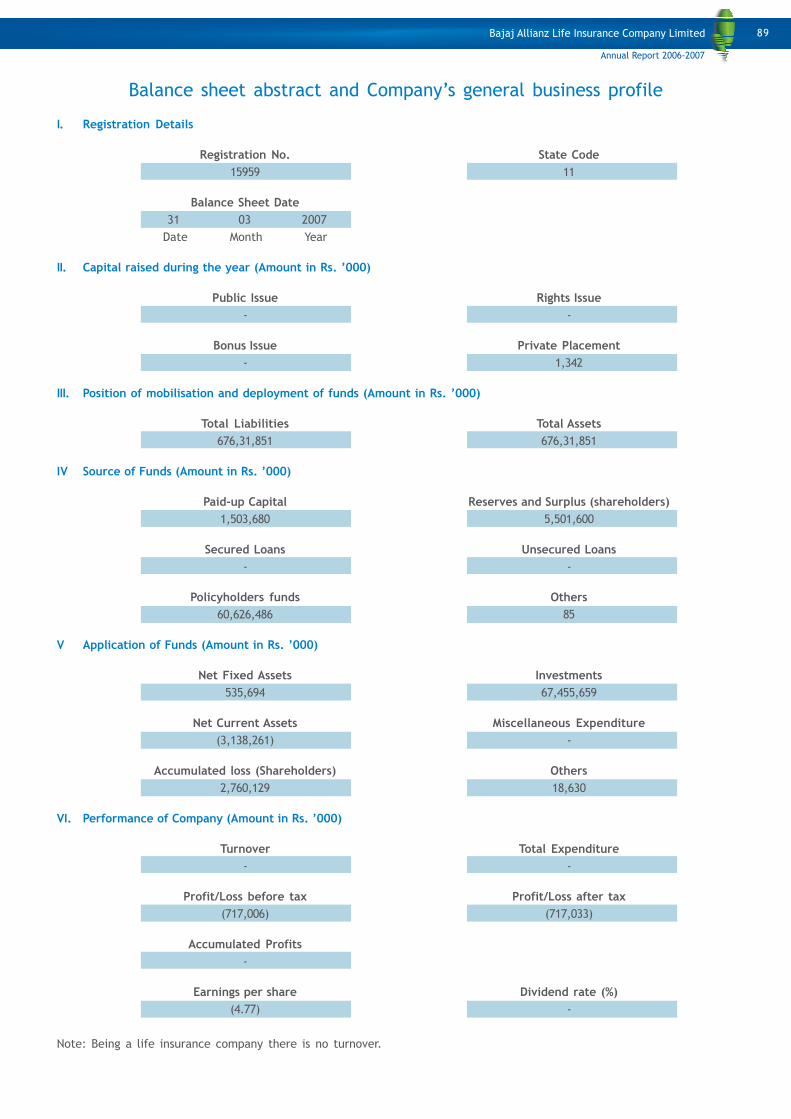
Balance sheet abstract and Company’s general business profile
I. Registration Details
Registration No. State Code
15959 11
Balance Sheet Date
31 03 2007
Date Month Year
II. Capital raised during the year (Amount in Rs. ’000)
Public Issue Rights Issue
- -
Bonus Issue Private Placement
- 1,342
III. Position of mobilisation and deployment of funds (Amount in Rs. ’000)
Total Liabilities Total Assets
676,31,851 676,31,851
IV Source of Funds (Amount in Rs. ’000)
Paid-up Capital Reserves and Surplus (shareholders)
1,503,680 5,501,600
Secured Loans Unsecured Loans
- -
Policyholders funds Others
60,626,486 85
V Application of Funds (Amount in Rs. ’000)
Net Fixed Assets Investments
535,694 67,455,659
Net Current Assets Miscellaneous Expenditure
(3,138,261) -
Accumulated loss (Shareholders) Others
2,760,129 18,630
VI. Performance of Company (Amount in Rs. ’000)
Turnover Total Expenditure
- -
Profit/Loss before tax Profit/Loss after tax
(717,006) (717,033)
Accumulated Profits
-
Earnings per share Dividend rate (%)
(4.77) -
Note: Being a life insurance company there is no turnover.
89
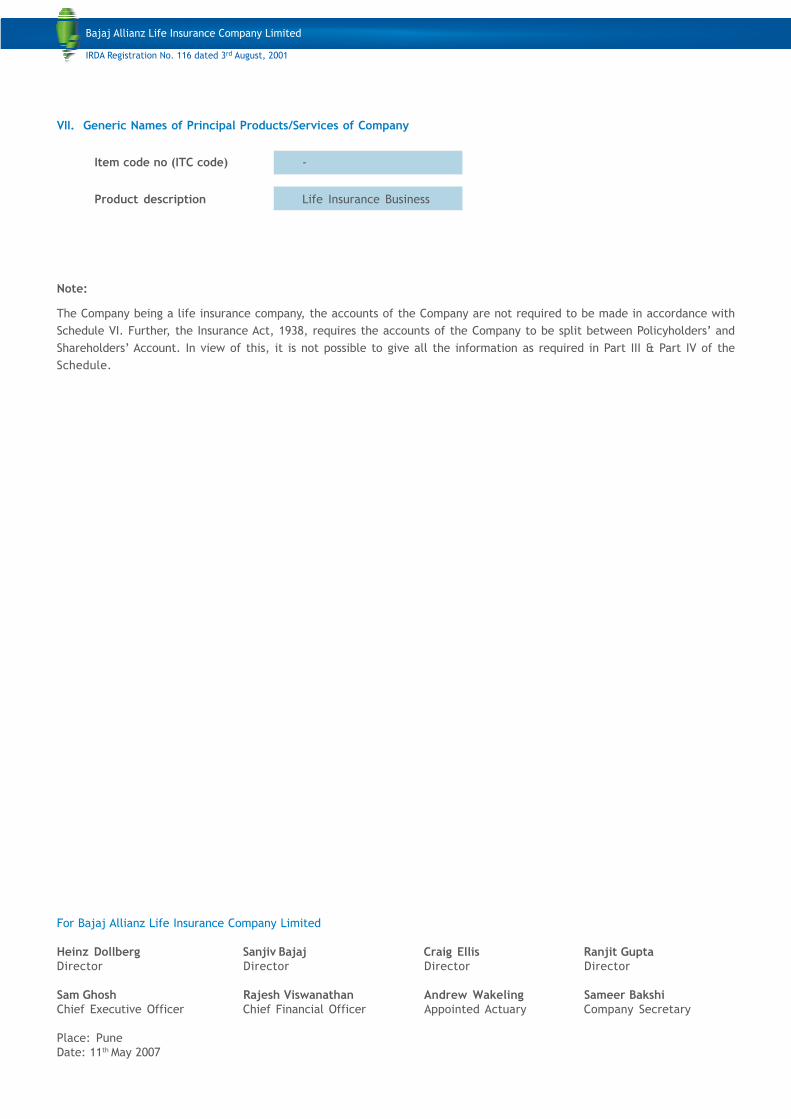
VII. Generic Names of Principal Products/Services of Company
Item code no (ITC code) -
Product description Life Insurance Business
Note:
The Company being a life insurance company, the accounts of the Company are not required to be made in accordance with
Schedule VI. Further, the Insurance Act, 1938, requires the accounts of the Company to be split between Policyholders’ and
Shareholders’ Account. In view of this, it is not possible to give all the information as required in Part III & Part IV of the
Schedule.
For Bajaj Allianz Life Insurance Company Limited
Heinz Dollberg Sanjiv Bajaj Craig Ellis Ranjit GuptaDirector Director Director Director
Sam Ghosh Rajesh Viswanathan Andrew Wakeling Sameer BakshiChief Executive Officer Chief Financial Officer Appointed Actuary Company Secretary
Place: Pune
Date: 11th
May 2007
90

Notes