Embed Size (px)
Citation preview
Balance of Payments Accounting
The Balance of Payments is the statistical record of a country’s international transactions over a certain period of time presented in the form of double-entry bookkeeping.
N.B. when we say “a country’s balance of payments” we are referring to the transactions of its citizens and government.
Balance of Payments Example
Suppose that Maplewood Bicycle in Maplewood, Missouri, USA imports $100,000 worth of bicycle frames from Mercian Bicycles in Darby England.
There will exist a $100,000 credit recorded by Mercian that offsets a $100,000 debit at Maplewood’s bank account.
This will lead to a rise in the supply of dollars and the demand for British pounds.
The balance of payments accounts are those that record all transactions between the residents of a country and residents of all foreign nations.
They are composed of the following:– The Current Account– The Capital Account– The Official Reserves Account– Statistical Discrepancy
Balance of Payments Accounts
The Current Account
Includes all imports and exports of goods and services (invisible trade).
Includes unilateral transfers of foreign aid. If the debits exceed the credits, then a country is
running a trade deficit. If the credits exceed the debits, then a country is
running a trade surplus. It is thought that the CA responds to changes in
income and the exchange rate.
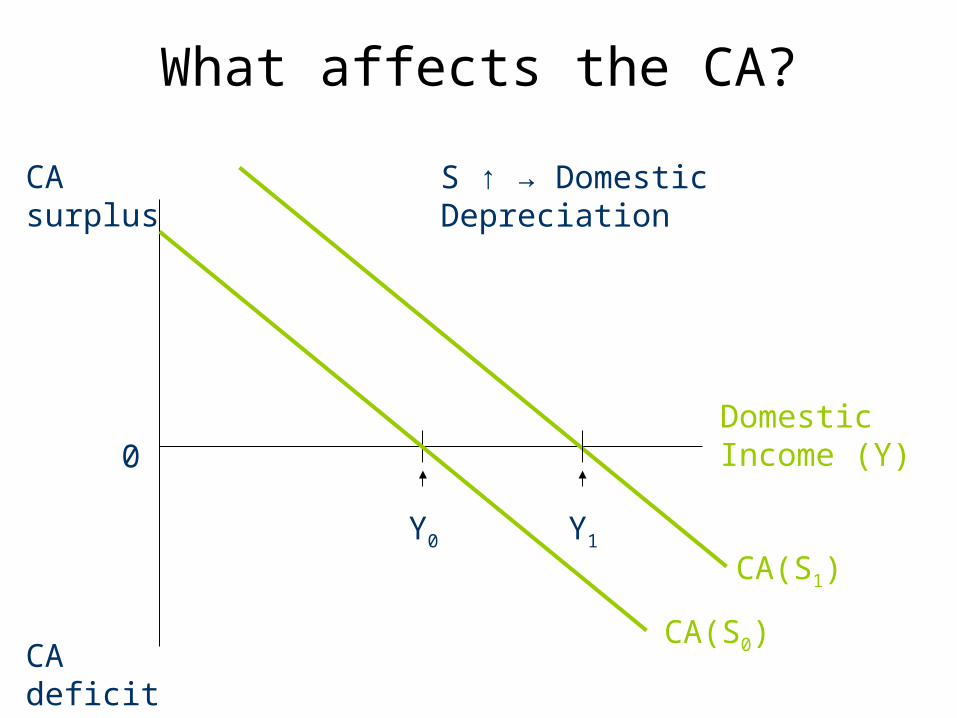
What affects the CA?
CA deficit
0
CA(S0)
CA surplus
Domestic Income (Y)
Y0
CA(S1)Y1
S ↑ → Domestic Depreciation
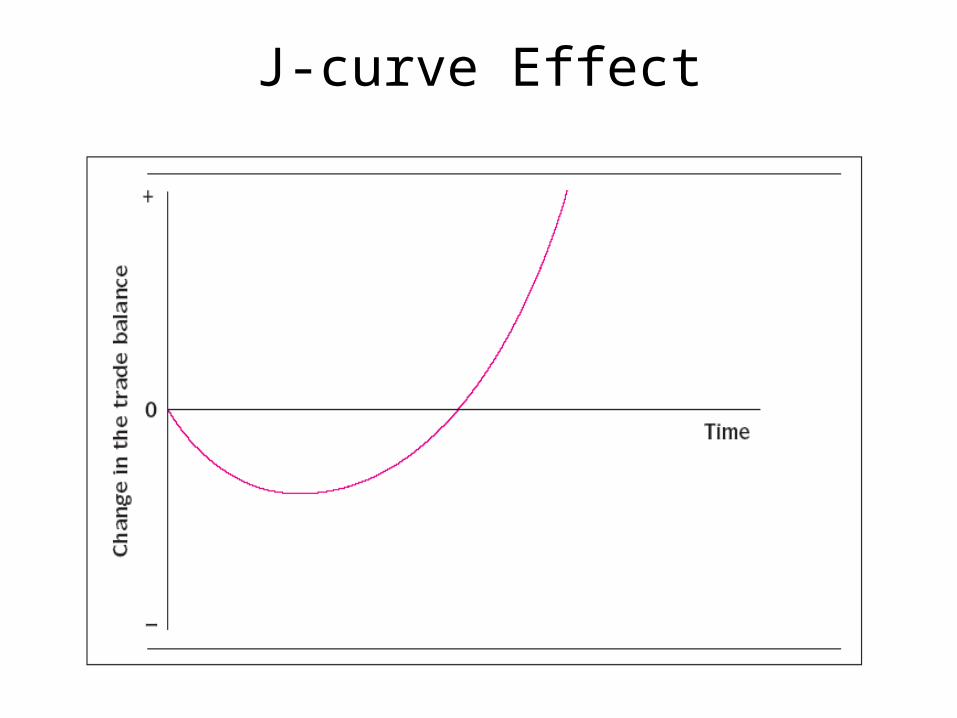
J-curve Effect
The Capital Account
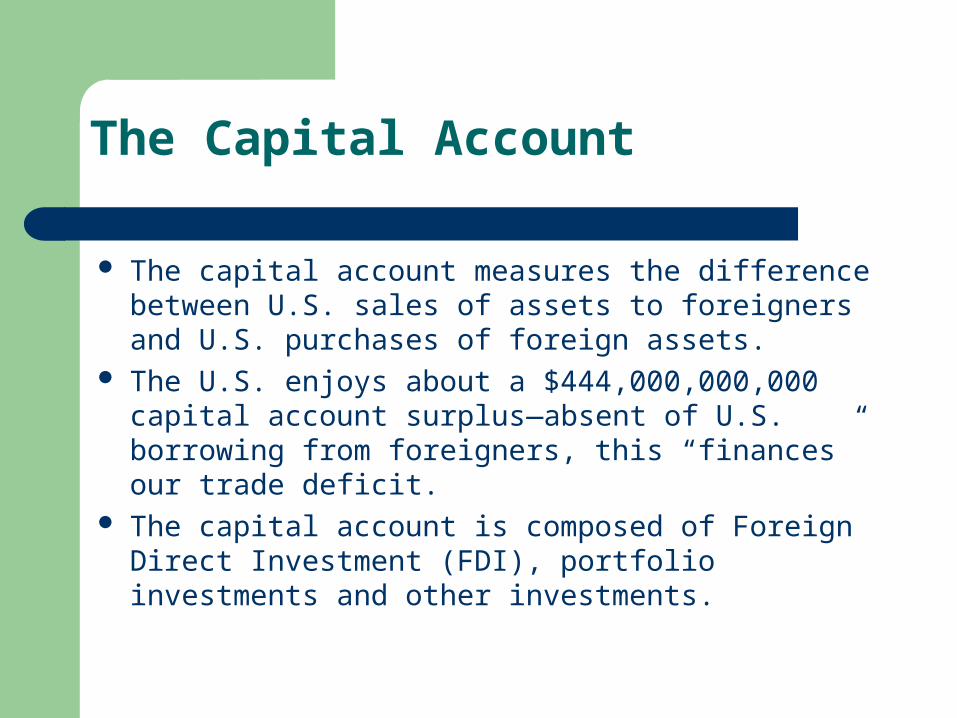
The capital account measures the difference between U.S. sales of assets to foreigners and U.S. purchases of foreign assets.
The U.S. enjoys about a $444,000,000,000 capital account surplus—absent of U.S. borrowing from foreigners, this “finances” our trade deficit.
The capital account is composed of Foreign Direct Investment (FDI), portfolio investments and other investments.
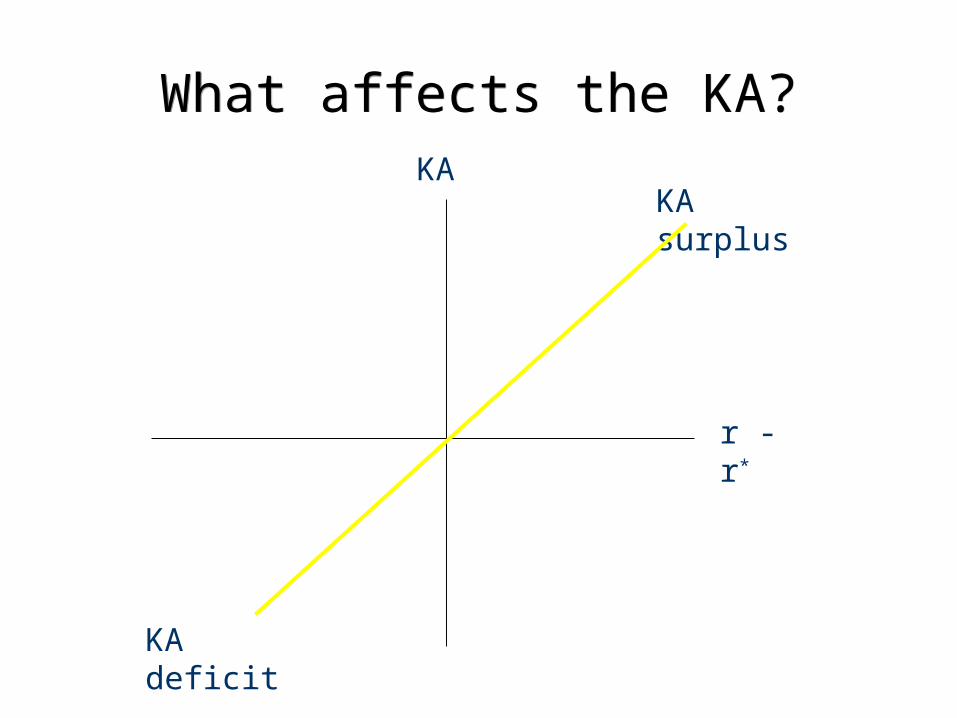
What affects the KA?What affects the KA?
KA deficit
r - r*
KA surplusKA
Statistical Discrepancy
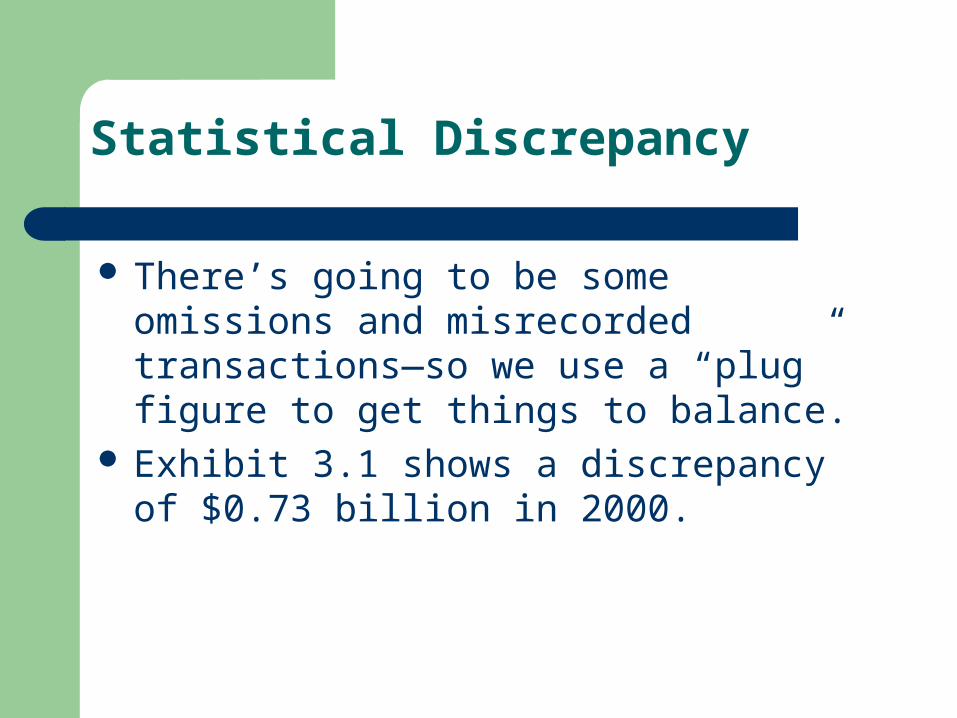
There’s going to be some omissions and misrecorded transactions—so we use a “plug” figure to get things to balance.
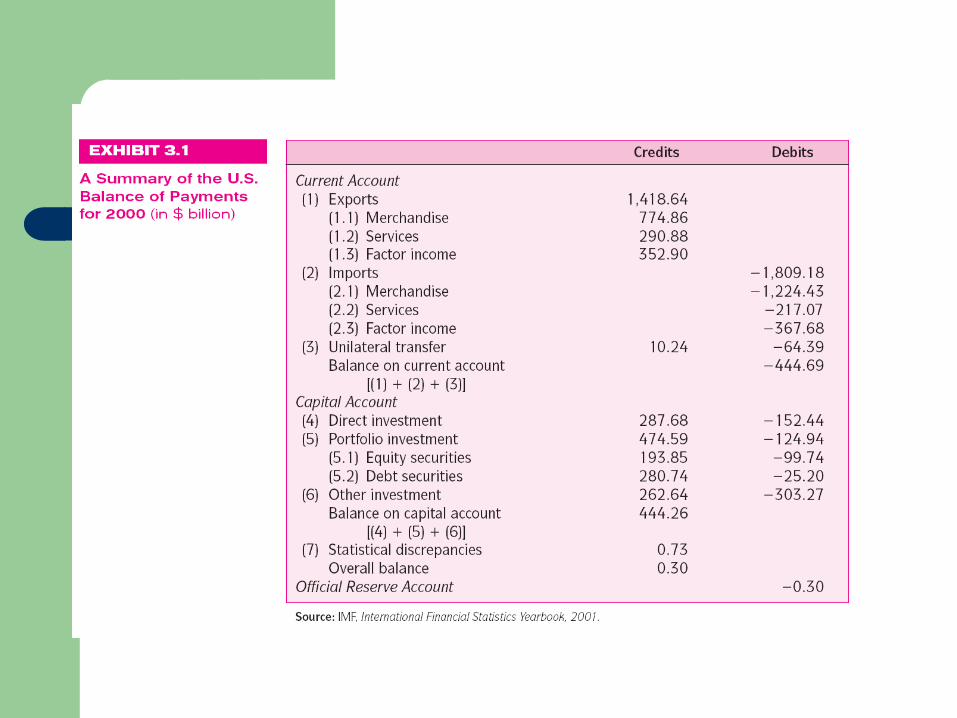
Exhibit 3.1 shows a discrepancy of $0.73 billion in 2000.
The Official Reserves Account
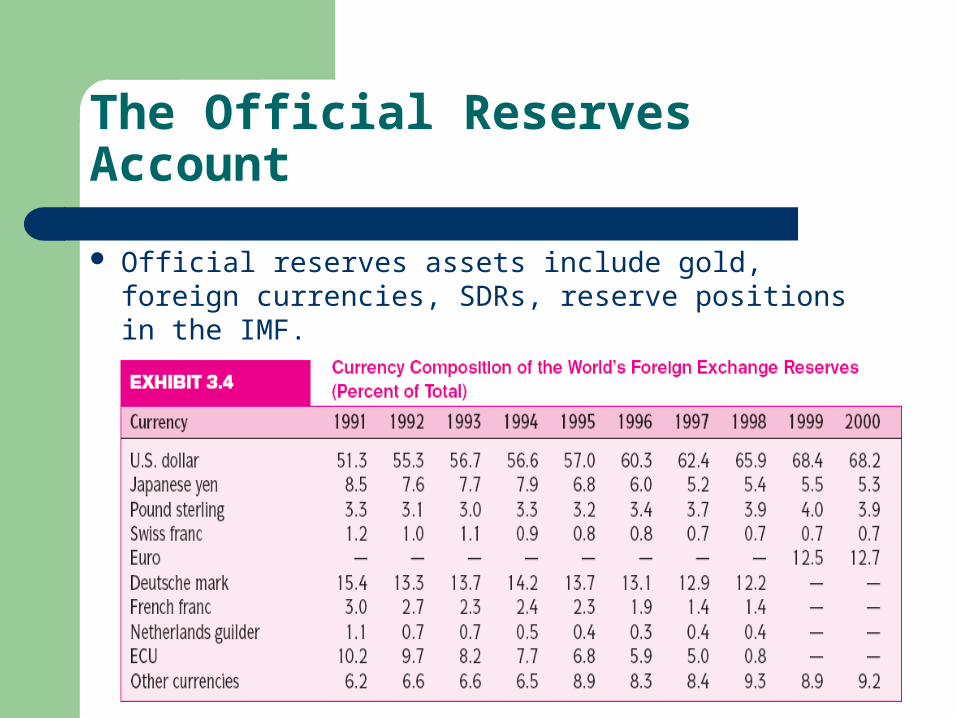
Official reserves assets include gold, foreign currencies, SDRs, reserve positions in the IMF.
The Balance of Payments Identity
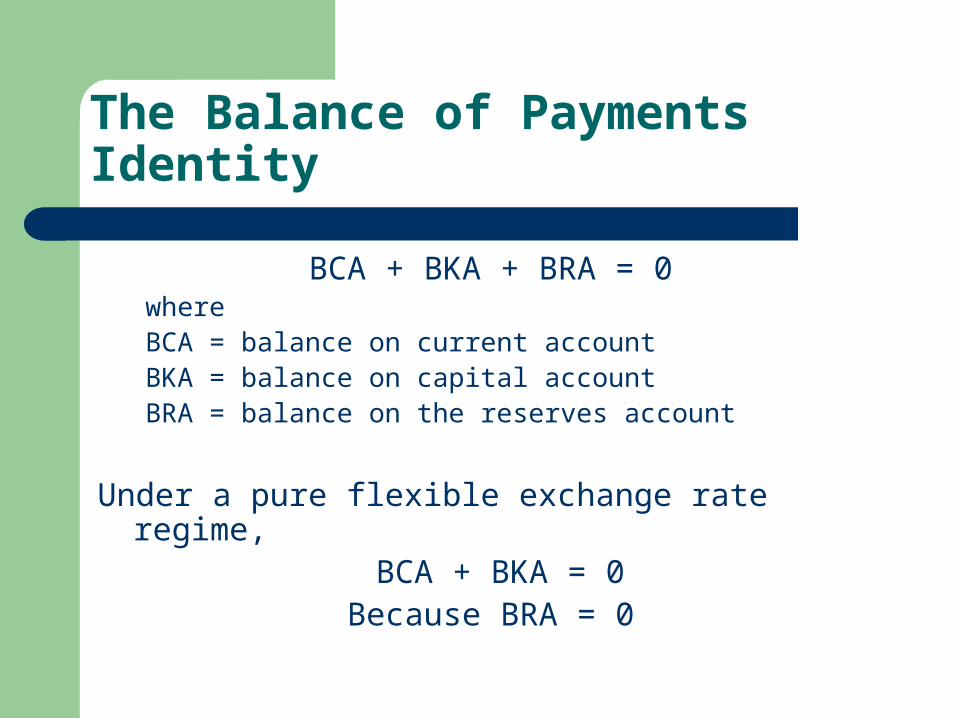
BCA + BKA + BRA = 0whereBCA = balance on current accountBKA = balance on capital accountBRA = balance on the reserves account
Under a pure flexible exchange rate regime, BCA + BKA = 0
Because BRA = 0
U.S. Balance of Payments DataU.S. Balance of Payments Data
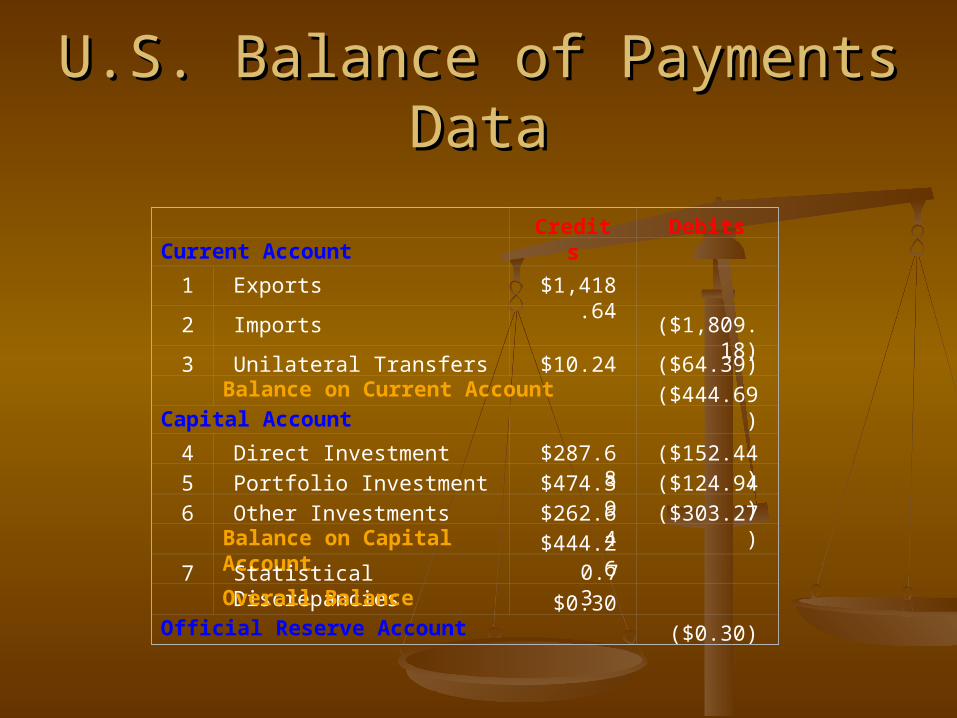
Credits DebitsCurrent Account
1 Exports $1,418.64
2 Imports ($1,809.18)
3 Unilateral Transfers $10.24 ($64.39)
Balance on Current Account ($444.69)Capital Account
4 Direct Investment $287.68 ($152.44)
5 Portfolio Investment $474.39 ($124.94)
6 Other Investments $262.64 ($303.27)
Balance on Capital Account $444.26
7 Statistical Discrepancies
Overall Balance $0.30 Official Reserve Account ($0.30)
0.73
U.S. Balance of Payments DataU.S. Balance of Payments Data
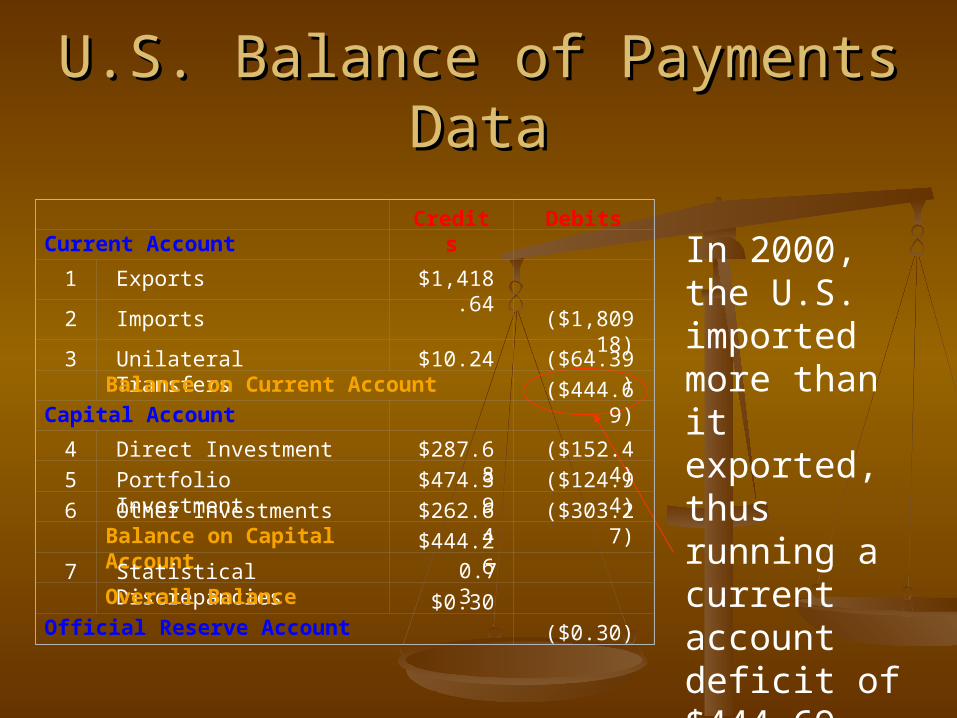
In 2000, the U.S. imported more than it exported, thus running a current account deficit of $444.69 billion.
Credits DebitsCurrent Account
1 Exports $1,418.64
2 Imports ($1,809.18)
3 Unilateral Transfers $10.24 ($64.39)
Balance on Current Account ($444.69)Capital Account
4 Direct Investment $287.68 ($152.44)
5 Portfolio Investment $474.39 ($124.94)
6 Other Investments $262.64 ($303.27)
Balance on Capital Account $444.26
7 Statistical Discrepancies
Overall Balance $0.30 Official Reserve Account ($0.30)
0.73
U.S. Balance of Payments DataU.S. Balance of Payments Data
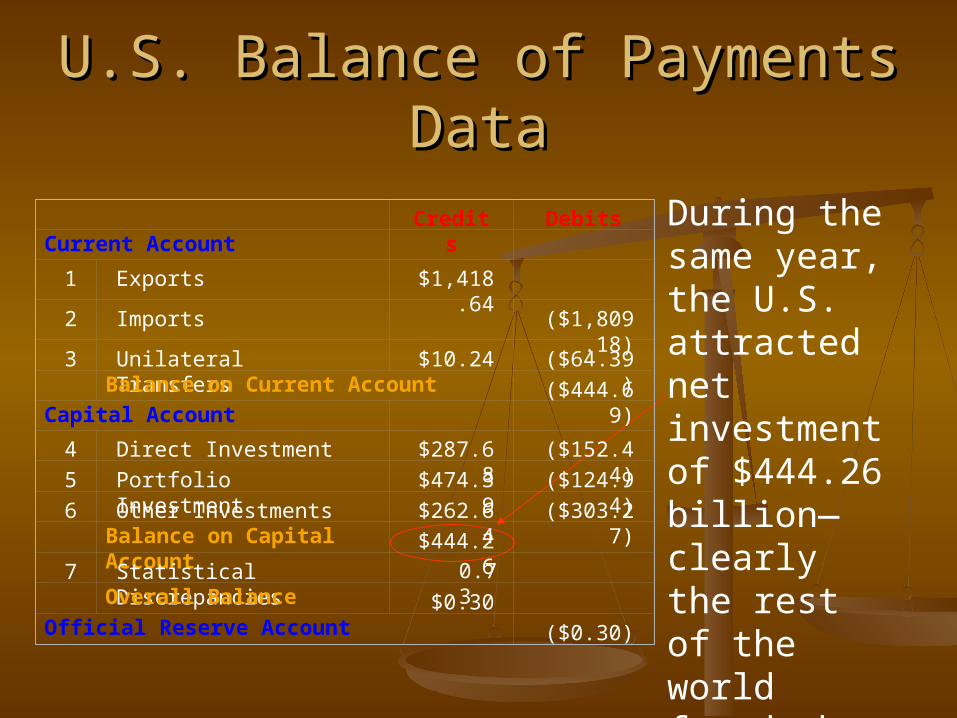
During the same year, the U.S. attracted net investment of $444.26 billion—clearly the rest of the world found the U.S. to be a good place to invest.
Credits DebitsCurrent Account
1 Exports $1,418.64
2 Imports ($1,809.18)
3 Unilateral Transfers $10.24 ($64.39)
Balance on Current Account ($444.69)Capital Account
4 Direct Investment $287.68 ($152.44)
5 Portfolio Investment $474.39 ($124.94)
6 Other Investments $262.64 ($303.27)
Balance on Capital Account $444.26
7 Statistical Discrepancies
Overall Balance $0.30 Official Reserve Account ($0.30)
0.73
U.S. Balance of Payments DataU.S. Balance of Payments Data
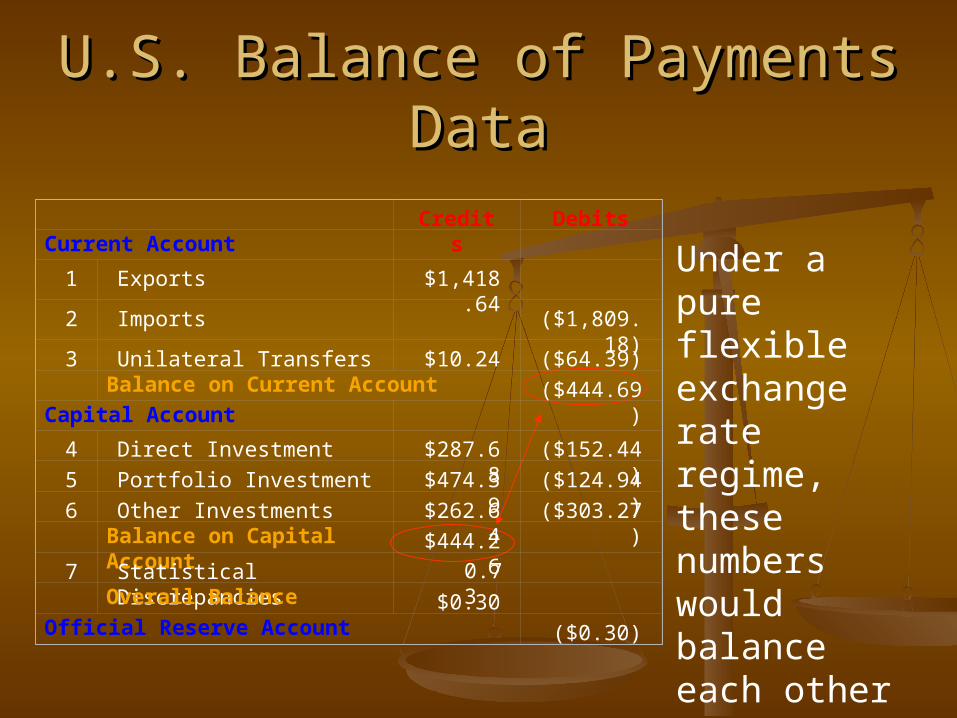
Under a pure flexible exchange rate regime, these numbers would balance each other out.
Credits DebitsCurrent Account
1 Exports $1,418.64
2 Imports ($1,809.18)
3 Unilateral Transfers $10.24 ($64.39)
Balance on Current Account ($444.69)Capital Account
4 Direct Investment $287.68 ($152.44)
5 Portfolio Investment $474.39 ($124.94)
6 Other Investments $262.64 ($303.27)
Balance on Capital Account $444.26
7 Statistical Discrepancies
Overall Balance $0.30 Official Reserve Account ($0.30)
0.73
U.S. Balance of Payments DataU.S. Balance of Payments Data
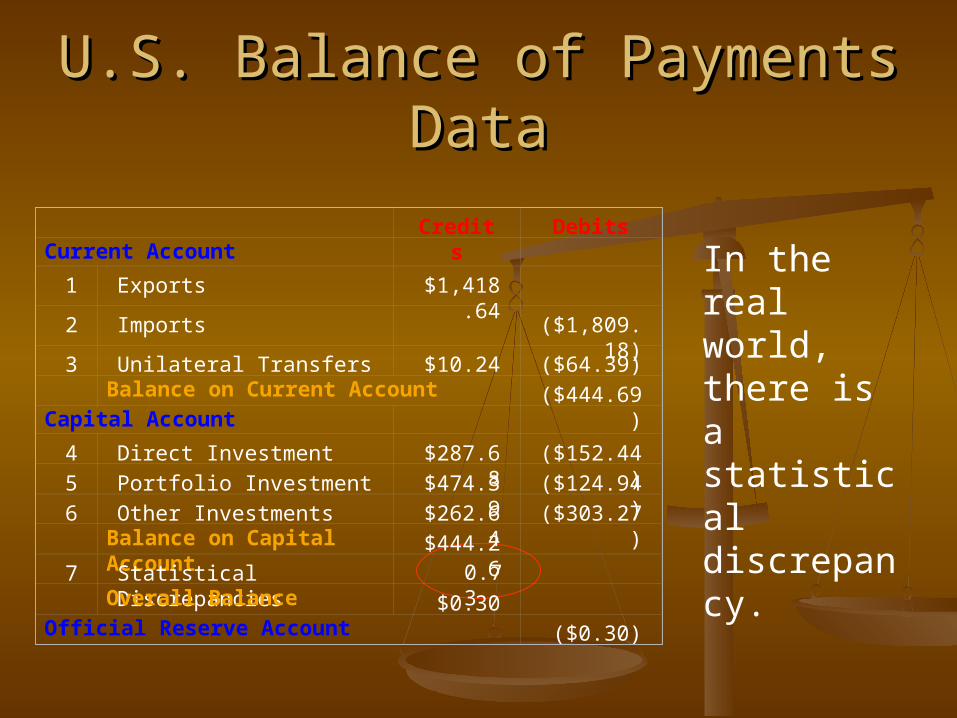
In the real world, there is a statistical discrepancy.
Credits DebitsCurrent Account
1 Exports $1,418.64
2 Imports ($1,809.18)
3 Unilateral Transfers $10.24 ($64.39)
Balance on Current Account ($444.69)Capital Account
4 Direct Investment $287.68 ($152.44)
5 Portfolio Investment $474.39 ($124.94)
6 Other Investments $262.64 ($303.27)
Balance on Capital Account $444.26
7 Statistical Discrepancies
Overall Balance $0.30 Official Reserve Account ($0.30)
0.73
U.S. Balance of Payments DataU.S. Balance of Payments Data
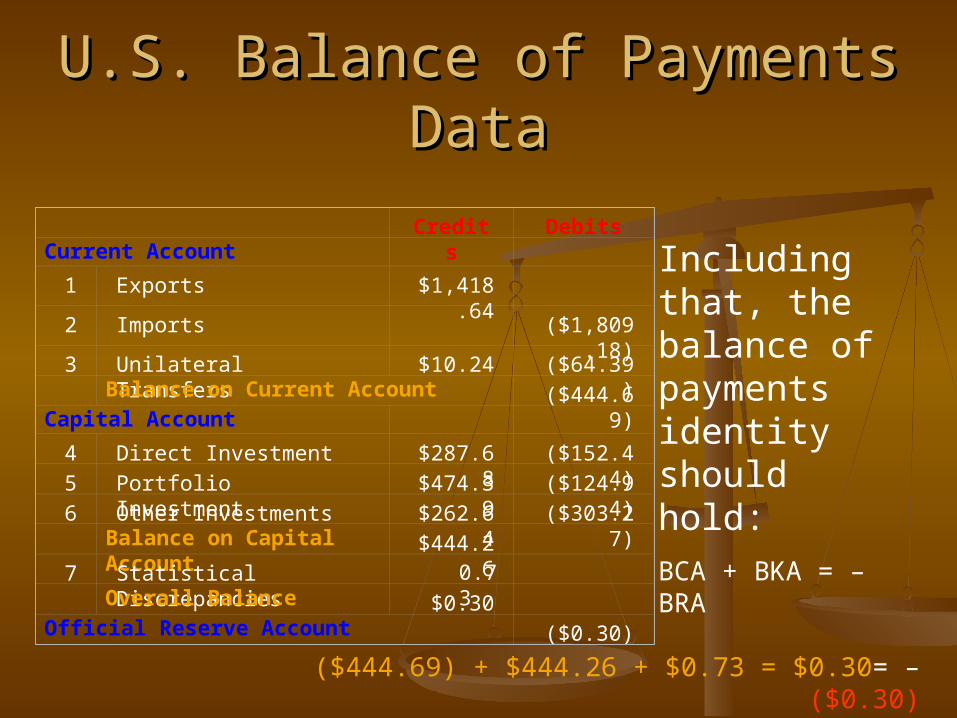
Including that, the balance of payments identity should hold:
BCA + BKA = – BRA
($444.69) + $444.26 + $0.73 = $0.30= –($0.30)
Credits DebitsCurrent Account
1 Exports $1,418.64
2 Imports ($1,809.18)
3 Unilateral Transfers $10.24 ($64.39)
Balance on Current Account ($444.69)Capital Account
4 Direct Investment $287.68 ($152.44)
5 Portfolio Investment $474.39 ($124.94)
6 Other Investments $262.64 ($303.27)
Balance on Capital Account $444.26
7 Statistical Discrepancies
Overall Balance $0.30 Official Reserve Account ($0.30)
0.73
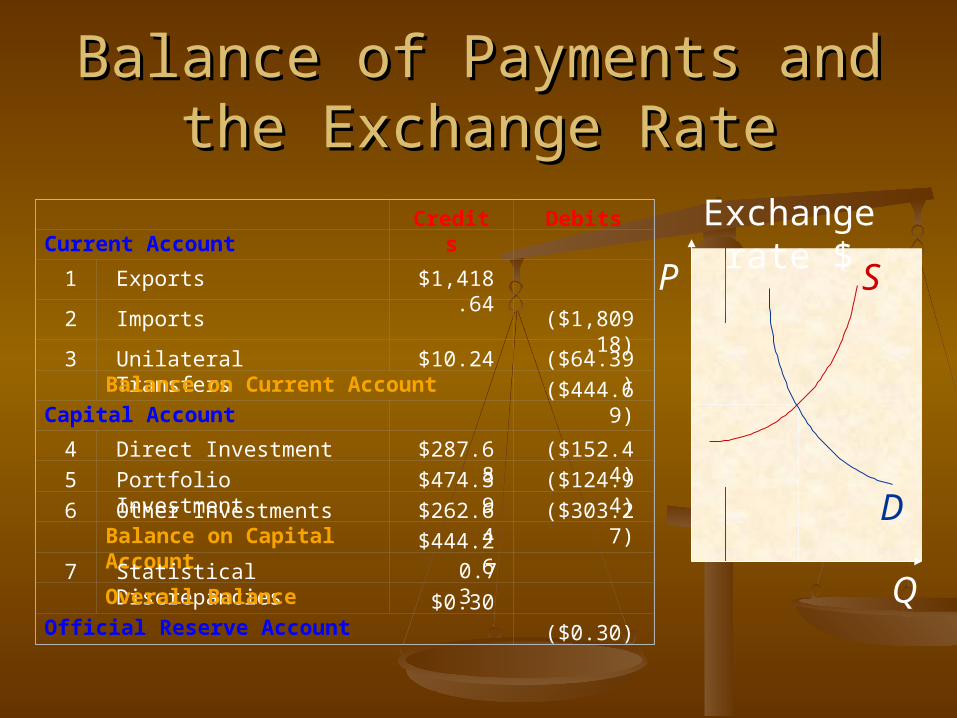
Balance of Payments and the Balance of Payments and the Exchange RateExchange Rate
Q
P
Exchange rate $ Credits DebitsCurrent Account
1 Exports $1,418.64
2 Imports ($1,809.18)
3 Unilateral Transfers $10.24 ($64.39)
Balance on Current Account ($444.69)Capital Account
4 Direct Investment $287.68 ($152.44)
5 Portfolio Investment $474.39 ($124.94)
6 Other Investments $262.64 ($303.27)
Balance on Capital Account $444.26
7 Statistical Discrepancies
Overall Balance $0.30 Official Reserve Account ($0.30)
0.73
S
D
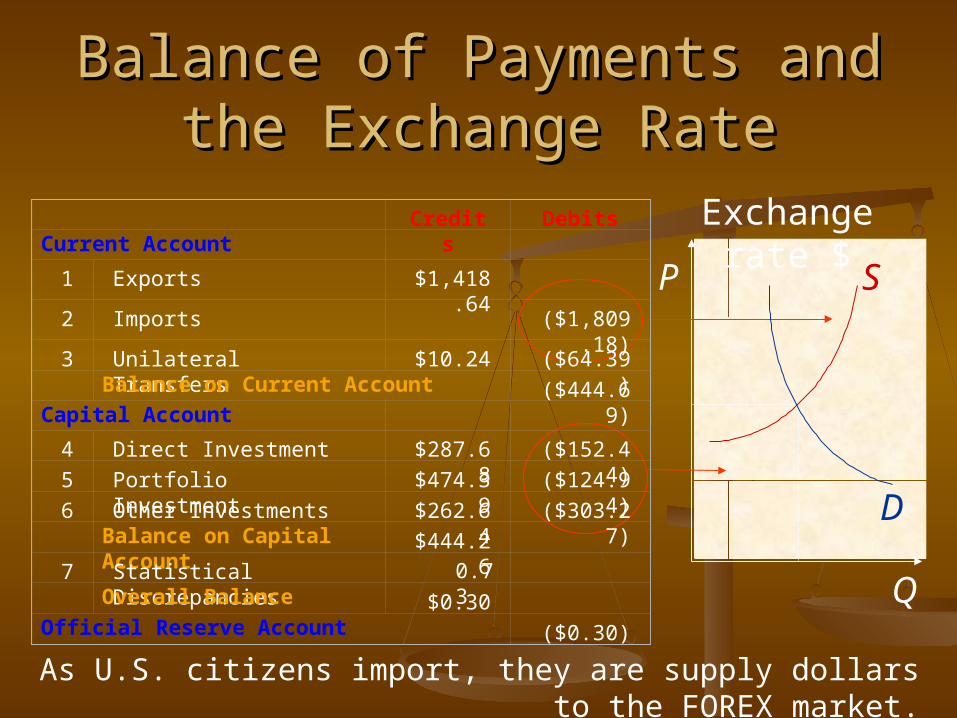
Balance of Payments and the Balance of Payments and the Exchange RateExchange Rate
Q
P
As U.S. citizens import, they are supply dollars to the FOREX market.
Credits DebitsCurrent Account
1 Exports $1,418.64
2 Imports ($1,809.18)
3 Unilateral Transfers $10.24 ($64.39)
Balance on Current Account ($444.69)Capital Account
4 Direct Investment $287.68 ($152.44)
5 Portfolio Investment $474.39 ($124.94)
6 Other Investments $262.64 ($303.27)
Balance on Capital Account $444.26
7 Statistical Discrepancies
Overall Balance $0.30 Official Reserve Account ($0.30)
0.73
Exchange rate $
S
D
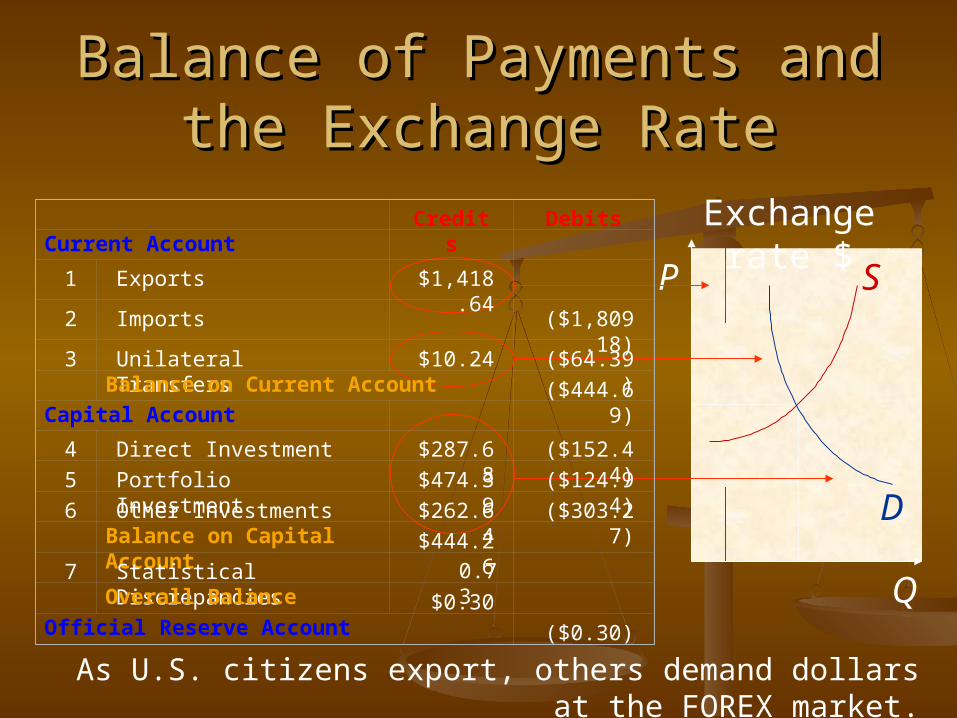
Balance of Payments and the Balance of Payments and the Exchange RateExchange Rate
Q
P
As U.S. citizens export, others demand dollars at the FOREX market.
Credits DebitsCurrent Account
1 Exports $1,418.64
2 Imports ($1,809.18)
3 Unilateral Transfers $10.24 ($64.39)
Balance on Current Account ($444.69)Capital Account
4 Direct Investment $287.68 ($152.44)
5 Portfolio Investment $474.39 ($124.94)
6 Other Investments $262.64 ($303.27)
Balance on Capital Account $444.26
7 Statistical Discrepancies
Overall Balance $0.30 Official Reserve Account ($0.30)
0.73
Exchange rate $
S
D
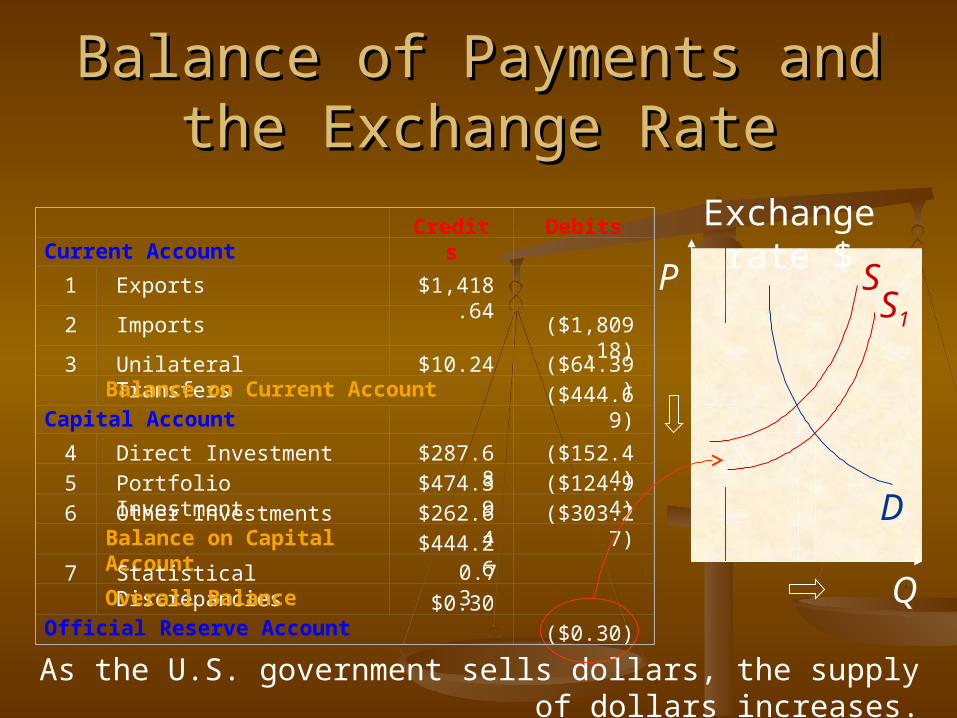
Balance of Payments and the Balance of Payments and the Exchange RateExchange Rate
Q
P S
D
As the U.S. government sells dollars, the supply of dollars increases.
S1
Credits DebitsCurrent Account
1 Exports $1,418.64
2 Imports ($1,809.18)
3 Unilateral Transfers $10.24 ($64.39)
Balance on Current Account ($444.69)Capital Account
4 Direct Investment $287.68 ($152.44)
5 Portfolio Investment $474.39 ($124.94)
6 Other Investments $262.64 ($303.27)
Balance on Capital Account $444.26
7 Statistical Discrepancies
Overall Balance $0.30 Official Reserve Account ($0.30)
0.73
Exchange rate $
Balance of Payments Trends
Since 1982 the U.S. has experienced continuous deficits on the current account and continuous surpluses on the capital account.
During the same period, China has experienced the opposite.
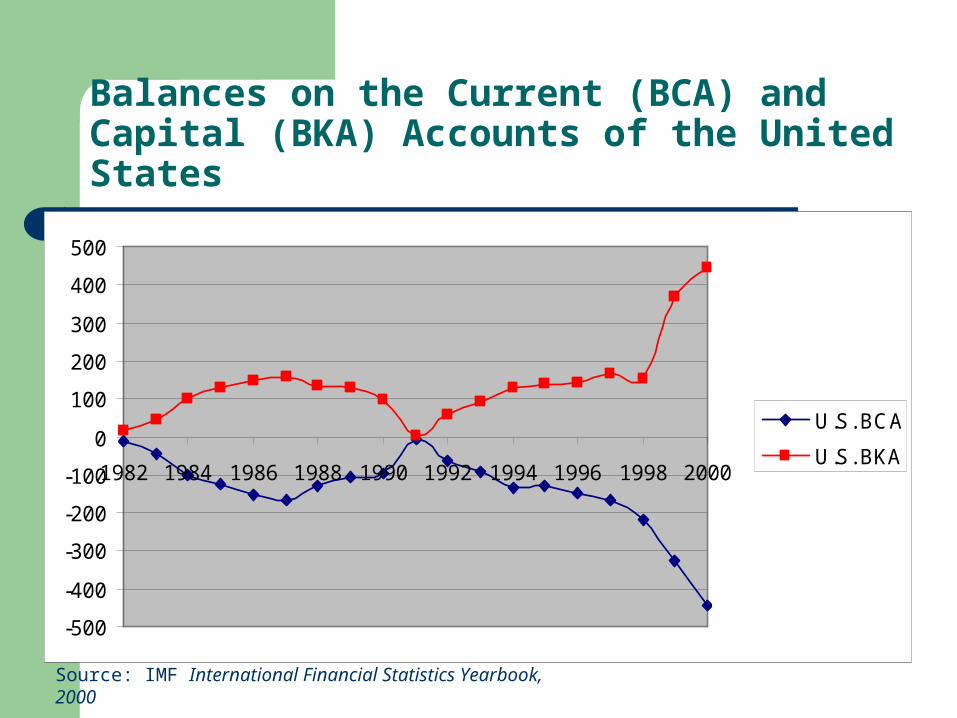
Balances on the Current (BCA) and Capital (BKA) Accounts of the United States
-500
-400
-300
-200
-100
0
100
200
300
400
500
1982 1984 1986 1988 1990 1992 1994 1996 1998 2000
U.S. BCA
U.S. BKA
Source: IMF International Financial Statistics Yearbook, 2000
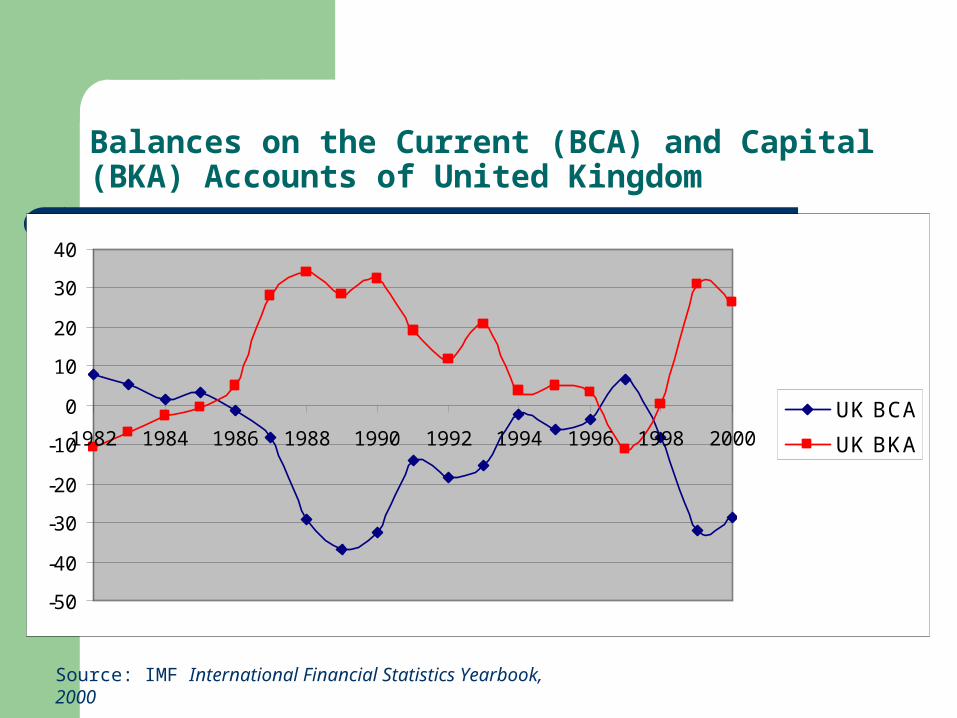
Balances on the Current (BCA) and Capital (BKA) Accounts of United Kingdom
-50
-40
-30
-20
-10
0
10
20
30
40
1982 1984 1986 1988 1990 1992 1994 1996 1998 2000
UK BCA
UK BKA
Source: IMF International Financial Statistics Yearbook, 2000
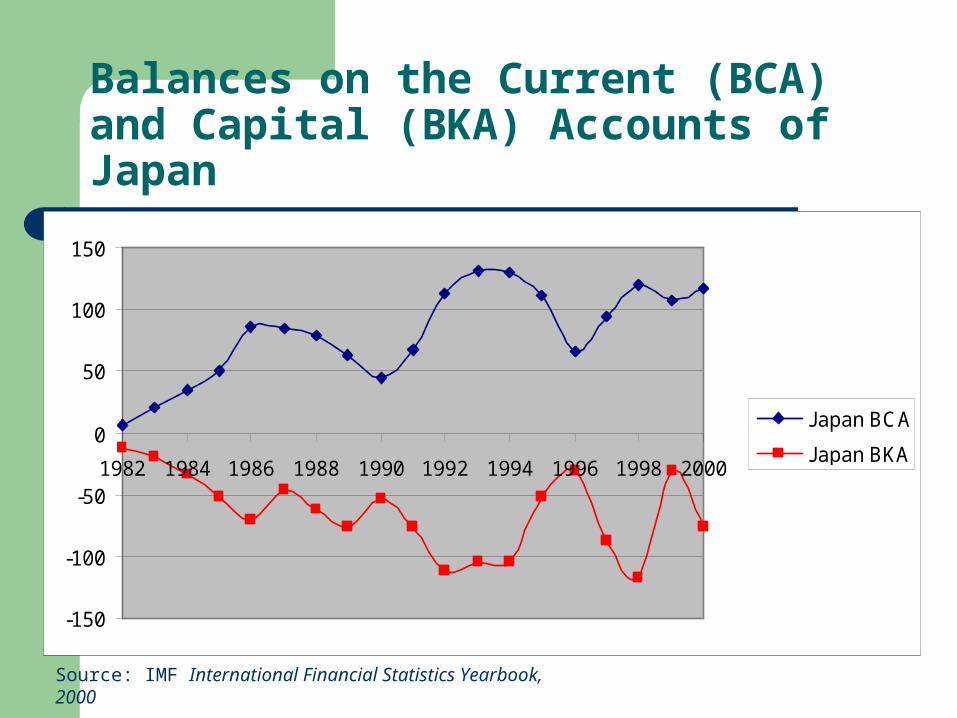
Balances on the Current (BCA) and Capital (BKA) Accounts of Japan
-150
-100
-50
0
50
100
150
1982 1984 1986 1988 1990 1992 1994 1996 1998 2000
Japan BCA
Japan BKA
Source: IMF International Financial Statistics Yearbook, 2000
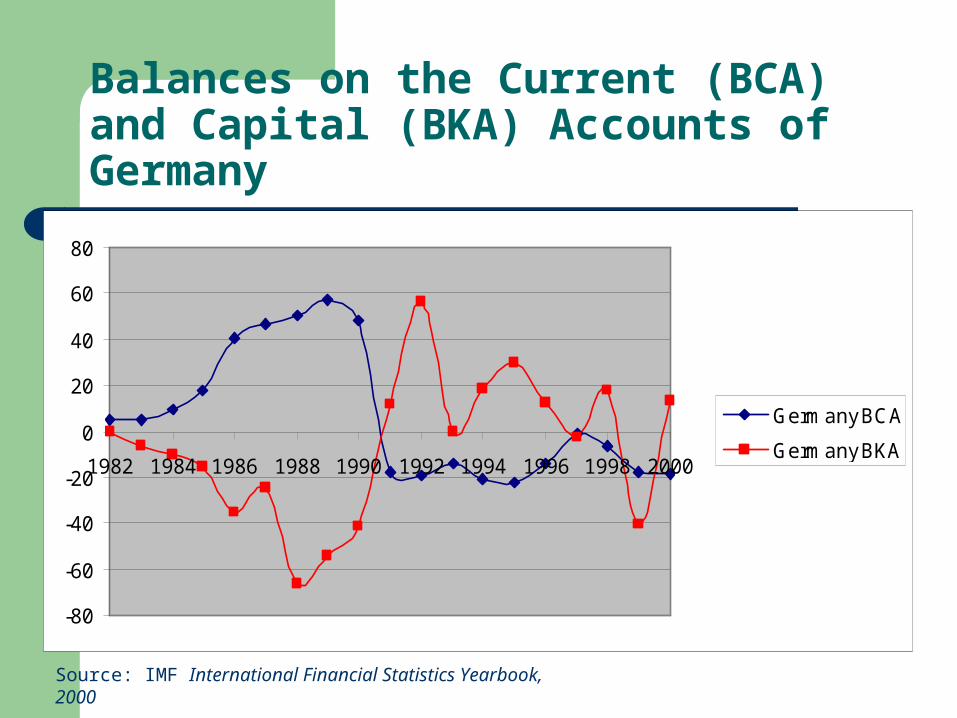
Balances on the Current (BCA) and Capital (BKA) Accounts of Germany
-80
-60
-40
-20
0
20
40
60
80
1982 1984 1986 1988 1990 1992 1994 1996 1998 2000
Germany BCA
Germany BKA
Source: IMF International Financial Statistics Yearbook, 2000
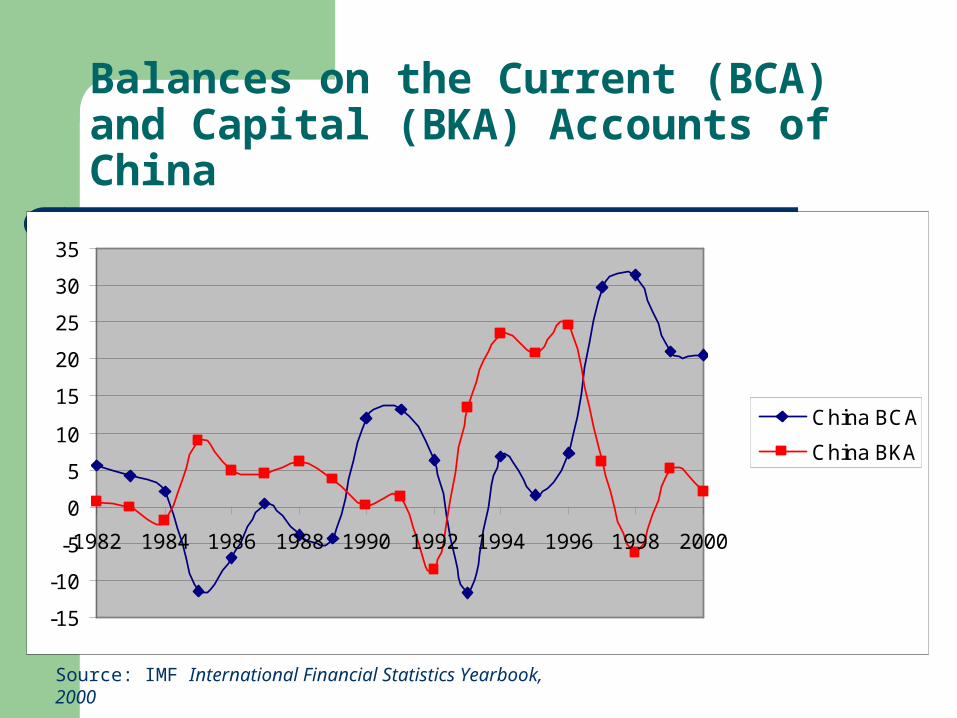
Balances on the Current (BCA) and Capital (BKA) Accounts of China
-15
-10
-5
0
5
10
15
20
25
30
35
1982 1984 1986 1988 1990 1992 1994 1996 1998 2000
China BCA
China BKA
Source: IMF International Financial Statistics Yearbook, 2000
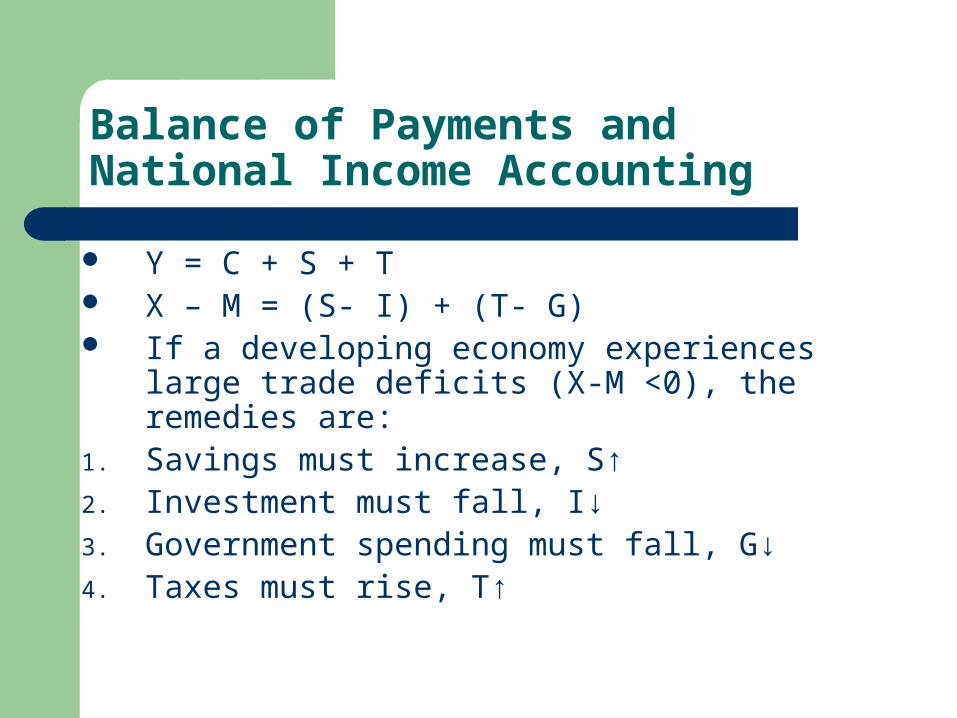
Balance of Payments and National Income Accounting GNP = Y = C + I + G + X – M Y = C + S + T X – M = (S- I) + (T- G) If a developing economy experiences large trade
deficits (X-M <0), the remedies are:1. Savings must increase, S↑2. Investment must fall, I↓3. Government spending must fall, G↓4. Taxes must rise, T↑