Embed Size (px)
Citation preview
Bangladesh Economic Update Balance of Payment
June 2012
Bangladesh Economic Update, June 2012 2 | P a g e
Bangladesh Economic Update Volume 3, No. 6, June 2012 Acknowledgement: Bangladesh Economic Update is a monthly publication of the Economic Policy Unit of the Unnayan Onneshan, a multidisciplinary research organisation based in Dhaka, Bangladesh. A team, under the guidance of Rashed Al Mahmud Titumir, comprising Syed Naimul Wadood, Nahida Sultana and A. Z. M. Saleh prepared the report.
© Copyright: Unnayan Onneshan The content of this publication may be reproduced for non-commercial purposes with proper citation (please send output to the address mentioned below). Any other form of reproduction, storage in a retrieval system or transmission by any means for commercial purposes, requires permission from the Unnayan Onneshan. For orders and request, please contact: Unnayan Onneshan 16/2, Indira Road, Farmgate Dhaka-1215, Bangladesh Tell: + (880-2) 8158274, 9110636 Fax: + (880-2) 8159135 E-mail: [email protected] Web: www.unnayan.org
Bangladesh Economic Update, June 2012 3 | P a g e
Executive Summary The Bangladesh economy is experiencing disequilibrium in balance of payments due to shortsighted policy decisions, internal economic imbalances and global economic crisis. The BoP slipped into a deficit for the first time in a decade resulting in heightened risks to Bangladesh’s external position. The government agreed a three-year reform programme with the International Monetary Fund (IMF) styled Memorandum of Economic and Financial Policies (MEFP) to access credit the IMF’s Extended Credit Facility (ECF) arrangement to stave-off the pressures on the BoP. The access to IMF funds requires reduction in aggregate demand by employing mechanisms such as depreciation of currency and cut in import demand and supply of investible funds to the entrepreneurs. The central bank has already allowed the local currency to depreciate significantly against the foreign currencies and put in place contractionary monetary policy to restrict money supply to the private sector and import of goods and services. The central bank may have to resort to further devaluation of taka and administer reduction in imports, if supply of foreign currencies from sources such as remittances does not maintain considerable growth momentum nor the government anticipated flow of foreign aid is materialised. The restrictive monetary targets, agreed in the IMF-MEFP, have in effect reduced the fiscal space of the government, demonstrated in the recently approved national budget of 2012-2013. The choice of instruments of resource mobilisation for deficit financing and public spending has been limited to regressive instruments such as raise in value added tax (VAT). The shortsighted different policies (e.g. quota rent for power sector) have increased the import payments while the growth rate of export earnings has started decelerating. A substantial requirement for foreign currency to finance high import of petroleum products have resulted in depreciation of Taka against USD and the foreign exchange reserve has also dwindled. Along with that, the contractionary monetary policy has restrained the import of capital machineries and intermediate goods, which again had negative fallouts on investment and export performances. In the current fiscal year, the flow of foreign aid disbursement has witnessed a comparatively lower amount in comparison with other fiscal years. In addition, the incremental foreign direct investment (FDI) inflow and receipt of remittance has experienced a trend of deceleration. Moreover, domestic private investment is facing difficulties due to ever increasing domestic borrowing of the government from banking sector that holds back the expansion of productive sector. In recent fiscal years, trade deficit has widened at a staggering rate mainly because of soaring import bills particularly for quick rental power plants and sluggish rate of export earnings. The current imbalance of balance of payment (BoP) has occurred mainly due to the trade imbalances. The continuous depreciation of the national currency against dollars has assisted to increase the import payments. Accommodative policies coupled with global headwinds and firming oil prices have widened the trade imbalances and also resulted in losses of foreign exchange reserve. During July-April FY 2011-12, export earnings (including EPZ) were USD 19543 million which was 8.19 percent higher than that of the same period of the previous fiscal year. During July-April of FY
Bangladesh Economic Update, June 2012 4 | P a g e
2011-12, import payments (including EPZ) were USD 26888 million which were 8.65 percent higher than that of the corresponding period of the previous fiscal year because of the higher growth rate of fuel imports for the higher demand of quick rental power generation. During July-April FY 2011-12, trade deficit increased by 9.87 percent and reached at USD 7345 million against USD 6685 million in the same month of the previous fiscal year. Exports are following a negative growth rate during the recent months of this current fiscal year because of the EU debt crisis which has cast a shadow on the expectations of export. In FY 2012-13, targets of the Medium Term Macroeconomic Framework (MTMF), IMF-MEFP and Medium Term Budgetary Framework (MTBF) on percentage change of exports are 14.5 percent, 16.6 percent and 14.5 percent respectively while the business as usual scenario suggests it at 9.32 percent. The target of the MTMF and MTBF on percentage change of import is only 15 percent while IMF-MEFP targets at 13.6 percent and under the business as usual scenario it might be only 9.60 percent in FY 2012-13. Depreciation of Taka against USD increases the export earnings and increases the import bills (measured in Taka). During the last few months of this fiscal year, depreciation of Taka against USD is increasing at a staggering rate, which ultimately increases the trade deficit. In December 2012, depreciation was 6.09 percent and 3.07 percent was found in January 2012. Depreciation of local currency may generally create the importable goods expensive and the exportable goods cheaper as well. Improvement of terms of trade of a country eases the current account deficit. It is observed that import price index in Bangladesh exceeds the export price index. Under the business as usual scenario, terms of trade might decrease to 70.71 in FY 2011-12. In comparison, in FY 2010-11, terms of trade was 72.37 percent which was 52 percentage points higher than that of FY 2009-10 and the export price index and the import price index increased by 7.31 percent and 6.74 percent respectively. Interest payment is increasing over the years. In FY 2010-11, it increased to USD 220 million which is 2.33 percent higher than that of FY 2009-10. In FY 2001-02, it was USD 161 million and in FY 2004-05, it was USD 203 million. After that, it was higher in FY 2008-09 at USD 238 million. Under the business as usual scenario, interest payment might increase to USD 226 million in FY 2011-12 and USD 232 million in FY 2012-13. The percentage of labour migration decelerated in FY 2010-11 because of the global economic recession, political instability in Middle East and squeezing demand of labour markets. During the first ten months of this current fiscal year, the remittance flow stood up at USD 10615.75 million which was 10.43 percent higher than that of the previous fiscal year. In FY 2011-12, the target of MTMF, IMF-MEFP, MTBF on remittance are at USD 12900 million, USD 12815 million and USD 10020 million respectively while business as usual scenario suggests that receipt of remittance might stood at USD 12265.18 million. Foreign exchange reserve is increasing at a decreasing rate over the years due to soaring import bills, the global financial crisis, economic slowdown and higher rate of inflation. Other factors associated are the depreciation of Taka against USD and the increase in debt and deficit cornered the reserve to decline in the current fiscal year. During January-April FY 2011-12, reserve continued to slide down
Bangladesh Economic Update, June 2012 5 | P a g e
than that of the previous fiscal year due to the steady depreciation of taka, decrease in export earnings, remittance and the upward trend of import bills. The reserve might reach at USD 11389.29 million under the business as usual scenario and it might stand at USD 9110 million and USD 9700 million according to the target of IMF-MEFP and MTMF respectively in FY 2011-12. During July-April FY 2011-12, current account surplus was USD 509 million which is 35.37 percent lower than that of the same period of the corresponding previous fiscal year. The slower rate of current account surplus occurred mainly due to the increase in deficits of trade and primary income. In the meantime, a larger deficit in trade and primary income was increased by 9.87 percent and 19 percent respectively than that of July-April FY 2010-11. In FY 2011-12, IMF-MEFP and MTBF targeted that current account balance as percent of GDP might reach at negative value of 0.7 percent and 0.2 percent respectively. However, the target of MTMF and the business as usual scenario suggests that it might attain at 0.4 percent and 1 percent respectively. During July-April of FY 2011-12, capital account was in surplus at USD 429 million which is 2.27 percent lower than that of the same period of the previous fiscal year. In FY 2010-11, capital transfer was USD 600 million which was 22.95 percent higher than that of FY 2009-10. Under the business as usual scenario, it might reach at USD 615 million in FY 2011-12 and USD 631 million might obtain in FY 2012-13. Lower value of net FDI, negative value of portfolio investment and the continuously declining trend of other investments are edging the financial account to further deficit. Under the business as usual scenario, the deficit in financial account might reach at USD 1703.3 million in FY 2011-12 and USD 1822.6 million in FY 2012-13. In spite of a capital account surplus of USD 429 million, a financial account deficit of USD 934 million and a large negative errors and omissions contribute to the overall account balance deficits of USD 106 million during July-April of FY 2011-12 against a deficit of USD 502 million during July-April of 2010-11. For the first time in a decade, the overall balance of payments slipped into a deficit in FY 2010-11 and might drive down further in the upcoming fiscal years.
In recent fiscal years, trade deficit has widened at a staggering rate mainly because of soaring import bills particularly for quick rental power plants and sluggish rate of export earnings.
1. INTRODUCTION The current issue of the Bangladesh Economic Update focuses on the pressure exerted on the balance of payments due to internal economic imbalances and mismanagement of different policies. The issue also diagnoses the targets of IMF-MEFP on balance of payments taken under the ECF. The prescription of shrinking import in the upcoming fiscal years would not only reduce the import of capital machineries and intermediate goods, prerequisite for the expansion of productive sector, but also result into contraction in export which would widen trade deficit further. Ultimately, the balance of payments of the country would face immense pressure, if effective and time-befitting measures are not taken to foster the flow of remittance, FDI, investment along with the import of capital machineries and intermediate goods.
2. CURRENT ACCOUNT BALANCE Current account includes imports and exports of merchandise, military transactions and service transactions. The net flow of current transactions, including goods, services, and interest payments between the countries is known as the current account balance. At a glance, it is the sum of the trade balance, service, primary and the secondary income. If the foreign earnings are higher than the expenditure then it is known as the current account surplus and vice versa. 2.1 Trade Balance1 Historically, the import bills were higher in comparison with export earnings due to which Bangladesh had had to face a persistent trade deficit over the years. In recent fiscal years, trade deficit has widened at a staggering rate mainly because of soaring import bills particularly for quick rental power plants and sluggish rate of export earnings.
1 The gap between the nation’s exports and imports of goods and services is known as the Balance of Trade. If the export earnings are higher than the import bills then it is known as Trade Surplus and if the export earnings are lower than the import bills then it is known as the Trade Deficit.
Bangladesh Economic Update, June 2012 7 | P a g e
The current imbalance of Balance of Payments has occurred mainly due to the trade imbalance. During July-April FY 2011-12, export earnings (including EPZ) were USD 19543 million which was 8.19 percent higher than that of the same period of the previous fiscal year.
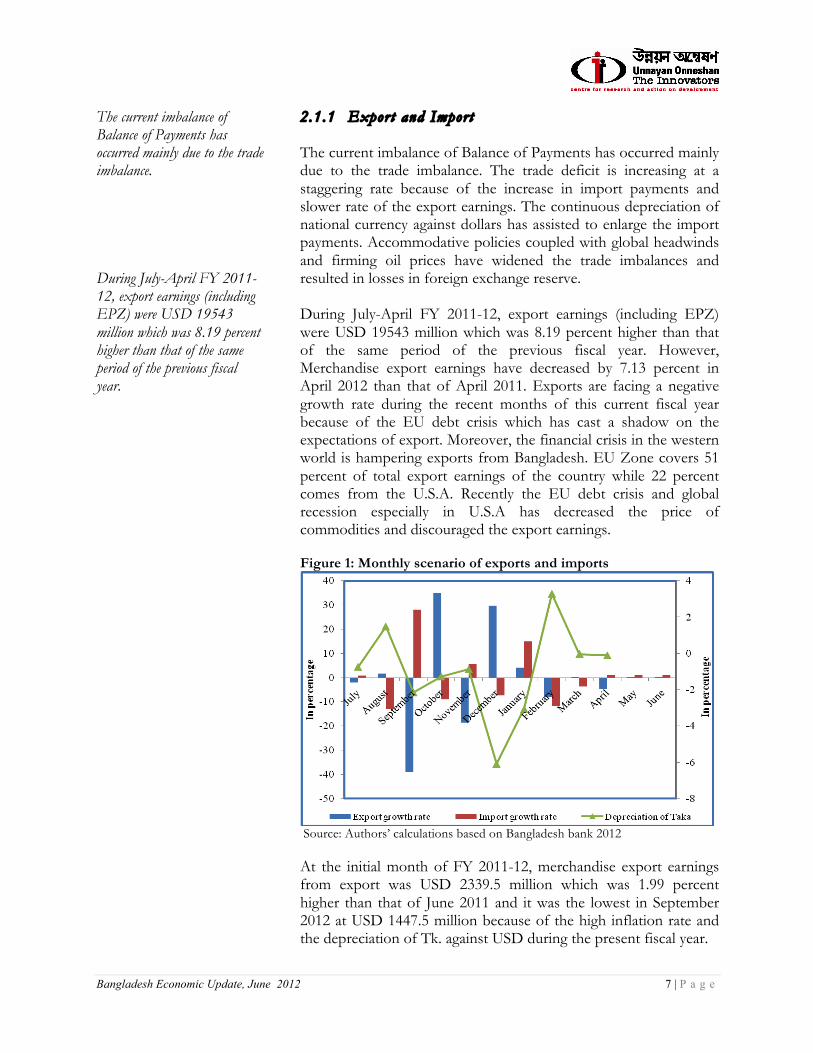
2.1.1 Export and Import The current imbalance of Balance of Payments has occurred mainly due to the trade imbalance. The trade deficit is increasing at a staggering rate because of the increase in import payments and slower rate of the export earnings. The continuous depreciation of national currency against dollars has assisted to enlarge the import payments. Accommodative policies coupled with global headwinds and firming oil prices have widened the trade imbalances and resulted in losses in foreign exchange reserve. During July-April FY 2011-12, export earnings (including EPZ) were USD 19543 million which was 8.19 percent higher than that of the same period of the previous fiscal year. However, Merchandise export earnings have decreased by 7.13 percent in April 2012 than that of April 2011. Exports are facing a negative growth rate during the recent months of this current fiscal year because of the EU debt crisis which has cast a shadow on the expectations of export. Moreover, the financial crisis in the western world is hampering exports from Bangladesh. EU Zone covers 51 percent of total export earnings of the country while 22 percent comes from the U.S.A. Recently the EU debt crisis and global recession especially in U.S.A has decreased the price of commodities and discouraged the export earnings. Figure 1: Monthly scenario of exports and imports
Source: Authors’ calculations based on Bangladesh bank 2012 At the initial month of FY 2011-12, merchandise export earnings from export was USD 2339.5 million which was 1.99 percent higher than that of June 2011 and it was the lowest in September 2012 at USD 1447.5 million because of the high inflation rate and the depreciation of Tk. against USD during the present fiscal year.
Bangladesh Economic Update, June 2012 8 | P a g e
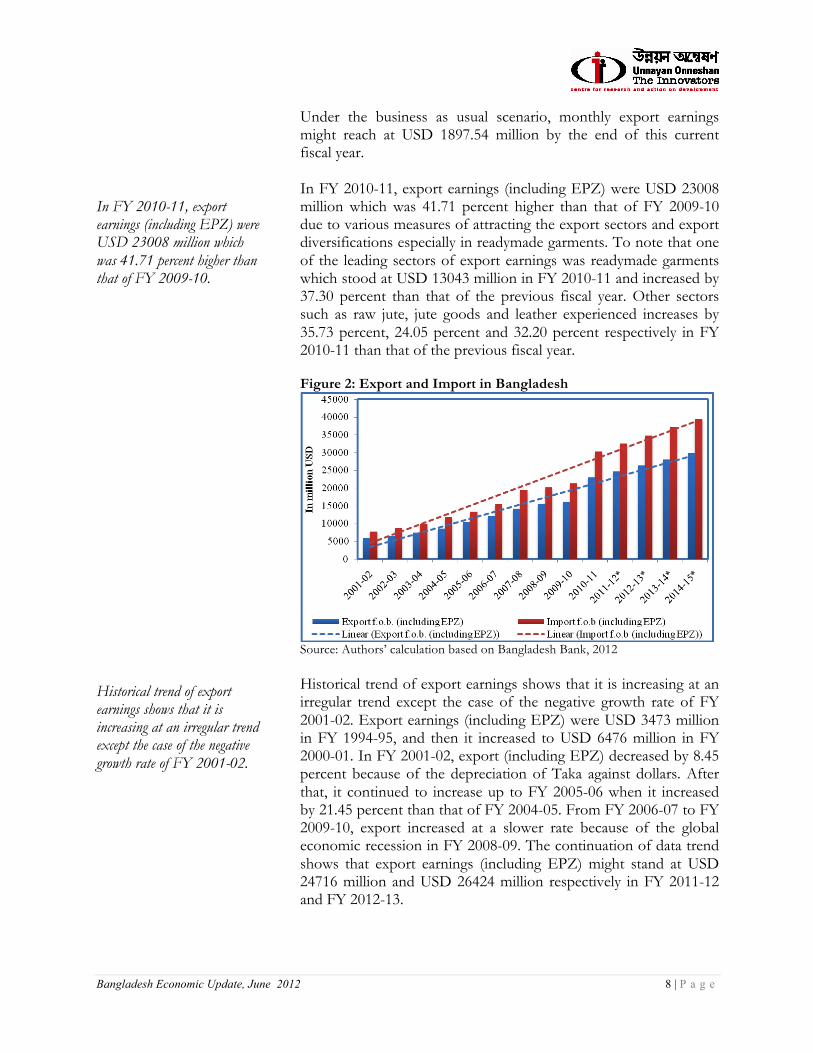
In FY 2010-11, export earnings (including EPZ) were USD 23008 million which was 41.71 percent higher than that of FY 2009-10. Historical trend of export earnings shows that it is increasing at an irregular trend except the case of the negative growth rate of FY 2001-02.
Under the business as usual scenario, monthly export earnings might reach at USD 1897.54 million by the end of this current fiscal year. In FY 2010-11, export earnings (including EPZ) were USD 23008 million which was 41.71 percent higher than that of FY 2009-10 due to various measures of attracting the export sectors and export diversifications especially in readymade garments. To note that one of the leading sectors of export earnings was readymade garments which stood at USD 13043 million in FY 2010-11 and increased by 37.30 percent than that of the previous fiscal year. Other sectors such as raw jute, jute goods and leather experienced increases by 35.73 percent, 24.05 percent and 32.20 percent respectively in FY 2010-11 than that of the previous fiscal year. Figure 2: Export and Import in Bangladesh
Source: Authors’ calculation based on Bangladesh Bank, 2012 Historical trend of export earnings shows that it is increasing at an irregular trend except the case of the negative growth rate of FY 2001-02. Export earnings (including EPZ) were USD 3473 million in FY 1994-95, and then it increased to USD 6476 million in FY 2000-01. In FY 2001-02, export (including EPZ) decreased by 8.45 percent because of the depreciation of Taka against dollars. After that, it continued to increase up to FY 2005-06 when it increased by 21.45 percent than that of FY 2004-05. From FY 2006-07 to FY 2009-10, export increased at a slower rate because of the global economic recession in FY 2008-09. The continuation of data trend shows that export earnings (including EPZ) might stand at USD 24716 million and USD 26424 million respectively in FY 2011-12 and FY 2012-13.
Bangladesh Economic Update, June 2012 9 | P a g e
In FY 2011-12, earnings from readymade garments reached up to USD 13043 million which was 34.70 percent higher than that the corresponding figure for the previous fiscal year. In FY 2011-12, the projection on export earnings growth of MTMF and MTBF is the same at 14.5 percent, whereas the business as usual scenario and IMF-MEF might stand at 7.39 and 14.2 percents respectively.
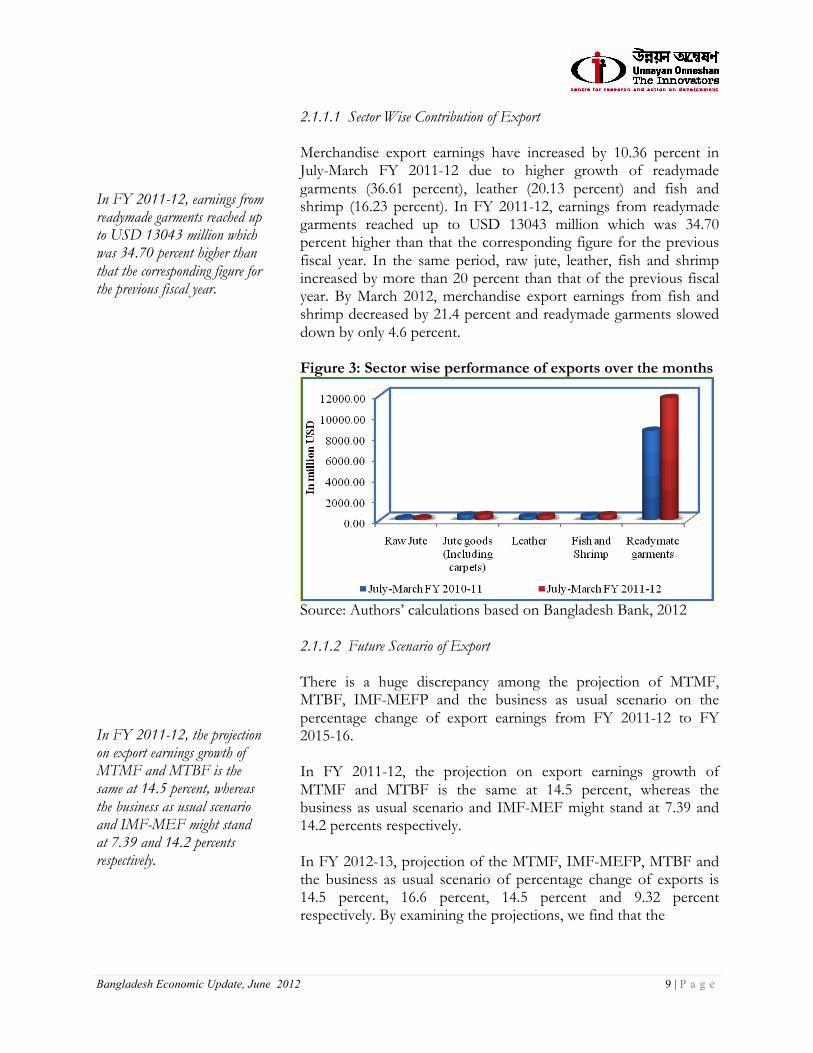
2.1.1.1 Sector Wise Contribution of Export Merchandise export earnings have increased by 10.36 percent in July-March FY 2011-12 due to higher growth of readymade garments (36.61 percent), leather (20.13 percent) and fish and shrimp (16.23 percent). In FY 2011-12, earnings from readymade garments reached up to USD 13043 million which was 34.70 percent higher than that the corresponding figure for the previous fiscal year. In the same period, raw jute, leather, fish and shrimp increased by more than 20 percent than that of the previous fiscal year. By March 2012, merchandise export earnings from fish and shrimp decreased by 21.4 percent and readymade garments slowed down by only 4.6 percent. Figure 3: Sector wise performance of exports over the months
Source: Authors’ calculations based on Bangladesh Bank, 2012 2.1.1.2 Future Scenario of Export There is a huge discrepancy among the projection of MTMF, MTBF, IMF-MEFP and the business as usual scenario on the percentage change of export earnings from FY 2011-12 to FY 2015-16. In FY 2011-12, the projection on export earnings growth of MTMF and MTBF is the same at 14.5 percent, whereas the business as usual scenario and IMF-MEF might stand at 7.39 and 14.2 percents respectively. In FY 2012-13, projection of the MTMF, IMF-MEFP, MTBF and the business as usual scenario of percentage change of exports is 14.5 percent, 16.6 percent, 14.5 percent and 9.32 percent respectively. By examining the projections, we find that the
Bangladesh Economic Update, June 2012 10 | P a g e
In FY 2011-12, the projection of MTMF, MTBF, IMF-MEFP and the business as usual scenario on growth rate of import might stand at 15, 14, 18.1 and 7.46 percent respectively. During the last few months of this fiscal year, depreciation of Taka against USD is increasing at a staggering rate which has increased the trade deficit.
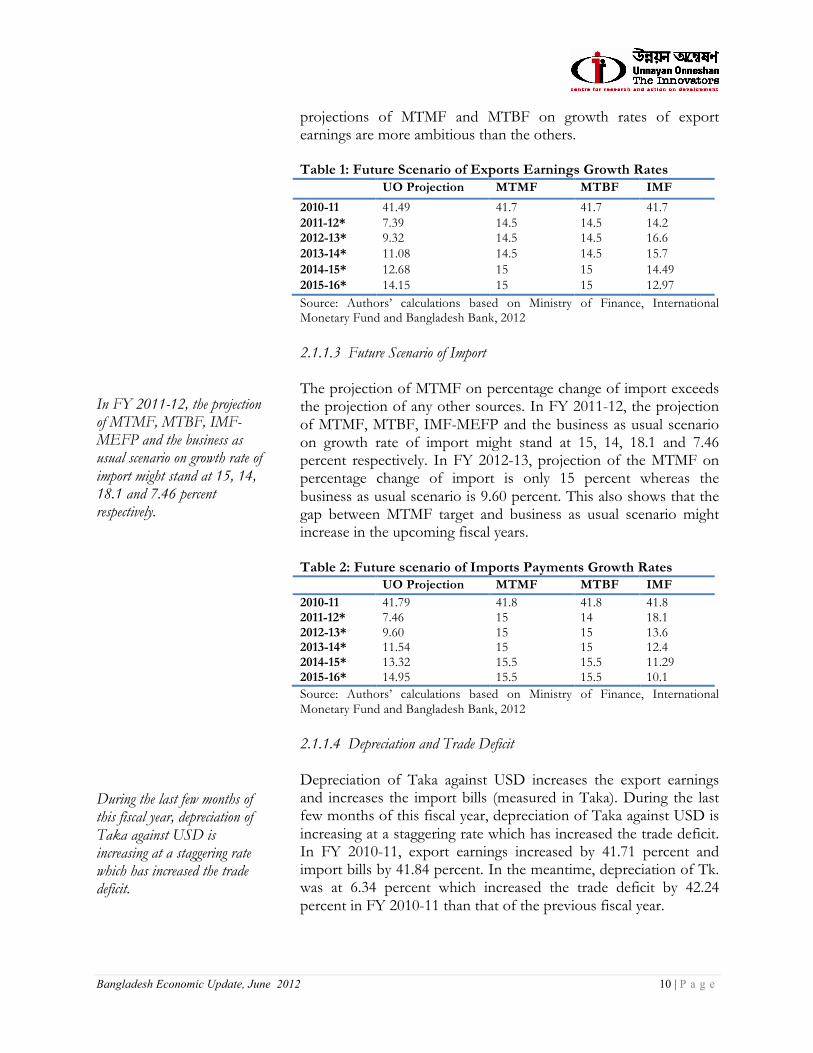
projections of MTMF and MTBF on growth rates of export earnings are more ambitious than the others. Table 1: Future Scenario of Exports Earnings Growth Rates UO Projection MTMF MTBF IMF
2010-11 41.49 41.7 41.7 41.7 2011-12* 7.39 14.5 14.5 14.2 2012-13* 9.32 14.5 14.5 16.6 2013-14* 11.08 14.5 14.5 15.7 2014-15* 12.68 15 15 14.49 2015-16* 14.15 15 15 12.97 Source: Authors’ calculations based on Ministry of Finance, International Monetary Fund and Bangladesh Bank, 2012 2.1.1.3 Future Scenario of Import The projection of MTMF on percentage change of import exceeds the projection of any other sources. In FY 2011-12, the projection of MTMF, MTBF, IMF-MEFP and the business as usual scenario on growth rate of import might stand at 15, 14, 18.1 and 7.46 percent respectively. In FY 2012-13, projection of the MTMF on percentage change of import is only 15 percent whereas the business as usual scenario is 9.60 percent. This also shows that the gap between MTMF target and business as usual scenario might increase in the upcoming fiscal years. Table 2: Future scenario of Imports Payments Growth Rates UO Projection MTMF MTBF IMF 2010-11 41.79 41.8 41.8 41.8 2011-12* 7.46 15 14 18.1 2012-13* 9.60 15 15 13.6 2013-14* 11.54 15 15 12.4 2014-15* 13.32 15.5 15.5 11.29 2015-16* 14.95 15.5 15.5 10.1 Source: Authors’ calculations based on Ministry of Finance, International Monetary Fund and Bangladesh Bank, 2012 2.1.1.4 Depreciation and Trade Deficit Depreciation of Taka against USD increases the export earnings and increases the import bills (measured in Taka). During the last few months of this fiscal year, depreciation of Taka against USD is increasing at a staggering rate which has increased the trade deficit. In FY 2010-11, export earnings increased by 41.71 percent and import bills by 41.84 percent. In the meantime, depreciation of Tk. was at 6.34 percent which increased the trade deficit by 42.24 percent in FY 2010-11 than that of the previous fiscal year.
Bangladesh Economic Update, June 2012 11 | P a g e
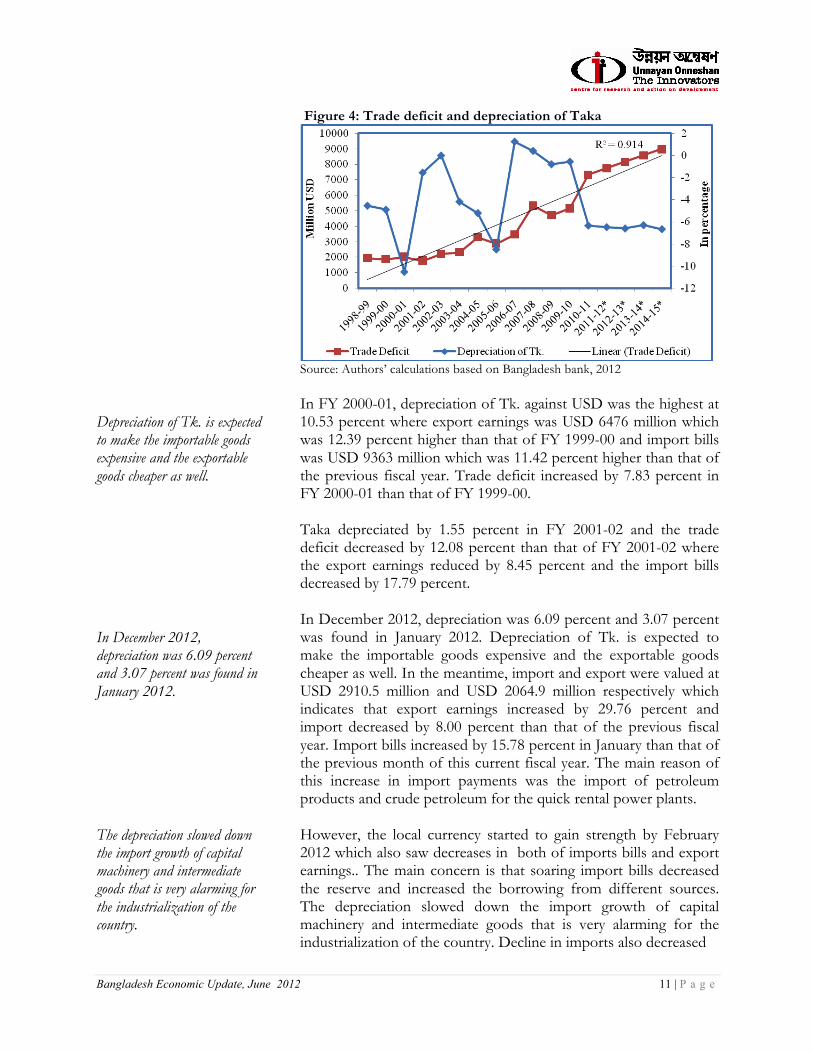
Depreciation of Tk. is expected to make the importable goods expensive and the exportable goods cheaper as well. In December 2012, depreciation was 6.09 percent and 3.07 percent was found in January 2012. The depreciation slowed down the import growth of capital machinery and intermediate goods that is very alarming for the industrialization of the country.
Figure 4: Trade deficit and depreciation of Taka
Source: Authors’ calculations based on Bangladesh bank, 2012 In FY 2000-01, depreciation of Tk. against USD was the highest at 10.53 percent where export earnings was USD 6476 million which was 12.39 percent higher than that of FY 1999-00 and import bills was USD 9363 million which was 11.42 percent higher than that of the previous fiscal year. Trade deficit increased by 7.83 percent in FY 2000-01 than that of FY 1999-00. Taka depreciated by 1.55 percent in FY 2001-02 and the trade deficit decreased by 12.08 percent than that of FY 2001-02 where the export earnings reduced by 8.45 percent and the import bills decreased by 17.79 percent. In December 2012, depreciation was 6.09 percent and 3.07 percent was found in January 2012. Depreciation of Tk. is expected to make the importable goods expensive and the exportable goods cheaper as well. In the meantime, import and export were valued at USD 2910.5 million and USD 2064.9 million respectively which indicates that export earnings increased by 29.76 percent and import decreased by 8.00 percent than that of the previous fiscal year. Import bills increased by 15.78 percent in January than that of the previous month of this current fiscal year. The main reason of this increase in import payments was the import of petroleum products and crude petroleum for the quick rental power plants. However, the local currency started to gain strength by February 2012 which also saw decreases in both of imports bills and export earnings.. The main concern is that soaring import bills decreased the reserve and increased the borrowing from different sources. The depreciation slowed down the import growth of capital machinery and intermediate goods that is very alarming for the industrialization of the country. Decline in imports also decreased
Bangladesh Economic Update, June 2012 12 | P a g e
During July-April of FY 2011-12, import payments (including EPZ) were USD 26888 million which were 8.65 percent higher than that of the corresponding period of the previous fiscal year. However, import payment has declined by 9.99 percent in April 2012 than that of April 2011 after taking a restrained monetary policy and devaluation of Taka against USD. In FY 2010-11, import bill (including EPZ) was the highest at USD 30336 million which was 41.84 percent higher than that of FY 2009-10.
the export earnings as most of the export products of the country are secondary. In the same way, the increase in import payments has created a pressure on the foreign exchange reserve. The demand for dollars exceeds the supply which is depreciating the local currency against USD. 2.1.2 Import Payments During the last few months of this current fiscal year, import payments are following a declining trend but the export earnings is declining more than that of the import payments which is fostering the trade deficit at a continuous basis. During July-April of FY 2011-12, import payments (including EPZ) were USD 26888 million which were 8.65 percent higher than that of the corresponding period of the previous fiscal year because of the higher growth rate of fuel imports for the higher demand of quick rental power generation. Except food grains and other than food items, crude petroleum, petroleum products have increased by more than 50 percent during July-March of FY 2011-12. During the same period of FY 2011-12, import of capital machinery increased by a very small amount than that of the same period of the previous fiscal year. During July-April of FY 2011-12, the fresh LCs opening of capital machinery and consumer goods decreased by 25.78 percent and 19.96 percent respectively which might adversely affect the industrial sectors of the country. However, import payment has declined by 9.99 percent in April 2012 than that of April 2011 after taking a restrained monetary policy and devaluation of Taka against USD. During the recent months of this current fiscal year, the imports of food grains with an expected bumper rice harvest has declined and effective measures have been adopted by Bangladesh Bank to discourage the luxury imports. This may ease the pressure on trade balance in the rest months of this current fiscal year and foreign exchange reserves as well. In FY 2010-11, import bill (including EPZ) was the highest at USD 30336 million which was 41.84 percent higher than that of FY 2009-10. Imports (including EPZ) were USD 3473 million in FY 1994-95 and then it continued to increase up to FY 2000-01. It decreased to USD 7697 million in FY 2001-02 which was 17.79 percent lower than that of FY 2000-01 because of the political unrest and the depreciation of Taka against USD. After that, it increased following an erratic trend in the next six fiscal years and this showed an upward trend of imports in FY 2007-08 which was 25.59 percent higher than that of the previous fiscal year. Under the
Bangladesh Economic Update, June 2012 13 | P a g e
It is observed that import price index in Bangladesh exceeds the export price index which might fuel up the current account deficit further.
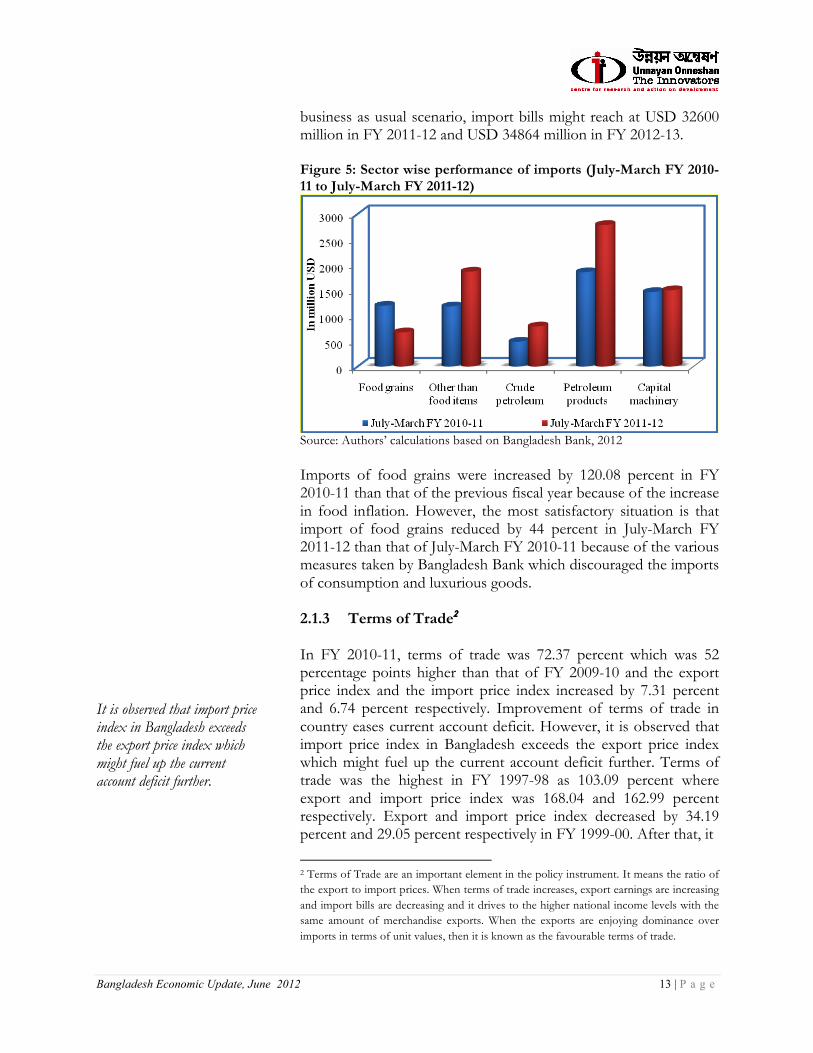
business as usual scenario, import bills might reach at USD 32600 million in FY 2011-12 and USD 34864 million in FY 2012-13. Figure 5: Sector wise performance of imports (July-March FY 2010-11 to July-March FY 2011-12)
Source: Authors’ calculations based on Bangladesh Bank, 2012 Imports of food grains were increased by 120.08 percent in FY 2010-11 than that of the previous fiscal year because of the increase in food inflation. However, the most satisfactory situation is that import of food grains reduced by 44 percent in July-March FY 2011-12 than that of July-March FY 2010-11 because of the various measures taken by Bangladesh Bank which discouraged the imports of consumption and luxurious goods. 2.1.3 Terms of Trade2 In FY 2010-11, terms of trade was 72.37 percent which was 52 percentage points higher than that of FY 2009-10 and the export price index and the import price index increased by 7.31 percent and 6.74 percent respectively. Improvement of terms of trade in country eases current account deficit. However, it is observed that import price index in Bangladesh exceeds the export price index which might fuel up the current account deficit further. Terms of trade was the highest in FY 1997-98 as 103.09 percent where export and import price index was 168.04 and 162.99 percent respectively. Export and import price index decreased by 34.19 percent and 29.05 percent respectively in FY 1999-00. After that, it
2 Terms of Trade are an important element in the policy instrument. It means the ratio of the export to import prices. When terms of trade increases, export earnings are increasing and import bills are decreasing and it drives to the higher national income levels with the same amount of merchandise exports. When the exports are enjoying dominance over imports in terms of unit values, then it is known as the favourable terms of trade.
Bangladesh Economic Update, June 2012 14 | P a g e
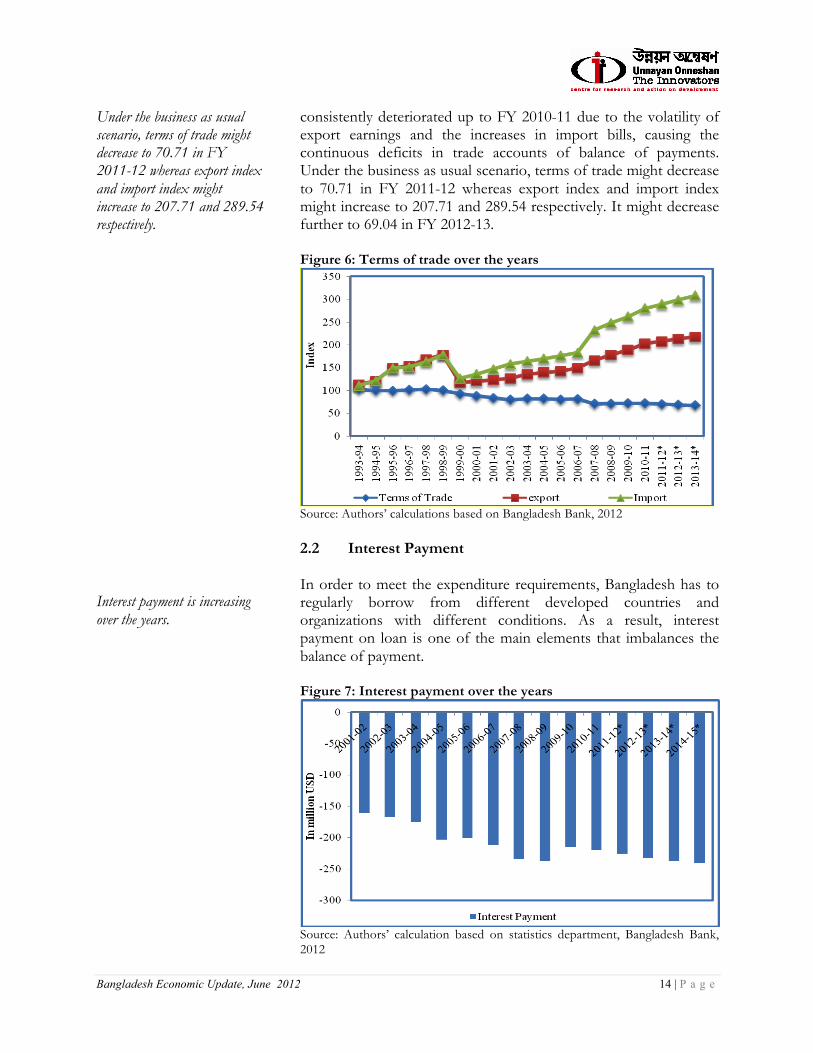
Under the business as usual scenario, terms of trade might decrease to 70.71 in FY 2011-12 whereas export index and import index might increase to 207.71 and 289.54 respectively. Interest payment is increasing over the years.
consistently deteriorated up to FY 2010-11 due to the volatility of export earnings and the increases in import bills, causing the continuous deficits in trade accounts of balance of payments. Under the business as usual scenario, terms of trade might decrease to 70.71 in FY 2011-12 whereas export index and import index might increase to 207.71 and 289.54 respectively. It might decrease further to 69.04 in FY 2012-13. Figure 6: Terms of trade over the years
Source: Authors’ calculations based on Bangladesh Bank, 2012 2.2 Interest Payment In order to meet the expenditure requirements, Bangladesh has to regularly borrow from different developed countries and organizations with different conditions. As a result, interest payment on loan is one of the main elements that imbalances the balance of payment. Figure 7: Interest payment over the years
Source: Authors’ calculation based on statistics department, Bangladesh Bank, 2012
Bangladesh Economic Update, June 2012 15 | P a g e
Under the business as usual scenario, interest payment might increase to USD 226 million in FY 2011-12 and USD 232 million in FY 2012-13. The number of expatriate workers is following an irregular trend over the years. Under the business as usual scenario, remittance might increase to USD 12237.1 million in FY 2011-12 and USD 12823.83 million in FY 2012-13.
Interest payment is increasing over the years. In FY 2001-02, it was USD 161 million and in FY 2004-05, it was USD 203 million which was 16.00 percent higher than that of FY 2003-04. After that, it decreased by 0.99 percent in the following fiscal year and increased in FY 2010-11 at USD 220 million which is 2.33 percent higher than that of FY 2009-10. Under the business as usual scenario, interest payment might increase to USD 226 million in FY 2011-12 and USD 232 million in FY 2012-13. 2.3 Remittance The secondary income is one of the components of current account balance. Of which, remittance is the prominent element to influence the overall balance in an economy and it is one of the most important sources of foreign earnings. According to the World Bank, Bangladesh emerged as the seventh largest remittance earner in FY 2010-11 with the amount of USD 11650.32 million. Bangladesh is a densely populated developing country with large numbers of less skilled and cheap labours. The semi-skilled or unskilled workers are the main source of obtaining more remittance inflow in the country. The number of expatriate workers is following an irregular trend over the years. The number of migrant workers was the highest at 0.98 million in FY 2007-08 and then it continued to decline because of the global economic recession and collapses in the construction sector in the Middle East which declined the demand for external labour in countries such as Malaysia, Saudi Arabia etc. Manpower export increased by 2.85 percent in FY 2010-11 than that of the previous fiscal year. The percentage of labour migration slowed in FY 2010-11 because of the global economic recession, political instability in Middle East and squeezing demand of labour markets. Although the manpower export declined during the period from FY 2007-08 to FY 2010-11, the workers’ remittance is increasing in volume but at a decreasing rate. The growth rate of remittance dropped from 32.39 percent in FY 2007-08 to 6.03 percent in FY 2010-11. Under the business as usual scenario, remittance might increase to USD 12237.1 million in FY 2011-12 and USD 12823.83 million in FY 2012-13. In the first seven months of FY 2011-12, manpower exports were 74 percent higher than that of the same period of the previous year. During the first ten months of this current fiscal year, the remittance flow stood up at USD 10615.75 million which was 10.43 percent higher than that of the previous fiscal year.
Bangladesh Economic Update, June 2012 16 | P a g e
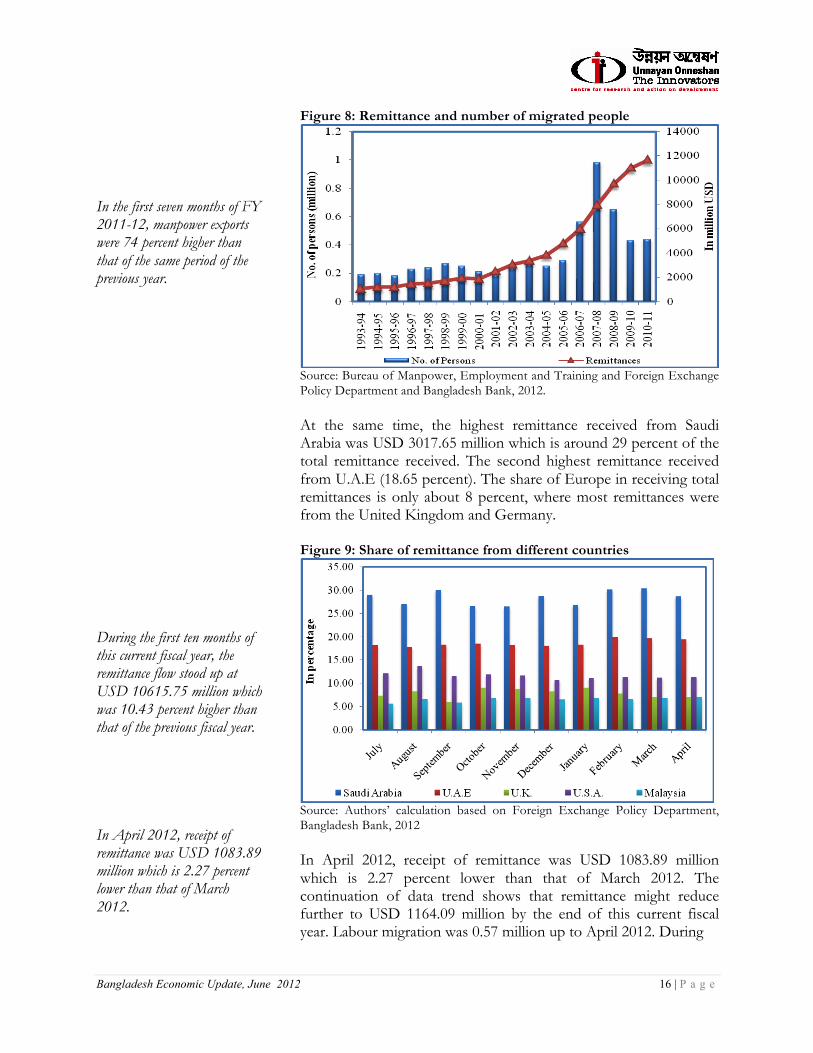
In the first seven months of FY 2011-12, manpower exports were 74 percent higher than that of the same period of the previous year. During the first ten months of this current fiscal year, the remittance flow stood up at USD 10615.75 million which was 10.43 percent higher than that of the previous fiscal year. In April 2012, receipt of remittance was USD 1083.89 million which is 2.27 percent lower than that of March 2012.
Figure 8: Remittance and number of migrated people
Source: Bureau of Manpower, Employment and Training and Foreign Exchange Policy Department and Bangladesh Bank, 2012. At the same time, the highest remittance received from Saudi Arabia was USD 3017.65 million which is around 29 percent of the total remittance received. The second highest remittance received from U.A.E (18.65 percent). The share of Europe in receiving total remittances is only about 8 percent, where most remittances were from the United Kingdom and Germany. Figure 9: Share of remittance from different countries
Source: Authors’ calculation based on Foreign Exchange Policy Department, Bangladesh Bank, 2012 In April 2012, receipt of remittance was USD 1083.89 million which is 2.27 percent lower than that of March 2012. The continuation of data trend shows that remittance might reduce further to USD 1164.09 million by the end of this current fiscal year. Labour migration was 0.57 million up to April 2012. During
Bangladesh Economic Update, June 2012 17 | P a g e
In FY 2011-12, the projection of MTMF, IMF-MEFP, MTBF and the business as usual scenario on remittance was USD 12900 million, USD 12815 million, USD 10020 million and USD 12265.18 million respectively.
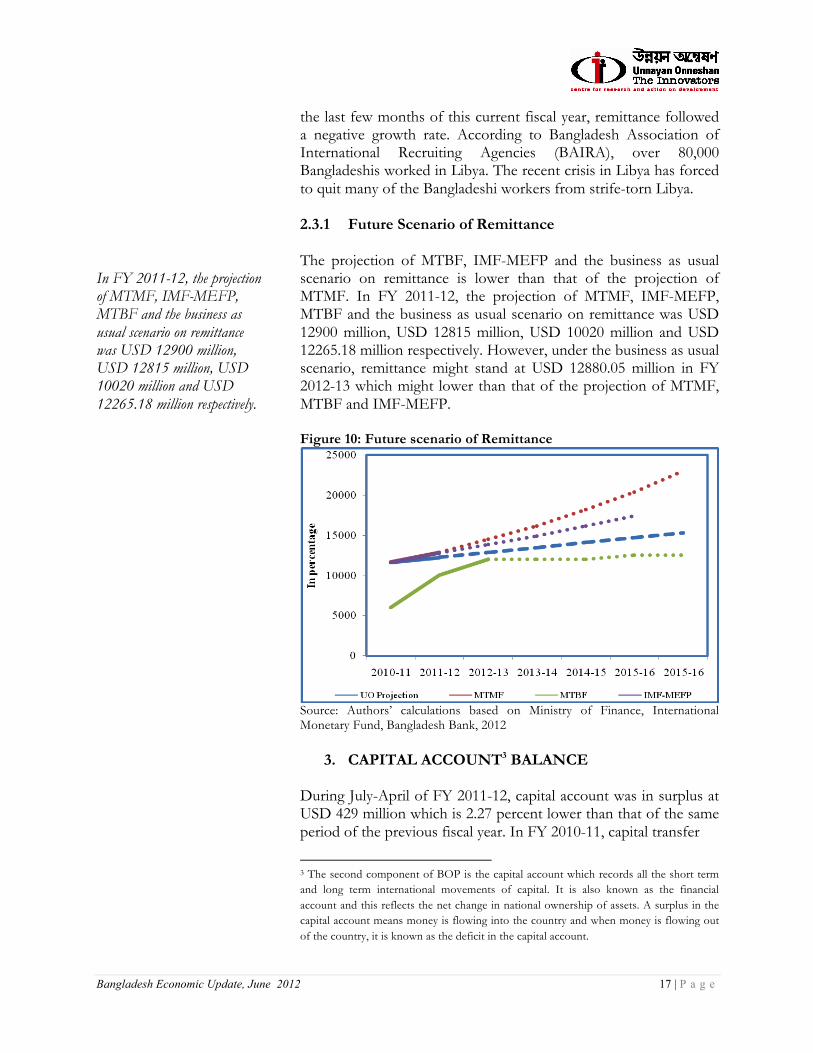
the last few months of this current fiscal year, remittance followed a negative growth rate. According to Bangladesh Association of International Recruiting Agencies (BAIRA), over 80,000 Bangladeshis worked in Libya. The recent crisis in Libya has forced to quit many of the Bangladeshi workers from strife-torn Libya. 2.3.1 Future Scenario of Remittance The projection of MTBF, IMF-MEFP and the business as usual scenario on remittance is lower than that of the projection of MTMF. In FY 2011-12, the projection of MTMF, IMF-MEFP, MTBF and the business as usual scenario on remittance was USD 12900 million, USD 12815 million, USD 10020 million and USD 12265.18 million respectively. However, under the business as usual scenario, remittance might stand at USD 12880.05 million in FY 2012-13 which might lower than that of the projection of MTMF, MTBF and IMF-MEFP. Figure 10: Future scenario of Remittance
Source: Authors’ calculations based on Ministry of Finance, International Monetary Fund, Bangladesh Bank, 2012
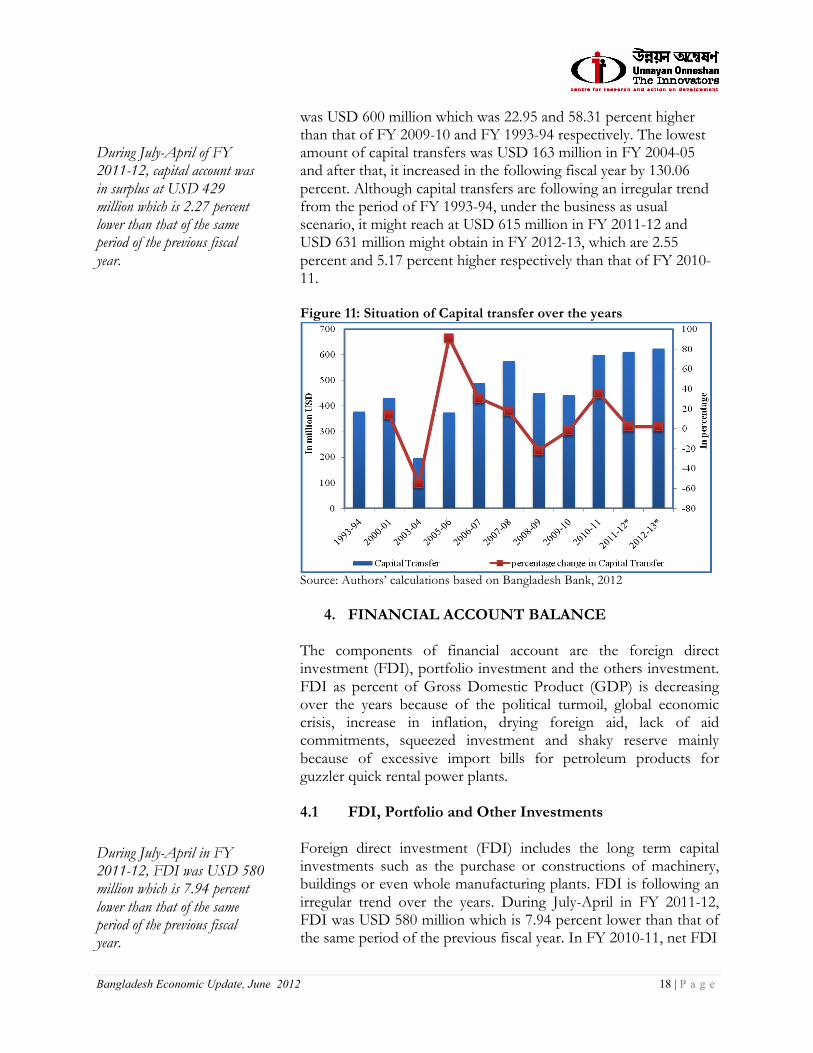
3. CAPITAL ACCOUNT3 BALANCE During July-April of FY 2011-12, capital account was in surplus at USD 429 million which is 2.27 percent lower than that of the same period of the previous fiscal year. In FY 2010-11, capital transfer
3 The second component of BOP is the capital account which records all the short term and long term international movements of capital. It is also known as the financial account and this reflects the net change in national ownership of assets. A surplus in the capital account means money is flowing into the country and when money is flowing out of the country, it is known as the deficit in the capital account.
Bangladesh Economic Update, June 2012 18 | P a g e
During July-April of FY 2011-12, capital account was in surplus at USD 429 million which is 2.27 percent lower than that of the same period of the previous fiscal year. During July-April in FY 2011-12, FDI was USD 580 million which is 7.94 percent lower than that of the same period of the previous fiscal year.
was USD 600 million which was 22.95 and 58.31 percent higher than that of FY 2009-10 and FY 1993-94 respectively. The lowest amount of capital transfers was USD 163 million in FY 2004-05 and after that, it increased in the following fiscal year by 130.06 percent. Although capital transfers are following an irregular trend from the period of FY 1993-94, under the business as usual scenario, it might reach at USD 615 million in FY 2011-12 and USD 631 million might obtain in FY 2012-13, which are 2.55 percent and 5.17 percent higher respectively than that of FY 2010-11. Figure 11: Situation of Capital transfer over the years
Source: Authors’ calculations based on Bangladesh Bank, 2012
4. FINANCIAL ACCOUNT BALANCE The components of financial account are the foreign direct investment (FDI), portfolio investment and the others investment. FDI as percent of Gross Domestic Product (GDP) is decreasing over the years because of the political turmoil, global economic crisis, increase in inflation, drying foreign aid, lack of aid commitments, squeezed investment and shaky reserve mainly because of excessive import bills for petroleum products for guzzler quick rental power plants. 4.1 FDI, Portfolio and Other Investments Foreign direct investment (FDI) includes the long term capital investments such as the purchase or constructions of machinery, buildings or even whole manufacturing plants. FDI is following an irregular trend over the years. During July-April in FY 2011-12, FDI was USD 580 million which is 7.94 percent lower than that of the same period of the previous fiscal year. In FY 2010-11, net FDI
Bangladesh Economic Update, June 2012 19 | P a g e
Under the business as usual scenario, net FDI might reach at USD 806 million in FY 2011-12 and USD 843 million in FY 2012-13. Portfolio investment was in deficit at USD 142 million during July-April in FY 2011-12, which is in deficit in the same period of the previous fiscal year. Under the business as usual scenario, net other investment might decline to USD 2787.6 million in FY 2012-13.
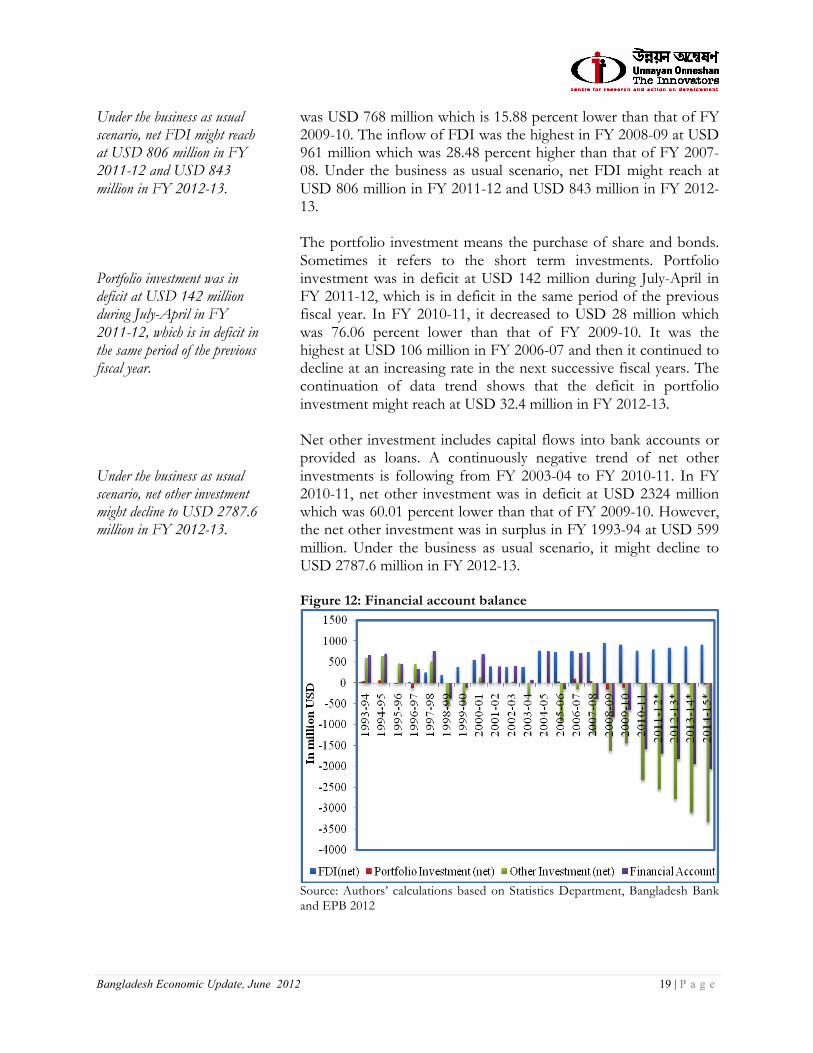
was USD 768 million which is 15.88 percent lower than that of FY 2009-10. The inflow of FDI was the highest in FY 2008-09 at USD 961 million which was 28.48 percent higher than that of FY 2007-08. Under the business as usual scenario, net FDI might reach at USD 806 million in FY 2011-12 and USD 843 million in FY 2012-13. The portfolio investment means the purchase of share and bonds. Sometimes it refers to the short term investments. Portfolio investment was in deficit at USD 142 million during July-April in FY 2011-12, which is in deficit in the same period of the previous fiscal year. In FY 2010-11, it decreased to USD 28 million which was 76.06 percent lower than that of FY 2009-10. It was the highest at USD 106 million in FY 2006-07 and then it continued to decline at an increasing rate in the next successive fiscal years. The continuation of data trend shows that the deficit in portfolio investment might reach at USD 32.4 million in FY 2012-13. Net other investment includes capital flows into bank accounts or provided as loans. A continuously negative trend of net other investments is following from FY 2003-04 to FY 2010-11. In FY 2010-11, net other investment was in deficit at USD 2324 million which was 60.01 percent lower than that of FY 2009-10. However, the net other investment was in surplus in FY 1993-94 at USD 599 million. Under the business as usual scenario, it might decline to USD 2787.6 million in FY 2012-13. Figure 12: Financial account balance
Source: Authors’ calculations based on Statistics Department, Bangladesh Bank and EPB 2012
Bangladesh Economic Update, June 2012 20 | P a g e
Under the business as usual scenario, the deficit in financial account might reach at USD 1703.3 million in FY 2011-12 and USD 1822.6 million in FY 2012-13. Foreign exchange reserve is increasing at a decreasing rate over the years due to soaring import bills, the global financial crisis, economic slowdown and higher rate of inflation. Under the business as usual scenario, reserve might reach at USD 11389.29 million and USD 11866.97 million in FY 2011-12 and FY 2012-13 respectively. During January-April FY 2011-12, reserve continued to slide down than that of the previous fiscal year due to the steady depreciation of taka, decrease in export earnings, remittance and the upward trend of import bills.
Lower value of net FDI, negative value of portfolio investment and the continuously declining trend of other investments are edging the financial account to further deficit. Under the business as usual scenario, the deficit in financial account might reach at USD 1703.3 million in FY 2011-12 and USD 1822.6 million in FY 2012-13. In FY 2010-11, financial account recorded a deficit of USD 1584 million which was USD 651 million in the corresponding previous fiscal year. In FY 2005-06, the positive trend of net FDI, increase in portfolio investment and the huge declining contribution of net other investments caused the deficit in financial account balance which was USD 141 million and in the next fiscal year, the financial account was in surplus. After then it continued to deficit in financial account balance. 4.2 Foreign Exchange Reserve Foreign exchange reserve is increasing at a decreasing rate over the years due to soaring import bills, the global financial crisis, economic slowdown and higher rate of inflation. Other factors associated are the depreciation of Taka against USD and the increase in debt and deficit cornered the reserve to decline in the current fiscal year. In FY 2010-11, foreign exchange reserve increased by only 1.51 percent than that of the previous fiscal year. It is only 0.14 percent of the total GDP which was 0.15 percent in FY 2009-10. In 1990s, the average foreign exchange reserve was USD 1949.33 million which was USD 5352.95 million in the next decade of 2000s. This also shows that average reserve increased by 174.60 percent in 2000s from the decade of 1990s. The regime wise trend of reserve shows that it was USD 2701.53 million during FY 2002-03 to FY 2004-05 while it increased to USD 11016.86 million during FY 2009-10 to FY 2011-12. Under the business as usual scenario, reserve might reach at USD 11389.29 million and USD 11866.97 million in FY 2011-12 and FY 2012-13 respectively, which states that the incremental growth rate of foreign exchange reserve might shrink in the upcoming fiscal years due to the recent slower rate of remittance inflow and upward trend of petroleum imports. During January-April FY 2011-12, reserve continued to slide down than that of the previous fiscal year due to the steady depreciation of taka, decrease in export earnings, remittance and the upward trend of import bills. After clearing the monthly payments of ACU (Asian Clearing Union), foreign exchange reserve dropped by 6.59 percent in May 2012 than that of the previous month of this current fiscal year. Moreover, reserve increased in April 2012 as the first installment (USD 141 million) of USD 987 million has already disbursed by International Monetary Fund. However, the
Bangladesh Economic Update, June 2012 21 | P a g e
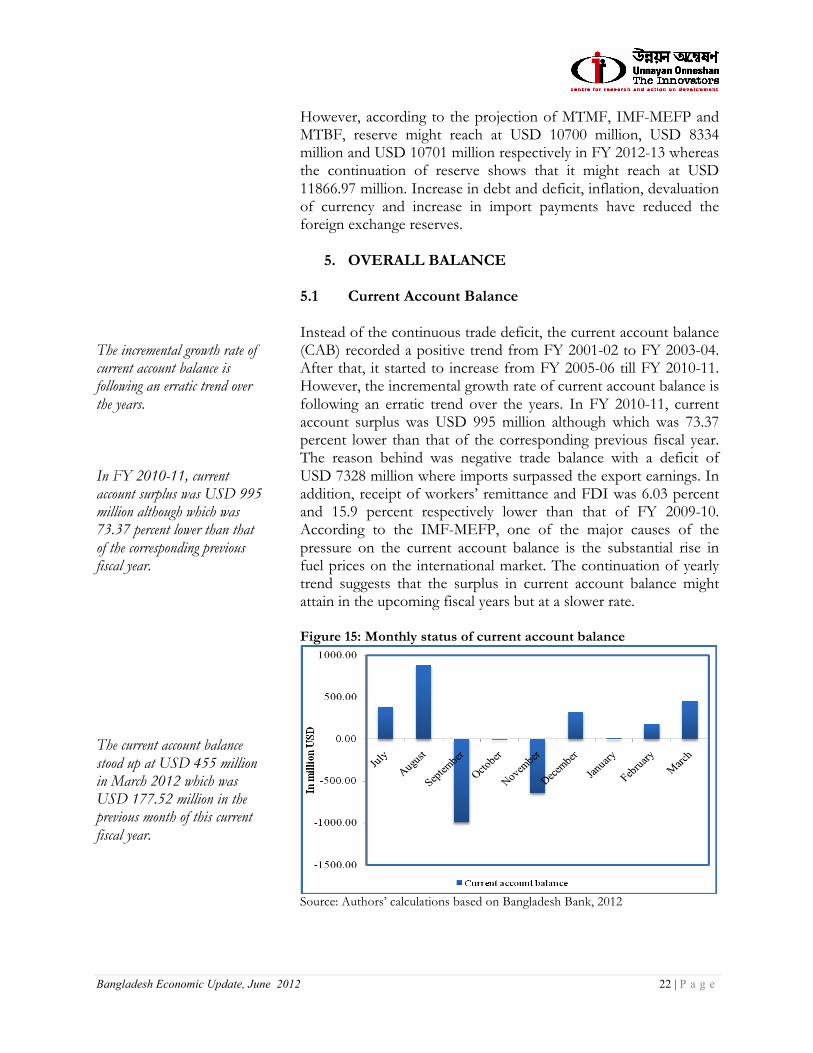
The reserve might reach at USD 11389.29 million under the business as usual scenario and it might stand at USD 9110 million and USD 9700 million according to the projection of IMF-MEFP and MTMF respectively in FY 2011-12.
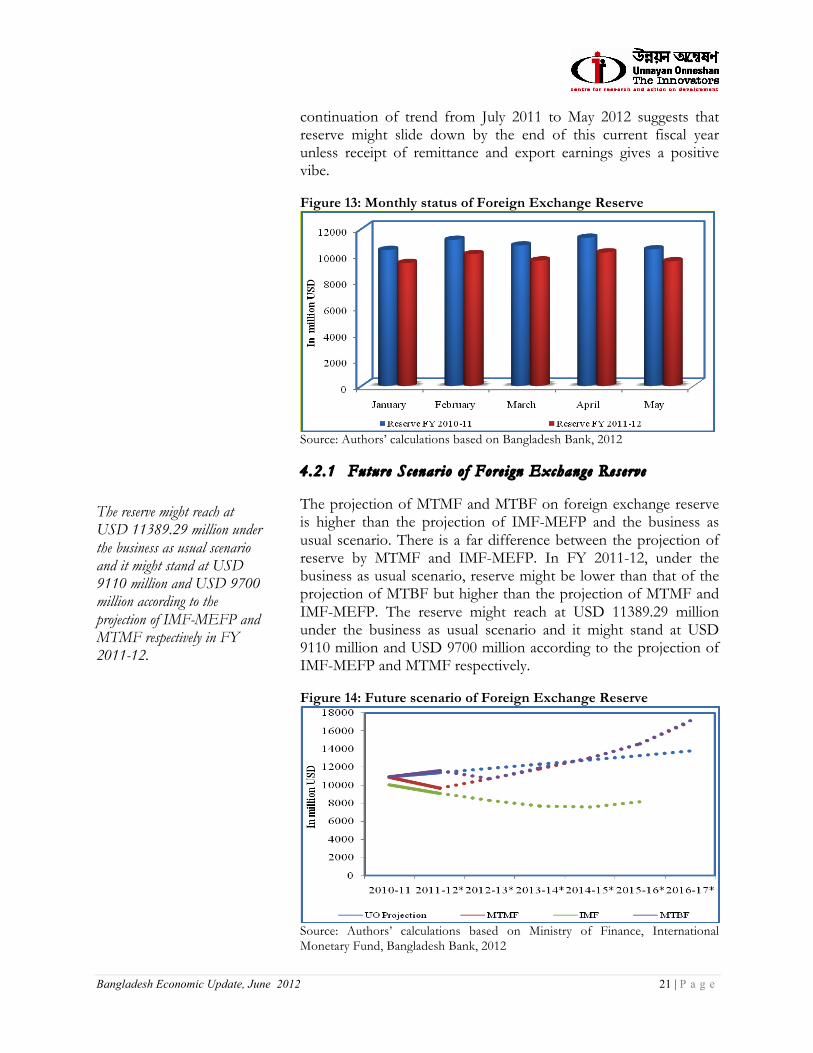
continuation of trend from July 2011 to May 2012 suggests that reserve might slide down by the end of this current fiscal year unless receipt of remittance and export earnings gives a positive vibe. Figure 13: Monthly status of Foreign Exchange Reserve
Source: Authors’ calculations based on Bangladesh Bank, 2012 4.2.1 Future Scenario o f Fore ign Exchange Reserve The projection of MTMF and MTBF on foreign exchange reserve is higher than the projection of IMF-MEFP and the business as usual scenario. There is a far difference between the projection of reserve by MTMF and IMF-MEFP. In FY 2011-12, under the business as usual scenario, reserve might be lower than that of the projection of MTBF but higher than the projection of MTMF and IMF-MEFP. The reserve might reach at USD 11389.29 million under the business as usual scenario and it might stand at USD 9110 million and USD 9700 million according to the projection of IMF-MEFP and MTMF respectively. Figure 14: Future scenario of Foreign Exchange Reserve
Source: Authors’ calculations based on Ministry of Finance, International Monetary Fund, Bangladesh Bank, 2012
Bangladesh Economic Update, June 2012 22 | P a g e
The incremental growth rate of current account balance is following an erratic trend over the years. In FY 2010-11, current account surplus was USD 995 million although which was 73.37 percent lower than that of the corresponding previous fiscal year. The current account balance stood up at USD 455 million in March 2012 which was USD 177.52 million in the previous month of this current fiscal year.
However, according to the projection of MTMF, IMF-MEFP and MTBF, reserve might reach at USD 10700 million, USD 8334 million and USD 10701 million respectively in FY 2012-13 whereas the continuation of reserve shows that it might reach at USD 11866.97 million. Increase in debt and deficit, inflation, devaluation of currency and increase in import payments have reduced the foreign exchange reserves.
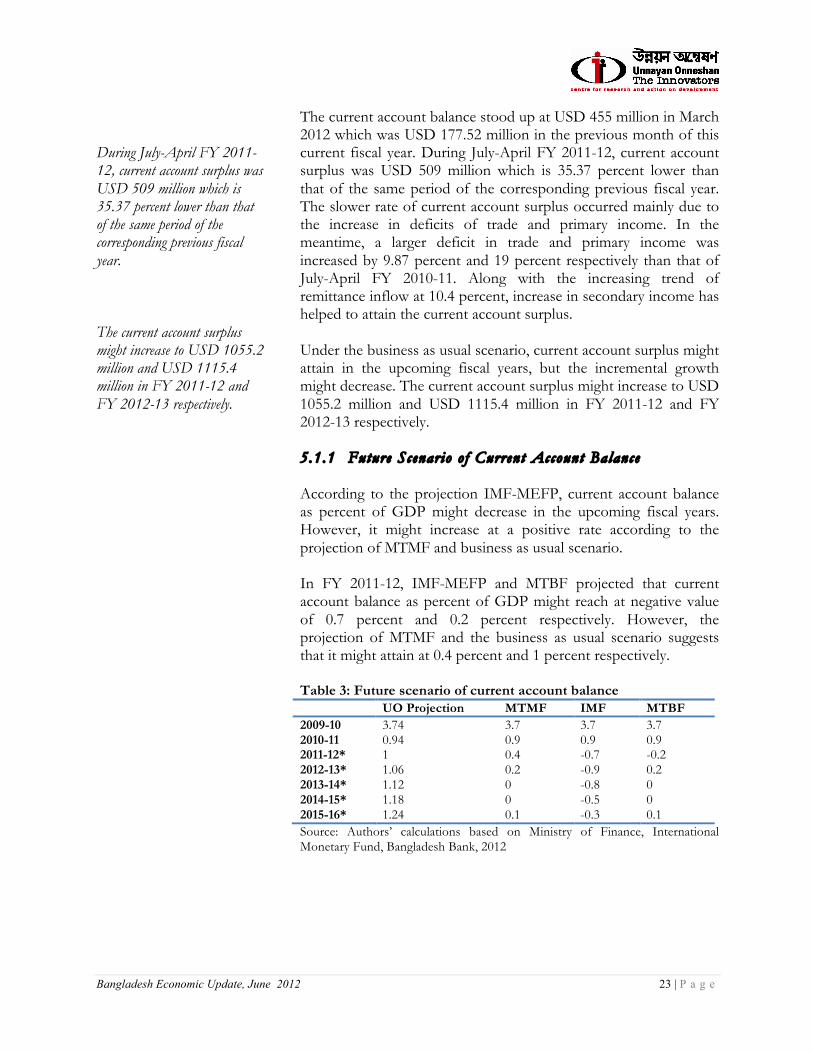
5. OVERALL BALANCE 5.1 Current Account Balance Instead of the continuous trade deficit, the current account balance (CAB) recorded a positive trend from FY 2001-02 to FY 2003-04. After that, it started to increase from FY 2005-06 till FY 2010-11. However, the incremental growth rate of current account balance is following an erratic trend over the years. In FY 2010-11, current account surplus was USD 995 million although which was 73.37 percent lower than that of the corresponding previous fiscal year. The reason behind was negative trade balance with a deficit of USD 7328 million where imports surpassed the export earnings. In addition, receipt of workers’ remittance and FDI was 6.03 percent and 15.9 percent respectively lower than that of FY 2009-10. According to the IMF-MEFP, one of the major causes of the pressure on the current account balance is the substantial rise in fuel prices on the international market. The continuation of yearly trend suggests that the surplus in current account balance might attain in the upcoming fiscal years but at a slower rate. Figure 15: Monthly status of current account balance
Source: Authors’ calculations based on Bangladesh Bank, 2012
Bangladesh Economic Update, June 2012 23 | P a g e
During July-April FY 2011-12, current account surplus was USD 509 million which is 35.37 percent lower than that of the same period of the corresponding previous fiscal year. The current account surplus might increase to USD 1055.2 million and USD 1115.4 million in FY 2011-12 and FY 2012-13 respectively.
The current account balance stood up at USD 455 million in March 2012 which was USD 177.52 million in the previous month of this current fiscal year. During July-April FY 2011-12, current account surplus was USD 509 million which is 35.37 percent lower than that of the same period of the corresponding previous fiscal year. The slower rate of current account surplus occurred mainly due to the increase in deficits of trade and primary income. In the meantime, a larger deficit in trade and primary income was increased by 9.87 percent and 19 percent respectively than that of July-April FY 2010-11. Along with the increasing trend of remittance inflow at 10.4 percent, increase in secondary income has helped to attain the current account surplus. Under the business as usual scenario, current account surplus might attain in the upcoming fiscal years, but the incremental growth might decrease. The current account surplus might increase to USD 1055.2 million and USD 1115.4 million in FY 2011-12 and FY 2012-13 respectively. 5.1.1 Future Scenario o f Current Account Balance According to the projection IMF-MEFP, current account balance as percent of GDP might decrease in the upcoming fiscal years. However, it might increase at a positive rate according to the projection of MTMF and business as usual scenario. In FY 2011-12, IMF-MEFP and MTBF projected that current account balance as percent of GDP might reach at negative value of 0.7 percent and 0.2 percent respectively. However, the projection of MTMF and the business as usual scenario suggests that it might attain at 0.4 percent and 1 percent respectively. Table 3: Future scenario of current account balance UO Projection MTMF IMF MTBF 2009-10 3.74 3.7 3.7 3.7 2010-11 0.94 0.9 0.9 0.9 2011-12* 1 0.4 -0.7 -0.2 2012-13* 1.06 0.2 -0.9 0.2 2013-14* 1.12 0 -0.8 0 2014-15* 1.18 0 -0.5 0 2015-16* 1.24 0.1 -0.3 0.1 Source: Authors’ calculations based on Ministry of Finance, International Monetary Fund, Bangladesh Bank, 2012
Bangladesh Economic Update, June 2012 24 | P a g e
Under the business as usual scenario, capital account might reach at USD 612.3 million in FY 2011-12 and USD 624.6million in FY 2012-13. The continuation of the data trend showed that financial account deficit might increase to USD 1709.2 million in FY 2011-12 and USD 1834.3 million in FY 2012-13.
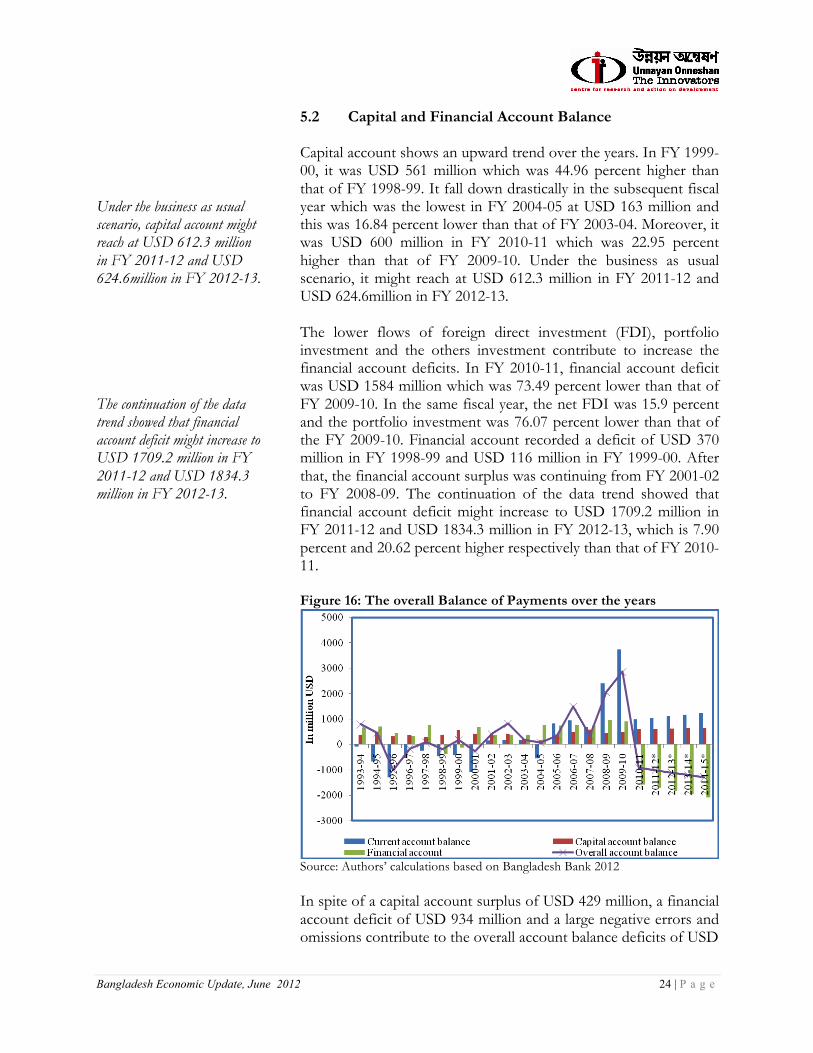
5.2 Capital and Financial Account Balance Capital account shows an upward trend over the years. In FY 1999-00, it was USD 561 million which was 44.96 percent higher than that of FY 1998-99. It fall down drastically in the subsequent fiscal year which was the lowest in FY 2004-05 at USD 163 million and this was 16.84 percent lower than that of FY 2003-04. Moreover, it was USD 600 million in FY 2010-11 which was 22.95 percent higher than that of FY 2009-10. Under the business as usual scenario, it might reach at USD 612.3 million in FY 2011-12 and USD 624.6million in FY 2012-13. The lower flows of foreign direct investment (FDI), portfolio investment and the others investment contribute to increase the financial account deficits. In FY 2010-11, financial account deficit was USD 1584 million which was 73.49 percent lower than that of FY 2009-10. In the same fiscal year, the net FDI was 15.9 percent and the portfolio investment was 76.07 percent lower than that of the FY 2009-10. Financial account recorded a deficit of USD 370 million in FY 1998-99 and USD 116 million in FY 1999-00. After that, the financial account surplus was continuing from FY 2001-02 to FY 2008-09. The continuation of the data trend showed that financial account deficit might increase to USD 1709.2 million in FY 2011-12 and USD 1834.3 million in FY 2012-13, which is 7.90 percent and 20.62 percent higher respectively than that of FY 2010-11. Figure 16: The overall Balance of Payments over the years
Source: Authors’ calculations based on Bangladesh Bank 2012 In spite of a capital account surplus of USD 429 million, a financial account deficit of USD 934 million and a large negative errors and omissions contribute to the overall account balance deficits of USD
Bangladesh Economic Update, June 2012 25 | P a g e
106 million during July-April of FY 2011-12 against a deficit of USD 502 million during July-April of 2010-11. For the first time in a decade, the overall balance of payments (BOP) slipped into a deficit in FY 2010-11.
6. IMPACTS OF IMF-MEFP In order to overcome the imbalances of balance of payments (BOP) and to restore macroeconomic stability, the government has received loan of SDR 639.96 million (about USD 1.0 billion) for three years under the Extended Credit Facility (ECF) by the IMF-MEFP (International Monetary Fund – Memorandum on Economic and Financial Policies). The IMF-MEFP asserts a combination of different conditionalities with four reforms. In order to boost up the social and development-related spending and improve the trade balance, the IMF-MEFP asserts the flexibility in exchange rates using demand-supply mechanism and to tighten further the monetary policy stance. IMF-MEFP requires more efforts to raise export (and other) earnings and reduce import payments, or more generally to reduce aggregate demand. Recent months of this current fiscal year, the depreciation of taka against dollars is increasing. According to IMF-MEFP, it is further necessary to depreciate Taka against dollars and to take different measures of imports restrictions if remittances and foreign assistance do not maintain the required growth. Moreover, the flexibility of exchange rate by the requirement of IMF-MEFP might not only increase the import bills but also create pressure on balance of payment. Automatically this might decelerate the foreign exchange reserve. From the beginning of this current fiscal year, the central bank has been following contractionary monetary policy to rein in higher rate of inflation, and this is in line with the IMF-MEFP policies. Under the ECF loan, the IMF-MEFP has asserted to increase the rate of interest. Another condition is to limit bank borrowing and set a ceiling on the reserve money held by Bangladesh Bank (BB). Ultimately this would increase the investment cost and monetary squeeze would decline the domestic investment. This slower rate of investment would not only decline in generation of employment but also reduce aggregate demand. Thus this contractionary monetary policy as pursued by the Bangladesh Bank may result in a reduced GDP growth rate in the upcoming fiscal years. The central bank may resort to further devaluation of taka and administer reduction in imports, if supply of foreign currencies from sources such as remittances does not keep up considerable
Bangladesh Economic Update, June 2012 26 | P a g e
growth momentum nor the government anticipated flow of foreign aid is materialised. The restrictive monetary targets, agreed in the IMF-MEFP, have in effect reduced the fiscal space of the government, demonstrated in the recently approved national budget of 2012-2013. The choice of instruments of resource mobilisation for deficit financing and public spending has been limited to regressive instruments such as raise in value added tax (VAT).
7. CONCLUSION Soaring import bills particularly for quick rental power plants and sluggish rate of export earnings has widened trade deficit in the recent fiscal years. The declining import of capital machineries and intermediate goods has further aggravated the growth prospects of the country. Depreciation of local currency against USD, low foreign exchange reserve and downward trend of incremental growth rate of remittance receipt have also exerted pressure on the balance of payment of the country. Deficits of trade and primary income, lower value of net FDI, negative value of portfolio investment and the continuously declining trend of other investments along with negative errors and omissions contribute to the overall account balance deficits in FY 2010-11 which might increase further in the upcoming years.
Bangladesh Economic Update, June 2012 27 | P a g e
References Bangladesh Bank. 2012, Major Economic Indicators. Dhaka, Bangladesh: Bangladesh Bank. Bangladesh Bank. 2012, Selected Indicators. Dhaka, Bangladesh: Bangladesh Bank. Chowdhury, F. A., Hossain, A., Chowdhury, M. 2011. IMF’s Loan and its Implications on Bangladesh
Economy. Bangladesh Economic Update, March 2011, Vol. 2, No. 2. Dhaka, Bangladesh: Unnayan Onneshan. Available at: http://www.unnayan.org/reports/meu/mar_11/meu_Mar_2011.pdf [Accessed 12 June 2012]
Fan, E.X., 2002, Implications of a US Dollar Depreciation for Asian Developing Countries. November 2002,
ERD policy brief NO. 11. Philippines: Asian Development Bank. Available at: http://openlibrary.org/works/OL5811327W/Implications_of_a_US_dollar_depreciation_for_Asian_developing_countries. [Accessed 2 June 2012]
Hossain, M. A. 2011, Impact of Foreign Direct Investment on Bangladesh’s Balance of Payments: Some Policy
Implications. Bangladesh. Available at: http://notunprojonmo.com/wp-content/uploads/2011/07/E18-pn0805.pdf [Accessed 4 June 2012]
International Monetary Fund (IMF). 2012, Bangladesh: Letter of Intent, Memorandum of Economic and
Financial Policies, and Technical Memorandum of Understanding. Washington DC, USA: International Monetary Fund. Available at: www.imf.org/external/np/loi/2012/bgd/032712.pdf [Accessed 3 May 2012]
International Monetary Fund (IMF). 2012, Bangladesh: Request for a Three-Year Arrangement Under the
Extended Credit Facility. Washington DC, USA: International Monetary Fund. Available at: www.imf.org/external/pubs/ft/scr/2012/cr1294.pdf [Accessed 28 May 2012]
International Monetary Fund (IMF). 2012, Bangladesh: Staff Report for the 2011 Article IV Consultation.
Washington DC, USA: International Monetary Fund. Available at: http://www.imf.org/external/pubs/ft/scr/2011/cr11314.pdf [Accessed 2 June 2012]
Mahmud, W. 2003, Bangladesh: Development Outcomes and Challenges in the Context of Globalization. Dhaka,
Bangladesh. Available at: http://www.google.com/url?sa=t&rct=j&q=&esrc=s&source=web&cd=1&ved=0CEoQFjAA&url=http%3A%2F%2Fwww.ycsg.yale.edu%2Factivities%2Ffiles%2FWahid.doc&ei=i6rmT5iNMsbZtAaMhdHYAQ&usg=AFQjCNFgqo02muGnfpkgsI-pmS5-jH3PaQ. [Accessed 4 April 2012]
Ministry of Finance (MoF). 2012, Bangladesh Economic Review FY 2012-13. Dhaka, Bangladesh:
Finance Division, Ministry of Finance, Government of Bangladesh. Available at: http://www.mof.gov.bd/en/index.php?option=com_content&view=article&id=210&Itemid=1 [Accessed 3 June 2012]
Bangladesh Economic Update, June 2012 28 | P a g e
Ministry of Finance (MoF). 2012, Macroeconomic Scenario. Dhaka, Bangladesh: Finance Division, Ministry of Finance, Government of Bangladesh. Available at: http://www.mof.gov.bd/en/index.php?option=com_content&view=article&id=107&Itemid=1&phpMyAdmin=XRGktGpDJ7v31TJLuZ5xtAQmRx9 [Accessed 3 June 2012]
Ministry of Finance (MoF). 2012, Medium-Term Budgetary Framework (MTBF) 2012-13 to 2016-17.
Dhaka, Bangladesh: Finance Division, Ministry of Finance, Government of Bangladesh. Available at: http://www.mof.gov.bd/en/index.php?option=com_content&view=article&id=208&Itemid=1. [Accessed 3 June 2012]
Ministry of Finance. 2007, Balance of Payments. Pakistan. Available at:
http://www.finance.gov.pk/survey/chapter_10/07_Balance_of_Payments.pdf [Accessed 8 June 2012]
Rajwade, A. V. January 14, 2012. The fall of the Rupee: Background. Economic & Political Weekly
[online] 14 January 2012. Available at: http://www.epw.in/commentary/fall-rupee-background-remedy-and-policy.html [Accessed 12 June 2012].
Rehman, H.U. and Rashid, H.A. 2006, The Balance of Payment Problem in Developing Countries,
Especially in Pakistan. Journal of Commerce, Vol. 1, No. 1, Pp. 31-52. Available at: http://joc.hcc.edu.pk/articlepdf/JOC_Rehman__Rashid_31_52.pdf [Accessed 30 May 2012]
Saleh, A.Z.M., Rahman, K.M.M., Basak, J.K., Sultana, N., Roy, N., Mozdalifa, J., Anik, S.I., Halder,
S.C. and Hossain, M. A. 2012, Faltering Growth: A Rapid Assessment of National Budget 2012-13. June 2012, Vol. 3, No. 5. Dhaka, Bangladesh: Unnayan Onneshan. Available at: http://www.unnayan.org/reports/meu/June_12/MEU_Jun_2012.pdf [Accessed 2 June 2012]
World Bank (WB). 2012, Poverty Reduction and Economic Management, South Asia Region. Washington
DC, USA: World Bank.
Bangladesh Economic Update, June 2012 29 | P a g e
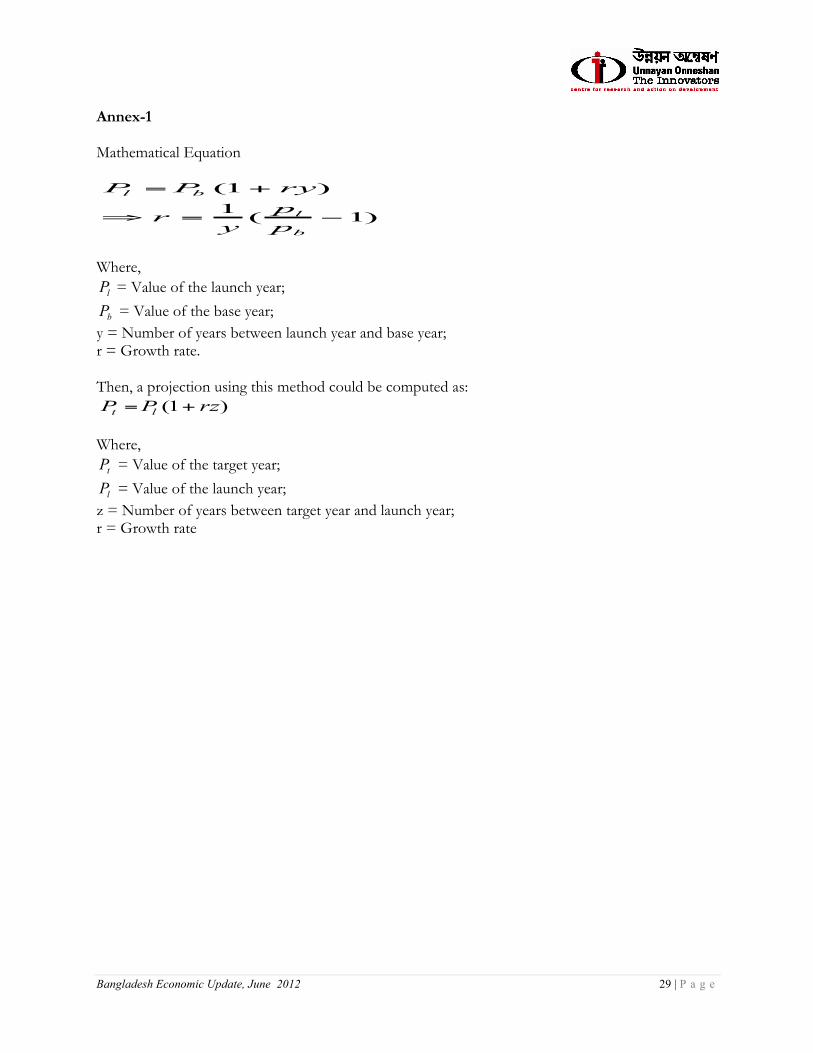
Annex-1 Mathematical Equation
)1(1)1(
−=⇒
+=
b
l
bl
pp
yr
ryPP
Where,
lP = Value of the launch year;
bP = Value of the base year; y = Number of years between launch year and base year; r = Growth rate. Then, a projection using this method could be computed as:
)1( rzPP lt += Where,
tP = Value of the target year;
lP = Value of the launch year; z = Number of years between target year and launch year; r = Growth rate

Bangladesh Economic Update, June 2012 30 | P a g e
Unnayan Onneshan - The Innovators 16/2, Indira Road, Farmgate
Dhaka-1215, Bangladesh Tell: + (880-2) 8158274, 9110636
Fax: + (880-2) 8159135 E-mail: [email protected]
Web: www.unnayan.org