Embed Size (px)
Citation preview
BANKING IN CEE: adequate risk appetite crucial to win the upside
UniCredit Group CEE Strategic Analysis
Vienna, November 9, 2009
2
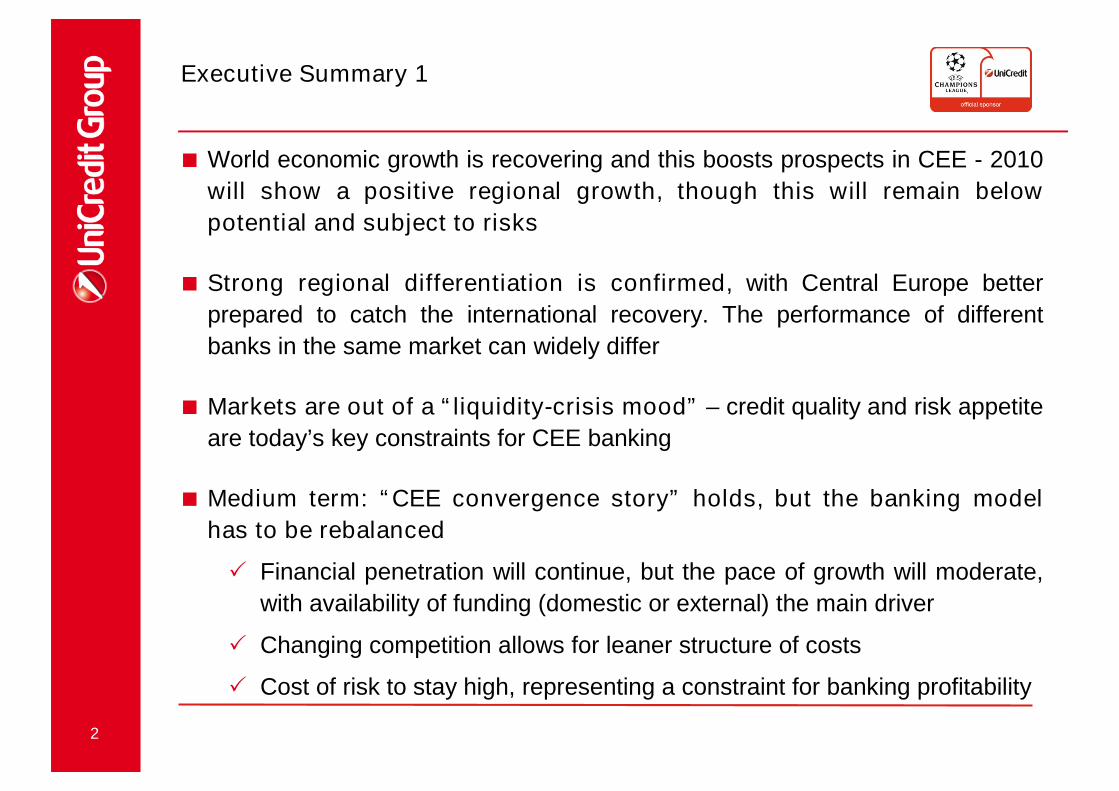
Executive Summary 1
World economic growth is recovering and this boosts prospects in CEE - 2010
will show a positive regional growth, though this will remain below
potential and subject to risks
Strong regional differentiation is confirmed, with Central Europe better
prepared to catch the international recovery. The performance of different
banks in the same market can widely differ
Markets are out of a “liquidity-crisis mood” – credit quality and risk appetite
are today’s key constraints for CEE banking
Medium term: “CEE convergence story” holds, but the banking model
has to be rebalanced
Financial penetration will continue, but the pace of growth will moderate,
with availability of funding (domestic or external) the main driver
Changing competition allows for leaner structure of costs
Cost of risk to stay high, representing a constraint for banking profitability
3
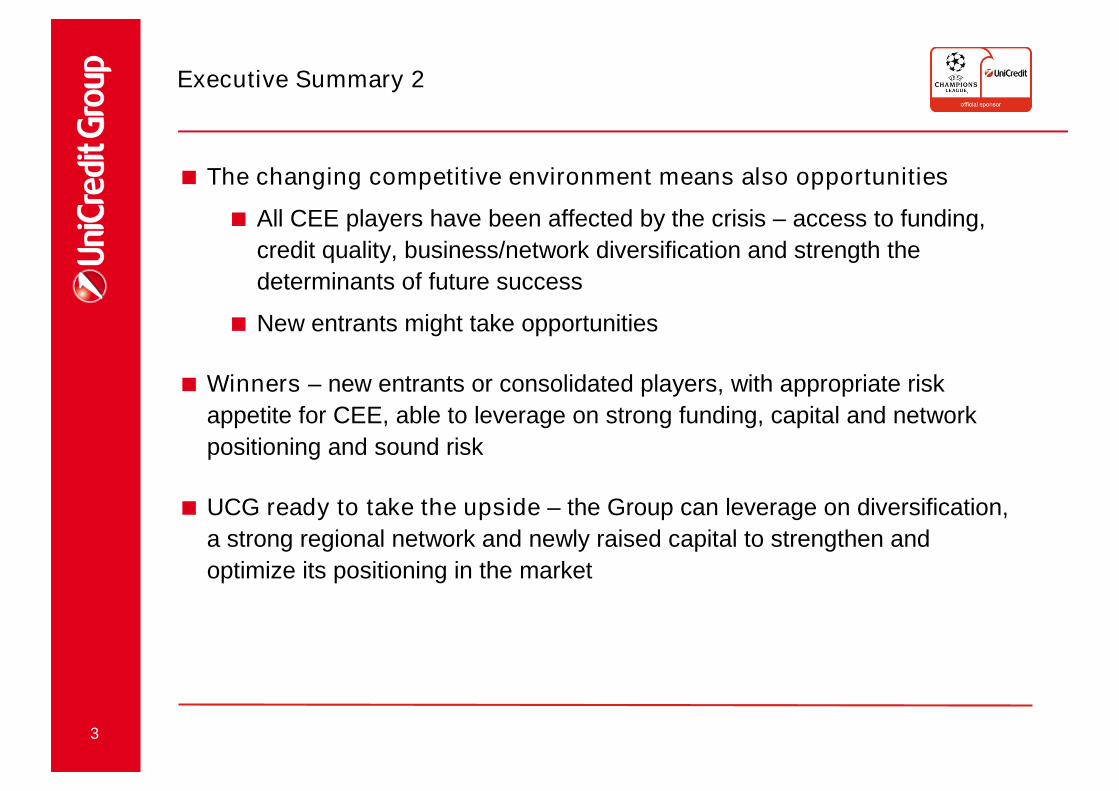
Executive Summary 2
The changing competitive environment means also opportunities
All CEE players have been affected by the crisis – access to funding,
credit quality, business/network diversification and strength the
determinants of future success
New entrants might take opportunities
Winners – new entrants or consolidated players, with appropriate risk
appetite for CEE, able to leverage on strong funding, capital and network
positioning and sound risk
UCG ready to take the upside – the Group can leverage on diversification,
a strong regional network and newly raised capital to strengthen and
optimize its positioning in the market

4
AGENDA
1. How the CEE banking landscape has changed in the short term
2. Banking through the crisis
3. International players - UniCredit ready to take the upside
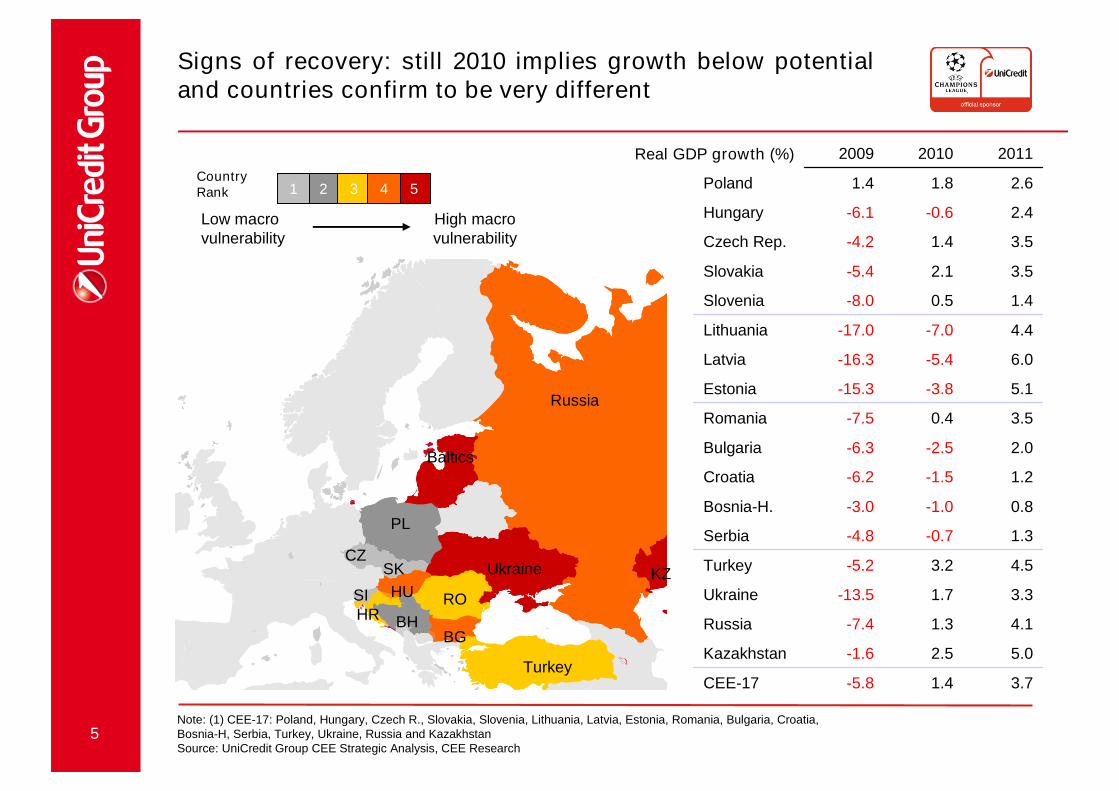
5Note: (1) CEE-17: Poland, Hungary, Czech R., Slovakia, Slovenia, Lithuania, Latvia, Estonia, Romania, Bulgaria, Croatia,Bosnia-H, Serbia, Turkey, Ukraine, Russia and KazakhstanSource: UniCredit Group CEE Strategic Analysis, CEE Research
Signs of recovery: still 2010 implies growth below potentialand countries confirm to be very different
Low macrovulnerability
2 5
High macrovulnerability
3 41CountryRank
PL
SK
Turkey
Russia
CZ
BG
Ukraine
ROHUKZ
Baltics
3.71.4-5.8CEE-17
5.02.5-1.6Kazakhstan
4.11.3-7.4Russia
3.31.7-13.5Ukraine
4.53.2-5.2Turkey
1.3-0.7-4.8Serbia
0.8-1.0-3.0Bosnia-H.
1.2-1.5-6.2Croatia
2.0-2.5-6.3Bulgaria
3.50.4-7.5Romania
5.1-3.8-15.3Estonia
6.0-5.4-16.3Latvia
4.4-7.0-17.0Lithuania
1.40.5-8.0Slovenia
3.52.1-5.4Slovakia
3.51.4-4.2Czech Rep.
2.4-0.6-6.1Hungary
2.61.81.4Poland
201120102009Real GDP growth (%)
HR BH
SI
6
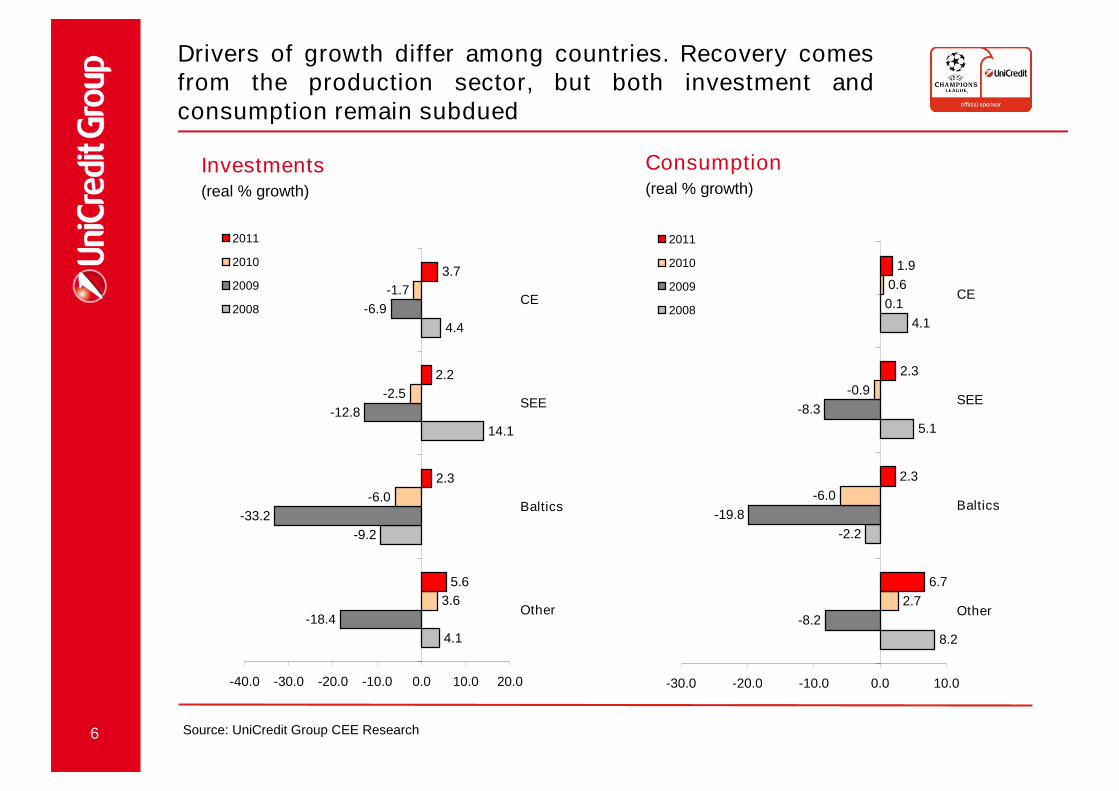
Drivers of growth differ among countries. Recovery comesfrom the production sector, but both investment andconsumption remain subdued
Source: UniCredit Group CEE Research
Investments(real % growth)
Consumption(real % growth)
4.1
-9.2
14.1
4.4
-18.4
-33.2
-12.8
-6.9
3.6
-6.0
-2.5
-1.7
5.6
2.3
2.2
3.7
-40.0 -30.0 -20.0 -10.0 0.0 10.0 20.0
Other
Baltics
SEE
CE
2011
2010
2009
2008
8.2
-2.2
5.1
4.1
-8.2
-19.8
-8.3
0.1
2.7
-6.0
-0.9
0.6
6.7
2.3
2.3
1.9
-30.0 -20.0 -10.0 0.0 10.0
Other
Baltics
SEE
CE
2011
2010
2009
2008
7
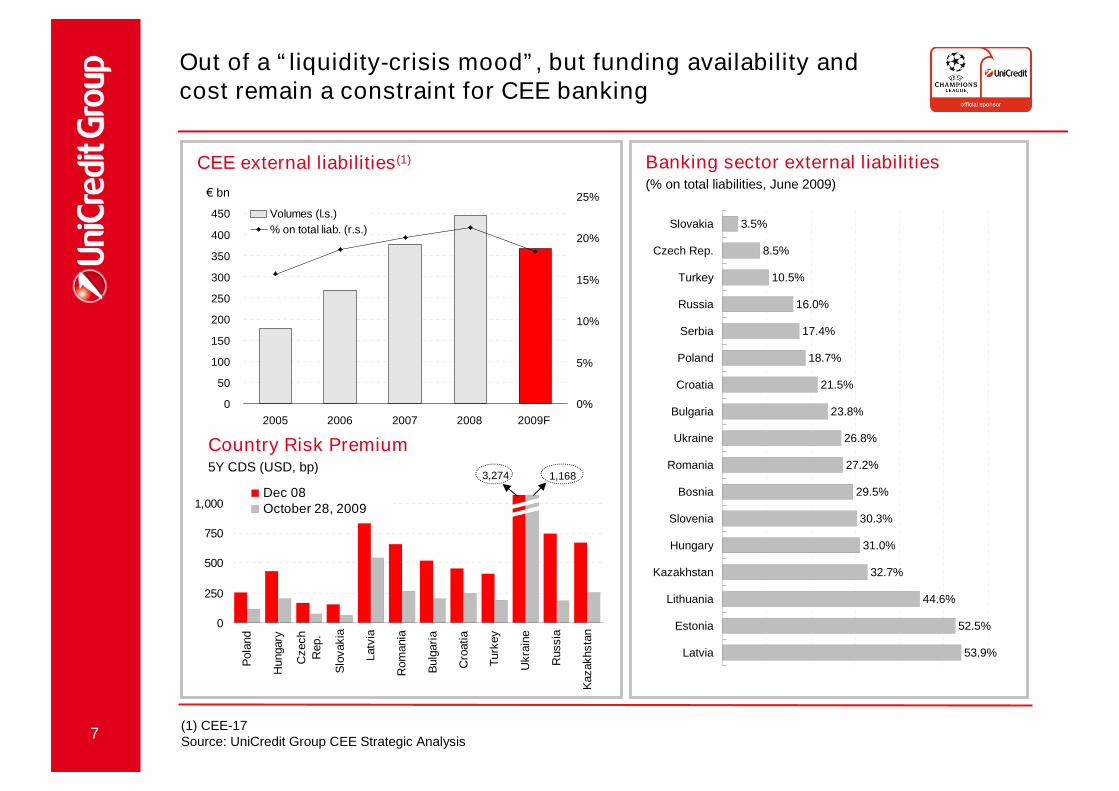
Out of a “liquidity-crisis mood”, but funding availability andcost remain a constraint for CEE banking
0
50
100
150
200
250
300
350
400
450
2005 2006 2007 2008 2009F
0%
5%
10%
15%
20%
25%
Volumes (l.s.)
% on total liab. (r.s.)
0
250
500
750
1,000
Pola
nd
Hungary
Czech
Rep.
Slo
vakia
Latv
ia
Rom
ania
Bulg
ari
a
Cro
atia
Turk
ey
Ukra
ine
Russia
Kazakhsta
n
Dec 08October 28, 2009
Country Risk Premium5Y CDS (USD, bp)
CEE external liabilities(1)
(1) CEE-17Source: UniCredit Group CEE Strategic Analysis
3,274 1,168
€ bn
Banking sector external liabilities(% on total liabilities, June 2009)
3.5%
8.5%
10.5%
16.0%
17.4%
18.7%
21.5%
23.8%
26.8%
27.2%
29.5%
30.3%
31.0%
32.7%
44.6%
52.5%
53.9%
Slovakia
Czech Rep.
Turkey
Russia
Serbia
Poland
Croatia
Bulgaria
Ukraine
Romania
Bosnia
Slovenia
Hungary
Kazakhstan
Lithuania
Estonia
Latvia
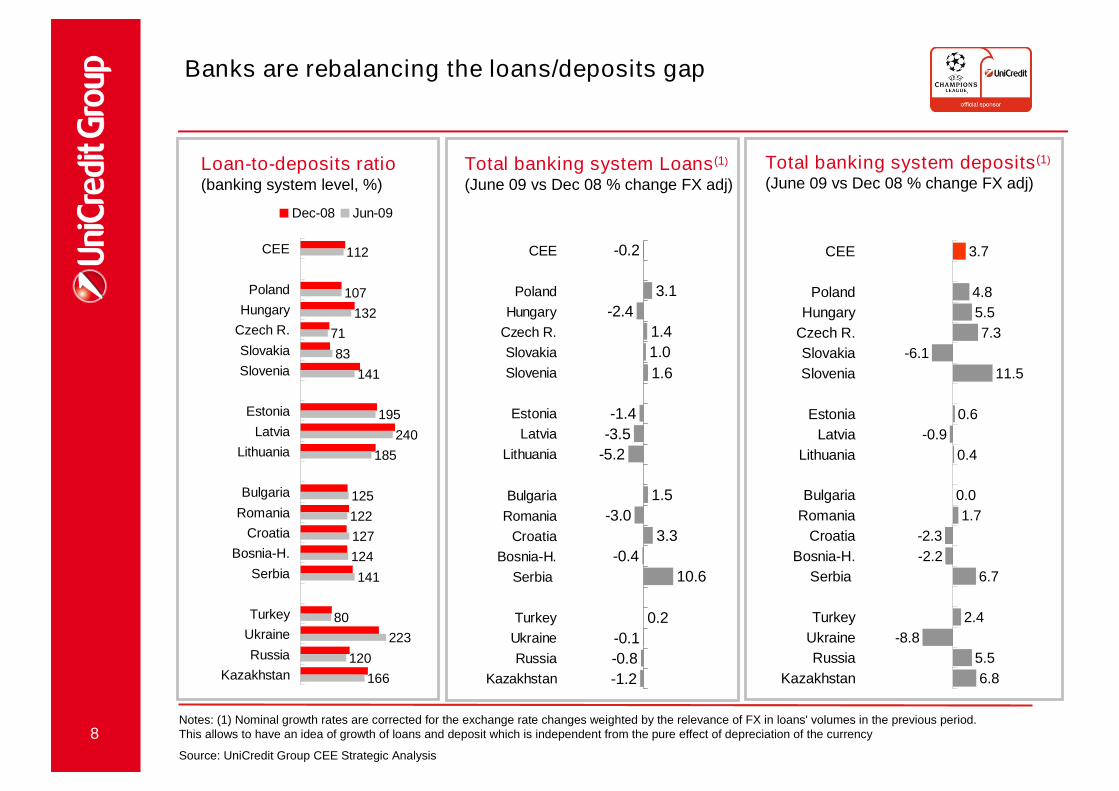
8Notes: (1) Nominal growth rates are corrected for the exchange rate changes weighted by the relevance of FX in loans' volumes in the previous period.This allows to have an idea of growth of loans and deposit which is independent from the pure effect of depreciation of the currency
Source: UniCredit Group CEE Strategic Analysis
Banks are rebalancing the loans/deposits gap
Total banking system deposits(1)
(June 09 vs Dec 08 % change FX adj)
-0.2
-2.4
1.4
1.0
1.6
-1.4
-5.2
1.5
-3.0
3.3
-0.4
0.2
-0.1
-0.8
-1.2
10.6
3.1
-3.5
CEE
Poland
Hungary
Czech R.
Slovakia
Slovenia
Estonia
Latvia
Lithuania
Bulgaria
Romania
Croatia
Bosnia-H.
Serbia
Turkey
Ukraine
Russia
Kazakhstan
112
107
132
71
83
141
195
240
185
125
122
127
124
141
80
223
120
166
CEE
Poland
Hungary
Czech R.
Slovakia
Slovenia
Estonia
Latvia
Lithuania
Bulgaria
Romania
Croatia
Bosnia-H.
Serbia
Turkey
Ukraine
Russia
Kazakhstan
Dec-08 Jun-09
Loan-to-deposits ratio(banking system level, %)
3.7
5.5
7.3
-6.1
11.5
0.6
0.4
0.0
1.7
-2.3
-2.2
6.7
2.4
-8.8
5.5
6.8
4.8
-0.9
CEE
Poland
Hungary
Czech R.
Slovakia
Slovenia
Estonia
Latvia
Lithuania
Bulgaria
Romania
Croatia
Bosnia-H.
Serbia
Turkey
Ukraine
Russia
Kazakhstan
Total banking system Loans(1)
(June 09 vs Dec 08 % change FX adj)
9
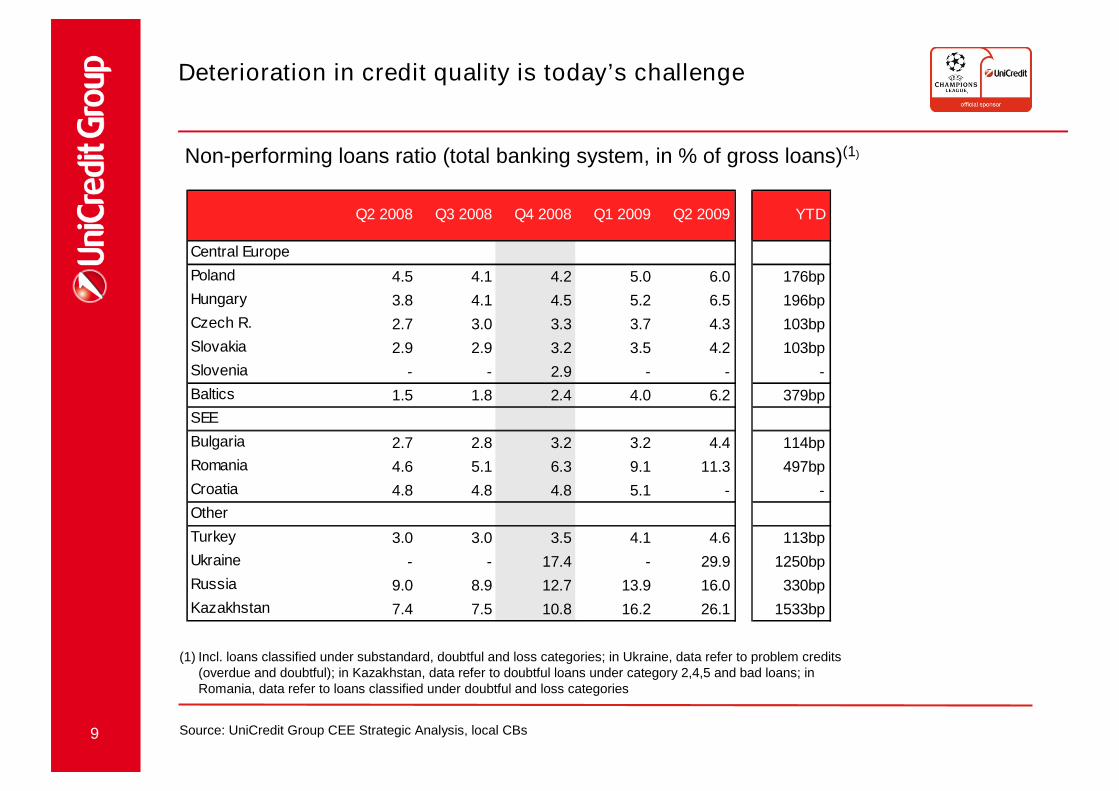
(1) Incl. loans classified under substandard, doubtful and loss categories; in Ukraine, data refer to problem credits(overdue and doubtful); in Kazakhstan, data refer to doubtful loans under category 2,4,5 and bad loans; inRomania, data refer to loans classified under doubtful and loss categories
Source: UniCredit Group CEE Strategic Analysis, local CBs
Non-performing loans ratio (total banking system, in % of gross loans)(1)
Deterioration in credit quality is today’s challenge
Q2 2008 Q3 2008 Q4 2008 Q1 2009 Q2 2009 YTD
Central Europe
Poland 4.5 4.1 4.2 5.0 6.0 176bp
Hungary 3.8 4.1 4.5 5.2 6.5 196bp
Czech R. 2.7 3.0 3.3 3.7 4.3 103bp
Slovakia 2.9 2.9 3.2 3.5 4.2 103bp
Slovenia - - 2.9 - - -
Baltics 1.5 1.8 2.4 4.0 6.2 379bp
SEE
Bulgaria 2.7 2.8 3.2 3.2 4.4 114bp
Romania 4.6 5.1 6.3 9.1 11.3 497bp
Croatia 4.8 4.8 4.8 5.1 - -
Other
Turkey 3.0 3.0 3.5 4.1 4.6 113bp
Ukraine - - 17.4 - 29.9 1250bp
Russia 9.0 8.9 12.7 13.9 16.0 330bp
Kazakhstan 7.4 7.5 10.8 16.2 26.1 1533bp
10
AGENDA
1. How the CEE banking landscape has changed in the short term
2. Banking through the crisis
3. International players - UniCredit ready to take the upside
11
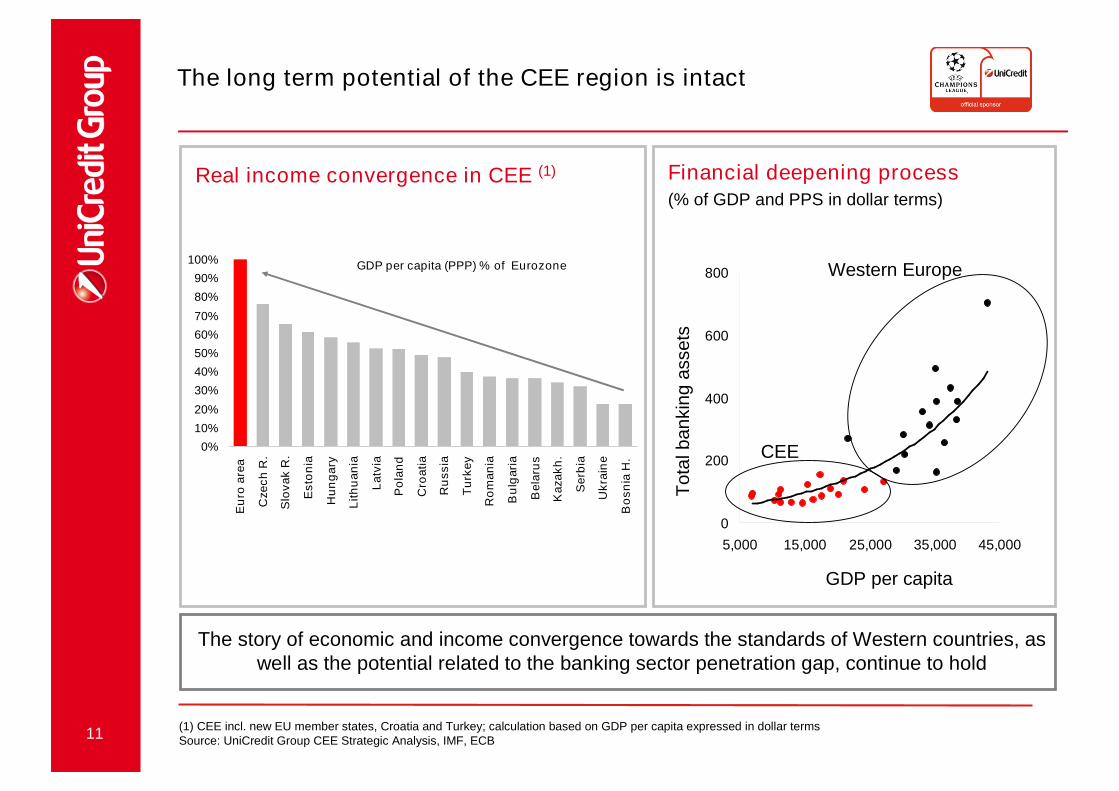
The long term potential of the CEE region is intact
Real income convergence in CEE (1)
(1) CEE incl. new EU member states, Croatia and Turkey; calculation based on GDP per capita expressed in dollar termsSource: UniCredit Group CEE Strategic Analysis, IMF, ECB
0
200
400
600
800
5,000 15,000 25,000 35,000 45,000
Financial deepening process(% of GDP and PPS in dollar terms)
GDP per capita
Tota
lbankin
gassets
Western Europe
CEE
The story of economic and income convergence towards the standards of Western countries, aswell as the potential related to the banking sector penetration gap, continue to hold
0%
10%
20%
30%
40%
50%
60%
70%
80%
90%
100%
Eu
roa
rea
Cze
ch
R.
Slo
va
kR
.
Es
ton
ia
Hu
ng
ary
Lit
hu
an
ia
La
tvia
Po
lan
d
Cro
ati
a
Ru
ss
ia
Tu
rke
y
Ro
ma
nia
Bu
lgari
a
Be
laru
s
Ka
za
kh
.
Se
rbia
Uk
rain
e
Bo
sn
iaH
.
GDP per capita (PPP) % of Eurozone
12
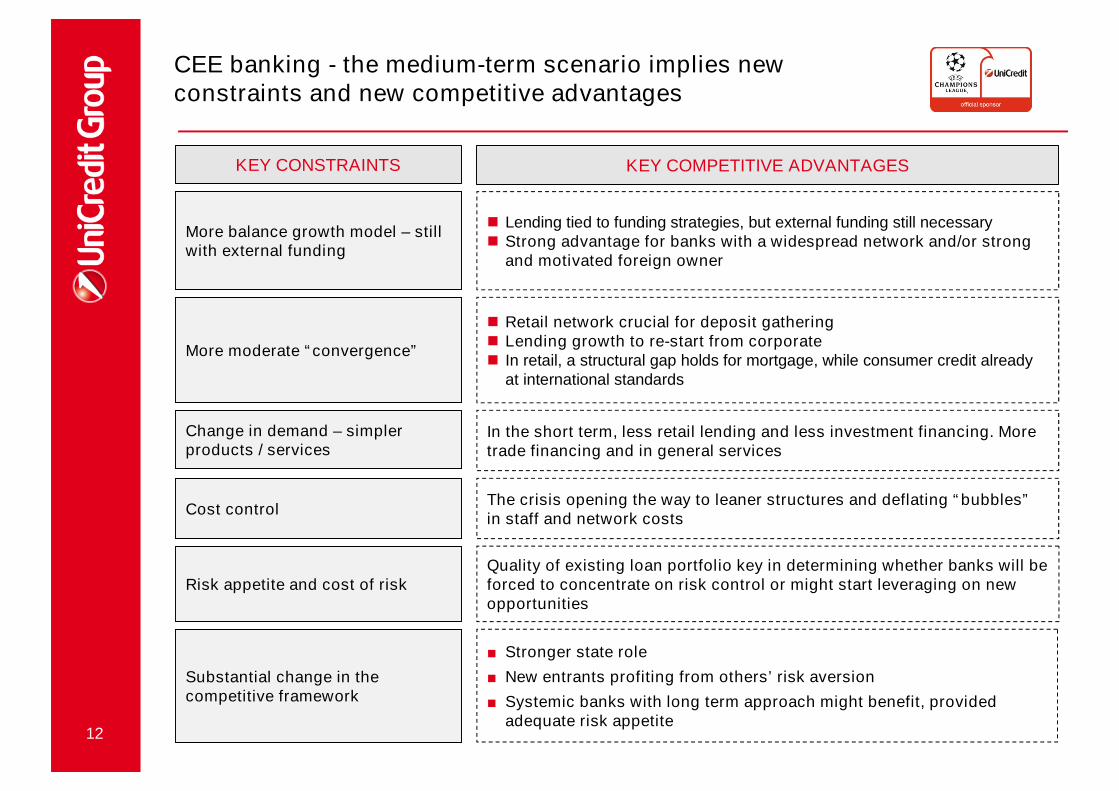
KEY COMPETITIVE ADVANTAGES
More balance growth model – stillwith external funding
Lending tied to funding strategies, but external funding still necessary Strong advantage for banks with a widespread network and/or strong
and motivated foreign owner
More moderate “convergence”
Retail network crucial for deposit gathering Lending growth to re-start from corporate In retail, a structural gap holds for mortgage, while consumer credit already
at international standards
Change in demand – simplerproducts / services
In the short term, less retail lending and less investment financing. Moretrade financing and in general services
Risk appetite and cost of riskQuality of existing loan portfolio key in determining whether banks will beforced to concentrate on risk control or might start leveraging on newopportunities
KEY CONSTRAINTS
CEE banking - the medium-term scenario implies newconstraints and new competitive advantages
Cost controlThe crisis opening the way to leaner structures and deflating “bubbles”in staff and network costs
Substantial change in thecompetitive framework
■ Stronger state role
■ New entrants profiting from others’ risk aversion
■ Systemic banks with long term approach might benefit, providedadequate risk appetite
13
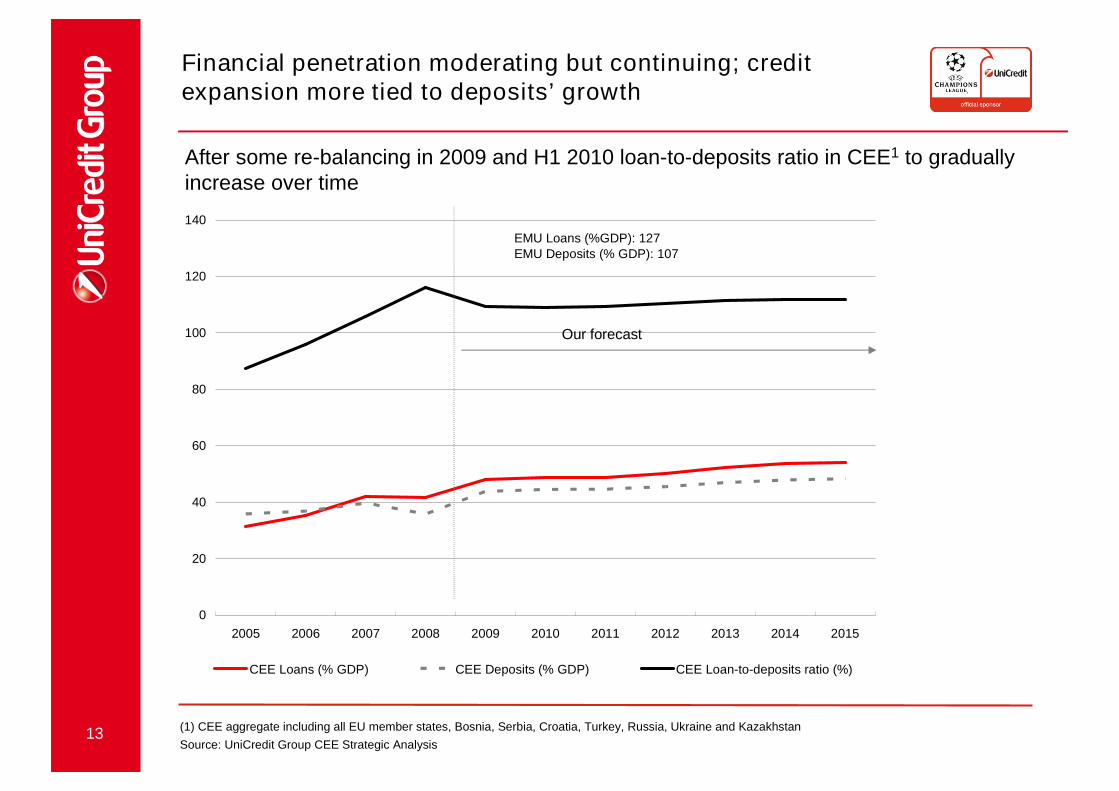
Financial penetration moderating but continuing; creditexpansion more tied to deposits’ growth
(1) CEE aggregate including all EU member states, Bosnia, Serbia, Croatia, Turkey, Russia, Ukraine and Kazakhstan
Source: UniCredit Group CEE Strategic Analysis
After some re-balancing in 2009 and H1 2010 loan-to-deposits ratio in CEE1 to graduallyincrease over time
0
20
40
60
80
100
120
140
2005 2006 2007 2008 2009 2010 2011 2012 2013 2014 2015
CEE Loans (% GDP) CEE Deposits (% GDP) CEE Loan-to-deposits ratio (%)
EMU Loans (%GDP): 127EMU Deposits (% GDP): 107
Our forecast
14
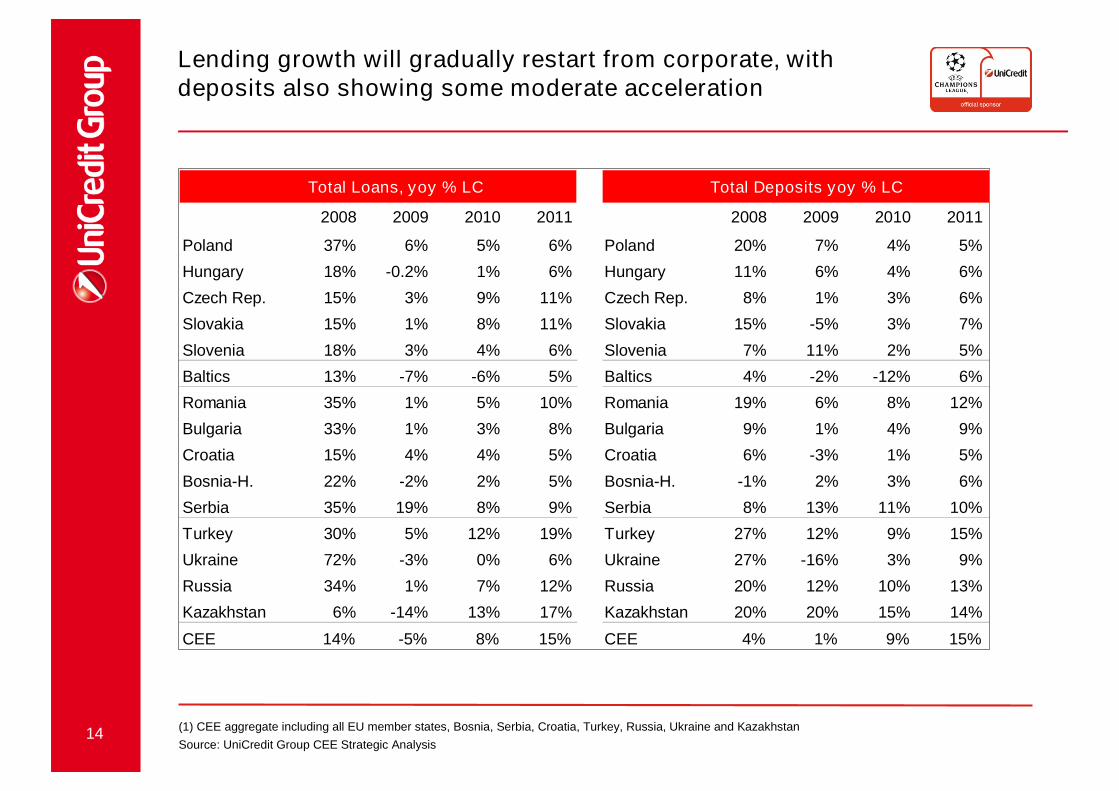
Lending growth will gradually restart from corporate, withdeposits also showing some moderate acceleration
(1) CEE aggregate including all EU member states, Bosnia, Serbia, Croatia, Turkey, Russia, Ukraine and Kazakhstan
Source: UniCredit Group CEE Strategic Analysis
Total Loans, yoy % LC Total Deposits yoy % LC
2008 2009 2010 2011 2008 2009 2010 2011
Poland 37% 6% 5% 6% Poland 20% 7% 4% 5%
Hungary 18% -0.2% 1% 6% Hungary 11% 6% 4% 6%
Czech Rep. 15% 3% 9% 11% Czech Rep. 8% 1% 3% 6%
Slovakia 15% 1% 8% 11% Slovakia 15% -5% 3% 7%
Slovenia 18% 3% 4% 6% Slovenia 7% 11% 2% 5%
Baltics 13% -7% -6% 5% Baltics 4% -2% -12% 6%
Romania 35% 1% 5% 10% Romania 19% 6% 8% 12%
Bulgaria 33% 1% 3% 8% Bulgaria 9% 1% 4% 9%
Croatia 15% 4% 4% 5% Croatia 6% -3% 1% 5%
Bosnia-H. 22% -2% 2% 5% Bosnia-H. -1% 2% 3% 6%
Serbia 35% 19% 8% 9% Serbia 8% 13% 11% 10%
Turkey 30% 5% 12% 19% Turkey 27% 12% 9% 15%
Ukraine 72% -3% 0% 6% Ukraine 27% -16% 3% 9%
Russia 34% 1% 7% 12% Russia 20% 12% 10% 13%
Kazakhstan 6% -14% 13% 17% Kazakhstan 20% 20% 15% 14%
CEE 14% -5% 8% 15% CEE 4% 1% 9% 15%
15
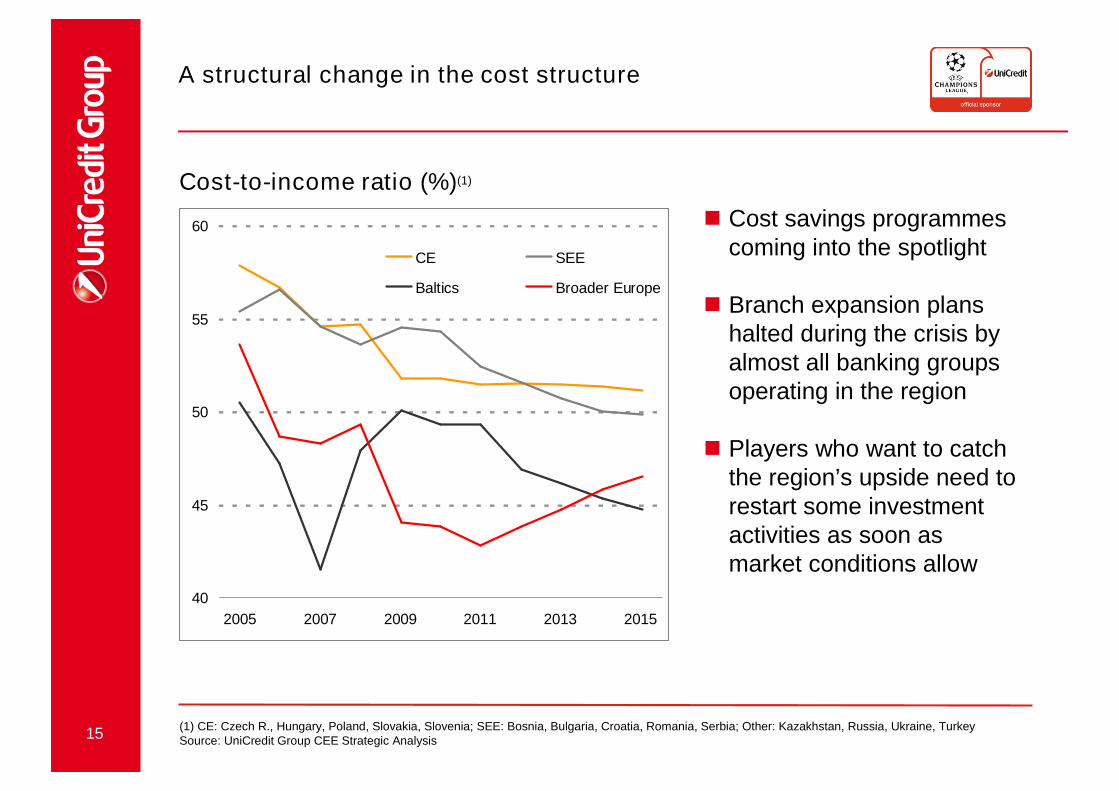
A structural change in the cost structure
Cost-to-income ratio (%)(1)
(1) CE: Czech R., Hungary, Poland, Slovakia, Slovenia; SEE: Bosnia, Bulgaria, Croatia, Romania, Serbia; Other: Kazakhstan, Russia, Ukraine, TurkeySource: UniCredit Group CEE Strategic Analysis
40
45
50
55
60
2005 2007 2009 2011 2013 2015
CE SEE
Baltics Broader Europe
Cost savings programmescoming into the spotlight
Branch expansion planshalted during the crisis byalmost all banking groupsoperating in the region
Players who want to catchthe region’s upside need torestart some investmentactivities as soon asmarket conditions allow
16
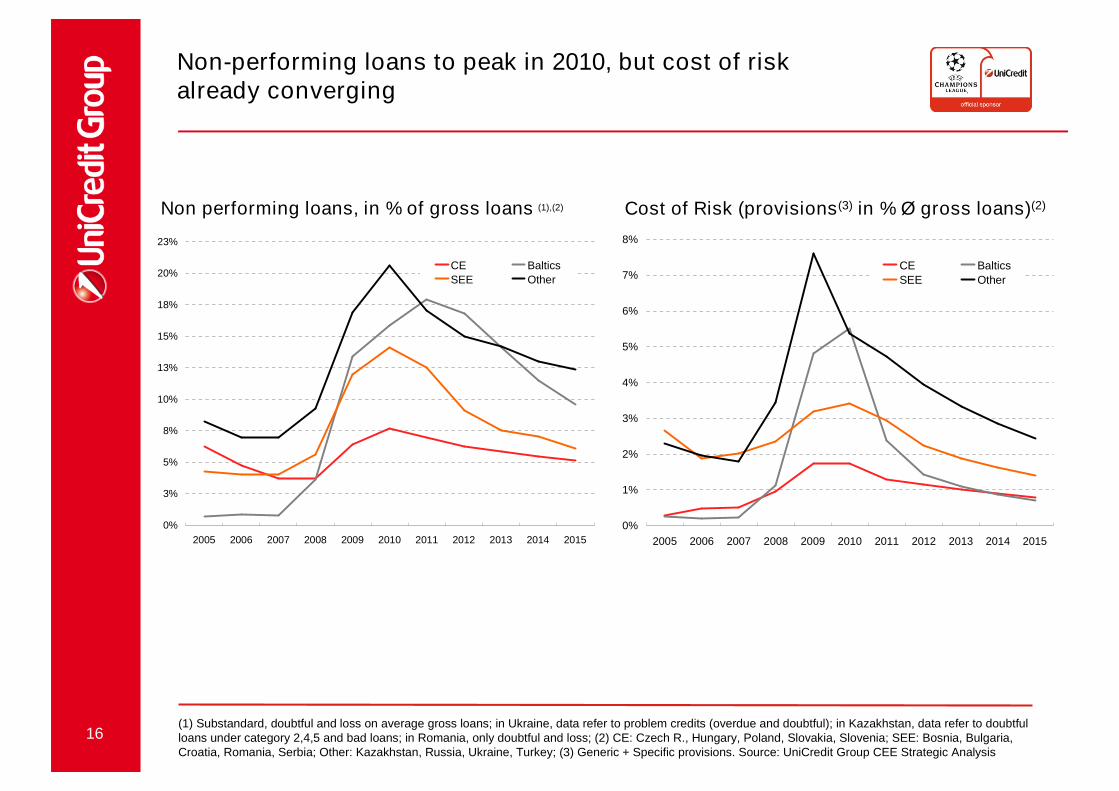
Non-performing loans to peak in 2010, but cost of riskalready converging
Non performing loans, in % of gross loans (1),(2)
(1) Substandard, doubtful and loss on average gross loans; in Ukraine, data refer to problem credits (overdue and doubtful); in Kazakhstan, data refer to doubtfulloans under category 2,4,5 and bad loans; in Romania, only doubtful and loss; (2) CE: Czech R., Hungary, Poland, Slovakia, Slovenia; SEE: Bosnia, Bulgaria,Croatia, Romania, Serbia; Other: Kazakhstan, Russia, Ukraine, Turkey; (3) Generic + Specific provisions. Source: UniCredit Group CEE Strategic Analysis
Cost of Risk (provisions(3) in % Ø gross loans)(2)
0%
3%
5%
8%
10%
13%
15%
18%
20%
23%
2005 2006 2007 2008 2009 2010 2011 2012 2013 2014 2015
CE Baltics
SEE Other
0%
1%
2%
3%
4%
5%
6%
7%
8%
2005 2006 2007 2008 2009 2010 2011 2012 2013 2014 2015
CE Baltics
SEE Other
18
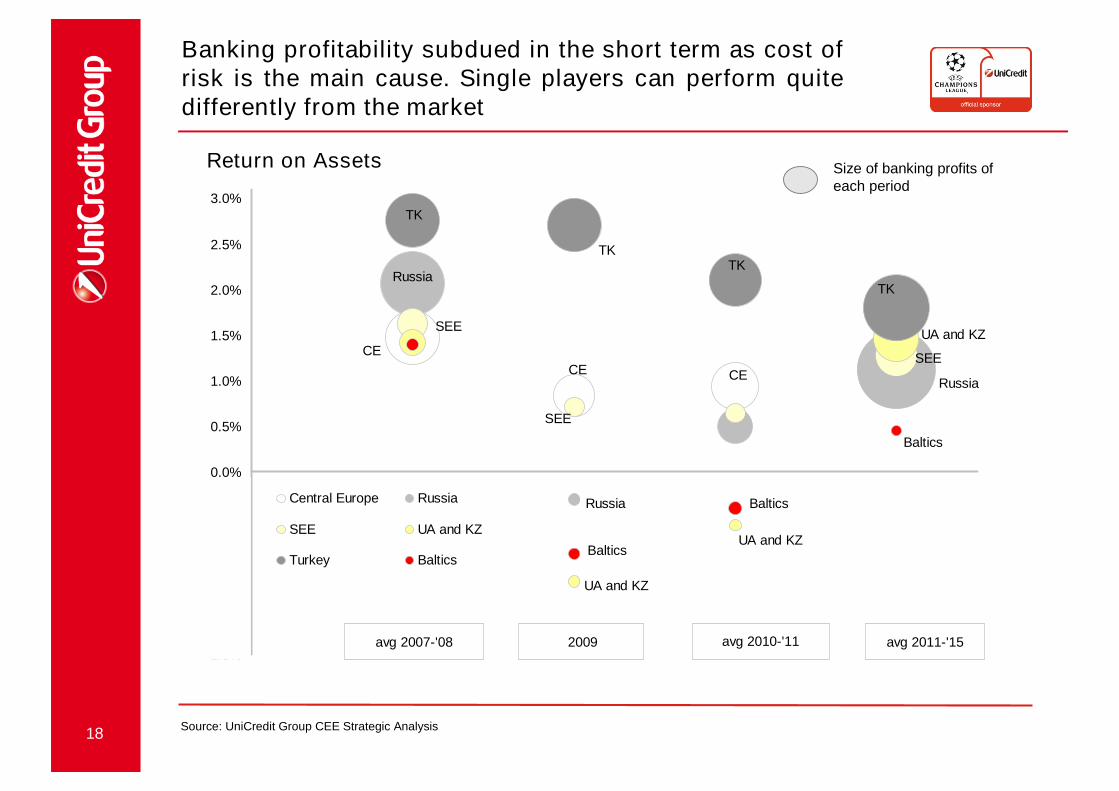
-2.0%
-1.5%
-1.0%
-0.5%
0.0%
0.5%
1.0%
1.5%
2.0%
2.5%
3.0%
Central Europe Russia
SEE UA and KZ
Turkey Baltics
avg 2007-'08 avg 2010-'112009
Russia
TK
TK
TK
CESEE
Russia
Russia
SEE
SEE
Baltics
UA and KZ
CE
avg 2011-'15
Baltics
UA and KZ
CE
TK
UA and KZ
Baltics
Source: UniCredit Group CEE Strategic Analysis
Size of banking profits ofeach period
Return on Assets
Banking profitability subdued in the short term as cost ofrisk is the main cause. Single players can perform quitedifferently from the market

19
AGENDA
1. How the CEE banking landscape has changed in the short term
2. Banking through the crisis
3. International players - UniCredit ready to take the upside
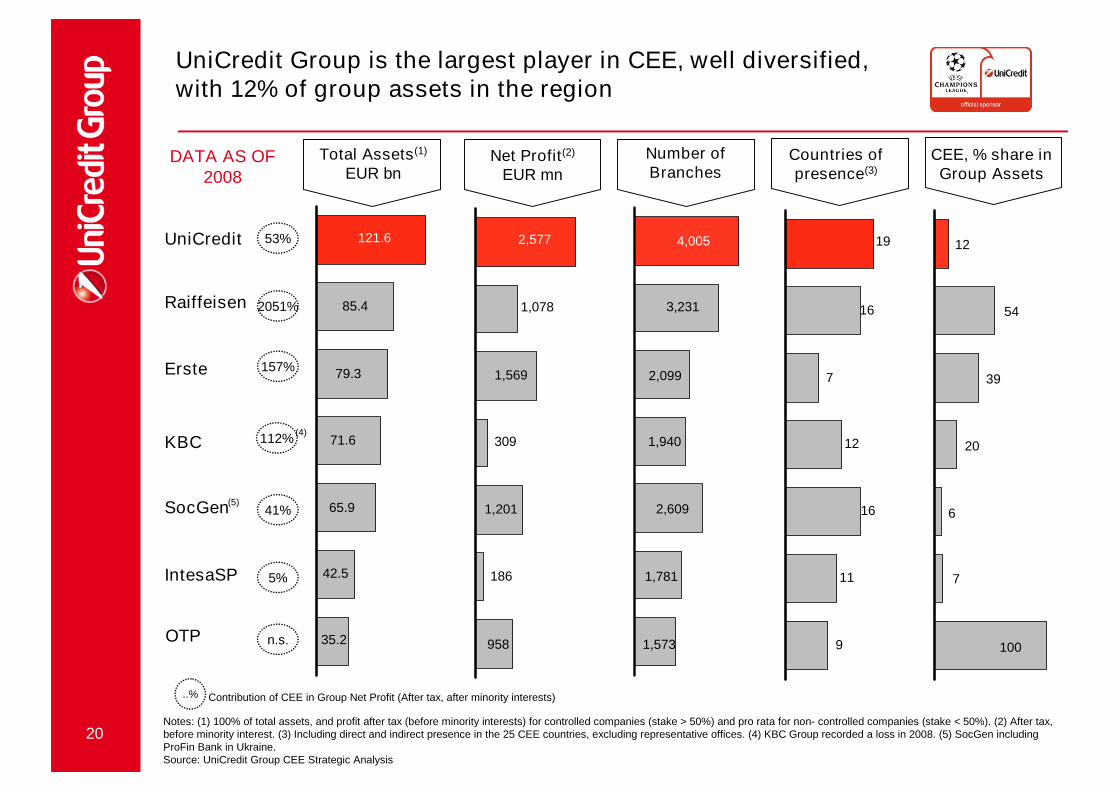
20
Total Assets(1)
EUR bnNet Profit(2)
EUR mn
Number ofBranches
Countries ofpresence(3)
OTP
KBC
Raiffeisen
Erste
UniCredit
IntesaSP
121.6 2,577
1,569
4,005
3,231
2,099
1,940
2,609
1,781
1,573
19
16
7
12
16
11
9
SocGen 1,201
112%
..% Contribution of CEE in Group Net Profit (After tax, after minority interests)
Notes: (1) 100% of total assets, and profit after tax (before minority interests) for controlled companies (stake > 50%) and pro rata for non- controlled companies (stake < 50%). (2) After tax,before minority interest. (3) Including direct and indirect presence in the 25 CEE countries, excluding representative offices. (4) KBC Group recorded a loss in 2008. (5) SocGen includingProFin Bank in Ukraine.Source: UniCredit Group CEE Strategic Analysis
1,078
958
(4)
53%
2051%
157%
41%
5%
n.s.
CEE, % share inGroup Assets
85.4
79.3
71.6
65.9
42.5
35.2
309
186
12
54
39
20
6
7
100
(5)
UniCredit Group is the largest player in CEE, well diversified,with 12% of group assets in the region
DATA AS OF2008
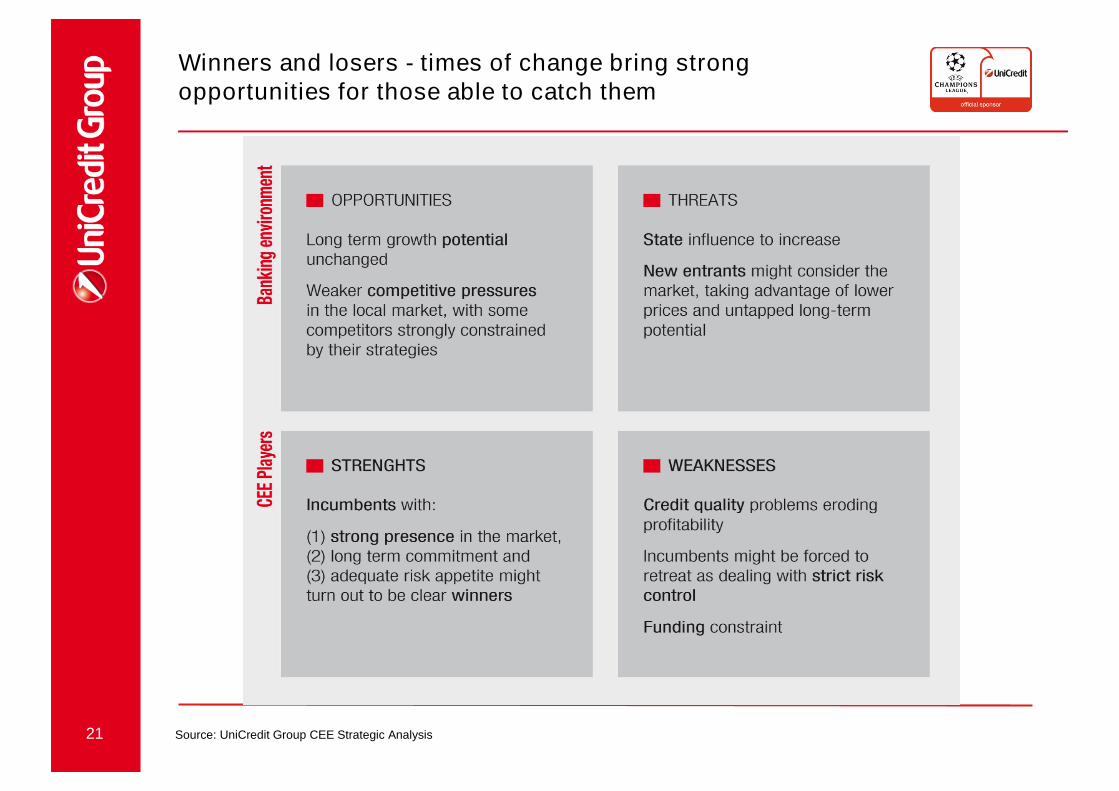
21
Winners and losers - times of change bring strongopportunities for those able to catch them
Source: UniCredit Group CEE Strategic Analysis
22
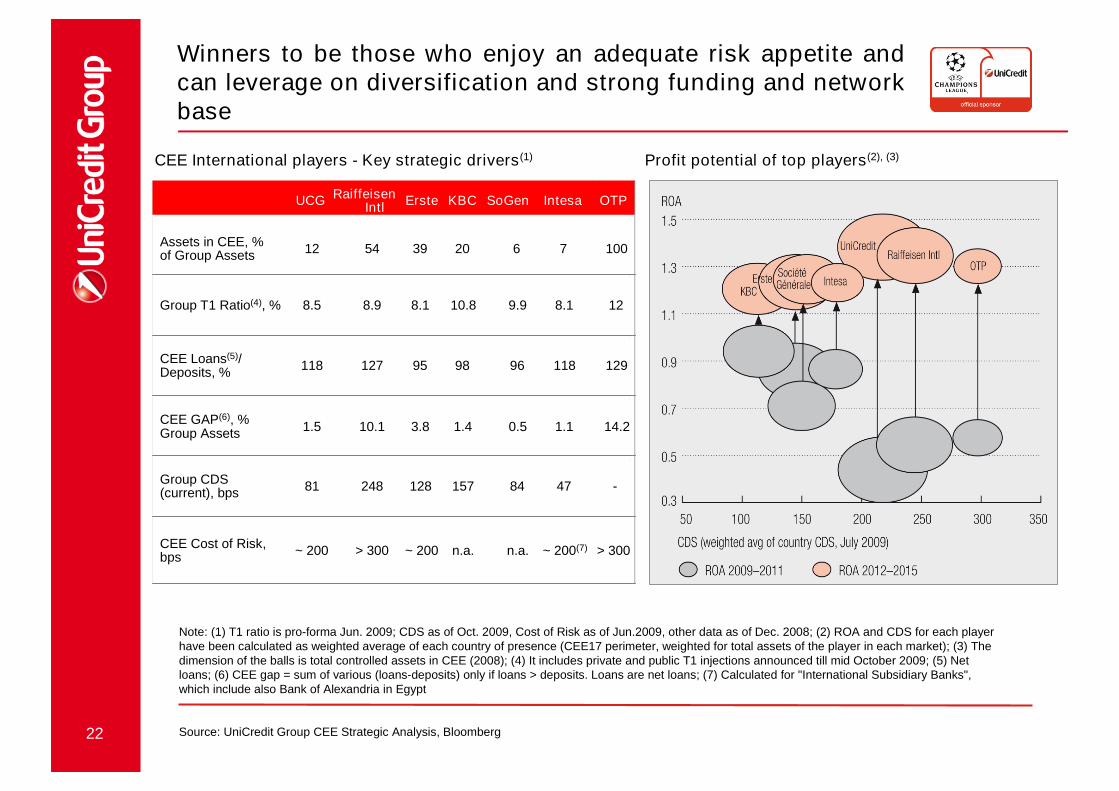
Note: (1) T1 ratio is pro-forma Jun. 2009; CDS as of Oct. 2009, Cost of Risk as of Jun.2009, other data as of Dec. 2008; (2) ROA and CDS for each playerhave been calculated as weighted average of each country of presence (CEE17 perimeter, weighted for total assets of the player in each market); (3) Thedimension of the balls is total controlled assets in CEE (2008); (4) It includes private and public T1 injections announced till mid October 2009; (5) Netloans; (6) CEE gap = sum of various (loans-deposits) only if loans > deposits. Loans are net loans; (7) Calculated for "International Subsidiary Banks",which include also Bank of Alexandria in Egypt
Source: UniCredit Group CEE Strategic Analysis, Bloomberg
CEE International players - Key strategic drivers(1) Profit potential of top players(2), (3)
Winners to be those who enjoy an adequate risk appetite andcan leverage on diversification and strong funding and networkbase
UCG RaiffeisenIntl
Erste KBC SoGen Intesa OTP
Assets in CEE, %of Group Assets
12 54 39 20 6 7 100
Group T1 Ratio(4), % 8.5 8.9 8.1 10.8 9.9 8.1 12
CEE Loans(5)/Deposits, %
118 127 95 98 96 118 129
CEE GAP(6), %Group Assets
1.5 10.1 3.8 1.4 0.5 1.1 14.2
Group CDS(current), bps
81 248 128 157 84 47 -
CEE Cost of Risk,bps
~ 200 > 300 ~ 200 n.a. n.a. ~ 200(7) > 300
23
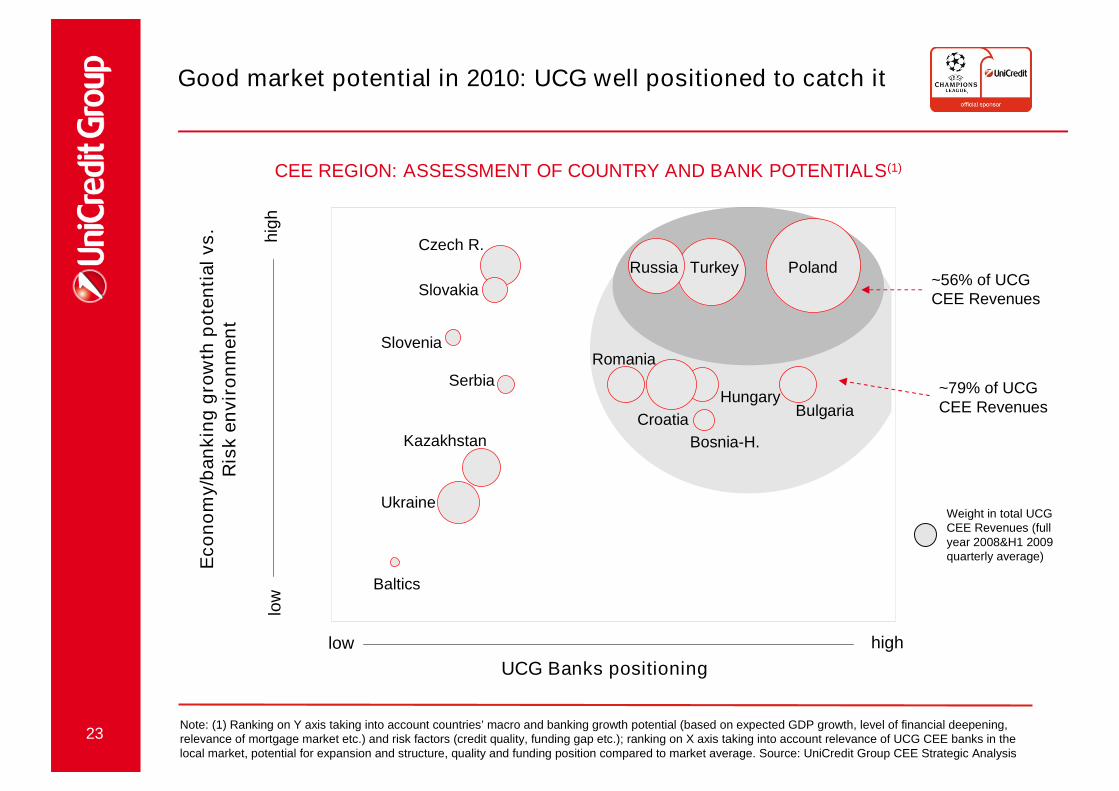
Good market potential in 2010: UCG well positioned to catch it
Note: (1) Ranking on Y axis taking into account countries’ macro and banking growth potential (based on expected GDP growth, level of financial deepening,relevance of mortgage market etc.) and risk factors (credit quality, funding gap etc.); ranking on X axis taking into account relevance of UCG CEE banks in thelocal market, potential for expansion and structure, quality and funding position compared to market average. Source: UniCredit Group CEE Strategic Analysis
UCG Banks positioning
Eco
no
my/b
an
kin
gg
row
thp
ote
nti
alvs.
Ris
ken
vir
on
men
t
low
hig
h
low high
CEE REGION: ASSESSMENT OF COUNTRY AND BANK POTENTIALS(1)
Romania
Croatia
Hungary
Bosnia-H.
Bulgaria
Baltics
Ukraine
Kazakhstan
Serbia
Slovenia
Slovakia
Czech R.
Weight in total UCGCEE Revenues (fullyear 2008&H1 2009quarterly average)
~56% of UCGCEE Revenues
~79% of UCGCEE Revenues
Russia PolandTurkey
24 Source: UniCredit Group CEE Strategic Analysis
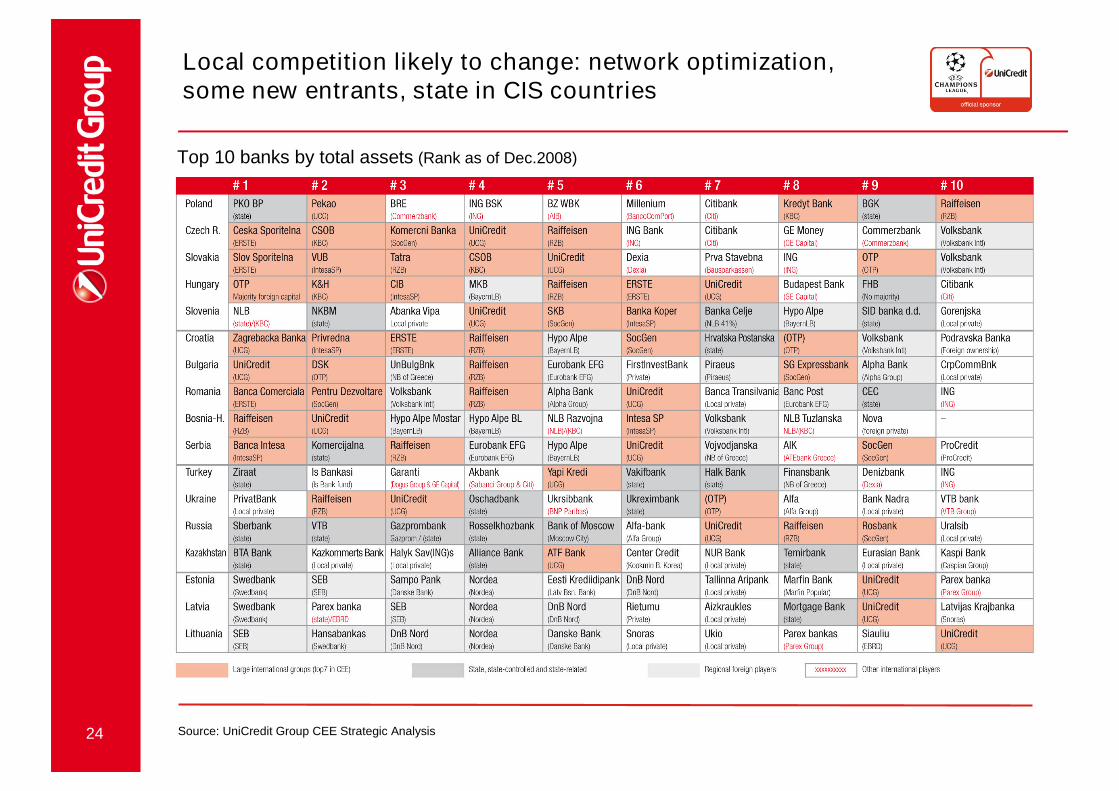
Top 10 banks by total assets (Rank as of Dec.2008)
Local competition likely to change: network optimization,some new entrants, state in CIS countries
25
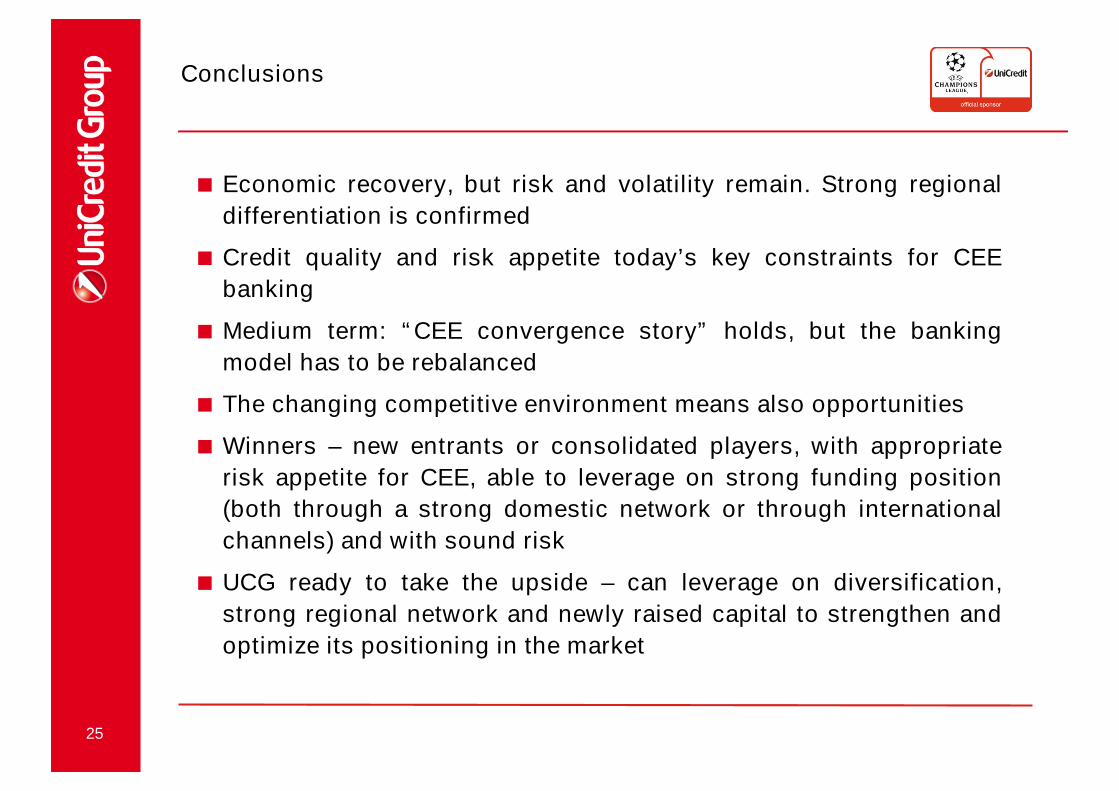
Conclusions
Economic recovery, but risk and volatility remain. Strong regional
differentiation is confirmed
Credit quality and risk appetite today’s key constraints for CEE
banking
Medium term: “CEE convergence story” holds, but the banking
model has to be rebalanced
The changing competitive environment means also opportunities
Winners – new entrants or consolidated players, with appropriate
risk appetite for CEE, able to leverage on strong funding position
(both through a strong domestic network or through international
channels) and with sound risk
UCG ready to take the upside – can leverage on diversification,
strong regional network and newly raised capital to strengthen and
optimize its positioning in the market