Embed Size (px)
Citation preview
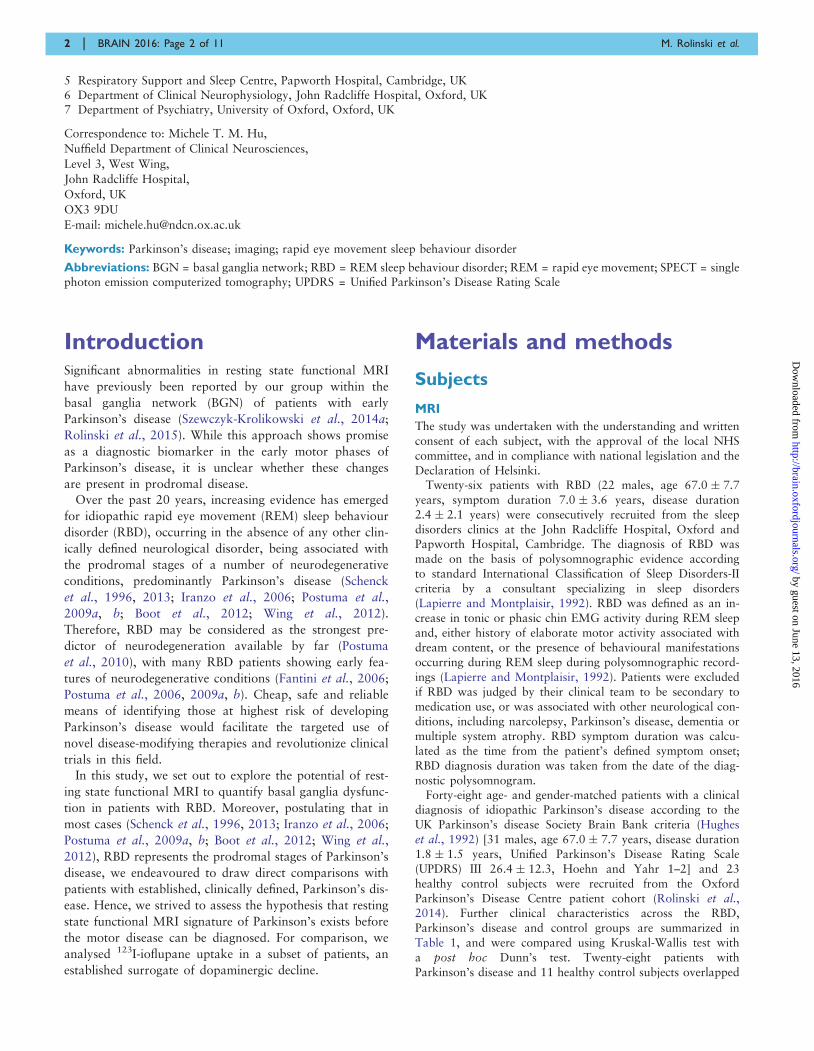
Basal ganglia dysfunction in idiopathic REMsleep behaviour disorder parallels that inearly Parkinson’s disease
Michal Rolinski,1,2 Ludovica Griffanti,3 Paola Piccini,4 Andreas A. Roussakis,4
Konrad Szewczyk-Krolikowski,1,2 Ricarda A. Menke,3 Timothy Quinnell,5 Zenobia Zaiwalla,6
Johannes C. Klein,1,2,3 Clare E. Mackay1,3,7,* and Michele T. M. Hu1,2,*
*These authors contributed equally to this work.
Resting state functional magnetic resonance imaging dysfunction within the basal ganglia network is a feature of early Parkinson’s
disease and may be a diagnostic biomarker of basal ganglia dysfunction. Currently, it is unclear whether these changes are present
in so-called idiopathic rapid eye movement sleep behaviour disorder, a condition associated with a high rate of future conversion to
Parkinson’s disease. In this study, we explore the utility of resting state functional magnetic resonance imaging to detect basal
ganglia network dysfunction in rapid eye movement sleep behaviour disorder. We compare these data to a set of healthy control
subjects, and to a set of patients with established early Parkinson’s disease. Furthermore, we explore the relationship between
resting state functional magnetic resonance imaging basal ganglia network dysfunction and loss of dopaminergic neurons assessed
with dopamine transporter single photon emission computerized tomography, and perform morphometric analyses to assess grey
matter loss. Twenty-six patients with polysomnographically-established rapid eye movement sleep behaviour disorder, 48 patients
with Parkinson’s disease and 23 healthy control subjects were included in this study. Resting state networks were isolated from
task-free functional magnetic resonance imaging data using dual regression with a template derived from a separate cohort of 80
elderly healthy control participants. Resting state functional magnetic resonance imaging parameter estimates were extracted from
the study subjects in the basal ganglia network. In addition, eight patients with rapid eye movement sleep behaviour disorder, 10
with Parkinson’s disease and 10 control subjects received 123I-ioflupane single photon emission computerized tomography. We
tested for reduction of basal ganglia network connectivity, and for loss of tracer uptake in rapid eye movement sleep behaviour
disorder and Parkinson’s disease relative to each other and to controls. Connectivity measures of basal ganglia network dysfunction
differentiated both rapid eye movement sleep behaviour disorder and Parkinson’s disease from controls with high sensitivity (96%)
and specificity (74% for rapid eye movement sleep behaviour disorder, 78% for Parkinson’s disease), indicating its potential as an
indicator of early basal ganglia dysfunction. Rapid eye movement sleep behaviour disorder was indistinguishable from Parkinson’s
disease on resting state functional magnetic resonance imaging despite obvious differences on dopamine transported single photon
emission computerized tomography. Basal ganglia connectivity is a promising biomarker for the detection of early basal ganglia
network dysfunction, and may help to identify patients at risk of developing Parkinson’s disease in the future. Future risk strati-
fication using a polymodal approach could combine basal ganglia network connectivity with clinical and other imaging measures,
with important implications for future neuroprotective trials in rapid eye movement sleep behaviour disorder.
1 Oxford Parkinson’s Disease Centre (OPDC), Oxford, UK2 Nuffield Department of Clinical Neurosciences, University of Oxford, Oxford, UK3 Centre for the functional MRI of the Brain (FMRIB), University of Oxford, Oxford, UK4 Division of Clinical Neurosciences and MRC Clinical Sciences Centre, Faculty of Medicine, Hammersmith Hospital, Imperial
College London, London, UK
doi:10.1093/brain/aww124 BRAIN 2016: Page 1 of 11 | 1
Received February 3, 2016. Revised April 1, 2016. Accepted April 5, 2016.
� The Author (2016). Published by Oxford University Press on behalf of the Guarantors of Brain.
This is an Open Access article distributed under the terms of the Creative Commons Attribution License (http://creativecommons.org/licenses/by/4.0/), which permits unrestricted reuse,
distribution, and reproduction in any medium, provided the original work is properly cited.
Brain Advance Access published June 12, 2016 by guest on June 13, 2016
http://brain.oxfordjournals.org/D
ownloaded from
5 Respiratory Support and Sleep Centre, Papworth Hospital, Cambridge, UK6 Department of Clinical Neurophysiology, John Radcliffe Hospital, Oxford, UK7 Department of Psychiatry, University of Oxford, Oxford, UK
Correspondence to: Michele T. M. Hu,
Nuffield Department of Clinical Neurosciences,
Level 3, West Wing,
John Radcliffe Hospital,
Oxford, UK
OX3 9DU
E-mail: [email protected]
Keywords: Parkinson’s disease; imaging; rapid eye movement sleep behaviour disorder
Abbreviations: BGN = basal ganglia network; RBD = REM sleep behaviour disorder; REM = rapid eye movement; SPECT = singlephoton emission computerized tomography; UPDRS = Unified Parkinson’s Disease Rating Scale
IntroductionSignificant abnormalities in resting state functional MRI
have previously been reported by our group within the
basal ganglia network (BGN) of patients with early
Parkinson’s disease (Szewczyk-Krolikowski et al., 2014a;
Rolinski et al., 2015). While this approach shows promise
as a diagnostic biomarker in the early motor phases of
Parkinson’s disease, it is unclear whether these changes
are present in prodromal disease.
Over the past 20 years, increasing evidence has emerged
for idiopathic rapid eye movement (REM) sleep behaviour
disorder (RBD), occurring in the absence of any other clin-
ically defined neurological disorder, being associated with
the prodromal stages of a number of neurodegenerative
conditions, predominantly Parkinson’s disease (Schenck
et al., 1996, 2013; Iranzo et al., 2006; Postuma et al.,
2009a, b; Boot et al., 2012; Wing et al., 2012).
Therefore, RBD may be considered as the strongest pre-
dictor of neurodegeneration available by far (Postuma
et al., 2010), with many RBD patients showing early fea-
tures of neurodegenerative conditions (Fantini et al., 2006;
Postuma et al., 2006, 2009a, b). Cheap, safe and reliable
means of identifying those at highest risk of developing
Parkinson’s disease would facilitate the targeted use of
novel disease-modifying therapies and revolutionize clinical
trials in this field.
In this study, we set out to explore the potential of rest-
ing state functional MRI to quantify basal ganglia dysfunc-
tion in patients with RBD. Moreover, postulating that in
most cases (Schenck et al., 1996, 2013; Iranzo et al., 2006;
Postuma et al., 2009a, b; Boot et al., 2012; Wing et al.,
2012), RBD represents the prodromal stages of Parkinson’s
disease, we endeavoured to draw direct comparisons with
patients with established, clinically defined, Parkinson’s dis-
ease. Hence, we strived to assess the hypothesis that resting
state functional MRI signature of Parkinson’s exists before
the motor disease can be diagnosed. For comparison, we
analysed 123I-ioflupane uptake in a subset of patients, an
established surrogate of dopaminergic decline.
Materials and methods
Subjects
MRI
The study was undertaken with the understanding and writtenconsent of each subject, with the approval of the local NHScommittee, and in compliance with national legislation and theDeclaration of Helsinki.
Twenty-six patients with RBD (22 males, age 67.0 � 7.7years, symptom duration 7.0 � 3.6 years, disease duration2.4 � 2.1 years) were consecutively recruited from the sleepdisorders clinics at the John Radcliffe Hospital, Oxford andPapworth Hospital, Cambridge. The diagnosis of RBD wasmade on the basis of polysomnographic evidence accordingto standard International Classification of Sleep Disorders-IIcriteria by a consultant specializing in sleep disorders(Lapierre and Montplaisir, 1992). RBD was defined as an in-crease in tonic or phasic chin EMG activity during REM sleepand, either history of elaborate motor activity associated withdream content, or the presence of behavioural manifestationsoccurring during REM sleep during polysomnographic record-ings (Lapierre and Montplaisir, 1992). Patients were excludedif RBD was judged by their clinical team to be secondary tomedication use, or was associated with other neurological con-ditions, including narcolepsy, Parkinson’s disease, dementia ormultiple system atrophy. RBD symptom duration was calcu-lated as the time from the patient’s defined symptom onset;RBD diagnosis duration was taken from the date of the diag-nostic polysomnogram.
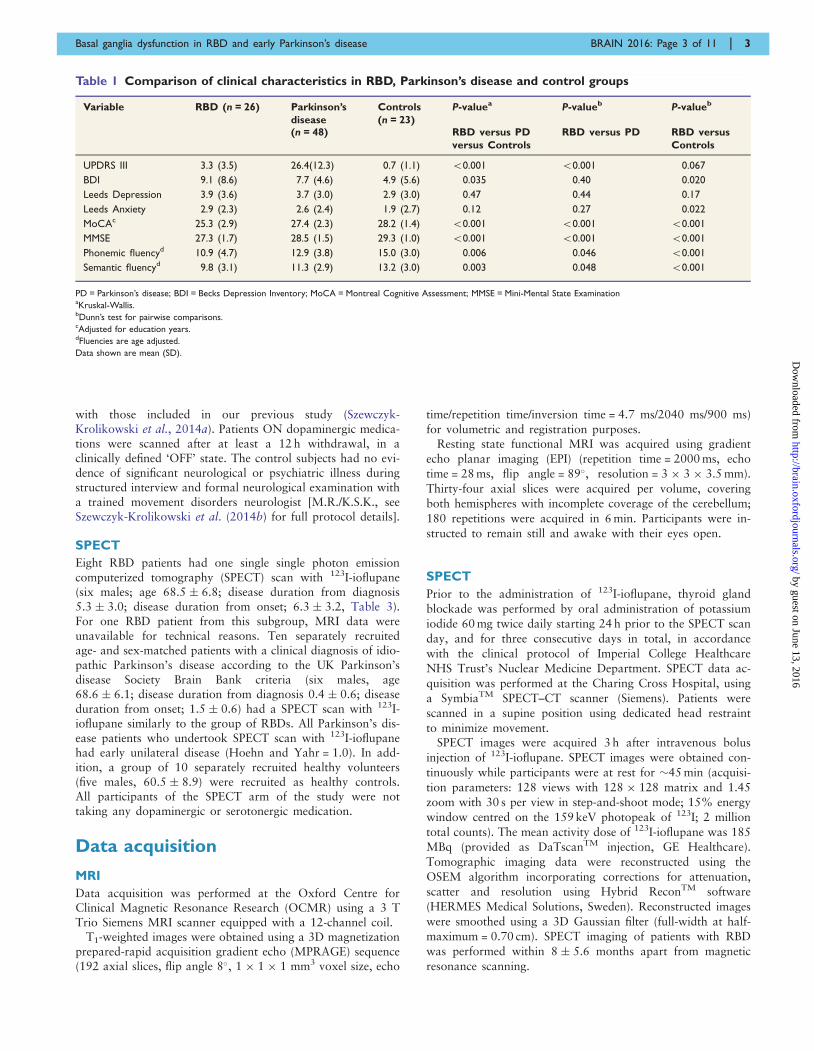
Forty-eight age- and gender-matched patients with a clinicaldiagnosis of idiopathic Parkinson’s disease according to theUK Parkinson’s disease Society Brain Bank criteria (Hugheset al., 1992) [31 males, age 67.0 � 7.7 years, disease duration1.8 � 1.5 years, Unified Parkinson’s Disease Rating Scale(UPDRS) III 26.4 � 12.3, Hoehn and Yahr 1–2] and 23healthy control subjects were recruited from the OxfordParkinson’s Disease Centre patient cohort (Rolinski et al.,2014). Further clinical characteristics across the RBD,Parkinson’s disease and control groups are summarized inTable 1, and were compared using Kruskal-Wallis test witha post hoc Dunn’s test. Twenty-eight patients withParkinson’s disease and 11 healthy control subjects overlapped
2 | BRAIN 2016: Page 2 of 11 M. Rolinski et al.
by guest on June 13, 2016http://brain.oxfordjournals.org/
Dow
nloaded from
with those included in our previous study (Szewczyk-Krolikowski et al., 2014a). Patients ON dopaminergic medica-tions were scanned after at least a 12 h withdrawal, in aclinically defined ‘OFF’ state. The control subjects had no evi-dence of significant neurological or psychiatric illness duringstructured interview and formal neurological examination witha trained movement disorders neurologist [M.R./K.S.K., seeSzewczyk-Krolikowski et al. (2014b) for full protocol details].
SPECT
Eight RBD patients had one single single photon emissioncomputerized tomography (SPECT) scan with 123I-ioflupane(six males; age 68.5 � 6.8; disease duration from diagnosis5.3 � 3.0; disease duration from onset; 6.3 � 3.2, Table 3).For one RBD patient from this subgroup, MRI data wereunavailable for technical reasons. Ten separately recruitedage- and sex-matched patients with a clinical diagnosis of idio-pathic Parkinson’s disease according to the UK Parkinson’sdisease Society Brain Bank criteria (six males, age68.6 � 6.1; disease duration from diagnosis 0.4 � 0.6; diseaseduration from onset; 1.5 � 0.6) had a SPECT scan with 123I-ioflupane similarly to the group of RBDs. All Parkinson’s dis-ease patients who undertook SPECT scan with 123I-ioflupanehad early unilateral disease (Hoehn and Yahr = 1.0). In add-ition, a group of 10 separately recruited healthy volunteers(five males, 60.5 � 8.9) were recruited as healthy controls.All participants of the SPECT arm of the study were nottaking any dopaminergic or serotonergic medication.
Data acquisition
MRI
Data acquisition was performed at the Oxford Centre forClinical Magnetic Resonance Research (OCMR) using a 3 TTrio Siemens MRI scanner equipped with a 12-channel coil.
T1-weighted images were obtained using a 3D magnetizationprepared-rapid acquisition gradient echo (MPRAGE) sequence(192 axial slices, flip angle 8�, 1 � 1 � 1 mm3 voxel size, echo
time/repetition time/inversion time = 4.7 ms/2040 ms/900 ms)for volumetric and registration purposes.
Resting state functional MRI was acquired using gradientecho planar imaging (EPI) (repetition time = 2000 ms, echo
time = 28 ms, flip angle = 89�, resolution = 3 � 3 � 3.5 mm).
Thirty-four axial slices were acquired per volume, coveringboth hemispheres with incomplete coverage of the cerebellum;
180 repetitions were acquired in 6 min. Participants were in-
structed to remain still and awake with their eyes open.
SPECT
Prior to the administration of 123I-ioflupane, thyroid gland
blockade was performed by oral administration of potassiumiodide 60 mg twice daily starting 24 h prior to the SPECT scan
day, and for three consecutive days in total, in accordance
with the clinical protocol of Imperial College HealthcareNHS Trust’s Nuclear Medicine Department. SPECT data ac-
quisition was performed at the Charing Cross Hospital, using
a SymbiaTM SPECT–CT scanner (Siemens). Patients werescanned in a supine position using dedicated head restraint
to minimize movement.SPECT images were acquired 3 h after intravenous bolus
injection of 123I-ioflupane. SPECT images were obtained con-
tinuously while participants were at rest for �45 min (acquisi-
tion parameters: 128 views with 128 � 128 matrix and 1.45zoom with 30 s per view in step-and-shoot mode; 15% energy
window centred on the 159 keV photopeak of 123I; 2 million
total counts). The mean activity dose of 123I-ioflupane was 185MBq (provided as DaTscanTM injection, GE Healthcare).
Tomographic imaging data were reconstructed using the
OSEM algorithm incorporating corrections for attenuation,scatter and resolution using Hybrid ReconTM software
(HERMES Medical Solutions, Sweden). Reconstructed images
were smoothed using a 3D Gaussian filter (full-width at half-maximum = 0.70 cm). SPECT imaging of patients with RBD
was performed within 8 � 5.6 months apart from magnetic
resonance scanning.
Table 1 Comparison of clinical characteristics in RBD, Parkinson’s disease and control groups
Variable RBD (n = 26) Parkinson’s
disease
Controls
(n = 23)
P-valuea P-valueb P-valueb
(n = 48) RBD versus PD
versus Controls
RBD versus PD RBD versus
Controls
UPDRS III 3.3 (3.5) 26.4(12.3) 0.7 (1.1) 50.001 50.001 0.067
BDI 9.1 (8.6) 7.7 (4.6) 4.9 (5.6) 0.035 0.40 0.020
Leeds Depression 3.9 (3.6) 3.7 (3.0) 2.9 (3.0) 0.47 0.44 0.17
Leeds Anxiety 2.9 (2.3) 2.6 (2.4) 1.9 (2.7) 0.12 0.27 0.022
MoCAc 25.3 (2.9) 27.4 (2.3) 28.2 (1.4) 50.001 50.001 50.001
MMSE 27.3 (1.7) 28.5 (1.5) 29.3 (1.0) 50.001 50.001 50.001
Phonemic fluencyd 10.9 (4.7) 12.9 (3.8) 15.0 (3.0) 0.006 0.046 50.001
Semantic fluencyd 9.8 (3.1) 11.3 (2.9) 13.2 (3.0) 0.003 0.048 50.001
PD = Parkinson’s disease; BDI = Becks Depression Inventory; MoCA = Montreal Cognitive Assessment; MMSE = Mini-Mental State ExaminationaKruskal-Wallis.bDunn’s test for pairwise comparisons.cAdjusted for education years.dFluencies are age adjusted.
Data shown are mean (SD).
Basal ganglia dysfunction in RBD and early Parkinson’s disease BRAIN 2016: Page 3 of 11 | 3
by guest on June 13, 2016http://brain.oxfordjournals.org/
Dow
nloaded from
Data analysis
MRI
Analyses were performed using tools from the FMRIBSoftware Library (FSL) (Jenkinson et al., 2012). Voxel-basedmorphometry analyses of the T1-MPRAGE data were carriedout using FSL-VBM (Douaud et al., 2009), testing for reduc-tion of grey matter concentrations in Parkinson’s disease andRBD patients compared to controls. We used the recom-mended FSL pipeline, including segmentation with FAST,non-linear registration with FNIRT and construction of astudy-specific standard space template.
Resting state analysis was performed using probabilistic in-dependent component analysis (ICA) as implemented in theMultivariate Exploratory Linear Optimized Decompositioninto Independent Component FSL tool (MELODIC)(Beckmann and Smith, 2004). Individual pre-statistical pro-cessing consisted of motion correction, brain extraction,unwarping using fieldmap data, spatial smoothing usingGaussian kernel of full-width at half-maximum of 6 mm, andhigh-pass temporal filtering of 150 s. To account for the effectof motion, non-neural physiology, scanner artefacts and otherconfounds, we used FIX, an ICA-based denoising approach(Griffanti et al., 2014; Salimi-Khorshidi et al., 2014). Oncepreprocessed, data were linearly registered to the correspond-ing structural image using FLIRT (Jenkinson et al., 2002), andregistered to Montreal Neurological Institute (MNI) spaceusing non-linear registration.
A previously developed template of resting state networksgenerated from 80 healthy elderly participants was used(Szewczyk-Krolikowski et al., 2014a). It included the BGNand 21 residual noise components that were not fully removedby FIX and were identified as residual noise based on theidentification of standard noise components (Beckmann,2012) and location of signal peaks in non-grey matter areas(e.g. white matter, CSF, skull), were also included as nuisancecovariates. The dual regression approach (Filippini et al.,2009) was used to identify individual temporal dynamics andthe associated spatial maps of the resting state networks.
Statistical comparisons were performed using permutation-based non-parametric inference within the framework of theGLM using Randomise (v2.1). Results were considered signifi-cant for P50.05, after correction for multiple comparisons(family-wise error) using the threshold-free cluster enhance-ment (TFCE) approach (Smith and Nichols, 2009), which en-hances sensitivity to spatially distributed effects. The designincluded linear regressors for age and sex.
A post hoc analysis was performed to further characterizethe connectivity changes within the BGN between the studygroups. For each participant, parameter estimates representingthe connectivity of a given voxels with the time-course of thewhole network, were averaged within a binary mask contain-ing only significant clusters from the voxel-wise analysis. Areceiver operating characteristic (ROC) curve was generatedto assess the separation between the two groups. Last, toassess the intra-network connectivity within individual partsof the basal ganglia, subcortical masks were created from theHarvard-Oxford Subcortical Atlas (Mazziotta et al., 2001).The generated masks were used to mean parameter estimatesfrom subject-specific BGN spatial maps, from the followingregions of interest: caudate, pallidum and the posterior and
anterior putamen, bilaterally. The boundary between the an-terior and posterior putamen was taken to be the posterioraspect of the fornix on the axial plane.
SPECT123I-ioflupane SPECT data were analysed using the BRASSsoftware (HERMES medical solutions, Sweden) following asemi-quantitative approach. Each individual’s reconstructedimage was automatically registered to a predefined template,provided with the software. Following automatic alignment, allscans were inspected visually and manually to fit to the prede-fined template where necessary. Uptake ratios of 123I-ioflupanewere calculated for each striatum, caudate, putamen, anteriorand posterior putamen relative to the non-specific uptake mea-sured in the occipital cortex. The uptake is defined as thespecific binding ratio [(striatal counts–background counts)/background counts]. The specific DAT binding as reflectedby 123I-ioflupane uptake values was calculated for both hemi-spheres. The average binding for region of interest was calcu-lated per individual as the mean uptake value for bothhemispheres.
We tested for differences in tracer uptake betweenParkinson’s disease, RBD and control groups using theKruskal-Wallis test. Post hoc Dunn’s tests were performed toidentify differences between (i) Parkinson’s disease and con-trols; (ii) Parkinson’s disease and RBD; and (iii) RBD and con-trols. All tests used a threshold of P5 0.05 one-tailed.Applying methodology similar to that used in the ParkinsonAssociated Risk Syndrome Study (Jennings et al., 2014), wedetermined the percentage of expected 123I-ioflupane traceruptake in the lowest putamen of each RBD and Parkinson’sindividual by comparing to the mean of the lowest putamen inthe 10 control subjects. Individual subjects were categorized ashaving dopamine transporter (DaT) deficit (465% ex-pected lowest putamen 123I-ioflupane binding), intermediate(65–80% expected lowest putamen 123I-ioflupane binding),or no DaT deficit (480% expected lowest putamen 123I-ioflupane binding).
Correlation analysis: MRI and SPECT
We tested for significant correlation between regional123I-ioflupane tracer uptake, and BGN parameter estimatesfor the whole BGN network, and for the individual regionsstudied, that is caudate nucleus, whole putamen, anterior andposterior putamen, using Spearman’s rank correlation.
Due to the low number of subjects receiving SPECT and theexploratory nature of the DAT analysis, we did not applycorrection for multiple comparisons.
Results
Voxel-based morphometry
Voxel-based morphometry analysis did not yield any sig-
nificant grey matter differences between the three groups,
including within cortical or brainstem subregions. Hence,
voxel-wise grey matter masks were not included as covari-
ates in the functional MRI analysis.
4 | BRAIN 2016: Page 4 of 11 M. Rolinski et al.
by guest on June 13, 2016http://brain.oxfordjournals.org/
Dow
nloaded from
Resting state network analysis
The mean relative (time point-to-time point) and absolute
head motion during functional MRI acquisition did
not differ significantly between the three groups
[F(2,94) = 2.93, P = 0.06 and F(2,94) = 1.58, P = 0.2,
respectively].
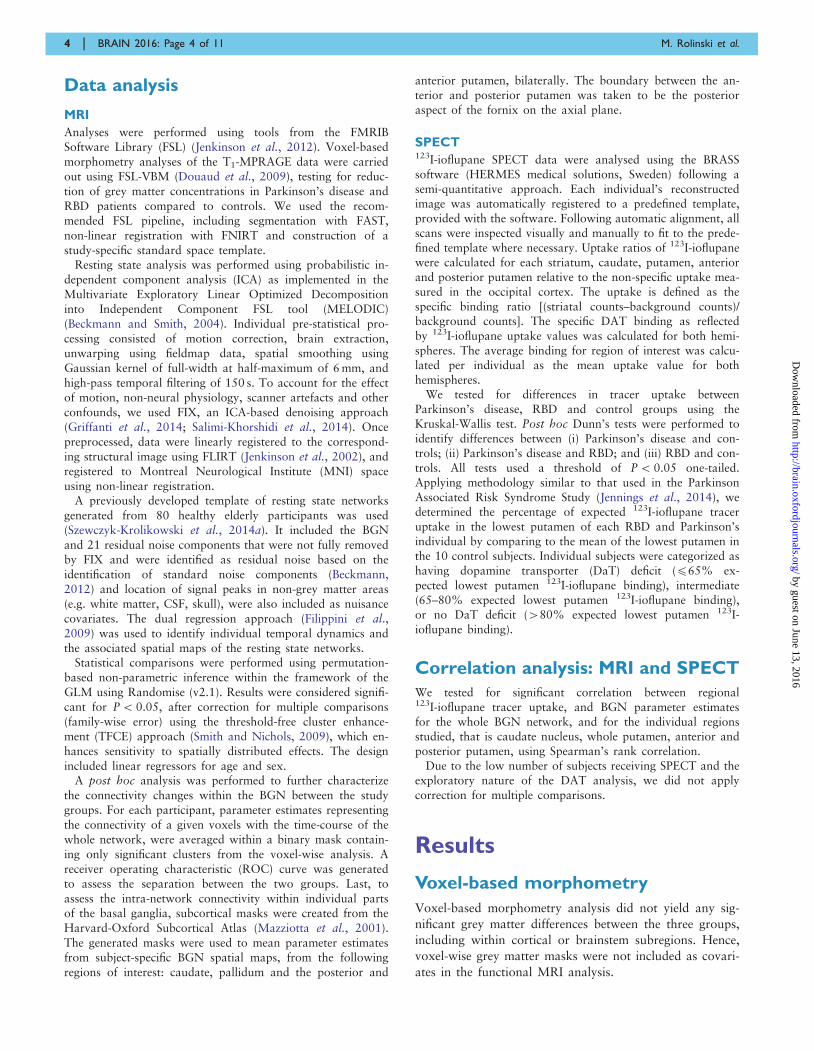
Significantly reduced coactivation within the BGN was
found in patients with Parkinson’s disease and RBD,
when compared to healthy controls (Fig. 1). In both
cases, significant clusters were found within the basal gang-
lia, as well as frontal regions, such as the cingulate and
paracingulate gyri, the frontal orbital cortices and the in-
ferior and middle frontal gyri (Table 2). Voxel-wise com-
parison did not reveal any statistically significant
differences when patients with RBD were compared to pa-
tients with established Parkinson’s disease.
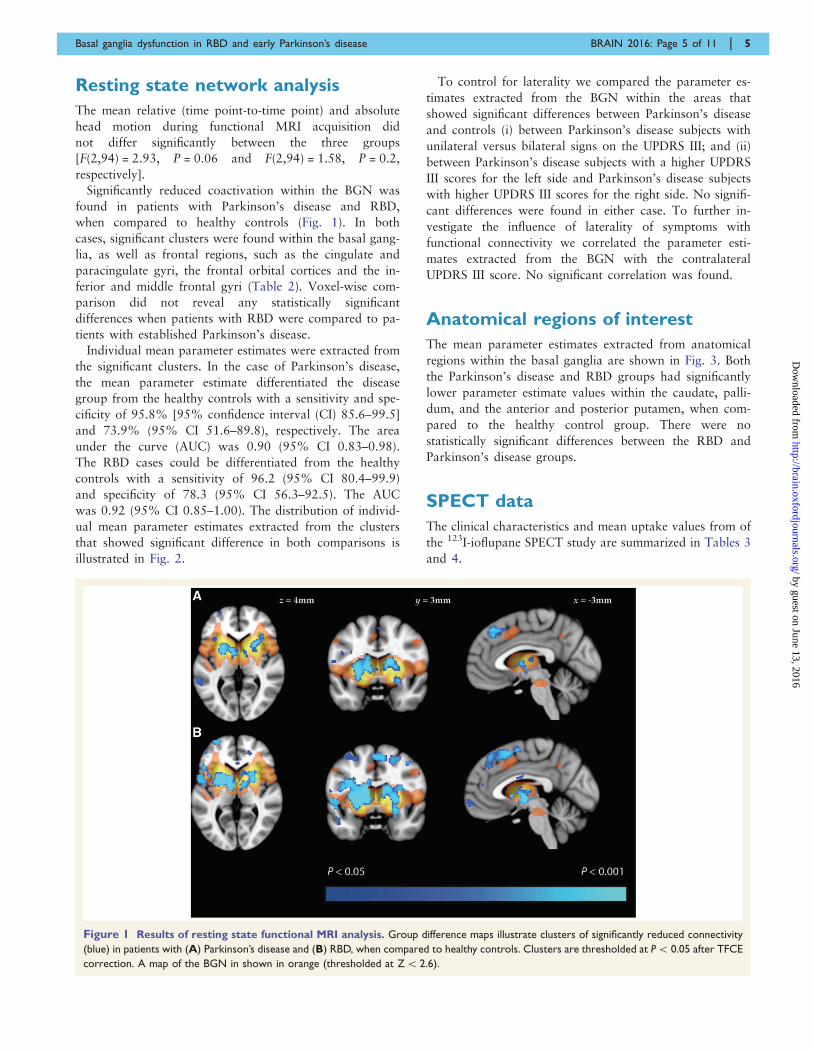
Individual mean parameter estimates were extracted from
the significant clusters. In the case of Parkinson’s disease,
the mean parameter estimate differentiated the disease
group from the healthy controls with a sensitivity and spe-
cificity of 95.8% [95% confidence interval (CI) 85.6–99.5]
and 73.9% (95% CI 51.6–89.8), respectively. The area
under the curve (AUC) was 0.90 (95% CI 0.83–0.98).
The RBD cases could be differentiated from the healthy
controls with a sensitivity of 96.2 (95% CI 80.4–99.9)
and specificity of 78.3 (95% CI 56.3–92.5). The AUC
was 0.92 (95% CI 0.85–1.00). The distribution of individ-
ual mean parameter estimates extracted from the clusters
that showed significant difference in both comparisons is
illustrated in Fig. 2.
To control for laterality we compared the parameter es-
timates extracted from the BGN within the areas that
showed significant differences between Parkinson’s disease
and controls (i) between Parkinson’s disease subjects with
unilateral versus bilateral signs on the UPDRS III; and (ii)
between Parkinson’s disease subjects with a higher UPDRS
III scores for the left side and Parkinson’s disease subjects
with higher UPDRS III scores for the right side. No signifi-
cant differences were found in either case. To further in-
vestigate the influence of laterality of symptoms with
functional connectivity we correlated the parameter esti-
mates extracted from the BGN with the contralateral
UPDRS III score. No significant correlation was found.
Anatomical regions of interest
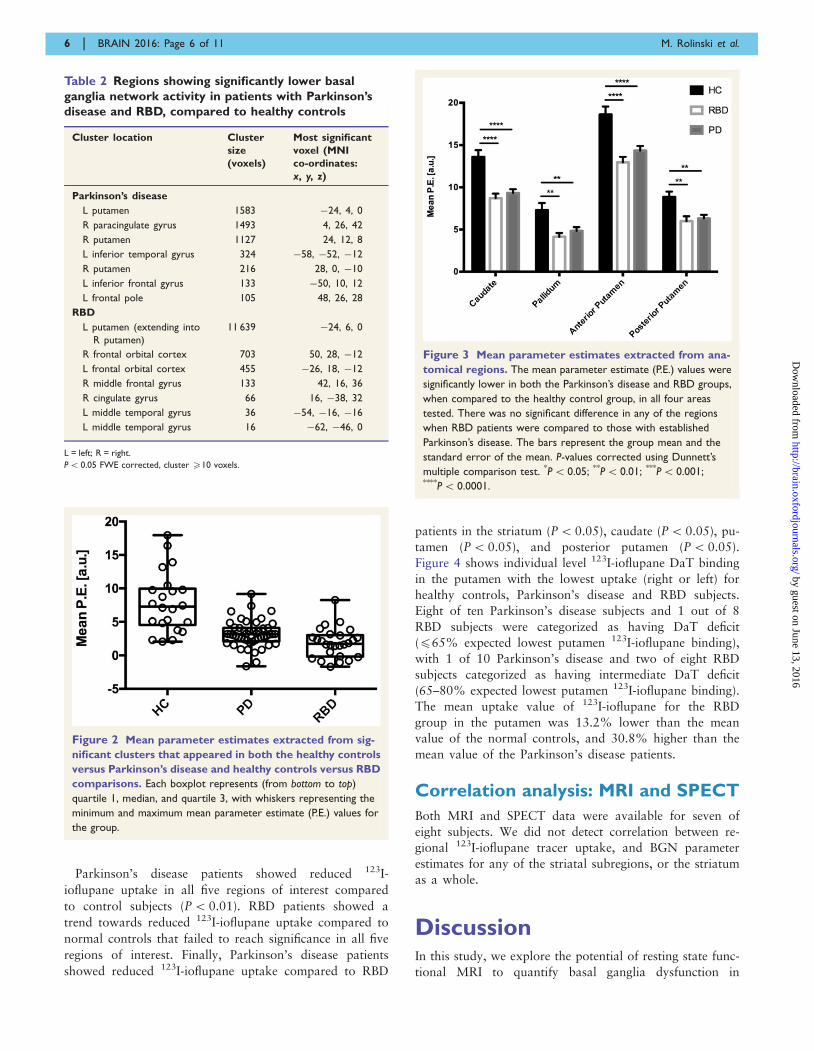
The mean parameter estimates extracted from anatomical
regions within the basal ganglia are shown in Fig. 3. Both
the Parkinson’s disease and RBD groups had significantly
lower parameter estimate values within the caudate, palli-
dum, and the anterior and posterior putamen, when com-
pared to the healthy control group. There were no
statistically significant differences between the RBD and
Parkinson’s disease groups.
SPECT data
The clinical characteristics and mean uptake values from of
the 123I-ioflupane SPECT study are summarized in Tables 3
and 4.
Figure 1 Results of resting state functional MRI analysis. Group difference maps illustrate clusters of significantly reduced connectivity
(blue) in patients with (A) Parkinson’s disease and (B) RBD, when compared to healthy controls. Clusters are thresholded at P5 0.05 after TFCE
correction. A map of the BGN in shown in orange (thresholded at Z5 2.6).
Basal ganglia dysfunction in RBD and early Parkinson’s disease BRAIN 2016: Page 5 of 11 | 5
by guest on June 13, 2016http://brain.oxfordjournals.org/
Dow
nloaded from
Parkinson’s disease patients showed reduced 123I-
ioflupane uptake in all five regions of interest compared
to control subjects (P5 0.01). RBD patients showed a
trend towards reduced 123I-ioflupane uptake compared to
normal controls that failed to reach significance in all five
regions of interest. Finally, Parkinson’s disease patients
showed reduced 123I-ioflupane uptake compared to RBD
patients in the striatum (P5 0.05), caudate (P5 0.05), pu-
tamen (P5 0.05), and posterior putamen (P50.05).
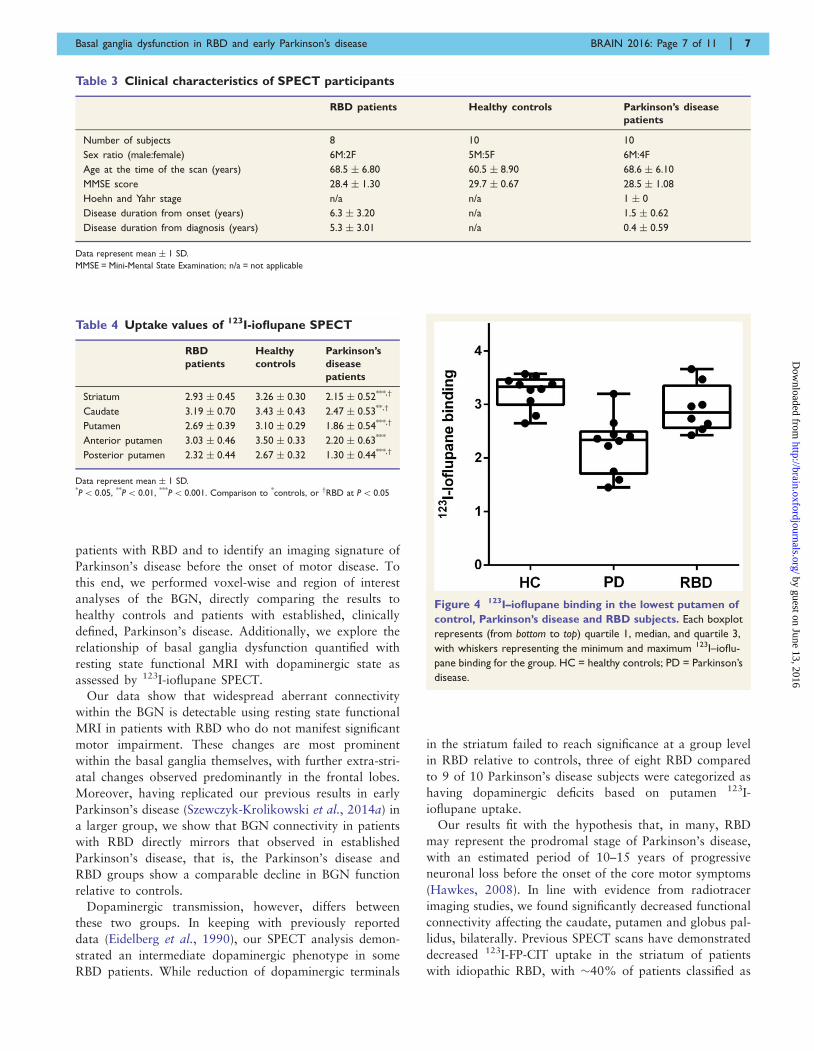
Figure 4 shows individual level 123I-ioflupane DaT binding
in the putamen with the lowest uptake (right or left) for
healthy controls, Parkinson’s disease and RBD subjects.
Eight of ten Parkinson’s disease subjects and 1 out of 8
RBD subjects were categorized as having DaT deficit
(465% expected lowest putamen 123I-ioflupane binding),
with 1 of 10 Parkinson’s disease and two of eight RBD
subjects categorized as having intermediate DaT deficit
(65–80% expected lowest putamen 123I-ioflupane binding).
The mean uptake value of 123I-ioflupane for the RBD
group in the putamen was 13.2% lower than the mean
value of the normal controls, and 30.8% higher than the
mean value of the Parkinson’s disease patients.
Correlation analysis: MRI and SPECT
Both MRI and SPECT data were available for seven of
eight subjects. We did not detect correlation between re-
gional 123I-ioflupane tracer uptake, and BGN parameter
estimates for any of the striatal subregions, or the striatum
as a whole.
DiscussionIn this study, we explore the potential of resting state func-
tional MRI to quantify basal ganglia dysfunction in
Figure 3 Mean parameter estimates extracted from ana-
tomical regions. The mean parameter estimate (P.E.) values were
significantly lower in both the Parkinson’s disease and RBD groups,
when compared to the healthy control group, in all four areas
tested. There was no significant difference in any of the regions
when RBD patients were compared to those with established
Parkinson’s disease. The bars represent the group mean and the
standard error of the mean. P-values corrected using Dunnett’s
multiple comparison test. *P5 0.05; **P5 0.01; ***P5 0.001;****P5 0.0001.
Table 2 Regions showing significantly lower basal
ganglia network activity in patients with Parkinson’s
disease and RBD, compared to healthy controls
Cluster location Cluster
size
(voxels)
Most significant
voxel (MNI
co-ordinates:
x, y, z)
Parkinson’s disease
L putamen 1583 �24, 4, 0
R paracingulate gyrus 1493 4, 26, 42
R putamen 1127 24, 12, 8
L inferior temporal gyrus 324 �58, �52, �12
R putamen 216 28, 0, �10
L inferior frontal gyrus 133 �50, 10, 12
L frontal pole 105 48, 26, 28
RBD
L putamen (extending into
R putamen)
11 639 �24, 6, 0
R frontal orbital cortex 703 50, 28, �12
L frontal orbital cortex 455 �26, 18, �12
R middle frontal gyrus 133 42, 16, 36
R cingulate gyrus 66 16, �38, 32
L middle temporal gyrus 36 �54, �16, �16
L middle temporal gyrus 16 �62, �46, 0
L = left; R = right.
P5 0.05 FWE corrected, cluster 510 voxels.
Figure 2 Mean parameter estimates extracted from sig-
nificant clusters that appeared in both the healthy controls
versus Parkinson’s disease and healthy controls versus RBD
comparisons. Each boxplot represents (from bottom to top)
quartile 1, median, and quartile 3, with whiskers representing the
minimum and maximum mean parameter estimate (P.E.) values for
the group.
6 | BRAIN 2016: Page 6 of 11 M. Rolinski et al.
by guest on June 13, 2016http://brain.oxfordjournals.org/
Dow
nloaded from
patients with RBD and to identify an imaging signature of
Parkinson’s disease before the onset of motor disease. To
this end, we performed voxel-wise and region of interest
analyses of the BGN, directly comparing the results to
healthy controls and patients with established, clinically
defined, Parkinson’s disease. Additionally, we explore the
relationship of basal ganglia dysfunction quantified with
resting state functional MRI with dopaminergic state as
assessed by 123I-ioflupane SPECT.
Our data show that widespread aberrant connectivity
within the BGN is detectable using resting state functional
MRI in patients with RBD who do not manifest significant
motor impairment. These changes are most prominent
within the basal ganglia themselves, with further extra-stri-
atal changes observed predominantly in the frontal lobes.
Moreover, having replicated our previous results in early
Parkinson’s disease (Szewczyk-Krolikowski et al., 2014a) in
a larger group, we show that BGN connectivity in patients
with RBD directly mirrors that observed in established
Parkinson’s disease, that is, the Parkinson’s disease and
RBD groups show a comparable decline in BGN function
relative to controls.
Dopaminergic transmission, however, differs between
these two groups. In keeping with previously reported
data (Eidelberg et al., 1990), our SPECT analysis demon-
strated an intermediate dopaminergic phenotype in some
RBD patients. While reduction of dopaminergic terminals
in the striatum failed to reach significance at a group level
in RBD relative to controls, three of eight RBD compared
to 9 of 10 Parkinson’s disease subjects were categorized as
having dopaminergic deficits based on putamen 123I-
ioflupane uptake.
Our results fit with the hypothesis that, in many, RBD
may represent the prodromal stage of Parkinson’s disease,
with an estimated period of 10–15 years of progressive
neuronal loss before the onset of the core motor symptoms
(Hawkes, 2008). In line with evidence from radiotracer
imaging studies, we found significantly decreased functional
connectivity affecting the caudate, putamen and globus pal-
lidus, bilaterally. Previous SPECT scans have demonstrated
decreased 123I-FP-CIT uptake in the striatum of patients
with idiopathic RBD, with �40% of patients classified as
Table 3 Clinical characteristics of SPECT participants
RBD patients Healthy controls Parkinson’s disease
patients
Number of subjects 8 10 10
Sex ratio (male:female) 6M:2F 5M:5F 6M:4F
Age at the time of the scan (years) 68.5 � 6.80 60.5 � 8.90 68.6 � 6.10
MMSE score 28.4 � 1.30 29.7 � 0.67 28.5 � 1.08
Hoehn and Yahr stage n/a n/a 1 � 0
Disease duration from onset (years) 6.3 � 3.20 n/a 1.5 � 0.62
Disease duration from diagnosis (years) 5.3 � 3.01 n/a 0.4 � 0.59
Data represent mean � 1 SD.
MMSE = Mini-Mental State Examination; n/a = not applicable
Figure 4 123I–ioflupane binding in the lowest putamen of
control, Parkinson’s disease and RBD subjects. Each boxplot
represents (from bottom to top) quartile 1, median, and quartile 3,
with whiskers representing the minimum and maximum 123I–ioflu-
pane binding for the group. HC = healthy controls; PD = Parkinson’s
disease.
Table 4 Uptake values of 123I-ioflupane SPECT
RBD
patients
Healthy
controls
Parkinson’s
disease
patients
Striatum 2.93 � 0.45 3.26 � 0.30 2.15 � 0.52***,†
Caudate 3.19 � 0.70 3.43 � 0.43 2.47 � 0.53**,†
Putamen 2.69 � 0.39 3.10 � 0.29 1.86 � 0.54***,†
Anterior putamen 3.03 � 0.46 3.50 � 0.33 2.20 � 0.63***
Posterior putamen 2.32 � 0.44 2.67 � 0.32 1.30 � 0.44***,†
Data represent mean � 1 SD.*P5 0.05, **P5 0.01, ***P5 0.001. Comparison to *controls, or †RBD at P5 0.05
Basal ganglia dysfunction in RBD and early Parkinson’s disease BRAIN 2016: Page 7 of 11 | 7
by guest on June 13, 2016http://brain.oxfordjournals.org/
Dow
nloaded from
having a clinically abnormal scan (Eisensehr et al., 2003;
Iranzo et al., 2010). Similarly, decreased 11C-dihydrotetra-
benazine (11C-DTBZ) striatal binding on PET scanning sug-
gests loss of dopaminergic neurons in patients with RBD
(Albin et al., 2000). Supporting the concept of a BGN dys-
function in RBD, a previous PET study has established an
expression of the metabolic Parkinson disease-related spa-
tial covariance pattern in RBD using 18FDG-PET
(Holtbernd et al., 2014).
In the only previously published study of resting state
connectivity in RBD, Ellmore and colleagues (2013) re-
ported on seed-based nigrostriatal and nigrocortical con-
nectivity in 10 RBD patients, 11 Parkinson’s disease
patients and 10 healthy controls. The authors reported
altered connectivity between the left substantia nigra and
the left putamen, and the right substantia nigra and the
right cuneus/precuneus/superior occipital gyrus. In all
cases, the connectivity between these structures was signifi-
cantly different in patients with RBD compared to both the
Parkinson’s disease and healthy control groups. However,
there was not always a difference between Parkinson’s dis-
ease and healthy controls, creating uncertainty on the rela-
tionship between these seed-based measures and nigrofugal
pathway dysfunction. In contrast, our study used a data-
driven approach to investigate the basal ganglia functional
network as a whole. Unlike the previous seed-based study,
we found no significant BGN differences between the RBD
and Parkinson’s disease groups, whether comparing the
groups on a voxel-wise or region of interest basis.
The apparent floor effect we have observed across the
basal ganglia functional network in Parkinson’s disease
and RBD subjects compared to the intermediate dopamin-
ergic phenotype seen in RBD with 123I-ioflupane uptake
may be best understood by appreciating what these differ-
ent imaging modalities measure. Resting state functional
MRI uses resting blood oxygen level-dependent signal to
identify brain regions showing a strong temporal coherence
(coactivation) in low frequency fluctuations (typically
50.1 Hz). These regions are defined as resting state net-
works, and reflect the intrinsic properties of brain organ-
ization (Filippini et al., 2009). Increased default mode
network (DMN) coactivation in APOE "4 carriers at
higher risk of future dementia has been demonstrated dec-
ades before any clinical, structural or neurophysiological
correlate of neurodegeneration in young healthy adult car-
riers (Filippini et al., 2009). These changes were unex-
plained by differences in memory performance, brain
morphology or resting cerebral blood flow.
In our prodromal RBD subjects, the observed changes in
BGN connectivity may occur years or even decades before
the onset of clinical RBD symptoms, let alone significant
motor impairment leading to a Parkinson’s diagnosis.
Furthermore, it is well recognized that RBD subjects fre-
quently manifest subtle features of motor impairment prior
to their Parkinson’s disease diagnosis, supported by our
finding of a mean motor UPDRS III score of 3.3 in the
RBD cohort. This might suggest that RBD and
Parkinson’s disease are not discrete clinical entities, but in
fact manifestations of the same condition at different time
points, with a detectable resting state functional MRI cor-
relate very early in the disease evolution. Although longi-
tudinal clinical and neuroimaging follow-up of the study
groups is currently underway to formally assess this, our
results would suggest that there is no increase in desyn-
chronization within the BGN as individuals move from
the premotor to the motor stage of Parkinson’s disease.
This is consistent with our previous findings that basal
ganglia connectivity does not correlate with the severity
of motor impairment in established Parkinson’s disease
(Szewczyk-Krolikowski et al., 2014a; Rolinski et al., 2015).
In contrast, dopaminergic function estimated with 123I-
ioflupane SPECT or 18F-Fluorodopa PET is directly related
to proportion of surviving substantia nigra dopaminergic
neurons and related dopaminergic nerve terminal density,
with its strongest clinical correlate being contralateral rigid-
ity and bradykinesia (Leenders et al., 1990). Our finding of
an intermediate dopaminergic phenotype in RBD compared
to Parkinson’s disease may simply reflect the relative tem-
poral progression seen with these imaging modalities, with
functional coherence being affected many years prior to the
onset of dopaminergic neuronal degeneration. Furthermore,
significant motor symptoms generally emerge only after
50–70% of dopaminergic nerve terminals have been irre-
versibly lost (Fearnley and Lees 1991), while compensatory
or reactive changes in functional brain networks measured
with resting state functional MRI will inevitably predate
this by several years. Longitudinal studies will also help
address the interesting question of whether the transition
from RBD to Parkinson’s disease might be marked by
changes in the functional coherence of resting state net-
works other than the BGN, such as the default mode net-
work, which may be of particular relevance given the
higher cognitive burden when early Parkinson’s disease is
associated with concomitant RBD (Rolinski et al., 2014).
We also detected reduced connectivity outside the basal
ganglia, including a number of frontal areas, such as the
cingulate, paracingulate and middle frontal gyri in
Parkinson’s disease and RBD subjects compared to
controls.
Functional connections between the basal ganglia and
these frontal areas are known to be associated with execu-
tive function (Gordon et al., 2015). Although executive
dysfunction was not formally assessed in this study,
global measures of cognitive function (Montreal Cognitive
Assessment, Mini-Mental State Examination) and verbal
fluency were reduced in RBD compared to controls, and
in RBD compared to Parkinson’s disease subjects (Table 1).
Interestingly, voxel-wise comparison did not reveal any
statistically significant differences in these frontal areas
when patients with RBD were compared to patients with
established Parkinson’s disease, despite the observed clinical
differences in global cognition and verbal fluency.
Executive dysfunction is known to be common in early
Parkinson’s disease (Dirnberger and Jahanshahi, 2013)
8 | BRAIN 2016: Page 8 of 11 M. Rolinski et al.
by guest on June 13, 2016http://brain.oxfordjournals.org/
Dow
nloaded from
and has also been shown to be associated with RBD
(Massicotte-Marquez et al., 2008). Our imaging findings
would support this work.
Connectivity within the basal ganglia network differen-
tiated patients with RBD from healthy controls with a sen-
sitivity and specificity of 96.2% and 78.3%, respectively.
While useful in itself, the greatest utility for this approach
would be to facilitate the diagnosis of prodromal
Parkinson’s disease, expressed as BGN network dysfunc-
tion in these subjects. However, the utility of BGN dysfunc-
tion as an imaging marker for the detection of prodromal
Parkinson’s disease will only be addressed through careful
longitudinal assessment of a larger RBD cohort, which is
currently underway. We did not detect a significant correl-
ation between BGN dysfunction and radiotracer uptake in
the seven participants in whom both data were available,
which may simply reflect a lack of statistical power. Despite
best efforts, we were unable to perform SPECT scans in a
larger RBD subgroup within the time constraints for this
study, as participants were frequently unwilling to travel
the longer distances incurred.
A previous longitudinal study with serial 123I-FP-CIT
SPECT revealed significant decline in tracer uptake in pa-
tients with RBD, consistent with progressive nigrostriatal
dopaminergic dysfunction (Iranzo et al., 2011).
Importantly, it was those patients with the lowest tracer
uptake at baseline that developed Parkinson’s disease
within the 3-year follow-up period. However, these results
hold on a group level only, and due to considerable overlap
of uptake values between RBD and controls, the predictive
value of a single SPECT scan is limited. In contrast, resting
state functional MRI analysis of BGN network dysfunction
in our study yielded a sensitivity of 96.2% and specificity
of 78.3%, indicating its potential as an indicator of early
basal ganglia dysfunction. Moreover, compared to radio-
tracer imaging, resting state functional MRI does not carry
an ionizing radiation burden; it is also cheaper and more
readily accessible.
The advanced imaging techniques included in this study
are currently research tools. Further independent validation
and correlation with clinical outcomes will be necessary
before they may be considered for true diagnostic use.
Longitudinal clinical and MRI follow-up of our cohort,
as well as acquisition of locally-acquired SPECT data, are
currently underway to allow us to assess the potential for
resting state functional MRI to predict the onset of
Parkinson’s disease, and to investigate its relationship
with dopaminergic dysfunction.
In our study, voxel-based morphometry analysis did not
yield any significant grey matter differences between the
three groups, including within cortex or the brainstem sub-
regions, which could account for the differences in func-
tional connectivity. Whilst previous studies have reported
grey matter abnormalities associated with RBD (Ellmore
et al., 2010; Scherfler et al., 2011; Hanyu et al., 2012),
subjects in these studies have generally had a longer re-
ported RBD disease duration (9.2 years, Scherfler et al.,
2011) than the mean of 2.4 years in our relatively early
cohort, which may have influenced results. Our findings
mirror those in early Parkinson’s disease, where the use
of structural compared to functional imaging has been
somewhat disappointing (Menke et al., 2014; Szewczyk-
Krolikowski et al., 2014a). One could therefore speculate
that on the basis of our results, the imaging correlate of
RBD progression to established motoric Parkinson’s disease
is the evolution from functional network reorganization,
through mild cortical and subcortical atrophy, followed
by significant midbrain dopaminergic cell loss.
The diagnosis of RBD was confirmed through stringent
clinical and polysomnographic assessment, but logistical
and technical constraints meant that, in control subjects,
the presence of RBD could not be formally excluded
using polysomnography. However, the prevalence of RBD
in the general population is low (Kang et al., 2013), and
accidental inclusion of such a subject would not impact
negatively on our conclusions.
In conclusion, we have demonstrated resting state func-
tional changes in the BGN of patients with RBD, and they
mirror those of established Parkinson’s disease. Our find-
ings support the presence of early basal ganglia dysfunction
in these patients even before the onset of clinically relevant
motor symptoms. Clinical and neuroimaging follow-up is
necessary to assess the clinical utility of resting state func-
tional MRI as an imaging biomarker to identify those most
at risk of future conversion to the motor stages of
Parkinson’s disease. This emerging MRI technique has the
potential to deliver individualized risk assessment using a
multimodal approach combined with other clinical meas-
ures, and has important implications for future neuropro-
tective trials in this key prodromal group.
AcknowledgementsThe authors thank all participants that have taken part.
FundingThis study was funded by the Monument Trust Discovery
Award from Parkinson’s UK, the Michael J Fox
Foundation for Parkinson’s Research (USA) and supported
by the National Institute for Health Research (NIHR)
Oxford Biomedical Research Centre based at Oxford
University Hospitals NHS Trust and University of
Oxford, and the Dementias and Neurodegenerative
Diseases Research Network (DeNDRoN).
ReferencesAlbin RL, Koeppe RA, Chervin RD, Consens FB, Wernette K, Frey
KA, et al. Decreased striatal dopaminergic innervation in REM sleep
behavior disorder. Neurology 2000; 55: 1410–12.
Basal ganglia dysfunction in RBD and early Parkinson’s disease BRAIN 2016: Page 9 of 11 | 9
by guest on June 13, 2016http://brain.oxfordjournals.org/
Dow
nloaded from
Beckmann CF. Modelling with independent components. NeuroImage
2012; 62: 891–901.
Beckmann CF, Smith SM. Probabilistic independent component ana-
lysis for functional magnetic resonance imaging. IEEE Trans Med
Imaging 2004; 23: 137–52.
Boot BP, Boeve BF, Roberts RO, Ferman TJ, Geda YE, Pankratz VS,
et al. Probable rapid eye movement sleep behavior disorder increases
risk for mild cognitive impairment and Parkinson disease: a popu-
lation-based study. Ann Neurol 2012; 71: 49–56.
Dirnberger G, Jahanshahi M. Executive dysfunction in Parkinson’s
disease: a review. J Neuropsychol 2013; 7: 193–224.
Douaud G, Mackay C, Andersson J, James S, Quested D, Ray MK,
et al. Schizophrenia delays and alters maturation of the brain in
adolescence. Brain 2009; 132 (Pt 9): 2437–48.
Eidelberg D, Moeller JR, Dhawan V, Sidtis JJ, Ginos JZ, Strother SC,
et al. The metabolic anatomy of Parkinson’s disease: complementary
[18F]fluorodeoxyglucose and [18F]fluorodopa positron emission
tomographic studies. Mov Disord 1990; 5: 203–13.Eisensehr I, Linke R, Tatsch K, Kharraz B, Gildehaus JF, Wetter CT,
et al. Increased muscle activity during rapid eye movement sleep
correlates with decrease of striatal presynaptic dopamine trans-
porters. IPT and IBZM SPECT imaging in subclinical and clinically
manifest idiopathic REM sleep behavior disorder, Parkinson’s dis-
ease, and controls. Sleep 2003; 26: 507–12.
Ellmore TM, Castriotta RJ, Hendley KL, Aalbers BM, Furr-Stimming
E, Hood AJ, et al. Altered nigrostriatal and nigrocortical functional
connectivity in rapid eye movement sleep behavior disorder. Sleep
2013; 36:1885–92.Ellmore TM, Hood AJ, Castriotta RJ, Stimming EF, Bick RJ, Schiess
MC. Reduced volume of the putamen in REM sleep behavior dis-
order patients. Parkinsonism Relat Disord 2010; 16: 645–9.Fantini ML, Postuma RB, Montplaisir J, Ferini-Strambi L. Olfactory
deficit in idiopathic rapid eye movements sleep behavior disorder.
Brain Res Bull 2006; 70: 386–90.
Fearnley JM, Lees AJ. Ageing and Parkinson’s disease: substantia nigra
regional selectivity. Brain 1991; 114 (Pt 5): 2283–301.
Filippini N, MacIntosh BJ, Hough MG, Goodwin GM, Frisoni GB,
Smith SM, et al. Distinct patterns of brain activity in young carriers
of the APOE-epsilon4 allele. Proc Natl Acad Sci U S A 2009; 106:
7209–14.
Gordon EM, Devaney JM, Bean S, Vaidya CJ. Resting-state striato-
frontal functional connectivity is sensitive to DAT1 genotype and
predicts executive function. Cereb Cortex 2015; 25: 336–45.
Griffanti L, Salimi-Khorshidi G, Beckmann CF, Auerbach EJ, Douaud
G, Sexton CE, et al. ICA-based artefact removal and accelerated
fMRI acquisition for improved resting state network imaging.
NeuroImage 2014; 95: 232–47.
Hanyu H, Inoue Y, Sakurai H, Kanetaka H, Nakamura M, Miyamoto
T, et al. Voxel-based magnetic resonance imaging study of structural
brain changes in patients with idiopathic REM sleep behavior dis-
order. Parkinsonism Relat Disord 2012; 18: 136–9.
Hawkes CH. The prodromal phase of sporadic Parkinson’s disease:
does it exist and if so how long is it? Mov Disord 2008; 23: 1799–
807.
Holtbernd F, Gagnon JF, Postuma RB, Ma Y, Tang CC, Feigin A,
et al. Abnormal metabolic network activity in REM sleep behavior
disorder. Neurology 2014; 82: 620–7.
Hughes AJ, Daniel SE, Kilford L, Lees AJ. Accuracy of clinical diag-
nosis of idiopathic Parkinson’s disease: a clinico-pathological study
of 100 cases. J Neurol Neurosurg Psychiatry 1992; 55: 181–4.
Iranzo A, Lomena F, Stockner H, Valldeoriola F, Vilaseca I, Salamero
M, et al. Decreased striatal dopamine transporter uptake and sub-
stantia nigra hyperechogenicity as risk markers of synucleinopathy
in patients with idiopathic rapid-eye-movement sleep behaviour dis-
order: a prospective study [corrected]. Lancet Neurol 2010; 9:
1070–7.
Iranzo A, Molinuevo JL, Santamaria J, Serradell M, Marti MJ,
Valldeoriola F, et al. Rapid-eye-movement sleep behaviour disorder
as an early marker for a neurodegenerative disorder: a descriptive
study. Lancet Neurol 2006; 5(7): 572–7.
Iranzo A, Valldeoriola F, Lomena F, Molinuevo JL, Serradell M,
Salamero M, et al. Serial dopamine transporter imaging of nigros-
triatal function in patients with idiopathic rapid-eye-movement sleep
behaviour disorder: a prospective study. Lancet Neurol 2011; 10:
797–805.
Jenkinson M, Bannister P, Brady M, Smith S. Improved optimization
for the robust and accurate linear registration and motion correction
of brain images. NeuroImage 2002; 17: 825–41.
Jenkinson M, Beckmann CF, Behrens TE, Woolrich MW, Smith SM.
FSL. NeuroImage 2012; 62: 782–90.
Jennings D, Siderowf A, Stern M, Seibyl J, Eberly S, Oakes D, et al.
Imaging prodromal Parkinson disease. The Parkinson Associated
Risk Syndrome Study. Neurology 2014; 83:1739–46.
Kang SH, Yoon IH, Lee SD, Han JW, Kim TH, Kim KW. REM sleep
behaviour disorder in the korean elderly population: prevalence and
clinical characteristics. Sleep 2013; 36: 1147–52.
Lapierre O, Montplaisir J. Polysomnographic features of REM sleep
behavior disorder: development of a scoring method. Neurology
1992; 42: 1371–4.
Leenders KL, Salmon EP, Tyrrell P, Perani D, Brooks DJ, Sager H,
et al. The nigrostriatal dopaminergic system assessed in vivo by
positron emission tomography in healthy volunteer subjects and pa-
tients with Parkinson’s disease. Arch Neurol 1990; 47: 1290–8.
Massicotte-Marquez J, Decary A, Gagnon JF, Vendette M, Mathieu A,
Postuma RB, et al. Executive dysfunction and memory impairment
in idiopathic REM sleep behavior disorder. Neurology 2008; 70:
1250–7.
Mazziotta J, Toga A, Evans A, Fox P, Lancaster J, Zilles K, et al. A
probabilistic atlas and reference system for the human brain:
International Consortium for Brain Mapping (ICBM). Philos Trans
R Soc Lond B Biol Sci 2001; 356: 1293–322.
Menke RA, Szewczyk-Krolikowski K, Jbabdi S, Jenkinson M, Talbot
K, Mackay CE, et al. Comprehensive morphometry of subcortical
grey matter structures in early-stage Parkinson’s disease. Hum Brain
Mapp 2014; 35: 1681–90.
Postuma RB, Gagnon JF, Montplaisir J. Clinical prediction of
Parkinson’s disease: planning for the age of neuroprotection.
J Neurol Neurosurg Psychiatry 2010; 81: 1008–13.
Postuma RB, Gagnon JF, Vendette M, Fantini ML, Massicotte-
Marquez J, Montplaisir J. Quantifying the risk of neurodegenerative
disease in idiopathic REM sleep behavior disorder. Neurology
2009a; 72: 1296–300.
Postuma RB, Gagnon JF, Vendette M, Montplaisir JY. Markers of
neurodegeneration in idiopathic rapid eye movement sleep behav-
iour disorder and Parkinson’s disease. Brain 2009b; 132 (Pt 12):
3298–307.
Postuma RB, Lang AE, Massicotte-Marquez J, Montplaisir J. Potential
early markers of Parkinson disease in idiopathic REM sleep behav-
ior disorder. Neurology 2006; 66: 845–51.
Rolinski M, Griffanti L, Szewczyk-Krolikowski K, Menke RAL,
Wilcock GK, Filippini N, et al. Aberrant functional connectivity
within the basal ganglia of patients with Parkinson’s disease.
NeuroImage 2015; 8: 126–32.Rolinski M, Szewczyk-Krolikowski K, Tomlinson PR, Nithi K, Talbot
K, Ben-Shlomo Y, et al. REM sleep behaviour disorder is associated
with worse quality of life and other non-motor features in early
Parkinson’s disease. J Neurol Neurosurg Psychiatry 2014; 85:
560–6.
Salimi-Khorshidi G, Douaud G, Beckmann CF, Glasser MF, Griffanti
L, Smith SM. Automatic denoising of functional MRI data: combin-
ing independent component analysis and hierarchical fusion of clas-
sifiers. NeuroImage 2014; 90:449–68.
Schenck CH, Boeve BF, Mahowald MW. Delayed emergence of a
parkinsonian disorder or dementia in 81% of older men initially
diagnosed with idiopathic rapid eye movement sleep behavior
10 | BRAIN 2016: Page 10 of 11 M. Rolinski et al.
by guest on June 13, 2016http://brain.oxfordjournals.org/
Dow
nloaded from
disorder: a 16-year update on a previously reported series. SleepMed 2013; 14: 744–8.
Schenck CH, Bundlie SR, Mahowald MW. Delayed emergence of a
parkinsonian disorder in 38% of 29 older men initially diagnosed
with idiopathic rapid eye movement sleep behaviour disorder.Neurology 1996; 46: 388–93.
Scherfler C, Frauscher B, Schocke M, Iranzo A, Gschliesser V, Seppi K,
et al. White and gray matter abnormalities in idiopathic rapid eye
movement sleep behavior disorder: a diffusion-tensor imaging andvoxel-based morphometry study. Ann Neurology 2011; 69: 400–7.
Smith SM, Nichols TE. Threshold-free cluster enhancement: addressing
problems of smoothing, threshold dependence and localisation incluster inference. NeuroImage 2009; 44: 83–98.
Szewczyk-Krolikowski K, Menke RA, Rolinski M, Duff E, Salimi-Khorshidi G, Filippini N, et al. Functional connectivity in the
basal ganglia network differentiates PD patients from controls.
Neurology 2014a; 83: 208–14.
Szewczyk-Krolikowski K, Tomlinson P, Nithi K, Wade-Martins R,Talbot K, Ben-Shlomo Y, et al. The influence of age and gender on
motor and non-motor features of early Parkinson’s disease: initial
findings from the Oxford Parkinson Disease Center (OPDC) discovery
cohort. Parkinsonism Relat Disord 2014b; 20: 99–105.Wing YK, Li SX, Mok V, Lam SP, Tsoh J, Chan A, et al. Prospective
outcome of rapid eye movement sleep behaviour disorder: psychi-
atric disorders as a potential early marker of Parkinson’s disease. JNeurol Neurosurg psychiatry 2012; 83: 470–2.
Basal ganglia dysfunction in RBD and early Parkinson’s disease BRAIN 2016: Page 11 of 11 | 11
by guest on June 13, 2016http://brain.oxfordjournals.org/
Dow
nloaded from