Embed Size (px)
Citation preview
�
Basic Optics SystemOS-8515C
Instruct ion Manual wi thExper iment Guide and
Teachers’ Notes012-09900B
����������
������
����
�� �� ����
��� �
���
��
��
����
����
����
��
������ ��
��
���
��
��
����
� ��
���
�
� ��
���
�
� ����
� ����
�����������
������
�����
�
�
�
� ����

Basic Opt ics System Table of Contents
Introduction . . . . . . . . . . . . . . . . . . . . . . . . . . . . . . . . . . . . . . . . . . . . . . . . . . . . . . . . . . . 5
About the Equipment . . . . . . . . . . . . . . . . . . . . . . . . . . . . . . . . . . . . . . . . . . . . . . . . . . . . 6
Storage Box . . . . . . . . . . . . . . . . . . . . . . . . . . . . . . . . . . . . . . . . . . . . . . . . . . . . . . . . . . . 7
About the Experiments. . . . . . . . . . . . . . . . . . . . . . . . . . . . . . . . . . . . . . . . . . . . . . . . . . . 7
Experiment 1: Color Addition . . . . . . . . . . . . . . . . . . . . . . . . . . . . . . . . . . . . . . . . . . . . . . 9
Experiment 2: Prism. . . . . . . . . . . . . . . . . . . . . . . . . . . . . . . . . . . . . . . . . . . . . . . . . . . . 11
Experiment 3: Reflection . . . . . . . . . . . . . . . . . . . . . . . . . . . . . . . . . . . . . . . . . . . . . . . . 13
Experiment 4: Snell’s Law . . . . . . . . . . . . . . . . . . . . . . . . . . . . . . . . . . . . . . . . . . . . . . . 15
Experiment 5: Total Internal Reflection . . . . . . . . . . . . . . . . . . . . . . . . . . . . . . . . . . . . . 17
Experiment 6: Convex and Concave Lenses. . . . . . . . . . . . . . . . . . . . . . . . . . . . . . . . . 19
Experiment 7: Hollow Lens . . . . . . . . . . . . . . . . . . . . . . . . . . . . . . . . . . . . . . . . . . . . . . 21
Experiment 8: Lensmaker’s Equation . . . . . . . . . . . . . . . . . . . . . . . . . . . . . . . . . . . . . . 23
Experiment 9: Apparent Depth. . . . . . . . . . . . . . . . . . . . . . . . . . . . . . . . . . . . . . . . . . . . 25
Experiment 10: Reversibility . . . . . . . . . . . . . . . . . . . . . . . . . . . . . . . . . . . . . . . . . . . . . 29
Experiment 11: Dispersion. . . . . . . . . . . . . . . . . . . . . . . . . . . . . . . . . . . . . . . . . . . . . . . 31
Experiment 12: Focal Length and Magnification of a Thin Lens . . . . . . . . . . . . . . . . . . 33
Experiment 13: Focal Length and Magnification of a Concave Mirror . . . . . . . . . . . . . . 37
Experiment 14: Virtual Images. . . . . . . . . . . . . . . . . . . . . . . . . . . . . . . . . . . . . . . . . . . . 41
Experiment 15: Telescope . . . . . . . . . . . . . . . . . . . . . . . . . . . . . . . . . . . . . . . . . . . . . . . 47
Experiment 16: Microscope . . . . . . . . . . . . . . . . . . . . . . . . . . . . . . . . . . . . . . . . . . . . . . 51
Experiment 17: Shadows. . . . . . . . . . . . . . . . . . . . . . . . . . . . . . . . . . . . . . . . . . . . . . . . 55
Telescope and Microscope Test Pattern . . . . . . . . . . . . . . . . . . . . . . . . . . . . . . . . . . . . 57
Teacher’s Guide. . . . . . . . . . . . . . . . . . . . . . . . . . . . . . . . . . . . . . . . . . . . . . . . . . . . . . . 59
Storage Box . . . . . . . . . . . . . . . . . . . . . . . . . . . . . . . . . . . . . . . . . . . . . . . . . . . . . . . . . . 69
Technical Support . . . . . . . . . . . . . . . . . . . . . . . . . . . . . . . . . . . . . . . . . . . . . . . . . . . . . 71
Basic Optics SystemOS-8515C
� 4
����������
������
����
�� �� ����
��� �
���
��
��
����
����
����
��
������ ��
��
���
��
��
����
� ��
���
�
� ��
���
�
� ����
� ����
�����������
������
�����
�
�
�
� ����
2
3
4
5
6
7
8
a
de
f
c
b
1
13
12
11
10
9
� 5
Introduction
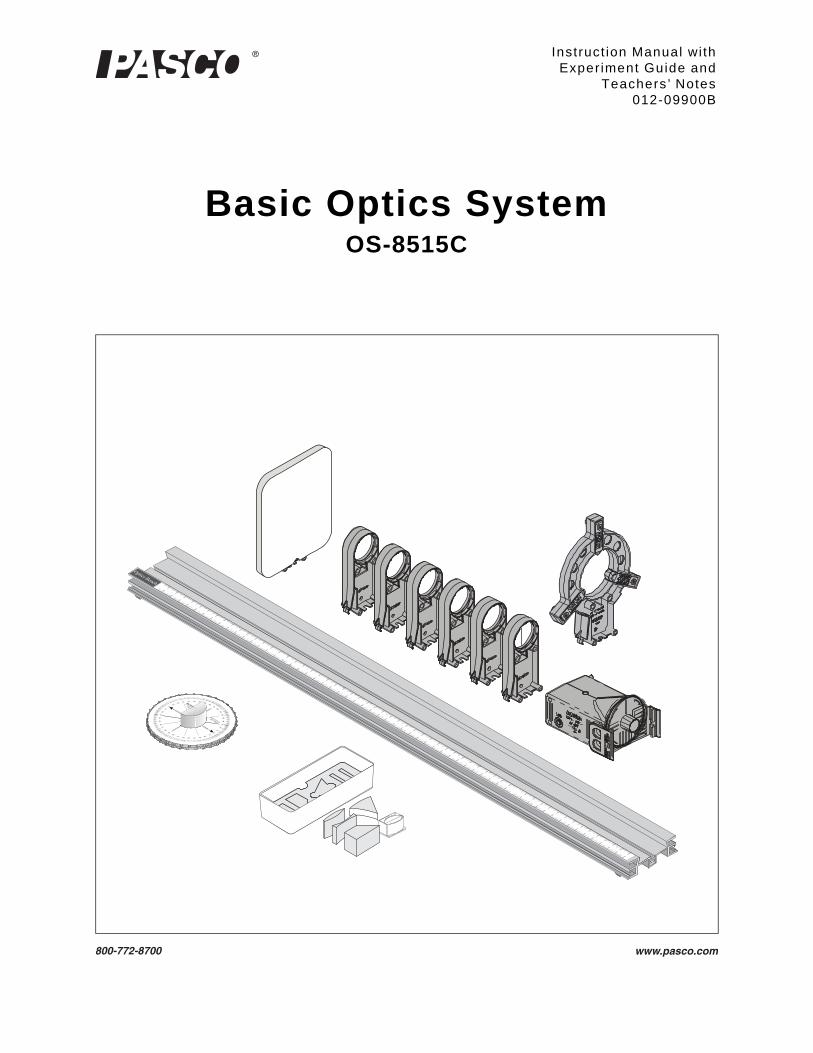
The PASCO Basic Optics System contains the optics components you will need for a variety of experiments and demonstrations. This manual includes student instructions and teacher’s notes for 17 typical experiments.
For an even greater variety, you can expand the system with any of the Basic Optics kits and components avail-able from PASCO, including lasers, polarizers, diffraction slits, and light sensors. See the PASCO Physics cata-log or visit www.pasco.com for details.
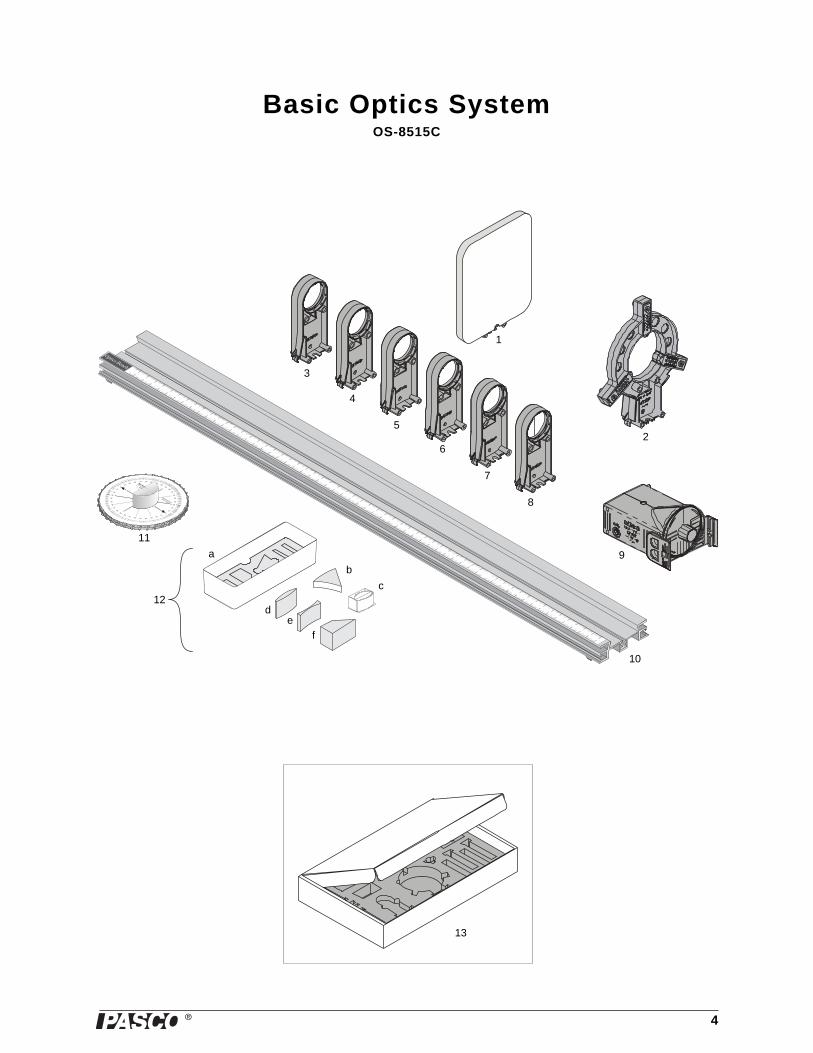
Included Equipment Part Number
1. Viewing Screen OS-8460
2. Adjustable Lens Holder OS-8474
3. +100 mm Mounted LensOS-8456
4. +200 mm Mounted Lens
5. +250 mm Mounted LensOS-8519
6. −150 mm Mounted Lens
7. Concave/convex MirrorOS-8457
8. Half-screen
9. Light Source OS-8470
10. 1.2 m Optics Bench OS-8508
11. Ray Table with D-shaped Lens OS-8465
12. Ray Optics Kit with: OS-8516A
a. Storage Box/Water Tank 740-177
b. Mirror 636-05100
c. Hollow Lens OS-8511
d. Convex Lens 636-05501
e. Concave Lens 636-05502
f. Acrylic Trapezoid 636-05611
13. Storage Box 740-09892
�
Basic Opt ics System About the Equipment
6
About the Equipment
For detailed information on the Light Source, Ray Table, Adjustable Lens Holder, and Ray Optics Kit, see the instruction sheets included with those components.
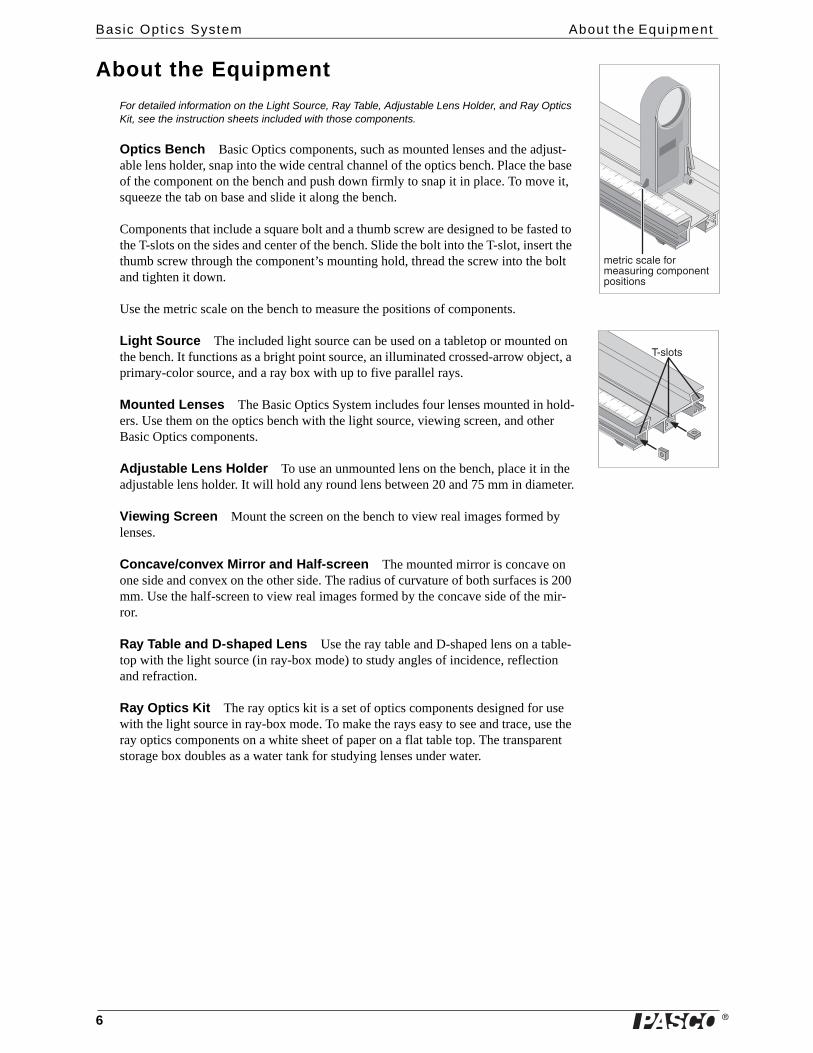
Optics Bench Basic Optics components, such as mounted lenses and the adjust-able lens holder, snap into the wide central channel of the optics bench. Place the base of the component on the bench and push down firmly to snap it in place. To move it, squeeze the tab on base and slide it along the bench.
Components that include a square bolt and a thumb screw are designed to be fasted to the T-slots on the sides and center of the bench. Slide the bolt into the T-slot, insert the thumb screw through the component’s mounting hold, thread the screw into the bolt and tighten it down.
Use the metric scale on the bench to measure the positions of components.
Light Source The included light source can be used on a tabletop or mounted on the bench. It functions as a bright point source, an illuminated crossed-arrow object, a primary-color source, and a ray box with up to five parallel rays.
Mounted Lenses The Basic Optics System includes four lenses mounted in hold-ers. Use them on the optics bench with the light source, viewing screen, and other Basic Optics components.
Adjustable Lens Holder To use an unmounted lens on the bench, place it in the adjustable lens holder. It will hold any round lens between 20 and 75 mm in diameter.
Viewing Screen Mount the screen on the bench to view real images formed by lenses.
Concave/convex Mirror and Half-screen The mounted mirror is concave on one side and convex on the other side. The radius of curvature of both surfaces is 200 mm. Use the half-screen to view real images formed by the concave side of the mir-ror.
Ray Table and D-shaped Lens Use the ray table and D-shaped lens on a table-top with the light source (in ray-box mode) to study angles of incidence, reflection and refraction.
Ray Optics Kit The ray optics kit is a set of optics components designed for use with the light source in ray-box mode. To make the rays easy to see and trace, use the ray optics components on a white sheet of paper on a flat table top. The transparent storage box doubles as a water tank for studying lenses under water.
��������� !��"#��� �$��%&��#�'#%�%�'#����#%�
���!#��
�
Model No. OS-8515C Storage Box
7
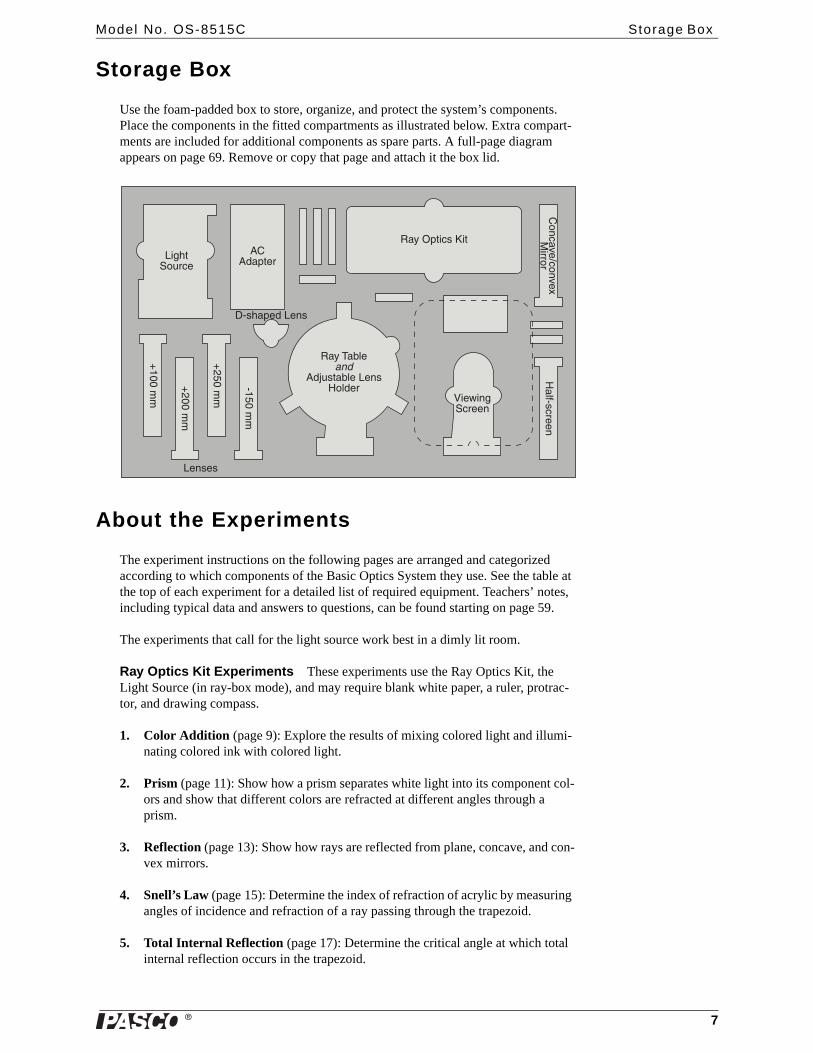
Storage Box
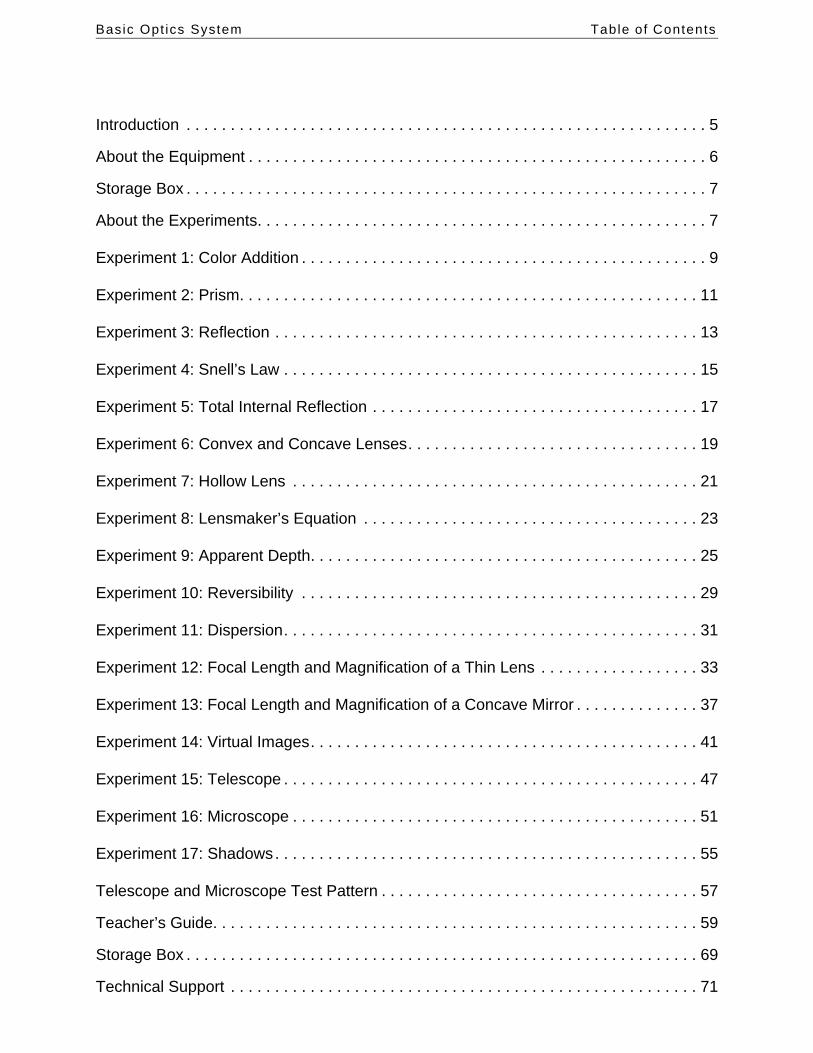
Use the foam-padded box to store, organize, and protect the system’s components. Place the components in the fitted compartments as illustrated below. Extra compart-ments are included for additional components as spare parts. A full-page diagram appears on page 69. Remove or copy that page and attach it the box lid.
About the Experiments
The experiment instructions on the following pages are arranged and categorized according to which components of the Basic Optics System they use. See the table at the top of each experiment for a detailed list of required equipment. Teachers’ notes, including typical data and answers to questions, can be found starting on page 59.
The experiments that call for the light source work best in a dimly lit room.
Ray Optics Kit Experiments These experiments use the Ray Optics Kit, the Light Source (in ray-box mode), and may require blank white paper, a ruler, protrac-tor, and drawing compass.
1. Color Addition (page 9): Explore the results of mixing colored light and illumi-nating colored ink with colored light.
2. Prism (page 11): Show how a prism separates white light into its component col-ors and show that different colors are refracted at different angles through a prism.
3. Reflection (page 13): Show how rays are reflected from plane, concave, and con-vex mirrors.
4. Snell’s Law (page 15): Determine the index of refraction of acrylic by measuring angles of incidence and refraction of a ray passing through the trapezoid.
5. Total Internal Reflection (page 17): Determine the critical angle at which total internal reflection occurs in the trapezoid.
��&(��#$���
���) '���
� *� '�����+��
� *�� ,!����
�)-$�� ,!����%�.#!)��
/��0�%&�����%
��%���
1������
1������
1������
�������
2��( '�)���%�
. !"������%
�#%� 3�4�#%3�5
����#�
�
Basic Opt ics System About the Exper iments
8
6. Convex and Concave Lenses (page 19): Use ray tracing to determine the focal lengths of lenses.
7. Hollow Lens (page 21): Use the hollow lens and water to explore how the prop-erties of a lens are related to its shape, its index of refraction, and the index of refraction of the surrounding medium.
8. Lensmaker’s Equation (page 23): Determine the focal length of a concave lens by measuring its radius of curvature.
9. Apparent Depth (page 25): Measure the apparent depth of the trapezoid and determine its index of refraction by comparing the apparent depth to the actual thickness.
Ray Table Experiments These experiments use the Ray Table with the D-shaped Lens and the Light Source (in ray-box mode).
10. Reversibility (page 29): Explore how the relationship between the angles of inci-dence and refraction is related to the direction of propagation.
11. Dispersion (page 31): Show how white light is separated into colors by the acrylic D-shaped lens and determine the different indices of refraction for red and blue light.
Optics Bench Experiments These experiments use the Optics Bench, Mounted Lenses, and Viewing Screen. Experiments 12 and 17 also use the Light Source.
12. Focal Length and Magnification of a Thin Lens (page 33): Determine the focal length of a converging lens and measure the magnification for a certain combination of object and image distances.
13. Focal Length and Magnification of a Concave Mirror (page 37): Determine the focal length of a concave mirror and measure the magnification for a certain combination of object and image distances.
14. Virtual Images (page 41): Study virtual images formed by a diverging lens and a convex mirror.
15. Telescope (page 47): Construct a telescope and determine its magnification.
16. Microscope (page 51): Construct a microscope and determine its magnification.
17. Shadows (page 55): Show the umbra and the penumbra of a shadow.
�
Model No. OS-8515C Exper iment 1: Color Addit ion
9
Experiment 1: Color Addition
Purpose
In Part 1 of this experiment, you will discover the results of mixing red, green, and blue light in different combinations. In Part 2, you will compare the appearance of red, blue, and black ink illuminated by red and blue light.
Part 1: Addition of Colored Light
Procedure
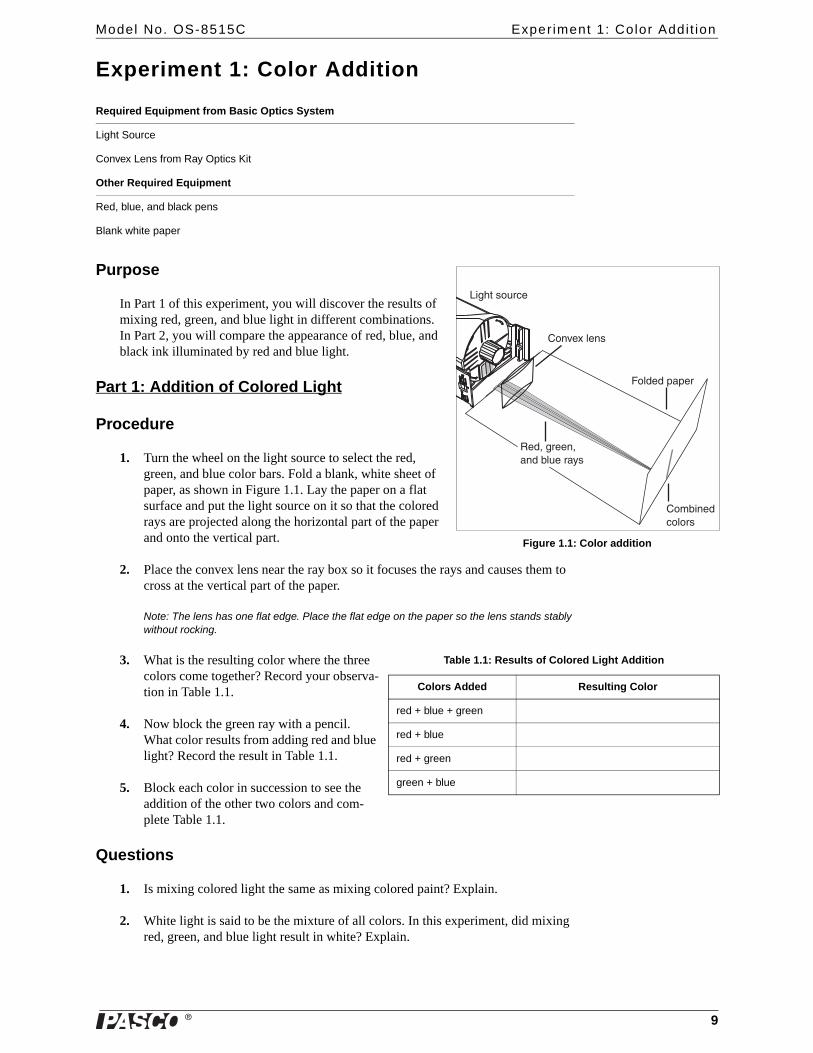
1. Turn the wheel on the light source to select the red, green, and blue color bars. Fold a blank, white sheet of paper, as shown in Figure 1.1. Lay the paper on a flat surface and put the light source on it so that the colored rays are projected along the horizontal part of the paper and onto the vertical part.
2. Place the convex lens near the ray box so it focuses the rays and causes them to cross at the vertical part of the paper.
Note: The lens has one flat edge. Place the flat edge on the paper so the lens stands stably without rocking.
3. What is the resulting color where the three colors come together? Record your observa-tion in Table 1.1.
4. Now block the green ray with a pencil. What color results from adding red and blue light? Record the result in Table 1.1.
5. Block each color in succession to see the addition of the other two colors and com-plete Table 1.1.
Questions
1. Is mixing colored light the same as mixing colored paint? Explain.
2. White light is said to be the mixture of all colors. In this experiment, did mixing red, green, and blue light result in white? Explain.
Required Equipment from Basic Optics System
Light Source
Convex Lens from Ray Optics Kit
Other Required Equipment
Red, blue, and black pens
Blank white paper
6#!)�)�' '��
�#%3�5�!�%�
��&(���#$���
��)7�&���%7 %)�,!$��� *�
�#�,�%�)�#!#��
Figure 1.1: Color addition
Table 1.1: Results of Colored Light Addition
Colors Added Resulting Color
red + blue + green
red + blue
red + green
green + blue
�
Basic Opt ics System Exper iment 1: Color Addit ion
10
Part 2: Observing Colored Ink Under Colored Light
Procedure
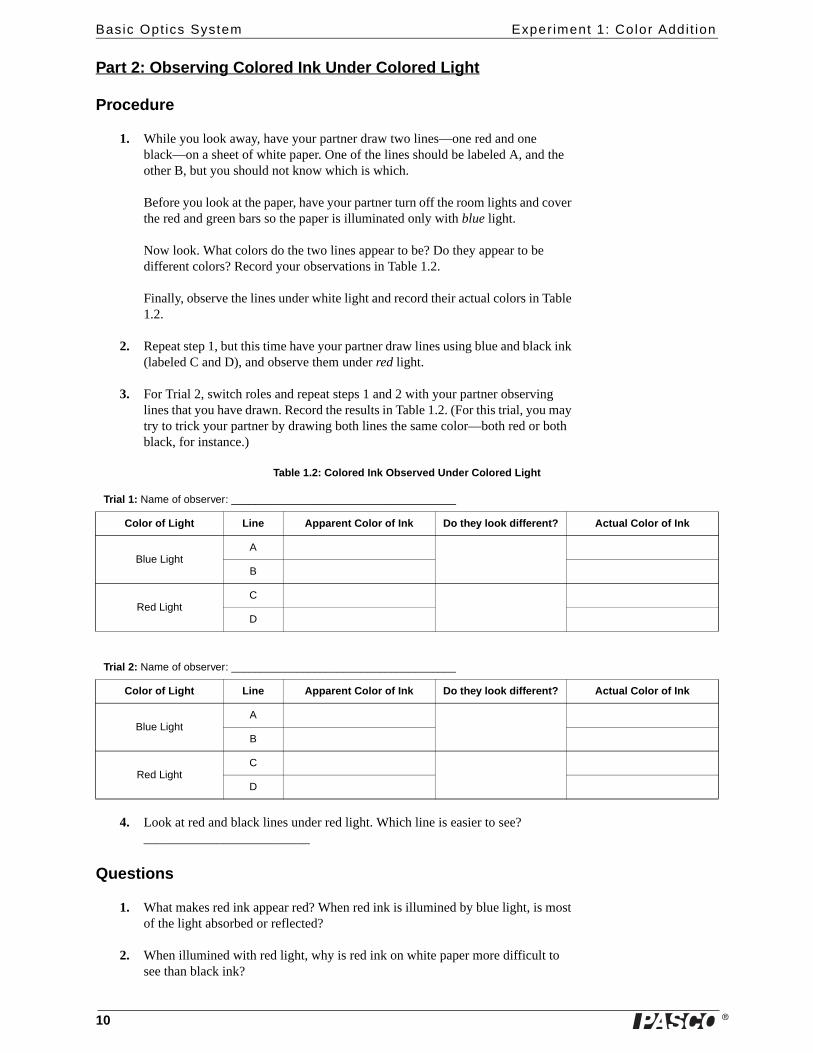
1. While you look away, have your partner draw two lines—one red and one black—on a sheet of white paper. One of the lines should be labeled A, and the other B, but you should not know which is which.
Before you look at the paper, have your partner turn off the room lights and cover the red and green bars so the paper is illuminated only with blue light.
Now look. What colors do the two lines appear to be? Do they appear to be different colors? Record your observations in Table 1.2.
Finally, observe the lines under white light and record their actual colors in Table 1.2.
2. Repeat step 1, but this time have your partner draw lines using blue and black ink (labeled C and D), and observe them under red light.
3. For Trial 2, switch roles and repeat steps 1 and 2 with your partner observing lines that you have drawn. Record the results in Table 1.2. (For this trial, you may try to trick your partner by drawing both lines the same color—both red or both black, for instance.)
4. Look at red and black lines under red light. Which line is easier to see? _________________________
Questions
1. What makes red ink appear red? When red ink is illumined by blue light, is most of the light absorbed or reflected?
2. When illumined with red light, why is red ink on white paper more difficult to see than black ink?
Table 1.2: Colored Ink Observed Under Colored Light
Trial 1: Name of observer: ______________________________________
Color of Light Line Apparent Color of Ink Do they look different? Actual Color of Ink
Blue LightA
B
Red LightC
D
Trial 2: Name of observer: ______________________________________
Color of Light Line Apparent Color of Ink Do they look different? Actual Color of Ink
Blue LightA
B
Red LightC
D
�
Model No. OS-8515C Exper iment 2: Pr ism
11
Experiment 2: Prism
Purpose
The purpose of this experiment is to show how a prism separates white light into its component colors and to show that different colors are refracted at different angles through a prism.
Theory
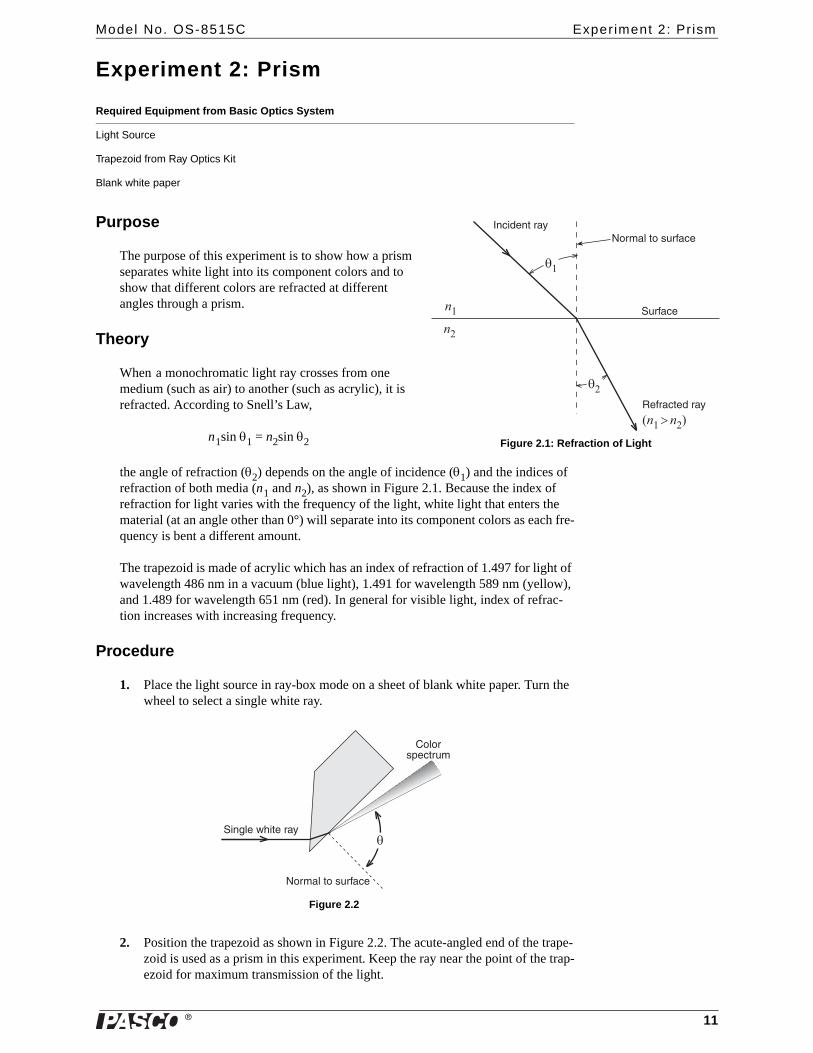
When a monochromatic light ray crosses from one medium (such as air) to another (such as acrylic), it is refracted. According to Snell’s Law,
n1sin θ1 = n2sin θ2
the angle of refraction (θ2) depends on the angle of incidence (θ1) and the indices of refraction of both media (n1 and n2), as shown in Figure 2.1. Because the index of refraction for light varies with the frequency of the light, white light that enters the material (at an angle other than 0°) will separate into its component colors as each fre-quency is bent a different amount.
The trapezoid is made of acrylic which has an index of refraction of 1.497 for light of wavelength 486 nm in a vacuum (blue light), 1.491 for wavelength 589 nm (yellow), and 1.489 for wavelength 651 nm (red). In general for visible light, index of refrac-tion increases with increasing frequency.
Procedure
1. Place the light source in ray-box mode on a sheet of blank white paper. Turn the wheel to select a single white ray.
2. Position the trapezoid as shown in Figure 2.2. The acute-angled end of the trape-zoid is used as a prism in this experiment. Keep the ray near the point of the trap-ezoid for maximum transmission of the light.
Required Equipment from Basic Optics System
Light Source
Trapezoid from Ray Optics Kit
Blank white paper
�#�� !��#��$�" ��
�$�" ��
��"� ���)�� *
���������
8%��)�%��� *
��
��
��
��
Figure 2.1: Refraction of Light
���%&!��0(����� *
�#�� !��#��$�" ��
�#!#��'����$�
Figure 2.2
�
Basic Opt ics System Exper iment 2: Pr ism
12
3. Rotate the trapezoid until the angle (θ) of the emerging ray is as large as possible and the ray separates into colors.
(a) What colors do you see? In what order are they?
(b) Which color is refracted at the largest angle?
(c) According to Snell’s Law and the information given about the frequency dependence of the index of refraction for acrylic, which color is predicted to refract at the largest angle?
4. Without repositioning the light source, turn the wheel to select the three primary color rays. The colored rays should enter trapezoid at the same angle that the white ray did. Do the colored rays emerge from the trapezoid parallel to each other? Why or why not?
�
Model No. OS-8515C Exper iment 3: Ref lect ion
13
Experiment 3: Reflection
Purpose
In this experiment, you will study how rays are reflected from different types of mir-rors. You will measure the focal length and determine the radius of curvature of a con-cave mirror and a convex mirror.
Part 1: Plane Mirror
Procedure
1. Place the light source in ray-box mode on a blank sheet of white paper. Turn the wheel to select a single ray.
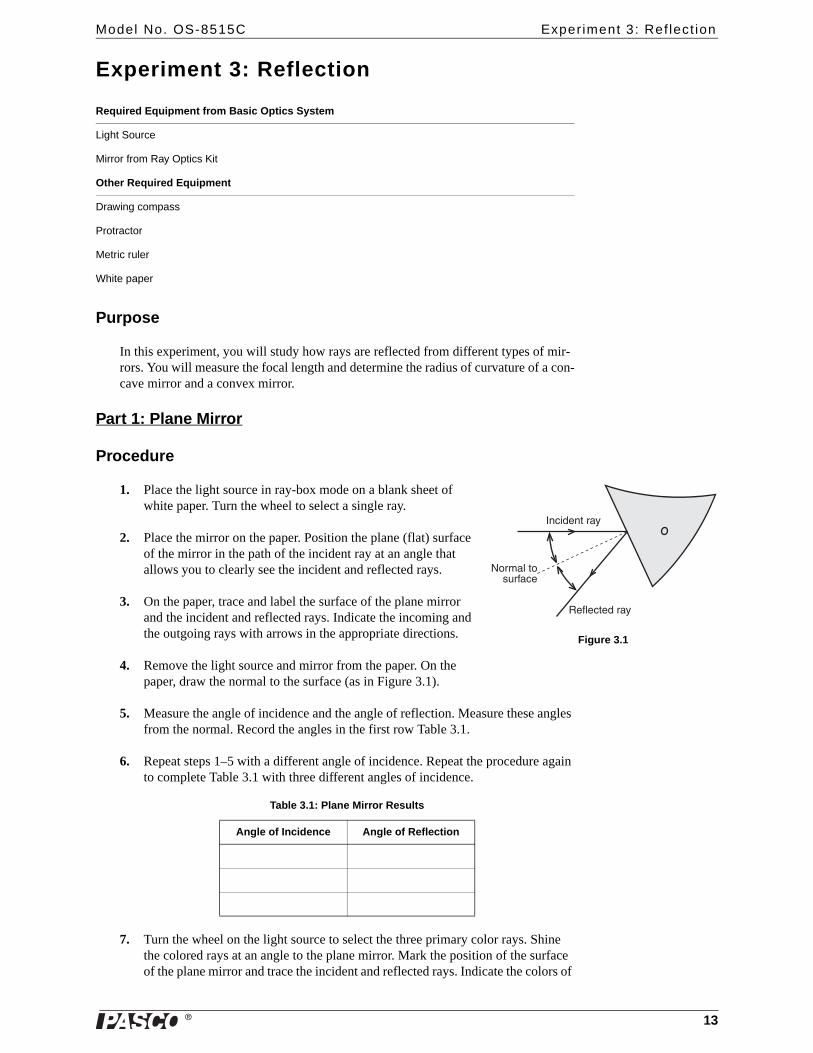
2. Place the mirror on the paper. Position the plane (flat) surface of the mirror in the path of the incident ray at an angle that allows you to clearly see the incident and reflected rays.
3. On the paper, trace and label the surface of the plane mirror and the incident and reflected rays. Indicate the incoming and the outgoing rays with arrows in the appropriate directions.
4. Remove the light source and mirror from the paper. On the paper, draw the normal to the surface (as in Figure 3.1).
5. Measure the angle of incidence and the angle of reflection. Measure these angles from the normal. Record the angles in the first row Table 3.1.
6. Repeat steps 1–5 with a different angle of incidence. Repeat the procedure again to complete Table 3.1 with three different angles of incidence.
7. Turn the wheel on the light source to select the three primary color rays. Shine the colored rays at an angle to the plane mirror. Mark the position of the surface of the plane mirror and trace the incident and reflected rays. Indicate the colors of
Required Equipment from Basic Optics System
Light Source
Mirror from Ray Optics Kit
Other Required Equipment
Drawing compass
Protractor
Metric ruler
White paper
Table 3.1: Plane Mirror Results
Angle of Incidence Angle of Reflection
8%��)�%��� *
�#�� !��#�$�" ��
��"!����)�� *
Figure 3.1
�
Basic Opt ics System Exper iment 3: Ref lect ion
14
the incoming and the outgoing rays and mark them with arrows in the appropriate directions.
Questions
1. What is the relationship between the angles of incidence and reflection?
2. Are the three colored rays reversed left-to-right by the plane mirror?
Part 2: Cylindrical Mirrors
Theory
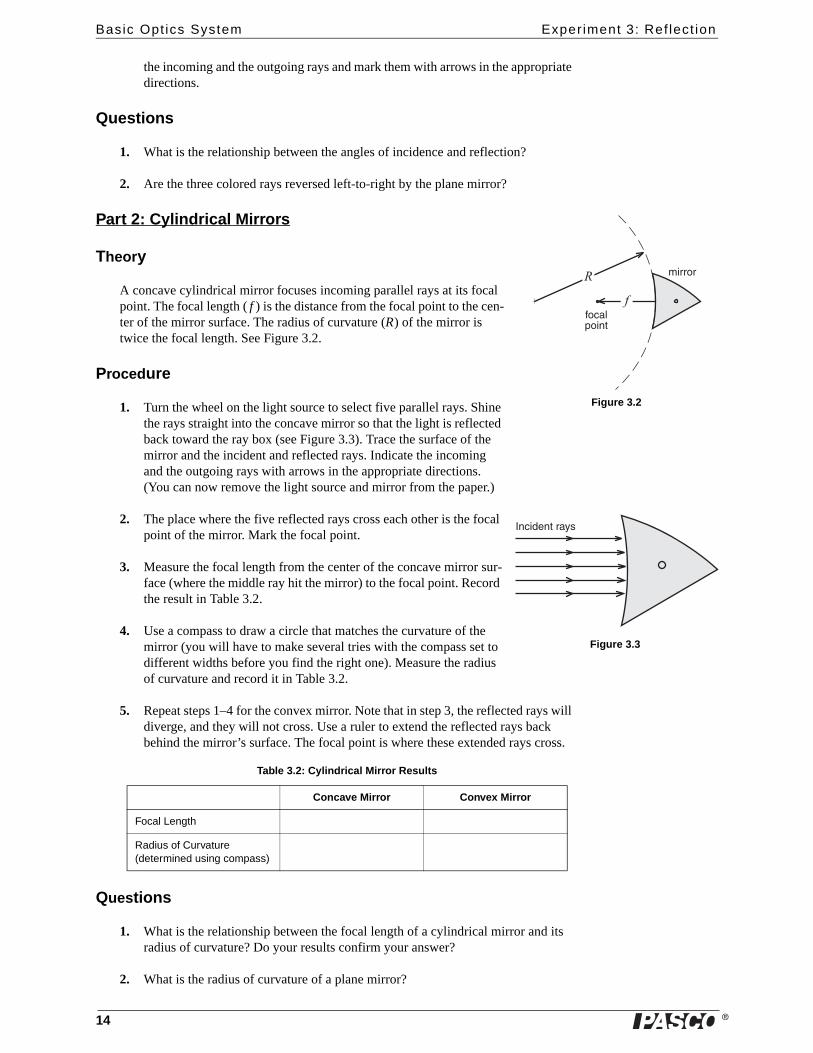
A concave cylindrical mirror focuses incoming parallel rays at its focal point. The focal length ( f ) is the distance from the focal point to the cen-ter of the mirror surface. The radius of curvature (R) of the mirror is twice the focal length. See Figure 3.2.
Procedure
1. Turn the wheel on the light source to select five parallel rays. Shine the rays straight into the concave mirror so that the light is reflected back toward the ray box (see Figure 3.3). Trace the surface of the mirror and the incident and reflected rays. Indicate the incoming and the outgoing rays with arrows in the appropriate directions. (You can now remove the light source and mirror from the paper.)
2. The place where the five reflected rays cross each other is the focal point of the mirror. Mark the focal point.
3. Measure the focal length from the center of the concave mirror sur-face (where the middle ray hit the mirror) to the focal point. Record the result in Table 3.2.
4. Use a compass to draw a circle that matches the curvature of the mirror (you will have to make several tries with the compass set to different widths before you find the right one). Measure the radius of curvature and record it in Table 3.2.
5. Repeat steps 1–4 for the convex mirror. Note that in step 3, the reflected rays will diverge, and they will not cross. Use a ruler to extend the reflected rays back behind the mirror’s surface. The focal point is where these extended rays cross.
Questions
1. What is the relationship between the focal length of a cylindrical mirror and its radius of curvature? Do your results confirm your answer?
2. What is the radius of curvature of a plane mirror?
Table 3.2: Cylindrical Mirror Results
Concave Mirror Convex Mirror
Focal Length
Radius of Curvature (determined using compass)
�
�"#� !'#�%�
����#�
Figure 3.2
8%��)�%��� *�
Figure 3.3
�
Model No. OS-8515C Exper iment 4: Snel l ’s Law
15
Experiment 4: Snell’s Law
Purpose
The purpose of this experiment is to determine the index of refraction of the acrylic trapezoid. For rays entering the trapezoid, you will measure the angles of incidence and refraction and use Snell’s Law to calculate the index of refraction.
Theory
For light crossing the boundary between two transparent materials, Snell’s Law states
n1sin θ1 = n2sin θ2
where θ1 is the angle of incidence, θ2 is the angle of refraction, and n1 and n2 are the respective indices of refraction of the materials (see Figure 4.1).
Procedure
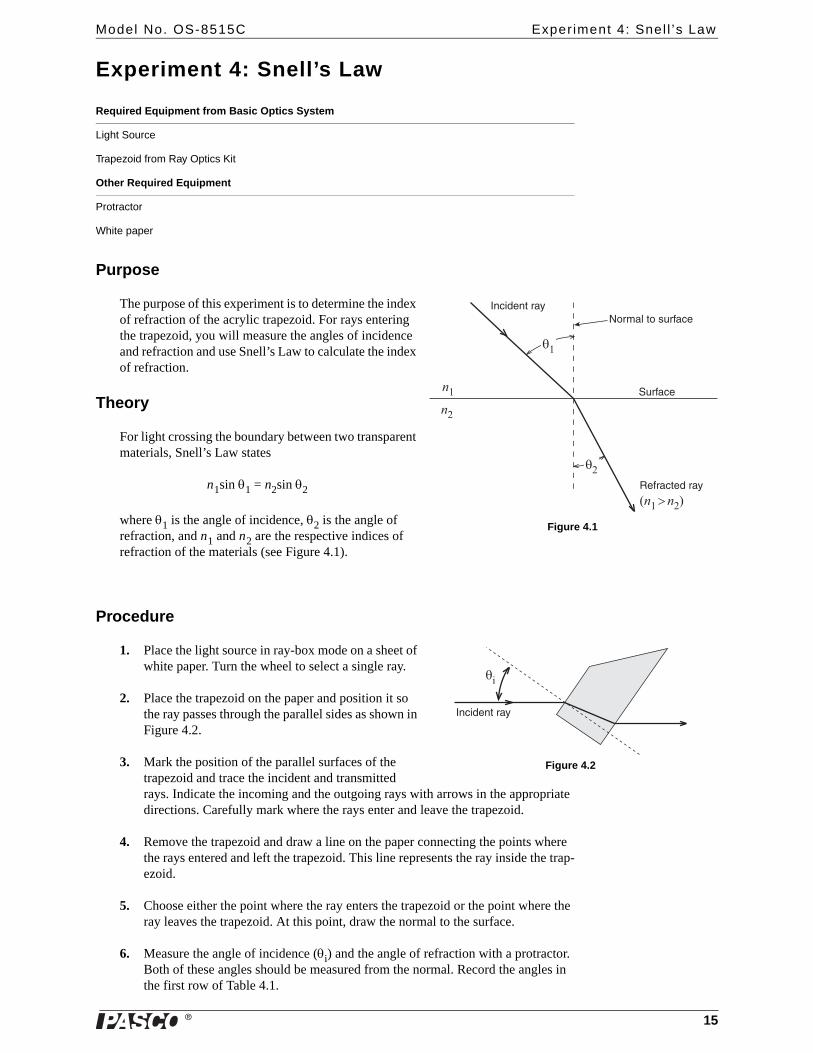
1. Place the light source in ray-box mode on a sheet of white paper. Turn the wheel to select a single ray.
2. Place the trapezoid on the paper and position it so the ray passes through the parallel sides as shown in Figure 4.2.
3. Mark the position of the parallel surfaces of the trapezoid and trace the incident and transmitted rays. Indicate the incoming and the outgoing rays with arrows in the appropriate directions. Carefully mark where the rays enter and leave the trapezoid.
4. Remove the trapezoid and draw a line on the paper connecting the points where the rays entered and left the trapezoid. This line represents the ray inside the trap-ezoid.
5. Choose either the point where the ray enters the trapezoid or the point where the ray leaves the trapezoid. At this point, draw the normal to the surface.
6. Measure the angle of incidence (θi) and the angle of refraction with a protractor. Both of these angles should be measured from the normal. Record the angles in the first row of Table 4.1.
Required Equipment from Basic Optics System
Light Source
Trapezoid from Ray Optics Kit
Other Required Equipment
Protractor
White paper
�#�� !��#��$�" ��
�$�" ��
��"� ���)�� *
���������
8%��)�%��� *
��
��
��
��
Figure 4.1
��
8%��)�%��� *
Figure 4.2
�
Basic Opt ics System Exper iment 4: Snel l ’s Law
16
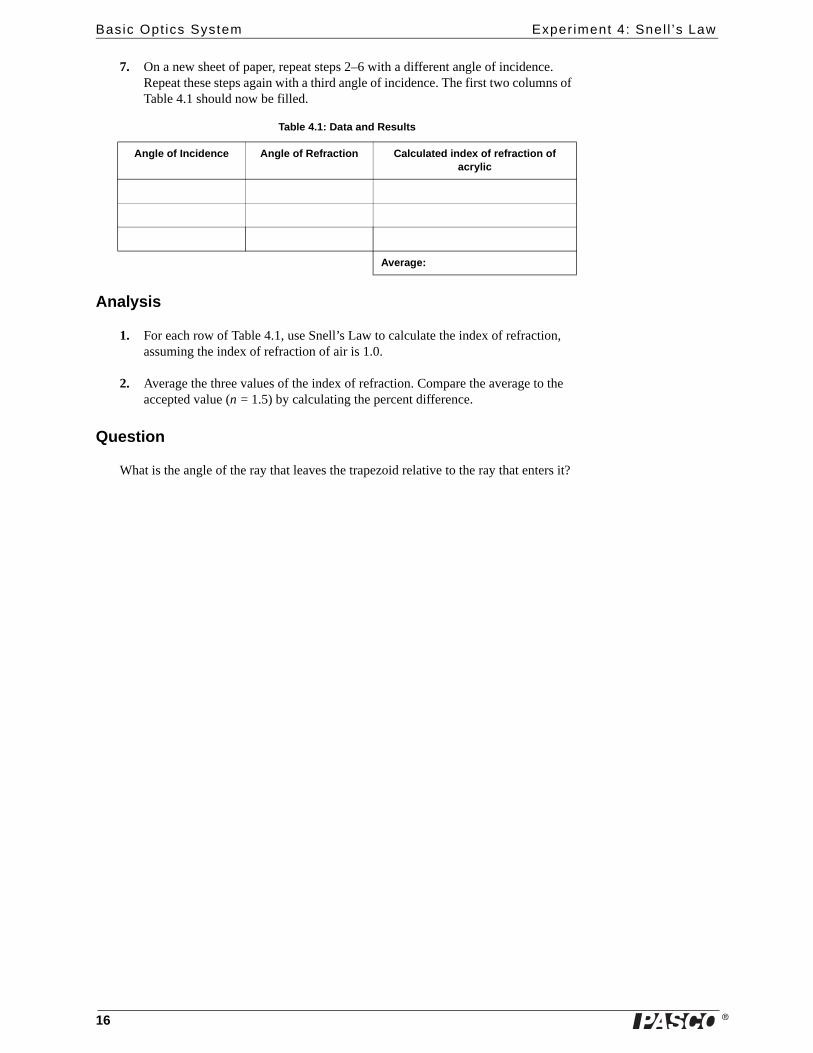
7. On a new sheet of paper, repeat steps 2–6 with a different angle of incidence. Repeat these steps again with a third angle of incidence. The first two columns of Table 4.1 should now be filled.
Analysis
1. For each row of Table 4.1, use Snell’s Law to calculate the index of refraction, assuming the index of refraction of air is 1.0.
2. Average the three values of the index of refraction. Compare the average to the accepted value (n = 1.5) by calculating the percent difference.
Question
What is the angle of the ray that leaves the trapezoid relative to the ray that enters it?
Table 4.1: Data and Results
Angle of Incidence Angle of Refraction Calculated index of refraction of acrylic
Average:
�
Model No. OS-8515C Exper iment 5: Total Internal Ref lect ion
17
Experiment 5: Total Internal Reflection
Purpose
In this experiment, you will determine the critical angle at which total internal reflec-tion occurs in the acrylic trapezoid and confirm your result using Snell’s Law.
Theory
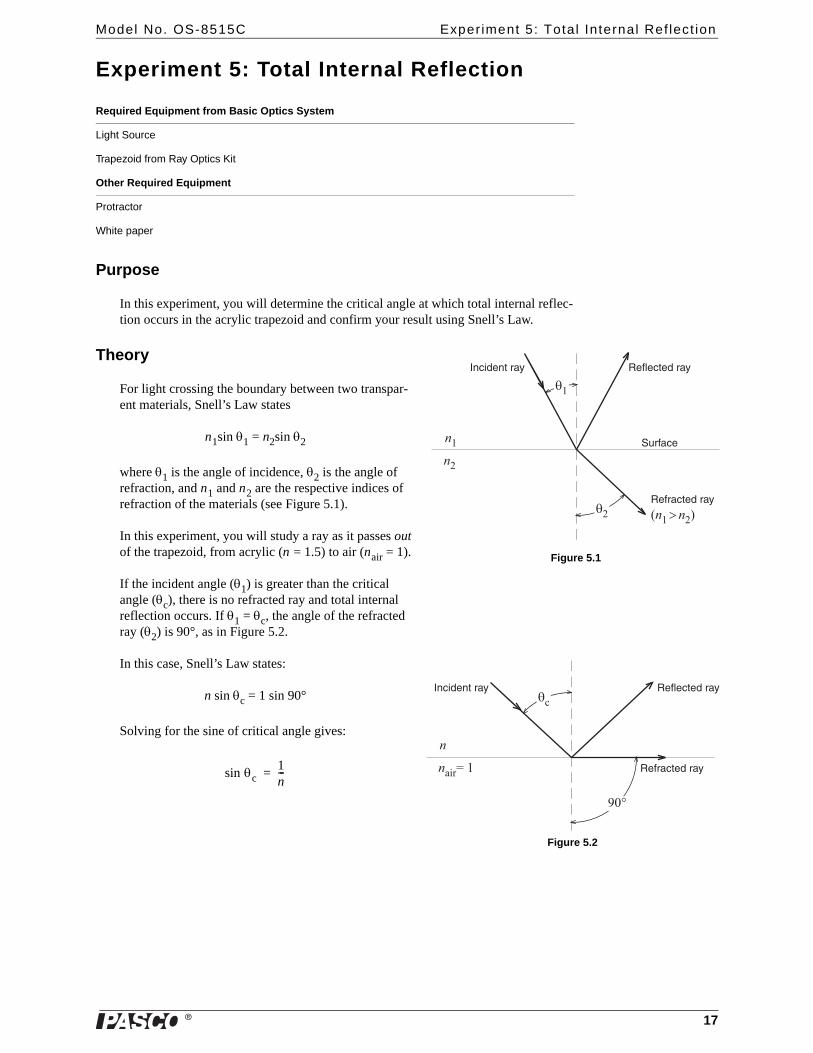
For light crossing the boundary between two transpar-ent materials, Snell’s Law states
n1sin θ1 = n2sin θ2
where θ1 is the angle of incidence, θ2 is the angle of refraction, and n1 and n2 are the respective indices of refraction of the materials (see Figure 5.1).
In this experiment, you will study a ray as it passes out of the trapezoid, from acrylic (n = 1.5) to air (nair = 1).
If the incident angle (θ1) is greater than the critical angle (θc), there is no refracted ray and total internal reflection occurs. If θ1 = θc, the angle of the refracted ray (θ2) is 90°, as in Figure 5.2.
In this case, Snell’s Law states:
n sin θc = 1 sin 90°
Solving for the sine of critical angle gives:
Required Equipment from Basic Optics System
Light Source
Trapezoid from Ray Optics Kit
Other Required Equipment
Protractor
White paper
�$�" ��
��"� ���)�� *���������
8%��)�%��� *
��
��
��
��
��"!����)�� *
Figure 5.1
��"� ���)�� *
8%��)�%��� *
�
������
���"!����)�� *
��
Figure 5.2
sin θc1n---=
�
Basic Opt ics System Exper iment 5: Total In ternal Ref lect ion
18
Procedure
1. Place the light source in ray-box mode on a sheet of white paper. Turn the wheel to select a single ray.
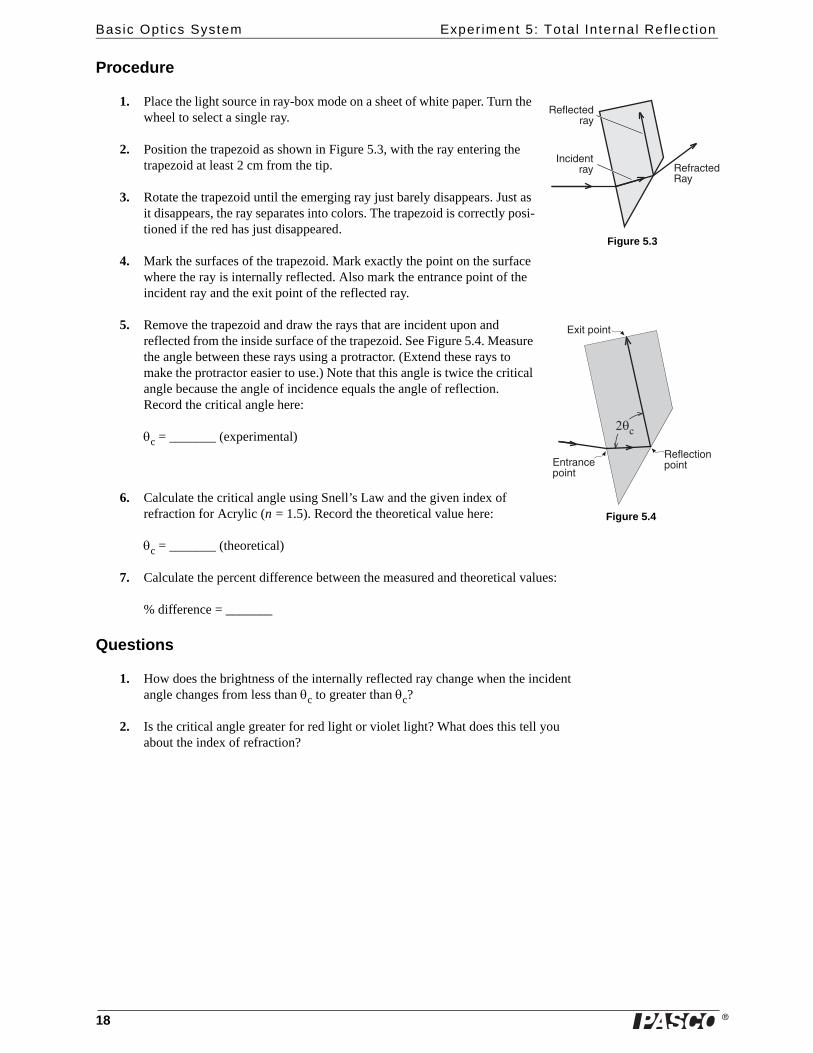
2. Position the trapezoid as shown in Figure 5.3, with the ray entering the trapezoid at least 2 cm from the tip.
3. Rotate the trapezoid until the emerging ray just barely disappears. Just as it disappears, the ray separates into colors. The trapezoid is correctly posi-tioned if the red has just disappeared.
4. Mark the surfaces of the trapezoid. Mark exactly the point on the surface where the ray is internally reflected. Also mark the entrance point of the incident ray and the exit point of the reflected ray.
5. Remove the trapezoid and draw the rays that are incident upon and reflected from the inside surface of the trapezoid. See Figure 5.4. Measure the angle between these rays using a protractor. (Extend these rays to make the protractor easier to use.) Note that this angle is twice the critical angle because the angle of incidence equals the angle of reflection. Record the critical angle here:
θc = _______ (experimental)
6. Calculate the critical angle using Snell’s Law and the given index of refraction for Acrylic (n = 1.5). Record the theoretical value here:
θc = _______ (theoretical)
7. Calculate the percent difference between the measured and theoretical values:
% difference = _______
Questions
1. How does the brightness of the internally reflected ray change when the incident angle changes from less than θc to greater than θc?
2. Is the critical angle greater for red light or violet light? What does this tell you about the index of refraction?
8%��)�%�� *
��"!����)� *
��"� ���)� *
Figure 5.3
��
�5���'#�%�
�%�� %��'#�%�
��"!����#%'#�%�
��
'#�%�
����'#
Figure 5.4
�
Model No. OS-8515C Exper iment 6: Convex and Concave Lenses
19
Experiment 6: Convex and Concave Lenses
Purpose
In this experiment, you will explore the difference between convex and concave lenses and determine their focal lengths.
Theory
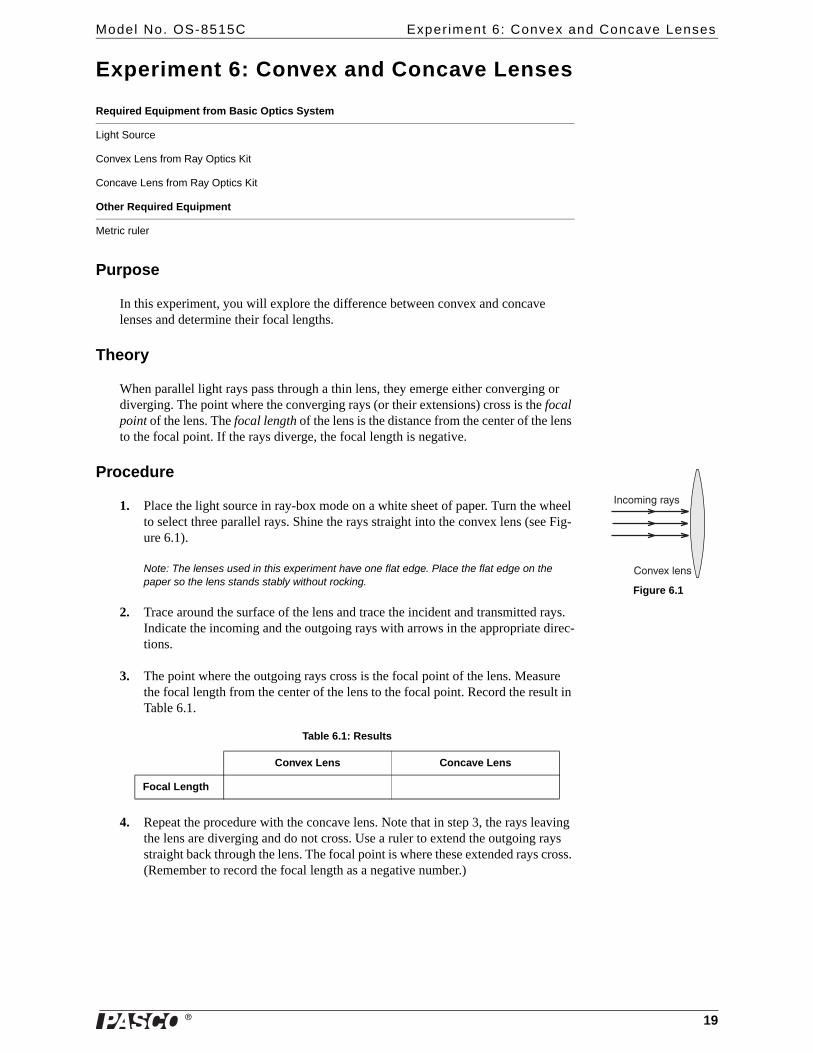
When parallel light rays pass through a thin lens, they emerge either converging or diverging. The point where the converging rays (or their extensions) cross is the focal point of the lens. The focal length of the lens is the distance from the center of the lens to the focal point. If the rays diverge, the focal length is negative.
Procedure
1. Place the light source in ray-box mode on a white sheet of paper. Turn the wheel to select three parallel rays. Shine the rays straight into the convex lens (see Fig-ure 6.1).
Note: The lenses used in this experiment have one flat edge. Place the flat edge on the paper so the lens stands stably without rocking.
2. Trace around the surface of the lens and trace the incident and transmitted rays. Indicate the incoming and the outgoing rays with arrows in the appropriate direc-tions.
3. The point where the outgoing rays cross is the focal point of the lens. Measure the focal length from the center of the lens to the focal point. Record the result in Table 6.1.
4. Repeat the procedure with the concave lens. Note that in step 3, the rays leaving the lens are diverging and do not cross. Use a ruler to extend the outgoing rays straight back through the lens. The focal point is where these extended rays cross. (Remember to record the focal length as a negative number.)
Required Equipment from Basic Optics System
Light Source
Convex Lens from Ray Optics Kit
Concave Lens from Ray Optics Kit
Other Required Equipment
Metric ruler
Table 6.1: Results
Convex Lens Concave Lens
Focal Length
8%�#��%&�� *�
�#%3�5�!�%�
Figure 6.1
�
Basic Opt ics System Exper iment 6: Convex and Concave Lenses
20
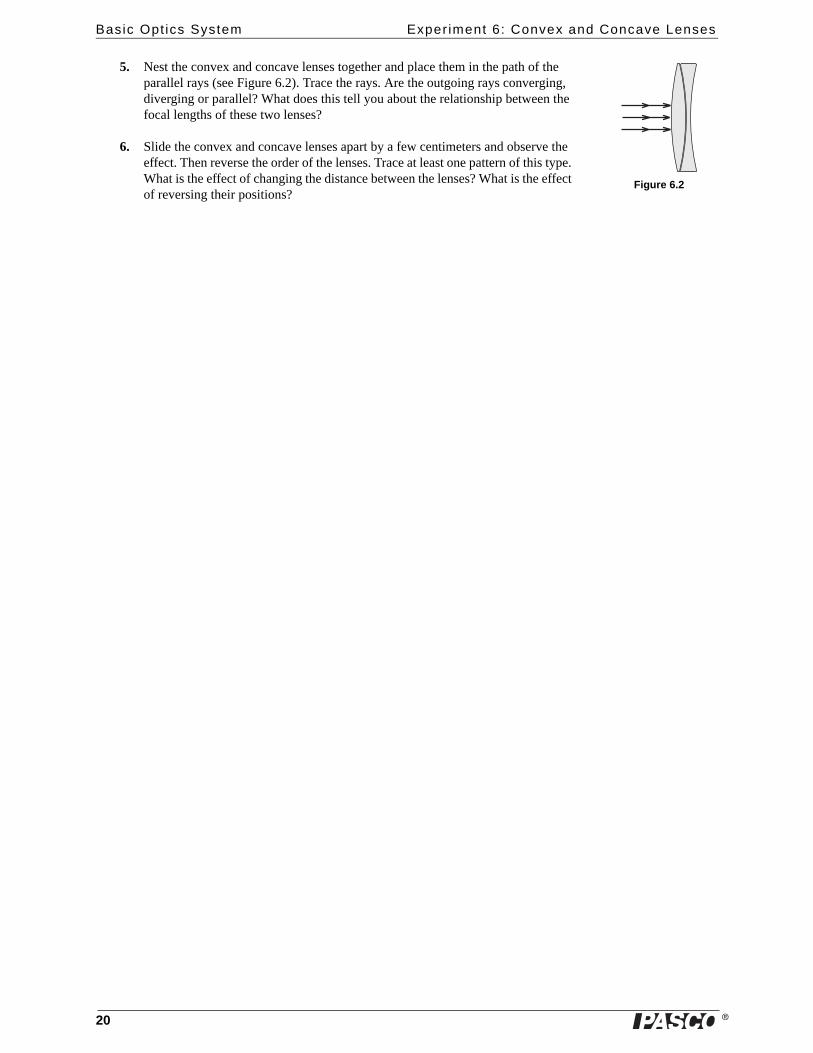
5. Nest the convex and concave lenses together and place them in the path of the parallel rays (see Figure 6.2). Trace the rays. Are the outgoing rays converging, diverging or parallel? What does this tell you about the relationship between the focal lengths of these two lenses?
6. Slide the convex and concave lenses apart by a few centimeters and observe the effect. Then reverse the order of the lenses. Trace at least one pattern of this type. What is the effect of changing the distance between the lenses? What is the effect of reversing their positions?
Figure 6.2
�
Model No. OS-8515C Exper iment 7: Hol low Lens
21
Experiment 7: Hollow Lens
Purpose
In this experiment you will explore how the properties of a lens are related to its shape, its index of refraction, and the index of refraction of the surrounding medium.
Background
A conventional lens is made of a material whose index of refraction is higher than that of the surrounding medium. For instance, the lenses in a pair of eyeglasses are usually made from glass or plastic with an index of refraction of 1.5 or higher, while the air surrounding the lenses has an index of refraction of 1.0. However, a lens can also have a lower index of refraction than the surrounding medium, as is the case when a hollow lens is “filled with air” and surrounded by water. (The index of refraction of water is about 1.3.)
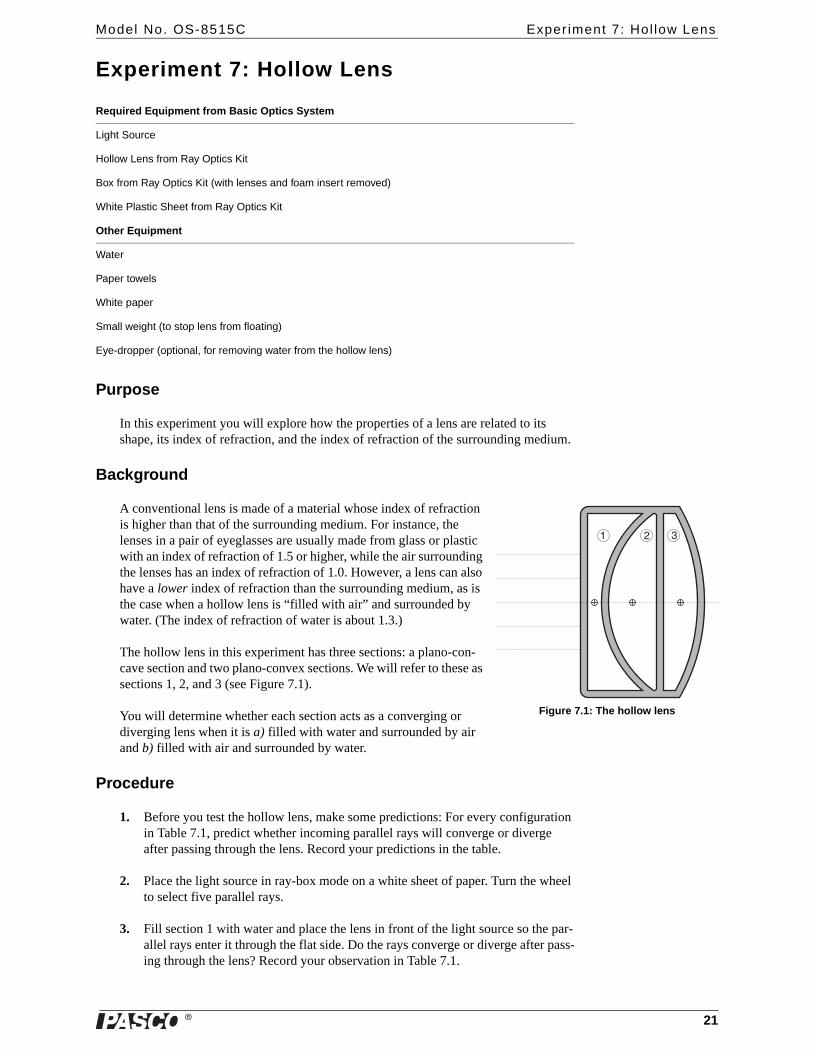
The hollow lens in this experiment has three sections: a plano-con-cave section and two plano-convex sections. We will refer to these as sections 1, 2, and 3 (see Figure 7.1).
You will determine whether each section acts as a converging or diverging lens when it is a) filled with water and surrounded by air and b) filled with air and surrounded by water.
Procedure
1. Before you test the hollow lens, make some predictions: For every configuration in Table 7.1, predict whether incoming parallel rays will converge or diverge after passing through the lens. Record your predictions in the table.
2. Place the light source in ray-box mode on a white sheet of paper. Turn the wheel to select five parallel rays.
3. Fill section 1 with water and place the lens in front of the light source so the par-allel rays enter it through the flat side. Do the rays converge or diverge after pass-ing through the lens? Record your observation in Table 7.1.
Required Equipment from Basic Optics System
Light Source
Hollow Lens from Ray Optics Kit
Box from Ray Optics Kit (with lenses and foam insert removed)
White Plastic Sheet from Ray Optics Kit
Other Equipment
Water
Paper towels
White paper
Small weight (to stop lens from floating)
Eye-dropper (optional, for removing water from the hollow lens)
� �
Figure 7.1: The hollow lens
�
Basic Opt ics System Exper iment 7: Hol low Lens
22
Repeat this step with water in different section of the lens to complete the first four rows of Table 7.1.
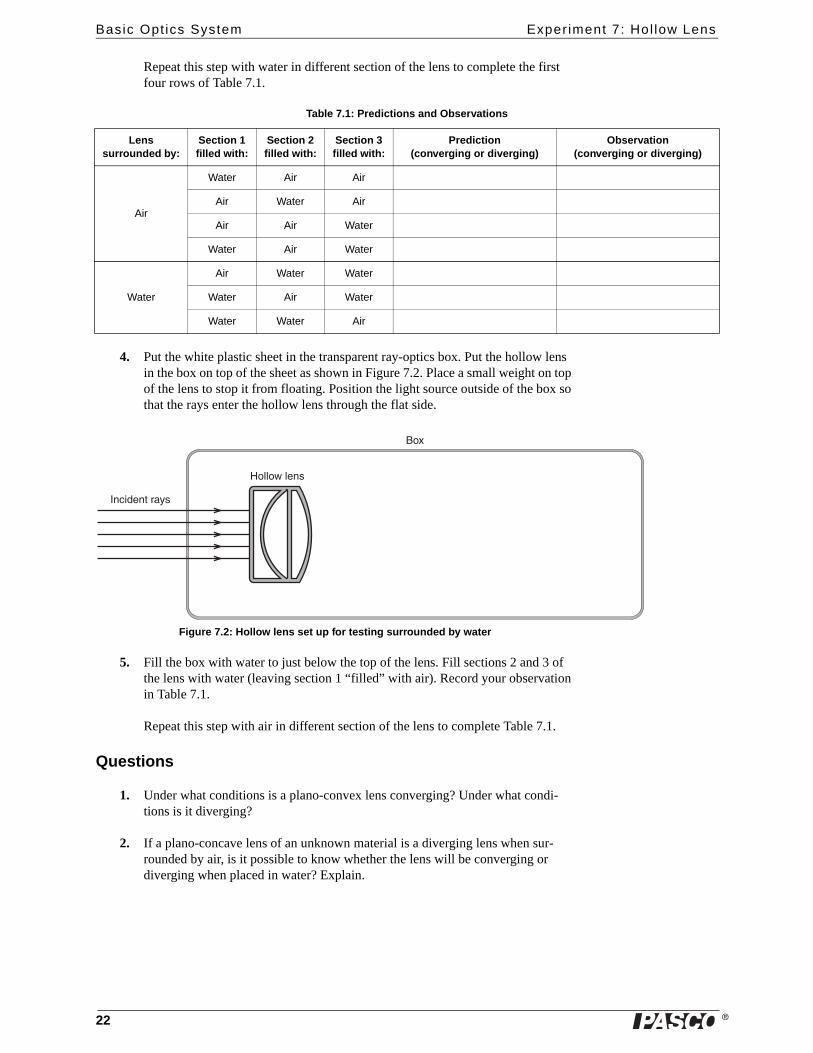
4. Put the white plastic sheet in the transparent ray-optics box. Put the hollow lens in the box on top of the sheet as shown in Figure 7.2. Place a small weight on top of the lens to stop it from floating. Position the light source outside of the box so that the rays enter the hollow lens through the flat side.
Figure 7.2: Hollow lens set up for testing surrounded by water
5. Fill the box with water to just below the top of the lens. Fill sections 2 and 3 of the lens with water (leaving section 1 “filled” with air). Record your observation in Table 7.1.
Repeat this step with air in different section of the lens to complete Table 7.1.
Questions
1. Under what conditions is a plano-convex lens converging? Under what condi-tions is it diverging?
2. If a plano-concave lens of an unknown material is a diverging lens when sur-rounded by air, is it possible to know whether the lens will be converging or diverging when placed in water? Explain.
Table 7.1: Predictions and Observations
Lens surrounded by:
Section 1 filled with:
Section 2 filled with:
Section 3 filled with:
Prediction(converging or diverging)
Observation(converging or diverging)
Air
Water Air Air
Air Water Air
Air Air Water
Water Air Water
Water
Air Water Water
Water Air Water
Water Water Air
8%��)�%��� *�
9#5
.#!!#0�!�%�
�
Model No. OS-8515C Exper iment 8: Lensmaker ’s Equat ion
23
Experiment 8: Lensmaker’s Equation
Purpose
In this experiment you will determine the focal length of a concave lens in two ways: a) by direct measurement using ray tracing and b) by measuring the radius of curva-ture and using the lensmaker’s equation.
Theory
The lensmaker’s equation is used to calculate the focal length (in air or a vacuum), f, of a lens based on the radii of curvature of its surfaces (R1 and R2) and the index of refraction (n) of the lens material:
(eq. 8.1)
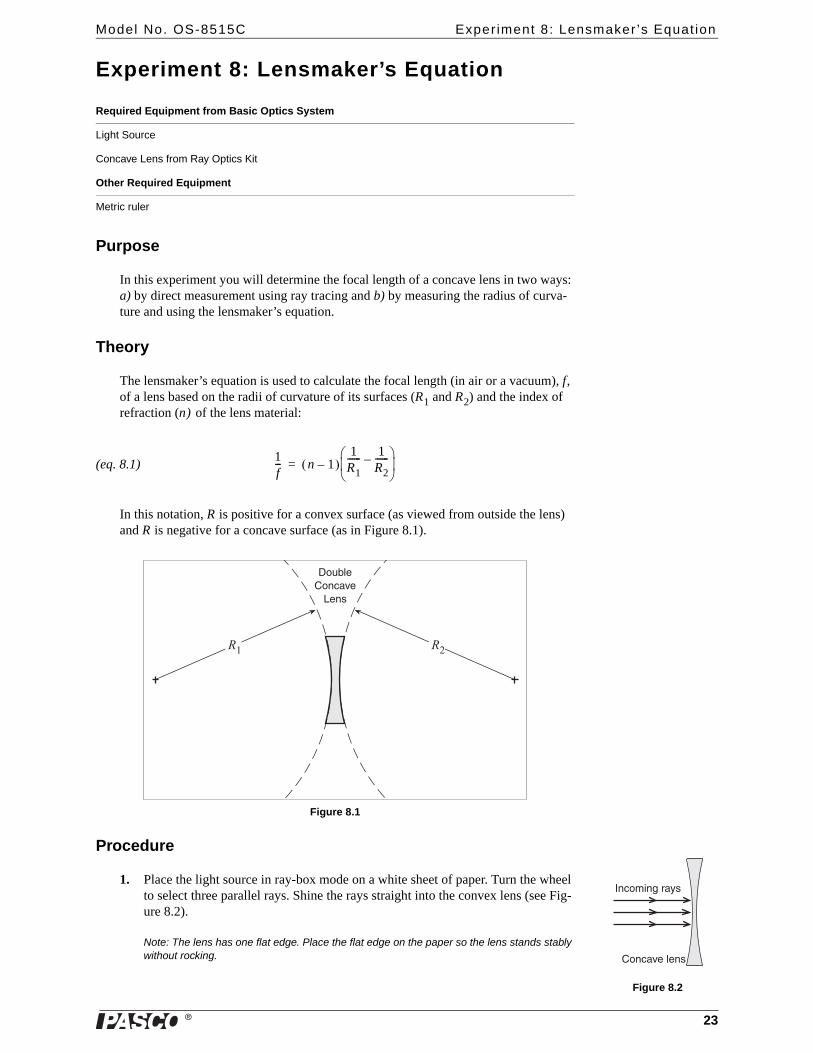
In this notation, R is positive for a convex surface (as viewed from outside the lens) and R is negative for a concave surface (as in Figure 8.1).
Figure 8.1
Procedure
1. Place the light source in ray-box mode on a white sheet of paper. Turn the wheel to select three parallel rays. Shine the rays straight into the convex lens (see Fig-ure 8.2).
Note: The lens has one flat edge. Place the flat edge on the paper so the lens stands stably without rocking.
Required Equipment from Basic Optics System
Light Source
Concave Lens from Ray Optics Kit
Other Required Equipment
Metric ruler
1f--- n 1–( )
1R1------ 1
R2------–
⎝ ⎠⎜ ⎟⎛ ⎞
=
2#$,!��#%� 3���%�
����
8%�#��%&�� *�
�#%� 3��!�%�
Figure 8.2
�
Basic Opt ics System Exper iment 8: Lensmaker ’s Equat ion
24
2. Trace around the surface of the lens and trace the incident and transmitted rays. Indicate the incoming and the outgoing rays with arrows in the appropriate direc-tions.
3. Remove the lens. To measure the focal length, use a ruler to extend the outgoing diverging rays straight back through the lens. The focal point is where these extended rays cross. Measure the distance from the center of the lens to the focal point. Record the result as a negative value:
f = _______________ (measured directly)
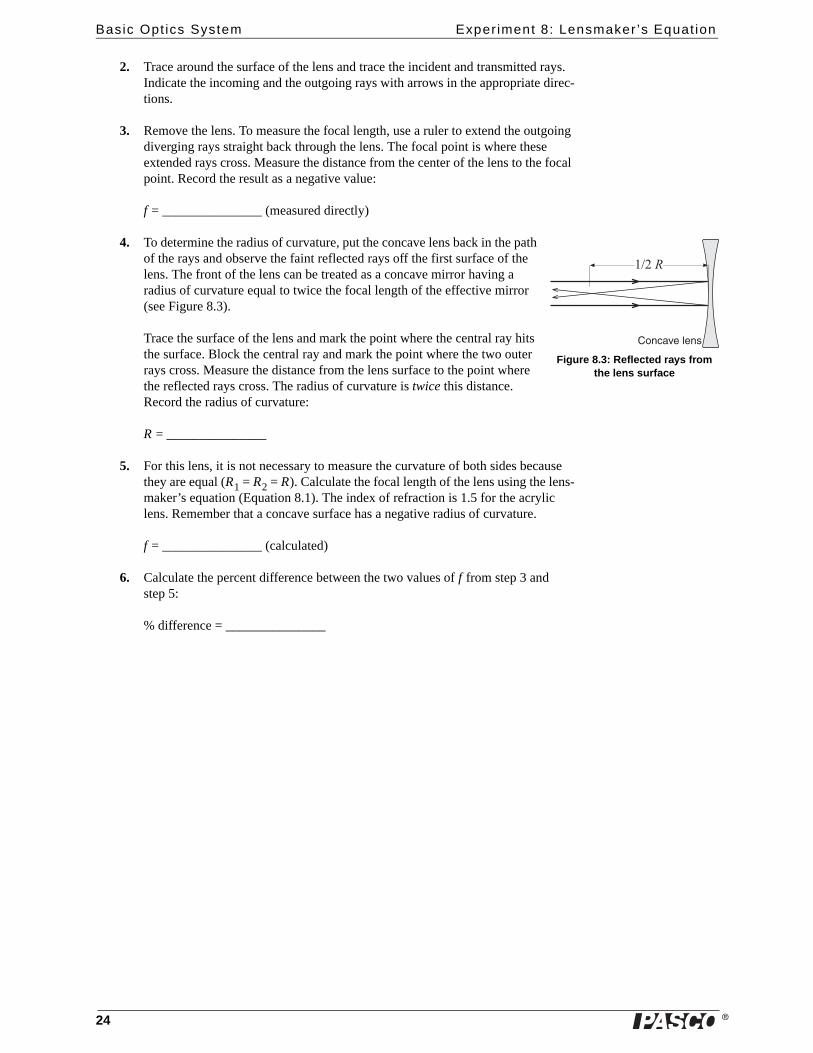
4. To determine the radius of curvature, put the concave lens back in the path of the rays and observe the faint reflected rays off the first surface of the lens. The front of the lens can be treated as a concave mirror having a radius of curvature equal to twice the focal length of the effective mirror (see Figure 8.3).
Trace the surface of the lens and mark the point where the central ray hits the surface. Block the central ray and mark the point where the two outer rays cross. Measure the distance from the lens surface to the point where the reflected rays cross. The radius of curvature is twice this distance. Record the radius of curvature:
R = _______________
5. For this lens, it is not necessary to measure the curvature of both sides because they are equal (R1 = R2 = R). Calculate the focal length of the lens using the lens-maker’s equation (Equation 8.1). The index of refraction is 1.5 for the acrylic lens. Remember that a concave surface has a negative radius of curvature.
f = _______________ (calculated)
6. Calculate the percent difference between the two values of f from step 3 and step 5:
% difference = _______________
�#%� 3��!�%�
�����
Figure 8.3: Reflected rays from the lens surface
�
Model No. OS-8515C Exper iment 9: Apparent Depth
25
Experiment 9: Apparent Depth
Purpose
In this experiment, you will use two different methods to measure the apparent depth of the acrylic trapezoid. You will also determine the index of refraction of acrylic by comparing the apparent depth to the actual depth.
Theory
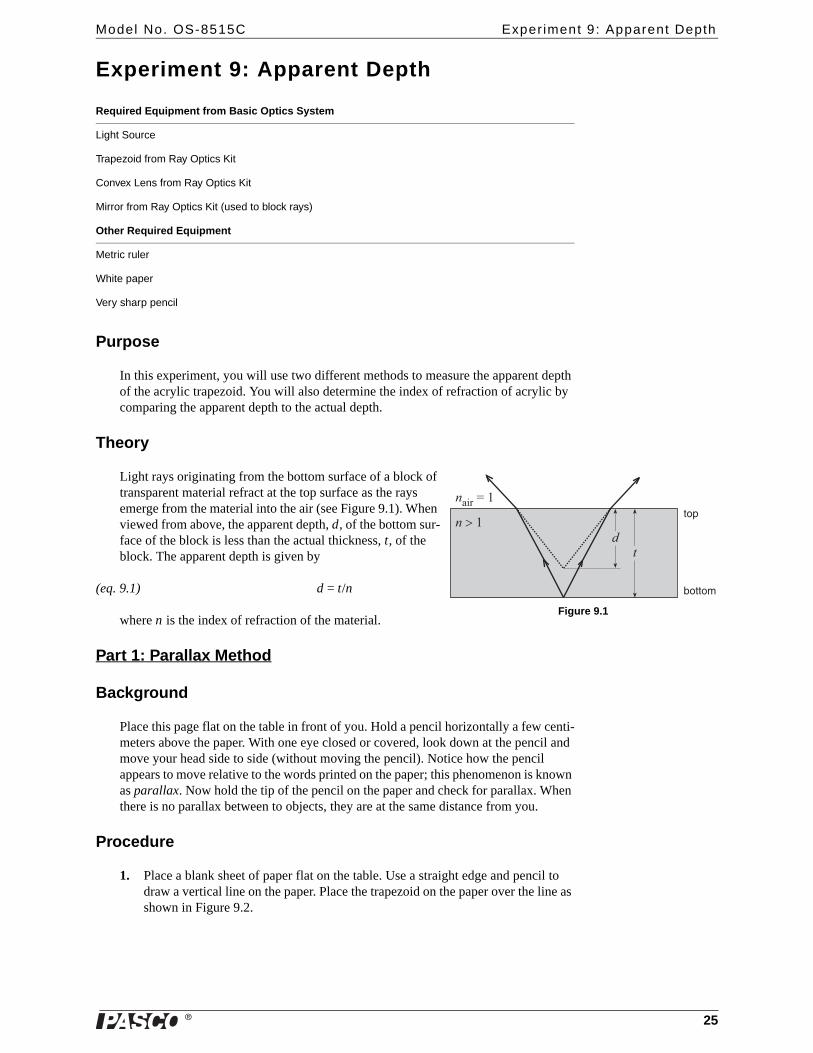
Light rays originating from the bottom surface of a block of transparent material refract at the top surface as the rays emerge from the material into the air (see Figure 9.1). When viewed from above, the apparent depth, d, of the bottom sur-face of the block is less than the actual thickness, t, of the block. The apparent depth is given by
(eq. 9.1) d = t/n
where n is the index of refraction of the material.
Part 1: Parallax Method
Background
Place this page flat on the table in front of you. Hold a pencil horizontally a few centi-meters above the paper. With one eye closed or covered, look down at the pencil and move your head side to side (without moving the pencil). Notice how the pencil appears to move relative to the words printed on the paper; this phenomenon is known as parallax. Now hold the tip of the pencil on the paper and check for parallax. When there is no parallax between to objects, they are at the same distance from you.
Procedure
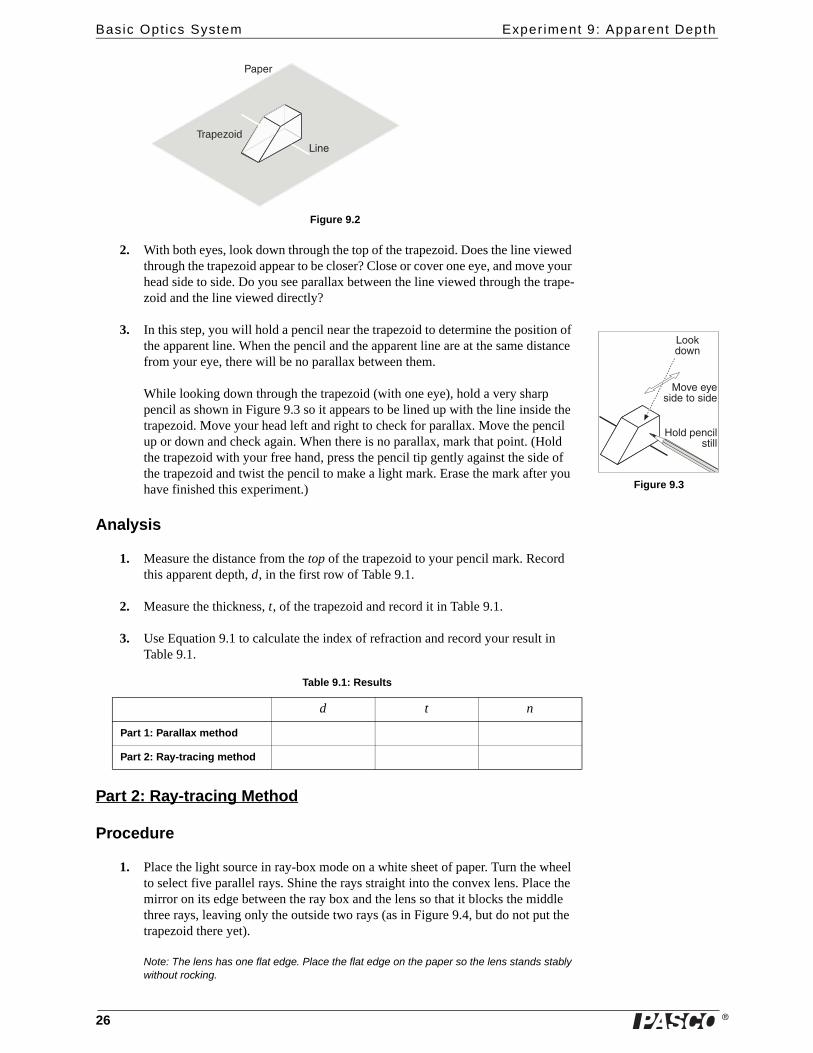
1. Place a blank sheet of paper flat on the table. Use a straight edge and pencil to draw a vertical line on the paper. Place the trapezoid on the paper over the line as shown in Figure 9.2.
Required Equipment from Basic Optics System
Light Source
Trapezoid from Ray Optics Kit
Convex Lens from Ray Optics Kit
Mirror from Ray Optics Kit (used to block rays)
Other Required Equipment
Metric ruler
White paper
Very sharp pencil
�������
������
�
������
�
,#��#�
�#'
Figure 9.1
�
Basic Opt ics System Exper iment 9: Apparent Depth
26
Figure 9.2
2. With both eyes, look down through the top of the trapezoid. Does the line viewed through the trapezoid appear to be closer? Close or cover one eye, and move your head side to side. Do you see parallax between the line viewed through the trape-zoid and the line viewed directly?
3. In this step, you will hold a pencil near the trapezoid to determine the position of the apparent line. When the pencil and the apparent line are at the same distance from your eye, there will be no parallax between them.
While looking down through the trapezoid (with one eye), hold a very sharp pencil as shown in Figure 9.3 so it appears to be lined up with the line inside the trapezoid. Move your head left and right to check for parallax. Move the pencil up or down and check again. When there is no parallax, mark that point. (Hold the trapezoid with your free hand, press the pencil tip gently against the side of the trapezoid and twist the pencil to make a light mark. Erase the mark after you have finished this experiment.)
Analysis
1. Measure the distance from the top of the trapezoid to your pencil mark. Record this apparent depth, d, in the first row of Table 9.1.
2. Measure the thickness, t, of the trapezoid and record it in Table 9.1.
3. Use Equation 9.1 to calculate the index of refraction and record your result in Table 9.1.
Part 2: Ray-tracing Method
Procedure
1. Place the light source in ray-box mode on a white sheet of paper. Turn the wheel to select five parallel rays. Shine the rays straight into the convex lens. Place the mirror on its edge between the ray box and the lens so that it blocks the middle three rays, leaving only the outside two rays (as in Figure 9.4, but do not put the trapezoid there yet).
Note: The lens has one flat edge. Place the flat edge on the paper so the lens stands stably without rocking.
Table 9.1: Results
d t n
Part 1: Parallax method
Part 2: Ray-tracing method
Trapezoid
�##:)#0%
.#!)�'�%��!���!!
�#3���*���)���#���)�
Figure 9.3
�
Model No. OS-8515C Exper iment 9: Apparent Depth
27
2. Mark the place on the paper where the two rays cross each other.
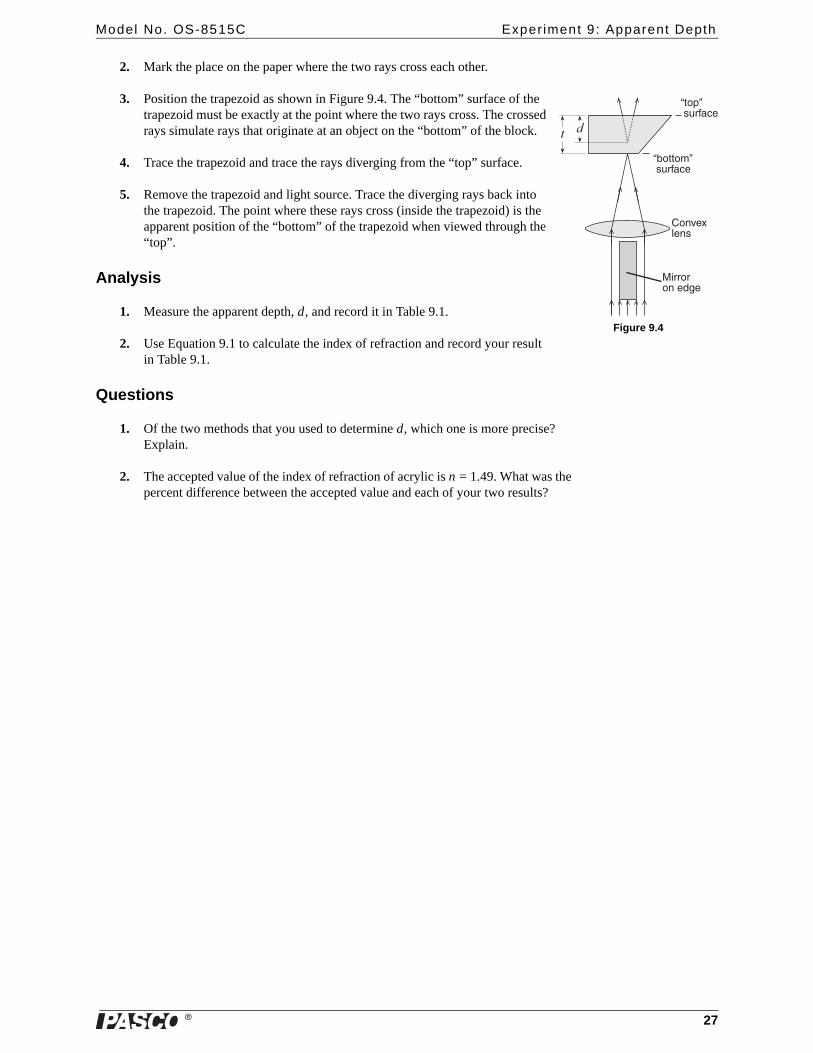
3. Position the trapezoid as shown in Figure 9.4. The “bottom” surface of the trapezoid must be exactly at the point where the two rays cross. The crossed rays simulate rays that originate at an object on the “bottom” of the block.
4. Trace the trapezoid and trace the rays diverging from the “top” surface.
5. Remove the trapezoid and light source. Trace the diverging rays back into the trapezoid. The point where these rays cross (inside the trapezoid) is the apparent position of the “bottom” of the trapezoid when viewed through the “top”.
Analysis
1. Measure the apparent depth, d, and record it in Table 9.1.
2. Use Equation 9.1 to calculate the index of refraction and record your result in Table 9.1.
Questions
1. Of the two methods that you used to determine d, which one is more precise? Explain.
2. The accepted value of the index of refraction of acrylic is n = 1.49. What was the percent difference between the accepted value and each of your two results?
� �
�#%3�5!�%�
����#�#%��)&�
;,#��#�<��$�" ��
;�#'<��$�" ��
Figure 9.4

�
Basic Opt ics System Exper iment 9: Apparent Depth
28
�
Model No. OS-8515C Exper iment 10: Reversib i l i ty
29
Experiment 10: Reversibility
Purpose
In Trial 1 of this experiment, you will determine the relationship between the angle of incidence and the angle of refraction for light passing from air into a more optically dense medium (the acrylic of the D-shaped lens).
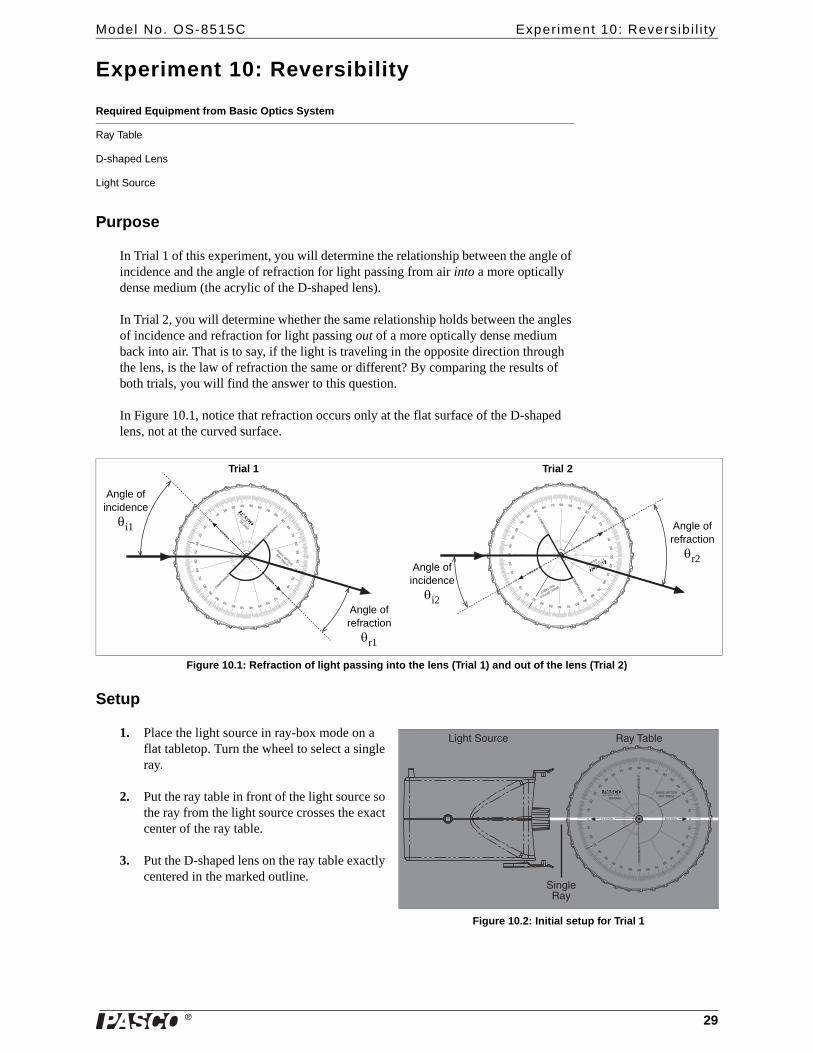
In Trial 2, you will determine whether the same relationship holds between the angles of incidence and refraction for light passing out of a more optically dense medium back into air. That is to say, if the light is traveling in the opposite direction through the lens, is the law of refraction the same or different? By comparing the results of both trials, you will find the answer to this question.
In Figure 10.1, notice that refraction occurs only at the flat surface of the D-shaped lens, not at the curved surface.
Figure 10.1: Refraction of light passing into the lens (Trial 1) and out of the lens (Trial 2)
Setup
1. Place the light source in ray-box mode on a flat tabletop. Turn the wheel to select a single ray.
2. Put the ray table in front of the light source so the ray from the light source crosses the exact center of the ray table.
3. Put the D-shaped lens on the ray table exactly centered in the marked outline.
Required Equipment from Basic Optics System
Ray Table
D-shaped Lens
Light Source
����
����
��
�� ����
����
� �
���
��
��
����
����
��
��
��
������ ��
��
��
�
��
��
����
� �� ����
� �� ����
� ����
� ����
�����������
������
�����
�
�
�
� ����
����������
����
��
��
���
�
���
��
��
��
�� �� ��
����
����
����
���
�
���
��
��
��
��
� ��
���
�
� ��
���
�
� ����
� ����
�����������
������
�����
�
�
� �
Angle ofrefractionθr1
Angle ofincidence
θi2
Angle ofrefractionθr2
Trial 1 Trial 2
Angle ofincidence
θi1
���� �� ����
����
����
���
�
���
��
��
��
����
��
������
����
��
���
�
���
��
��
��
��
� �� ����
� �� ����
� ���� � ����
�����������������
������
���� �� ����
����
����
���
�
���
��
��
��
����
��
������
����
��
���
�
���
��
��
��
��
� �� ����
� �� ����
� ���� � ����
�����������������
������
��&(���#$��� � *�� ,!�
��%&!�� *
Figure 10.2: Initial setup for Trial 1
�
Basic Opt ics System Exper iment 10: Reversib i l i ty
30
Record Data
Trial 1
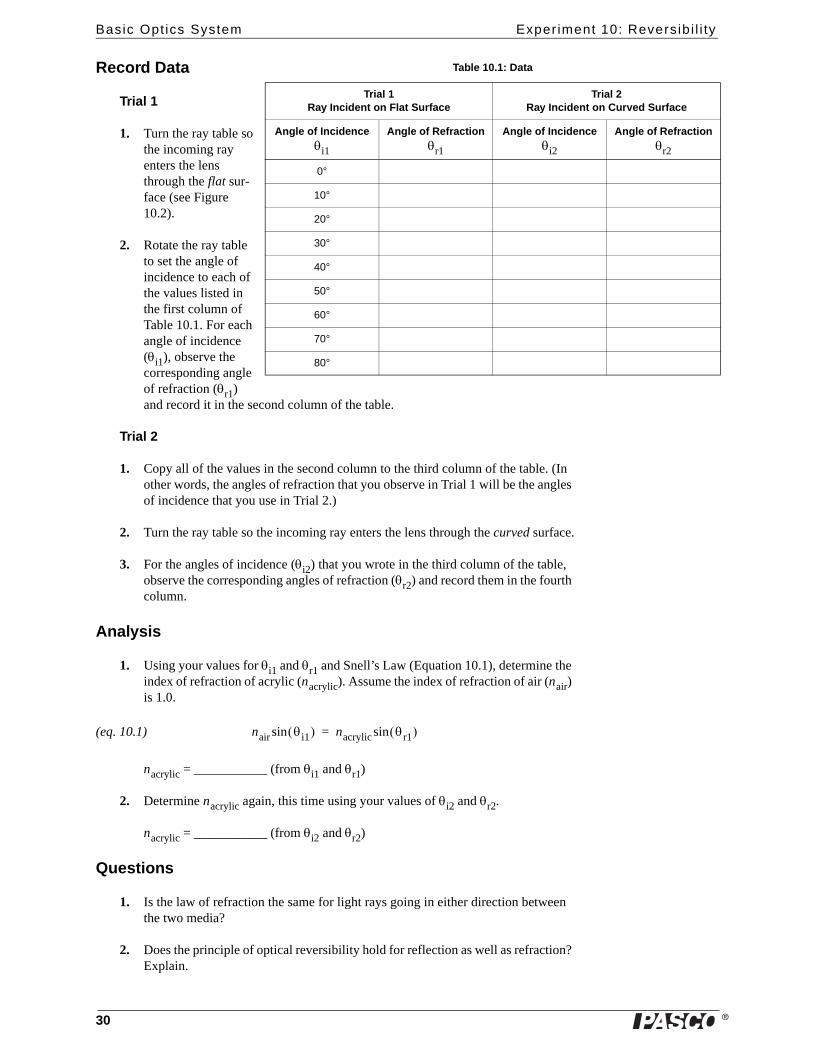
1. Turn the ray table so the incoming ray enters the lens through the flat sur-face (see Figure 10.2).
2. Rotate the ray table to set the angle of incidence to each of the values listed in the first column of Table 10.1. For each angle of incidence (θi1), observe the corresponding angle of refraction (θr1) and record it in the second column of the table.
Trial 2
1. Copy all of the values in the second column to the third column of the table. (In other words, the angles of refraction that you observe in Trial 1 will be the angles of incidence that you use in Trial 2.)
2. Turn the ray table so the incoming ray enters the lens through the curved surface.
3. For the angles of incidence (θi2) that you wrote in the third column of the table, observe the corresponding angles of refraction (θr2) and record them in the fourth column.
Analysis
1. Using your values for θi1 and θr1 and Snell’s Law (Equation 10.1), determine the index of refraction of acrylic (nacrylic). Assume the index of refraction of air (nair) is 1.0.
(eq. 10.1)
nacrylic = ___________ (from θi1 and θr1)
2. Determine nacrylic again, this time using your values of θi2 and θr2.
nacrylic = ___________ (from θi2 and θr2)
Questions
1. Is the law of refraction the same for light rays going in either direction between the two media?
2. Does the principle of optical reversibility hold for reflection as well as refraction? Explain.
Table 10.1: Data
Trial 1Ray Incident on Flat Surface
Trial 2Ray Incident on Curved Surface
Angle of Incidenceθi1
Angle of Refractionθr1
Angle of Incidenceθi2
Angle of Refractionθr2
0°
10°
20°
30°
40°
50°
60°
70°
80°
nair θi1( )sin nacrylic θr1( )sin=
�
Model No. OS-8515C Exper iment 11: Dispersion
31
Experiment 11: Dispersion
Purpose
The purpose of this experiment is to determine the index of refraction of acrylic at two different wavelengths.
Theory
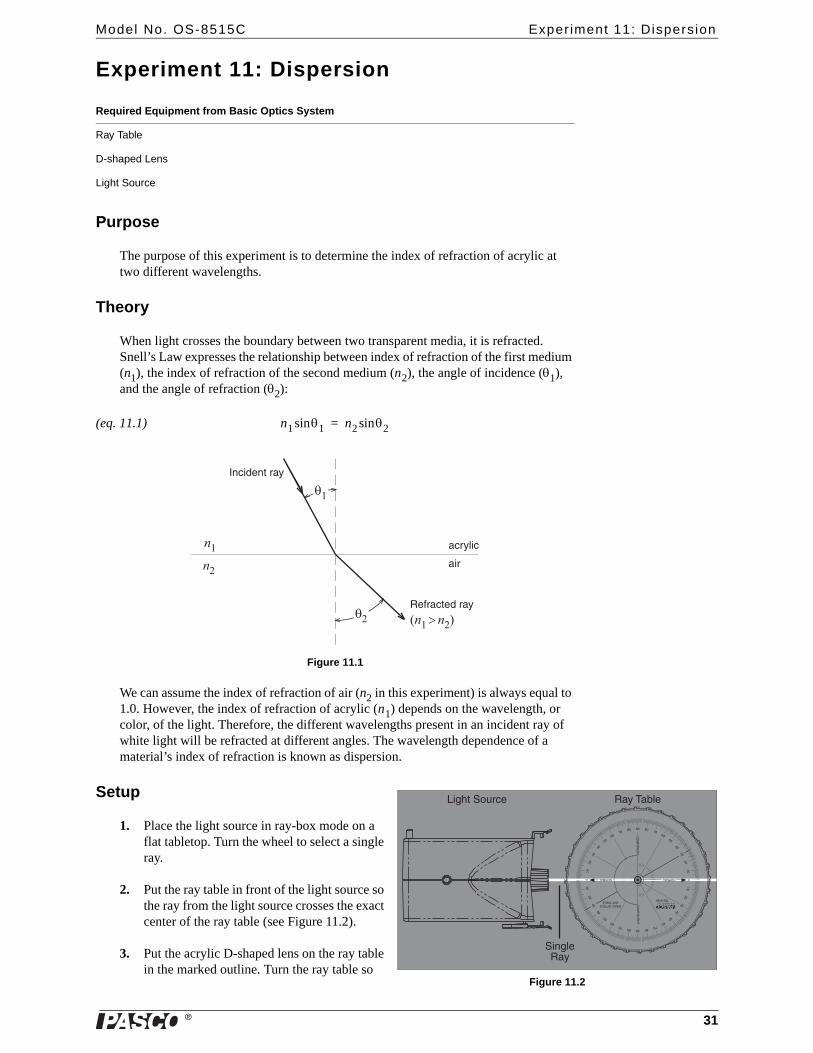
When light crosses the boundary between two transparent media, it is refracted. Snell’s Law expresses the relationship between index of refraction of the first medium (n1), the index of refraction of the second medium (n2), the angle of incidence (θ1), and the angle of refraction (θ2):
(eq. 11.1)
Figure 11.1
We can assume the index of refraction of air (n2 in this experiment) is always equal to 1.0. However, the index of refraction of acrylic (n1) depends on the wavelength, or color, of the light. Therefore, the different wavelengths present in an incident ray of white light will be refracted at different angles. The wavelength dependence of a material’s index of refraction is known as dispersion.
Setup
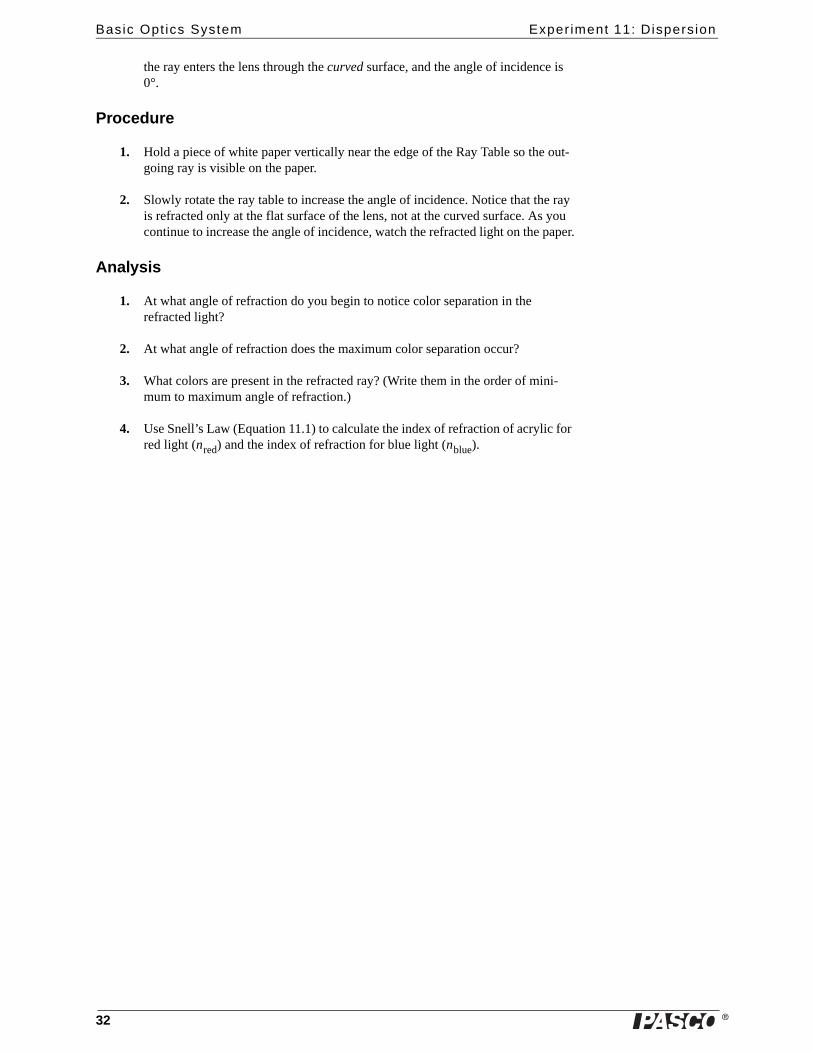
1. Place the light source in ray-box mode on a flat tabletop. Turn the wheel to select a single ray.
2. Put the ray table in front of the light source so the ray from the light source crosses the exact center of the ray table (see Figure 11.2).
3. Put the acrylic D-shaped lens on the ray table in the marked outline. Turn the ray table so
Required Equipment from Basic Optics System
Ray Table
D-shaped Lens
Light Source
n1 θ1sin n2 θ2sin=
��"� ���)�� *
���������
8%��)�%��� *
��
��
��
��
��*!��
��
����������
����
����
���
�
���
��
��
��
����
��
�� �� ��
����
��
���
�
���
��
��
��
��
� �� ����
� �� ����
� ����� ����
�����������������
������
����������
����
����
���
�
���
��
��
��
����
��
�� �� ��
����
��
���
�
���
��
��
��
��
� �� ����
� �� ����
� ����� ����
�����������������
������
��&(���#$��� � *�� ,!�
��%&!�� *
Figure 11.2
�
Basic Opt ics System Exper iment 11: Dispersion
32
the ray enters the lens through the curved surface, and the angle of incidence is 0°.
Procedure
1. Hold a piece of white paper vertically near the edge of the Ray Table so the out-going ray is visible on the paper.
2. Slowly rotate the ray table to increase the angle of incidence. Notice that the ray is refracted only at the flat surface of the lens, not at the curved surface. As you continue to increase the angle of incidence, watch the refracted light on the paper.
Analysis
1. At what angle of refraction do you begin to notice color separation in the refracted light?
2. At what angle of refraction does the maximum color separation occur?
3. What colors are present in the refracted ray? (Write them in the order of mini-mum to maximum angle of refraction.)
4. Use Snell’s Law (Equation 11.1) to calculate the index of refraction of acrylic for red light (nred) and the index of refraction for blue light (nblue).
�
Model No. OS-8515C Exper iment 12: Focal Length and Magni f icat ion of a Thin Lens
33
Experiment 12: Focal Length and Magnification of a Thin Lens
Purpose
The purpose of this experiment is to determine the focal length of a thin lens and to measure the magnification for a certain combination of object and image distances.
Theory
For a thin lens:
(eq. 12.1)
where f is focal length, do is the distance between the object and the lens, and di is the distance between the image and the lens. By measuring do and di the focal length can be determined.
Magnification, M, is the ratio of image size to object size. If the image is inverted, M is negative.
Part I: Object at Infinity
In this part, you will determine the focal length of the lens by making a single mea-surement of di with .
Procedure
1. Hold the lens in one hand and the screen in the other hand. Focus the image of a distant bright object (such as a window or lamp across the room) on the screen.
2. Have your partner measure the distance from the lens to the screen. This is the image distance, di.
di = _______________
Analysis
1. As do approaches infinity, what does 1/do approach?
Required Equipment from Basic Optics System
Light Source
Bench
Converging lens of unknown focal length1
1Instructors: see note on page 63.
Screen
Other Equipment
Metric ruler
Optics Caliper (optional, for measuring image sizes), PASCO part OS-8468
1f--- 1
do----- 1
di----+=
do ∞≅
�
Basic Opt ics System Exper iment 12: Focal Length and Magni f icat ion of a Thin Lens
34
2. Use the Thin Lens Formula (Equation 12.1) to calculate the focal length.
f = _______________
Part II: Object Closer Than Infinity
In this part, you will determine the focal length by measuring several pairs of object and image distances and plotting 1/do versus 1/di.
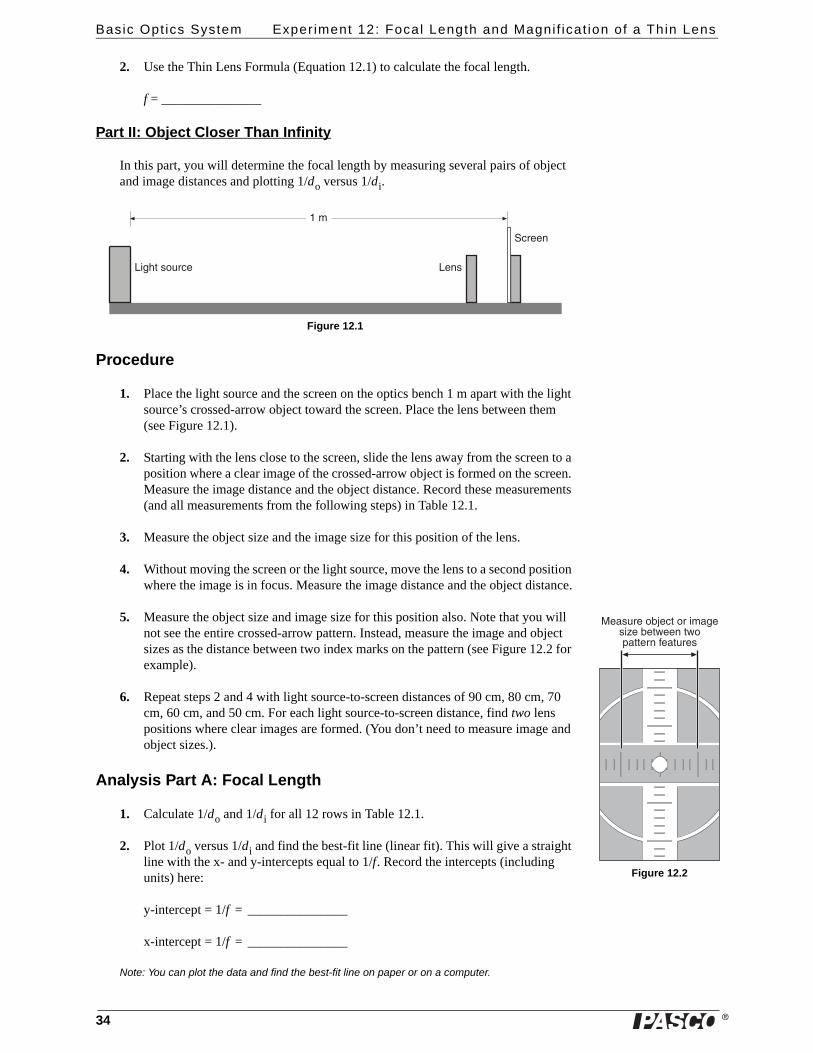
Figure 12.1
Procedure
1. Place the light source and the screen on the optics bench 1 m apart with the light source’s crossed-arrow object toward the screen. Place the lens between them (see Figure 12.1).
2. Starting with the lens close to the screen, slide the lens away from the screen to a position where a clear image of the crossed-arrow object is formed on the screen. Measure the image distance and the object distance. Record these measurements (and all measurements from the following steps) in Table 12.1.
3. Measure the object size and the image size for this position of the lens.
4. Without moving the screen or the light source, move the lens to a second position where the image is in focus. Measure the image distance and the object distance.
5. Measure the object size and image size for this position also. Note that you will not see the entire crossed-arrow pattern. Instead, measure the image and object sizes as the distance between two index marks on the pattern (see Figure 12.2 for example).
6. Repeat steps 2 and 4 with light source-to-screen distances of 90 cm, 80 cm, 70 cm, 60 cm, and 50 cm. For each light source-to-screen distance, find two lens positions where clear images are formed. (You don’t need to measure image and object sizes.).
Analysis Part A: Focal Length
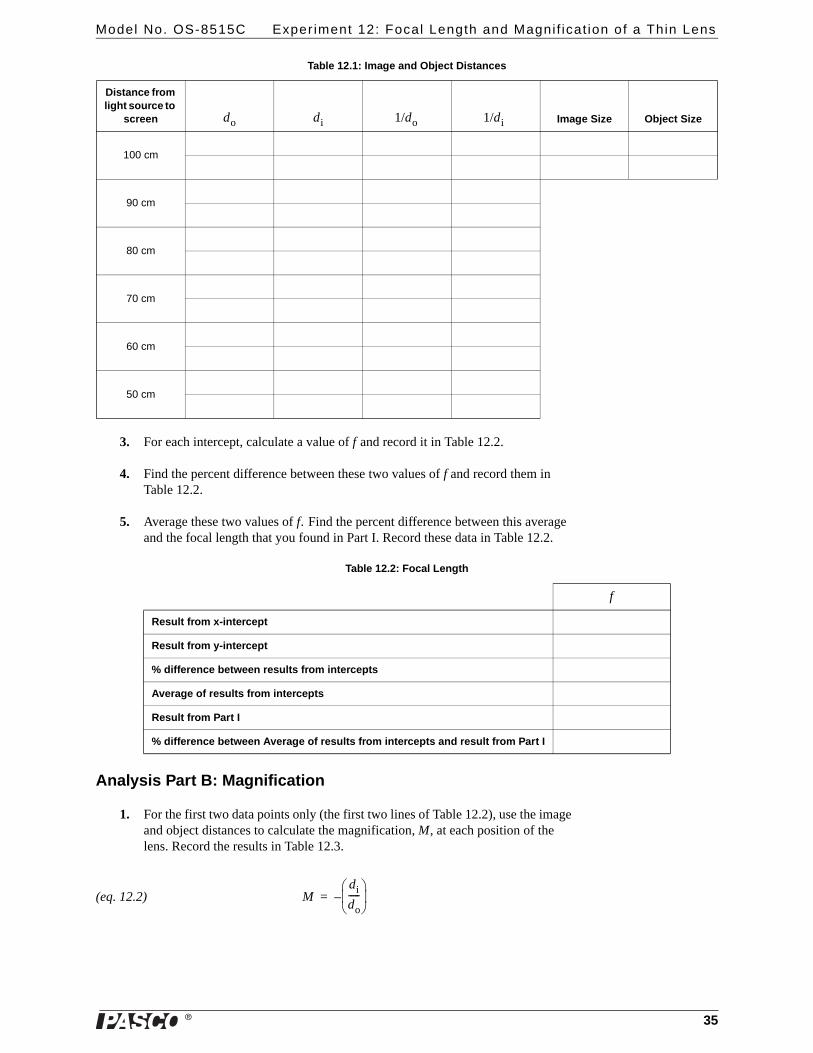
1. Calculate 1/do and 1/di for all 12 rows in Table 12.1.
2. Plot 1/do versus 1/di and find the best-fit line (linear fit). This will give a straight line with the x- and y-intercepts equal to 1/f. Record the intercepts (including units) here:
y-intercept = 1/f = _______________
x-intercept = 1/f = _______________
Note: You can plot the data and find the best-fit line on paper or on a computer.
��&(���#$��� ��%�
�����%
���
�� �$���#,-����#���� &���=��,��0��%��0#' ����%�"� �$���
Figure 12.2
�
Model No. OS-8515C Exper iment 12: Focal Length and Magni f icat ion of a Thin Lens
35
3. For each intercept, calculate a value of f and record it in Table 12.2.
4. Find the percent difference between these two values of f and record them in Table 12.2.
5. Average these two values of f. Find the percent difference between this average and the focal length that you found in Part I. Record these data in Table 12.2.
Analysis Part B: Magnification
1. For the first two data points only (the first two lines of Table 12.2), use the image and object distances to calculate the magnification, M, at each position of the lens. Record the results in Table 12.3.
(eq. 12.2)
Table 12.1: Image and Object Distances
Distance from light source to
screen do di 1/do 1/di Image Size Object Size
100 cm
90 cm
80 cm
70 cm
60 cm
50 cm
Table 12.2: Focal Length
f
Result from x-intercept
Result from y-intercept
% difference between results from intercepts
Average of results from intercepts
Result from Part I
% difference between Average of results from intercepts and result from Part I
Mdido-----⎝ ⎠⎜ ⎟⎛ ⎞
–=
�
Basic Opt ics System Exper iment 12: Focal Length and Magni f icat ion of a Thin Lens
36
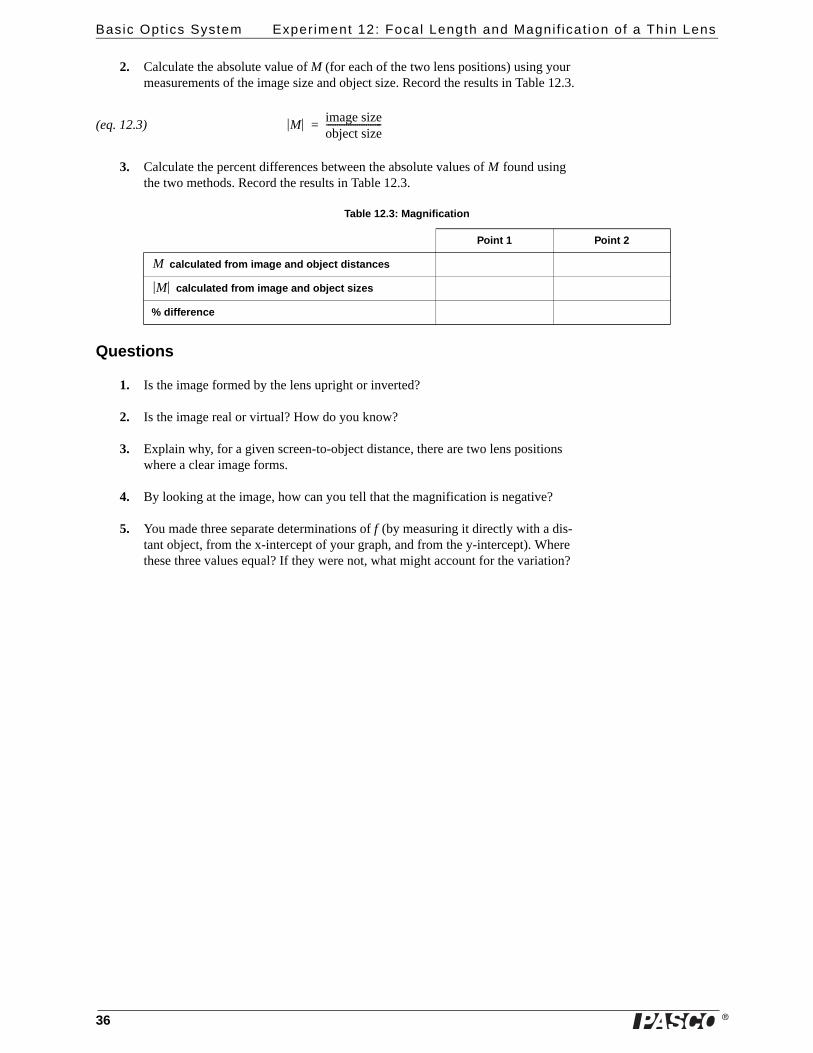
2. Calculate the absolute value of M (for each of the two lens positions) using your measurements of the image size and object size. Record the results in Table 12.3.
(eq. 12.3)
3. Calculate the percent differences between the absolute values of M found using the two methods. Record the results in Table 12.3.
Questions
1. Is the image formed by the lens upright or inverted?
2. Is the image real or virtual? How do you know?
3. Explain why, for a given screen-to-object distance, there are two lens positions where a clear image forms.
4. By looking at the image, how can you tell that the magnification is negative?
5. You made three separate determinations of f (by measuring it directly with a dis-tant object, from the x-intercept of your graph, and from the y-intercept). Where these three values equal? If they were not, what might account for the variation?
M image sizeobject size-------------------------=
Table 12.3: Magnification
Point 1 Point 2
calculated from image and object distances
calculated from image and object sizes
% difference
M
M
�
Model No. OS-8515C Experiment 13: Focal Length and Magnification of a Concave Mirror
37
Experiment 13: Focal Length and Magnification of a Concave Mirror
Purpose
The purpose of this experiment is to determine the focal length of a concave mirror and to measure the magnification for a certain combination of object and image dis-tances.
Theory
For a spherically curved mirror:
(eq. 13.1)
where f is focal length, do is the distance between the object and the mirror, and di is the distance between the image and the mirror. By measuring do and di the focal length can be determined.
Magnification, M, is the ratio of image size to object size. If the image is inverted, M is negative.
Part I: Object at Infinity
In this part, you will determine the focal length of the mirror by making a single mea-surement of di with .
Procedure
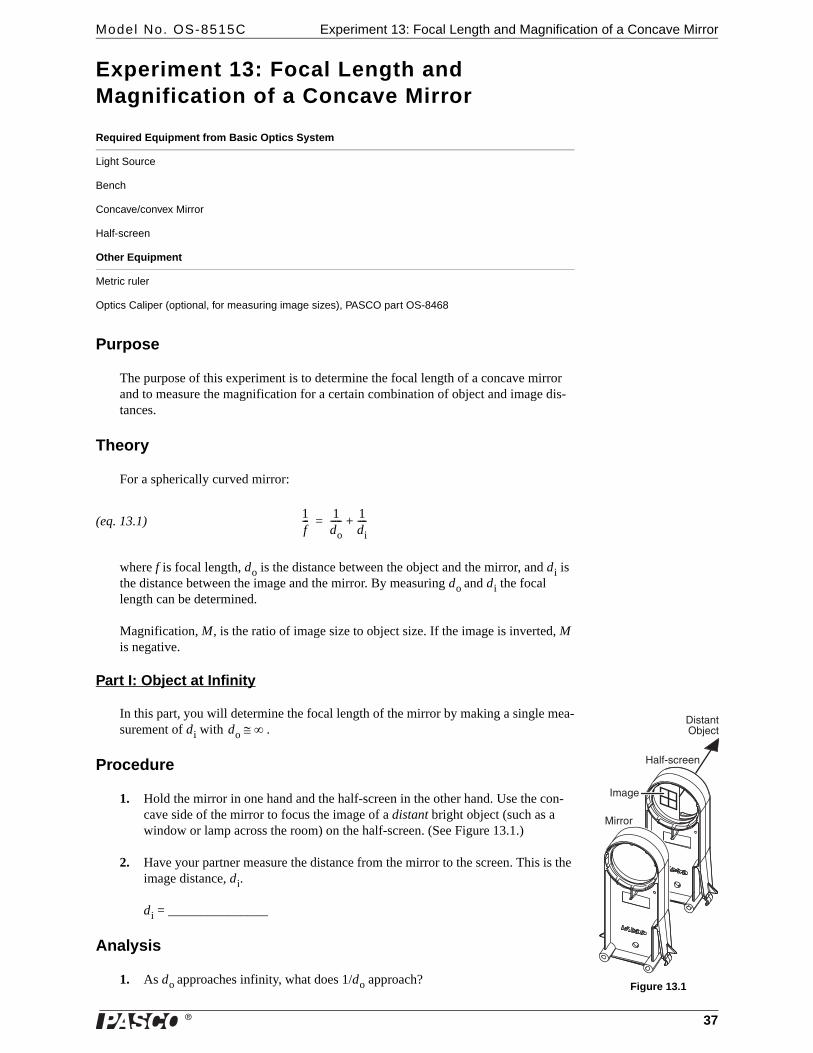
1. Hold the mirror in one hand and the half-screen in the other hand. Use the con-cave side of the mirror to focus the image of a distant bright object (such as a window or lamp across the room) on the half-screen. (See Figure 13.1.)
2. Have your partner measure the distance from the mirror to the screen. This is the image distance, di.
di = _______________
Analysis
1. As do approaches infinity, what does 1/do approach?
Required Equipment from Basic Optics System
Light Source
Bench
Concave/convex Mirror
Half-screen
Other Equipment
Metric ruler
Optics Caliper (optional, for measuring image sizes), PASCO part OS-8468
1f--- 1
do----- 1
di----+=
do ∞≅2��� %� ,-���
. !"������%
����#�
8� &�
Figure 13.1
�
Basic Opt ics System Experiment 13: Focal Length and Magnification of a Concave Mirror
38
2. Use the Equation 13.1 to calculate the focal length.
f = _______________
Part II: Object Closer Than Infinity
In this part, you will determine the focal length of the mirror by measuring several pairs of object and image distances and plotting 1/do versus 1/di.
Figure 13.2
Procedure
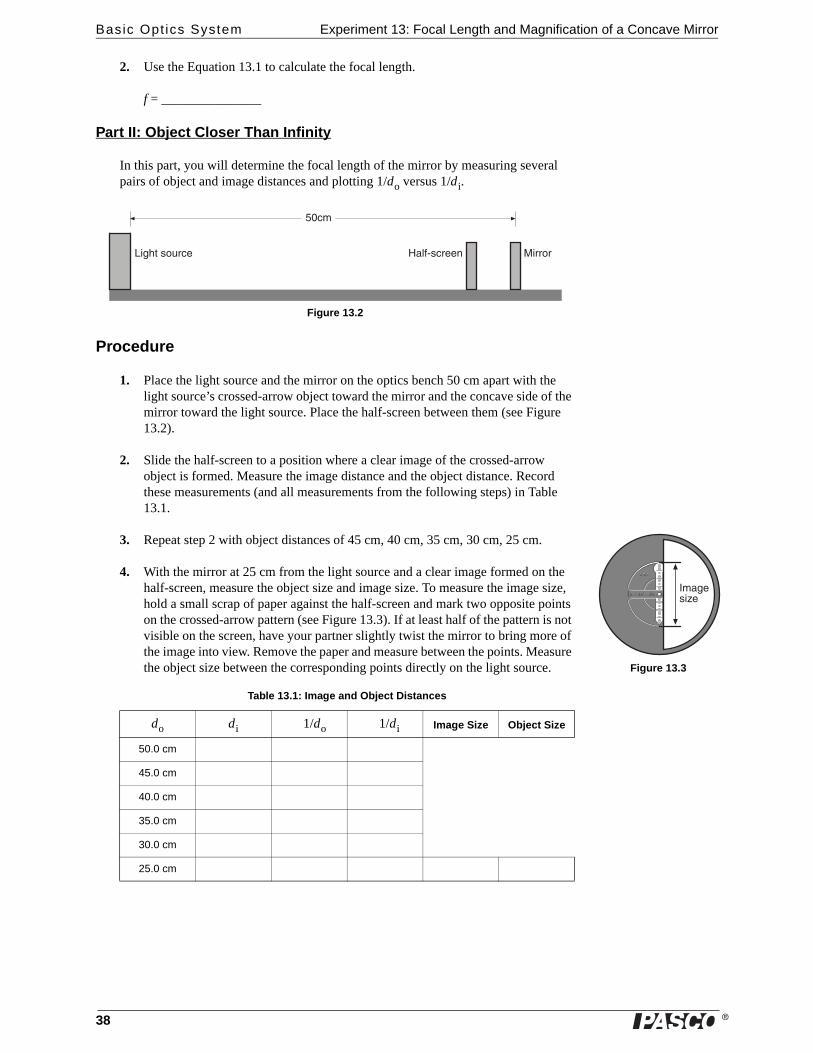
1. Place the light source and the mirror on the optics bench 50 cm apart with the light source’s crossed-arrow object toward the mirror and the concave side of the mirror toward the light source. Place the half-screen between them (see Figure 13.2).
2. Slide the half-screen to a position where a clear image of the crossed-arrow object is formed. Measure the image distance and the object distance. Record these measurements (and all measurements from the following steps) in Table 13.1.
3. Repeat step 2 with object distances of 45 cm, 40 cm, 35 cm, 30 cm, 25 cm.
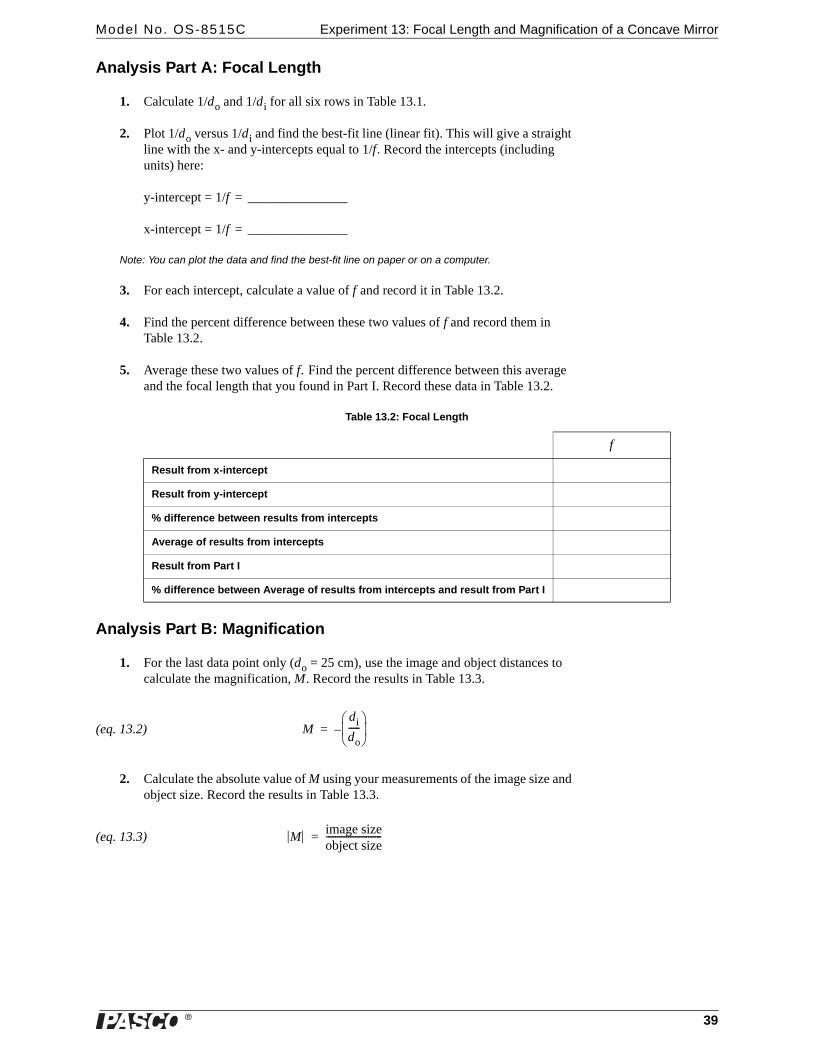
4. With the mirror at 25 cm from the light source and a clear image formed on the half-screen, measure the object size and image size. To measure the image size, hold a small scrap of paper against the half-screen and mark two opposite points on the crossed-arrow pattern (see Figure 13.3). If at least half of the pattern is not visible on the screen, have your partner slightly twist the mirror to bring more of the image into view. Remove the paper and measure between the points. Measure the object size between the corresponding points directly on the light source.
Table 13.1: Image and Object Distances
do di 1/do 1/di Image Size Object Size
50.0 cm
45.0 cm
40.0 cm
35.0 cm
30.0 cm
25.0 cm
��&(���#$��� . !"������% ����#�
����
8� &���=�
Figure 13.3
�
Model No. OS-8515C Experiment 13: Focal Length and Magnification of a Concave Mirror
39
Analysis Part A: Focal Length
1. Calculate 1/do and 1/di for all six rows in Table 13.1.
2. Plot 1/do versus 1/di and find the best-fit line (linear fit). This will give a straight line with the x- and y-intercepts equal to 1/f. Record the intercepts (including units) here:
y-intercept = 1/f = _______________
x-intercept = 1/f = _______________
Note: You can plot the data and find the best-fit line on paper or on a computer.
3. For each intercept, calculate a value of f and record it in Table 13.2.
4. Find the percent difference between these two values of f and record them in Table 13.2.
5. Average these two values of f. Find the percent difference between this average and the focal length that you found in Part I. Record these data in Table 13.2.
Analysis Part B: Magnification
1. For the last data point only (do = 25 cm), use the image and object distances to calculate the magnification, M. Record the results in Table 13.3.
(eq. 13.2)
2. Calculate the absolute value of M using your measurements of the image size and object size. Record the results in Table 13.3.
(eq. 13.3)
Table 13.2: Focal Length
f
Result from x-intercept
Result from y-intercept
% difference between results from intercepts
Average of results from intercepts
Result from Part I
% difference between Average of results from intercepts and result from Part I
Mdido-----⎝ ⎠⎜ ⎟⎛ ⎞
–=
M image sizeobject size-------------------------=
�
Basic Opt ics System Experiment 13: Focal Length and Magnification of a Concave Mirror
40
3. Calculate the percent differences between the absolute values of M found using the two methods. Record the results in Table 13.3.
Questions
1. Is the image formed by the mirror upright or inverted?
2. Is the image real or virtual? How do you know?
3. By looking at the image, how can you tell that the magnification is negative?
4. You made three separate determinations of f (by measuring it directly with a dis-tant object, from the x-intercept of your graph, and from the y-intercept). Where these three values equal? If they were not, what might account for the variation?
Table 13.3: Magnification
calculated from image and object distances
calculated from image and object sizes
% difference
M
M
�
Model No. OS-8515C Exper iment 14: Vir tual Images
41
Experiment 14: Virtual Images
Purpose
In this experiment, you will study virtual images formed by a diverging lens and a convex mirror.
Theory
A virtual image cannot be viewed on a screen. It forms where the backwards exten-sions of diverging rays cross. You can see a virtual image by looking at it through a lens or mirror. Like all images, a virtual image formed by a lens or mirror can serve as the object of another lens or mirror.
Part I: Virtual Image Formed by a Diverging Lens
In this part, you will set up a diverging lens to form a virtual image. You will then use another lens to form a real image of the virtual image. In this way you can identify the location of the virtual image.
Procedure
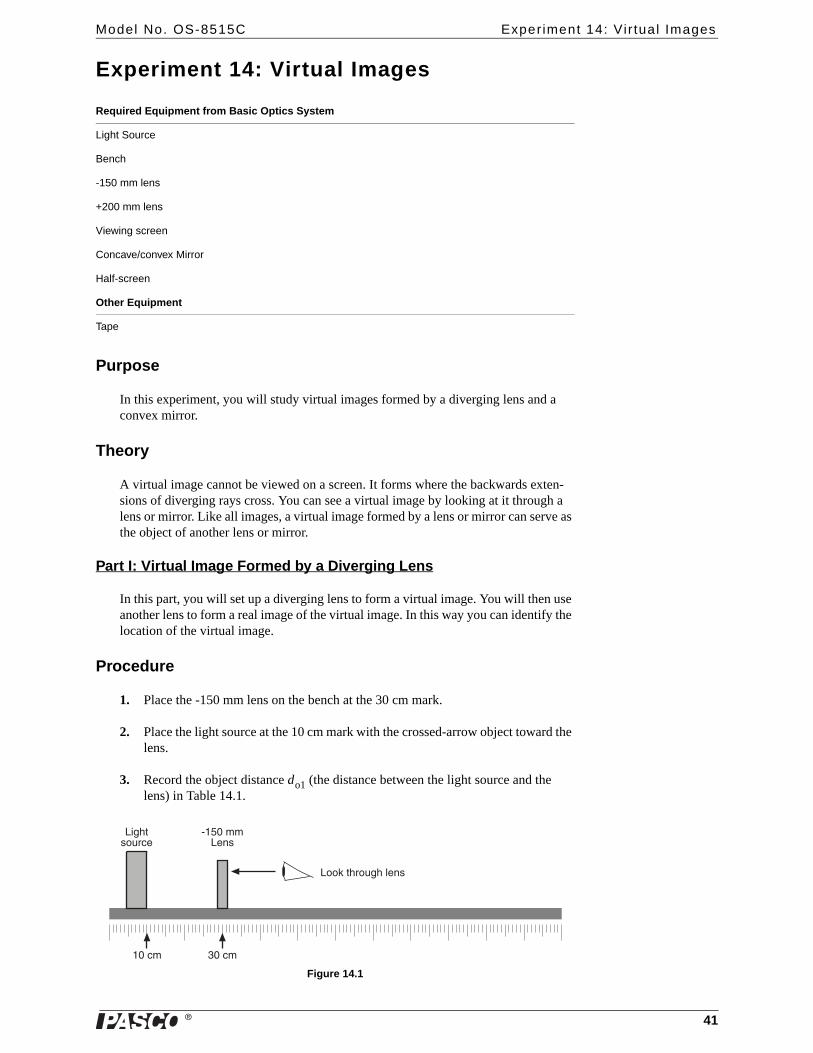
1. Place the -150 mm lens on the bench at the 30 cm mark.
2. Place the light source at the 10 cm mark with the crossed-arrow object toward the lens.
3. Record the object distance do1 (the distance between the light source and the lens) in Table 14.1.
Figure 14.1
Required Equipment from Basic Optics System
Light Source
Bench
-150 mm lens
+200 mm lens
Viewing screen
Concave/convex Mirror
Half-screen
Other Equipment
Tape
��&(��#$���
���������%�
����� ����
�##:��(�#$&(�!�%�
�
Basic Opt ics System Exper iment 14: Vir tual Images
42
4. Look through the lens toward the light source (see Figure 14.1). Describe the image. Is it upright or inverted? Does it appear to be larger or smaller than the object?
________________________________________________________________________________________________________________________________________________________________________________________________
5. Which do you think is closer to the lens: the image or the object? Why do you think so?
________________________________________________________________________________________________________________________________________________________________________________________________
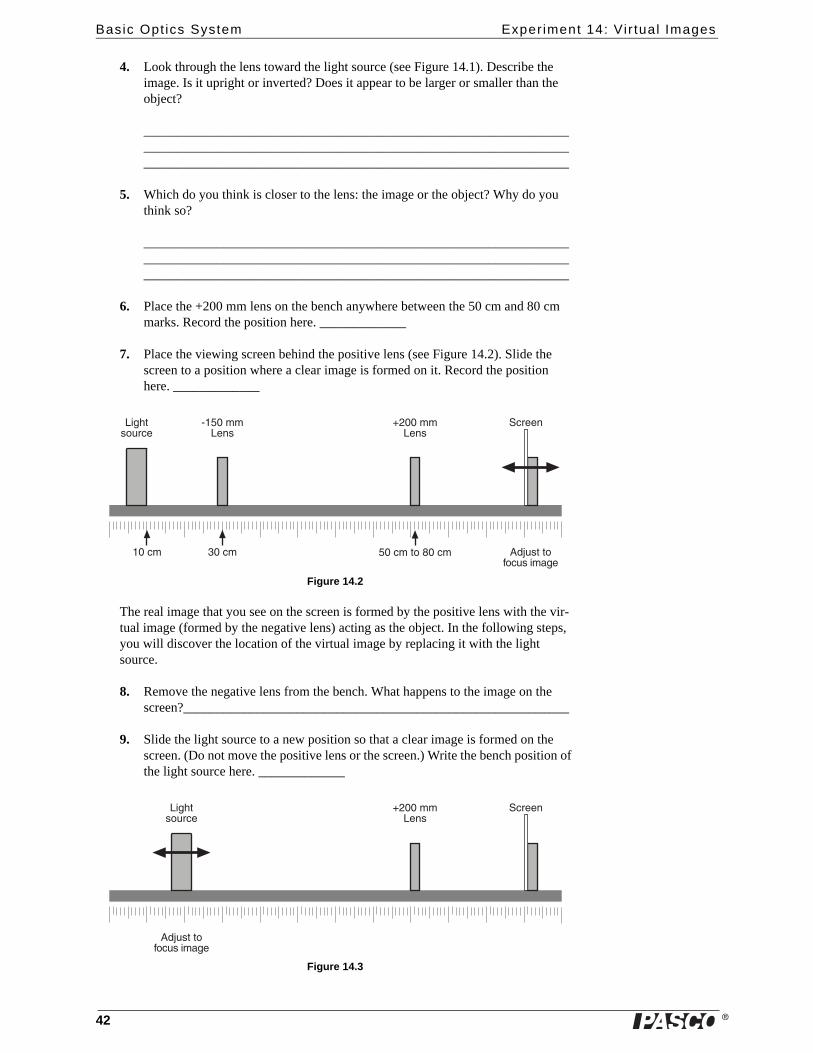
6. Place the +200 mm lens on the bench anywhere between the 50 cm and 80 cm marks. Record the position here. _____________
7. Place the viewing screen behind the positive lens (see Figure 14.2). Slide the screen to a position where a clear image is formed on it. Record the position here. _____________
Figure 14.2
The real image that you see on the screen is formed by the positive lens with the vir-tual image (formed by the negative lens) acting as the object. In the following steps, you will discover the location of the virtual image by replacing it with the light source.
8. Remove the negative lens from the bench. What happens to the image on the screen?__________________________________________________________
9. Slide the light source to a new position so that a clear image is formed on the screen. (Do not move the positive lens or the screen.) Write the bench position of the light source here. _____________
Figure 14.3
��&(��#$���
�����%1��������%�
�)-$����#"#�$���� &�
���������%�
����� ���� �������#������
��&(��#$���
�����%1��������%�
�)-$����#"#�$���� &�
�
Model No. OS-8515C Exper iment 14: Vir tual Images
43
Analysis
The current position of the light source is identical to the previous position of the vir-tual image.
1. Calculate the virtual image distance di1 (the distance between the negative lens and the virtual image). Remember that it is a negative. Record it in Table 14.1.
2. Calculate the magnification and record it in Table 14.1.
(eq. 14.1)
Questions
1. How do you know that the current position of the light source is identical to the position of the virtual image when the negative lens was on the bench?
2. In step 5 of the procedure, you predicted the position of the virtual image relative to the light source. Was your prediction correct?
3. Is M1 positive or negative? How does this relate to the appearance of the image?
4. Draw a scale diagram showing the light source in its original position, both lenses, the screen, and both images. Label every part.
5. Draw another diagram at the same scale showing the light source in its final posi-tion, the positive lens, the screen, and the image.
Part II: Virtual Image Formed by a Convex Mirror
In this part, you will find the location of a virtual image formed by convex mirror.
Procedure
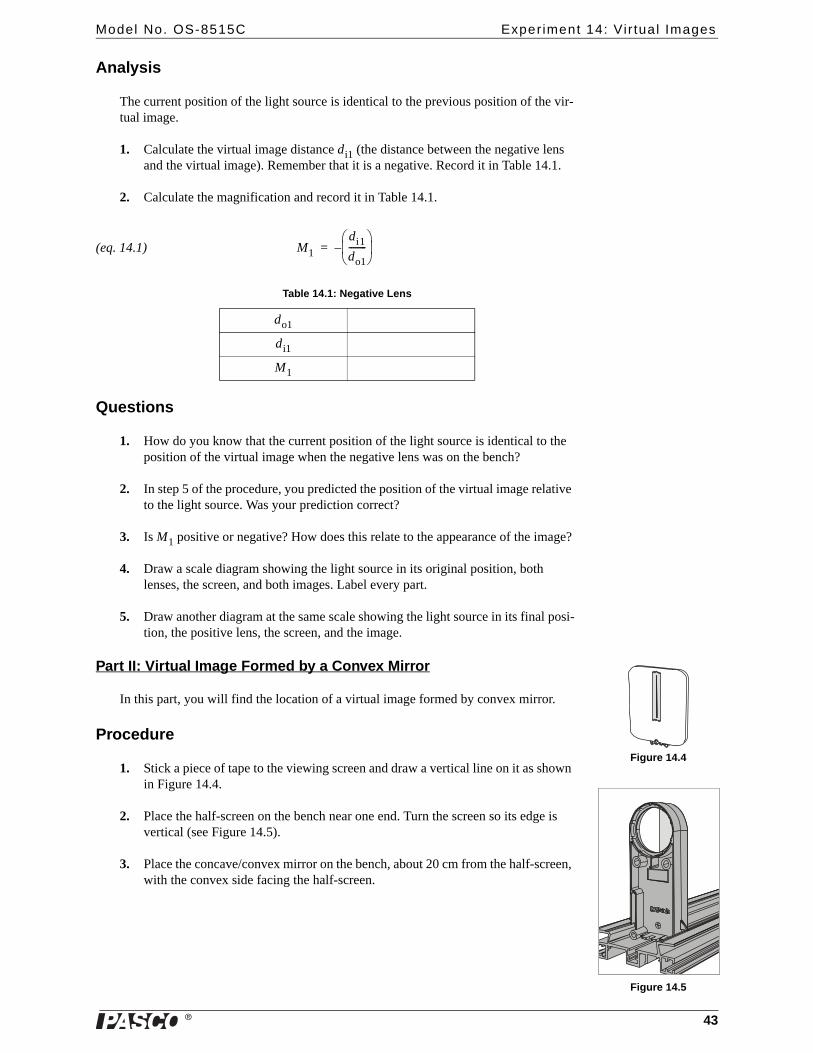
1. Stick a piece of tape to the viewing screen and draw a vertical line on it as shown in Figure 14.4.
2. Place the half-screen on the bench near one end. Turn the screen so its edge is vertical (see Figure 14.5).
3. Place the concave/convex mirror on the bench, about 20 cm from the half-screen, with the convex side facing the half-screen.
Table 14.1: Negative Lens
do1
di1
M1
M1di1do1--------⎝ ⎠⎜ ⎟⎛ ⎞
–=
Figure 14.4
Figure 14.5
�
Basic Opt ics System Exper iment 14: Vir tual Images
44
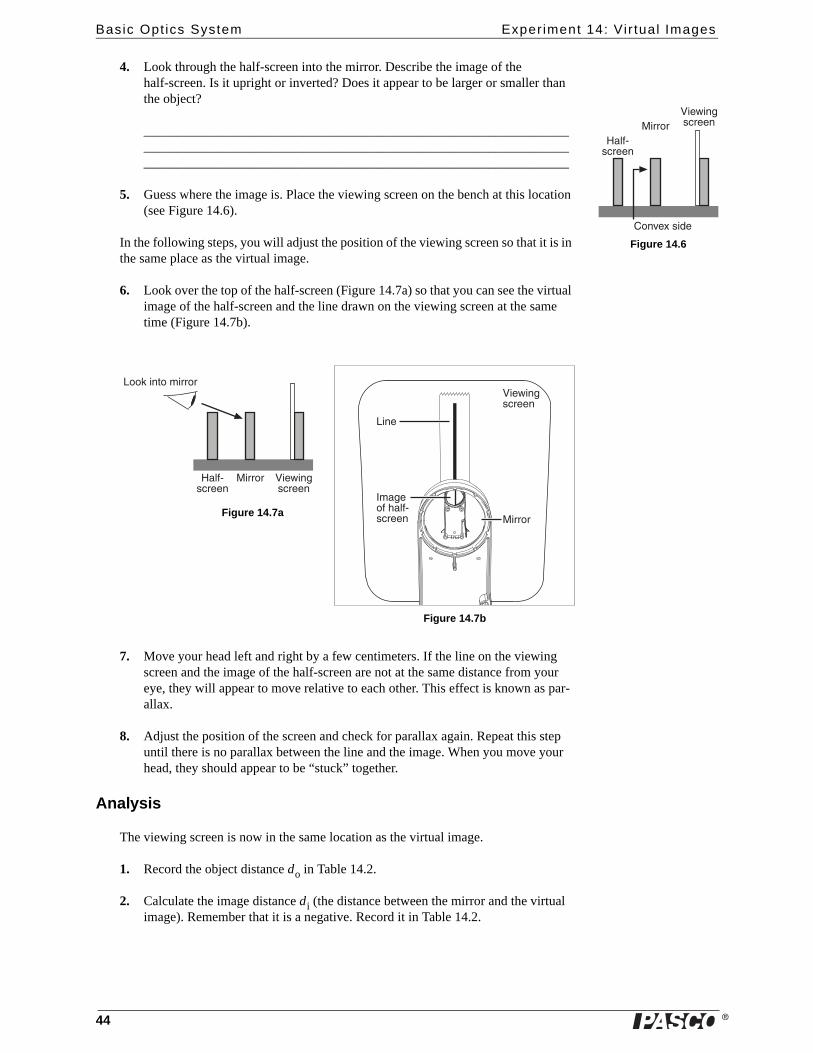
4. Look through the half-screen into the mirror. Describe the image of the half-screen. Is it upright or inverted? Does it appear to be larger or smaller than the object?
________________________________________________________________________________________________________________________________________________________________________________________________
5. Guess where the image is. Place the viewing screen on the bench at this location (see Figure 14.6).
In the following steps, you will adjust the position of the viewing screen so that it is in the same place as the virtual image.
6. Look over the top of the half-screen (Figure 14.7a) so that you can see the virtual image of the half-screen and the line drawn on the viewing screen at the same time (Figure 14.7b).
7. Move your head left and right by a few centimeters. If the line on the viewing screen and the image of the half-screen are not at the same distance from your eye, they will appear to move relative to each other. This effect is known as par-allax.
8. Adjust the position of the screen and check for parallax again. Repeat this step until there is no parallax between the line and the image. When you move your head, they should appear to be “stuck” together.
Analysis
The viewing screen is now in the same location as the virtual image.
1. Record the object distance do in Table 14.2.
2. Calculate the image distance di (the distance between the mirror and the virtual image). Remember that it is a negative. Record it in Table 14.2.
. !"������%
����#�
�#%3�5���)�
/��0�%&�����%
Figure 14.6
��%�
8� &�#"�( !"������%
/��0�%&�����%
����#�
. !"������%
����#� /��0�%&�����%
�##:��%�#�����#�
Figure 14.7a
Figure 14.7b
�
Model No. OS-8515C Exper iment 14: Vir tual Images
45
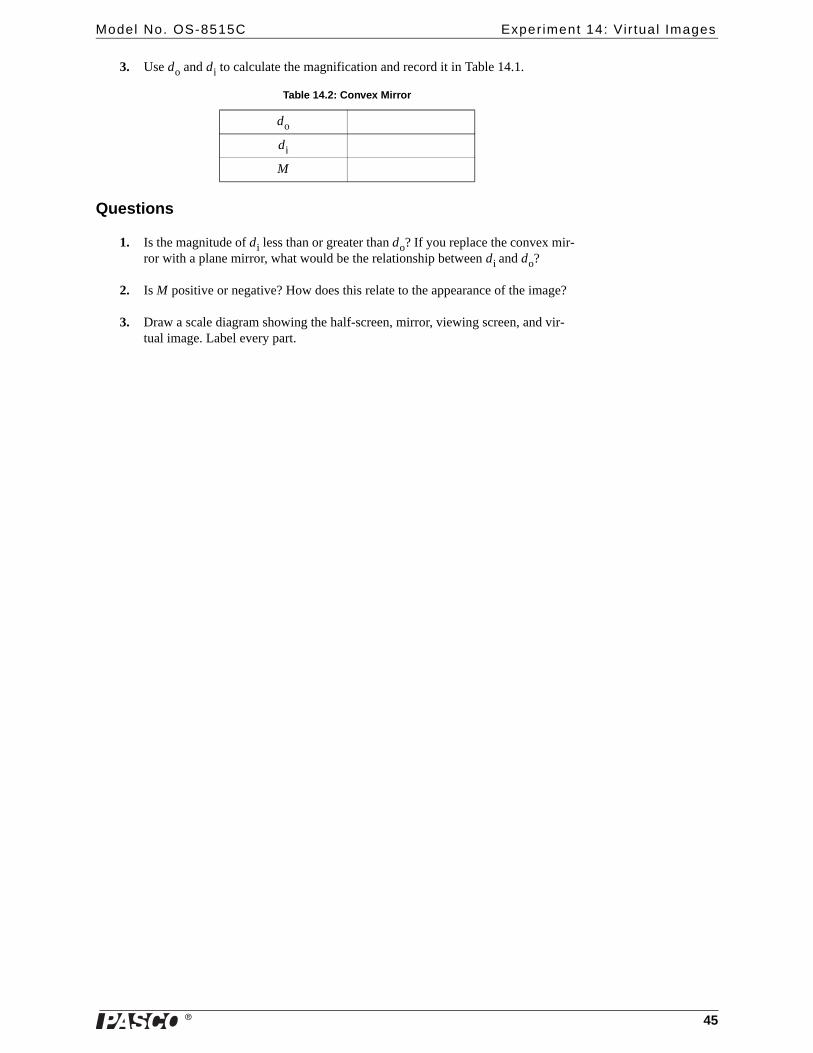
3. Use do and di to calculate the magnification and record it in Table 14.1.
Questions
1. Is the magnitude of di less than or greater than do? If you replace the convex mir-ror with a plane mirror, what would be the relationship between di and do?
2. Is M positive or negative? How does this relate to the appearance of the image?
3. Draw a scale diagram showing the half-screen, mirror, viewing screen, and vir-tual image. Label every part.
Table 14.2: Convex Mirror
do
di
M
�
Basic Opt ics System Exper iment 14: Vir tual Images
46
�
Model No. OS-8515C Exper iment 15: Telescope
47
Experiment 15: Telescope
Purpose
In this experiment, you will construct a telescope and determine its magnification.
Theory
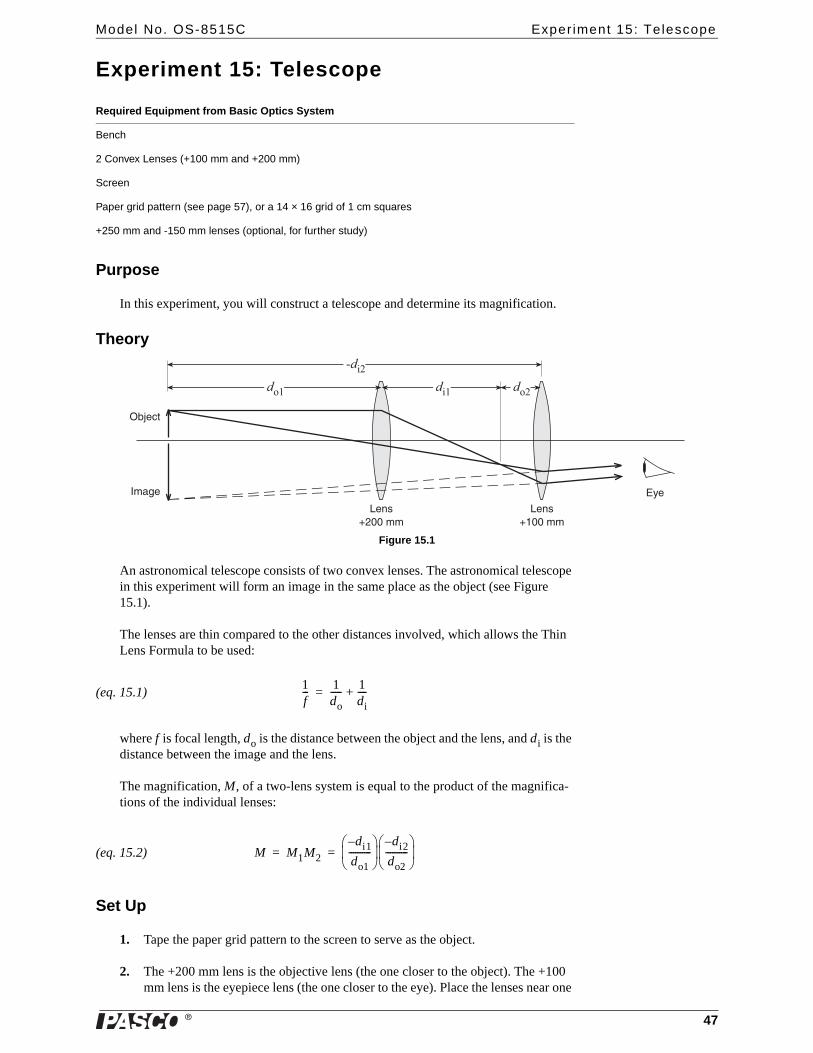
Figure 15.1
An astronomical telescope consists of two convex lenses. The astronomical telescope in this experiment will form an image in the same place as the object (see Figure 15.1).
The lenses are thin compared to the other distances involved, which allows the Thin Lens Formula to be used:
(eq. 15.1)
where f is focal length, do is the distance between the object and the lens, and di is the distance between the image and the lens.
The magnification, M, of a two-lens system is equal to the product of the magnifica-tions of the individual lenses:
(eq. 15.2)
Set Up
1. Tape the paper grid pattern to the screen to serve as the object.
2. The +200 mm lens is the objective lens (the one closer to the object). The +100 mm lens is the eyepiece lens (the one closer to the eye). Place the lenses near one
Required Equipment from Basic Optics System
Bench
2 Convex Lenses (+100 mm and +200 mm)
Screen
Paper grid pattern (see page 57), or a 14 × 16 grid of 1 cm squares
+250 mm and -150 mm lenses (optional, for further study)
���
����
��� ���
,-���
8� &�
��%�1������
��%�1������
�*�
1f--- 1
do----- 1
di----+=
M M1M2di1–
do1----------⎝ ⎠⎜ ⎟⎛ ⎞ di2–
do2----------⎝ ⎠⎜ ⎟⎛ ⎞
= =
�
Basic Opt ics System Exper iment 15: Telescope
48
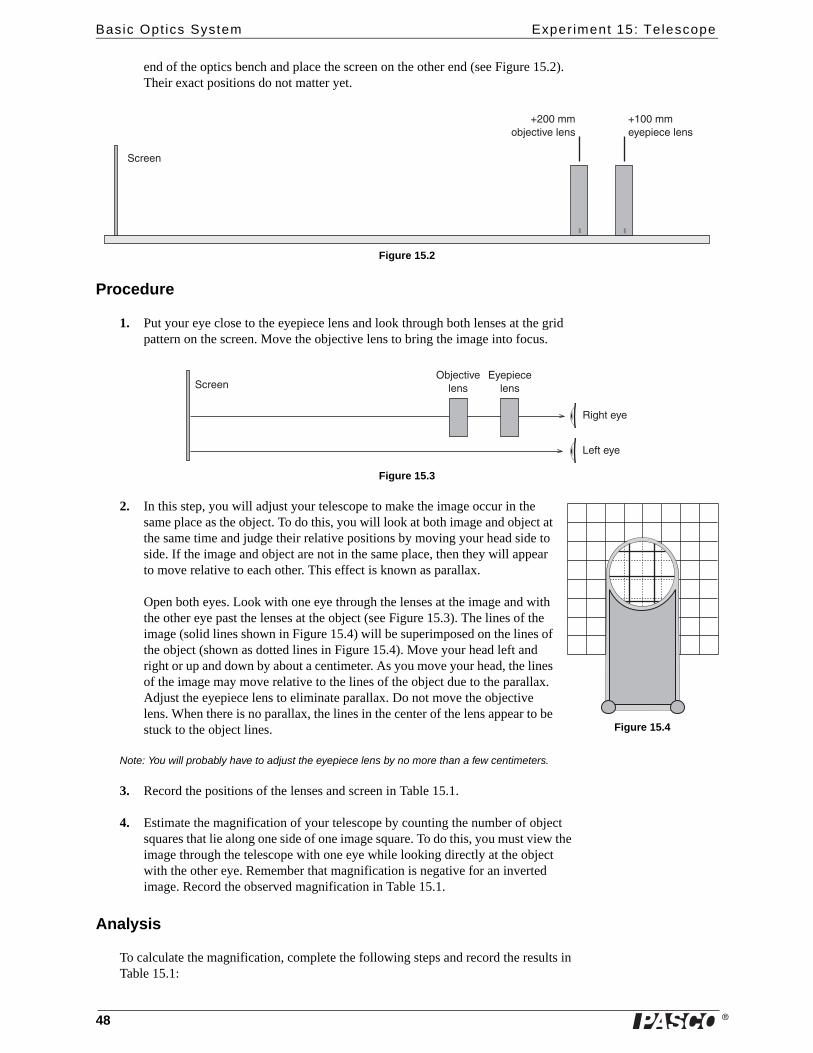
end of the optics bench and place the screen on the other end (see Figure 15.2). Their exact positions do not matter yet.
Figure 15.2
Procedure
1. Put your eye close to the eyepiece lens and look through both lenses at the grid pattern on the screen. Move the objective lens to bring the image into focus.
Figure 15.3
2. In this step, you will adjust your telescope to make the image occur in the same place as the object. To do this, you will look at both image and object at the same time and judge their relative positions by moving your head side to side. If the image and object are not in the same place, then they will appear to move relative to each other. This effect is known as parallax.
Open both eyes. Look with one eye through the lenses at the image and with the other eye past the lenses at the object (see Figure 15.3). The lines of the image (solid lines shown in Figure 15.4) will be superimposed on the lines of the object (shown as dotted lines in Figure 15.4). Move your head left and right or up and down by about a centimeter. As you move your head, the lines of the image may move relative to the lines of the object due to the parallax. Adjust the eyepiece lens to eliminate parallax. Do not move the objective lens. When there is no parallax, the lines in the center of the lens appear to be stuck to the object lines.
Note: You will probably have to adjust the eyepiece lens by no more than a few centimeters.
3. Record the positions of the lenses and screen in Table 15.1.
4. Estimate the magnification of your telescope by counting the number of object squares that lie along one side of one image square. To do this, you must view the image through the telescope with one eye while looking directly at the object with the other eye. Remember that magnification is negative for an inverted image. Record the observed magnification in Table 15.1.
Analysis
To calculate the magnification, complete the following steps and record the results in Table 15.1:
�����%
1������#,-����3��!�%�
1�������*�'�����!�%�
��"���*�
��&(���*�
�����% ,-����3�
!�%��*�'����
!�%�
��� ����
Figure 15.4
�
Model No. OS-8515C Exper iment 15: Telescope
49
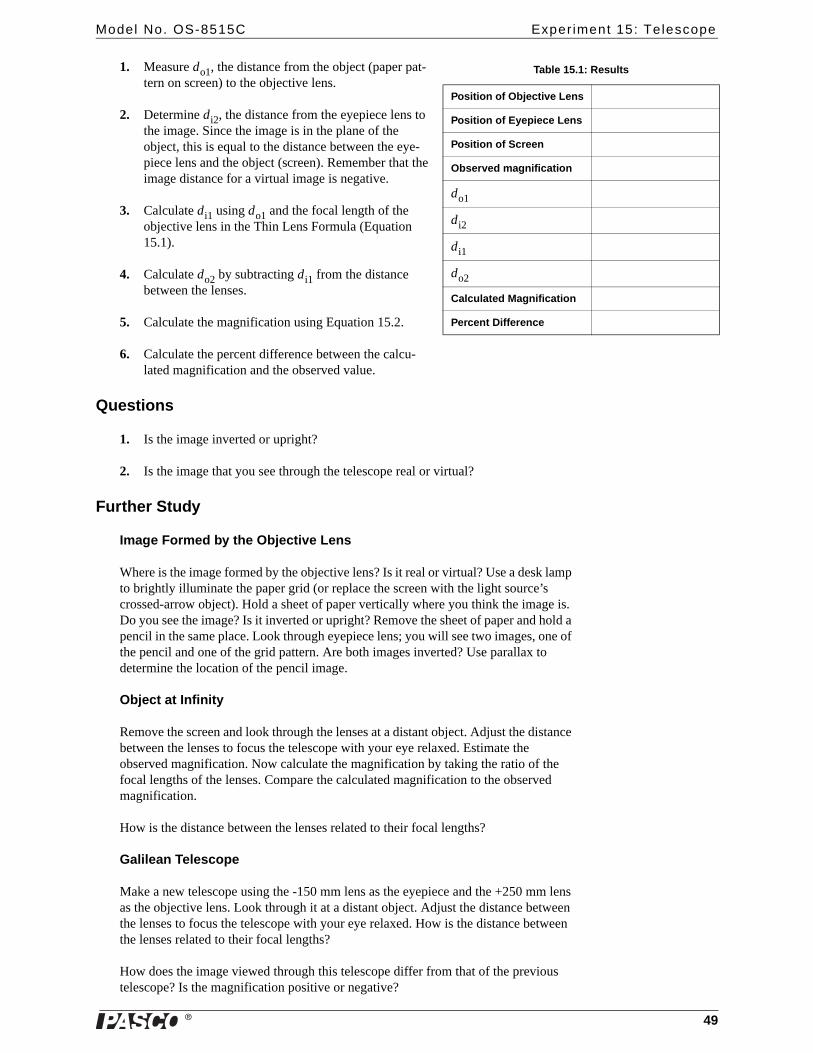
1. Measure do1, the distance from the object (paper pat-tern on screen) to the objective lens.
2. Determine di2, the distance from the eyepiece lens to the image. Since the image is in the plane of the object, this is equal to the distance between the eye-piece lens and the object (screen). Remember that the image distance for a virtual image is negative.
3. Calculate di1 using do1 and the focal length of the objective lens in the Thin Lens Formula (Equation 15.1).
4. Calculate do2 by subtracting di1 from the distance between the lenses.
5. Calculate the magnification using Equation 15.2.
6. Calculate the percent difference between the calcu-lated magnification and the observed value.
Questions
1. Is the image inverted or upright?
2. Is the image that you see through the telescope real or virtual?
Further Study
Image Formed by the Objective Lens
Where is the image formed by the objective lens? Is it real or virtual? Use a desk lamp to brightly illuminate the paper grid (or replace the screen with the light source’s crossed-arrow object). Hold a sheet of paper vertically where you think the image is. Do you see the image? Is it inverted or upright? Remove the sheet of paper and hold a pencil in the same place. Look through eyepiece lens; you will see two images, one of the pencil and one of the grid pattern. Are both images inverted? Use parallax to determine the location of the pencil image.
Object at Infinity
Remove the screen and look through the lenses at a distant object. Adjust the distance between the lenses to focus the telescope with your eye relaxed. Estimate the observed magnification. Now calculate the magnification by taking the ratio of the focal lengths of the lenses. Compare the calculated magnification to the observed magnification.
How is the distance between the lenses related to their focal lengths?
Galilean Telescope
Make a new telescope using the -150 mm lens as the eyepiece and the +250 mm lens as the objective lens. Look through it at a distant object. Adjust the distance between the lenses to focus the telescope with your eye relaxed. How is the distance between the lenses related to their focal lengths?
How does the image viewed through this telescope differ from that of the previous telescope? Is the magnification positive or negative?
Table 15.1: Results
Position of Objective Lens
Position of Eyepiece Lens
Position of Screen
Observed magnification
do1
di2
di1
do2
Calculated Magnification
Percent Difference

�
Basic Opt ics System Exper iment 15: Telescope
50
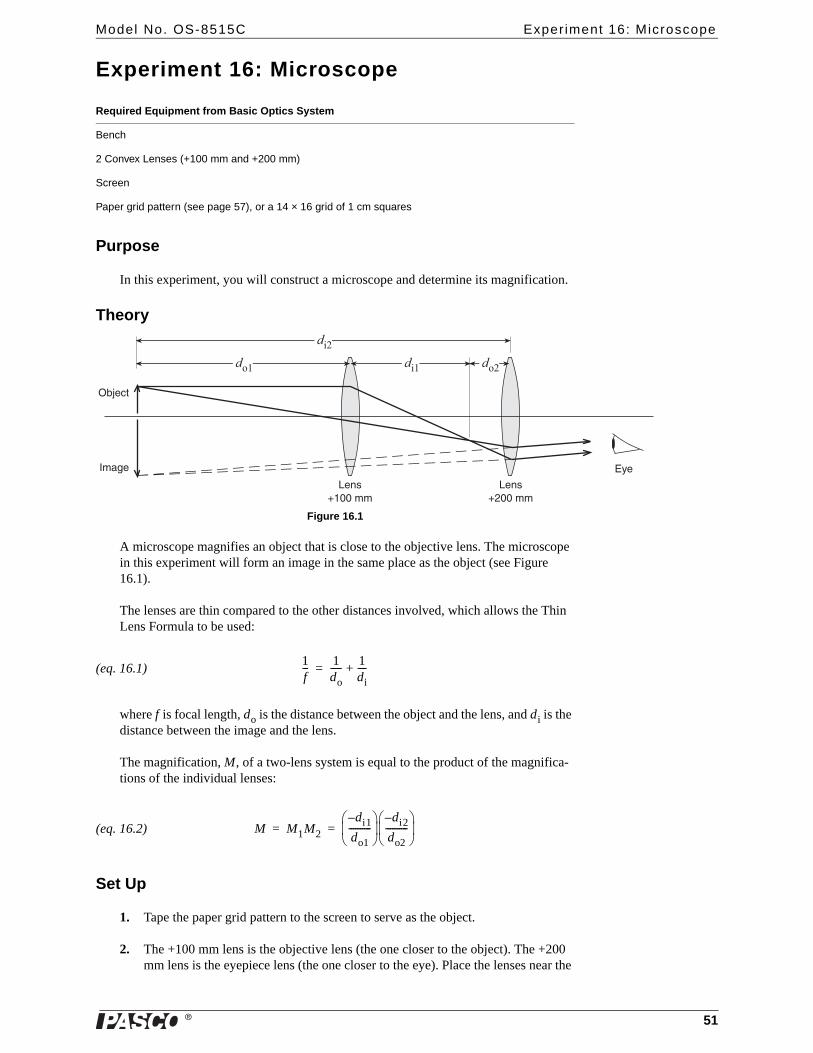
�
Model No. OS-8515C Exper iment 16: Microscope
51
Experiment 16: Microscope
Purpose
In this experiment, you will construct a microscope and determine its magnification.
Theory
Figure 16.1
A microscope magnifies an object that is close to the objective lens. The microscope in this experiment will form an image in the same place as the object (see Figure 16.1).
The lenses are thin compared to the other distances involved, which allows the Thin Lens Formula to be used:
(eq. 16.1)
where f is focal length, do is the distance between the object and the lens, and di is the distance between the image and the lens.
The magnification, M, of a two-lens system is equal to the product of the magnifica-tions of the individual lenses:
(eq. 16.2)
Set Up
1. Tape the paper grid pattern to the screen to serve as the object.
2. The +100 mm lens is the objective lens (the one closer to the object). The +200 mm lens is the eyepiece lens (the one closer to the eye). Place the lenses near the
Required Equipment from Basic Optics System
Bench
2 Convex Lenses (+100 mm and +200 mm)
Screen
Paper grid pattern (see page 57), or a 14 × 16 grid of 1 cm squares
���
���
��� ���
,-���
8� &�
��%�1������
��%�1������
�*�
1f--- 1
do----- 1
di----+=
M M1M2di1–
do1----------⎝ ⎠⎜ ⎟⎛ ⎞ di2–
do2----------⎝ ⎠⎜ ⎟⎛ ⎞
= =
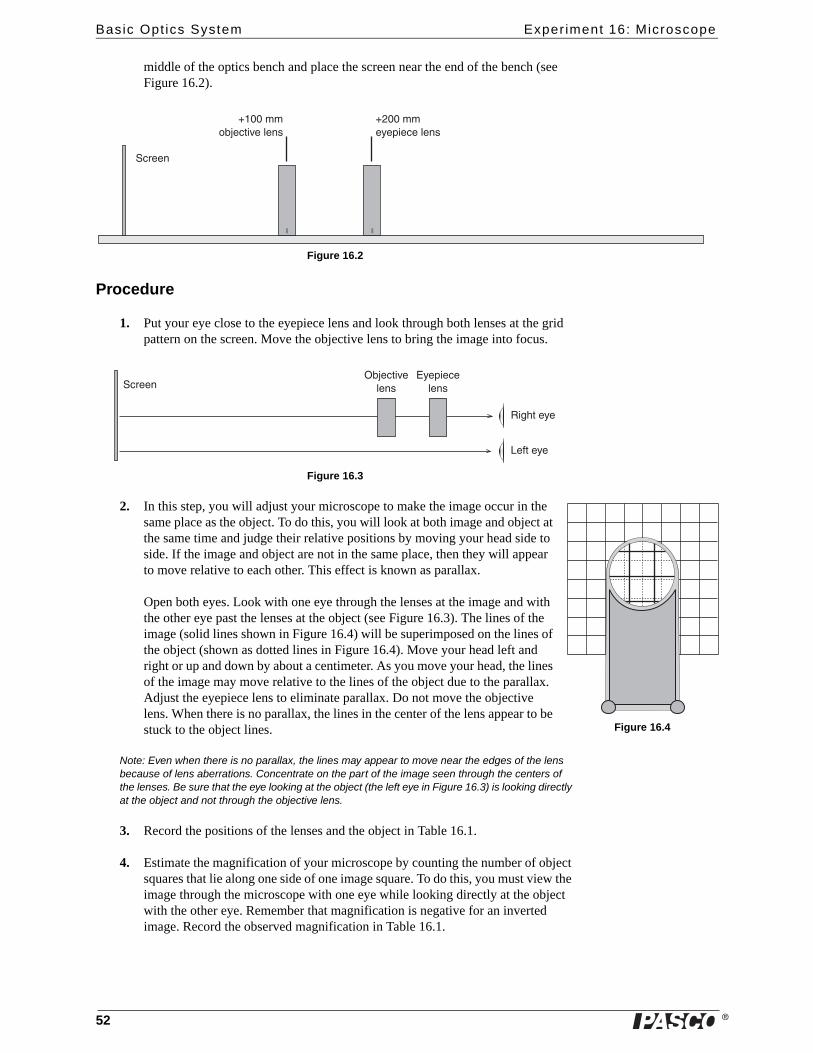
�
Basic Opt ics System Exper iment 16: Microscope
52
middle of the optics bench and place the screen near the end of the bench (see Figure 16.2).
Figure 16.2
Procedure
1. Put your eye close to the eyepiece lens and look through both lenses at the grid pattern on the screen. Move the objective lens to bring the image into focus.
Figure 16.3
2. In this step, you will adjust your microscope to make the image occur in the same place as the object. To do this, you will look at both image and object at the same time and judge their relative positions by moving your head side to side. If the image and object are not in the same place, then they will appear to move relative to each other. This effect is known as parallax.
Open both eyes. Look with one eye through the lenses at the image and with the other eye past the lenses at the object (see Figure 16.3). The lines of the image (solid lines shown in Figure 16.4) will be superimposed on the lines of the object (shown as dotted lines in Figure 16.4). Move your head left and right or up and down by about a centimeter. As you move your head, the lines of the image may move relative to the lines of the object due to the parallax. Adjust the eyepiece lens to eliminate parallax. Do not move the objective lens. When there is no parallax, the lines in the center of the lens appear to be stuck to the object lines.
Note: Even when there is no parallax, the lines may appear to move near the edges of the lens because of lens aberrations. Concentrate on the part of the image seen through the centers of the lenses. Be sure that the eye looking at the object (the left eye in Figure 16.3) is looking directly at the object and not through the objective lens.
3. Record the positions of the lenses and the object in Table 16.1.
4. Estimate the magnification of your microscope by counting the number of object squares that lie along one side of one image square. To do this, you must view the image through the microscope with one eye while looking directly at the object with the other eye. Remember that magnification is negative for an inverted image. Record the observed magnification in Table 16.1.
�����%
1������#,-����3��!�%�
1�������*�'�����!�%�
��"���*�
��&(���*�
�����% ,-����3�
!�%��*�'����
!�%�
��� ����
Figure 16.4
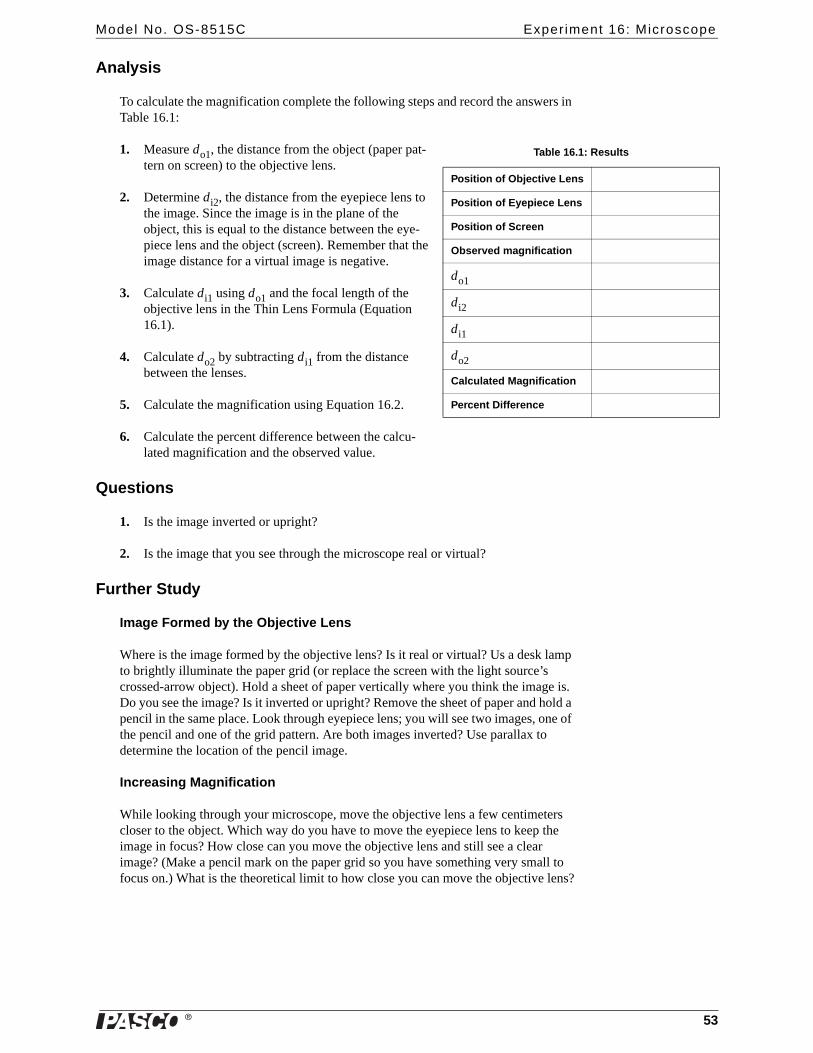
�
Model No. OS-8515C Exper iment 16: Microscope
53
Analysis
To calculate the magnification complete the following steps and record the answers in Table 16.1:
1. Measure do1, the distance from the object (paper pat-tern on screen) to the objective lens.
2. Determine di2, the distance from the eyepiece lens to the image. Since the image is in the plane of the object, this is equal to the distance between the eye-piece lens and the object (screen). Remember that the image distance for a virtual image is negative.
3. Calculate di1 using do1 and the focal length of the objective lens in the Thin Lens Formula (Equation 16.1).
4. Calculate do2 by subtracting di1 from the distance between the lenses.
5. Calculate the magnification using Equation 16.2.
6. Calculate the percent difference between the calcu-lated magnification and the observed value.
Questions
1. Is the image inverted or upright?
2. Is the image that you see through the microscope real or virtual?
Further Study
Image Formed by the Objective Lens
Where is the image formed by the objective lens? Is it real or virtual? Us a desk lamp to brightly illuminate the paper grid (or replace the screen with the light source’s crossed-arrow object). Hold a sheet of paper vertically where you think the image is. Do you see the image? Is it inverted or upright? Remove the sheet of paper and hold a pencil in the same place. Look through eyepiece lens; you will see two images, one of the pencil and one of the grid pattern. Are both images inverted? Use parallax to determine the location of the pencil image.
Increasing Magnification
While looking through your microscope, move the objective lens a few centimeters closer to the object. Which way do you have to move the eyepiece lens to keep the image in focus? How close can you move the objective lens and still see a clear image? (Make a pencil mark on the paper grid so you have something very small to focus on.) What is the theoretical limit to how close you can move the objective lens?
Table 16.1: Results
Position of Objective Lens
Position of Eyepiece Lens
Position of Screen
Observed magnification
do1
di2
di1
do2
Calculated Magnification
Percent Difference

�
Basic Opt ics System Exper iment 16: Microscope
54
�
Model No. OS-8515C Exper iment 17: Shadows
55
Experiment 17: Shadows
Purpose
The purpose of this experiment is to show the umbra (darker part) and the penumbra (lighter part) of the shadow.
Set Up
1. Place the two optics benches beside each other.
2. Put one light source on each bench with the point source (circular hole) facing the other end of the bench.
3. Place the screen on one of the benches at the opposite end to the light sources.
Procedure
1. Plug in only one of the light sources.
2. Hold a pencil about 5 cm away from the screen so its shadow is cast on the screen. Now turn the light source around so the crossed-arrow illuminates the pencil and screen. How does the shadow change?
3. Rotate the light source back to the point-source position. Plug in the second light source. Make a sketch of the shadow of the pencil. Label the umbra and the pen-umbra.
4. Move the pencil away and toward the screen. How does the shadow change?
5. Block the light from each point source in succession to determine which part of the shadow is caused by each light source. Indicate your observation on your sketch.
Required Equipment from Basic Optics System (2 systems needed)
2 Benches
2 Light Sources
1 Screen

�
Basic Opt ics System Exper iment 17: Shadows
56
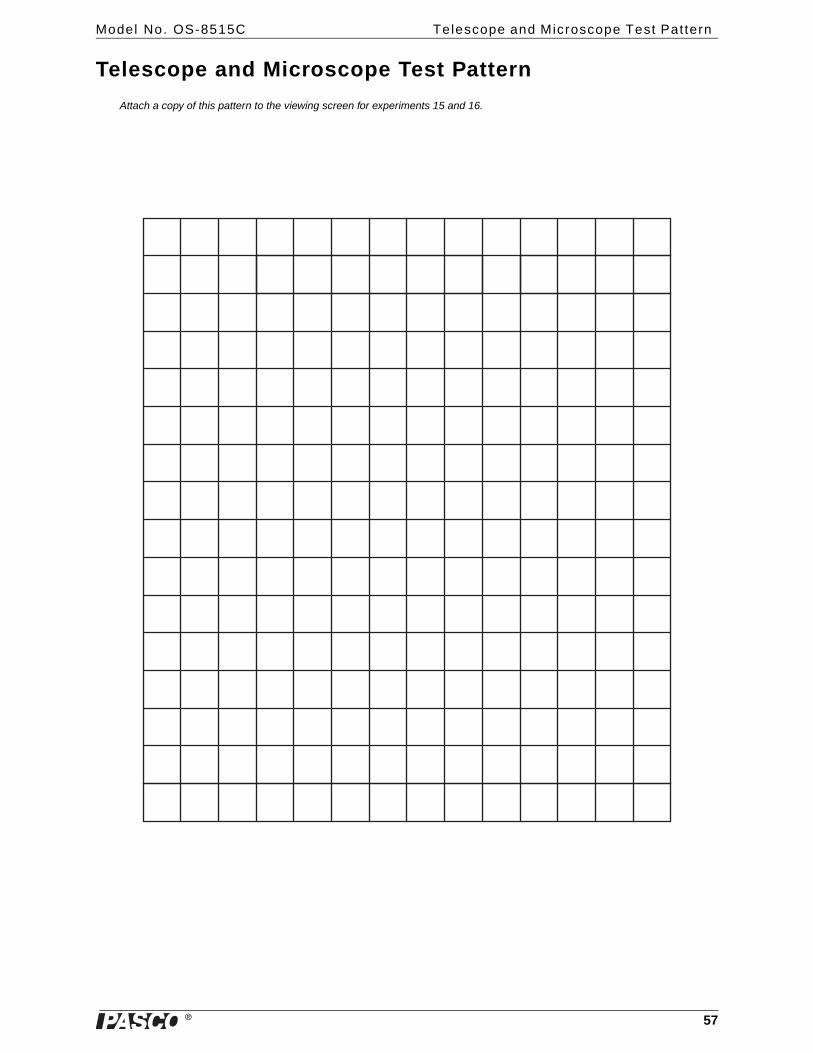
�
Model No. OS-8515C Telescope and Microscope Test Pattern
57
Telescope and Microscope Test Pattern
Attach a copy of this pattern to the viewing screen for experiments 15 and 16.
�
Basic Opt ics System Telescope and Microscope Test Pattern
58
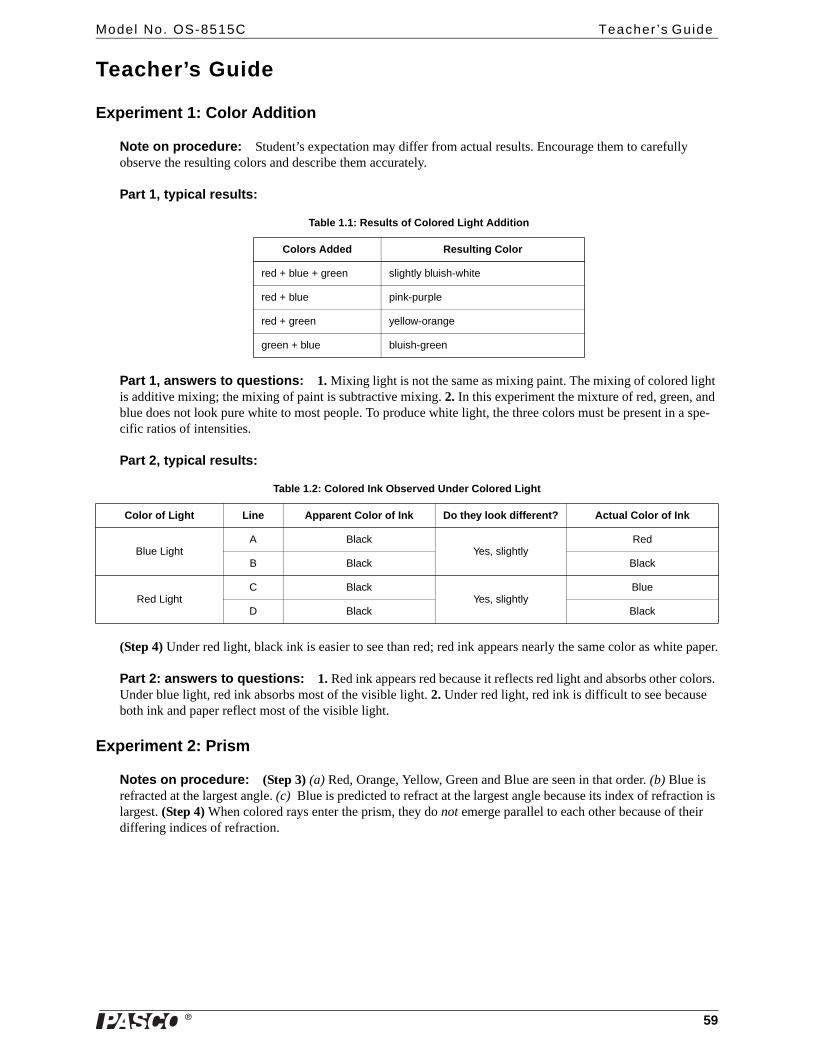
�
Model No. OS-8515C Teacher ’s Guide
59
Teacher’s Guide
Experiment 1: Color Addition
Note on procedure: Student’s expectation may differ from actual results. Encourage them to carefully observe the resulting colors and describe them accurately.
Part 1, typical results:
Part 1, answers to questions: 1. Mixing light is not the same as mixing paint. The mixing of colored light is additive mixing; the mixing of paint is subtractive mixing. 2. In this experiment the mixture of red, green, and blue does not look pure white to most people. To produce white light, the three colors must be present in a spe-cific ratios of intensities.
Part 2, typical results:
(Step 4) Under red light, black ink is easier to see than red; red ink appears nearly the same color as white paper.
Part 2: answers to questions: 1. Red ink appears red because it reflects red light and absorbs other colors. Under blue light, red ink absorbs most of the visible light. 2. Under red light, red ink is difficult to see because both ink and paper reflect most of the visible light.
Experiment 2: Prism
Notes on procedure: (Step 3) (a) Red, Orange, Yellow, Green and Blue are seen in that order. (b) Blue is refracted at the largest angle. (c) Blue is predicted to refract at the largest angle because its index of refraction is largest. (Step 4) When colored rays enter the prism, they do not emerge parallel to each other because of their differing indices of refraction.
Table 1.1: Results of Colored Light Addition
Colors Added Resulting Color
red + blue + green slightly bluish-white
red + blue pink-purple
red + green yellow-orange
green + blue bluish-green
Table 1.2: Colored Ink Observed Under Colored Light
Color of Light Line Apparent Color of Ink Do they look different? Actual Color of Ink
Blue LightA Black
Yes, slightlyRed
B Black Black
Red LightC Black
Yes, slightlyBlue
D Black Black
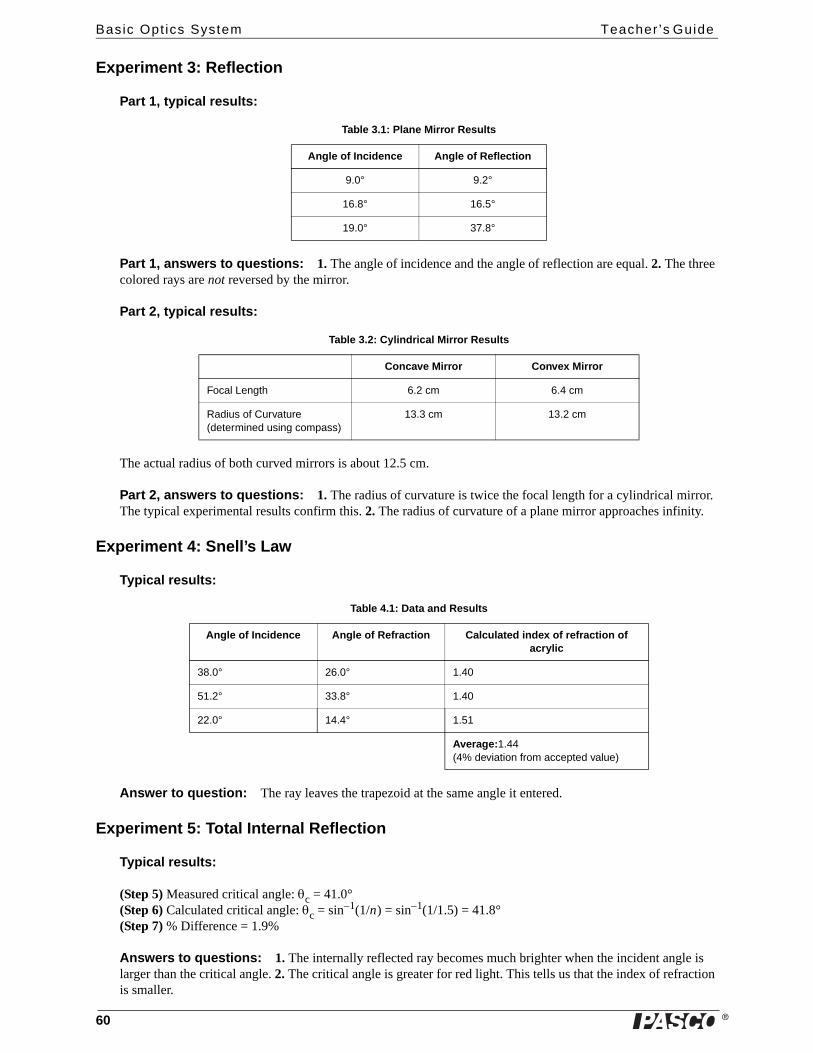
�
Basic Opt ics System Teacher ’s Guide
60
Experiment 3: Reflection
Part 1, typical results:
Part 1, answers to questions: 1. The angle of incidence and the angle of reflection are equal. 2. The three colored rays are not reversed by the mirror.
Part 2, typical results:
The actual radius of both curved mirrors is about 12.5 cm.
Part 2, answers to questions: 1. The radius of curvature is twice the focal length for a cylindrical mirror. The typical experimental results confirm this. 2. The radius of curvature of a plane mirror approaches infinity.
Experiment 4: Snell’s Law
Typical results:
Answer to question: The ray leaves the trapezoid at the same angle it entered.
Experiment 5: Total Internal Reflection
Typical results:
(Step 5) Measured critical angle: θc = 41.0°(Step 6) Calculated critical angle: θc = sin−1(1/n) = sin−1(1/1.5) = 41.8°(Step 7) % Difference = 1.9%
Answers to questions: 1. The internally reflected ray becomes much brighter when the incident angle is larger than the critical angle. 2. The critical angle is greater for red light. This tells us that the index of refraction is smaller.
Table 3.1: Plane Mirror Results
Angle of Incidence Angle of Reflection
9.0° 9.2°
16.8° 16.5°
19.0° 37.8°
Table 3.2: Cylindrical Mirror Results
Concave Mirror Convex Mirror
Focal Length 6.2 cm 6.4 cm
Radius of Curvature (determined using compass)
13.3 cm 13.2 cm
Table 4.1: Data and Results
Angle of Incidence Angle of Refraction Calculated index of refraction of acrylic
38.0° 26.0° 1.40
51.2° 33.8° 1.40
22.0° 14.4° 1.51
Average:1.44(4% deviation from accepted value)
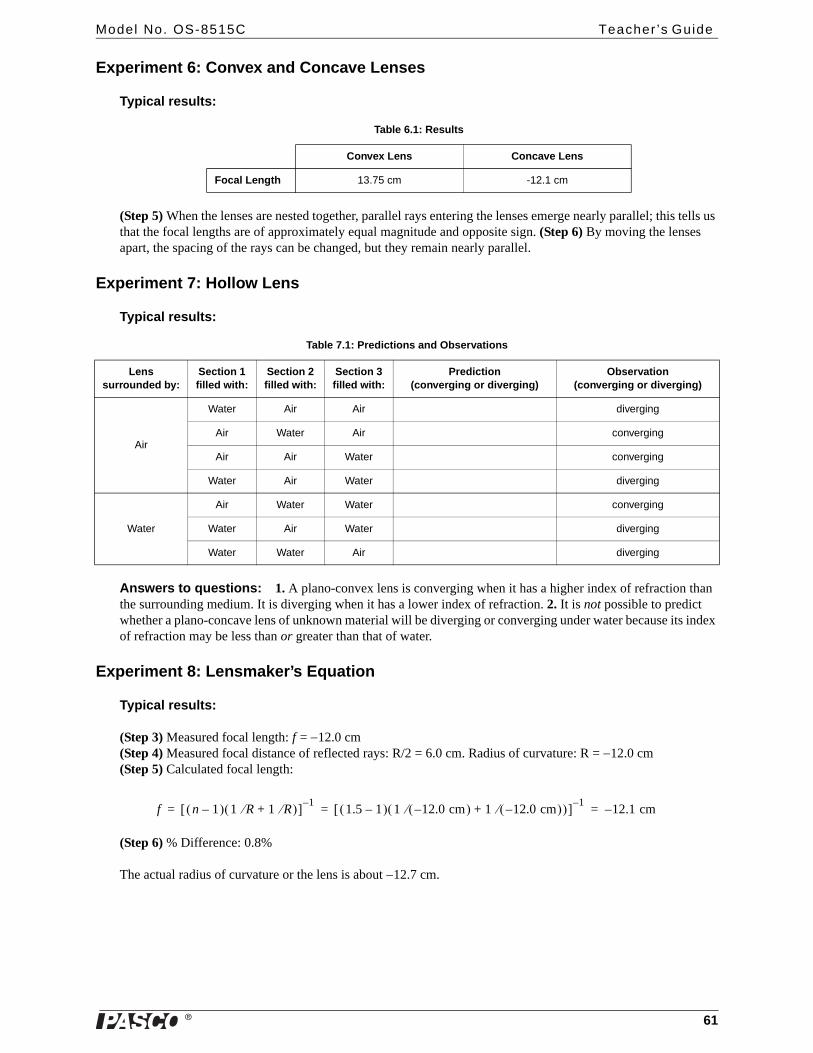
�
Model No. OS-8515C Teacher ’s Guide
61
Experiment 6: Convex and Concave Lenses
Typical results:
(Step 5) When the lenses are nested together, parallel rays entering the lenses emerge nearly parallel; this tells us that the focal lengths are of approximately equal magnitude and opposite sign. (Step 6) By moving the lenses apart, the spacing of the rays can be changed, but they remain nearly parallel.
Experiment 7: Hollow Lens
Typical results:
Answers to questions: 1. A plano-convex lens is converging when it has a higher index of refraction than the surrounding medium. It is diverging when it has a lower index of refraction. 2. It is not possible to predict whether a plano-concave lens of unknown material will be diverging or converging under water because its index of refraction may be less than or greater than that of water.
Experiment 8: Lensmaker’s Equation
Typical results:
(Step 3) Measured focal length: f = −12.0 cm(Step 4) Measured focal distance of reflected rays: R/2 = 6.0 cm. Radius of curvature: R = −12.0 cm(Step 5) Calculated focal length:
(Step 6) % Difference: 0.8%
The actual radius of curvature or the lens is about −12.7 cm.
Table 6.1: Results
Convex Lens Concave Lens
Focal Length 13.75 cm -12.1 cm
Table 7.1: Predictions and Observations
Lens surrounded by:
Section 1 filled with:
Section 2 filled with:
Section 3 filled with:
Prediction(converging or diverging)
Observation(converging or diverging)
Air
Water Air Air diverging
Air Water Air converging
Air Air Water converging
Water Air Water diverging
Water
Air Water Water converging
Water Air Water diverging
Water Water Air diverging
f n 1–( ) 1 R⁄ 1 R⁄+( )[ ] 1– 1.5 1–( ) 1 12.0– cm( )⁄ 1 12.0– cm( )⁄+( )[ ] 1– 12.1 cm–= = =
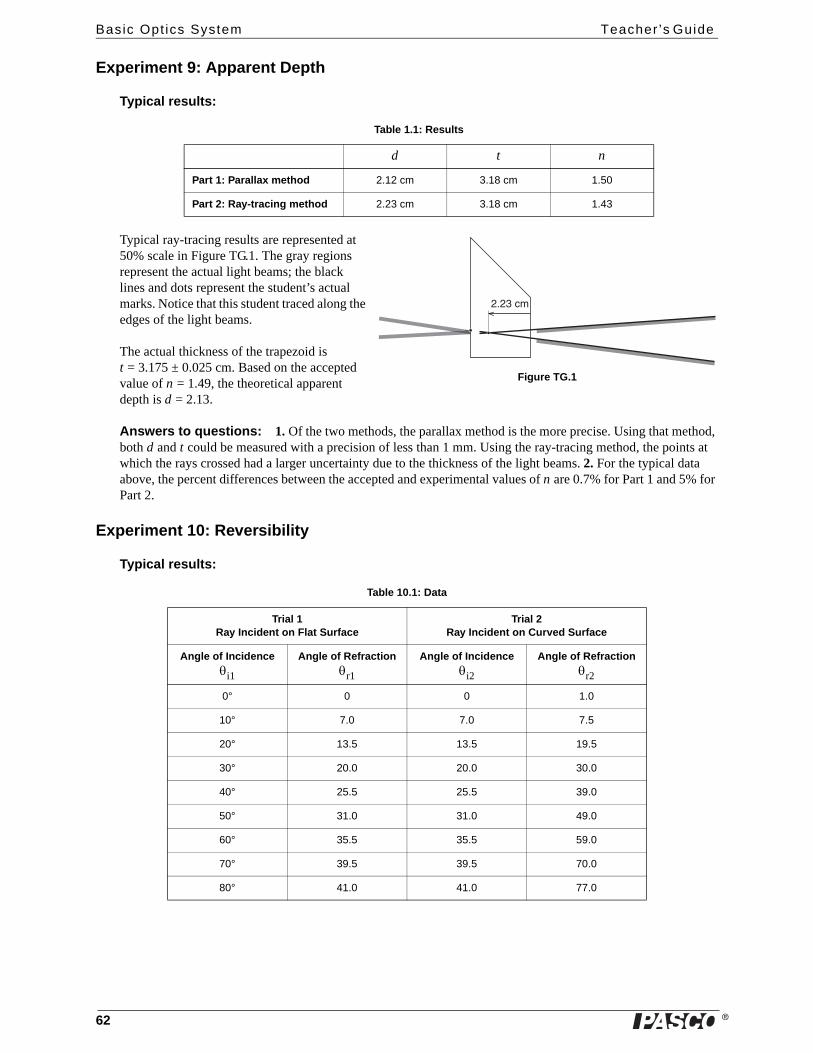
�
Basic Opt ics System Teacher ’s Guide
62
Experiment 9: Apparent Depth
Typical results:
Typical ray-tracing results are represented at 50% scale in Figure TG.1. The gray regions represent the actual light beams; the black lines and dots represent the student’s actual marks. Notice that this student traced along the edges of the light beams.
The actual thickness of the trapezoid is t = 3.175 ± 0.025 cm. Based on the accepted value of n = 1.49, the theoretical apparent depth is d = 2.13.
Answers to questions: 1. Of the two methods, the parallax method is the more precise. Using that method, both d and t could be measured with a precision of less than 1 mm. Using the ray-tracing method, the points at which the rays crossed had a larger uncertainty due to the thickness of the light beams. 2. For the typical data above, the percent differences between the accepted and experimental values of n are 0.7% for Part 1 and 5% for Part 2.
Experiment 10: Reversibility
Typical results:
Table 1.1: Results
d t n
Part 1: Parallax method 2.12 cm 3.18 cm 1.50
Part 2: Ray-tracing method 2.23 cm 3.18 cm 1.43
Table 10.1: Data
Trial 1Ray Incident on Flat Surface
Trial 2Ray Incident on Curved Surface
Angle of Incidenceθi1
Angle of Refractionθr1
Angle of Incidenceθi2
Angle of Refractionθr2
0° 0 0 1.0
10° 7.0 7.0 7.5
20° 13.5 13.5 19.5
30° 20.0 20.0 30.0
40° 25.5 25.5 39.0
50° 31.0 31.0 49.0
60° 35.5 35.5 59.0
70° 39.5 39.5 70.0
80° 41.0 41.0 77.0
�>����
Figure TG.1
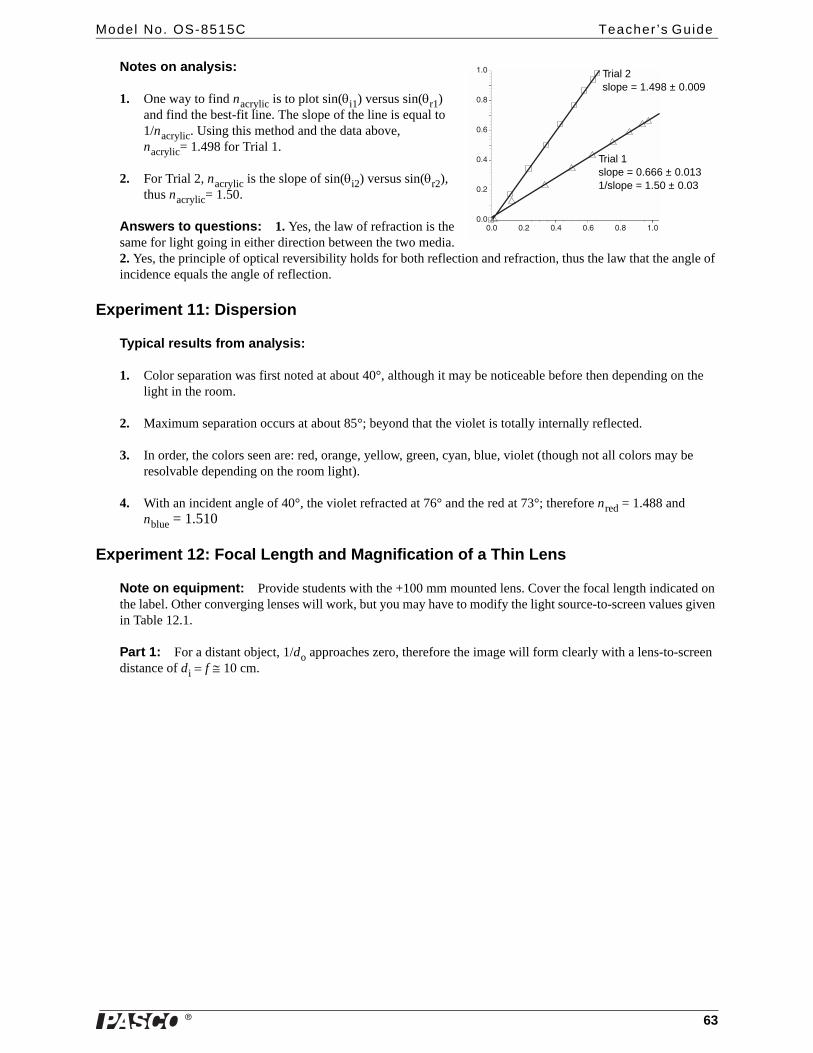
�
Model No. OS-8515C Teacher ’s Guide
63
Notes on analysis:
1. One way to find nacrylic is to plot sin(θi1) versus sin(θr1) and find the best-fit line. The slope of the line is equal to 1/nacrylic. Using this method and the data above, nacrylic= 1.498 for Trial 1.
2. For Trial 2, nacrylic is the slope of sin(θi2) versus sin(θr2), thus nacrylic= 1.50.
Answers to questions: 1. Yes, the law of refraction is the same for light going in either direction between the two media. 2. Yes, the principle of optical reversibility holds for both reflection and refraction, thus the law that the angle of incidence equals the angle of reflection.
Experiment 11: Dispersion
Typical results from analysis:
1. Color separation was first noted at about 40°, although it may be noticeable before then depending on the light in the room.
2. Maximum separation occurs at about 85°; beyond that the violet is totally internally reflected.
3. In order, the colors seen are: red, orange, yellow, green, cyan, blue, violet (though not all colors may be resolvable depending on the room light).
4. With an incident angle of 40°, the violet refracted at 76° and the red at 73°; therefore nred = 1.488 and nblue = 1.510
Experiment 12: Focal Length and Magnification of a Thin Lens
Note on equipment: Provide students with the +100 mm mounted lens. Cover the focal length indicated on the label. Other converging lenses will work, but you may have to modify the light source-to-screen values given in Table 12.1.
Part 1: For a distant object, 1/do approaches zero, therefore the image will form clearly with a lens-to-screen distance of di = f ≅ 10 cm.
�>� �>� �> �>� �>� �>��>�
�>�
�>
�>�
�>�
�>� Trial 2slope = 1.498 ± 0.009
Trial 1slope = 0.666 ± 0.0131/slope = 1.50 ± 0.03
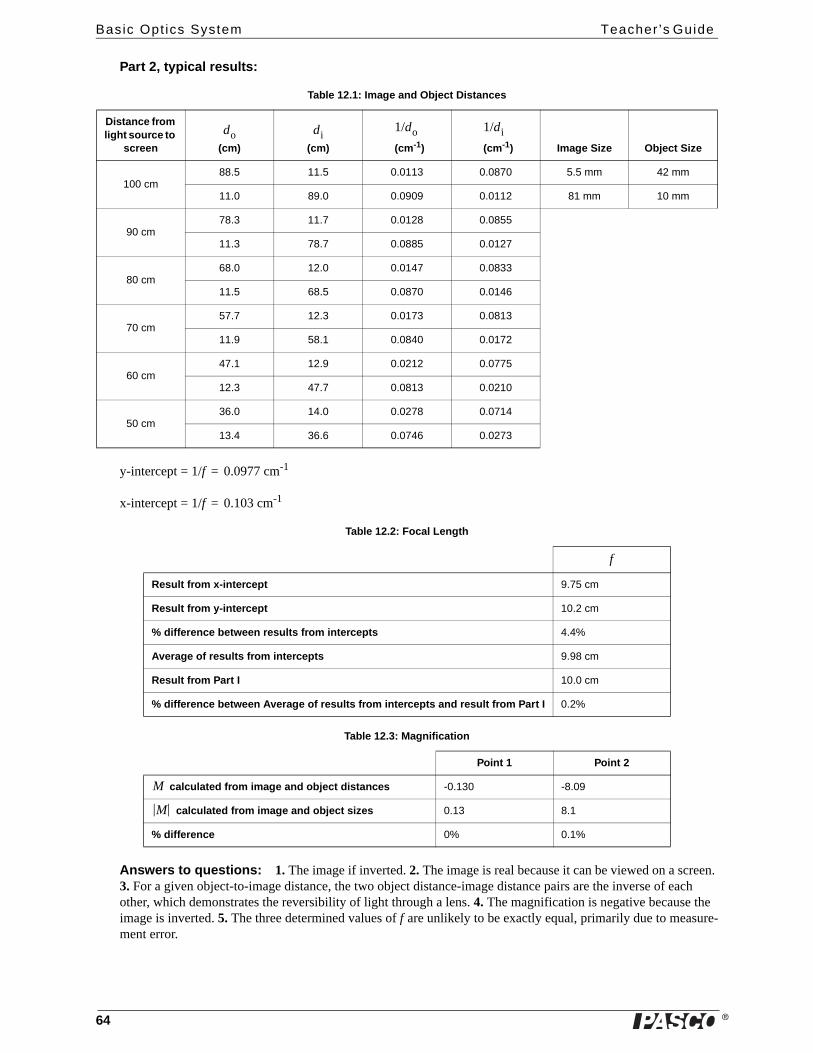
�
Basic Opt ics System Teacher ’s Guide
64
Part 2, typical results:
y-intercept = 1/f = 0.0977 cm-1
x-intercept = 1/f = 0.103 cm-1
Answers to questions: 1. The image if inverted. 2. The image is real because it can be viewed on a screen. 3. For a given object-to-image distance, the two object distance-image distance pairs are the inverse of each other, which demonstrates the reversibility of light through a lens. 4. The magnification is negative because the image is inverted. 5. The three determined values of f are unlikely to be exactly equal, primarily due to measure-ment error.
Table 12.1: Image and Object Distances
Distance from light source to
screen
do(cm)
di(cm)
1/do (cm-1)
1/di (cm-1) Image Size Object Size
100 cm88.5 11.5 0.0113 0.0870 5.5 mm 42 mm
11.0 89.0 0.0909 0.0112 81 mm 10 mm
90 cm78.3 11.7 0.0128 0.0855
11.3 78.7 0.0885 0.0127
80 cm68.0 12.0 0.0147 0.0833
11.5 68.5 0.0870 0.0146
70 cm57.7 12.3 0.0173 0.0813
11.9 58.1 0.0840 0.0172
60 cm47.1 12.9 0.0212 0.0775
12.3 47.7 0.0813 0.0210
50 cm36.0 14.0 0.0278 0.0714
13.4 36.6 0.0746 0.0273
Table 12.2: Focal Length
f
Result from x-intercept 9.75 cm
Result from y-intercept 10.2 cm
% difference between results from intercepts 4.4%
Average of results from intercepts 9.98 cm
Result from Part I 10.0 cm
% difference between Average of results from intercepts and result from Part I 0.2%
Table 12.3: Magnification
Point 1 Point 2
calculated from image and object distances -0.130 -8.09
calculated from image and object sizes 0.13 8.1
% difference 0% 0.1%
M
M
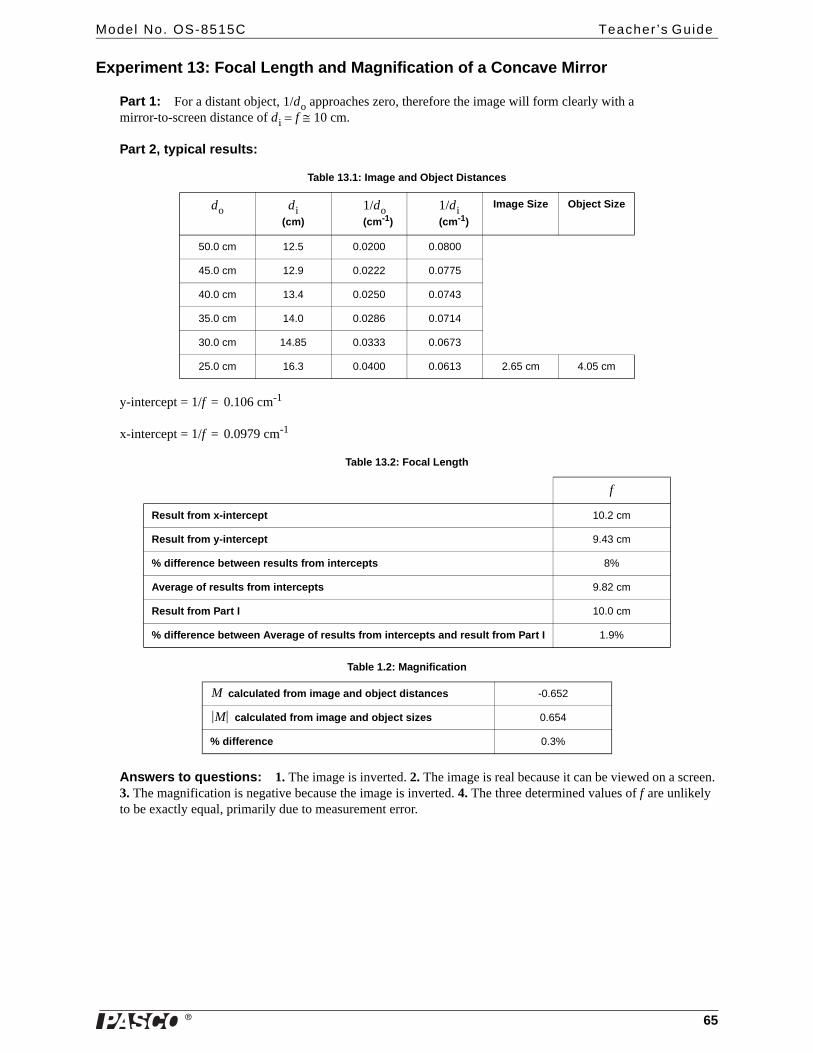
�
Model No. OS-8515C Teacher ’s Guide
65
Experiment 13: Focal Length and Magnification of a Concave Mirror
Part 1: For a distant object, 1/do approaches zero, therefore the image will form clearly with a mirror-to-screen distance of di = f ≅ 10 cm.
Part 2, typical results:
y-intercept = 1/f = 0.106 cm-1
x-intercept = 1/f = 0.0979 cm-1
Answers to questions: 1. The image is inverted. 2. The image is real because it can be viewed on a screen. 3. The magnification is negative because the image is inverted. 4. The three determined values of f are unlikely to be exactly equal, primarily due to measurement error.
Table 13.1: Image and Object Distances
do di(cm)
1/do(cm-1)
1/di(cm-1)
Image Size Object Size
50.0 cm 12.5 0.0200 0.0800
45.0 cm 12.9 0.0222 0.0775
40.0 cm 13.4 0.0250 0.0743
35.0 cm 14.0 0.0286 0.0714
30.0 cm 14.85 0.0333 0.0673
25.0 cm 16.3 0.0400 0.0613 2.65 cm 4.05 cm
Table 13.2: Focal Length
f
Result from x-intercept 10.2 cm
Result from y-intercept 9.43 cm
% difference between results from intercepts 8%
Average of results from intercepts 9.82 cm
Result from Part I 10.0 cm
% difference between Average of results from intercepts and result from Part I 1.9%
Table 1.2: Magnification
calculated from image and object distances -0.652
calculated from image and object sizes 0.654
% difference 0.3%
M
M
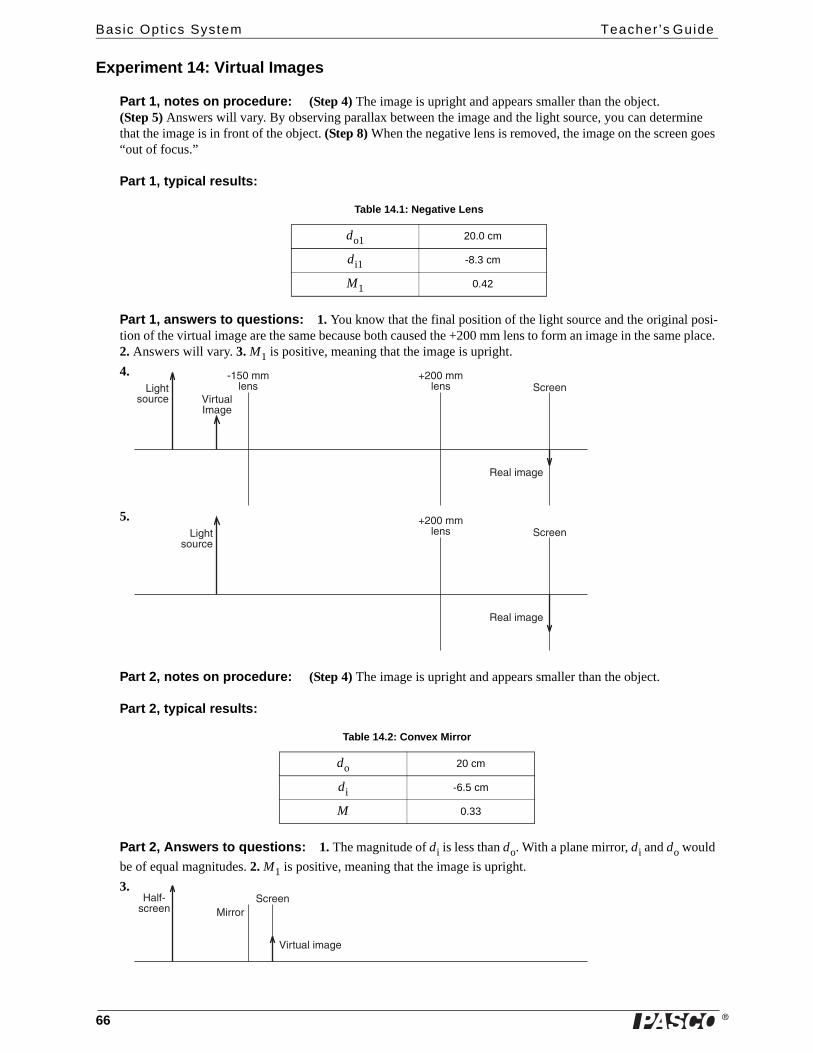
�
Basic Opt ics System Teacher ’s Guide
66
Experiment 14: Virtual Images
Part 1, notes on procedure: (Step 4) The image is upright and appears smaller than the object. (Step 5) Answers will vary. By observing parallax between the image and the light source, you can determine that the image is in front of the object. (Step 8) When the negative lens is removed, the image on the screen goes “out of focus.”
Part 1, typical results:
Part 1, answers to questions: 1. You know that the final position of the light source and the original posi-tion of the virtual image are the same because both caused the +200 mm lens to form an image in the same place. 2. Answers will vary. 3. M1 is positive, meaning that the image is upright. 4.
5.
Part 2, notes on procedure: (Step 4) The image is upright and appears smaller than the object.
Part 2, typical results:
Part 2, Answers to questions: 1. The magnitude of di is less than do. With a plane mirror, di and do would be of equal magnitudes. 2. M1 is positive, meaning that the image is upright. 3.
Table 14.1: Negative Lens
do1 20.0 cm
di1 -8.3 cm
M1 0.42
Table 14.2: Convex Mirror
do 20 cm
di -6.5 cm
M 0.33
��&(��#$���
�� !��� &�
�����%1������
!�%�/���$ !8� &�
�������!�%�
�� !��� &�
�����%1������
!�%���&(��#$���
. !"������%
/���$ !��� &�
�����%����#�
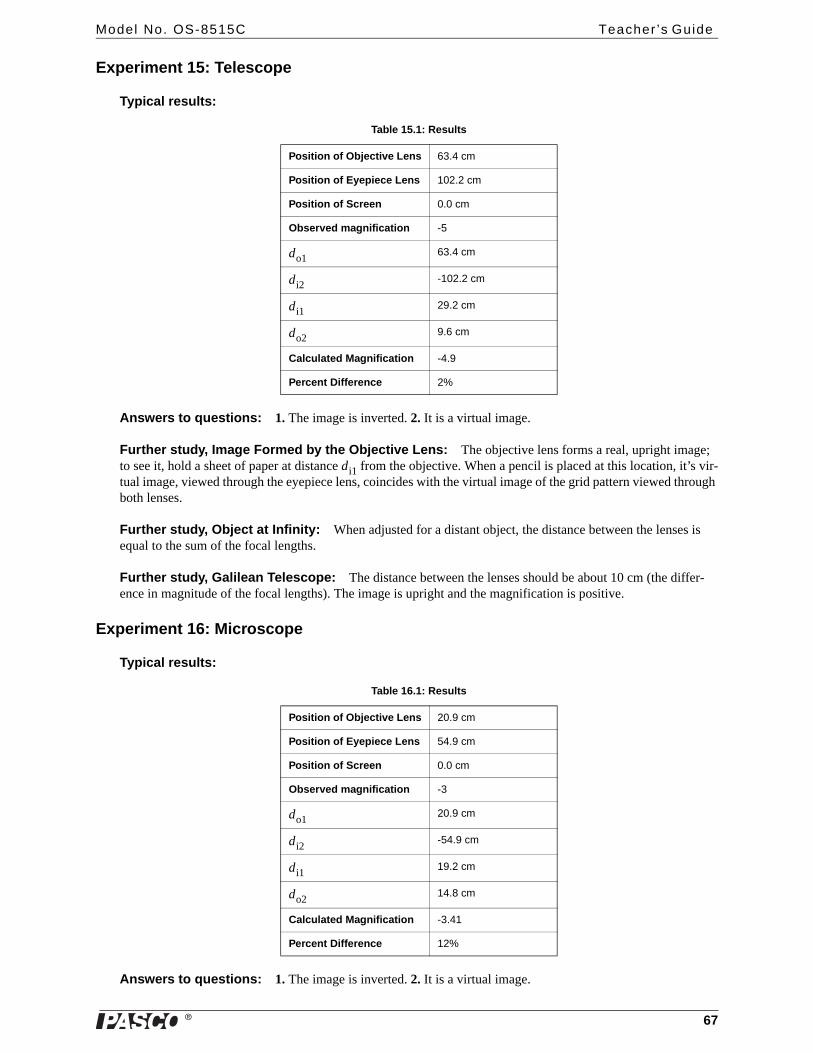
�
Model No. OS-8515C Teacher ’s Guide
67
Experiment 15: Telescope
Typical results:
Answers to questions: 1. The image is inverted. 2. It is a virtual image.
Further study, Image Formed by the Objective Lens: The objective lens forms a real, upright image; to see it, hold a sheet of paper at distance di1 from the objective. When a pencil is placed at this location, it’s vir-tual image, viewed through the eyepiece lens, coincides with the virtual image of the grid pattern viewed through both lenses.
Further study, Object at Infinity: When adjusted for a distant object, the distance between the lenses is equal to the sum of the focal lengths.
Further study, Galilean Telescope: The distance between the lenses should be about 10 cm (the differ-ence in magnitude of the focal lengths). The image is upright and the magnification is positive.
Experiment 16: Microscope
Typical results:
Answers to questions: 1. The image is inverted. 2. It is a virtual image.
Table 15.1: Results
Position of Objective Lens 63.4 cm
Position of Eyepiece Lens 102.2 cm
Position of Screen 0.0 cm
Observed magnification -5
do1 63.4 cm
di2 -102.2 cm
di1 29.2 cm
do2 9.6 cm
Calculated Magnification -4.9
Percent Difference 2%
Table 16.1: Results
Position of Objective Lens 20.9 cm
Position of Eyepiece Lens 54.9 cm
Position of Screen 0.0 cm
Observed magnification -3
do1 20.9 cm
di2 -54.9 cm
di1 19.2 cm
do2 14.8 cm
Calculated Magnification -3.41
Percent Difference 12%
�
Basic Opt ics System Teacher ’s Guide
68
Further study, Image Formed by the Objective Lens: The objective lens forms a real, upright image; to see it, hold a sheet of paper at distance di1 from the objective. When a pencil is placed at this location, it’s vir-tual image, viewed through the eyepiece lens, coincides with the virtual image of the grid pattern viewed through both lenses.
Further study, Increasing Magnification: As the objective lens is moved closer to the object, the eye-piece must be moved further away. In practice, the objective can be moved to within about 13 cm before distor-tion from lens aberrations becomes significant. The theoretical limit is 10 cm, or the focal length of the objective lens.
Experiment 17: Shadows
When the pencil is illuminated by the point source, the shadow appears sharper than when illuminated by a dis-tributed light source (the crossed-arrow object). When illuminated by both point sources, the pencil casts two shadows. The area where the shadows overlap is the umbra. The areas of partial shadow are the penumbra. By moving the pencil toward the screen, the relative size of the umbra is increased. By moving the pencil away from the screen, the umbra is decreased until the two shadow separate entirely.
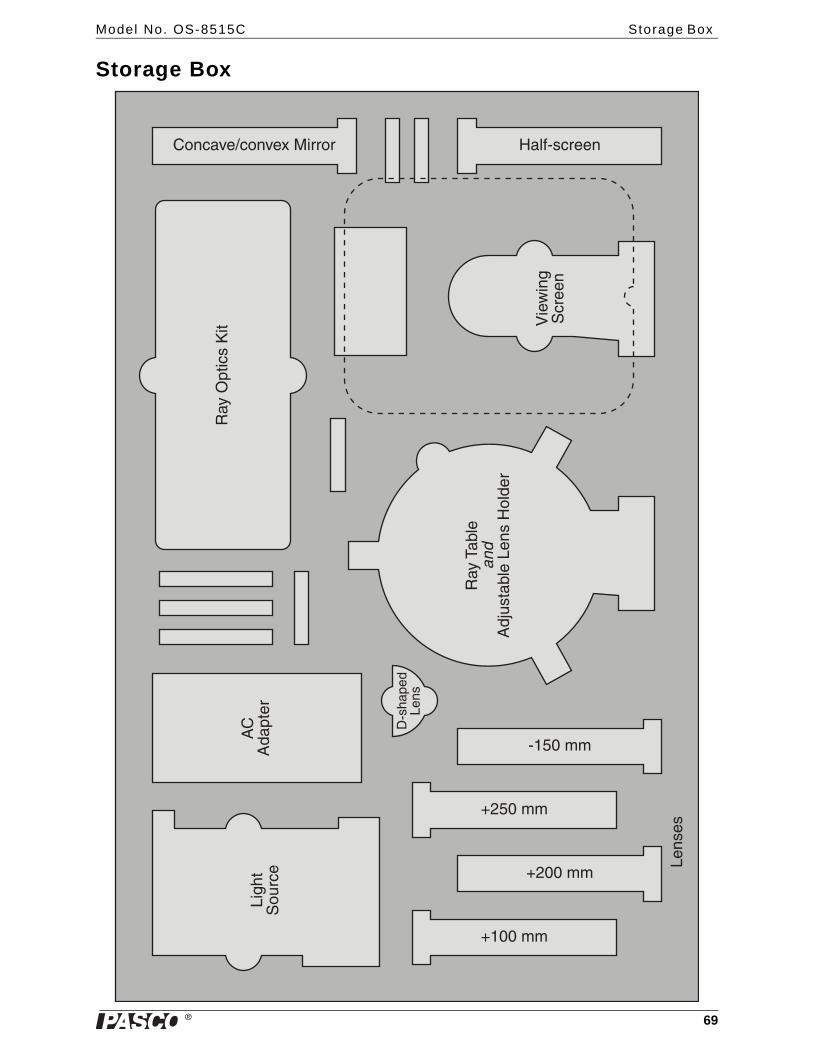
�
Model No. OS-8515C Storage Box
69
Storage Box
��&(�
�#$���
��
�) '���
� *� '�����+��
� *�� ,!�
���
�)-$�� ,!����%��.#!)��
/��0�%&
�����%
��%���
1������
1������
1������
�������
2��(
'�)
��%�
. !"������%�#%� 3�4�#%3�5�����#�

�
Basic Opt ics System Storage Box
70
�
Model No. OS-8515C Technical Support
71
Technical Support
For assistance with any PASCO product, contact PASCO at:
Limited WarrantyFor a description of the product warranty, see the PASCO catalog.
CopyrightThe PASCO scientific 012-09900B Basic Optics System Instruction Manual is copyrighted with all rights reserved. Permission is granted to non-profit educational institutions for reproduction of any part of this manual, providing the reproductions are used only in their laboratories and classrooms, and are not sold for profit. Reproduction under any other circumstances, without the written con-sent of PASCO scientific, is prohibited.
TrademarksPASCO and PASCO scientific are trademarks or registered trademarks of PASCO scientific, in the United States and/or in other coun-tries. All other brands, products, or service names are or may be trademarks or service marks of, and are used to identify, products or services of, their respective owners. For more information visit www.pasco.com/legal.
Address: PASCO scientific10101 Foothills Blvd.Roseville, CA 95747-7100
Phone: 916-786-3800 (worldwide)800-772-8700 (U.S.)
Fax: (916) 786-7565Web: www.pasco.comEmail: [email protected]
Authors: Alec OgstonAnn HanksDave Griffith