Embed Size (px)
Citation preview
1
Basics of Radio
Astronomy
Tom Wilson
NRL
NRAO Synthesis Workshop 2014
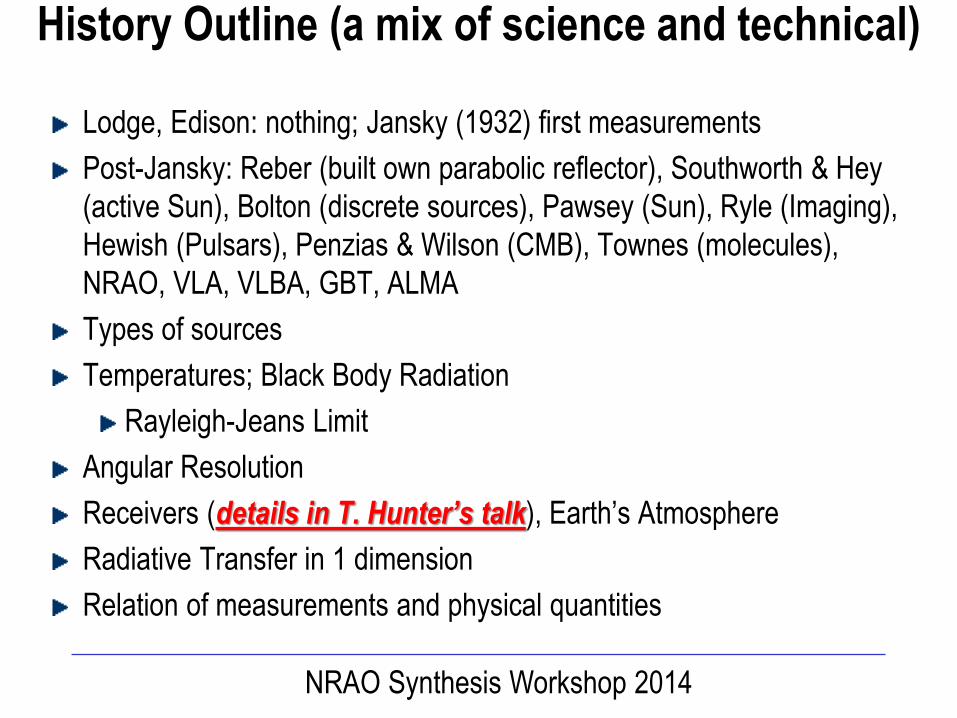
History Outline (a mix of science and technical)
Lodge, Edison: nothing; Jansky (1932) first measurements
Post-Jansky: Reber (built own parabolic reflector), Southworth & Hey
(active Sun), Bolton (discrete sources), Pawsey (Sun), Ryle (Imaging),
Hewish (Pulsars), Penzias & Wilson (CMB), Townes (molecules),
NRAO, VLA, VLBA, GBT, ALMA
Types of sources
Temperatures; Black Body Radiation
Rayleigh-Jeans Limit
Angular Resolution
Receivers (details in T. Hunter’s talk), Earth’s Atmosphere
Radiative Transfer in 1 dimension
Relation of measurements and physical quantities
NRAO Synthesis Workshop 2014
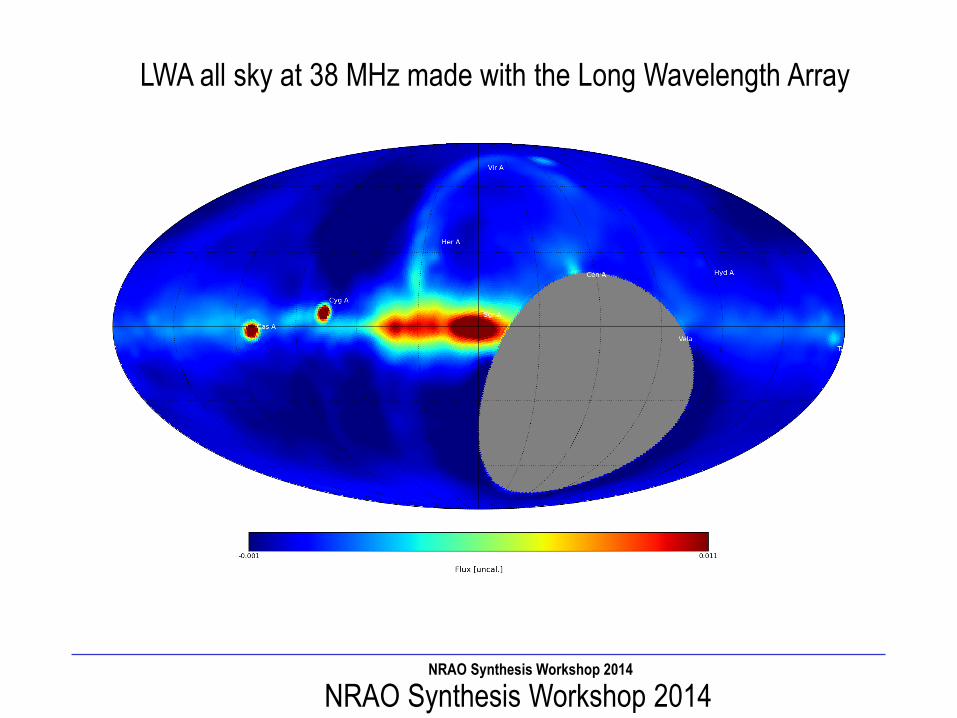
LWA Image of the Sky
LWA all sky at 38 MHz made with the Long Wavelength Array
NRAO Synthesis Workshop 2014
NRAO Synthesis Workshop 2014
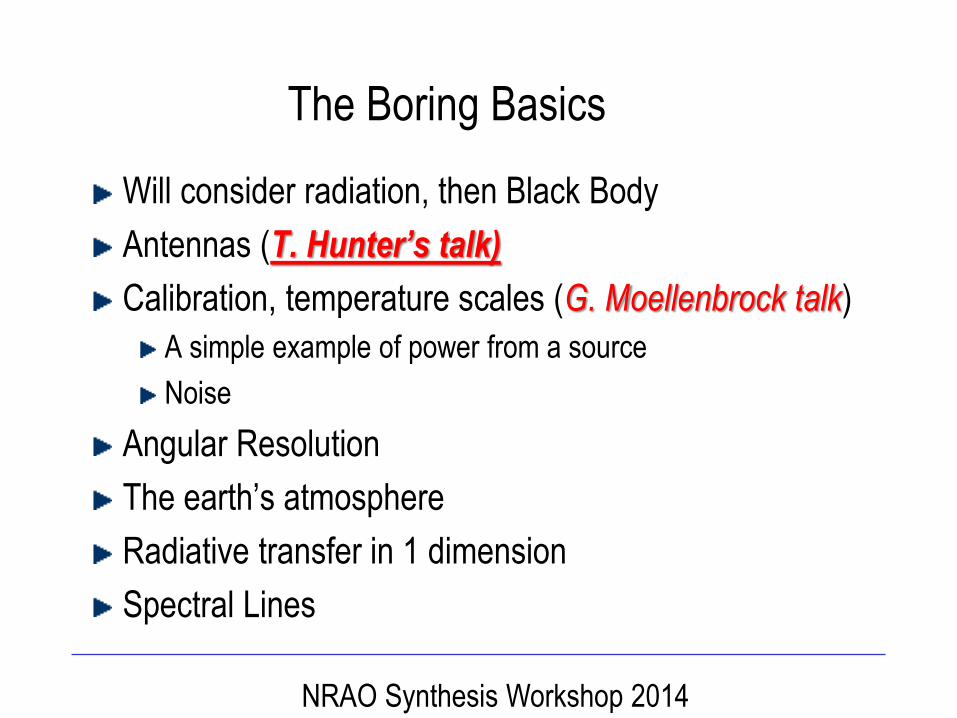
The Boring Basics
Will consider radiation, then Black Body
Antennas (T. Hunter’s talk)
Calibration, temperature scales (G. Moellenbrock talk)
A simple example of power from a source
Noise
Angular Resolution
The earth’s atmosphere
Radiative transfer in 1 dimension
Spectral Lines
NRAO Synthesis Workshop 2014
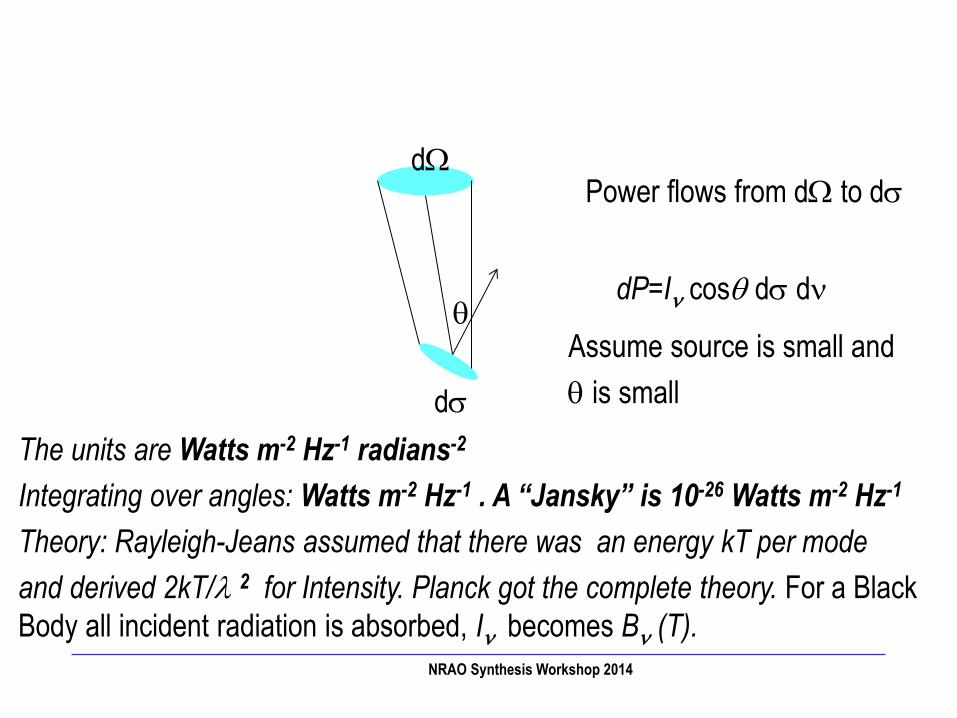
q
ds
dW
dP=In cosq ds dn
Power flows from dW to ds
Assume source is small and
q is small
The units are Watts m-2 Hz-1 radians-2
Integrating over angles: Watts m-2 Hz-1 . A “Jansky” is 10-26 Watts m-2 Hz-1
Theory: Rayleigh-Jeans assumed that there was an energy kT per mode
and derived 2kT/l 2 for Intensity. Planck got the complete theory. For a Black
Body all incident radiation is absorbed, In becomes Bn (T).
NRAO Synthesis Workshop 2014
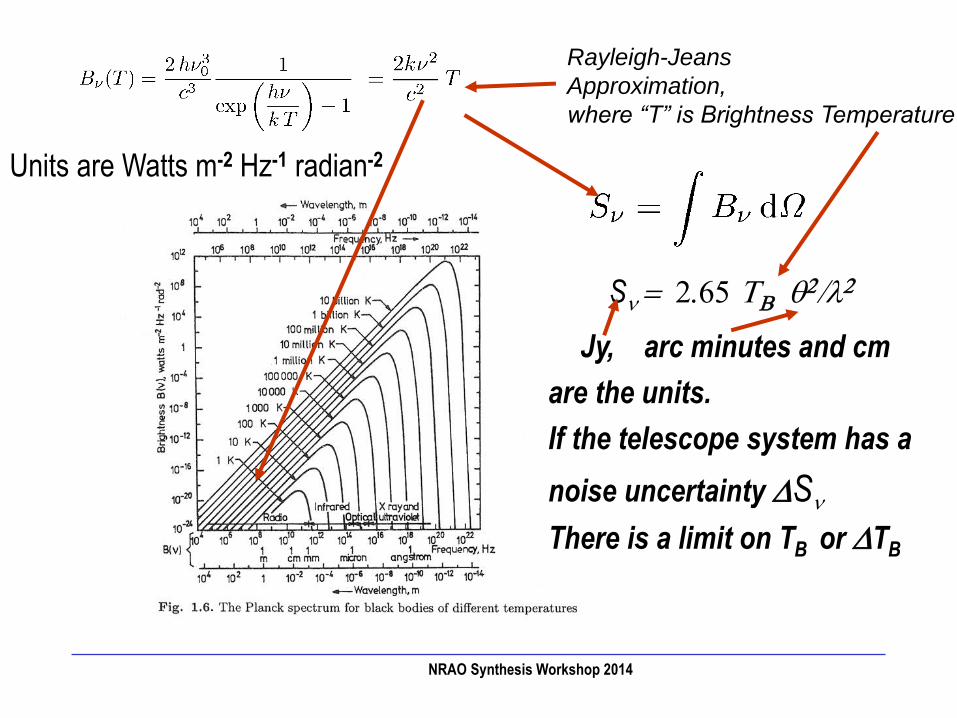
Rayleigh-Jeans
Approximation,
where “T” is Brightness Temperature
Sn = 2.65 TB q2/l2
Units are Watts m-2 Hz-1 radian-2
Jy, arc minutes and cm
are the units.
If the telescope system has a
noise uncertainty DSn
There is a limit on TB or DTB
NRAO Synthesis Workshop 2014
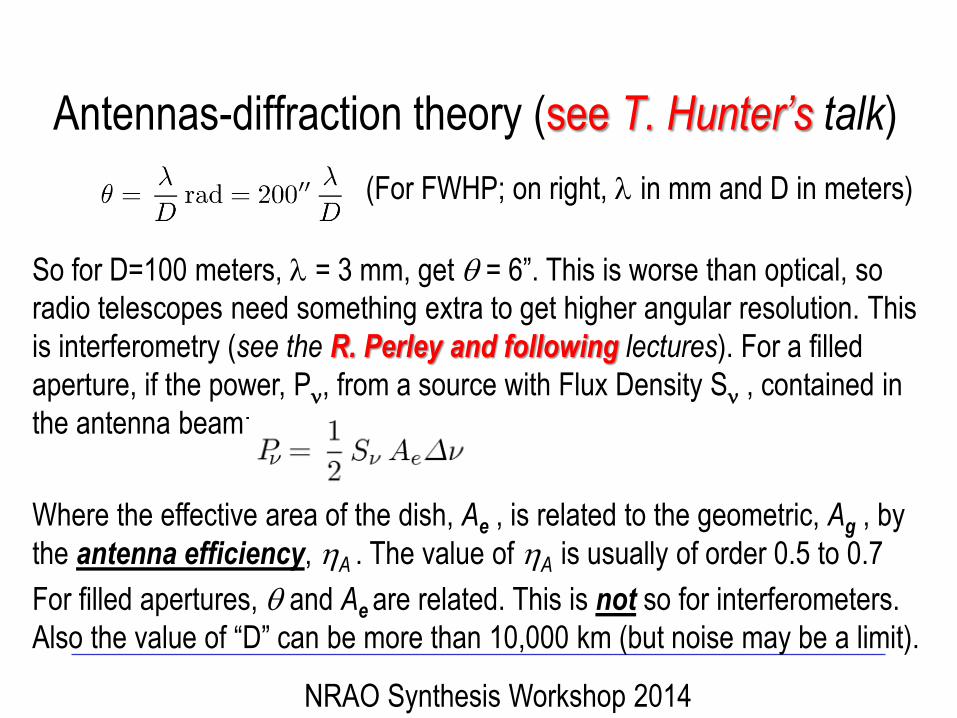
Antennas-diffraction theory (see T. Hunter’s talk)
(For FWHP; on right, l in mm and D in meters)
So for D=100 meters, l = 3 mm, get q = 6”. This is worse than optical, so
radio telescopes need something extra to get higher angular resolution. This
is interferometry (see the R. Perley and following lectures). For a filled
aperture, if the power, Pn, from a source with Flux Density Sn , contained in
the antenna beam:
Where the effective area of the dish, Ae , is related to the geometric, Ag , by
the antenna efficiency, hA . The value of hA is usually of order 0.5 to 0.7
For filled apertures, q and Ae are related. This is not so for interferometers.
Also the value of “D” can be more than 10,000 km (but noise may be a limit).
NRAO Synthesis Workshop 2014
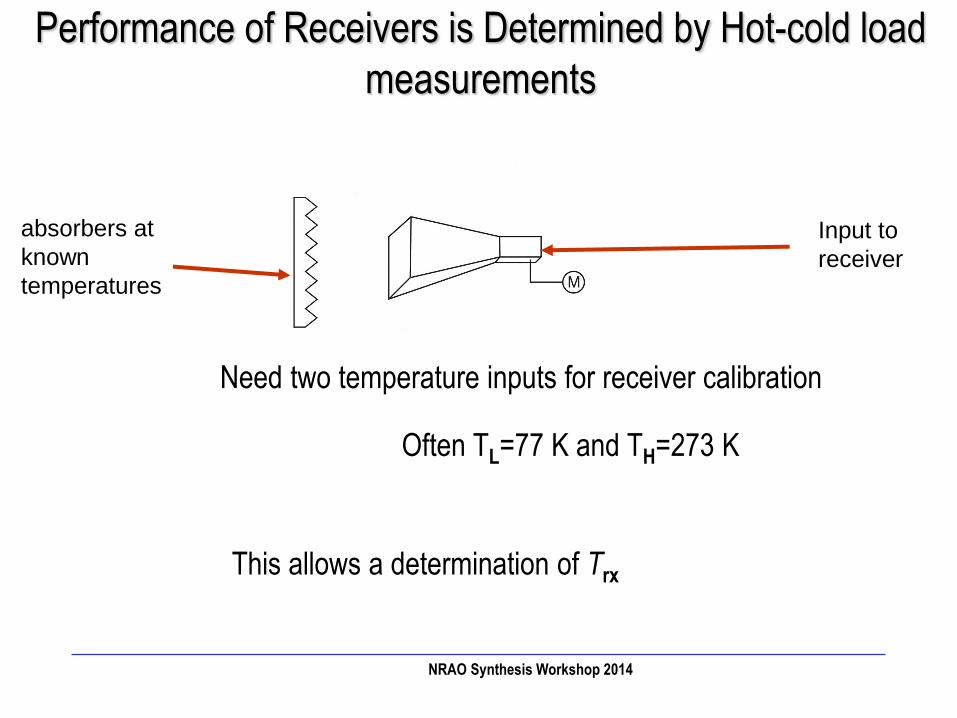
Performance of Receivers is Determined by Hot-cold load
measurements
absorbers at
known
temperatures
Input to
receiver
Need two temperature inputs for receiver calibration
Often TL=77 K and TH=273 K
This allows a determination of Trx
NRAO Synthesis Workshop 2014
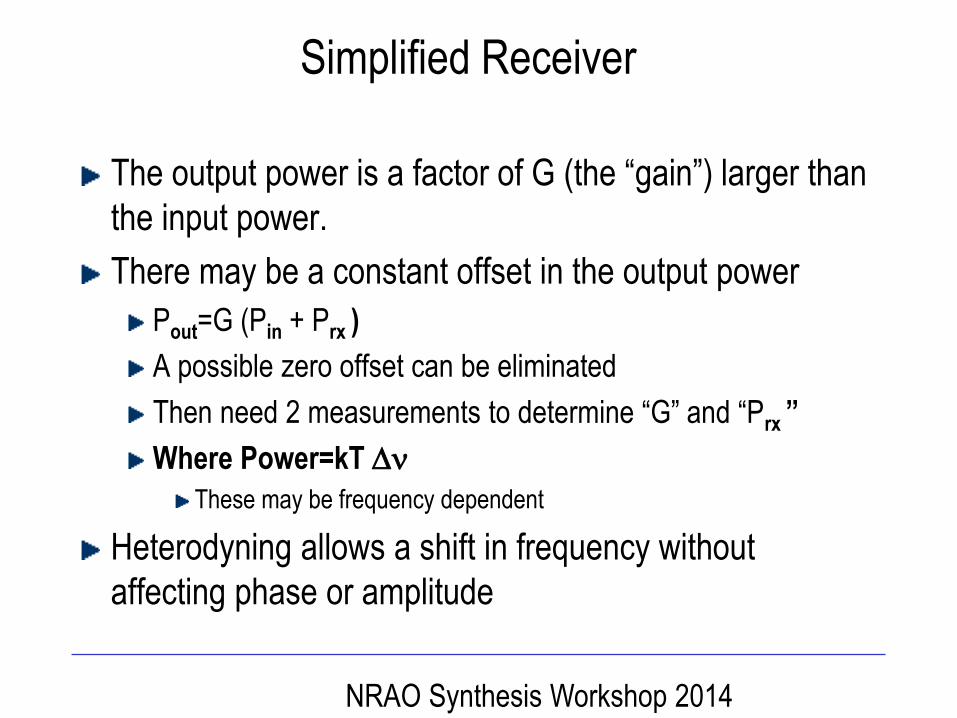
Simplified Receiver
The output power is a factor of G (the “gain”) larger than
the input power.
There may be a constant offset in the output power
Pout=G (Pin + Prx )
A possible zero offset can be eliminated
Then need 2 measurements to determine “G” and “Prx ”
Where Power=kT Dn
These may be frequency dependent
Heterodyning allows a shift in frequency without
affecting phase or amplitude
NRAO Synthesis Workshop 2014
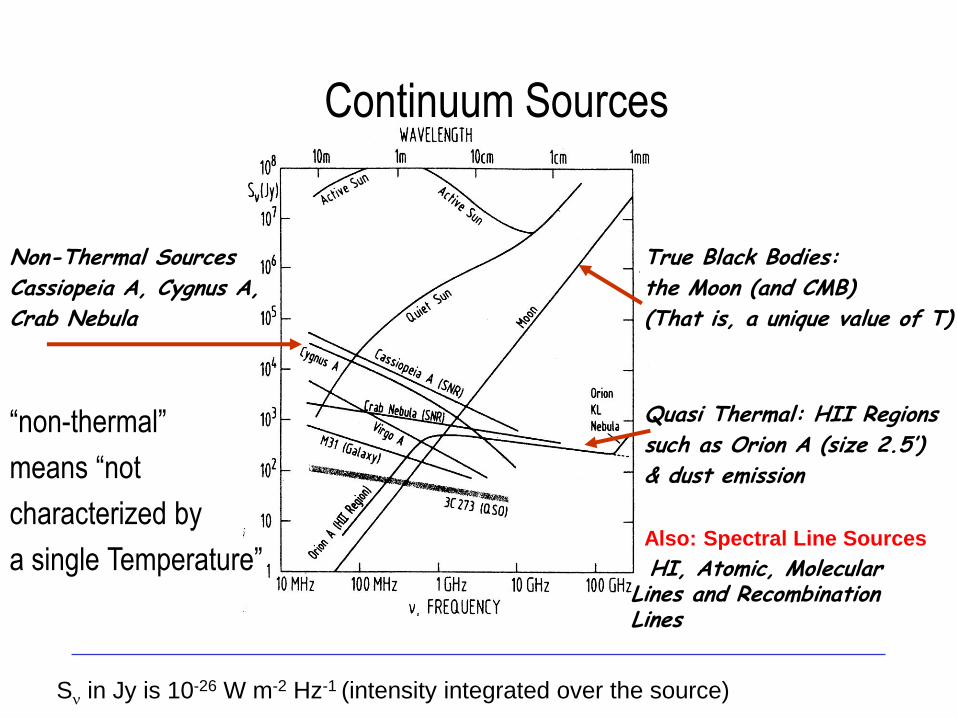
Continuum Sources
Sn in Jy is 10-26 W m-2 Hz-1 (intensity integrated over the source)
Non-Thermal Sources
Cassiopeia A, Cygnus A,
Crab Nebula
Quasi Thermal: HII Regions
such as Orion A (size 2.5’)
& dust emission
True Black Bodies:
the Moon (and CMB)
(That is, a unique value of T)
Also: Spectral Line Sources
HI, Atomic, Molecular Lines and Recombination Lines
“non-thermal”
means “not
characterized by
a single Temperature”
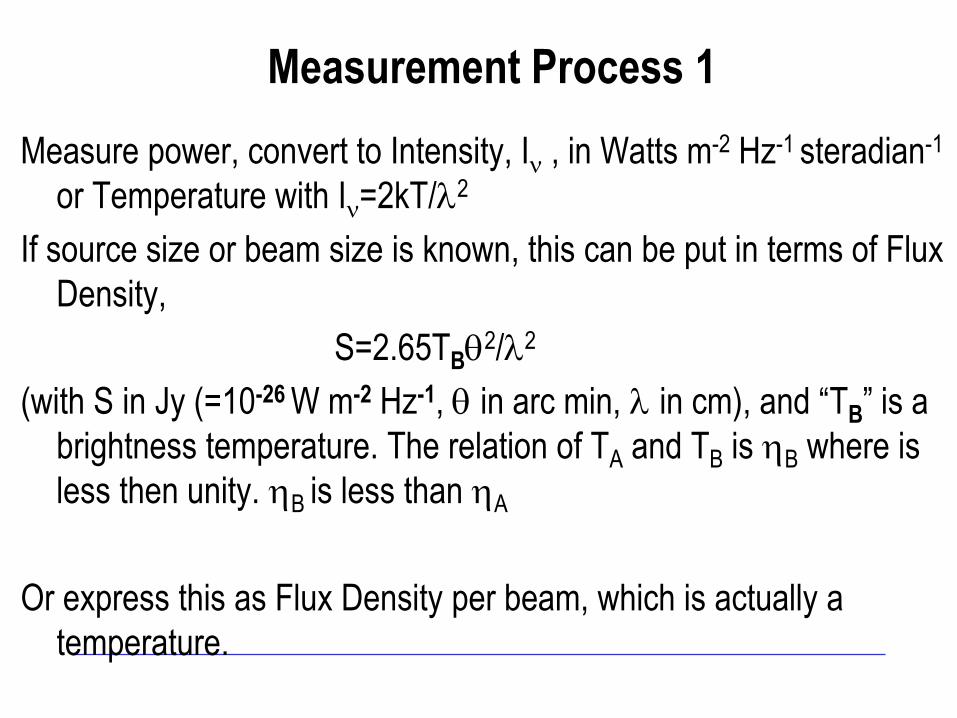
Measurement Process 1
Measure power, convert to Intensity, In , in Watts m-2 Hz-1 steradian-1
or Temperature with In=2kT/l2
If source size or beam size is known, this can be put in terms of Flux
Density,
S=2.65TBq2/l2
(with S in Jy (=10-26 W m-2 Hz-1, q in arc min, l in cm), and “TB” is a
brightness temperature. The relation of TA and TB is hB where is
less then unity. hB is less than hA
Or express this as Flux Density per beam, which is actually a
temperature.
Measurement Process 2
Temperatures are an issue. “Brightness Temperature”,
TB is obtained from Flux Density, l and q. “Antenna
Temperature”, TA is the power delivered by a heated
absorber at the input of the receiver. TA< TB always!
Usually the measurements are based on comparisons
with nearby sources or with internal thermal sources,
that is, “cold loads”
Absolute measurements are rare (but are done)
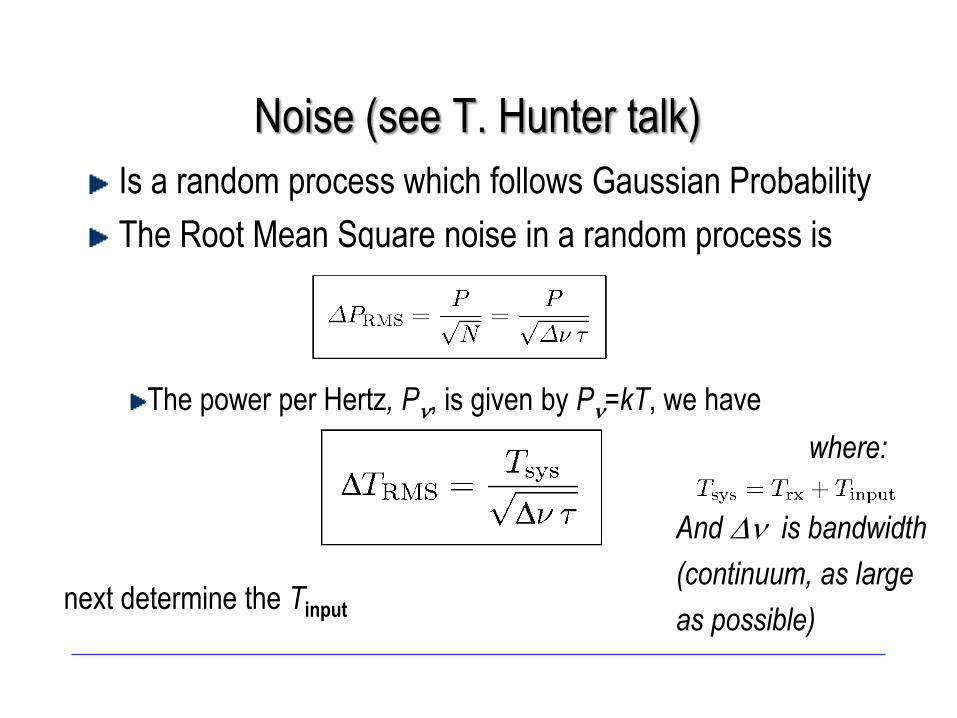
Noise (see T. Hunter talk)
Is a random process which follows Gaussian Probability
The Root Mean Square noise in a random process is
The power per Hertz, Pn, is given by Pn=kT, we have
where:
next determine the Tinput
And Dn is bandwidth
(continuum, as large
as possible)
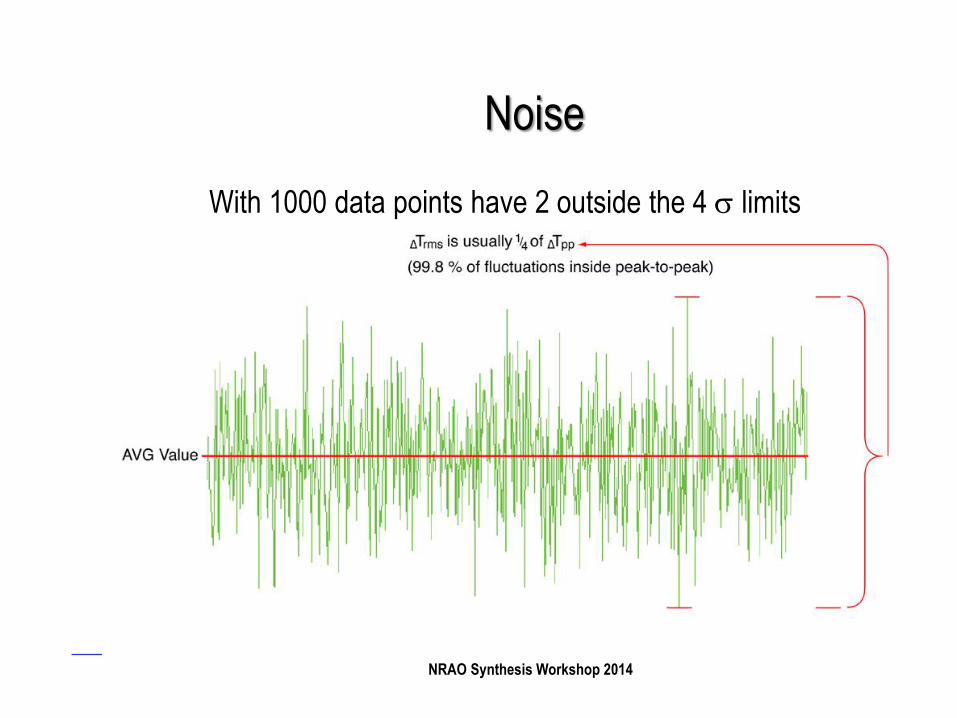
Noise
With 1000 data points have 2 outside the 4 s limits
NRAO Synthesis Workshop 2014
Power, Flux Density and Signal-to-Noise
Example: Orion A at 23 GHz (=1.3 cm) has a size of
2.5’, a flux density of 400 Jy. The peak continuum
temperature from the Rayleigh-Jeans relation is 40K.
The antenna temperature is about 25K.
The receiver noise temperature is 20K + 25K. So the
Noise for a bandwidth Dn=1 GHz in 1 second is
0.0014K.
The Signal-to-RMS-Noise is 3 104
A 1 milli Watt Transmitter at Geo
Distance=40,000 km
Transmit a power of 1 mW as a 1 Hz wide signal in all
directions
On earth, this gives a Flux Density of 5 106 Jy
What is the effective temperature? (Pn=kT Dn)
Such beacons are often used for Holographic measurements
of radio telescope surface accuracies (see T. Hunter talk).
Also used at the VLA for phase monitoring.
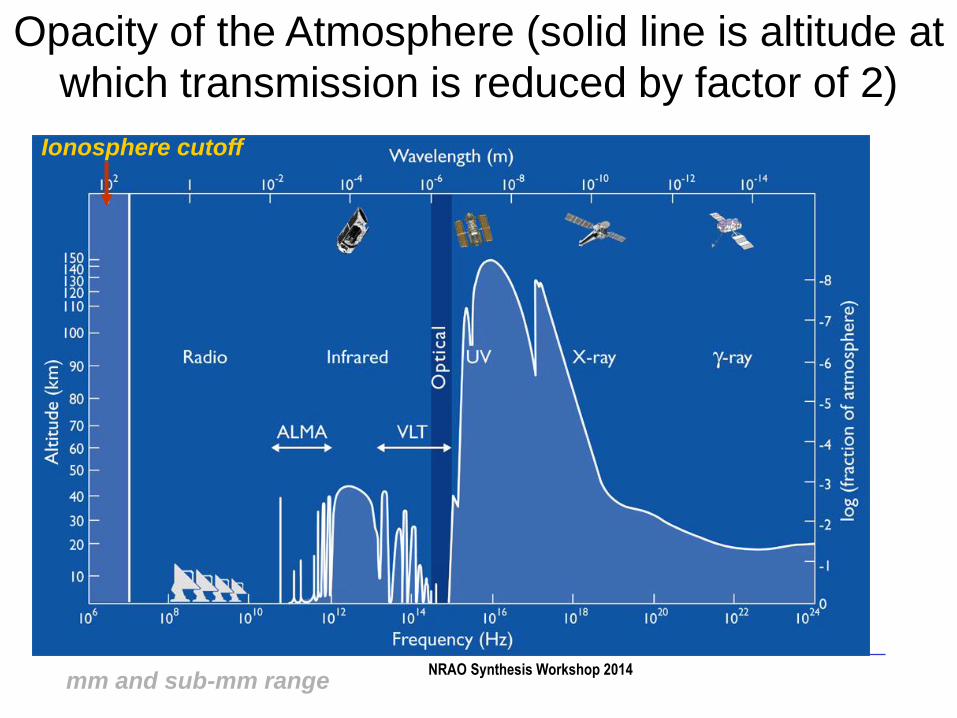
Opacity of the Atmosphere (solid line is altitude at
which transmission is reduced by factor of 2)
Ionosphere cutoff
mm and sub-mm range
NRAO Synthesis Workshop 2014
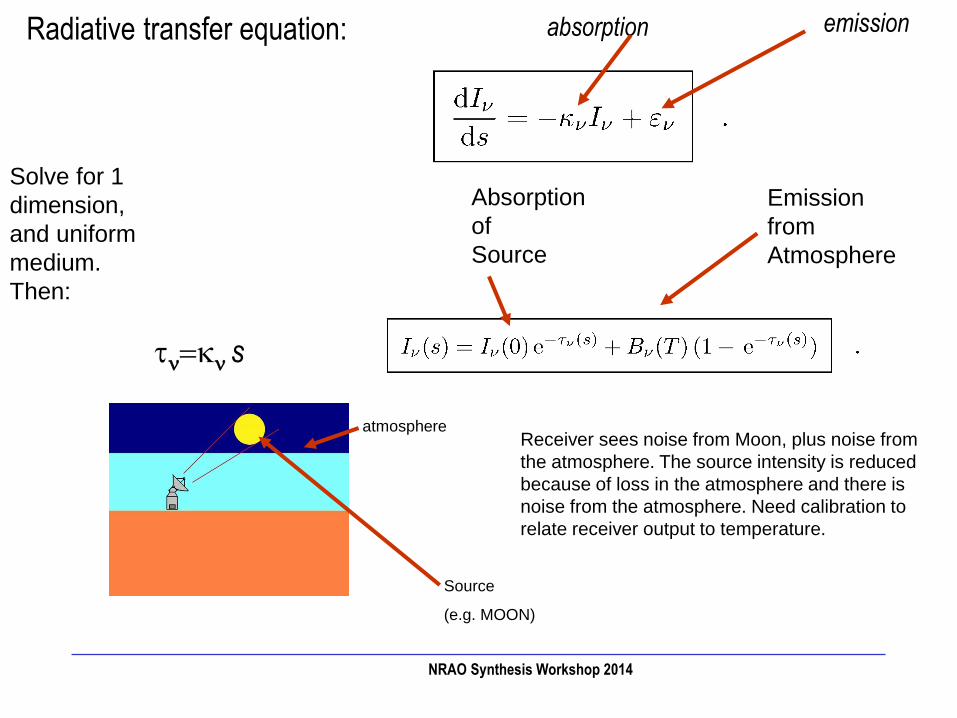
Solve for 1
dimension,
and uniform
medium.
Then:
atmosphere
Source
(e.g. MOON)
Receiver sees noise from Moon, plus noise from
the atmosphere. The source intensity is reduced
because of loss in the atmosphere and there is
noise from the atmosphere. Need calibration to
relate receiver output to temperature.
Emission
from
Atmosphere
Absorption
of
Source
Radiative transfer equation: absorption emission
tn=kn s
NRAO Synthesis Workshop 2014
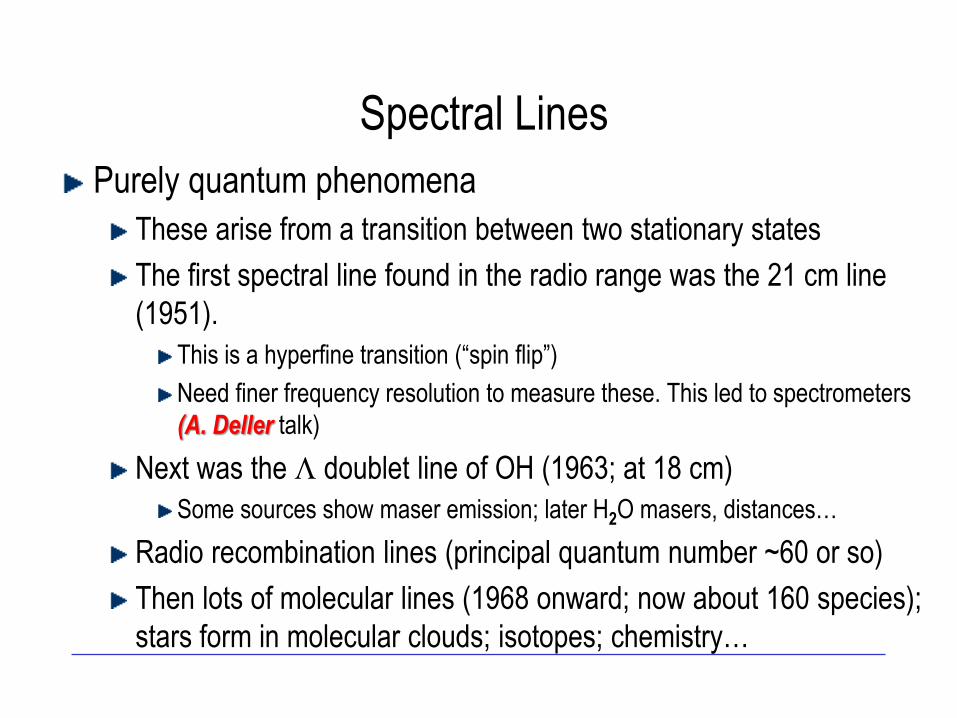
Spectral Lines
Purely quantum phenomena
These arise from a transition between two stationary states
The first spectral line found in the radio range was the 21 cm line
(1951).
This is a hyperfine transition (“spin flip”)
Need finer frequency resolution to measure these. This led to spectrometers
(A. Deller talk)
Next was the L doublet line of OH (1963; at 18 cm)
Some sources show maser emission; later H2O masers, distances…
Radio recombination lines (principal quantum number ~60 or so)
Then lots of molecular lines (1968 onward; now about 160 species);
stars form in molecular clouds; isotopes; chemistry…
Relating Intensities to Abundances
We measure a TMB but want an abundance. Need the properties of the species to be investigated. This is gotten from laboratory data.
For allowed rotational transitions, need permanent electric dipole moments. Such dipole moments can be obtained from semi-classical arguments
Measurements give the population in the two levels
Usually quote the population of a lower of the levels
This is a column density in cm-2
Need to determine the total population
Usually, the assumption is that the excitation is close to Local Thermodynamic Equilibrium (LTE)
Assumption that chemistry is understood
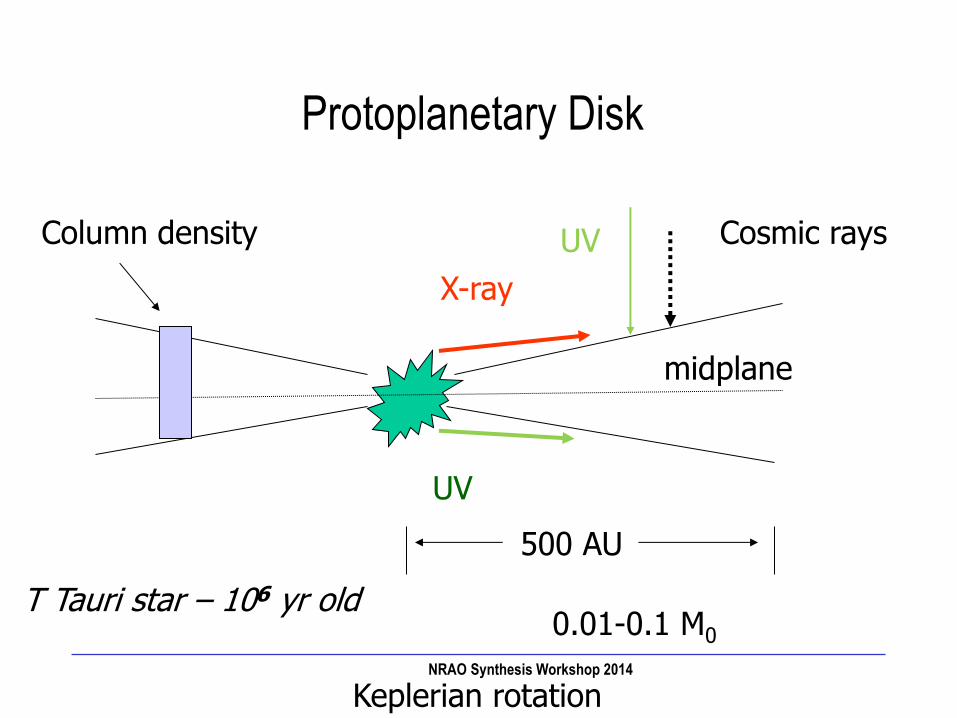
Protoplanetary Disk
0.01-0.1 M0
500 AU
Cosmic rays
X-ray
UV
Keplerian rotation
T Tauri star – 106 yr old
midplane
Column density UV
NRAO Synthesis Workshop 2014
Extragalactic Science
We live in the Milky Way, so difficult to understand
detailed structure
Other galaxies allow comparisons, but like comparing
Paris with NYC
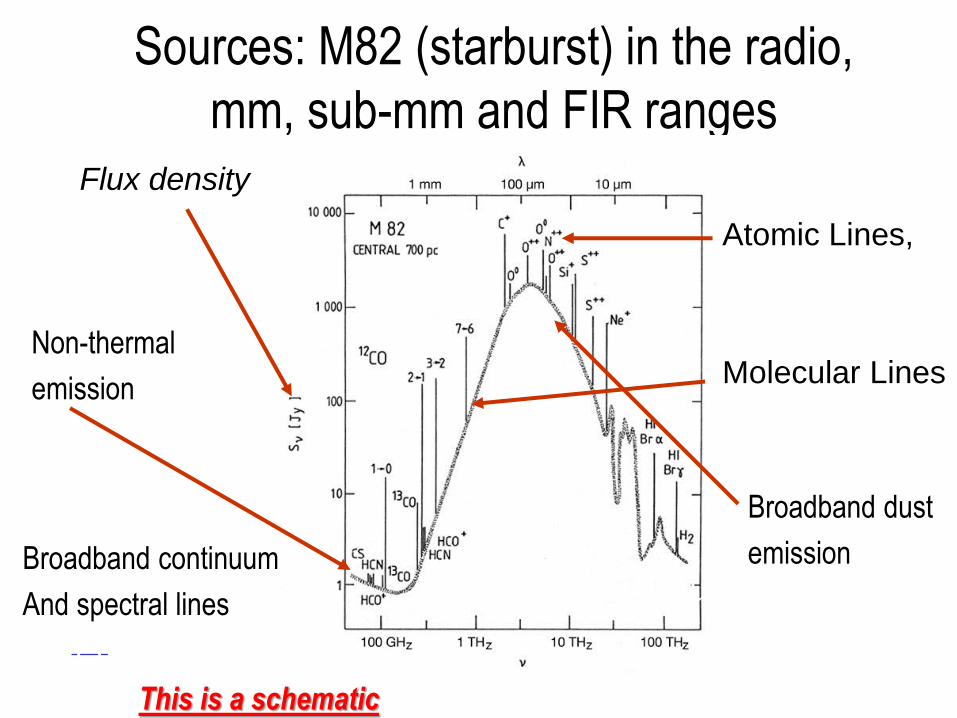
Sources: M82 (starburst) in the radio,
mm, sub-mm and FIR ranges
Dust continuum
Atomic Lines,
Molecular Lines
Non-therml
emissionFree-Free
(Bremsstrahlung)
& Synchrotron
Continuum
Emission
Flux density
Broadband dust
emission Broadband continuum
And spectral lines
Non-thermal
emission
This is a schematic
Concluding Remarks
Ground based radio astronomy now extends from 30
meters to 0.3 mm; from satellites to shorter wavelengths
The interpretation of the data are subject to a large
number of subtle effects that can be extremely
important. For molecules:
Excitation
Chemistry
Interpretations are the applications of rather complex theories
For continuum, dust properties. For non-thermal radiation, these
include magnetic field strength, Lorentz factor, lifetimes,
reacceleration, etc.
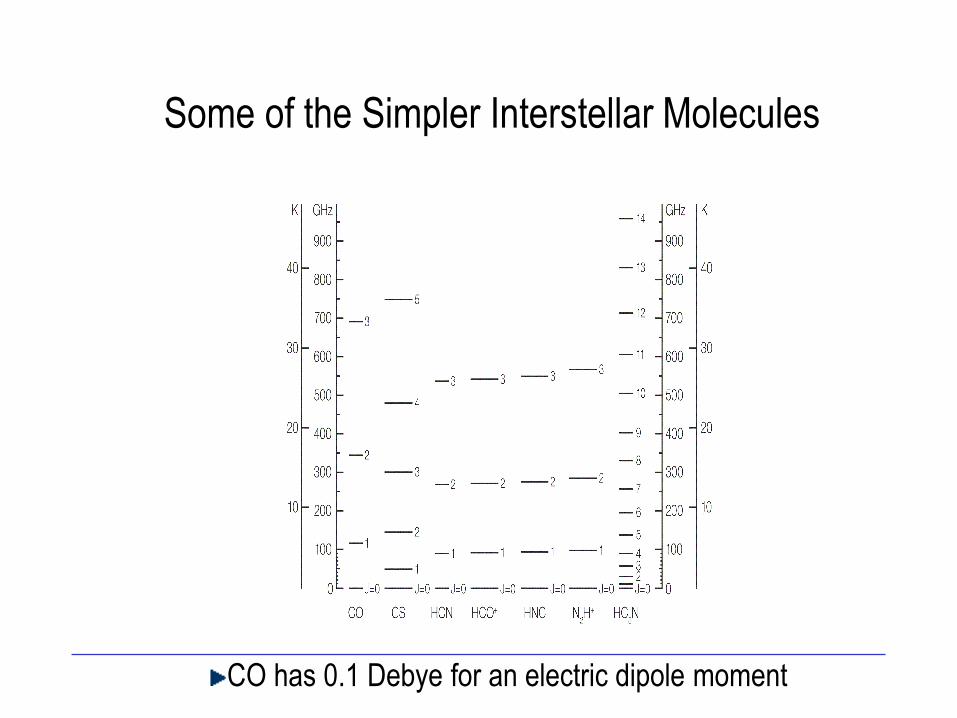
Some of the Simpler Interstellar Molecules
CO has 0.1 Debye for an electric dipole moment
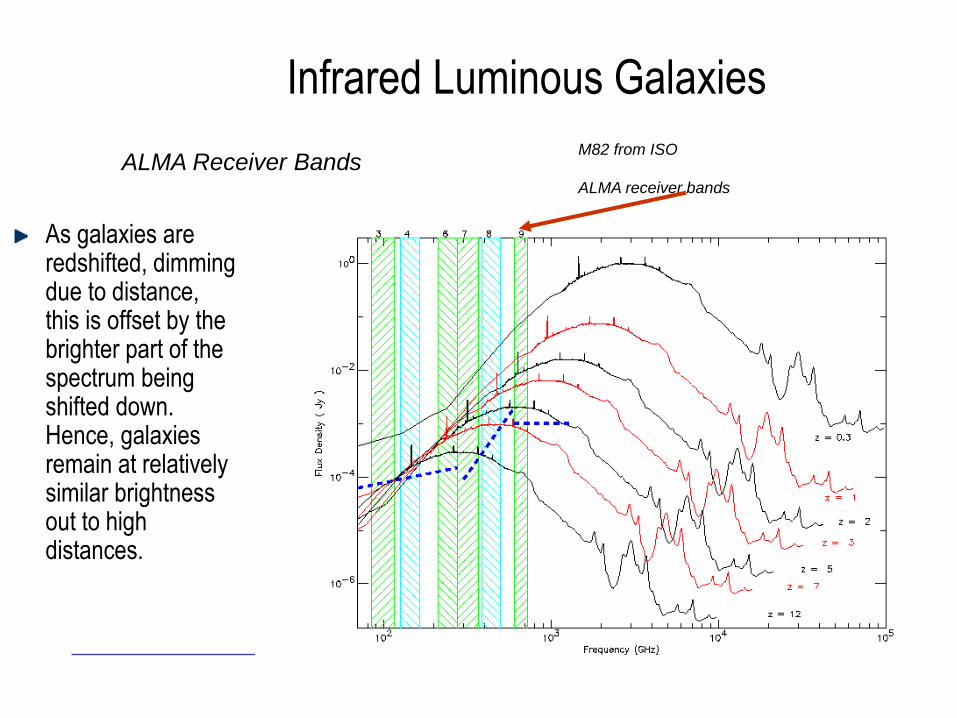
Infrared Luminous Galaxies
As galaxies are redshifted, dimming due to distance, this is offset by the brighter part of the spectrum being shifted down. Hence, galaxies remain at relatively similar brightness out to high distances.
M82 from ISO
ALMA receiver bands
ALMA Receiver Bands
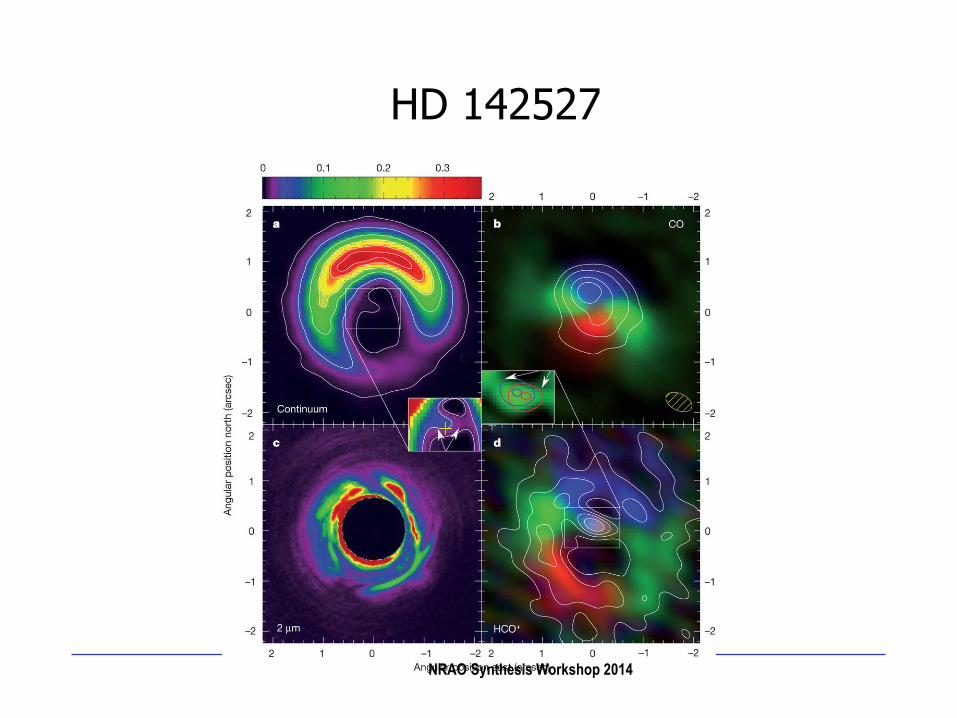
HD 142527
NRAO Synthesis Workshop 2014