Embed Size (px)
Citation preview

BASICS OF ULTRASOUND AND PHOTOACOUSTIC IMAGING
Junyu [email protected]
Johns Hopkins University
July 22, 2021
BASICS OF CONVNETS - JULY 22, 2021
Contents
1 Ultrasound Imaging Systems 3
1.1 Physics of Ultrasound Imaging . . . . . . . . . . . . . . . . . . . . . . . . . . . . . . . . . . . . . . 3
1.1.1 Frequency . . . . . . . . . . . . . . . . . . . . . . . . . . . . . . . . . . . . . . . . . . . . . 3
1.1.2 Propagation speed . . . . . . . . . . . . . . . . . . . . . . . . . . . . . . . . . . . . . . . . 3
1.1.3 Ultrasound Interaction with Tissue . . . . . . . . . . . . . . . . . . . . . . . . . . . . . . . . 3
1.1.4 Angle of Incidence . . . . . . . . . . . . . . . . . . . . . . . . . . . . . . . . . . . . . . . . 4
1.1.5 Attenuation . . . . . . . . . . . . . . . . . . . . . . . . . . . . . . . . . . . . . . . . . . . . 4
1.2 Transducers . . . . . . . . . . . . . . . . . . . . . . . . . . . . . . . . . . . . . . . . . . . . . . . . 4
1.3 Wave Equation . . . . . . . . . . . . . . . . . . . . . . . . . . . . . . . . . . . . . . . . . . . . . . 5
1.4 Ultrasound Beams . . . . . . . . . . . . . . . . . . . . . . . . . . . . . . . . . . . . . . . . . . . . . 5
1.4.1 Plane Wave . . . . . . . . . . . . . . . . . . . . . . . . . . . . . . . . . . . . . . . . . . . . 5
1.4.2 Focused Beam . . . . . . . . . . . . . . . . . . . . . . . . . . . . . . . . . . . . . . . . . . 5
2 Photoacoustic Imaging 6
2.1 Source of Contrast . . . . . . . . . . . . . . . . . . . . . . . . . . . . . . . . . . . . . . . . . . . . 6
2.2 Basic Imaging Equation . . . . . . . . . . . . . . . . . . . . . . . . . . . . . . . . . . . . . . . . . . 7
3 Beamforming in Ultrasound and PA 7
3.1 Delay and Sum . . . . . . . . . . . . . . . . . . . . . . . . . . . . . . . . . . . . . . . . . . . . . . 7
3.2 Short-lag Spatial Coherence . . . . . . . . . . . . . . . . . . . . . . . . . . . . . . . . . . . . . . . 8
3.3 Locally Weighted Short-lag Spatial Coherence . . . . . . . . . . . . . . . . . . . . . . . . . . . . . . 8
4 Noise and artifacts in ultrasound and PA 8
4.1 Speckle Noise . . . . . . . . . . . . . . . . . . . . . . . . . . . . . . . . . . . . . . . . . . . . . . . 8
4.2 Reverberation . . . . . . . . . . . . . . . . . . . . . . . . . . . . . . . . . . . . . . . . . . . . . . . 9
4.3 Mirror Image . . . . . . . . . . . . . . . . . . . . . . . . . . . . . . . . . . . . . . . . . . . . . . . 9
4.4 Acoustic shadowing . . . . . . . . . . . . . . . . . . . . . . . . . . . . . . . . . . . . . . . . . . . . 9
4.5 Acoustic enhancement . . . . . . . . . . . . . . . . . . . . . . . . . . . . . . . . . . . . . . . . . . 9
4.6 Clutter . . . . . . . . . . . . . . . . . . . . . . . . . . . . . . . . . . . . . . . . . . . . . . . . . . . 9
5 Image Quality for Ultrasound and PA 9
6 Application of Ultrasound and PA in Bone 10
6.1 Ultrasound of bone . . . . . . . . . . . . . . . . . . . . . . . . . . . . . . . . . . . . . . . . . . . . 10
6.2 PA of bone . . . . . . . . . . . . . . . . . . . . . . . . . . . . . . . . . . . . . . . . . . . . . . . . 11
6.2.1 Pre-insertion of screw . . . . . . . . . . . . . . . . . . . . . . . . . . . . . . . . . . . . . . 11
6.2.2 During the screw insertion . . . . . . . . . . . . . . . . . . . . . . . . . . . . . . . . . . . . 11
2
BASICS OF CONVNETS - JULY 22, 2021
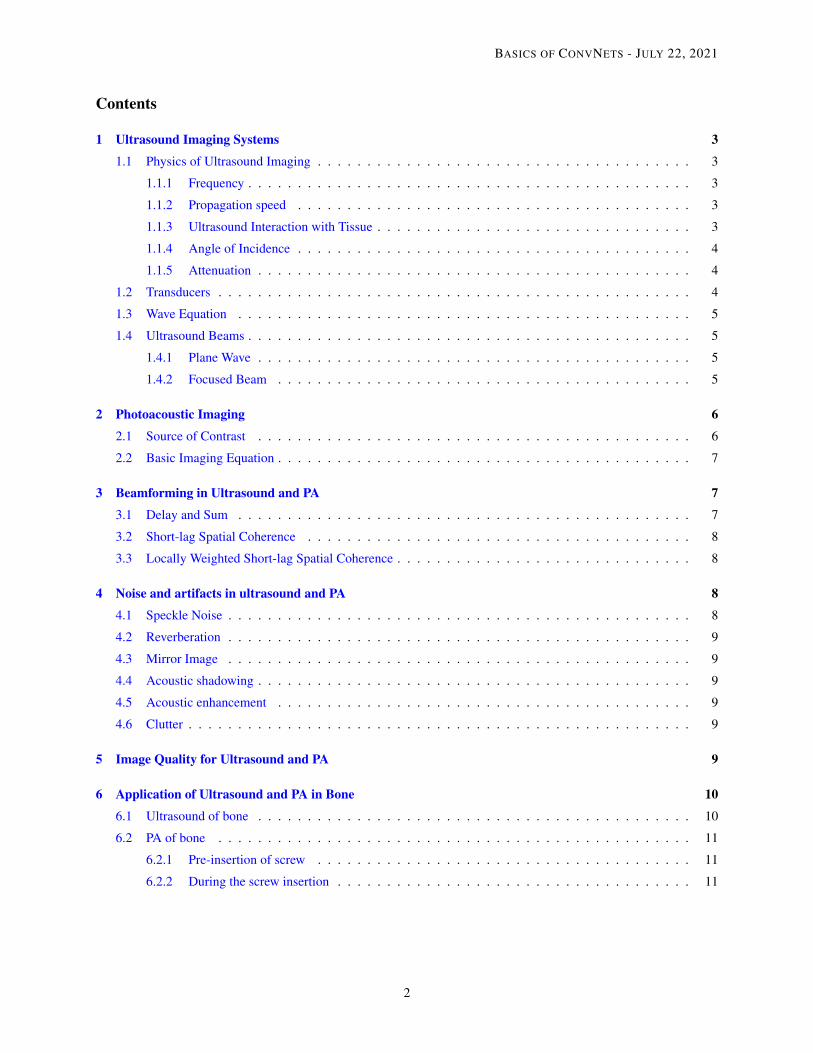
Figure 1: Graphical illustration of the sinusoidal positional embedding. (Images were obtained from [1])
1 Ultrasound Imaging Systems
There are two basic principles regarding how ultrasound is generated and an image is formed. In ultrasoundimaging, a transducer generates acoustic waves via the piezoelectric effect. When an electric current is applied to thecrystals, the crystals deform and vibrate. This deformation produces the ultrasound beam. An ultrasound image isformed via the pulse-echo principle. Ultrasound waves are produced in pulses, because the same crystals are usedto generate and receive acoustic waves, and they cannot do both at the same time. As the ultrasound pulse enters thepatient, it is bounced or reflected back to the transducer. An ultrasound image is formed by measuring the amplitudeand the travel time of the reflected sound echoes to reach the transducer. If there is a high acoustic impedance mismatchbetween two tissue interfaces, then the reflected echo will have a high amplitude resulting in a high-intensity pixelappearance in the formed ultrasound image.
1.1 Physics of Ultrasound Imaging
1.1.1 Frequency
The frequency of an ultrasound wave has a meaning of the number of cycles or pressure changes that occur in1 second. Ultrasound is sound with a frequency ≥ 20 kHz (above the frequency of human audible sound). Typicalultrasound frequency used for clinical purpose are in the range of [2 MHZ, 10 MHz].
1.1.2 Propagation speed
The speed at which ultrasound can travel through a medium, which is about 1540 meters/second for soft tissue.The speed depends solely on the density and stiffness of the medium. Images in Fig 1 (a) demonstrate the speed andfrequency of ultrasound wave.
1.1.3 Ultrasound Interaction with Tissue
When a beam of ultrasound travels through a medium, a reflection of the beam can happen. This reflection iscalled an echo. The production and detection of the echos form the basis of ultrasound imaging. A reflection occursat the boundary between two materials, provided that the acoustic impedance of the materials is different. Acousticimpedance is calculated as the product of the tissue density and the speed of the sound wave:
Z = ρ× c, (1)
where ρ is the density of the tissue, and c is the speed of the sound. If two materials have the same acoustic impedance,their boundary will not produce a reflection (i.e., echo). If the difference in acoustic impedance is large, a strong echo(i.e., large amplitude) will be produced, and vice versa. If the difference in acoustic impedance is too large, all theultrasounds will be reflected. As shown in Fig. 1 (b), regions containing bone or air can produce large echos that notenough ultrasound remains to image the tissues underneath. Strong reflection or echos show on the ultrasound image aswhite and weaker echos as gray.
3
BASICS OF CONVNETS - JULY 22, 2021
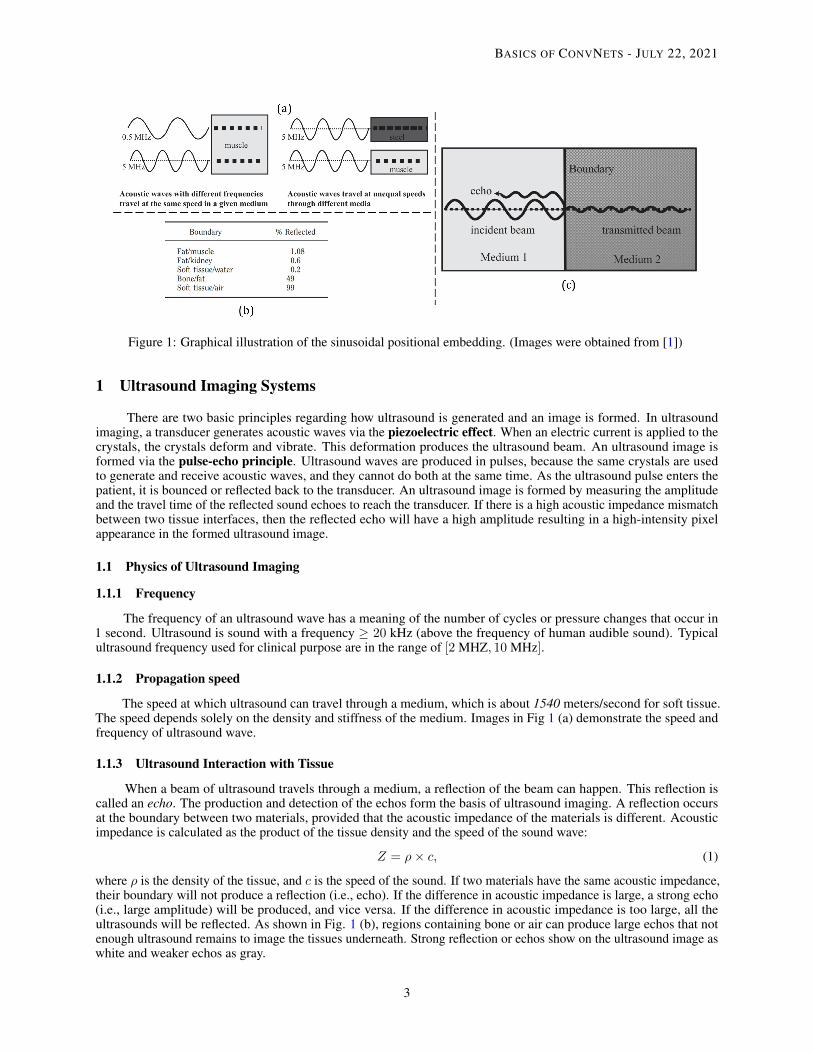
Figure 2: Left: Ultrasound refraction and Snell’s law. Right: Ultrasound steering and focusing (image was obtainedfrom [1])
1.1.4 Angle of Incidence
The percentage reflections shown in Fig. 1 (b) are applicable for a normal angle of incidence (90◦ to the boundary).If a beam of ultrasound strikes a boundary with an angle other than 90◦, the echo will return from the boundary atangle equal to the angle of incidence, and the transmitted beam will be deviated from the straight line by an amountthat depends on the difference in the velocity of ultrasound. This deviation of the beam traveling direction is known asrefraction, and it is governed by the Snell’s law (as shown in the left panel Fig. 2):
sin θ1c1
=sin θ2c2
, (2)
where sin θ1 and sin θ2 are incident and refracted angles of the ultrasound beam, respectively, and c1 and c2 denote,respectively, the speed of sound in the first and second medium. Ultrasound machine always assumes that the ultrasoundtravels in a straight line, therefore, refraction only confuses the machine. However, refraction from rough surfacesproduces echoes in many directions, which enables sound to get back to the transducer from oblique surfaces.
1.1.5 Attenuation
The intensity of an ultrasound beam is reduced by attenuation due to reflection, refraction, scattering, andabsorption. Reflection and refraction occur at surfaces that are large compared with the wavelength of the ultrasound.For objects that are smaller than the wavelength, the energy of the ultrasound is scattered in many directions andeventually gets absorbed as particle vibration and heat generation. Therefore a high-frequency (smaller wavelength)beam will be attenuated more than a lower frequency (larger wavelength). To penetrate deep into the body, one needsto use a lower-frequency transducer (larger wavelength). However, only higher frequencies can enable finer details.Therefore, there is a trade-off between resolution and depth of penetration for different imaging applications.
In ultrasound, relative intensity of the beam is important. Because the change in intensity is so large, the relativechange in intensity is measured in decibels (dB):
10 log(transmitted intensity
incident intensity). (3)
A 3-MHz beam will be attenuated 3dB in the first centimeter (decreased to its 50% intensity), then another 3dB in thenext centimeter. Therefore, after passing through 20 centimeters of tissue and being reflected back to the transducer, theintensity will be attenuated by a factor of more than a million.
1.2 Transducers
Transducer is the most critical component in any ultrasonic imaging system. Transducers use a piezoelectricmaterial with a characteristic acoustic impedance perfectly matched to that of the (human) body. Transducers havehigh efficiency as a transmitter and have high sensitivity as a receiver. However, due to the 99.9% reflection rate of
4
BASICS OF CONVNETS - JULY 22, 2021
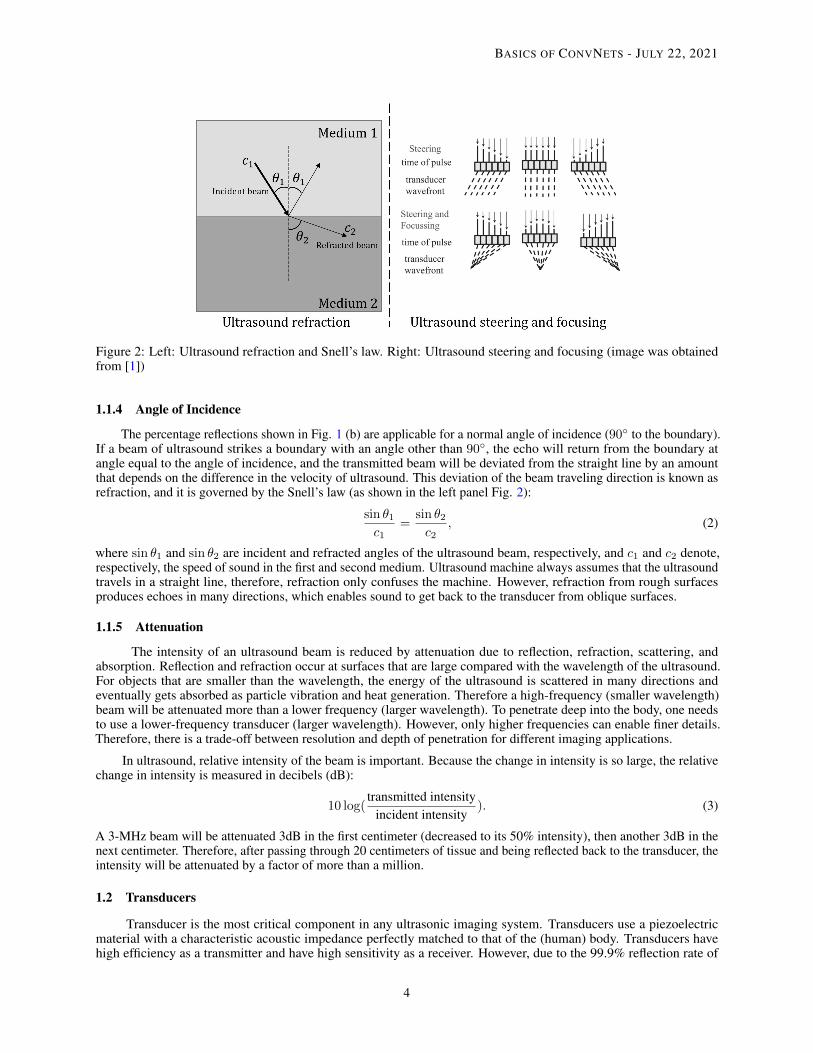
Figure 3: Left: Comparisons between the focused ultrasound beam and the plane wave transmission. Middle: Planewave steering. Right: Steering and focusing. (images were obtained from [2] and [3])
air/soft-tissue (as shown in Fig. 1 (b)), transducers must be directly coupled to the patient skin without any air gap. Thiscoupling is accomplished by using gel or oil between transducer and human skin.
1.3 Wave Equation
From the physical properties of matter, an acoustic pressure p must satisfy the wave equation:
∇2p(x, y, z, t) =1
c2∂2p(x, y, z, t)
∂t2(4)
1.4 Ultrasound Beams
Generally, there are two types of ultrasound beams, the plane wave transmission and the focused beam. Theredifferences can be visualized in Fig. 3.
1.4.1 Plane Wave
Ultrasound transducer can generate an acoustic wave that varies in only one spatial direction and time, this is calleda plane wave. For a plane wave traveling in the z-direction, the wave equation can be reduced to:
∂2p(z, t)
∂z2=
1
c2∂2p(z, t)
∂t2. (5)
It is possible to steer the acoustic beam by adding a separate delay element to each transducer a phase array (as shownin the right panel of Fig. 2).
1.4.2 Focused Beam
By tuning the delays in the pulsing of elements, the beam from an array can also be focused, then the beam cansweep as in a scanning motion (as shown in the right panel Fig. 2).
Assuming that transducer T0 generates a pulse at t = 0, then at time t, the leading edge of the pulse generated byT0 has traveled distance r0(t) = ct. Therefore, the distance between Ti and the wavefront can be expressed as:
ri(t) = r0(t)− id sin θ. (6)
Thus, to generate a pulse that will also have the same wavefront, the pulse must be generated at time:
ti =r0(t)− ri(t)
c=id sin θ
c. (7)
To focus the beam, which is a refinement of steering, as shown in the right panel of Fig. 3. The range from Ti to thefocal point at (xf , zf ) is:
ri =√
(id− xf )2 + z2f . (8)
5
BASICS OF CONVNETS - JULY 22, 2021
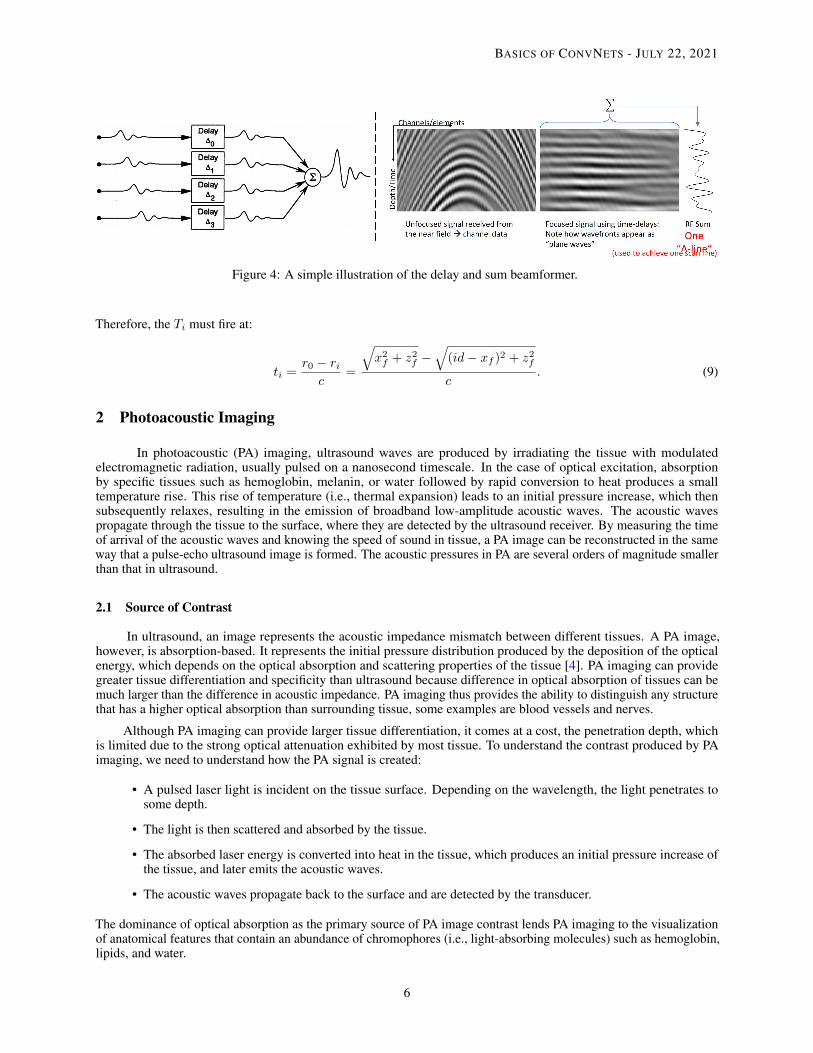
Figure 4: A simple illustration of the delay and sum beamformer.
Therefore, the Ti must fire at:
ti =r0 − ric
=
√x2f + z2f −
√(id− xf )2 + z2f
c. (9)
2 Photoacoustic Imaging
In photoacoustic (PA) imaging, ultrasound waves are produced by irradiating the tissue with modulatedelectromagnetic radiation, usually pulsed on a nanosecond timescale. In the case of optical excitation, absorptionby specific tissues such as hemoglobin, melanin, or water followed by rapid conversion to heat produces a smalltemperature rise. This rise of temperature (i.e., thermal expansion) leads to an initial pressure increase, which thensubsequently relaxes, resulting in the emission of broadband low-amplitude acoustic waves. The acoustic wavespropagate through the tissue to the surface, where they are detected by the ultrasound receiver. By measuring the timeof arrival of the acoustic waves and knowing the speed of sound in tissue, a PA image can be reconstructed in the sameway that a pulse-echo ultrasound image is formed. The acoustic pressures in PA are several orders of magnitude smallerthan that in ultrasound.
2.1 Source of Contrast
In ultrasound, an image represents the acoustic impedance mismatch between different tissues. A PA image,however, is absorption-based. It represents the initial pressure distribution produced by the deposition of the opticalenergy, which depends on the optical absorption and scattering properties of the tissue [4]. PA imaging can providegreater tissue differentiation and specificity than ultrasound because difference in optical absorption of tissues can bemuch larger than the difference in acoustic impedance. PA imaging thus provides the ability to distinguish any structurethat has a higher optical absorption than surrounding tissue, some examples are blood vessels and nerves.
Although PA imaging can provide larger tissue differentiation, it comes at a cost, the penetration depth, whichis limited due to the strong optical attenuation exhibited by most tissue. To understand the contrast produced by PAimaging, we need to understand how the PA signal is created:
• A pulsed laser light is incident on the tissue surface. Depending on the wavelength, the light penetrates tosome depth.
• The light is then scattered and absorbed by the tissue.
• The absorbed laser energy is converted into heat in the tissue, which produces an initial pressure increase ofthe tissue, and later emits the acoustic waves.
• The acoustic waves propagate back to the surface and are detected by the transducer.
The dominance of optical absorption as the primary source of PA image contrast lends PA imaging to the visualizationof anatomical features that contain an abundance of chromophores (i.e., light-absorbing molecules) such as hemoglobin,lipids, and water.
6
BASICS OF CONVNETS - JULY 22, 2021
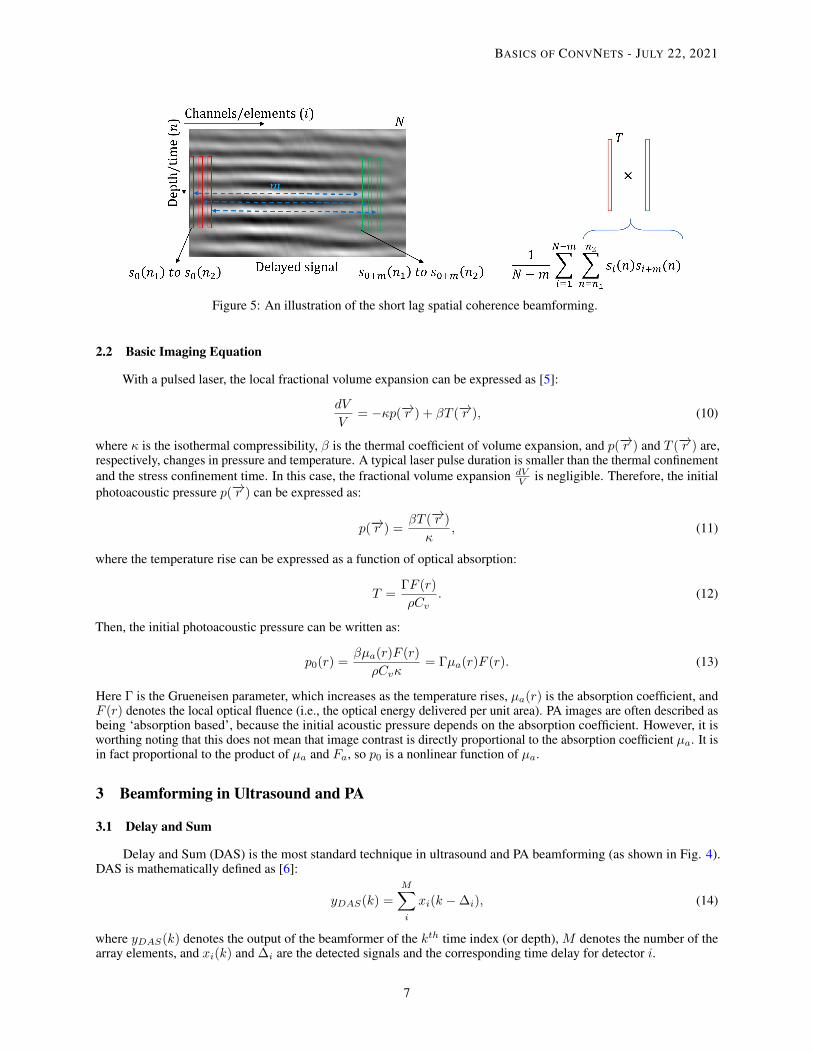
Figure 5: An illustration of the short lag spatial coherence beamforming.
2.2 Basic Imaging Equation
With a pulsed laser, the local fractional volume expansion can be expressed as [5]:
dV
V= −κp(−→r ) + βT (−→r ), (10)
where κ is the isothermal compressibility, β is the thermal coefficient of volume expansion, and p(−→r ) and T (−→r ) are,respectively, changes in pressure and temperature. A typical laser pulse duration is smaller than the thermal confinementand the stress confinement time. In this case, the fractional volume expansion dV
V is negligible. Therefore, the initialphotoacoustic pressure p(−→r ) can be expressed as:
p(−→r ) =βT (−→r )
κ, (11)
where the temperature rise can be expressed as a function of optical absorption:
T =ΓF (r)
ρCv. (12)
Then, the initial photoacoustic pressure can be written as:
p0(r) =βµa(r)F (r)
ρCvκ= Γµa(r)F (r). (13)
Here Γ is the Grueneisen parameter, which increases as the temperature rises, µa(r) is the absorption coefficient, andF (r) denotes the local optical fluence (i.e., the optical energy delivered per unit area). PA images are often described asbeing ‘absorption based’, because the initial acoustic pressure depends on the absorption coefficient. However, it isworthing noting that this does not mean that image contrast is directly proportional to the absorption coefficient µa. It isin fact proportional to the product of µa and Fa, so p0 is a nonlinear function of µa.
3 Beamforming in Ultrasound and PA
3.1 Delay and Sum
Delay and Sum (DAS) is the most standard technique in ultrasound and PA beamforming (as shown in Fig. 4).DAS is mathematically defined as [6]:
yDAS(k) =
M∑i
xi(k −∆i), (14)
where yDAS(k) denotes the output of the beamformer of the kth time index (or depth), M denotes the number of thearray elements, and xi(k) and ∆i are the detected signals and the corresponding time delay for detector i.
7
BASICS OF CONVNETS - JULY 22, 2021
3.2 Short-lag Spatial Coherence
Instead of the simple summation, the time delayed signal can be used in a more advanced beamformer, namely theshort-lag spatial coherence (SLSC). SLSC beamforming only accounts for the similarity across the received signalsin the aperture domain, as a function of element separation m. Then, an SLSC image is formed as the integral of thespatial coherence function over the first M lags. It displays spatial coherence between the received echos at differentshort-lag values (i.e., element separation m), thereby reduces speckle noise and removes clutter artifacts. As shown inFig. 5, for a receive aperture with N elements, the time-delayed signal detected by the ith element of nth time index (ordepth) is defined as si(n) (note that si(n) is a zero-mean signal). The estimated spatial covariance across the receiveaperture is defined as [7]:
C(m) =1
N −m
N−m∑i=1
n2∑n=n1
si(n)si+m(n), (15)
where m is the distance, or lag, which is really the number of elements between two points in the aperture. Notice thatsignals si and si+m have zero-mean. The covariance, C(m), is further normalized by the individual variances of thesignals si and si+m, the spatial correlation can be computed by:
R(m) =1
N −m
N−m∑i=1
∑n2
n=n1si(n)si+m(n)∑n2
n=n1si(n)
∑n2
n=n1si+m(n)
. (16)
It is found that the largest losses in spatial coherence will occur in the regions of low lags [7]. Therefore, the short-lagspatial coherence (SLSC) is computed as the integral of the spatial coherence function over the first M lags:
Rsl =
∫ M
1
R(m)dm =
M∑m=1
R(m), (17)
where M is a hyperparameter, for which a parameter Q is introduced to represent Q as a percentage of the aperturewidth N :
Q =M
N× 100% (18)
3.3 Locally Weighted Short-lag Spatial Coherence
Instead of summing up to a pre-defined lag value of M , LW-SLSC computes the weighted sum of a subsetof the coherence functions Ri(m). Ri(m) ∈ Rkz×kx×N is the ith moving kernel inside the correlation matrixR(m) ∈ RNz×Nx×N . The weighting parameter wi(m) for each coherence function in side the moving kernel (i.e.,Ri(m)) is determined by optimizing an energy function [8]:
wi = arg minwi
TV(f(wi, Ri)) + α2‖∇wi‖2, (19)
where
f(wi, Ri) =
N∑m=1
Ri(m) · wi(m), (20)
‖wi‖ = 1, and 0 ≤ wi ≤ 1. (21)
The key advantage of LW-SLSC is the adaptive selection of the number of lags to be summed, which reduces incoherentsignals and noise. The kernel size (kz × kx), overlap, and the regularization term are all factors that influence thequality of LW-SLSC.
4 Noise and artifacts in ultrasound and PA
4.1 Speckle Noise
Speckle noise comes from the acoustic echoes with random phases and amplitudes. The superposition of theseechos produces a complicated interference pattern, which is known as speckle noise. Speckle noise is a pseudo-randomprocess because it generally depends on the structure of the tissue. Speckle noise tends to reduce the image contrast andblur the image details.
8
BASICS OF CONVNETS - JULY 22, 2021
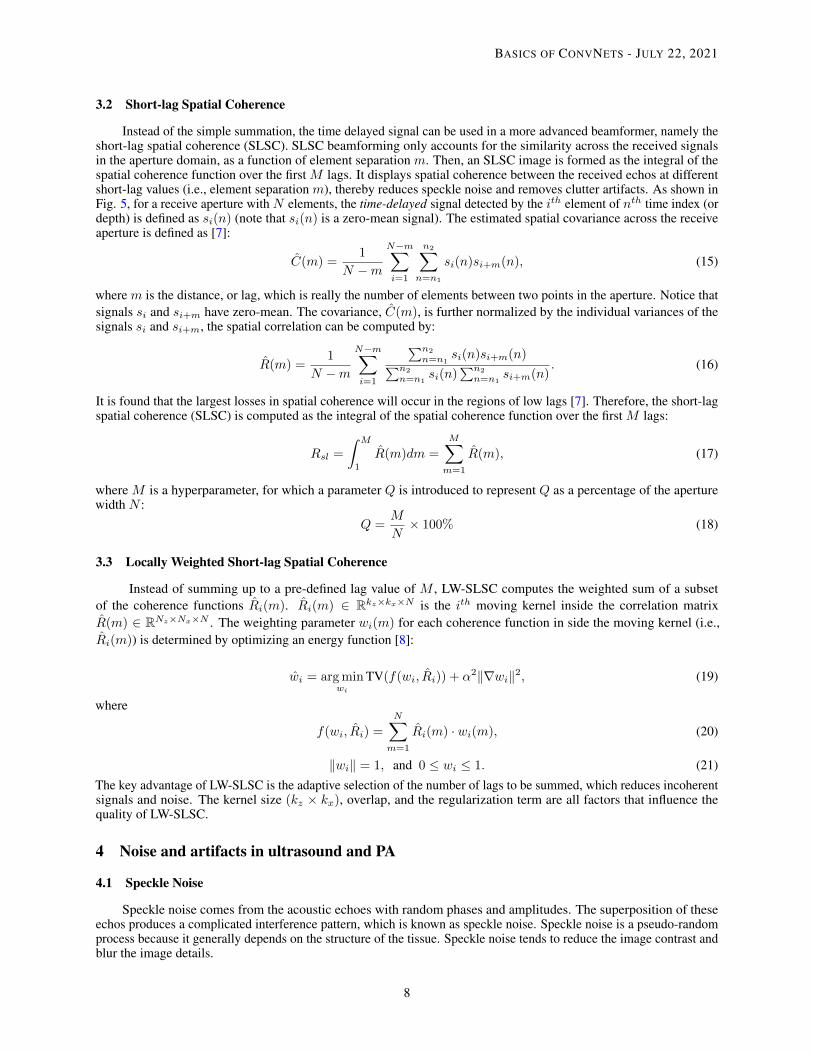
Figure 6: Examples of accurate and inaccurate pedicle screw placement. (Image obtained from [9])
4.2 Reverberation
Reverberation artifacts appear as a sequence of lines that are evenly spaced. An ultrasonic beam bounces back andforth between two highly reflecting contacts or between the transducer and a strong reflector to produce the artifacts. Anillustrative diagram of this artifact is shown here https://radiopaedia.org/cases/reverberation-artifact?lang=us.
4.3 Mirror Image
One of the beam path artifacts is the mirror image artifact. When an ultrasound beam hits a reflecting surface, it isnot reflected directly back to the transducer, but instead takes an indirect return back. An illustrative diagram of thisartifact is shown here https://litfl.com/mirror-image-artefacts/.
4.4 Acoustic shadowing
The sound beam is completely absorbed or reflected at the structure with high attenuation, resulting ina shadow underneath the high acoustic attenuating object. An illustrative diagram of this artifact is shown herehttps://okean.rs/artifacts-in-ultrasonography/.
4.5 Acoustic enhancement
Acoustic enhancement is a localized increase in echo amplitude distal to a low-attenuation structure that appearsas a brighter region. There is less tissue reflection when sound waves pass through a poorly attenuating structure thatallows them easy passage, and an area of artifactually increased echogenicity is produced right under the structurebecause more sound waves are present in this area compared to tissues at the same depth around it. An illustrativediagram of this artifact is shown here https://okean.rs/artifacts-in-ultrasonography/.
4.6 Clutter
Clutter in ultrasound and PA originates from the scattering by multiple tissues (i.e., multipath scattering). Cluttertypically overlays structures or signals of interest and often degrades image contrast.
5 Image Quality for Ultrasound and PA
The following paragraphs introduce the commonly used image quality measurements in ultrasound and PA.Varaibles include the mean of regions within and outside a target of interest, denoted by µi and µo, respectively, thestandard deviation of the same regions (σi and σo), and the histograms of the same regions (hi and ho).
Contrast Contrast measures visibility of the target with respect to the background. It is defined as:
Contrast = 20 log10(µi
µo). (22)
9
BASICS OF CONVNETS - JULY 22, 2021
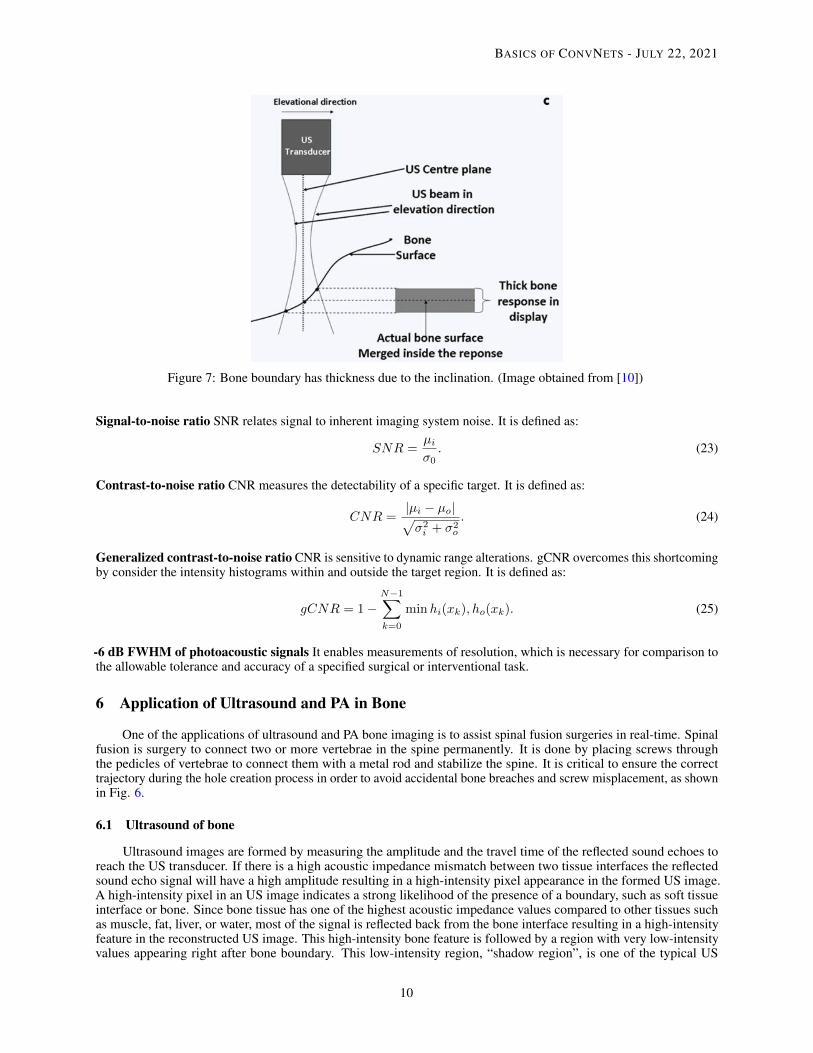
Figure 7: Bone boundary has thickness due to the inclination. (Image obtained from [10])
Signal-to-noise ratio SNR relates signal to inherent imaging system noise. It is defined as:
SNR =µi
σ0. (23)
Contrast-to-noise ratio CNR measures the detectability of a specific target. It is defined as:
CNR =|µi − µo|√σ2i + σ2
o
. (24)
Generalized contrast-to-noise ratio CNR is sensitive to dynamic range alterations. gCNR overcomes this shortcomingby consider the intensity histograms within and outside the target region. It is defined as:
gCNR = 1−N−1∑k=0
minhi(xk), ho(xk). (25)
-6 dB FWHM of photoacoustic signals It enables measurements of resolution, which is necessary for comparison tothe allowable tolerance and accuracy of a specified surgical or interventional task.
6 Application of Ultrasound and PA in Bone
One of the applications of ultrasound and PA bone imaging is to assist spinal fusion surgeries in real-time. Spinalfusion is surgery to connect two or more vertebrae in the spine permanently. It is done by placing screws throughthe pedicles of vertebrae to connect them with a metal rod and stabilize the spine. It is critical to ensure the correcttrajectory during the hole creation process in order to avoid accidental bone breaches and screw misplacement, as shownin Fig. 6.
6.1 Ultrasound of bone
Ultrasound images are formed by measuring the amplitude and the travel time of the reflected sound echoes toreach the US transducer. If there is a high acoustic impedance mismatch between two tissue interfaces the reflectedsound echo signal will have a high amplitude resulting in a high-intensity pixel appearance in the formed US image.A high-intensity pixel in an US image indicates a strong likelihood of the presence of a boundary, such as soft tissueinterface or bone. Since bone tissue has one of the highest acoustic impedance values compared to other tissues suchas muscle, fat, liver, or water, most of the signal is reflected back from the bone interface resulting in a high-intensityfeature in the reconstructed US image. This high-intensity bone feature is followed by a region with very low-intensityvalues appearing right after bone boundary. This low-intensity region, “shadow region”, is one of the typical US
10
BASICS OF CONVNETS - JULY 22, 2021
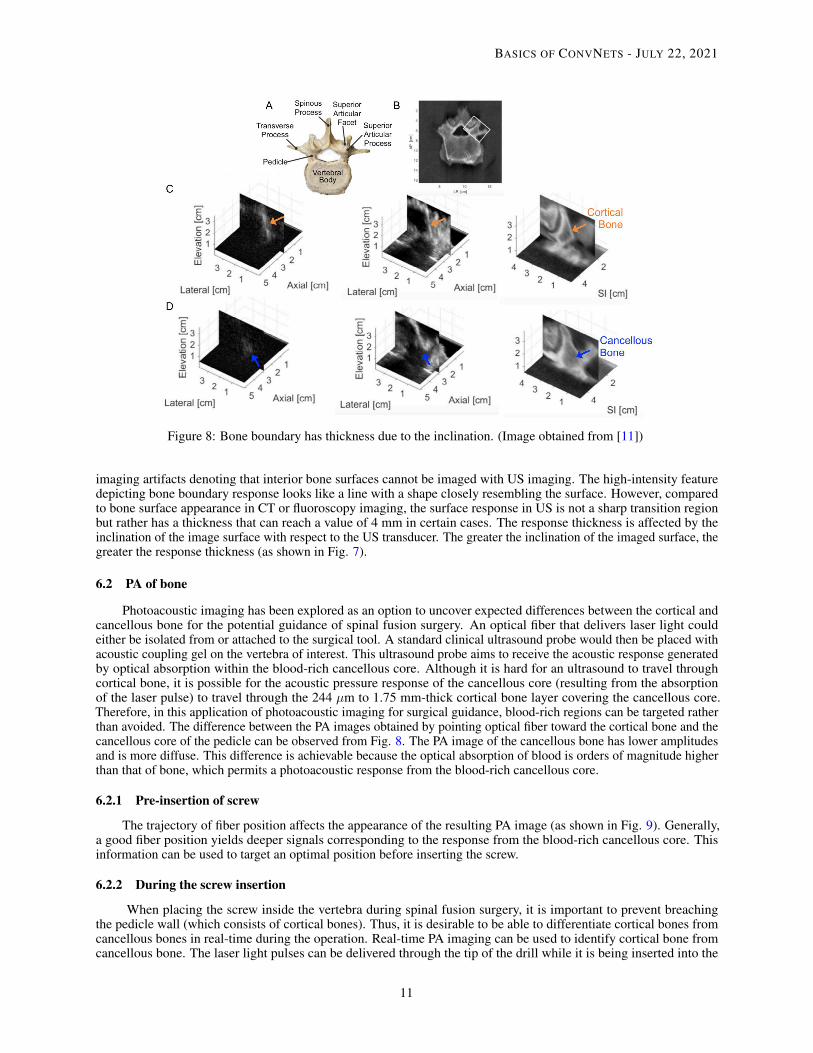
Figure 8: Bone boundary has thickness due to the inclination. (Image obtained from [11])
imaging artifacts denoting that interior bone surfaces cannot be imaged with US imaging. The high-intensity featuredepicting bone boundary response looks like a line with a shape closely resembling the surface. However, comparedto bone surface appearance in CT or fluoroscopy imaging, the surface response in US is not a sharp transition regionbut rather has a thickness that can reach a value of 4 mm in certain cases. The response thickness is affected by theinclination of the image surface with respect to the US transducer. The greater the inclination of the imaged surface, thegreater the response thickness (as shown in Fig. 7).
6.2 PA of bone
Photoacoustic imaging has been explored as an option to uncover expected differences between the cortical andcancellous bone for the potential guidance of spinal fusion surgery. An optical fiber that delivers laser light couldeither be isolated from or attached to the surgical tool. A standard clinical ultrasound probe would then be placed withacoustic coupling gel on the vertebra of interest. This ultrasound probe aims to receive the acoustic response generatedby optical absorption within the blood-rich cancellous core. Although it is hard for an ultrasound to travel throughcortical bone, it is possible for the acoustic pressure response of the cancellous core (resulting from the absorptionof the laser pulse) to travel through the 244 µm to 1.75 mm-thick cortical bone layer covering the cancellous core.Therefore, in this application of photoacoustic imaging for surgical guidance, blood-rich regions can be targeted ratherthan avoided. The difference between the PA images obtained by pointing optical fiber toward the cortical bone and thecancellous core of the pedicle can be observed from Fig. 8. The PA image of the cancellous bone has lower amplitudesand is more diffuse. This difference is achievable because the optical absorption of blood is orders of magnitude higherthan that of bone, which permits a photoacoustic response from the blood-rich cancellous core.
6.2.1 Pre-insertion of screw
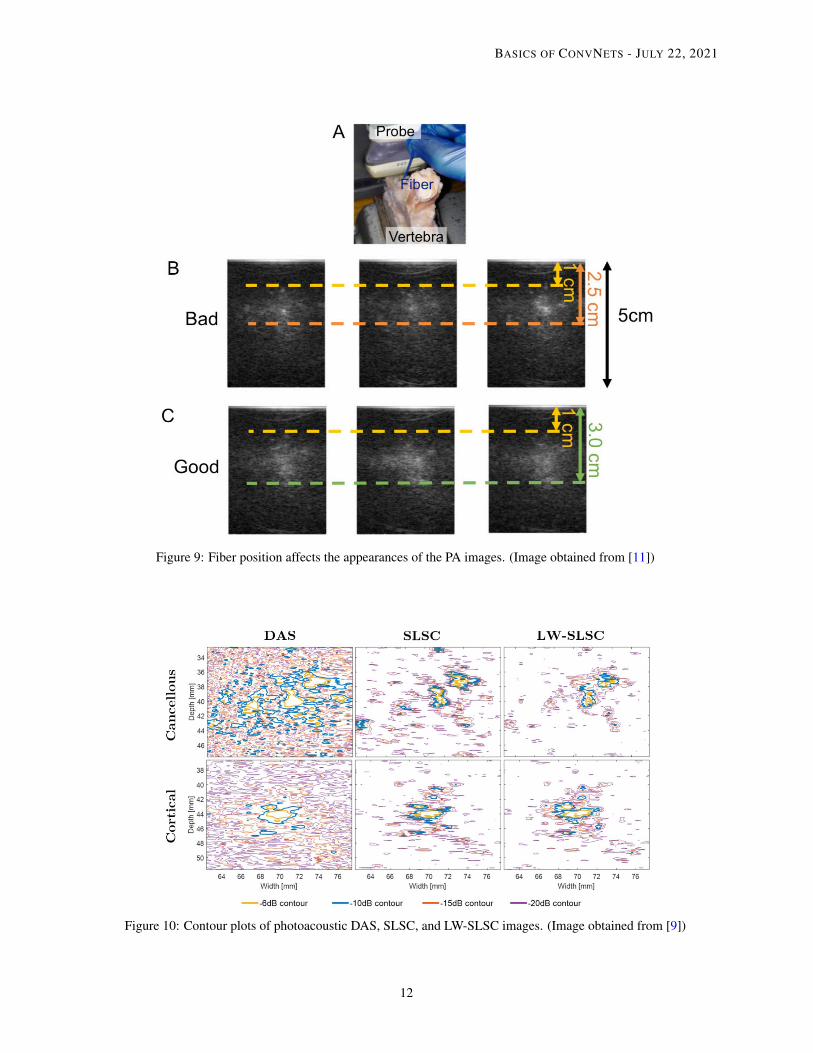
The trajectory of fiber position affects the appearance of the resulting PA image (as shown in Fig. 9). Generally,a good fiber position yields deeper signals corresponding to the response from the blood-rich cancellous core. Thisinformation can be used to target an optimal position before inserting the screw.
6.2.2 During the screw insertion
When placing the screw inside the vertebra during spinal fusion surgery, it is important to prevent breachingthe pedicle wall (which consists of cortical bones). Thus, it is desirable to be able to differentiate cortical bones fromcancellous bones in real-time during the operation. Real-time PA imaging can be used to identify cortical bone fromcancellous bone. The laser light pulses can be delivered through the tip of the drill while it is being inserted into the
11
BASICS OF CONVNETS - JULY 22, 2021
Figure 9: Fiber position affects the appearances of the PA images. (Image obtained from [11])
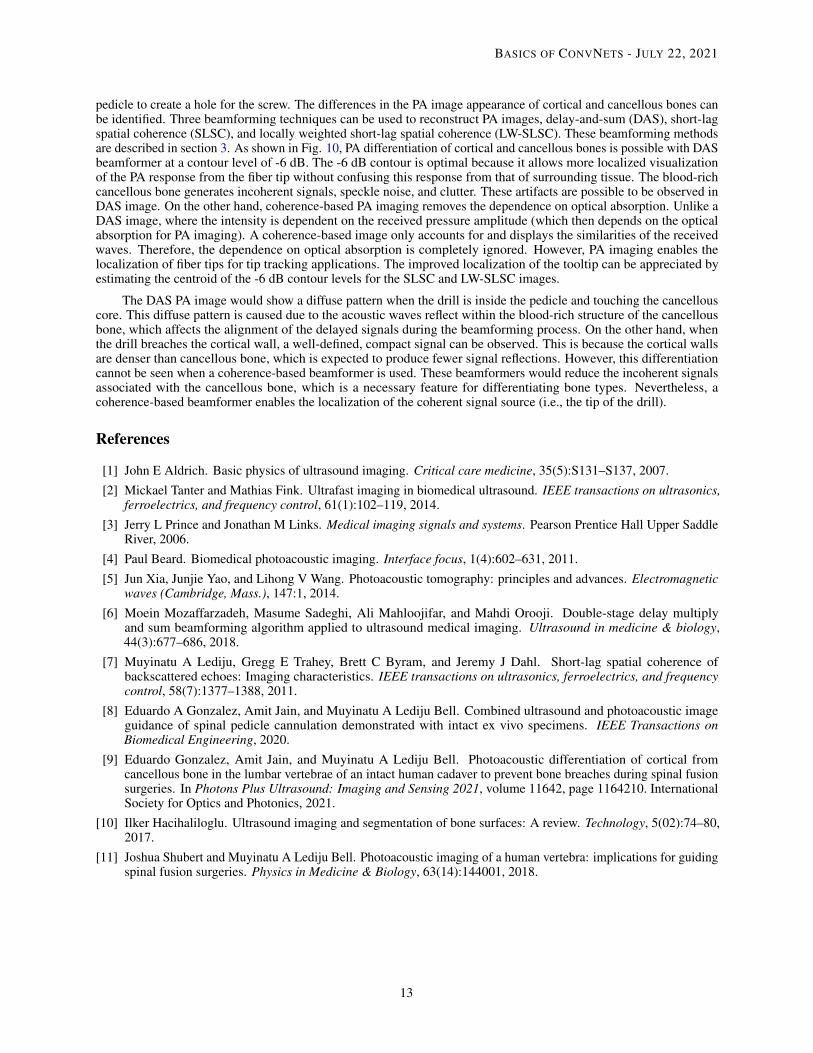
Figure 10: Contour plots of photoacoustic DAS, SLSC, and LW-SLSC images. (Image obtained from [9])
12
BASICS OF CONVNETS - JULY 22, 2021
pedicle to create a hole for the screw. The differences in the PA image appearance of cortical and cancellous bones canbe identified. Three beamforming techniques can be used to reconstruct PA images, delay-and-sum (DAS), short-lagspatial coherence (SLSC), and locally weighted short-lag spatial coherence (LW-SLSC). These beamforming methodsare described in section 3. As shown in Fig. 10, PA differentiation of cortical and cancellous bones is possible with DASbeamformer at a contour level of -6 dB. The -6 dB contour is optimal because it allows more localized visualizationof the PA response from the fiber tip without confusing this response from that of surrounding tissue. The blood-richcancellous bone generates incoherent signals, speckle noise, and clutter. These artifacts are possible to be observed inDAS image. On the other hand, coherence-based PA imaging removes the dependence on optical absorption. Unlike aDAS image, where the intensity is dependent on the received pressure amplitude (which then depends on the opticalabsorption for PA imaging). A coherence-based image only accounts for and displays the similarities of the receivedwaves. Therefore, the dependence on optical absorption is completely ignored. However, PA imaging enables thelocalization of fiber tips for tip tracking applications. The improved localization of the tooltip can be appreciated byestimating the centroid of the -6 dB contour levels for the SLSC and LW-SLSC images.
The DAS PA image would show a diffuse pattern when the drill is inside the pedicle and touching the cancellouscore. This diffuse pattern is caused due to the acoustic waves reflect within the blood-rich structure of the cancellousbone, which affects the alignment of the delayed signals during the beamforming process. On the other hand, whenthe drill breaches the cortical wall, a well-defined, compact signal can be observed. This is because the cortical wallsare denser than cancellous bone, which is expected to produce fewer signal reflections. However, this differentiationcannot be seen when a coherence-based beamformer is used. These beamformers would reduce the incoherent signalsassociated with the cancellous bone, which is a necessary feature for differentiating bone types. Nevertheless, acoherence-based beamformer enables the localization of the coherent signal source (i.e., the tip of the drill).
References
[1] John E Aldrich. Basic physics of ultrasound imaging. Critical care medicine, 35(5):S131–S137, 2007.[2] Mickael Tanter and Mathias Fink. Ultrafast imaging in biomedical ultrasound. IEEE transactions on ultrasonics,
ferroelectrics, and frequency control, 61(1):102–119, 2014.[3] Jerry L Prince and Jonathan M Links. Medical imaging signals and systems. Pearson Prentice Hall Upper Saddle
River, 2006.[4] Paul Beard. Biomedical photoacoustic imaging. Interface focus, 1(4):602–631, 2011.[5] Jun Xia, Junjie Yao, and Lihong V Wang. Photoacoustic tomography: principles and advances. Electromagnetic
waves (Cambridge, Mass.), 147:1, 2014.[6] Moein Mozaffarzadeh, Masume Sadeghi, Ali Mahloojifar, and Mahdi Orooji. Double-stage delay multiply
and sum beamforming algorithm applied to ultrasound medical imaging. Ultrasound in medicine & biology,44(3):677–686, 2018.
[7] Muyinatu A Lediju, Gregg E Trahey, Brett C Byram, and Jeremy J Dahl. Short-lag spatial coherence ofbackscattered echoes: Imaging characteristics. IEEE transactions on ultrasonics, ferroelectrics, and frequencycontrol, 58(7):1377–1388, 2011.
[8] Eduardo A Gonzalez, Amit Jain, and Muyinatu A Lediju Bell. Combined ultrasound and photoacoustic imageguidance of spinal pedicle cannulation demonstrated with intact ex vivo specimens. IEEE Transactions onBiomedical Engineering, 2020.
[9] Eduardo Gonzalez, Amit Jain, and Muyinatu A Lediju Bell. Photoacoustic differentiation of cortical fromcancellous bone in the lumbar vertebrae of an intact human cadaver to prevent bone breaches during spinal fusionsurgeries. In Photons Plus Ultrasound: Imaging and Sensing 2021, volume 11642, page 1164210. InternationalSociety for Optics and Photonics, 2021.
[10] Ilker Hacihaliloglu. Ultrasound imaging and segmentation of bone surfaces: A review. Technology, 5(02):74–80,2017.
[11] Joshua Shubert and Muyinatu A Lediju Bell. Photoacoustic imaging of a human vertebra: implications for guidingspinal fusion surgeries. Physics in Medicine & Biology, 63(14):144001, 2018.
13

![In vivo imaging of swimming micromotors using hybrid high … · 2020. 6. 15. · optical-ultrasound imaging technique, also called photoacoustic imaging (PAI).[28–32] PAI is](https://img.pdfslide.net/doc/110x75/6092d60f6674c8570e70cd4e/in-vivo-imaging-of-swimming-micromotors-using-hybrid-high-2020-6-15-optical-ultrasound.jpg)