Embed Size (px)
Citation preview
School of Mechanical Engineering
Battery Management, Power Supply and Safety
Systems in an Electric Drive Vehicle
Stephen Whitely
10119492
School of Mechanical Engineering, University of Western Australia
Supervisor
Thomas Braunl, Assoc. Prof. Dr. habil.
School of Electrical, Electronic and Computer Engineering
3rd November 2008
i
ABSTRACT
There is currently a great focus on reducing carbon emissions and fossil fuel
consumption by means of alternative energy sources in transportation. An increasingly
popular option is the electric vehicle (EV). One of the main criticisms on EVs is their
limited range. Range is largely dictated by limitations of the batteries carried in the
vehicle. Battery technology is continuously improving but in order to get the most out
of current and future technologies, intelligent battery management and efficient use of
the energy is required. The management of charging and discharging of the batteries can
allow for increased range and extended battery life on current technology and can be
applied to new battery technologies as they become available.
This paper will cover the installation and implementation of battery management, power
supply and safety systems in a conventional vehicle converted to electric drive for the
Renewable Energy Vehicle (REV) Project at the University of Western Australia. These
systems will be based on a Lithium ion battery pack and will be predominately using
currently available technologies to provide a simple conversion that could be achieved
by general members of the public without access to high tech labs and workshops.
These systems will be tested and reviewed for their strengths and shortcomings.
Suggestions will be made as how to improve the systems for future works by the REV
Project in ongoing years.
This paper shows that while the systems are adequate, a number of improvements on
battery management, efficient power distribution and safety issues can be made.
ii
LETTER OF TRANSMITTAL
Stephen Whitely
267 Heytesbury Rd
Subiaco WA 6008
3rd November 2008
Associate Professor Carolyn Oldham
Dean
Faculty of Engineering, Computing and Mathematics
University of Western Australia
35 Stirling Highway
Crawley, WA 6009
Dear Associate Professor Oldham
I am pleased to present this thesis, entitled “Battery Management, Power Supply and
Safety Systems in an Electric Drive Vehicle” as part of the requirement for the degree
of Bachelor of Engineering.
Yours sincerely
Stephen Whitely
10119492

iii
TABLE OF CONTENTS
1. Nomenclature ............................................................................................................. 1
2. Introduction and Literature Review ........................................................................... 2
2.1. Introduction ........................................................................................................ 2
2.2. Literature review ................................................................................................ 2
2.3. Project objectives................................................................................................ 6
2.4. REV Project background .................................................................................... 7
3. Battery Management System ..................................................................................... 8
3.1. Description of system ......................................................................................... 8
3.2. Process .............................................................................................................. 10
3.3. Results and Discussion ..................................................................................... 14
4. Safety Systems ......................................................................................................... 23
4.1. Process .............................................................................................................. 23
4.2. Results and Discussion ..................................................................................... 26
5. Power Supply ........................................................................................................... 29
5.1. Process .............................................................................................................. 29
5.2. Results and Discussion ..................................................................................... 33
6. Conclusions and Future Work ................................................................................. 34
6.1. Conclusions ...................................................................................................... 34
6.2. Future work ...................................................................................................... 35
7. References ................................................................................................................ 36
8. Appendices .............................................................................................................. 39
8.1. Data from experiment 2 .................................................................................... 39
8.2. Data from experiment 3 .................................................................................... 40
8.3. Safe Installation Guide for Batteries ................................................................ 40

1
1. NOMENCLATURE
The following are some acronyms that shall be used throughout this paper.
BMS Battery Management System
CI Constant Current (Charging)
CV Constant Voltage (Charging)
DPI Department of Planning and Infrastructure (Western Australia)
EV Electric Vehicle
ICE Internal Combustion Engine
ICV Internal Combustion Vehicle
NCOP National Code of Practice
REV Renewable Energy Vehicle
SOC State of Charge
ZEV Zero Emission Vehicle
2
2. INTRODUCTION AND LITERATURE REVIEW
2.1. Introduction
Due to growing concerns of climate change and global oil shortages, many are looking
to alternate means of power for transportation. These alternatives aim to reduce petrol
consumption and emissions, in the case of hybrid vehicles, or remove them completely,
in pure electric and hydrogen fuel cell vehicles.
Electric vehicles (EVs) are an appealing alternative due to their relative simplicity in
construction compared to hybrids and fuel cells. They offer a zero emission vehicle
(ZEV) solution and can be far more energy efficient than an internal combustion vehicle
(ICV). Emissions at a power station can be comparably low (compared to ICVs) due to
their efficiency or power can be sourced from renewable resources. Their main
disadvantages are their limited range and long times to recharge (NAUNIN, D., 1996).
Both of these disadvantages can be directly attributed to limitations of the batteries and
has especially been the main hurdle in the past with the then available battery
technologies. These characteristics must be improved with better battery chemistries
and manufacturing processes, and better battery management systems.
Another concern regarding electric vehicles is their safety. The issues of the chemical
and electrical hazards to vehicle operators, maintenance operators and others that may
come in contact with the vehicle such as emergency service personnel.
2.2. Literature review
EV History
The electric vehicle actually has a history as long as internal combustion vehicles with
the first vehicle appearing in 1895 (D'AGOSTINO, S., 1993). In a historical survey of
the EV, D’Agostino writes that “in the year 1900, 1575 electric automobiles were
produced versus only 936 [petrol] cars.” However by 1905 petrol vehicles were more
popular with the advent of the starter motor and availability of petrol as a cheap, high
energy-density fuel.
The article goes on to show several resurgences of the EV over the next one hundred
years based on a number of factors and states that at the time of publication, “never
before have political, economic, and environmental issues all simultaneously served to
3
strongly motivate the return of the electric vehicle – until now” (D'AGOSTINO, S.,
1993).
Battery technology
In the mid 1990s, before current battery technologies matured, the best available
batteries for an electric conversion were still lead-acid (KEOUN, B. C., 1995). This was
due to their cost and availability as other technologies existed but were not yet being
produced at a cost or volume to make them available to the average do-it-yourself
converter.
Oman (1994) writes of the emerging new battery technologies of just over a decade ago.
Compared to today, things have come a long way and one of the technologies Oman
looks at is lithium-ion but described as a new and exotic technology.
EVs have benefitted from recent rapid research and development into battery
technologies brought on by recent growth in mobile telecommunication electronics as
they share a number of requirements in a battery – high power, high energy density,
lightweight, resistant to temperature extremes, long life and low life cycle cost
(MCDOWALL, J. et al., 2001).
Numerous papers identify the lithium ion batteries for their superior characteristics.
Lithium ion battery technologies are found to be attractive for an EV application as they
have relatively high energy density compared to other chemistries, maintenance free as
they are hermetically sealed, and, with management electronics, able to operate in a
large range of temperatures, however they require battery management to realise their
full potential (BRENIER, A. et al., 2004). Adapted from the same paper, Figure 2.1
compares desirable characteristics of several battery chemistry types. It clearly shows
lithium ion as the best all-round performer, far surpassing lead-acid in all categories and
nickel-cadmium in most.

4
Figure 2.1 - Relative merits of various battery technologies – adapted from (BRENIER, A. et al., 2004)
Battery management
Despite benefitting by advances in battery chemistry and manufacture brought on by
advancing mobile electronics, battery management in electric vehicles hasn’t had such a
hand-in-hand improvement as battery usage patterns in an EV are considerably different
to most other application with requirements of both short high current bursts for
acceleration and long periods of constant load for highway driving (MASKEY, M. et

5
al., 1999). This means that battery management developed for other means such as
telecommunication don’t necessarily suit the application to EVs.
Teofilo (1997) explains how correct charging is important to achieve maximum
capacity and therefore range of the EV. Lithium ion batteries can receive 30-60% of
their capacity under ‘taper’ charging or a constant voltage stage (TEOFILO, V. L. et al.,
1997). Specialised chargers, usually microprocessor controlled, are needed that can
operate in different modes in order to maximise range.
Kroeze, R. C. Et al (2008) developed a model for batteries in the paper, “Electrical
Battery Model for Use in Dynamic Electric Vehicle Simulations.” The goal of this
model is to provide more accurate results in simulating use in an electric vehicle. Use of
models like these could be used to design and simulate better battery management
systems.
Haifeng, D et al (2006) have derived a model for better online estimation of the batteries
state of charge. Accurate models will allow for better utilisation of battery capacity.
Galdi (2006) produces a model based on fuzzy logic by which the battery management
systems can limit the vehicles performance to a degree in order to maximise the battery
life when the state of charge begins to get low. This autonomous control is shown, in
simulation, to increase the range of the simulated electric vehicle.
Currently there are limited commercially available implementations of battery
management to suit converted EVs and systems being developed by major car
manufacturers are kept in house and not available to the public. There is a great range of
different power needs in converted EVs from 120V DC to 600V AC. The EVAlbum
(CHANCEY, M., 2008) website shows many examples of privately and commercially
converted electric vehicles ranging from twelve to two hundred batteries in a single
vehicle.
Safety
Released by the Australian Government, Department of Infrastructure, Transport,
Regional Development and Local Government (2006), the National Code of Practice
(NCOP) regarding the Installation of Electric Drives in Motor Vehicles sets out a
number of standards, guidelines and recommendations for an electric vehicle. These

6
standards and guidelines must be followed in order to maintain a licensable vehicle. The
document also points to a number of Australian Design Rules that must be adhered to.
Limitations of Present Work
Much of the literature currently available revolves around mobile telecommunications
but applying many of the ideas could be a relatively simple matter of scaling up to suit.
Only in more recent years has there been a resurgence in research and advancements
that apply specifically to electric vehicles, similar to that which occurred in the early to
mid nineties.
Other than the one NCOP document, there is very little official documentation about
safe practices and safety systems in electric vehicles. More documents need to be
produced so that standards in safety can be achieved.
2.3. Project objectives
The objectives of this project cover the installation and assessment of a battery
management system, power supply, and safety and power isolation systems in the REV
Project’s Hyundai Getz converted to electric drive (see 2.4 REV Project background).
Some of the components used in the conversion had already been procured for use in
the previous year’s project. This included the motor, controller, batteries and battery
management system. However, the components had never been installed or evaluated so
little was known about how these systems would perform in practice.
The first stage of this project was to install the batteries and battery management
systems into the vehicle and evaluate it. Then a model of an ideal management system
will be derived and the real system compared to it. Suggestions shall be made for a new
battery management system that could be designed in the future to perform closer to the
ideal system.
The next stage is to look at what safety systems are required for isolating the electrical
hazards from passengers in the vehicle and person working on the vehicle, and to ensure
safe operation of the vehicle.
Lastly, power supply is looked at. This is important as there are two power rails, a range
of power requirements and devices that need to be switched on and off under certain
7
circumstances. Different conductors and insulations need to be considered for each
system’s power requirements.
2.4. REV Project background
The Renewable Energy Vehicle (REV) Project is a project involving a number of
students investigating many aspects of alternative propulsion vehicles. This year, the
Project’s focus has been on electric vehicles (EVs).
The REV Project has taken a common, cheap, internal combustion engine (ICE)
vehicle, a Hyundai Getz, and converted it to an electric drive. The converted drive
comprises a DC motor and controller, powered by a pack of lithium ion batteries. It also
uses various systems to restore original functionality to all the cars original auxiliary
systems such as power steering, brake vacuum, heating and air conditioning, which
were previously powered by the original combustion engine.
The conversion of an existing vehicle has some advantages over a completely new,
custom-designed vehicle. Firstly, it allows for a much simpler project that can be
completed in a shorter time frame, on a smaller budget. It also allows for much simpler
licensing to get the vehicle on the road, meeting the requirements of the National Code
of Practice and the Department of Planning and Infrastructure (in Western Australia).
A secondary goal of the REV Project is to raise awareness and understanding of the
technology amongst the general public. This is done through public exposure of the
technology and producing educational materials that the public can use to do their own
conversions.
8
3. BATTERY MANAGEMENT SYSTEM
3.1. Description of system
The main purpose of the battery management system (BMS) is to optimise the battery
charging process and alert the system operator (in this case, the driver) of any errors.
The BMS that was inherited from the previous year’s project, unused and untested, was
an early version of the TS90 Thunder Sky battery management system from a local
company, EV-Power Australia Pty Ltd (DILKES, R., 2008). Newer versions are much
unchanged in regards to electrics and electronics but are now mass produced, as
opposed to the handmade units shown in Figure 2.1.
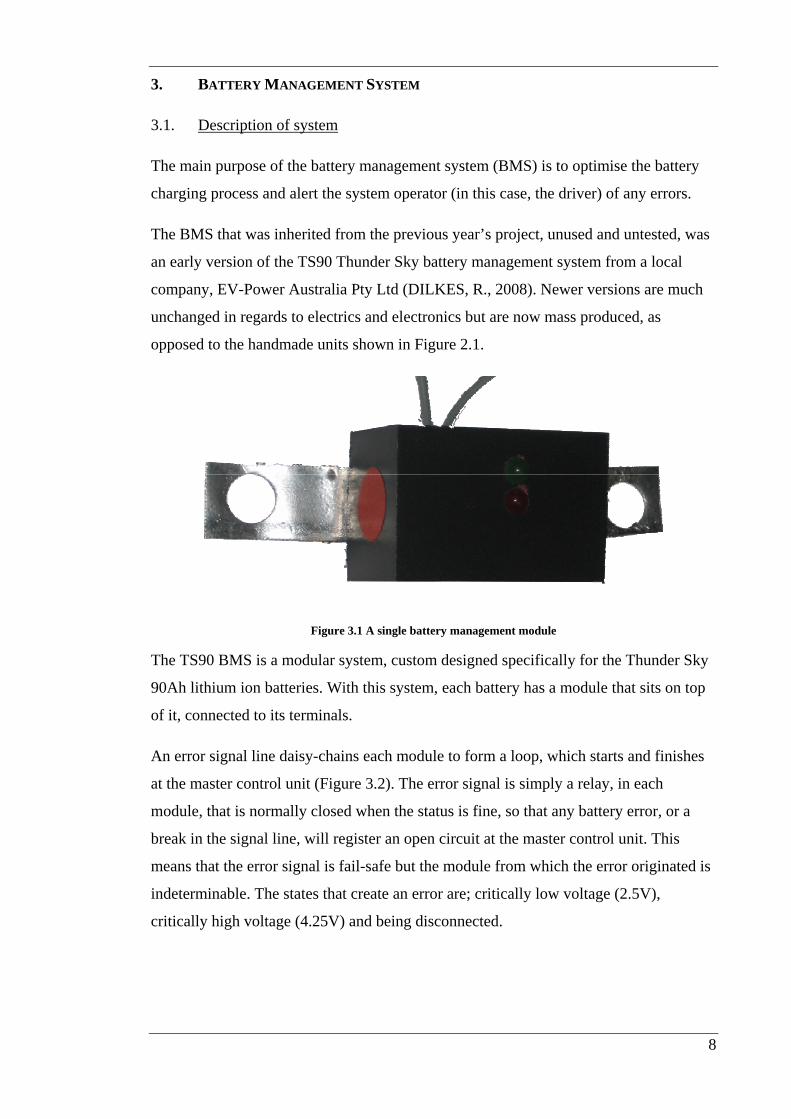
Figure 3.1 A single battery management module
The TS90 BMS is a modular system, custom designed specifically for the Thunder Sky
90Ah lithium ion batteries. With this system, each battery has a module that sits on top
of it, connected to its terminals.
An error signal line daisy-chains each module to form a loop, which starts and finishes
at the master control unit (Figure 3.2). The error signal is simply a relay, in each
module, that is normally closed when the status is fine, so that any battery error, or a
break in the signal line, will register an open circuit at the master control unit. This
means that the error signal is fail-safe but the module from which the error originated is
indeterminable. The states that create an error are; critically low voltage (2.5V),
critically high voltage (4.25V) and being disconnected.
9
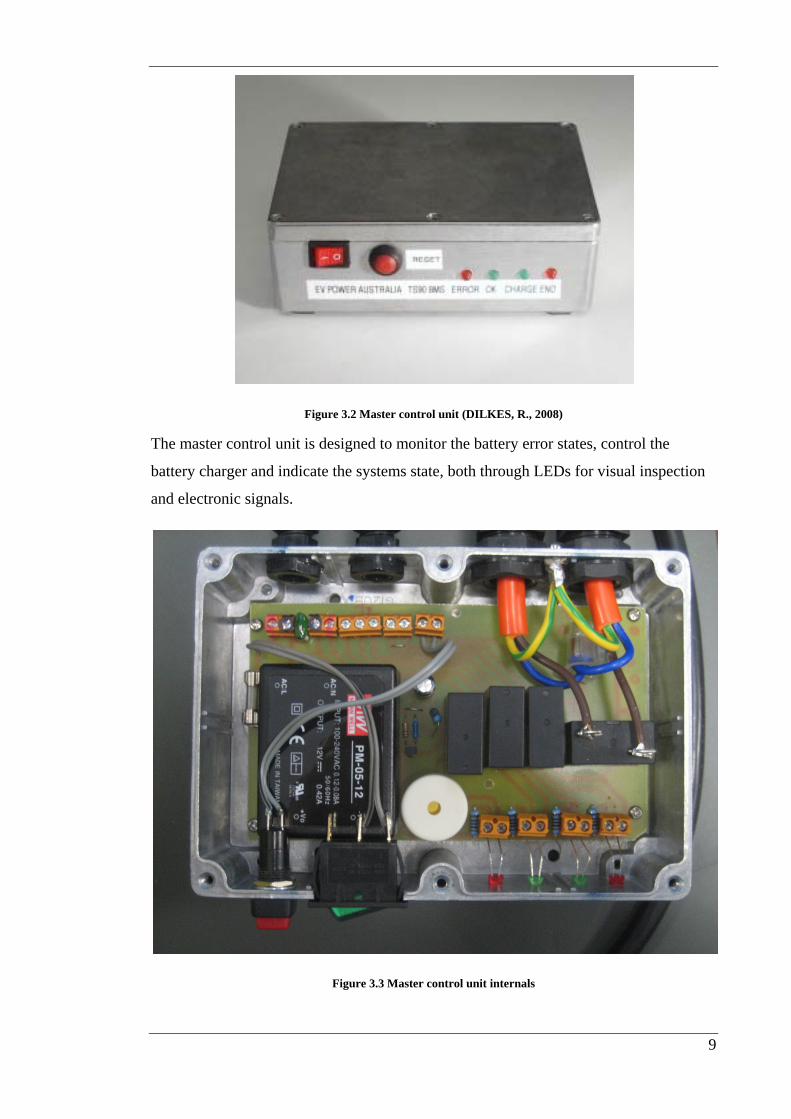
Figure 3.2 Master control unit (DILKES, R., 2008)
The master control unit is designed to monitor the battery error states, control the
battery charger and indicate the systems state, both through LEDs for visual inspection
and electronic signals.
Figure 3.3 Master control unit internals
10
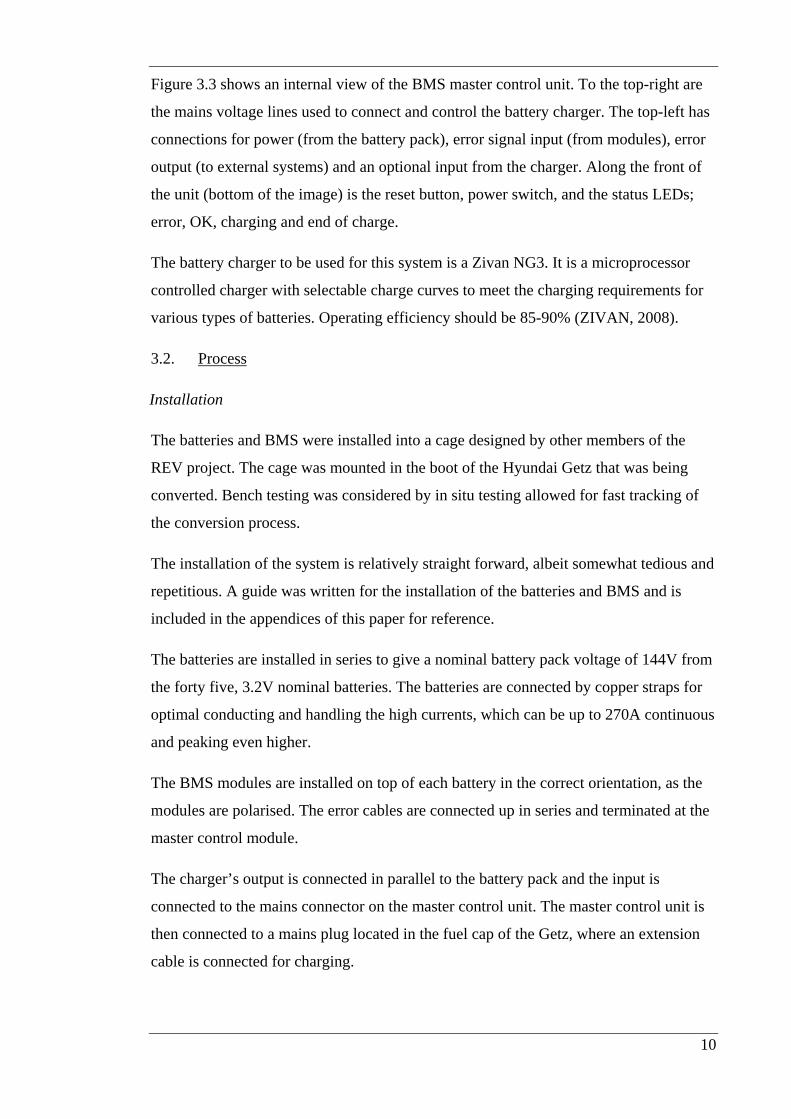
Figure 3.3 shows an internal view of the BMS master control unit. To the top-right are
the mains voltage lines used to connect and control the battery charger. The top-left has
connections for power (from the battery pack), error signal input (from modules), error
output (to external systems) and an optional input from the charger. Along the front of
the unit (bottom of the image) is the reset button, power switch, and the status LEDs;
error, OK, charging and end of charge.
The battery charger to be used for this system is a Zivan NG3. It is a microprocessor
controlled charger with selectable charge curves to meet the charging requirements for
various types of batteries. Operating efficiency should be 85-90% (ZIVAN, 2008).
3.2. Process
Installation
The batteries and BMS were installed into a cage designed by other members of the
REV project. The cage was mounted in the boot of the Hyundai Getz that was being
converted. Bench testing was considered by in situ testing allowed for fast tracking of
the conversion process.
The installation of the system is relatively straight forward, albeit somewhat tedious and
repetitious. A guide was written for the installation of the batteries and BMS and is
included in the appendices of this paper for reference.
The batteries are installed in series to give a nominal battery pack voltage of 144V from
the forty five, 3.2V nominal batteries. The batteries are connected by copper straps for
optimal conducting and handling the high currents, which can be up to 270A continuous
and peaking even higher.
The BMS modules are installed on top of each battery in the correct orientation, as the
modules are polarised. The error cables are connected up in series and terminated at the
master control module.
The charger’s output is connected in parallel to the battery pack and the input is
connected to the mains connector on the master control unit. The master control unit is
then connected to a mains plug located in the fuel cap of the Getz, where an extension
cable is connected for charging.
11
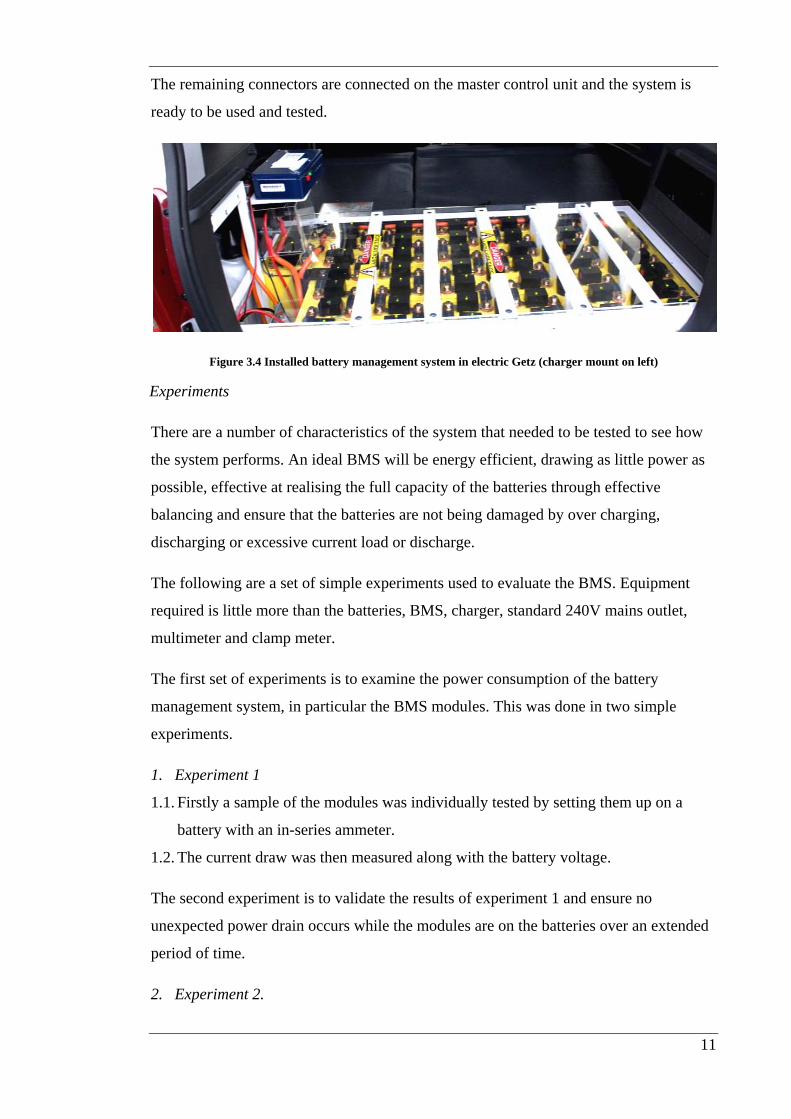
The remaining connectors are connected on the master control unit and the system is
ready to be used and tested.
Figure 3.4 Installed battery management system in electric Getz (charger mount on left)
Experiments
There are a number of characteristics of the system that needed to be tested to see how
the system performs. An ideal BMS will be energy efficient, drawing as little power as
possible, effective at realising the full capacity of the batteries through effective
balancing and ensure that the batteries are not being damaged by over charging,
discharging or excessive current load or discharge.
The following are a set of simple experiments used to evaluate the BMS. Equipment
required is little more than the batteries, BMS, charger, standard 240V mains outlet,
multimeter and clamp meter.
The first set of experiments is to examine the power consumption of the battery
management system, in particular the BMS modules. This was done in two simple
experiments.
1. Experiment 1
1.1. Firstly a sample of the modules was individually tested by setting them up on a
battery with an in-series ammeter.
1.2. The current draw was then measured along with the battery voltage.
The second experiment is to validate the results of experiment 1 and ensure no
unexpected power drain occurs while the modules are on the batteries over an extended
period of time.
2. Experiment 2.
12
2.1. With the battery management modules installed on the batteries, the voltage of each
battery is recorded over a period of two weeks.
2.2. During this time, the batteries are not charged or discharged except for the modules
and self discharge.
Next the BMS is tested to see how effective it is at balancing the batteries during
charging. The modules aid in balancing the battery pack by bypassing current over
batteries that reach a voltage of 3.9V. It is already known that the modules can bypass at
most 1A.
The charger delivers 15A during the constant current (CI) stage, the first stage of
charging. This means that batteries that are holding higher voltages will reach bypass
stage but still be receiving most of the charging current and will rapidly reach the
critical voltage of 4.25V, at which time the BMS will signal on error and the master
control unit will turn off the charger.
In the second stage of charging, constant voltage (CV), the charger never delivers much
more than 1A and often less than 1A. When the modules reach bypass in this stage of
charging they should be effective in stopping those batteries’ voltages from continuing
to rise, allowing the maximum amount of energy to be stored in the batteries.
3. Experiment 3
3.1. With batteries and BMS installed, the battery voltages were measured and the
charger was turned on to charge the batteries.
3.2. When the BMS cut off the charging process (because one or more batteries reach
critical voltage) ten minutes was given to allow voltages to settle before measuring
again.
3.3. A load was applied across the highest voltage batteries to bring their SOC down,
closer to the mean.
3.4. The experiment then repeats until the charger is able to reach CV charging without
pushing any batteries past critical voltage.
The last experiments are to test the charger itself. The efficiency of the charging unit
should be high as minimising energy waste is high on the agenda of the REV Project in
all areas.
4. Experiment 4

13
4.1. With the batteries in a SOC that allows the charger to operate in the first mode,
constant current, the charger was turned on to charge the batteries.
4.2. Using a clamp meter, the current on the mains side of the charger was measured.
4.3. At the same time, the current being delivered to the batteries, and pack voltage are
measured.
4.4. These measurements are then used to calculate the efficiency of the charger.
The charger also has to be effective in delivering the maximum charge to the batteries.
The efficacy can be measured by measuring the behaviour of the charger and comparing
it to the ideal charging pattern given by the manufacturer.
5. Experiment 5
5.1. With the batteries in a SOC that allows the charger to operate in the first mode,
constant current, the charger was turned on to charge the batteries. The batteries
also needed to be well balanced for this experiment.
5.2. Current and voltages are monitored until the charger reaches the constant voltage
mode, indicated by the change of the LED on the charger from red to orange and a
significant drop in current.
5.3. Monitoring of current and voltage continued until the current drops to zero and
charger reaches ‘end of charge’ or ‘float charging’.
14
3.3. Results and Discussion
This section covers the results of the experiments described earlier and also discusses
the characteristics of an ideal battery management system.
Measuring state of charge
State of charge is measure of how much charge is stored in the battery. This is a very
useful measure to use in to express the results. However measuring it is not
straightforward as battery voltage is not linearly proportional in relation to state of
charge.
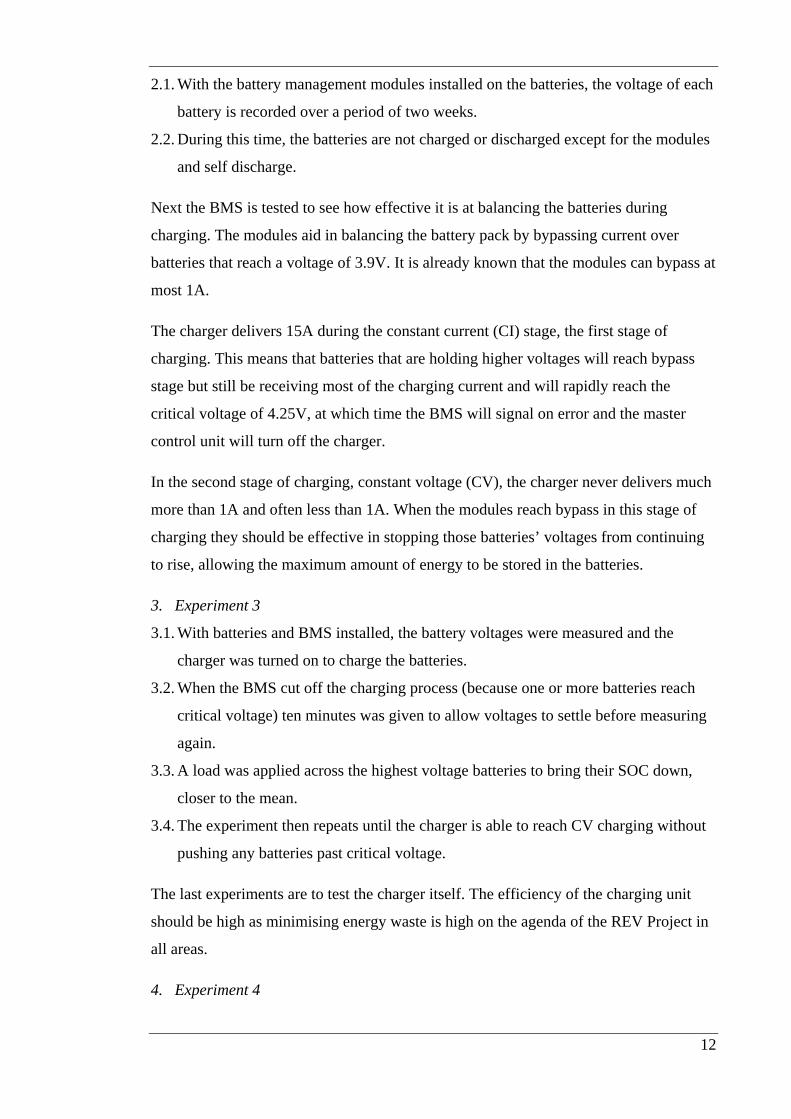
To assist in the reading of the data, equation (3.1), a sixth degree polynomial, was
derived from the manufacturer’s specifications of the batteries (THUNDER SKY, 2007)
to approximate the relationship between the battery SOC (Bpc), expressed as a
percentage, to the battery voltage (Bv). Note that this particular model is only valid
while charging as once charging has stopped battery voltages settle back down.
1.7449 10 4.6398 10 4.963 100.0027 0.0783 1.1603 3.4323
0 70
4.2 70 100(3.1)
Figure 3.5 Battery charging curve Voltage vs %SOC. Adapted from (THUNDER SKY, 2007)
Experiment 1
The current draw from all but one BMS module ranged from 18.0mA to 18.3mA, whilst
the battery was at 3.300V. The one odd module was drawing 44.2mA but was found to
be faulty so that data was ignored.
15
The measurements give a power consumption of approximately 60mW. This is
approximately the same power requirement for a single, standard, 15mcd, 5mm, green
LED such as the one that is found on the unit. This shows that the BMS modules
consume very little power and there’s little room for improvement without removing the
LED indicator.
Experiment 2
The data collected for this experiment showed that the voltage drop over time was very
small. Unfortunately it was so small that the accuracy of the actual values is limited.
The voltages were measured to accuracy of 1mV but the calculated average drop in
voltage per battery per day was 0.48mV and at times the difference between
measurements was zero. The raw data can be found in the appendices.
The accuracy of the data is however not very important in this experiment as the goal
was to show that the BMS modules consume very little power. That fact is clearly
demonstrated by the measurements.
Drop in SOC in;
one day 0.027%
one week 0.175%
one month 0.750%
one year 9.125% Table 3.1 Discharge due to BMS modules
Table 3.1 shows the predicted decrease in state of charge over various lengths of time.
The figures suggest it would take over a month to bring the state of charge down just
one percent. While the data may not be highly accurate, it’s good enough to show that
the energy consumed by the BMS modules is insignificant, especially given the most
realistic usage model of the vehicle, where it would be charged every night
Experiment 3
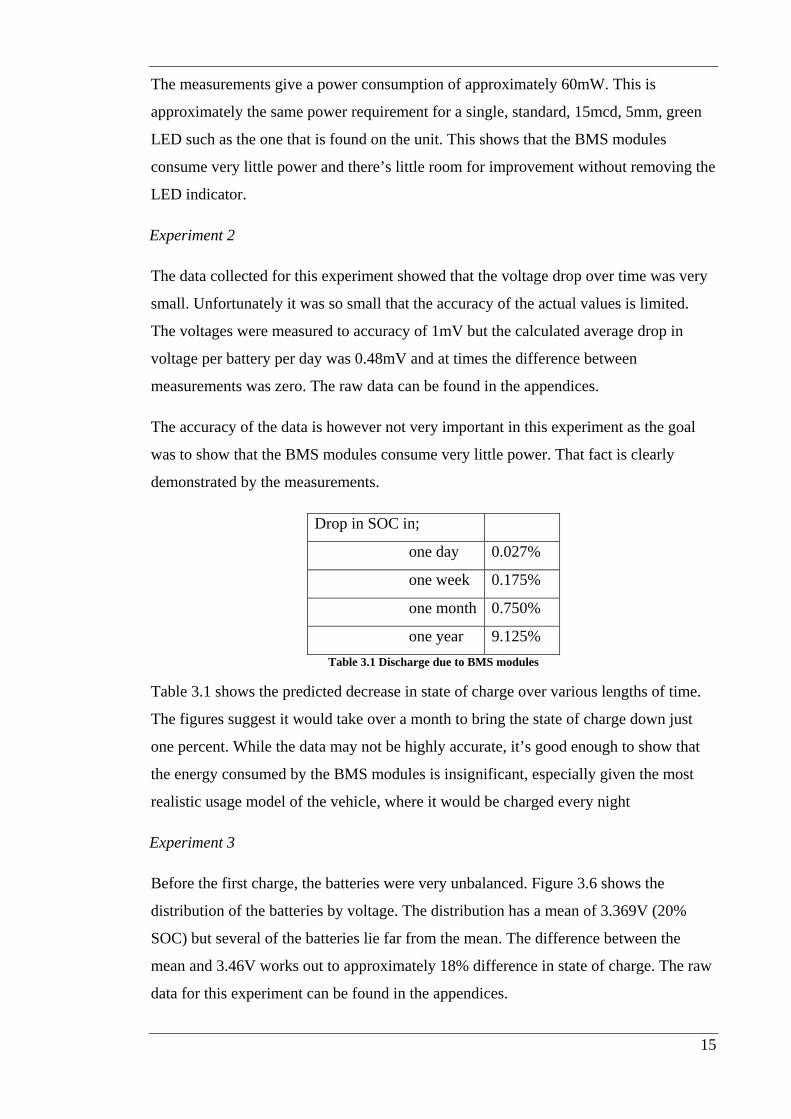
Before the first charge, the batteries were very unbalanced. Figure 3.6 shows the
distribution of the batteries by voltage. The distribution has a mean of 3.369V (20%
SOC) but several of the batteries lie far from the mean. The difference between the
mean and 3.46V works out to approximately 18% difference in state of charge. The raw
data for this experiment can be found in the appendices.
16
Figure 3.6 Initial battery voltage distribution
The first iteration of this experiment clearly demonstrated the battery management
system’s inability to deal with heavily unbalanced batteries. After charging for several
hours, the first BMS module tripped at the critical voltage and the charger stopped.
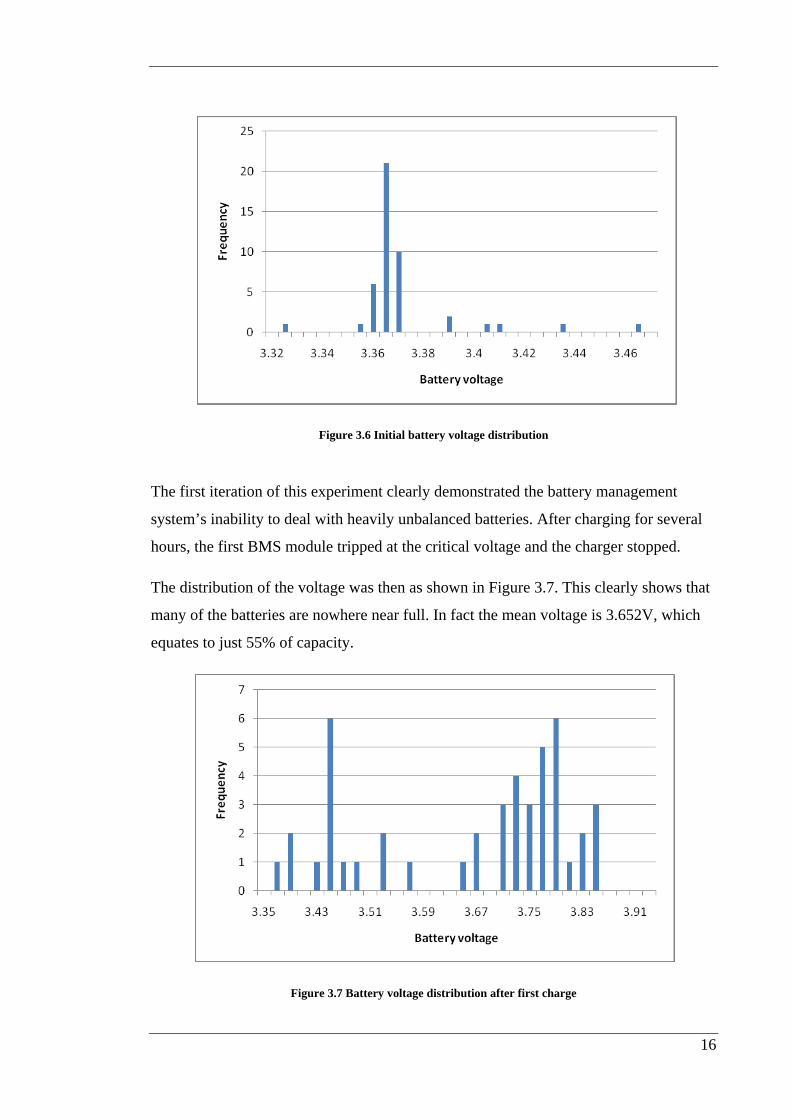
The distribution of the voltage was then as shown in Figure 3.7. This clearly shows that
many of the batteries are nowhere near full. In fact the mean voltage is 3.652V, which
equates to just 55% of capacity.
Figure 3.7 Battery voltage distribution after first charge
17
The difference in the two figures also demonstrates the effect of charging curve. In
Figure 3.6 many of the batteries seem to be closely grouped together however Figure
3.7 shows the same batteries, after just one charge to be spread apart. The relatively
small spread is deceiving as an increase of 0.1V at 3.3V is an approximately 15%
change in actual charge, whereas a change of 0.1V at 3.7V is only around 3%.
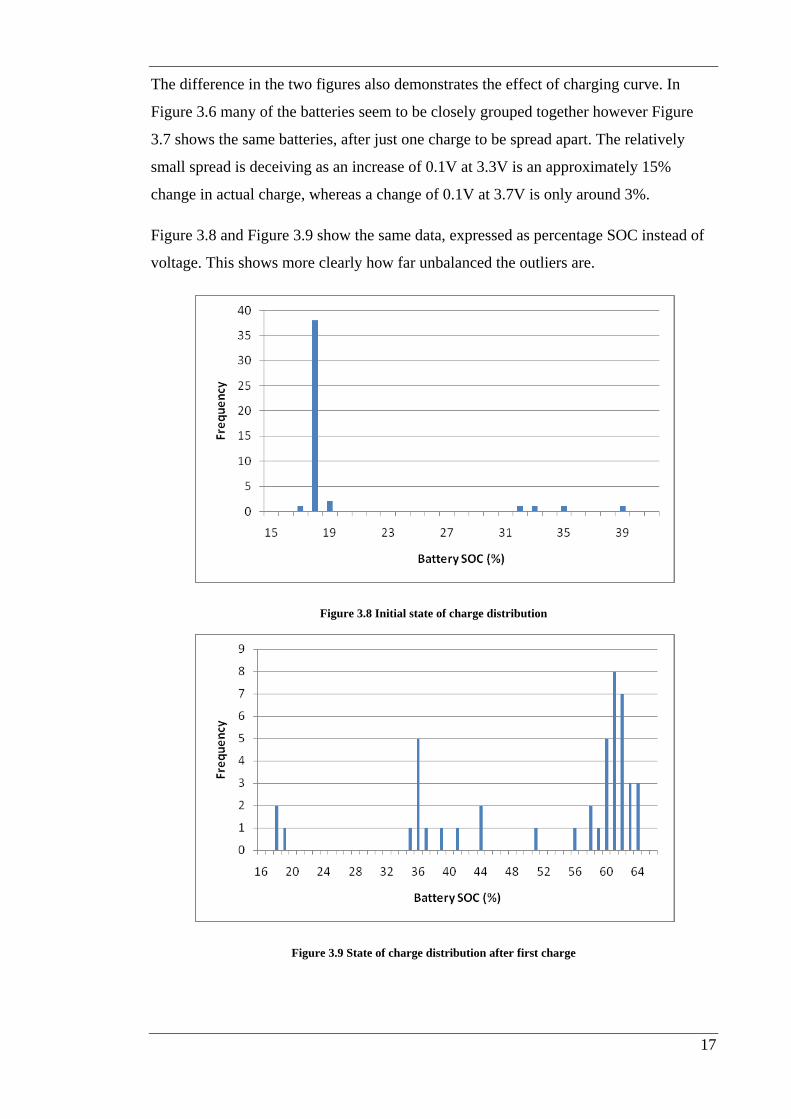
Figure 3.8 and Figure 3.9 show the same data, expressed as percentage SOC instead of
voltage. This shows more clearly how far unbalanced the outliers are.
Figure 3.8 Initial state of charge distribution
Figure 3.9 State of charge distribution after first charge
18
In order to be able to charge the batteries uninterrupted, the batteries that recorded high
voltages were drained slightly with an adjustable load. Once the highest batteries were
brought down, the batteries were measured and the experiment repeated.
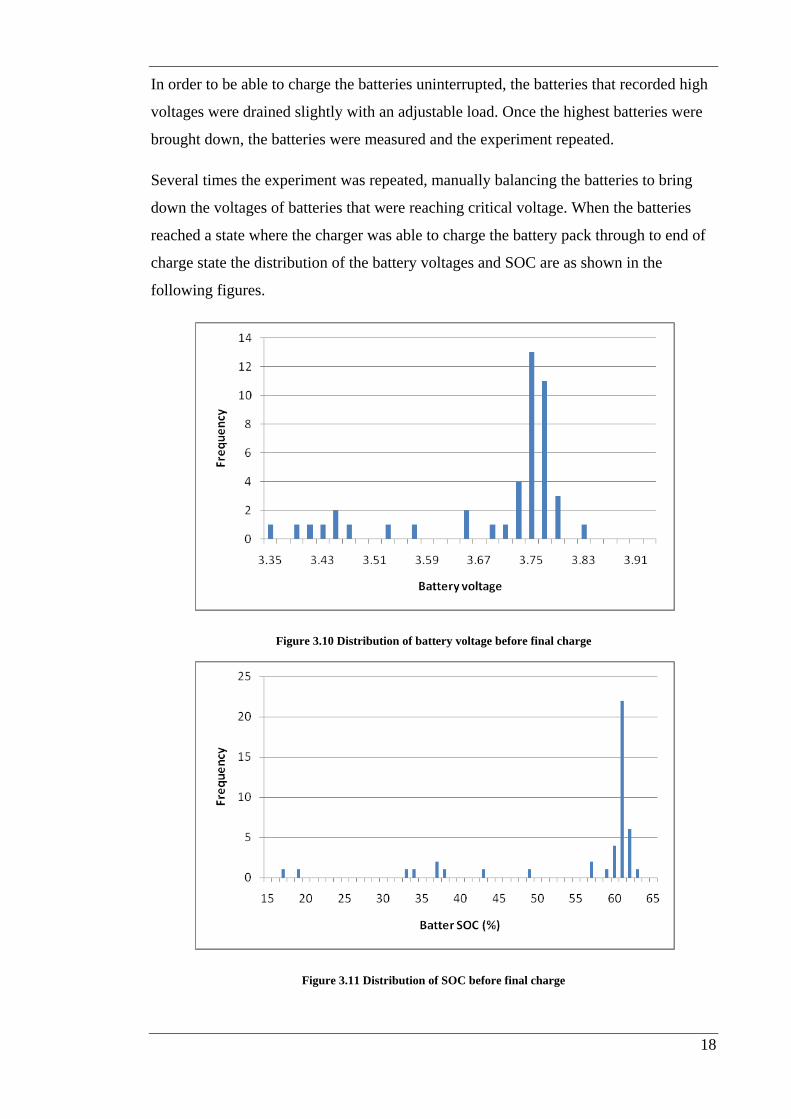
Several times the experiment was repeated, manually balancing the batteries to bring
down the voltages of batteries that were reaching critical voltage. When the batteries
reached a state where the charger was able to charge the battery pack through to end of
charge state the distribution of the battery voltages and SOC are as shown in the
following figures.
Figure 3.10 Distribution of battery voltage before final charge
Figure 3.11 Distribution of SOC before final charge
19
As can be seen in the figures, there are no more high voltage batteries, causing the
charger to stop prematurely. However, there are still many batteries with low SOC.
Further charging failed to bring all batteries up because the end of charge state was
being reached. In this state, the charger delivers nearly no current and just maintains a
constant voltage.
For a crude estimate of how unbalanced the batteries could be while still being able to
be charged effectively, the batteries’ state of charge can be modelled as being normally
distributed throughout the pack if the sample size is large and distribution is random
when they come from the factory.
If when the battery pack reaches an average of 3.75V per battery (when the charger
enters CV charging), the standard deviation of the batteries SOC is less than one half of
the difference between 3.75V and the bypass voltage, 3.9V, then 95% of the batteries
should not have reached bypass and it is likely that the charging should be able to
complete. This works out to be a standard deviation of just 2% in the state of charge.
In practice the batteries were not evenly distributed as the sample size was too small and
their original state of charge may not have been truly random. However this does help
to illustrate the limitations of the BMS as it is incapable of automatically balancing the
batteries without assistance.
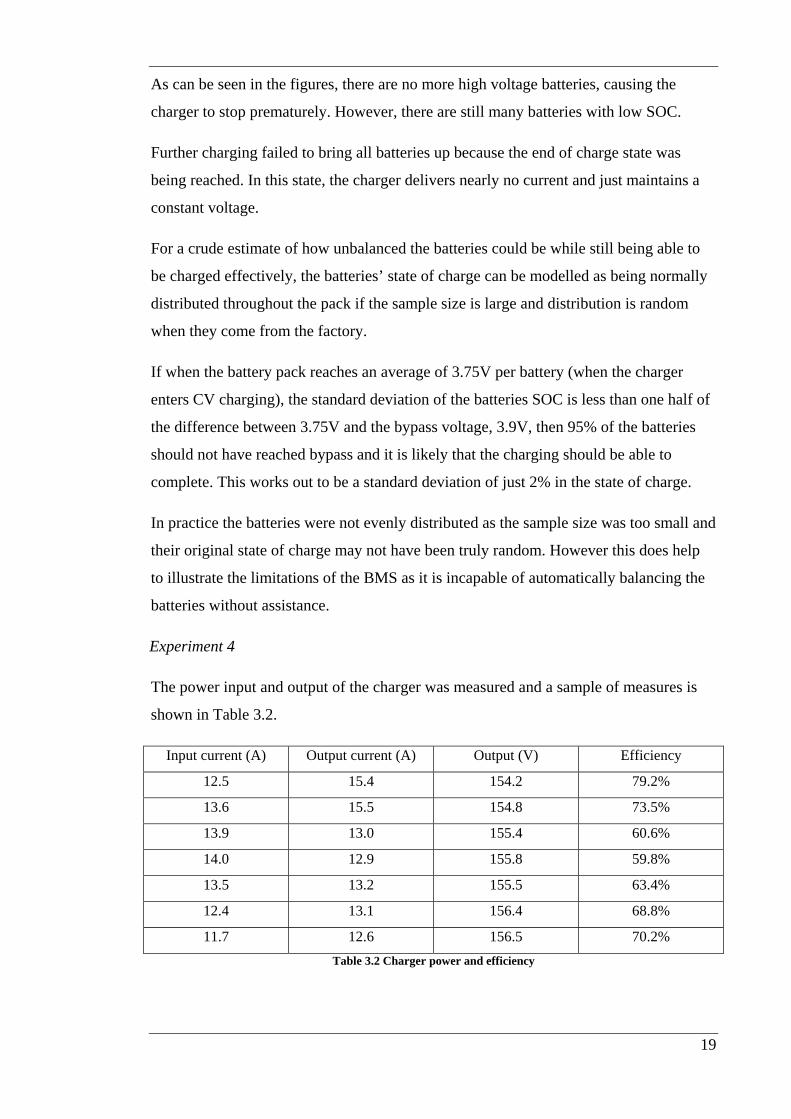
Experiment 4
The power input and output of the charger was measured and a sample of measures is
shown in Table 3.2.
Input current (A) Output current (A) Output (V) Efficiency
12.5 15.4 154.2 79.2%
13.6 15.5 154.8 73.5%
13.9 13.0 155.4 60.6%
14.0 12.9 155.8 59.8%
13.5 13.2 155.5 63.4%
12.4 13.1 156.4 68.8%
11.7 12.6 156.5 70.2% Table 3.2 Charger power and efficiency
20
The results show a rather poor efficiency, especially as the manufacturer’s claim 85-
90% efficiency (ZIVAN, 2008). However, this poor performance is likely because the
charger is working outside of its efficient range due to a modification.
A modification was made to the charger as it was decided that the vehicle was to be able
to charge its batteries from any standard Australian mains outlet (240V, 10A). The
charger was originally configured to draw up to 19A. The charger was adjusted to draw
as little power as possible, which was still not under 10A. This also had the undesirable
effect of making the charger very inefficient.
It is clear from this experiment that another charger is going to be needed to meet the
requirements.
Experiment 5
Whilst charging, the output and behaviour of the charger was monitored.
In the first stage of charging, the charger behaves in a constant current mode. The
charger supplies 15A to the batteries and the voltage increases with the state of charge.
Once the total voltage reaches 169V (3.75V per battery), the charger enters a constant
voltage stage and the current decreases gradually.
Eventually the current drops off and the charger is in an end of charge (or float charge)
mode. The charger holds a voltage of 169V to maintain the charge.
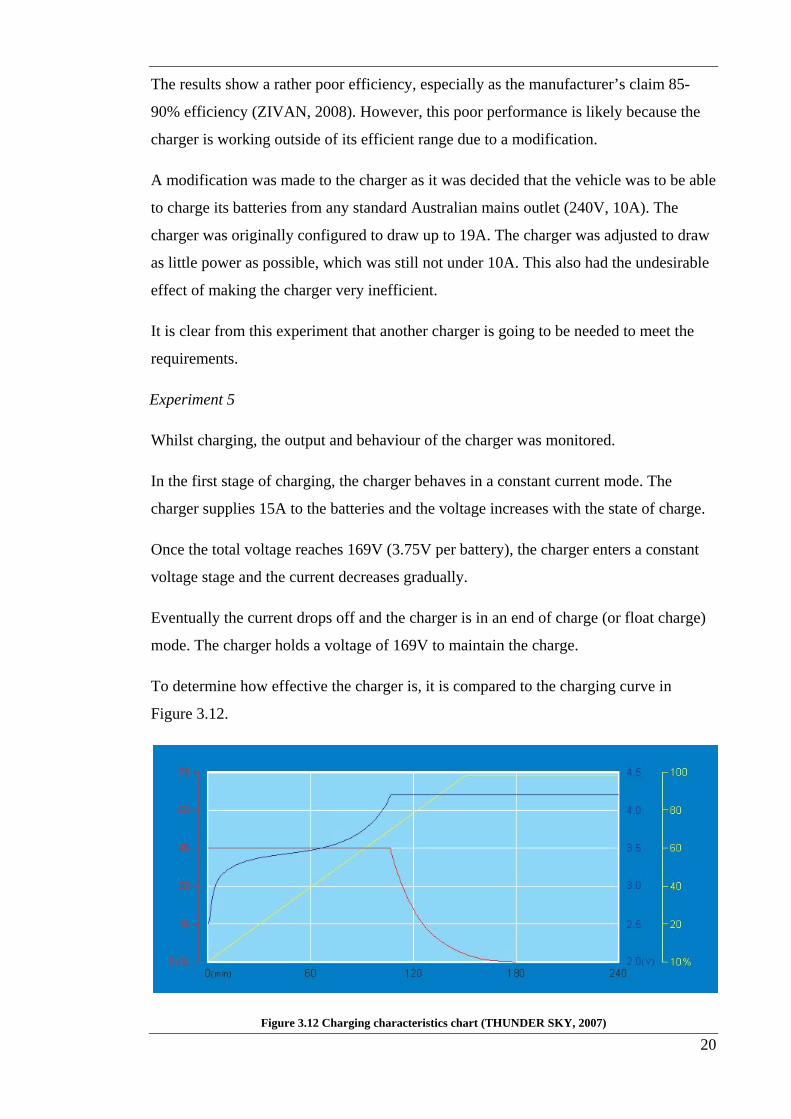
To determine how effective the charger is, it is compared to the charging curve in
Figure 3.12.
Figure 3.12 Charging characteristics chart (THUNDER SKY, 2007)

21
The charger delivers only a third of the optimal current in the constant current stage.
This is acceptable as it is a limit that has been imposed by the requirements of using
standard electrical outlets. The only sacrifice is the speed of charging.
The charger reaches constant voltage mode at 3.75V per battery. When compared to the
chart, it can be seen that some capacity may be unutilised due to this as the ideal voltage
to reach is 4.2V. This conservative charging may help in increasing the longevity of the
batteries but means that there’s 9% of the batteries’ capacity that is never used.
Ideal battery management system
In order to evaluate the BMS system, some characteristics of an ideal BMS system are
considered.
First and foremost the BMS is there to protect the batteries. Without it, lithium ion
batteries are prone to failure and short longevity. The batteries need to be protected
from over charging and over discharging.
When charging, the BMS will stop the charger if any battery reaches critical voltage.
When discharging, the modules similarly produce an error but it is up to other systems
to use that signal to stop using the batteries. This system is adequate as long as it is used
correctly.
Next, the system needs to draw the minimal amount of power. If the modules are
drawing excessive power then a nontrivial amount of the battery charge could be
constantly lost, even while the vehicle is idle.
The system installed has been shown not to draw any significant amount of power so,
on this point, it meets the ideal system.
The BMS should be able to balance the batteries. In order to do this the system needs to
be able to bypass a larger current (up to 15A) during charging or put the batteries in
parallel during charging.
The system has been shown to only be able to balance batteries that are slightly out of
balance. The 1A limit on the bypass is a significant deficiency.
The charging needs to be high in efficacy and efficiency both to store the maximum amount of charge in the batteries and waste as little energy as possible.

22
The charger has been shown to be quite unsatisfactory in this particular system. Due to artificial limits imposed upon it, it is unable to operate efficiently. The conservative charging voltages also mean that not all of the capacity of the batteries is utilised.
An ideal, but more complex system would be able to measure and log the voltages and states of the batteries. This would be especially helpful in the laboratory environment where measurements are required to be made frequently. This would also allow monitoring of the voltages while under load and driving.
Currently, the system has nothing in place for monitoring.
Compared to the ideal BMS the TS90 system comes up short. However it has succeeded to meet a number of criteria and is certainly adequate for the task. When paired with a more appropriate charger unit, the system would be considered better.

23
4. SAFETY SYSTEMS
4.1. Process
Safety is an important consideration in this project due to the potential hazards. Extra
care must be taken as the vehicle is not limited to a controlled environment such as a
laboratory but is to be taken out onto public roads where conditions and events are not
always able to be controlled.
This section of this paper covers the specification, design and implementation of safety
systems to isolate the battery voltage the rest of the vehicle in an emergency situation
and from the motor circuit when hazards are present.
Specification
The main guide for the specification of these systems comes from the National Code of
Practice for Light Vehicle Construction and Modification (2006). The first specification
is for the master contactor. “A master switch for isolating the power supply to the motor
and its control apparatus must be located within easy reach of the driver. The master
switch must isolate all electrical connections to the power source.” Also “[safety
equipment] must be supplied in preference to the traction circuit” (DEPARTMENT OF
INFRASTRUCTURE, TRANSPORT, REGIONAL DEVELOPMENT AND LOCAL
GOVERNMENT, 2006). So under any failure or power shortage the system must still
supply power to the safety equipment such as lights, windscreen wipers and brakes.
Due to the many systems involved in the vehicle, a number of conditions need to be met
before the vehicle is rendered safe to drive. These conditions will need to be met before
power is made available to the controller and motor circuit. The main conditions
considered are;
• Charging cable disconnected
• Brake assist vacuum pump functioning satisfactorily
• Key in and in and turned to ‘on’ position (ignition signal)
• Accelerator pedal engaged (microswitch on the throttle pot box)
• Inertia switch reset (cuts power in case of a crash)

24
As the care shall be installed with Eyebot microcontroller (BRAUNL, T., 2008) for
logging purposes, the errors need to be sent to the Eyebot as well. The Eyebot can take a
digital signal up to 5V on the digital IO.
All safety systems should be simple, fault tolerant and failsafe.
Design
The first system is the primary contactor. In order to isolate the batteries from all other
systems, a high voltage, high current rated, two-pole contactor with mechanical
actuation is to be installed in the cabin. The actuator is a large, red, emergency stop
button.
Consideration was given as to the location as it needed to be visible, simple to access by
the driver and be connected to the main power rail without adding electrical hazard to
the cabin.
The optimal location was found to be in a panel in the centre console, next to the
cigarette lighter plug. This allowed for ease of access and the cables can be routed up
through the floor without too much trouble. It is also easily visible for anyone attending
the vehicle in the event of an accident.
As it is required to maintain power to safety systems at all times, the 12V battery must
remain installed to supply these systems even when the main power supply is isolated.
A secondary contactor is installed to cut power to the traction circuit (controller and
motor) until all the previously mentioned conditions are met. The contactor has a single
input so a system is needed to read the signals from several systems and output a single
logical (high/low) 12V signal. The errors also need to be input to the Eyebot
microcontroller.
As the error signals are all simple switches and relays, they are simple to use. The only
exception to this is the ignition signal, which is just a 12V signal. Most of the error
sensors provide two or three wires to connect to. These are a common line, a normally
closed line, and, in some, also a normally open line. To utilise the error signals, 12V is
applied to a common line and the signal is taken from the normally closed (closed
circuit when error is not present, open circuit for error). This gives a 12V logical high as
a ‘system okay’ or safe signal.

25
As the Eyebot cannot handle 12V on the digital IO, a solution is required to provide the
error signals at a lower voltage. Voltage divider circuits could have been used but
instead, a simple and novel error relay box was designed as it provides a simple solution
for both enabling the secondary contactor and relaying the errors to the Eyebot
microcontroller.
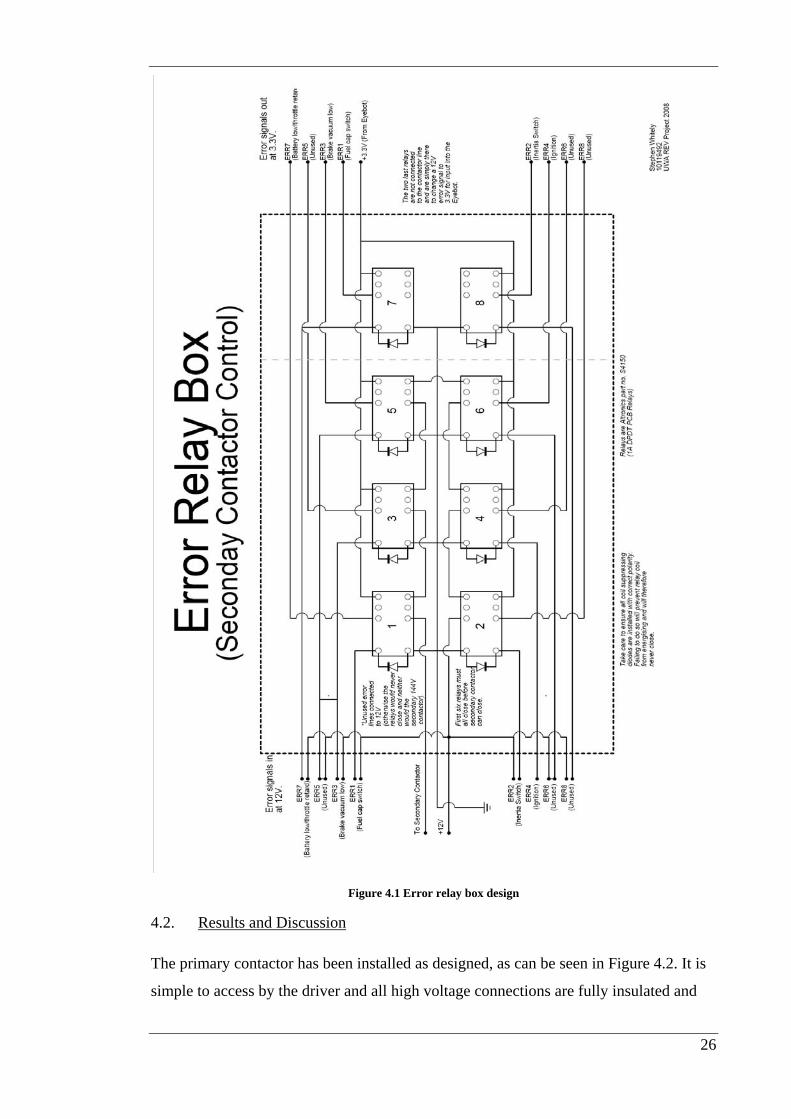
The design can be seen in Figure 4.1 and is based on a group of double pole, double
throw (DPDT) relays.
The DPDT relays allow two isolated circuits to be controlled by the same error signal.
Six of the relays are used to control the secondary contactor. The other two are for non-
vital errors.
The first pole of the first six relays is connected in series, with 12V on one end and a
line to the contactor on the other. This is used to enable the secondary contactor. Only
when all six relays close will the contactor close. Unused error signals are connected to
power to close those relays.
The second pole of the relays has one side connected to a line that goes to an output
from the Eyebot controller kept at a logical high (3.3V or 5V) and the other side
connects back to the Eyebot’s digital inputs.
The design is fail safe as if any signal wire is broken, it will be open circuit and be
treated as an error, disallowing the contactor to close.
26
Figure 4.1 Error relay box design
4.2. Results and Discussion
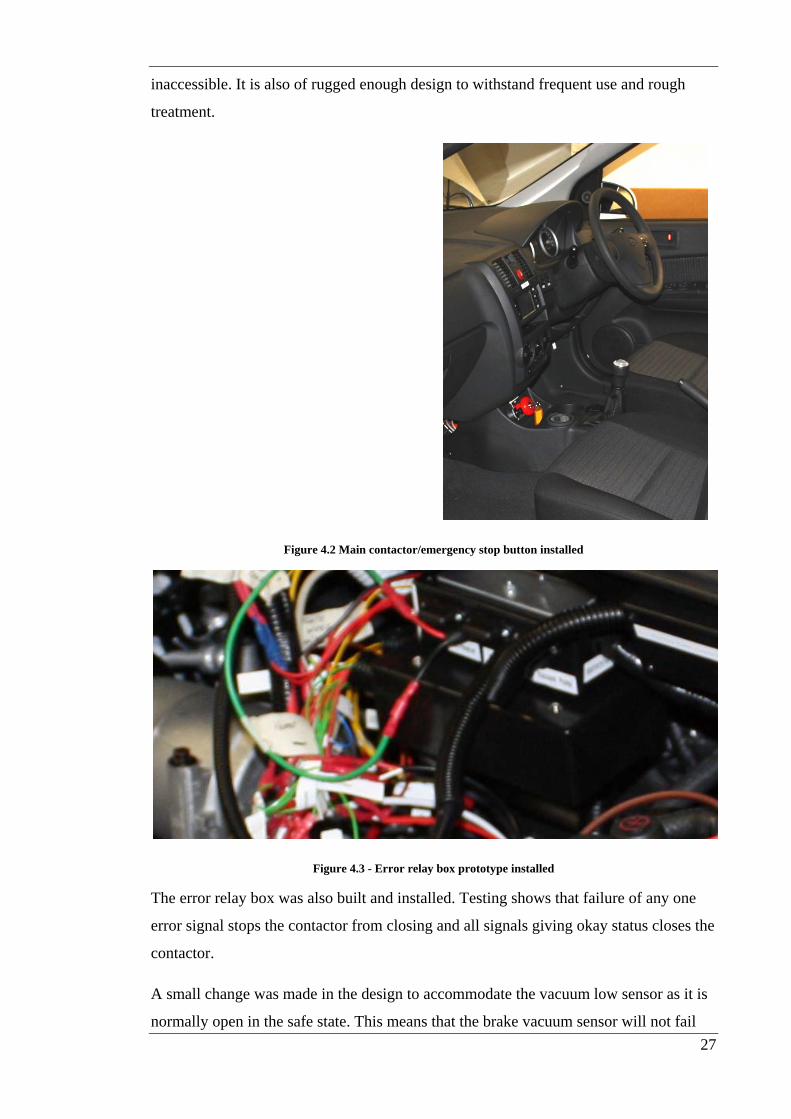
The primary contactor has been installed as designed, as can be seen in Figure 4.2. It is
simple to access by the driver and all high voltage connections are fully insulated and
27
inaccessible. It is also of rugged enough design to withstand frequent use and rough
treatment.
Figure 4.2 Main contactor/emergency stop button installed
Figure 4.3 - Error relay box prototype installed
The error relay box was also built and installed. Testing shows that failure of any one
error signal stops the contactor from closing and all signals giving okay status closes the
contactor.
A small change was made in the design to accommodate the vacuum low sensor as it is
normally open in the safe state. This means that the brake vacuum sensor will not fail

28
safely if there is a wire disconnected. This will have to be a temporary fix until an
appropriate replacement sensor can be sourced.
In its current state, the error relay box is likely to fail after some time due to the many
weak connections in it. By design, any failure is only going to prevent the vehicle from
running and not present a safety risk. As a prototype and a proof of concept it works but
a better built version will be required in the near future.
Extra relays were designed into the box with the foresight that extra sensors would be
added in the future. Some suggested sensors include some to protect the motor such as
an over-rev error for when the motor may be spinning too fast when no load is applied,
or a neutral gear sensor to prevent the motor from being run unloaded.
29
5. POWER SUPPLY
5.1. Process
The issue of power supply can first be looked at in regards to each system with three
factors;
• What voltage does it require?
• How much current can it draw? (Peak? Constant?)
• When should it be turned on?
Once these questions are answered for each system in the vehicle, an organised
approach to arranging the power management can be achieved.
All the main systems in the vehicle run on either the high voltage rail (144V) from the
batteries, or the original 12V rail. All the pre-existing systems in the vehicle are already
wired, fused and switched, so no changes need to be made with those systems.
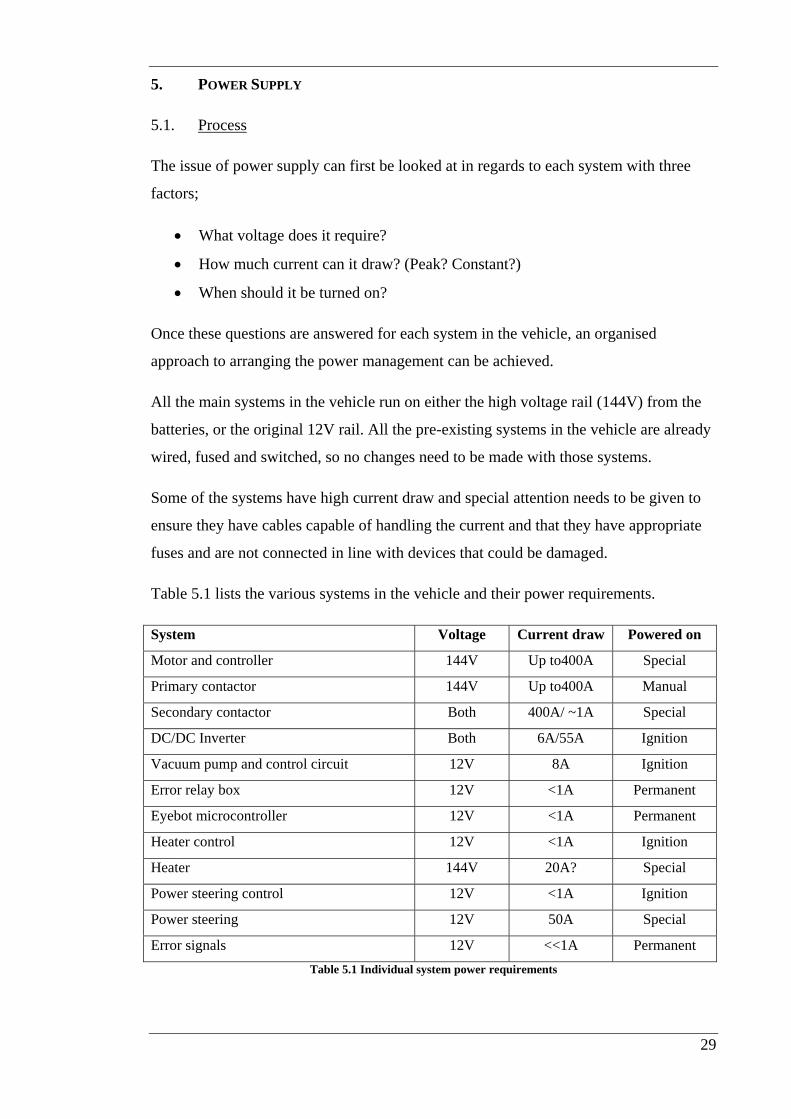
Some of the systems have high current draw and special attention needs to be given to
ensure they have cables capable of handling the current and that they have appropriate
fuses and are not connected in line with devices that could be damaged.
Table 5.1 lists the various systems in the vehicle and their power requirements.
System Voltage Current draw Powered on
Motor and controller 144V Up to400A Special
Primary contactor 144V Up to400A Manual
Secondary contactor Both 400A/ ~1A Special
DC/DC Inverter Both 6A/55A Ignition
Vacuum pump and control circuit 12V 8A Ignition
Error relay box 12V <1A Permanent
Eyebot microcontroller 12V <1A Permanent
Heater control 12V <1A Ignition
Heater 144V 20A? Special
Power steering control 12V <1A Ignition
Power steering 12V 50A Special
Error signals 12V <<1A Permanent Table 5.1 Individual system power requirements

30
Once this information is known for each system, an organised plan can be made on how
to connect all the systems to power. For example, several 12V systems only require
power when the ignition is turned on. To simplify the design, the vacuum pump, heater
control and power steering control can all be turned on with a single relay.
From the table, cable requirements can be considered. All cables in the system can use
one of the following classes of cables
• High voltage, very high current – 50mm2 welding cable, up to 500A, 150A
continuous
• High voltage, high current – 8AG, 50A
• High voltage, low current – standard 10A
• Low voltage, high current - 8AG, 50A
• Low voltage, moderate current – standard 10A
• Low voltage, low current – standard hook-up, 1A
Note that some cable is suitable for more than one class. Light gauge, multi-cored
cables are also suitable for signal wires that do not need to carry much current, however
terminal connections must be strong and protection from mechanical wear must be
considered.
Armed with this information, a schematic can be drawn up of the electrical systems.
Figure 5.1 shows the systems, contactors, relays and fuses. It shows how systems will
be connected up to common nodes in the system. The schematic does not, however, take
into account the physical location of components and is not an actual physical wiring
diagram.
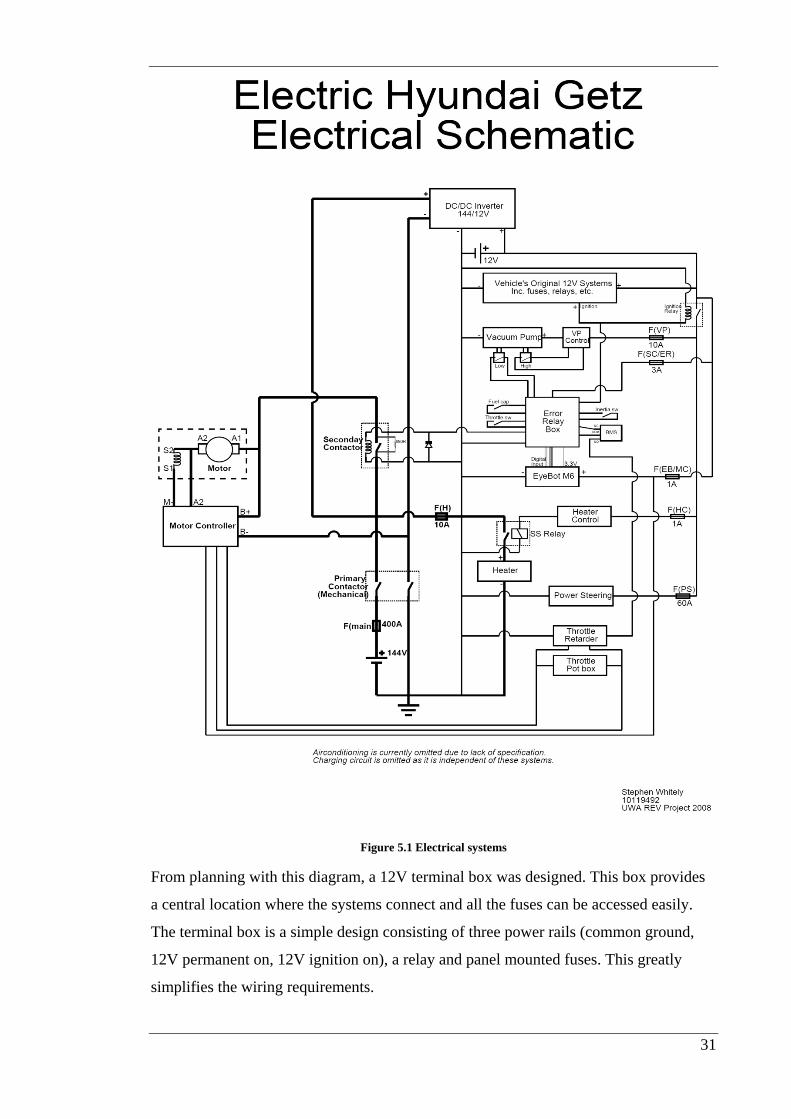
31
Figure 5.1 Electrical systems
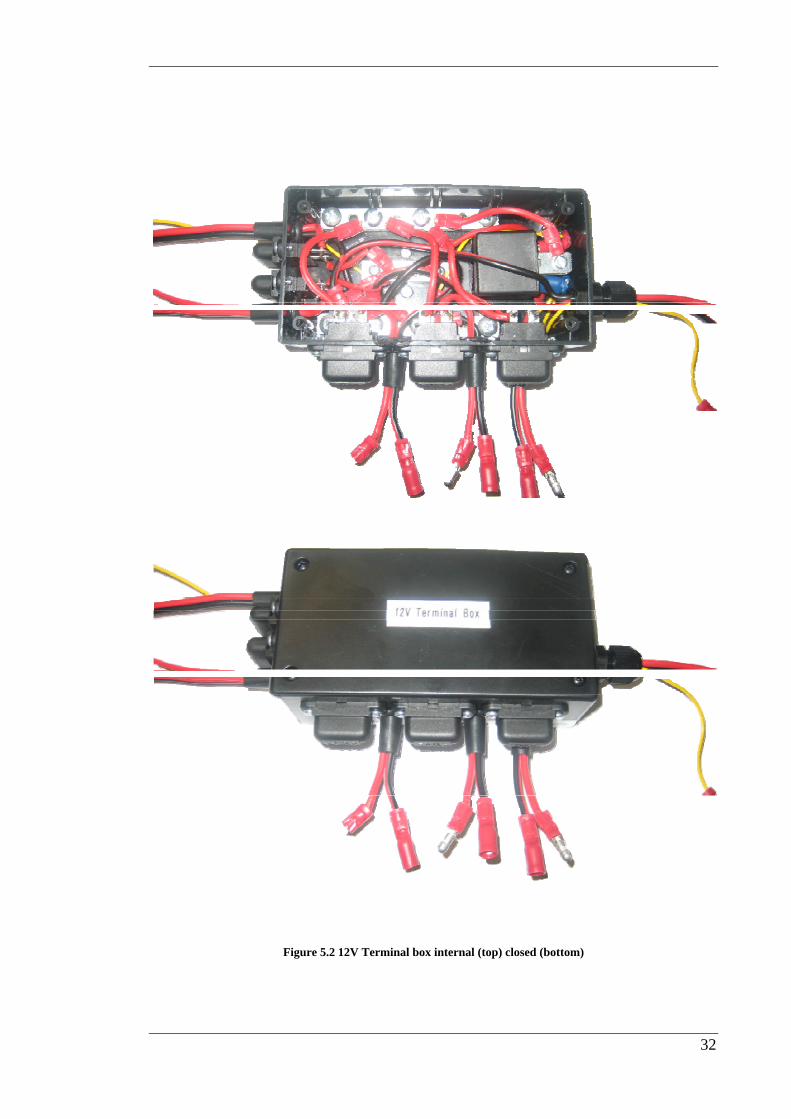
From planning with this diagram, a 12V terminal box was designed. This box provides
a central location where the systems connect and all the fuses can be accessed easily.
The terminal box is a simple design consisting of three power rails (common ground,
12V permanent on, 12V ignition on), a relay and panel mounted fuses. This greatly
simplifies the wiring requirements.
32
Figure 5.2 12V Terminal box internal (top) closed (bottom)
33
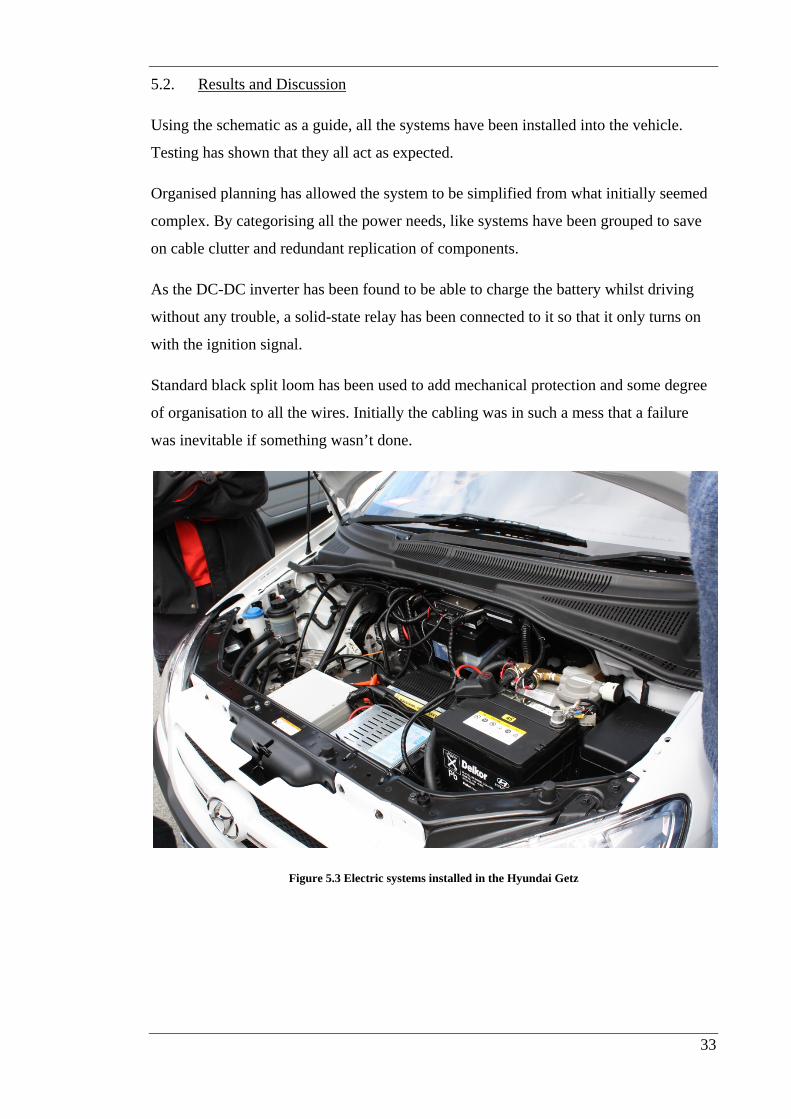
5.2. Results and Discussion
Using the schematic as a guide, all the systems have been installed into the vehicle.
Testing has shown that they all act as expected.
Organised planning has allowed the system to be simplified from what initially seemed
complex. By categorising all the power needs, like systems have been grouped to save
on cable clutter and redundant replication of components.
As the DC-DC inverter has been found to be able to charge the battery whilst driving
without any trouble, a solid-state relay has been connected to it so that it only turns on
with the ignition signal.
Standard black split loom has been used to add mechanical protection and some degree
of organisation to all the wires. Initially the cabling was in such a mess that a failure
was inevitable if something wasn’t done.
Figure 5.3 Electric systems installed in the Hyundai Getz

34
6. CONCLUSIONS AND FUTURE WORK
6.1. Conclusions
At the time of writing, the EV Getz had only just been licensed for legal road use. As
such only limited tests were conducted on discharging the batteries and no full cycles
have been achieved. In the near future full range and battery cycle tests shall be carried
out.
As it stands, the Renewable Energy Vehicle Project has been a success thus far in
getting a working electric vehicle on the road that can be shown at expos and trade
shows.
The current battery management system was found to be mostly adequate once manual
balancing was achieved. In order to complete the balancing, each battery was charged
up to 3.9V individually with a power supply. As a one of process, this is acceptable but
having to do this regularly would be unacceptable. Since then the batteries have
remained balanced but more testing with discharging full cycles is needed.
The only real concern would be to find a more appropriate charger so that the vehicle
can be charged at any standard mains outlet and with better efficiency. It is
recommended that this be replaced as it does not meet a number of the criteria set down
by the REV Project.
The safety systems installed in the vehicle provide protection from high current and
dangerous voltages, and ensure safe operation of the vehicle. The systems are fail-safe
and designed with room for expansion of extra sensors. The quality of the build on the
error relay box is, however, somewhat lacking and could lead to an unnecessary failure
of the system.
The power supply part of the project was also completed successfully with all systems
onboard the electric Getz able to function properly in a relatively organised system.
Most importantly, the organisation makes troubleshooting much easier as the fuses are
all centrally located and systems can easily be connected and disconnected.
All up, the project can be considered a successful and productive one. The project goals
were met and the REV Project goal or releasing the converted electric vehicle has been
realised.
35
6.2. Future work
There are many tasks to be considered for future work in the REV Project. Next year the
group will begin work on converting a Lotus Elise to electric drive. Many things that
have been studied this year will come into use with that project and many new issues
will arise.
With regards to the battery management systems, much more testing needs to be done
with the batteries being put through full discharge cycles and seeing how they cope
under load and how they handle the voltage drop under heavy current draw.
There is already a new battery management system being developed outside of the
University based on some of the findings and recommendations found during this study.
When they are ready, they can be tested. Alternatively, the REV Project could develop
its own system for use in the vehicles they convert.
As safety is one of the most important factors in a project like this, it is important to
continue to identify and assess hazards.
One potential hazard is the limitation of the isolation from the 144V source. Whilst
operating the vehicle this is not a concern as it can be adequately isolated but when
working on the batteries in the vehicle, there is an unavoidable exposure to the live
144V source with the current design. A design to split the pack into easily isolatable,
safe packs, without direct contact, could improve the safety to those working on the
vehicle.
Now that the error relay box has been proven to work, it needs to be rebuilt as the
current prototype is messy and not as rugged as it needs to be. The design would be
simple to implement etched on to a two-sided PCB and this would allow the removal of
many of the fragile wire connections that could potentially fail.
A formal wiring diagram is required for the vehicle. This would include the physical layout of the cables, full documentation of all connectors, wiring colour schemes and guides, troubleshooting guides for maintenance, and more. This would also be an opportunity to better organise the wiring that is currently installed and implement a proper wiring colour scheme so that maintenance would be much easier.
This is just the suggestions that arose from the areas covered in this paper. The REV Project as a whole has a lot future work ahead of it and as it continues to move forward, the scope of the group will grow and advance on to many new fields.
36
7. REFERENCES
BRAUNL, T. 2008. Eyebot - Online Documentation. [online]. [Accessed 1 November
2008]. Available form World Wide Web: <http://robotics.ee.uwa.edu.au/eyebot/>
BRENIER, A., J. MCDOWALL, and C. MORIN. 2004. A new approach to the
qualification of lithium-based battery systems. 26th Annual International
Telecommunications Energy Conference, 2004., pp.12-18.
CALWELL, C. and P. OSTENDORP. 2005. 80 plus: a strategy for reducing the
inherent environmental impacts of computers. Proceedings of the 2005 IEEE
International Symposium on Electronics and the Environment., pp.151-156.
CHANCEY, M. 2008. EV Photo Album: Our Electic Cars on the Web. [online].
[Accessed 21 October 2008]. Available form World Wide Web:
<http://www.evalbum.com/>
D'AGOSTINO, S. 1993. The electric car. Potentials, IEEE. 12(1), pp.28-32.
DEPARTMENT OF INFRASTRUCTURE, TRANSPORT, REGIONAL
DEVELOPMENT AND LOCAL GOVERNMENT. 2006. Vehicle Standards Bulletin
12, National Code of Practice for Light Vehicle Constructions and Modification,
National Guidelines for the Installation of Electric Drives in Motor Vehicles. Australia:
Australian Government.
DILKES, R. 2008. EV Power - Australian Electric Vehicle Specialists — EV Power -
Australian Electric Vehicles sells Electric Bikes and car conversions, Electric Bicycles,
Electric Vehicles, Conversion Kits. [online]. [Accessed 4 October 2008]. Available
form World Wide Web: <http://ev-power.com.au/-Thundersky-Battery-Balancing-
System-.html>
ELIAS, M. F. M., K. M. NOR, N. A. RAHIM, and A. K. AROF. 2003. Lithium-ion
battery charger for high energy appplication. Proceedings, National Power Engineering
Conference, 2003., pp.283-288.
GALDI, V., A. PICCOLO, and P. SIANO. 2006. A Fuzzy Based Safe Power
Management Algorithm for Energy Storage Systems in Electric Vehicles. In: Vehicle
Power and Propulsion Conference, 2006, 2006. IEEE, pp.1-6.
37
HAIFENG, D., W. XUEZHE, and S. ZECHANG. 2006. Online SOC Estimation of
High-power Lithium-ion Batteries Used on HEVs. In: Vehicular Electronics and Safety,
2006. Conference on, 2006. IEEE, pp.342-347.
KEOUN, B. C. 1995. Designing an electric vehicle conversion. In: Southcon/95.
Conference Record, 1995., pp.303-308.
KROEZE, R. C. and P. T. KREIN. 2008. Electrical battery model for use in dynamic
electric vehicle simulations. In: Power Electronics Specialists Conference, 2008, 2008.
IEEE, pp.1336-1342.
MASKEY, M., M. PARTEN, D. VINES, and T. MAXWELL. 1999. An intelligent
battery management system for electric and hybrid electric vehicles. IEEE 49th
Vehicular Technology Conference. 2, pp.1389-1391.
MCDOWALL, J., A. BRENIER, G. CHAGNON, and J. P. CITTANOVA. 2001. High
power lithium ion batteries for a changing telecommunications world. In:
Telecommunications Energy Conference, 2001. INTELEC 2001. Twenty-Third
International, 2001., pp.187-191.
MOORE, S. W. and G. MACLEAN. 2001. Control and Management Strategies for the
Delphi High Power Lithium Battery. 18th International Electric Vehicle Symposium
(EVS18), Berlin, Germany. October 2001.
MOORE, S. W. and P. J. SCHNIEDER. 2001. A Review of Cell Equalization Methods
for Lithium Ion and Lithium Polymer Battery Systems. SAE 2001 World Congress
Technical Papers.
NAUNIN, D. 1996. Electric Vehicles. Industrial Electronics, 1996. ISIE '96.,
Proceedings of the IEEE International Symposium on. 1, pp.11-24.
OMAN, H. 1994. New electric-vehicle batteries. In: Northcon/94 Conference Record,
1994., pp.326-330.
TEOFILO, V. L., L. V. MERRITT, and R. P. HOLLANDSWORTH. 1997. Advanced
lithium ion battery charger. Aerospace and Electronic Systems Magazine, IEEE. 12(11),
pp.30-36.
THUNDER SKY. 2007. Thunder Sky Lithium-Ion Power Battery Specifications.
Thunder Sky Energy Group Limited.

38
ZIVAN. 2008. Zivan NG3 Battery Charger. [online]. [Accessed 15 September 2008].
Available form World Wide Web:
<http://www.zivanusa.com/NG3BatteryCharger.htm>

39
8. APPENDICES
8.1. Data from experiment 2
Date 30‐May 5‐Jun 6‐Jun 9‐Jun 13‐JunTime 10:00 12:00 10:00 15:00 9:30
Battery # 13 3.317 3.311 3.310 3.309 3.30814 3.316 3.309 3.308 3.307 3.30615 3.317 3.305 3.308 3.308 3.30816 3.313 3.305 3.305 3.303 3.30117 3.317 3.311 3.311 3.310 3.30918 3.315 3.309 3.309 3.308 3.30719 3.315 3.310 3.310 3.308 3.30720 3.318 3.311 3.310 3.309 3.30821 3.315 3.309 3.309 3.307 3.30622 3.317 3.310 3.310 3.309 3.30823 3.319 3.312 3.312 3.311 3.31024 3.316 3.312 3.311 3.310 3.30925 3.316 3.311 3.311 3.310 3.30926 3.317 3.312 3.312 3.311 3.30927 3.319 3.313 3.312 3.311 3.31028 3.319 3.313 3.312 3.311 3.30929 3.317 3.310 3.309 3.308 3.30730 3.318 3.312 3.312 3.311 3.31031 3.317 3.312 3.311 3.310 3.30932 3.317 3.311 3.311 3.310 3.30933 3.314 3.306 3.306 3.304 3.30234 3.319 3.312 3.312 3.311 3.31035 3.318 3.312 3.312 3.311 3.30936 3.306 3.304 3.304 3.304 3.30337 3.317 3.312 3.312 3.310 3.30938 3.309 3.307 3.307 3.307 3.30639 3.316 3.310 3.310 3.306 3.30740 3.317 3.311 3.310 3.309 3.30841 3.316 3.309 3.309 3.307 3.30642 3.317 3.310 3.310 3.308 3.30743 3.316 3.311 3.311 3.310 3.30944 3.313 3.309 3.309 3.308 3.30745 3.317 3.311 3.311 3.310 3.30946 3.318 3.312 3.311 3.310 3.30947 3.318 3.312 3.311 3.310 3.30948 3.318 3.311 3.310 3.309 3.30849 3.315 3.309 3.309 3.307 3.30650 3.313 3.309 3.309 3.308 3.30751 3.316 3.310 3.310 3.308 3.30752 3.319 3.311 3.311 3.310 3.30953 3.319 3.313 3.312 3.311 3.31054 3.319 3.312 3.311 3.310 3.30955 3.317 3.311 3.311 3.310 3.30956 3.317 3.311 3.311 3.310 3.30957 3.316 3.311 3.310 3.309 3.308
Avg. 3.316 3.310 3.310 3.309 3.308

40
8.2. Data from experiment 3
8.3. Safe Installation Guide for Batteries
This guide is included as a reference for future members of the REV Project. It is a
guide to installing the batteries and battery management systems, specific to the
Hyundai Getz electric conversion, 2008.
08‐Jul 08‐Jul 09‐Jul 09‐Jul 11‐Jul 14‐Jul 15‐Jul 21‐Jul 22‐Jul 24‐Jul 25‐Jul11:30 15:30 12:00 15:45 11:00 11:30 12:00 11:00 11:00 11:00 11:00
13 3.367 3.781 3.404 3.790 3.389 3.357 3.791 3.395 3.374 3.747 3.43014 3.363 3.754 3.390 3.774 3.380 3.353 3.778 3.389 3.039 3.741 3.42215 3.364 3.695 3.390 3.754 3.382 3.356 3.756 3.393 3.373 3.733 3.42516 3.357 3.436 3.363 3.425 3.357 3.349 3.399 3.359 3.353 3.317 3.37517 3.367 3.779 3.412 3.796 3.397 3.359 3.797 3.401 3.378 3.755 3.44518 3.365 3.757 3.395 3.769 3.382 3.355 3.770 3.389 3.370 3.732 3.42019 3.366 3.747 3.395 3.762 3.383 3.355 3.756 3.391 3.372 3.725 3.42120 3.364 3.569 3.387 3.672 3.379 3.356 3.693 3.390 3.372 3.689 3.42221 3.362 3.514 3.381 3.569 3.372 3.353 3.613 3.380 3.366 3.642 3.41122 3.365 3.730 3.394 3.771 3.386 3.356 3.778 3.395 3.374 3.743 3.43123 3.361 3.485 3.380 3.524 3.374 3.355 3.541 3.383 3.369 3.557 3.41424 3.360 3.424 3.368 3.417 3.364 3.352 3.411 3.369 3.361 3.416 3.42025 3.365 3.720 3.403 3.781 3.397 3.360 3.789 3.404 3.381 3.751 3.44926 3.367 3.783 3.418 3.799 3.403 3.362 3.799 3.408 3.383 3.762 3.46227 3.361 3.466 3.378 3.497 3.374 3.354 3.577 3.386 3.371 3.648 3.41528 3.410 3.837 3.496 3.774 3.398 3.359 3.808 3.399 3.378 3.758 3.44029 3.363 3.723 3.387 3.756 3.378 3.354 3.757 3.387 3.368 3.729 3.41730 3.388 3.829 3.494 3.626 3.397 3.361 3.793 3.424 3.390 3.820 3.64431 3.367 3.754 3.411 3.789 3.399 3.361 3.792 3.406 3.382 3.754 3.45232 3.365 3.661 3.396 3.749 3.387 3.358 3.762 3.398 3.377 3.741 3.43433 3.324 3.352 3.326 3.345 3.319 3.311 3.329 3.337 3.355 3.383 3.41534 3.405 3.829 3.485 3.749 3.396 3.360 3.802 3.399 3.378 3.755 3.43535 3.361 3.440 3.375 3.446 3.371 3.355 3.446 3.378 3.367 3.461 3.42036 3.354 3.371 3.357 3.367 3.353 3.349 3.362 3.353 3.351 3.410 3.40537 3.359 3.432 3.370 3.433 3.366 3.352 3.432 3.373 3.363 3.445 3.41638 3.357 3.381 3.359 3.374 3.354 3.350 3.367 3.354 3.378 3.444 3.40639 3.365 3.763 3.397 3.789 3.386 3.356 3.785 3.394 3.373 3.748 3.43140 3.463 3.848 3.568 3.805 3.409 3.361 3.818 3.404 3.379 3.764 3.45641 3.361 3.706 3.383 3.738 3.376 3.353 3.738 3.384 3.367 3.717 3.41142 3.364 3.734 3.392 3.763 3.381 3.354 3.773 3.389 3.370 3.738 3.42143 3.362 3.513 3.383 3.597 3.379 3.356 3.676 3.393 3.375 3.702 3.42944 3.360 3.437 3.369 3.432 3.364 3.352 3.420 3.368 3.404 3.754 3.43745 3.370 3.781 3.414 3.787 3.399 3.361 3.790 3.404 3.381 3.750 3.44446 3.388 3.801 3.434 3.773 3.394 3.357 3.805 3.395 3.375 3.756 3.43347 3.364 3.659 3.393 3.762 3.388 3.358 3.781 3.398 3.376 3.750 3.44048 3.365 3.759 3.398 3.780 3.388 3.357 3.785 3.395 3.374 3.746 3.43149 3.363 3.708 3.390 3.743 3.379 3.354 3.753 3.387 3.368 3.730 3.41650 3.361 3.436 3.371 3.432 3.367 3.353 3.424 3.371 3.409 3.745 3.44151 3.367 3.742 3.410 3.766 3.389 3.356 3.788 3.393 3.371 3.749 3.43152 3.431 3.843 3.514 3.814 3.408 3.361 3.817 3.403 3.378 3.770 3.45853 3.360 3.442 3.373 3.448 3.369 3.353 3.467 3.379 3.368 3.511 3.41254 3.366 3.776 3.415 3.792 3.399 3.360 3.798 3.402 3.379 3.755 3.44955 3.367 3.778 3.419 3.794 3.402 3.361 3.802 3.408 3.382 3.772 3.47656 3.366 3.636 3.396 3.739 3.391 3.360 3.774 3.407 3.388 3.777 3.48557 3.364 3.719 3.397 3.777 3.389 3.357 3.789 3.397 3.375 3.771 3.437
Average 3.369 3.652 3.403 3.668 3.382 3.355 3.682 3.389 3.367 3.681 3.435StDev 0.0214 0.1566 0.0445 0.1559 0.0170 0.0076 0.1609 0.0167 0.0511 0.1298 0.0374Min 3.324 3.352 3.326 3.345 3.319 3.311 3.329 3.337 3.039 3.317 3.375Max 3.463 3.848 3.568 3.814 3.409 3.362 3.818 3.424 3.409 3.82 3.644Spread 0.139 0.496 0.242 0.469 0.090 0.051 0.489 0.087 0.370 0.503 0.269

41
Instruction and Safety Guide on the Installation of Batteries in the Hyundai Getz EV
Stephen Whitely 10119492
This is a guide to assist in the safe and efficient installation of the batteries into the vehicle. It should be remembered at all times that you are working with potentially dangerous voltages and very high current, and as such all precaution should be taken. Shorting the batteries could cause irreparable damage to both the batteries and your person. It is advised that the installation of the batteries be done with at least one other person present. Any connection at a higher voltage (greater than 30V) should be done by, or under supervision, a technician or other qualified electrician.
1. Before you begin check that you have all the components; • 45 Thundersky Li‐Ion 90Ah batteries, • 45 battery management modules, • 44 copper connecting straps • 90 bolts, flat washers and spring washers You will also need some tools; • open end spanner M8 • ring spanner M8 • if available, a torque wrench It is advised that you insulate all metal tools to avoid shorting across the batteries. This can simply be done by wrapping the tool in electrical tape or other insulator for the length of the tool.
2. First test the batteries. This can be done with a multimeter or with the battery management modules. To test with the battery management modules the end of the module with the red circle goes on the positive terminal of the battery (indicated by a red circle around the terminal) and the other end goes onto the negative terminal. When properly connected to the battery the module should light up its green LED. If the red LED lights up then the battery is giving a low voltage. This could be because of a problem with the battery or simply a low state of charge. Any batteries that fail should be checked and tested before continuing.
3. Install the battery cage and check that the bolts are all correctly tightened. The charger and the mounting space of the battery management etc. should be on the left hand side of the car, near the fuel cap. Check that the power cables and any other wiring are situated such that they will still be accessible after the batteries are installed. Ensure that the floor of the battery cage is in place.

42
4. Install the Zivan charger before the batteries as the mounting bolts will be difficult to access after the batteries are installed. It should be installed so that the terminals for charging are facing upwards.
5. For ease of installation, the left and right‐most ‘columns’ of batteries should be installed first as they are under an overhanging lip on the cage. Likewise, it may be simpler to install the top and bottom batteries of each ‘column’ before filling the column. Extreme care should be taken when installing the batteries to avoiding shorting the terminals on the cage. Have the positive terminal insulated with tape whilst installing the batteries. It is also suggested to insulate the cage along the top edges where contact may be likely. Install the two ‘columns’ of batteries as shown in Error! Reference source not found.. Important – take note of the numbering and orientation of the batteries. The numbers shown in the figure represent the last two digits of the serial number printed on the battery. Keeping them in order will make testing and documentation much simpler. The ‘+’ and ‘‐’ signs on the batteries indicate the positive and negative terminals. The positive terminals are indicated by a red ring around the terminal. Incorrect orientation and connection could lead to battery damage – make sure they are laid out as in the figures.
Figure 1 ‐ First batteries to install. Note battery numbering and orientation
6. Should there be any movement when the batteries are packed in, a sheet of rubber or similar can be installed along the wall to pack the batteries tight. This will avoid vibration that could lead to physical wear of the batteries.
7. Install the remaining batteries into the cage as shown in Error! Reference source not found. remembering to take care in noting numbering and orientation and avoid shorting the terminals on the cage.
+ 13 ‐ + 19 ‐
‐ 20 + ‐ 26 +
+ 27 ‐ + 33 ‐
‐ 39 +
+ 45 ‐
‐ 51 +
+ 57 ‐

43
Figure 2 ‐Install remaining batteries
8. The next step is to install the battery management modules and some, not all, of the
copper connecting straps. Again, the idea is to work in columns, as in Error! Reference source not found.. This makes each of the larger columns approximately 24V and relatively safe. The components should be stacked on the terminals in the following order, from bottom (first) to top (last); • battery management module • copper connecting strap • flat washer •spring washer • bolt Remember that the end of the battery module with the red circle goes on the positive terminal of the battery (indicated by a red circle around the terminal) and the other end goes onto the negative terminal. The module should light up green. If the module lights up red, remove the battery and test it before continuing. The small leads on the modules do not have to be connected at this stage but if they are not then they should be insulated to avoid damage to the modules. Install only the copper connecting straps indicated in Error! Reference source not found.. Be very careful not to short any batteries by dropping the connecting straps across the terminals of a battery. The bolt should be tightened just enough to flatten the spring washer. If a torque wrench is available, do one bolt up to the desired tension then set the torque wrench to that tension and use it to tighten the others. Some may be difficult to reach so use an open end spanner.
+ 13 ‐ + 14 ‐ + 15 ‐ + 16 ‐ + 17 ‐ + 18 ‐ + 19 ‐
‐ 20 + ‐ 21 + ‐ 22 + ‐ 23 + ‐ 24 + ‐ 25 + ‐ 26 +
+ 27 ‐ + 28 ‐ + 29 ‐ + 30 ‐ + 31 ‐ + 32 ‐ + 33 ‐
‐ 34 + ‐ 35 + ‐ 36 + ‐ 37 + ‐ 38 + ‐ 39 +
+ 40 ‐ + 41 ‐ + 42 ‐ + 43 ‐ + 44 ‐ + 45 ‐
‐ 46 + ‐ 47 + ‐ 48 + ‐ 49 + ‐ 50 + ‐ 51 +
+ 52 ‐ + 53 ‐ + 54 ‐ + 55 ‐ + 56 ‐ + 57 ‐

44
Figure 3 ‐Connect only the straps indicated first
The next step required the supervision of a technician as it involves hazardous voltage. After inspection, have the technician, or under technician supervision, attach the remaining copper connecting straps. Once connected there will be 144V so care should be taken.
9. Ensure the cables are open circuit (disengage safety/remove fuse) and install the power leads and charging leads. The positive (red) cables should be connected to positive terminal on battery ’27, on the left hand side. The negative or ground (black) cables should be connected to the negative terminal on battery ’19, in the forward right hand corner.
10. Finally, if not already connected, join the battery management module leads in series and install and connect the battery management box.
11. Connect up the charger and battery management. Installation is now complete. The batteries are now ready to receive their first charge.
+ 13 ‐ + 14 ‐ + 15 ‐ + 16 ‐ + 17 ‐ + 18 ‐ + 19 ‐
‐ 20 + ‐ 21 + ‐ 22 + ‐ 23 + ‐ 24 + ‐ 25 + ‐ 26 +
+ 27 ‐ + 28 ‐ + 29 ‐ + 30 ‐ + 31 ‐ + 32 ‐ + 33 ‐
‐ 34 + ‐ 35 + ‐ 36 + ‐ 37 + ‐ 38 + ‐ 39 +
+ 40 ‐ + 41 ‐ + 42 ‐ + 43 ‐ + 44 ‐ + 45 ‐
‐ 46 + ‐ 47 + ‐ 48 + ‐ 49 + ‐ 50 + ‐ 51 +
+ 52 ‐ + 53 ‐ + 54 ‐ + 55 ‐ + 56 ‐ + 57 ‐

45