Embed Size (px)
Citation preview
Bayesian Modelling of HealthcareResource Use in MultinationalRandomized Clinical TrialsAline Gauthier,1 Andrea Manca2 and Susan Anton 3
1 i3 Innovus, Uxbridge, UK
2 Centre for Health Economics, University of York, York, UK
3 Boehringer-Ingelheim Pharmaceuticals Inc., Ridgefield, Connecticut, USA
Abstract Background: Most cost-effectiveness analyses conducted alongside multi-
national randomized clinical trials (RCT) are carried out applying the unit
costs from the country of interest to trial-wide resource use items with the
objective of estimating total healthcare costs by treatment group. However,
this approach could confound ‘price effects’ with ‘country effects’. An alter-
native approach is to use multilevel modelling techniques to analyse health-
care resource use (HCRU) from the trial, and obtain country-specific total
costs by applying country-specific unit costs to corresponding shrinkage es-
timates of differential HCRU.
Methods: To illustrate the feasibility of this approach, we analysed data from
twin multinational RCTs, which enrolled approximately 2000 individuals
into three treatment arms for the management of patients with chronic re-
spiratory disease. The models were implemented using Bayesian multilevel
models, to reflect the hierarchical structure of the data while controlling for
co-variates at the patient and country level.
Results: This analysis showed that directly modelling the level of HCRU is a
promising approach to facilitate cost-effectiveness analyses conducted
alongside multinational RCTs, offering several advantages compared with
the modelling of direct costs.
Conclusions: It is argued that modelling the level of HCRUwithin the Bayesian
framework avoids confounding the price effects with the country effects and
facilitates the estimation of costs for several countries represented in the trial.
Background
Multinational randomized clinical trials(RCTs) are increasingly used as a vehicle to con-duct economic evaluation,[1] but these analyses
raise a number of methodological challenges,which are not always recognized. Estimation ofcosts for RCT-based cost-effectiveness analysis(CEA) is frequently carried out by applying theunit costs from the country of interest to each item
ORIGINAL RESEARCH ARTICLEPharmacoeconomics 2009; 27 (12): 1017-1029
1170-7690/09/0012-1017/$49.95/0
ª 2009 Adis Data Information BV. All rights reserved.
of resource use in the overall trial, with the objec-tive of estimating the total healthcare costs of eachstrategy being compared.[2] It has been argued thatthese ‘pooled’ estimates might not be applicable tothe jurisdiction of interest, as between-countryvariation in factors such as clinical practice, avail-ability of healthcare resource and organization ofhealthcare system are not taken into account, eventhough such factors might be expected to affect thecost effectiveness of the intervention.[3,4] To ad-dress this problem, multilevel modelling (MLM)has been proposed as a method to explicitly qu-antify between-country variability while adjustingfor both patient- and country-specific factors, thusfacilitating quantification of country-specific esti-mates of cost effectiveness.[4-10] The introduction ofpatient and country-level co-variates in the modelis intended to help explain some of the between-country variability observed in the data.
It should be noted that one of the most im-portant factors that could explain between-countryvariation in cost effectiveness usually remains un-addressed. Between-country differences in the re-lative prices of the resources used in the process ofcare are expected to determine the volume of re-source use and the way various factors are com-bined locally to treat a patient. The application of asingle vector of unit costs to trial-wide resource usetherefore risks confounding the ‘country effect’with the ‘price effect’.
The question of which are the most appropriateunit costs to use in cost analysis of multinationaldatasets remains unresolved. Wordsworth andLudbrook[11] investigated different approaches forcomparing cost data across countries. After show-ing that the use of exchange rate and publishedpurchasing power parities (PPP) failed to reflectthe between-country variability, they proposed atechnology-specific PPP that provides a more ro-bust basis for international comparisons. In an al-ternative approach, Jonsson and Weinstein[12]
moved away from the issue of which unit cost touse. They argued thatmultinational data should beanalysed assuming the control arm in the trial re-flects country-specific level of healthcare resourceuse (HCRU) in standard practice and suggestedcalculating the pooled proportional difference inresource use across all countries, and then applying
this proportional reduction to country-specificbaseline resource use.
In this article, we use the concept advanced byJonsson and Weinstein[12] and propose to focusdirectly on the level of resource use – rather thantotal costs – using MLM techniques. This alter-native approach offers several advantages com-pared with the univariate modelling of totalhealthcare costs. First, modelling homogeneousendpoints has the potential to provide a better fitto the data in that it removes the need to apply acommon vector of unit costs to resource usefrom different countries, therefore removing thepotential risk of ‘price confounding’. Second, thisanalysis provides information on the mix of re-source use and their underlying empirical re-lationship, which is not available when modellingtotal direct costs. Third, because adjusted meanlevels of resource use can be estimated for allcountries represented in the trial, direct costs canbe derived for each country of interest by apply-ing the relevant set of unit costs to each vector ofcountry-specific resource use estimates.
This article aims to assess the feasibility ofmodelling HCRU data within the context of mul-tinational multicentre RCTs and how to obtaincountry-specific estimates of differential HCRU.
Development of Multilevel Modelsfor Healthcare Resource Use
The structure of MLMs and their applicationin CEA have been previously described.[2,3,6-9,13]
This section provides a brief description of thetechniques used to model count data within thecontext of HCRU modelling and their extensionto MLM to account for the hierarchical structureof the multinational data.
Models for Count Data
Levels of resource use are often a mix of count(e.g. number of GP visits) and continuous data(e.g. study drug in milligrams) with excess zeros,making standard statistical methods based onconditional Normality (e.g. ordinary leastsquares of the dependent variable) inappropriateto analyse such data.[14]
1018 Gauthier et al.
ª 2009 Adis Data Information BV. All rights reserved. Pharmacoeconomics 2009; 27 (12)
An alternative formulation that allows moreflexibility as to the choice of the underlying dis-tribution of the endpoint of interest is the gen-eralized linear model (GLM).[15] In this class ofmodels, observations are assumed to be in-dependent and drawn from a given family dis-tribution (random component of the model),with the expectation of the response variable ex-pressed as a monotonic transformation (througha ‘link’ function) of a linear combination of theindividual co-variates. This modelling approachlends itself to the analysis of HCRU data. Twocommonly used models for count resource usedata are the Poisson and the Negative Binomial(see the Supplemental Digital Content 1, http://links.adisonline.com/PCZ/A63).
The Poisson distribution has been widely usedto model the number of events over a certainperiod of time. In its standard formulation, thisprocess assumes that events are occurring in-dependently of one another both within and be-tween individuals,[16] and that the mean rate of
events equals the variance. The Poisson model isgenerally considered too rigid for dealing withreal-life situations where excess zeros leading toover-dispersion are often observed in the data.
The negative binomial (NB) distribution, onthe other hand, is more flexible than the Poisson,as it assumes the number of events observed ineach individual i follows a Poisson distributionwith a patient-specific rate ri, thereby accountingfor variability between patients of the samplepopulation.[16]
The zero-inflated Poisson (ZIP) distribution isa degenerated Poisson distribution, which as-sumes that the data are generated by a dualprocess: a first stage that determines whetherthe event occurs at least once (zero vs non-zerocounts) and a second stage that determinesthe level of events, assuming a Poisson distri-bution. An extension of the ZIP is the zero-inflated Poisson over-dispersed (ZIPO), whichincludes a random element to account forover-dispersion.
1.0
0.8
0.6
0.4
0.2
00 1 2 3 4 5 6 7 8 9 10
1.0
0.8
0.6
0.4
0.2
00 1 2 3 4 5 6 7 8 9 10
1.0
0.8
0.6
0.4
0.2
00 1 2 3 4
No. of healthcare contactsNo. of healthcare contacts
No. of healthcare contacts
5 6 7 8 9 10
c
a b
PoissonNegative binomialZIP
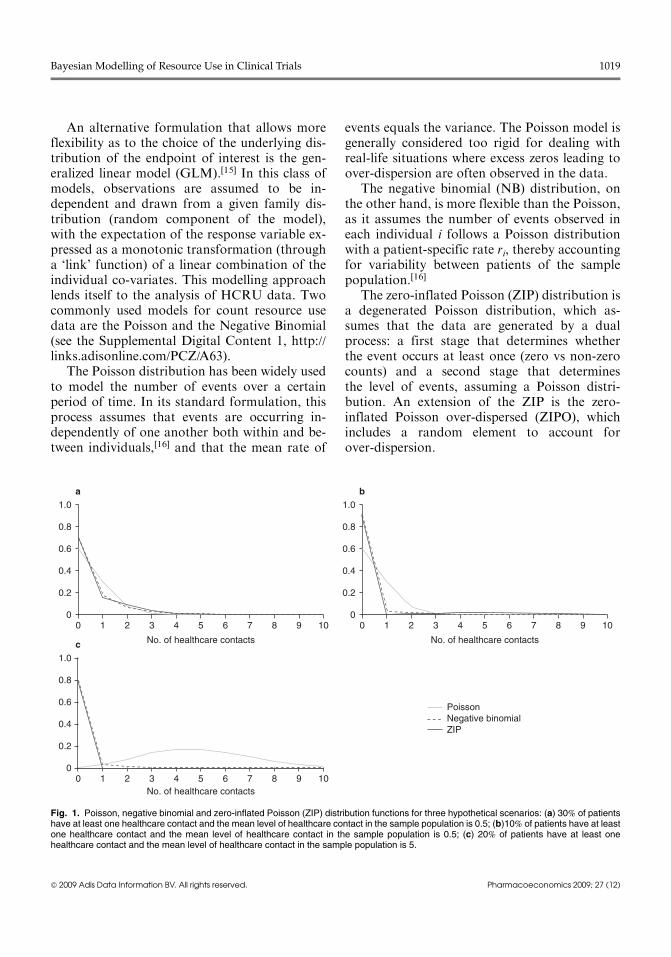
Fig. 1. Poisson, negative binomial and zero-inflated Poisson (ZIP) distribution functions for three hypothetical scenarios: (a) 30% of patientshave at least one healthcare contact and the mean level of healthcare contact in the sample population is 0.5; (b)10% of patients have at leastone healthcare contact and the mean level of healthcare contact in the sample population is 0.5; (c) 20% of patients have at least onehealthcare contact and the mean level of healthcare contact in the sample population is 5.
Bayesian Modelling of Resource Use in Clinical Trials 1019
ª 2009 Adis Data Information BV. All rights reserved. Pharmacoeconomics 2009; 27 (12)
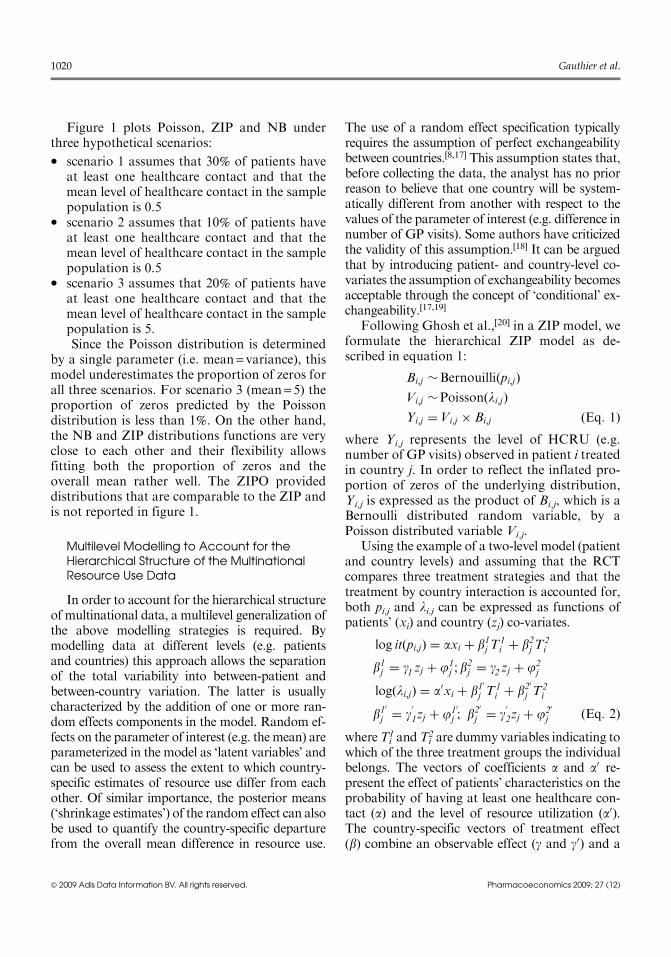
Figure 1 plots Poisson, ZIP and NB underthree hypothetical scenarios:
� scenario 1 assumes that 30% of patients haveat least one healthcare contact and that themean level of healthcare contact in the samplepopulation is 0.5
� scenario 2 assumes that 10% of patients haveat least one healthcare contact and that themean level of healthcare contact in the samplepopulation is 0.5
� scenario 3 assumes that 20% of patients haveat least one healthcare contact and that themean level of healthcare contact in the samplepopulation is 5.Since the Poisson distribution is determined
by a single parameter (i.e. mean = variance), thismodel underestimates the proportion of zeros forall three scenarios. For scenario 3 (mean = 5) theproportion of zeros predicted by the Poissondistribution is less than 1%. On the other hand,the NB and ZIP distributions functions are veryclose to each other and their flexibility allowsfitting both the proportion of zeros and theoverall mean rather well. The ZIPO provideddistributions that are comparable to the ZIP andis not reported in figure 1.
Multilevel Modelling to Account for theHierarchical Structure of the MultinationalResource Use Data
In order to account for the hierarchical structureof multinational data, a multilevel generalization ofthe above modelling strategies is required. Bymodelling data at different levels (e.g. patientsand countries) this approach allows the separationof the total variability into between-patient andbetween-country variation. The latter is usuallycharacterized by the addition of one or more ran-dom effects components in the model. Random ef-fects on the parameter of interest (e.g. themean) areparameterized in the model as ‘latent variables’ andcan be used to assess the extent to which country-specific estimates of resource use differ from eachother. Of similar importance, the posterior means(‘shrinkage estimates’) of the random effect can alsobe used to quantify the country-specific departurefrom the overall mean difference in resource use.
The use of a random effect specification typicallyrequires the assumption of perfect exchangeabilitybetween countries.[8,17] This assumption states that,before collecting the data, the analyst has no priorreason to believe that one country will be system-atically different from another with respect to thevalues of the parameter of interest (e.g. difference innumber of GP visits). Some authors have criticizedthe validity of this assumption.[18] It can be arguedthat by introducing patient- and country-level co-variates the assumption of exchangeability becomesacceptable through the concept of ‘conditional’ ex-changeability.[17,19]
Following Ghosh et al.,[20] in a ZIP model, weformulate the hierarchical ZIP model as de-scribed in equation 1:
Bi;j �Bernouilliðpi;jÞVi;j �Poissonðli;jÞYi;j ¼Vi;j � Bi;j ðEq: 1Þ
where Yi,j represents the level of HCRU (e.g.number of GP visits) observed in patient i treatedin country j. In order to reflect the inflated pro-portion of zeros of the underlying distribution,Yi,j is expressed as the product of Bi,j, which is aBernoulli distributed random variable, by aPoisson distributed variable Vi,j.
Using the example of a two-level model (patientand country levels) and assuming that the RCTcompares three treatment strategies and that thetreatment by country interaction is accounted for,both pi,j and li.j can be expressed as functions ofpatients’ (xi) and country (zj) co-variates.
log itðpi;jÞ ¼ axi þ b1j T1i þ b2j T
2i
b1j ¼ g1 zj þ j1j ; b
2j ¼ g2 zj þ j2
j
logðli;jÞ ¼ a0xi þ b10
j T1i þ b2
0j T
2i
b10j ¼ g
01zj þ j10
j ; b20
j ¼ g02zj þ j20
j ðEq: 2ÞwhereTi
1 andTi2 are dummy variables indicating to
which of the three treatment groups the individualbelongs. The vectors of coefficients a and a0 re-present the effect of patients’ characteristics on theprobability of having at least one healthcare con-tact (a) and the level of resource utilization (a0).The country-specific vectors of treatment effect(b) combine an observable effect (g and g0) and a
1020 Gauthier et al.
ª 2009 Adis Data Information BV. All rights reserved. Pharmacoeconomics 2009; 27 (12)
residual random effect (j and j0). As the effects oftreatment on the probability of having at least onehealthcare contact and on the level of HCRU (bjand bj 0) are expected to be correlated, the vectors[bj, bj 0] are modelled to follow a multivariateNormal distribution.
Motivating Example
Dataset
The analysis was conducted on twin 1-yearmultinational multicentre RCTs enrolling approxi-mately 2000 patients with a chronic respiratorydisease recruited in 20 different countries from allcontinents and 154 centres. For illustrative pur-poses, the dataset variable names have beensimplified. Patients enrolled in the trial were ran-domized to three treatment groups, and the investi-gators reported the items of HCRU in relation tothe chronic disease of interest at each visit (patientshad a visit scheduled every 8 weeks over the
observation period). Collected HCRU consisted offour categories of healthcare contacts: inpatienthospital days, ED visits, specialist visits and GPvisits; concomitant medication treatment was alsocollected (days of use classified by therapeuticgroup). Concomitant medications were those pre-scribed in addition to the study medication. Thecase study aimed to investigate how to adequatelymodel the level of each category of HCRU and toestimate the mean volume of each item of resourceuse by country and treatment group.
Model Specifications
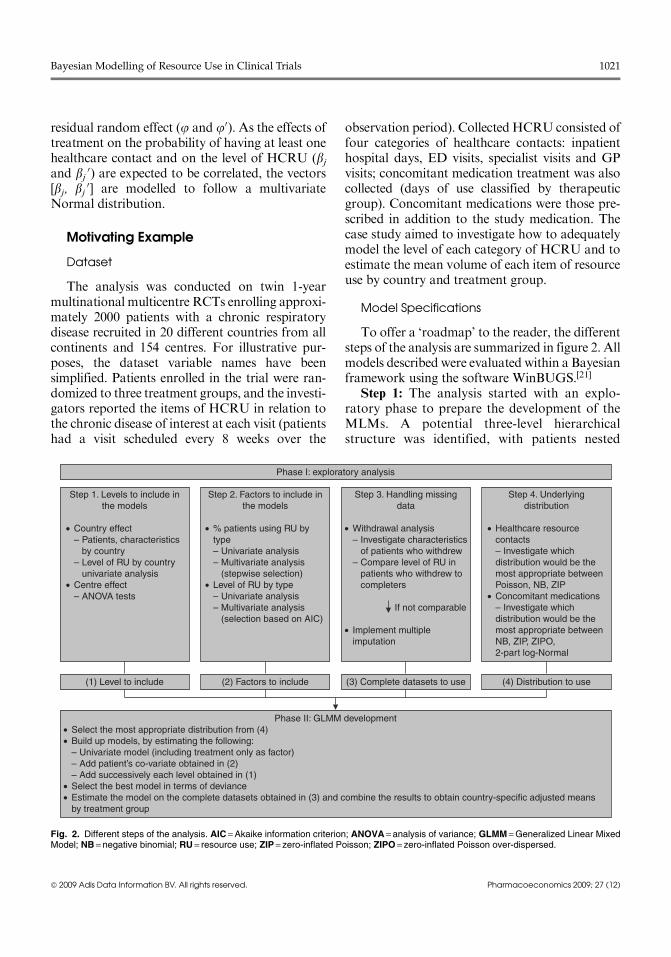
To offer a ‘roadmap’ to the reader, the differentsteps of the analysis are summarized in figure 2. Allmodels described were evaluated within a Bayesianframework using the software WinBUGS.[21]
Step 1: The analysis started with an explo-ratory phase to prepare the development of theMLMs. A potential three-level hierarchicalstructure was identified, with patients nested
Step 1. Levels to include inthe models
• Country effect – Patients, characteristics by country – Level of RU by country univariate analysis• Centre effect
– ANOVA tests
Step 2. Factors to include inthe models
• % patients using RU by type – Univariate analysis – Multivariate analysis (stepwise selection)• Level of RU by type
– Univariate analysis – Multivariate analysis (selection based on AIC)
Step 3. Handling missingdata
Phase I: exploratory analysis
• Withdrawal analysis – Investigate characteristics of patients who withdrew – Compare level of RU in patients who withdrew to completers
If not comparable
• Implement multiple imputation
Step 4. Underlyingdistribution
(1) Level to include
Phase II: GLMM development• Select the most appropriate distribution from (4)• Build up models, by estimating the following:
– Univariate model (including treatment only as factor)
– Add patient’s co-variate obtained in (2)
– Add successively each level obtained in (1)• Select the best model in terms of deviance• Estimate the model on the complete datasets obtained in (3) and combine the results to obtain country-specific adjusted means by treatment group
(2) Factors to include (3) Complete datasets to use (4) Distribution to use
• Healthcare resource contacts – Investigate which distribution would be the most appropriate between Poisson, NB, ZIP• Concomitant medications – Investigate which distribution would be the most appropriate between NB, ZIP, ZIPO, 2-part log-Normal
Fig. 2. Different steps of the analysis. AIC =Akaike information criterion; ANOVA = analysis of variance; GLMM =Generalized Linear MixedModel; NB = negative binomial; RU = resource use; ZIP = zero-inflated Poisson; ZIPO = zero-inflated Poisson over-dispersed.
Bayesian Modelling of Resource Use in Clinical Trials 1021
ª 2009 Adis Data Information BV. All rights reserved. Pharmacoeconomics 2009; 27 (12)
within treatment centres, nested within countries.A preliminary investigation of the levels’ effectswas undertaken. The number of patients andcentres participating in the study was reported bycountry. Patients’ demographics, baseline anddisease characteristics were explored to assesswhether patients’ case-mix was comparable be-tween countries. Levels of resource use were alsoexplored by country to validate a priori assump-tions of homogeneity between countries. One-way analysis of variance (ANOVA) tests wereused to inform the analysis of the country andcentre effects on the level of HCRU.
Step 2: Potential co-variates to include in themodel were identified as follows. At the patientlevel, a literature review was undertaken to iden-tify the factors influencing the level of HCRU inthe population of interest. Factors available inthe datasets were further explored via univariatetests (ANOVA tests) and regression analyses(using GLM). Both clinical and statistical evi-dence were used to select the set of patients’characteristics to be used when modelling thelevel of HCRU and two factors related to theseverity of the disease at baseline were kept inthe final set of factors. At the country level, totalhealthcare costs (which can be expressed as afunction of the GDP per capita and percent GDPspent on healthcare) may explain part of the in-dividual behaviour of healthcare consumption.Getzen[22] has shown that 90% of the variation inhealthcare costs between countries was explainedby the GDP per capita. The extent to which GDPper capita and percent GDP spent on healthcarecould explain an increased level of HCRU in theRCT was therefore explored.
Step 3: Missing data due to early withdrawalwere also investigated. First, the time to withdrawalwas analysed via a Kaplan Meier survival analysisand the heterogeneity between the treatmentgroups was tested using a log-rank test. Patientswho withdrew were compared with patients whocompleted the trial in terms of demographics,baseline characteristics, response to treatment overthe evaluation phase and level of HCRU over thetreatment period. As patients who withdrew fromthe trial could not be considered to be a subsampleof patients who completed the study, a multiple
imputation (MI) approach based on propensityscoring was employed.[23,24] Because missingdata were due to withdrawal, the missing patternwas monotone, and an iterative algorithm wasused to impute levels of HCRU from the firstvisit following withdrawal to the last visit sched-uled in the protocol. This process was repeated fivetimes in order to capture the uncertainty due tomissingness.
Step 4: The last step was to explore the modelfit using the different distributions as discussedabove in Models for Count Data. For healthcarecontacts, the Poisson, NB and ZIP distributionswere identified as potential candidates.[20,25] Se-lected concomitant medications were split intotwo categories: drugs taken long term (Med1)and medications used to treat worsening ofsymptoms (Med2 andMed3). The distribution ofthe number of treatment days was expected to beover-dispersed compared with the number ofhealthcare resource contacts. NB, ZIP, ZIPO andtwo-part log-Normal distributions were identi-fied as potential distribution functions for thenumber of concomitant medications treatmentdays. For each endpoint of interest, a univariatemodel (containing only the treatment group asfactor) was estimated, successively assuming eachpossible distribution function. As the devianceinformation criterion,[26] which accounts for boththe likelihood and number of parameters in themodel, cannot be estimated in WinBUGS formixture models, the best model was identified asthe one providing the lowest deviance. A decreaseof four points deviance per additional parameterwas judged significant.
Model Development
The hierarchical structure of the data was ex-plored as follows. First, the univariate model(including only the treatment group as factor)was estimated. The deviance obtained with thisinitial model was used as a reference to determinewhether the introduction of additional levels andfactors significantly improved the model fit. Sec-ond, patients’ co-variates (selected from step 2)were included as factors. The improvement inmodel fit was measured as the decrease in
1022 Gauthier et al.
ª 2009 Adis Data Information BV. All rights reserved. Pharmacoeconomics 2009; 27 (12)
deviance compared with the reference model.Third, one country variable was added as afunction of co-variates selected from step 2 plus aresidual random effect. Finally, the centre effectwas added to the model. As no information re-lating to centre characteristics was available, thiswas modelled as a pure random effect.[27]
The country effect was assumed to affect boththe baseline levels of resource use and treatmenteffect to allow for potential between-country varia-bility of the differential resource use estimates.[6] Asspecified in the Background section, within eachcountry, the baseline and treatment effects wereassumed to follow a multivariate Normal distribu-tion. The associated precision matrix was assumedto follow a Wishart distribution (see the Supple-mental Digital Content for the WinBUGS code).
Results
Descriptive Statistics
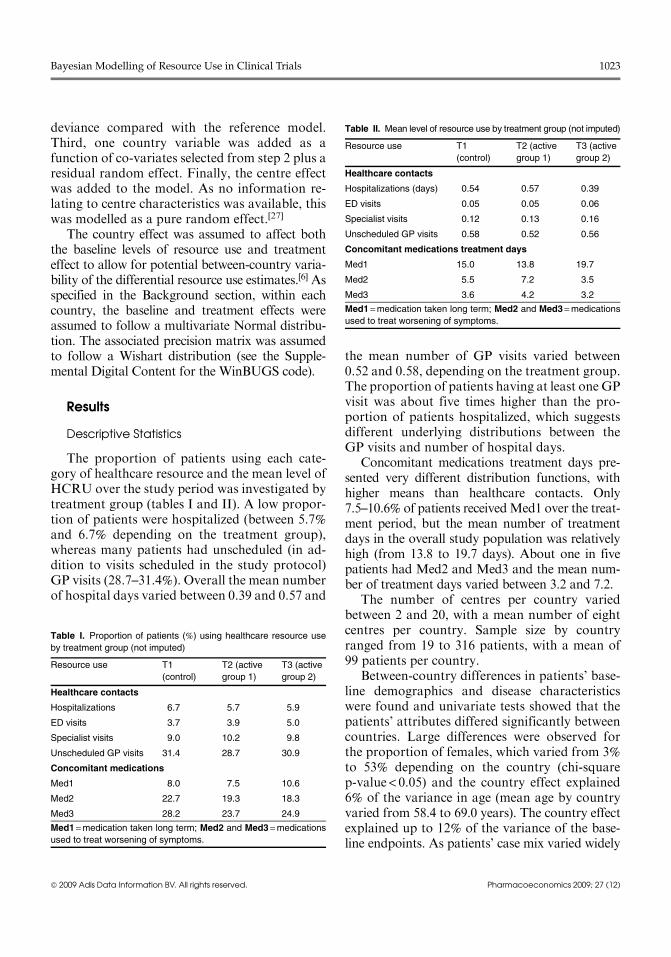
The proportion of patients using each cate-gory of healthcare resource and the mean level ofHCRU over the study period was investigated bytreatment group (tables I and II). A low propor-tion of patients were hospitalized (between 5.7%and 6.7% depending on the treatment group),whereas many patients had unscheduled (in ad-dition to visits scheduled in the study protocol)GP visits (28.7–31.4%). Overall the mean numberof hospital days varied between 0.39 and 0.57 and
the mean number of GP visits varied between0.52 and 0.58, depending on the treatment group.The proportion of patients having at least one GPvisit was about five times higher than the pro-portion of patients hospitalized, which suggestsdifferent underlying distributions between theGP visits and number of hospital days.
Concomitant medications treatment days pre-sented very different distribution functions, withhigher means than healthcare contacts. Only7.5–10.6% of patients receivedMed1 over the treat-ment period, but the mean number of treatmentdays in the overall study population was relativelyhigh (from 13.8 to 19.7 days). About one in fivepatients had Med2 and Med3 and the mean num-ber of treatment days varied between 3.2 and 7.2.
The number of centres per country variedbetween 2 and 20, with a mean number of eightcentres per country. Sample size by countryranged from 19 to 316 patients, with a mean of99 patients per country.
Between-country differences in patients’ base-line demographics and disease characteristicswere found and univariate tests showed that thepatients’ attributes differed significantly betweencountries. Large differences were observed forthe proportion of females, which varied from 3%to 53% depending on the country (chi-squarep-value < 0.05) and the country effect explained6% of the variance in age (mean age by countryvaried from 58.4 to 69.0 years). The country effectexplained up to 12% of the variance of the base-line endpoints. As patients’ case mix varied widely
Table I. Proportion of patients (%) using healthcare resource use
by treatment group (not imputed)
Resource use T1
(control)
T2 (active
group 1)
T3 (active
group 2)
Healthcare contacts
Hospitalizations 6.7 5.7 5.9
ED visits 3.7 3.9 5.0
Specialist visits 9.0 10.2 9.8
Unscheduled GP visits 31.4 28.7 30.9
Concomitant medications
Med1 8.0 7.5 10.6
Med2 22.7 19.3 18.3
Med3 28.2 23.7 24.9
Med1 =medication taken long term; Med2 and Med3 =medications
used to treat worsening of symptoms.
Table II. Mean level of resource use by treatment group (not imputed)
Resource use T1
(control)
T2 (active
group 1)
T3 (active
group 2)
Healthcare contacts
Hospitalizations (days) 0.54 0.57 0.39
ED visits 0.05 0.05 0.06
Specialist visits 0.12 0.13 0.16
Unscheduled GP visits 0.58 0.52 0.56
Concomitant medications treatment days
Med1 15.0 13.8 19.7
Med2 5.5 7.2 3.5
Med3 3.6 4.2 3.2
Med1 =medication taken long term; Med2 and Med3 =medications
used to treat worsening of symptoms.
Bayesian Modelling of Resource Use in Clinical Trials 1023
ª 2009 Adis Data Information BV. All rights reserved. Pharmacoeconomics 2009; 27 (12)
between countries, it was considered important tocontrol for these characteristics to satisfy the as-sumption of conditional exchangeability betweencountries in the development of the MLM.
On the basis of graphical representations ofthe level of HCRU by country, it was difficultto notice a clear difference between countries inthe mean number of hospital days, ED visitsand specialist visits, as the mean number of unitsby patient was relatively low and the variabilitybetween patients was high. This resulted in95% credibility intervals by country overlappingeach other.
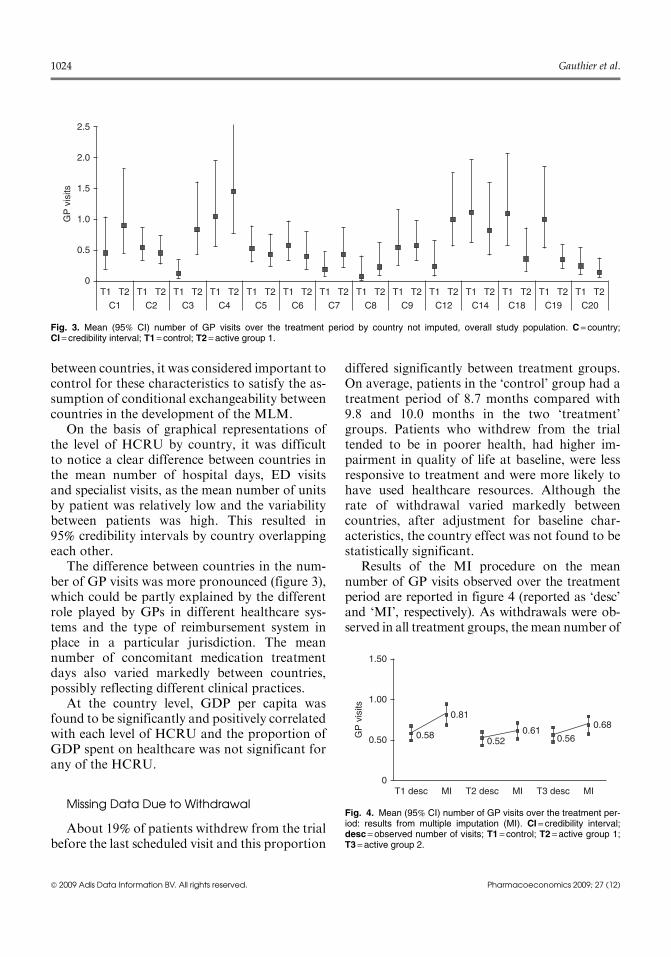
The difference between countries in the num-ber of GP visits was more pronounced (figure 3),which could be partly explained by the differentrole played by GPs in different healthcare sys-tems and the type of reimbursement system inplace in a particular jurisdiction. The meannumber of concomitant medication treatmentdays also varied markedly between countries,possibly reflecting different clinical practices.
At the country level, GDP per capita wasfound to be significantly and positively correlatedwith each level of HCRU and the proportion ofGDP spent on healthcare was not significant forany of the HCRU.
Missing Data Due to Withdrawal
About 19% of patients withdrew from the trialbefore the last scheduled visit and this proportion
differed significantly between treatment groups.On average, patients in the ‘control’ group had atreatment period of 8.7 months compared with9.8 and 10.0 months in the two ‘treatment’groups. Patients who withdrew from the trialtended to be in poorer health, had higher im-pairment in quality of life at baseline, were lessresponsive to treatment and were more likely tohave used healthcare resources. Although therate of withdrawal varied markedly betweencountries, after adjustment for baseline char-acteristics, the country effect was not found to bestatistically significant.
Results of the MI procedure on the meannumber of GP visits observed over the treatmentperiod are reported in figure 4 (reported as ‘desc’and ‘MI’, respectively). As withdrawals were ob-served in all treatment groups, themean number of
C1
T1 T2
C2
T1 T2
C3
T1 T2
C4
T1 T2
C5
T1 T2
C6
T1 T2
C7
T1 T2
C8
T1 T2
C9
T1 T2
C12
T1 T2
C14
T1 T2
C18
T1 T2
C19
T1 T2
C20
T1 T20
0.5
1.0GP
vis
its 1.5
2.0
2.5
Fig. 3. Mean (95% CI) number of GP visits over the treatment period by country not imputed, overall study population. C = country;CI = credibility interval; T1 = control; T2 = active group 1.
0T1 desc
0.58
0.81
0.520.61
0.56
0.68
MI T2 desc MI T3 desc MI
0.50GP
vis
its
1.00
1.50
Fig. 4. Mean (95% CI) number of GP visits over the treatment per-iod: results from multiple imputation (MI). CI = credibility interval;desc = observed number of visits; T1 = control; T2 =active group 1;T3 = active group 2.
1024 Gauthier et al.
ª 2009 Adis Data Information BV. All rights reserved. Pharmacoeconomics 2009; 27 (12)
GP visits was increased by the MI algorithm andthe increase was higher in the control treatmentgroup as patients experienced earlier withdrawals.
Results from the Multilevel Model Analysis
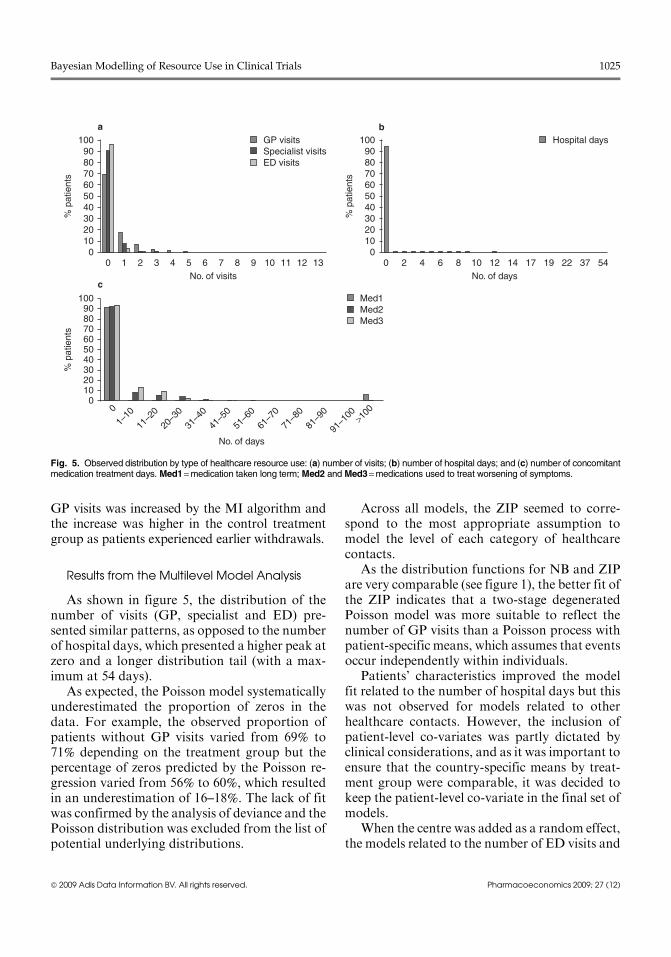
As shown in figure 5, the distribution of thenumber of visits (GP, specialist and ED) pre-sented similar patterns, as opposed to the numberof hospital days, which presented a higher peak atzero and a longer distribution tail (with a max-imum at 54 days).
As expected, the Poisson model systematicallyunderestimated the proportion of zeros in thedata. For example, the observed proportion ofpatients without GP visits varied from 69% to71% depending on the treatment group but thepercentage of zeros predicted by the Poisson re-gression varied from 56% to 60%, which resultedin an underestimation of 16–18%. The lack of fitwas confirmed by the analysis of deviance and thePoisson distribution was excluded from the list ofpotential underlying distributions.
Across all models, the ZIP seemed to corre-spond to the most appropriate assumption tomodel the level of each category of healthcarecontacts.
As the distribution functions for NB and ZIPare very comparable (see figure 1), the better fit ofthe ZIP indicates that a two-stage degeneratedPoisson model was more suitable to reflect thenumber of GP visits than a Poisson process withpatient-specific means, which assumes that eventsoccur independently within individuals.
Patients’ characteristics improved the modelfit related to the number of hospital days but thiswas not observed for models related to otherhealthcare contacts. However, the inclusion ofpatient-level co-variates was partly dictated byclinical considerations, and as it was important toensure that the country-specific means by treat-ment group were comparable, it was decided tokeep the patient-level co-variate in the final set ofmodels.
When the centre was added as a random effect,the models related to the number of ED visits and
0 1 2 3 4 5 6 7No. of visits No. of days
No. of days
8 9 10 11 12 130
102030405060
% p
atie
nts 70
8090
100 GP visitsSpecialist visitsED visits
0
1–10
11–2
0
20–3
0
31–4
0
41–5
0
51–6
0
61–7
0
71–8
0
81–9
0
91–1
00 >100
0102030405060
% p
atie
nts 70
8090
100 Med1Med2Med3
0 2 4 6 8 10 12 14 17 19 22 37 540
102030405060
% p
atie
nts 70
8090
100 Hospital daysb
c
a
Fig. 5. Observed distribution by type of healthcare resource use: (a) number of visits; (b) number of hospital days; and (c) number of concomitantmedication treatment days. Med1=medication taken long term; Med2 and Med3=medications used to treat worsening of symptoms.
Bayesian Modelling of Resource Use in Clinical Trials 1025
ª 2009 Adis Data Information BV. All rights reserved. Pharmacoeconomics 2009; 27 (12)
to the number of specialist visits did not con-verge. This may be due to the unbalanced numberof events (e.g. ED visits) across different centres.Adding the centre effect improved the model re-lated to the number of hospital days. However,the decrease in deviance was only 1.08 per addi-tional parameter.
As characteristics of the centre were notavailable and as the primary objective of thisstudy was to explore the feasibility of modellingHCRU to obtain country-specific estimates ofdifferential resource use, the centre effect was notfurther explored within the context of this work.
The final set of models for healthcare contactsassumed a ZIP distribution, included the patientand country levels and the corresponding co-variates (patients’ demographics and baselinedisease severity at the patient level and GDP percapita at the country level). Although GDP per
capita was found to significantly affect the prob-ability of using HCRU in the univariate analysis,coefficients associated with GDP per capita werenot statistically significant after adjustment forpatients’ characteristics. However, it was decidedto express the country effect as a function of itsGDP per capita to satisfy the assumption of con-ditional exchangeability. The WinBUGS specifi-cations of the ZIP model are reported in theSupplemental Digital Content.
The same analysis was conducted for thenumber of concomitant medications treatmentdays by category. The distribution providing thebest model fit was the ZIPO for all therapeuticcategories. Introducing patients’ characteristicsimproved the model related to medications takenin presence of worsening of symptoms only andeven if the country effect seemed to influence thenumber of treatment days in the first place (based
3.5
3.0
2.5
2.0
1.5
1.0
0.5
0
3.5
3.0
2.5
2.0
1.5
1.0
0.5
0
0
0.2
0.4
0.6
0.8
1.0
0
0.1
0.2
0.3
0.4
0.5c d
a b
C1
(n =
60)
C2
(n =
79)
C3
(n =
68)
C4
(n =
177
)
C5
(n =
102
)
C6
(n =
66)
C7
(n =
135
)
C8
(n =
91)
C9
(n =
63)
C12
(n =
131
)
C14
(n =
205
)
C18
(n =
193
)
C19
(n =
316
)
C20
(n =
94)
T1 T2 T1 T2 T1 T2 T1 T2 T1 T2 T1 T2 T1 T2 T1 T2 T1 T2 T1 T2 T1 T2 T1 T2 T1 T2 T1 T2
C1
(n =
60)
C2
(n =
79)
C3
(n =
68)
C4
(n =
177
)
C5
(n =
102
)
C6
(n =
66)
C7
(n =
135
)
C8
(n =
91)
C9
(n =
63)
C12
(n =
131
)
C14
(n =
205
)
C18
(n =
193
)
C19
(n =
316
)
C20
(n =
94)
T1 T2 T1 T2 T1 T2 T1 T2 T1 T2 T1 T2 T1 T2 T1 T2 T1 T2 T1 T2 T1 T2 T1 T2 T1 T2 T1 T2
C1
(n =
60)
C2
(n =
79)
C3
(n =
68)
C4
(n =
177
)
C5
(n =
102
)
C6
(n =
66)
C7
(n =
135
)
C8
(n =
91)
C9
(n =
63)
C12
(n =
131
)
C14
(n =
205
)
C18
(n =
193
)
C19
(n =
316
)
C20
(n =
94)
T1 T2 T1 T2 T1 T2 T1 T2 T1 T2 T1 T2 T1 T2 T1 T2 T1 T2 T1 T2 T1 T2 T1 T2 T1 T2 T1 T2
C1
(n =
60)
C2
(n =
79)
C3
(n =
68)
C4
(n =
177
)
C5
(n =
102
)
C6
(n =
66)
C7
(n =
135
)
C8
(n =
91)
C9
(n =
63)
C12
(n =
131
)
C14
(n =
205
)
C18
(n =
193
)
C19
(n =
316
)
C20
(n =
94)
T1 T2 T1 T2 T1 T2 T1 T2 T1 T2 T1 T2 T1 T2 T1 T2 T1 T2 T1 T2 T1 T2 T1 T2 T1 T2 T1 T2
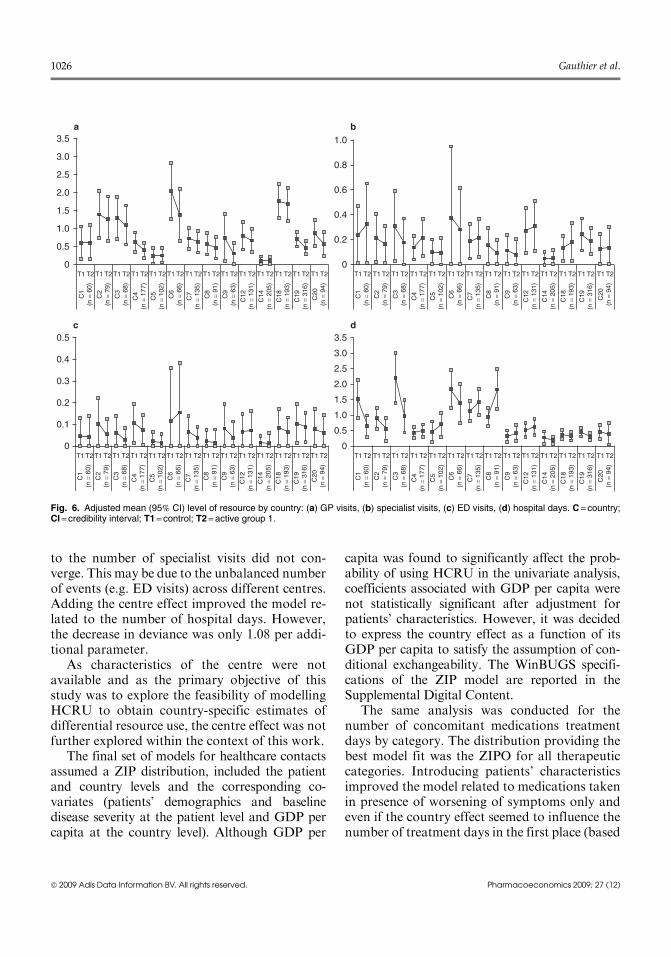
Fig. 6. Adjusted mean (95% CI) level of resource by country: (a) GP visits, (b) specialist visits, (c) ED visits, (d) hospital days. C = country;CI = credibility interval; T1 = control; T2 = active group 1.
1026 Gauthier et al.
ª 2009 Adis Data Information BV. All rights reserved. Pharmacoeconomics 2009; 27 (12)

on ANOVA test), the addition of the countryeffect did not decrease the deviance significantly.However, as the study aimed to produce end-points by country, the country effect (as a func-tion of GDP per capita) was kept in all models.
Estimates of resource use for countries with asmall sample will be typically subject to heavyshrinkage towards the population random effectmean estimate.[28] In this sense, it may be arguedthat they may not adequately reflect the actualmean level of HCRU for the country of interest.While countries with small samples were used forthe development of the model, figure 6 plots theshrinkage estimates only for those countries withat least 60 patients.
The level of precision varied between types ofresource use, with wider credibility intervals ob-served for ED, specialist visits and concomitantmedications treatment days (not reported in thegraph, as very similar results were observed). Pa-tients from the control group had a consistentlyhigher (although not statistically significant) num-ber of GP visits than patients in the interventiongroup, but this was not always observed for otherhealthcare contacts.
Discussion
From a methodological point of view, analysisof costs alongside RCTs presents several chal-lenges including missing data due to early with-drawals, hierarchical structure of the data, andestimation and distribution of costs. Althoughmost analyses use a single vector of unit costs toestimate the cost of resources collected in the trialregardless of the country of interest, some ana-lyses are based on country-specific unit costs,which are converted to monetary units using acommon numeraire. The latter approach requiresthe analyst to obtain unit costs for each countryinvolved in the trial, which generates a consider-able costing effort.
In order not to confound the country effect withthe relative price effect, we proposed to model thelevel of resource use rather than the total costs ofhealthcare. Although the results of this study maynot be directly transferable to other RCTs, the ap-proach outlined in this article, consisting of the
following steps, can be generalized. First, we in-vestigated the potential levels to include in thehierarchical models (country, possibly centre) byanalysing the heterogeneity of case mix and level ofresource use across units. Second, factors to includein the models at each level were identified from theliterature and univariate and multivariate statisticalanalyses were conducted to quantify the impact ofeach factor on the probability of using resourcesand on the level of resource use. Third, an analysisof early withdrawal was conducted (cause, char-acteristics of patients who withdrew) and an MIwas implemented to handle missing data. Fourth,the underlying distribution of each endpoint ofinterest was explored, and the univariate model(including treatment only) that minimized thedeviance was selected to identify the most suitabledistribution. The results from these four steps wereused to develop and estimate the MLM within theBayesian framework. The approach presented inthis article offers several advantages over conven-tional approaches: homogeneous endpoints aremodelled, which is likely to lead to bettermodel fits;the vector of unit cost specific to each country ofinterest can simply be applied to the shrinkage es-timates of differential resource use to estimate thetotal costs by country and this approach providesmore detailed information on the cost component,which, in the presence of transferability betweentypes of HCRU, can be crucial to understand thetreatment effect.
This analysis could be improved further. Themost suitable distribution functions were identi-fied within the context of the studied RCT andthese results may not be applicable to otherRCTs. For example, the zero-inflated NB dis-tribution could be investigated and may betterreflect the distribution of the endpoints of inter-est.[29] This may affect the results, as the inferenceof the population mean cost has been shown to besensitive to the choice of underlying distribu-tion.[30,31] Moreover, the correlations between thelevels of different categories of HCRU are notexplicitly accounted for, which could be ad-dressed by developing a multivariate model.[32]
Although themodelling of resource use improvesthe estimate of individual cost components,[33]
whether combining the estimates of cost
Bayesian Modelling of Resource Use in Clinical Trials 1027
ª 2009 Adis Data Information BV. All rights reserved. Pharmacoeconomics 2009; 27 (12)
components obtained via this approach providesan unbiased estimate of the mean total cost ofhealthcare is yet to be addressed and needsfurther investigation, possibly via simulationstudies and via a comparison of the proposedapproach with the classical modelling of totalhealthcare costs, using different unit costs andrelative costs reflecting country-specific varia-tions, to assess the sensitivity of the results.
Owing to issues of convergence, the inter-mediate level of the hierarchical structure (thecentre effect) was not included in the final set ofmodels, which may result in an overestimation ofthe between-country heterogeneity – due to anoverestimation of the variance components ofthe model – and to wider credibility intervalsat the country levels, due to an overestimation ofthe standard error.[34] As suggested by Wennbergand Gittelson,[35] the level of resource utiliza-tion can vary widely within a given country.Therefore, analysis of multinational trials shouldconsider within-country variation. Moreover, se-lection of centres should be carefully reviewedwhen designing studies aiming for economicevaluation.
The effect of other explanatory variables at thecountry level such as density of physicians andhospital beds should be further explored. The me-chanism of missingness may also vary betweencountries. There is a need for further research in thisarea beyond the analysis of the collected data, whichmay not provide all the necessary information.
Lastly, the treatment effect was allowed to varybetween countries, and further analyses would beneeded to interpret the qualitative changes betweentwo treatment groups from country to country. Ascredibility intervals largely overlap, the differencewas not statistically significant. However, if thepoint estimate is of interest for the development ofa decision model, extra caution is required to selectthe relevant cost of healthcare. To obtain a moreprecise estimate, other sources of evidence could beused. For example, meta-analysis of existing evi-dence and experts’ opinion could help to obtainmore reliable estimates, and such additional in-formation could be incorporated in the models viainformative priors or through comprehensiveevidence synthesis models.
Economic data collected alongside RCTs pre-sents two important advantages: the minimizationof selection bias (owing to appropriate randomi-zation) and high-quality data (that providesdetailed information on the type of HCRU).However, the economic analysis of RCTs is alsoassociated with several limitations: HCRU maynot reflect the level of consumption in real practice,as it may be driven by the study protocol; theanalysis is limited to the study design in terms oftime horizon and comparators; and the results ofthe economic analysis are based on a singlestudy.[1] Therefore, while economic analyses ofRCTs provide an important source of information,the results should be interpreted within the contextof all available evidence.
To our knowledge this study is the first appli-cation of the proposed approach, and further ex-amples are required to explore its use and validitywithin the context of CEAs.
Conclusions
This analysis shows that modelling the level ofHCRU within the Bayesian framework is a con-venient approach that offers several advantagescompared with the modelling of direct costs: itprovides better model fit, avoids confounding theprice effects with the country effects and facil-itates the estimation of costs for several countriesrepresented in the trial.
Acknowledgements
This study was sponsored by Boehringer Ingelheim Inter-national GmbH and conducted by i3 Innovus under contract.AndreaManca acted as a consultant to i3 Innovus and providedadvice on the analysis of the data, the development of themodelsand the draft of themanuscript. The authors have no conflicts ofinterest that are directly relevant to this study.
References1. Sculpher MJ, Claxton K, Drummond M, et al. Whither
trial-based economic evaluation for health care decisionmaking? Health Econ 2006; 15: 677-87
2. Sculpher MJ, Pang FS, Manca A, et al. Generalisability ineconomic evaluation studies in healthcare: a review andcase studies. Health Technol Assess 2004; 8: iii-192
1028 Gauthier et al.
ª 2009 Adis Data Information BV. All rights reserved. Pharmacoeconomics 2009; 27 (12)
3. Manca A, Willan AR. ‘Lost in translation’: accounting forbetween-country differences in the analysis of multina-tional cost-effectiveness data. Pharmacoeconomics 2006;24 (11): 1101-19
4. Drummond M, Manca A, Sculpher M. Increasing the gen-eralizability of economic evaluations: recommendationsfor the design, analysis, and reporting of studies. Int JTechnol Assess Health Care 2005; 21: 165-71
5. Willan AR, Kowgier ME. Cost-effectiveness analysis of amultinational RCT with a binary measure of effectivenessand an interacting covariate. Health Econ 2008; 17: 777-91
6. Manca A, Rice N, Sculpher MJ, et al. Assessing generalis-ability by location in trial-based cost-effectiveness analysis:the use of multilevel models. Health Econ 2005; 14: 471-85
7. Grieve R, Nixon R, Thompson SG, et al. Using multilevelmodels for assessing the variability of multinational re-source use and cost data. Health Econ 2005; 14: 185-96
8. Grieve R, Nixon R, Thompson SG, et al. Multilevel modelsfor estimating incremental net benefits in multinationalstudies. Health Econ 2007; 16: 815-26
9. Nixon RM, Thompson SG. Methods for incorporatingcovariate adjustment, subgroup analysis and between-centre differences into cost-effectiveness evaluations.Health Econ 2005; 14: 1217-29
10. Willke RJ, Glick HA, Polsky D, et al. Estimating country-specific cost-effectiveness from multinational clinical trials.Health Econ 1998; 7: 481-93
11. Wordsworth S, Ludbrook A. Comparing costing results inacross country economic evaluations: the use of technologyspecific purchasing power parities. Health Econ 2005; 14:93-9
12. Jonsson B, Weinstein MC. Economic evaluation alongsidemultinational clinical trials: study considerations for GUSTOIIb. Int J Technol Assess Health Care 1997; 13: 49-58
13. Thompson SG, Nixon RM, Grieve R. Addressing theissues that arise in analysing multicentre cost data, withapplication to a multinational study. J Health Econ 2006;25: 1015-28
14. Cameron AC, Trivedi PK. Regression analysis of countdata. New York: Cambridge University Press, 1998
15. McCullagh P, Nelder J. Generalized linear models, 2nd ed.[monographs on statistics and applied probability]. NewYork: Chapman and Hall, 1989
16. Metcalfe C, Thompson SG. The importance of varying theevent generation process in simulation studies of statisticalmethods for recurrent events. Stat Med 2006; 25: 165-79
17. Gelman A, Carlin J, Stern H, et al. Bayesian data analysis.New York: Chapman and Hall/CRC, 2004
18. Glick H, Doshi JA, Sonnad SS, et al. Economic evaluationin clinical trials. Oxford: Oxford University Press, 2007
19. Ohlssen DI, Sharples LD, Spiegelhalter DJ. Flexiblerandom-effects models using Bayesian semi-parametric
models: applications to institutional comparisons. StatMed 2007; 26: 2088-112
20. Ghosh S, Mukhopadhyay P, Lu J. Bayesian analysis of zeroinflated regression models. J Stat Planning Infer 2006; 136:1360-75
21. Spiegelhalter D, Thomas A, Best N, et al. WinBUGS usermanual: version 1.4. Cambridge: MRC Biostatistics Unit,2003
22. Getzen TE. Aggregation and the measurement of health carecosts. Health Serv Res 2006; 41: 1938-54
23. Rubin D. Multiple imputation for nonresponse in surveys,New York. New York: John Wiley & Sons, 1987
24. Schafer J. Analysis of incomplete multivariate data. NewYork: Chapman and Hall, 1997
25. Martin A. Bayesian inference for heterogeneous eventcounts. Sociol Methods Res 2003; 31: 30-63
26. Spiegelhalter D, Best N, Carlin B, et al. Bayesian measuresof model complexity and fit: series B (statistical metho-dology). J R Stat Soc 2002; 64: 583-639
27. Petrinco M, Pagano E, Desideri A, et al. Information oncenter characteristics as costs’ determinants in multicenterclinical trials: is modeling center effect worth the effort?Value Health 2008; 12 (2): 325-30
28. Spiegelhalter D, Abrams K,Miles J. Bayesian approaches toclinical trials and health care evaluation. Hoboken (NJ):John Wiley & Sons, 2004
29. Sangho M, Jaeun S. Health care utilization among Medi-care-Medicaid dual eligibles: a count data analysis. BMCPublic Health 2006 1988; 6: 88
30. Nixon RM, Thompson SG. Parametric modelling of costdata in medical studies. Stat Med 2004; 23: 1311-31
31. Briggs A, Nixon R, Dixon S, et al. Parametric modellingof cost data: some simulation evidence. Health Econ 2005;14: 421-8
32. Conti S, Manca A, Lambert P, et al. Bayesian multivariatemodelling of patient level healthcare resource use data inRCTs [abstract]. International Health Economics Asso-ciation (iHEA); 2007 Jul 9; Copenhagen
33. Lambert PC, Billingham LJ, Cooper NJ, et al. Estimatingthe cost-effectiveness of an intervention in a clinical trialwhen partial cost information is available: a Bayesianapproach. Health Econ 2008; 17: 67-81
34. Moerbeek M. The consequence of ignoring a level of nestingin multilevel analysis. Multivar Behav Res 2004; 39: 149
35. Wennberg J, Gittelsohn J. Small area variations in healthcare delivery. Science 1973; 182: 1102-8
Correspondence: Ms Aline Gauthier, 3b Healey Street, NW18SR, London, UK.E-mail: [email protected]
Bayesian Modelling of Resource Use in Clinical Trials 1029
ª 2009 Adis Data Information BV. All rights reserved. Pharmacoeconomics 2009; 27 (12)