Embed Size (px)
Citation preview
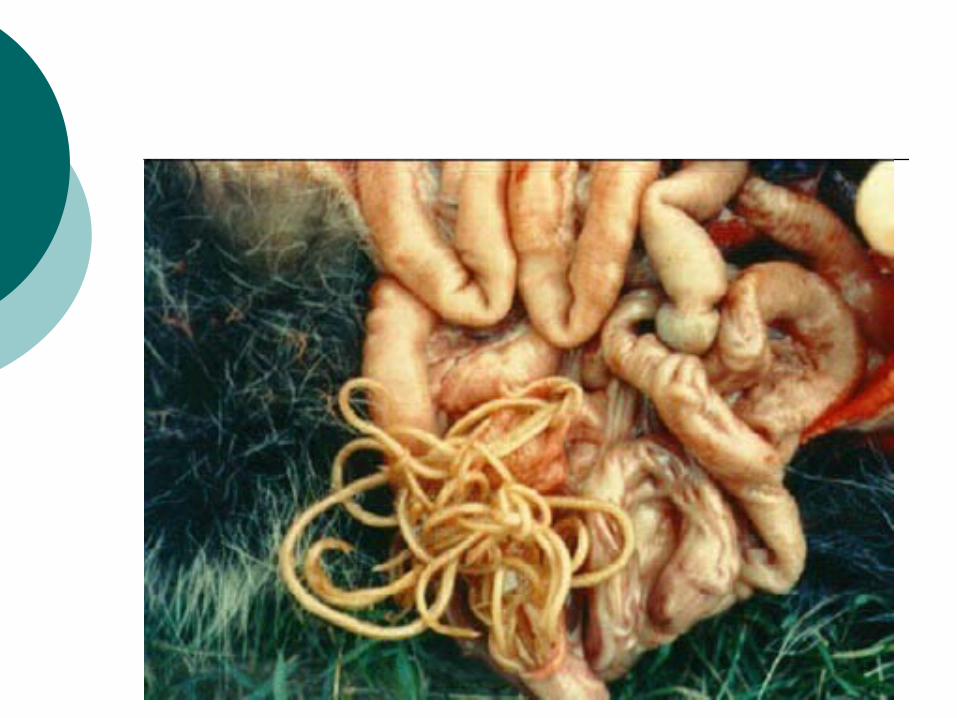
Baylisascaris procyonis,Raccoon Roundworm
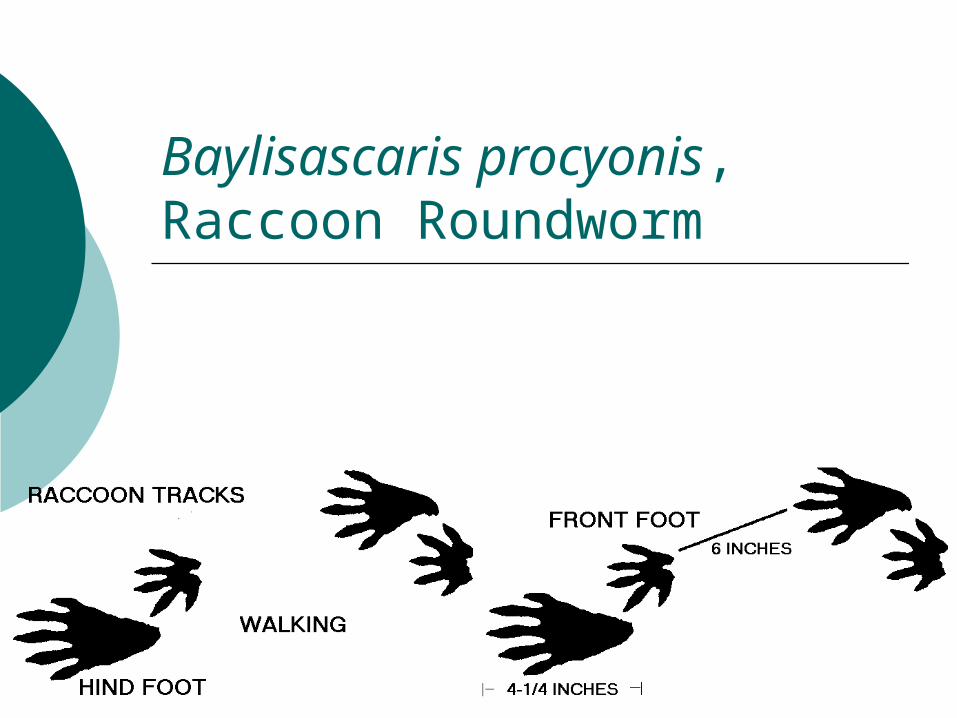
Classification Raccoon Roundworm
Kingdom Animalia
Phylum Nemathelminthes
Class Nematoda
Order Ascaridida
Family Ascarididae
Genus Baylisascaris
Species procyonis
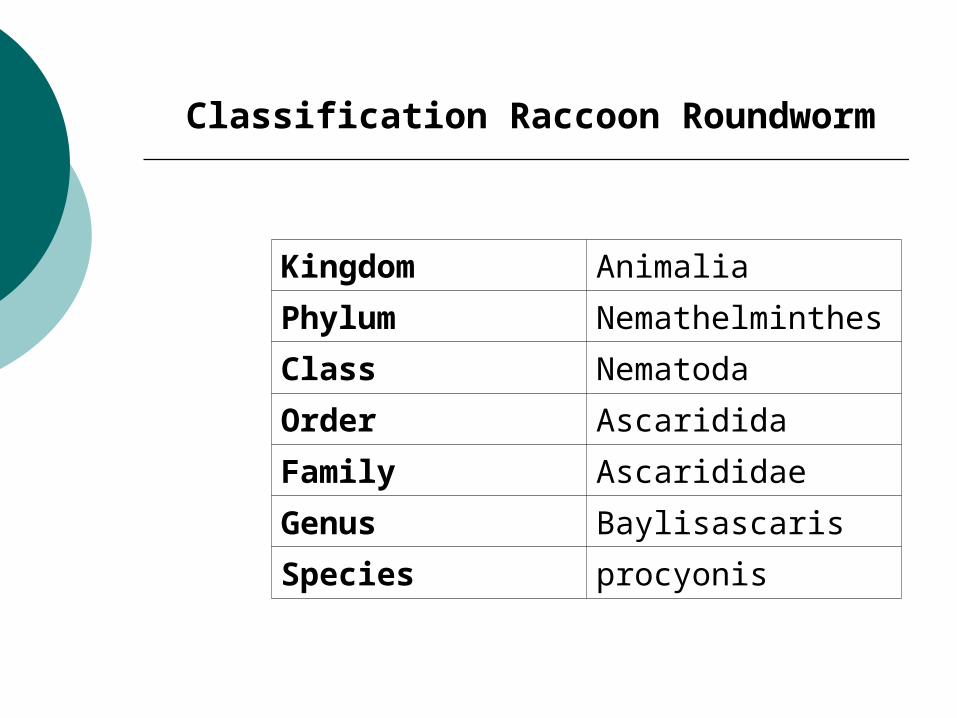
The Smithsonian Book of North American Mammals edited by Don E. Wilson and Sue Ruff.
North American Distribution
Sm
all
Dark
L
arg
e L
ight
colo
ur
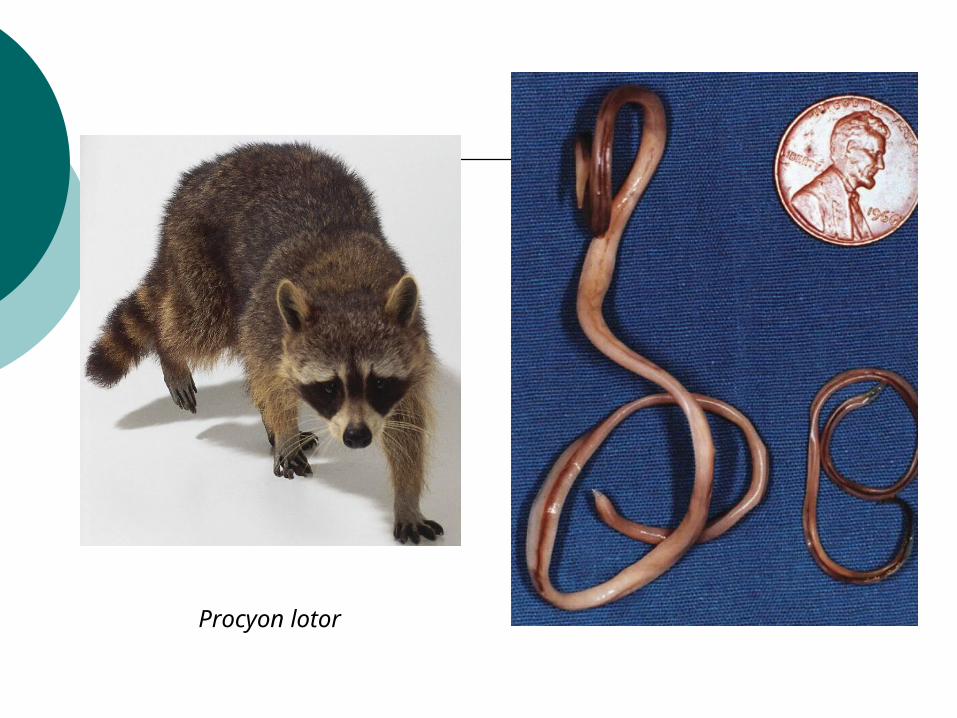
Procyon lotor
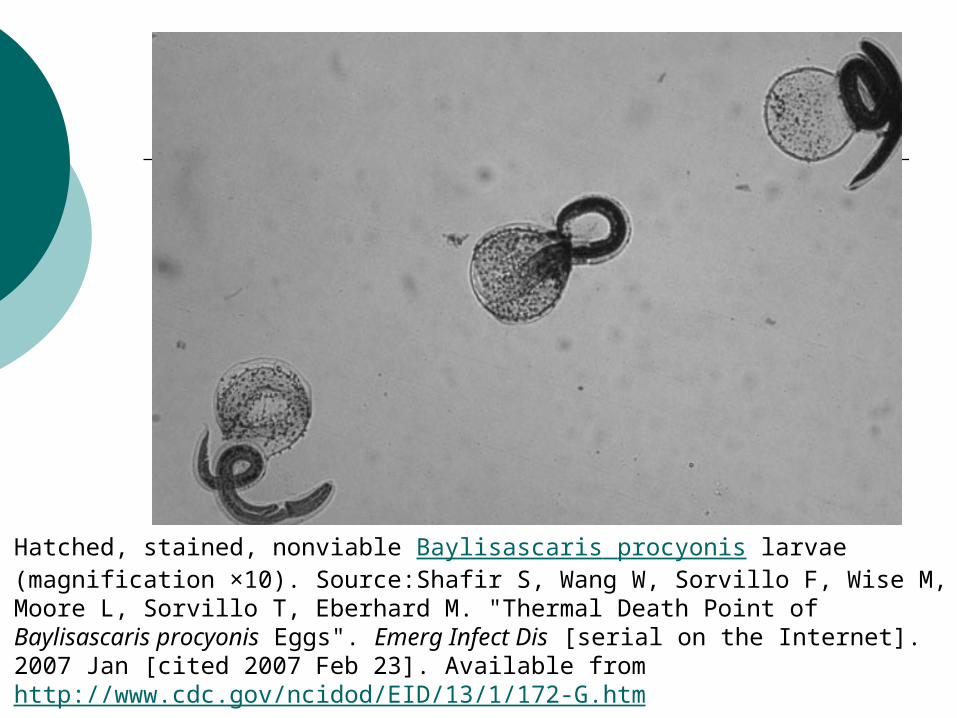
Hatched, stained, nonviable Baylisascaris procyonis larvae (magnification ×10). Source:Shafir S, Wang W, Sorvillo F, Wise M, Moore L, Sorvillo T, Eberhard M. "Thermal Death Point of Baylisascaris procyonis Eggs". Emerg Infect Dis [serial on the Internet]. 2007 Jan [cited 2007 Feb 23]. Available from http://www.cdc.gov/ncidod/EID/13/1/172-G.htm
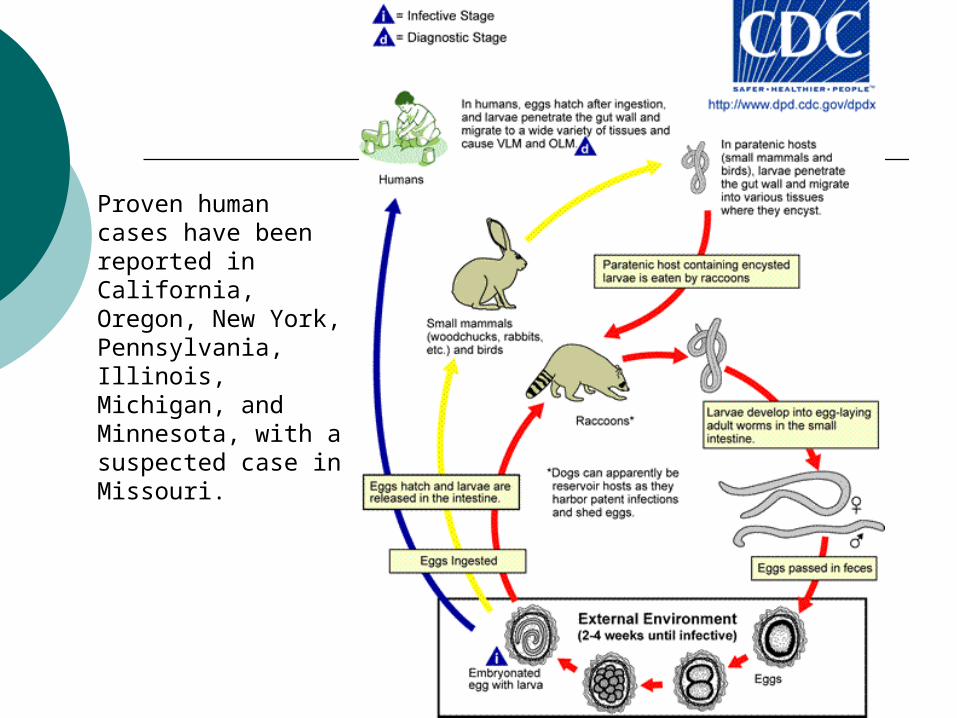
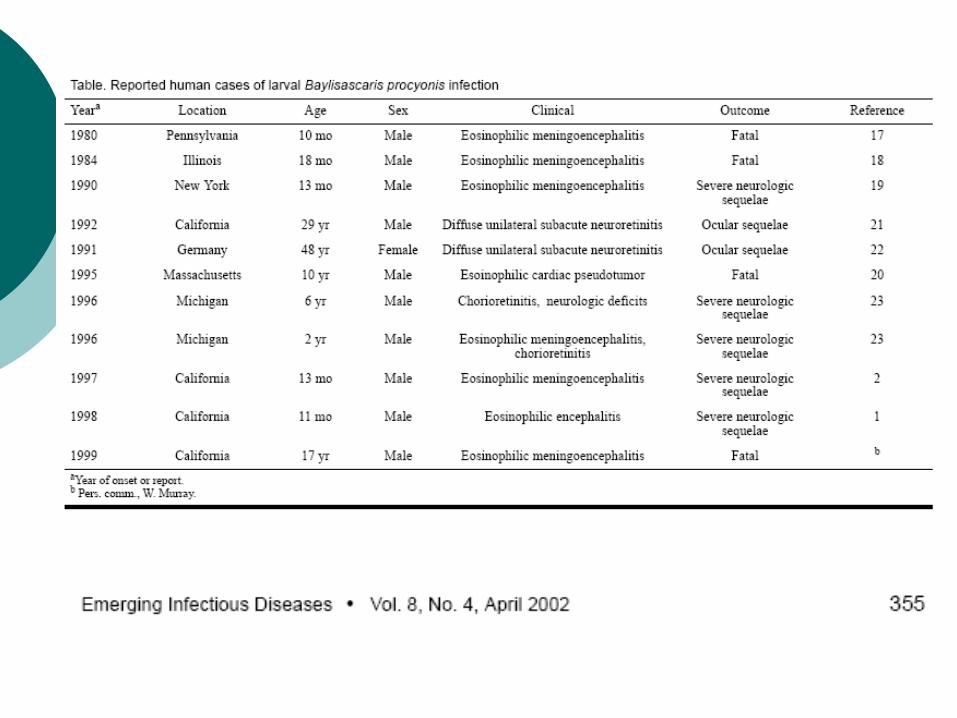
Proven human cases have been reported in California, Oregon, New York, Pennsylvania, Illinois, Michigan, and Minnesota, with a suspected case in Missouri.
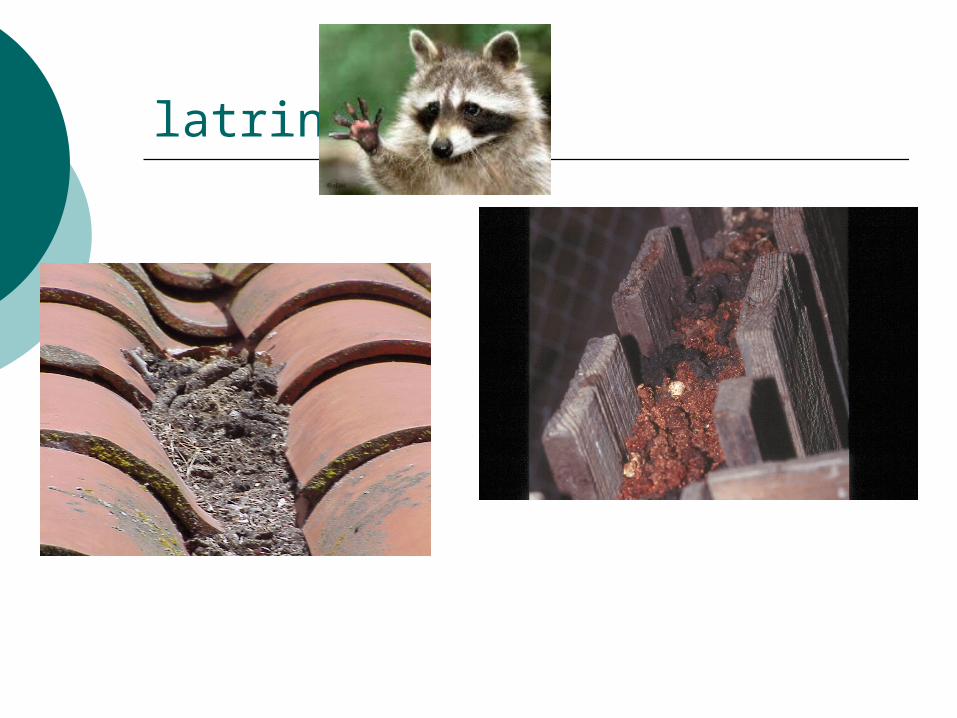
latrines
Study Objectives
Using data routinely collected through Winnipeg’s urban raccoon complaint and control program, estimate the geographic distribution of the raccoon population in Winnipeg model against ecological predictors
Habitat (rivers streams), abandoned houses, or houses in disrepair
Potential food sources (no of people, no. of restaurants, garbage disposal type (dumpster vs. non-dumpster neighborhoods)
Study Objectives cont’d
Assess temporal and spatial variations in B. procyonis infection in urban racoons Testing of racoon feces obtained at 52
designated latrine sites Necroptic analysis of raccoon
specimens supplied by Manitoba Conservation
Study Objectives cont’d
Assess potential risk to the human population (primarily children) of exposure to raccoon carried B. procyonis through geographic proximity analysis Identify geographic areas having high raccoon
densities and a high concentration of young children
Identify schools, daycares, parks, community centres and other relevant facilities in high risk areas
Study Protocol
Summer Student was hired to collect and enter data Raccoon complaint data from 2003 to
2007 were entered into a database and mapped (n=1119)
Latrine samples were collected and tested over the summer of 2007 (52 latrines, 2 samples per latrine).
Raccoon necropsies (n=114) were collected over the summer of 2007
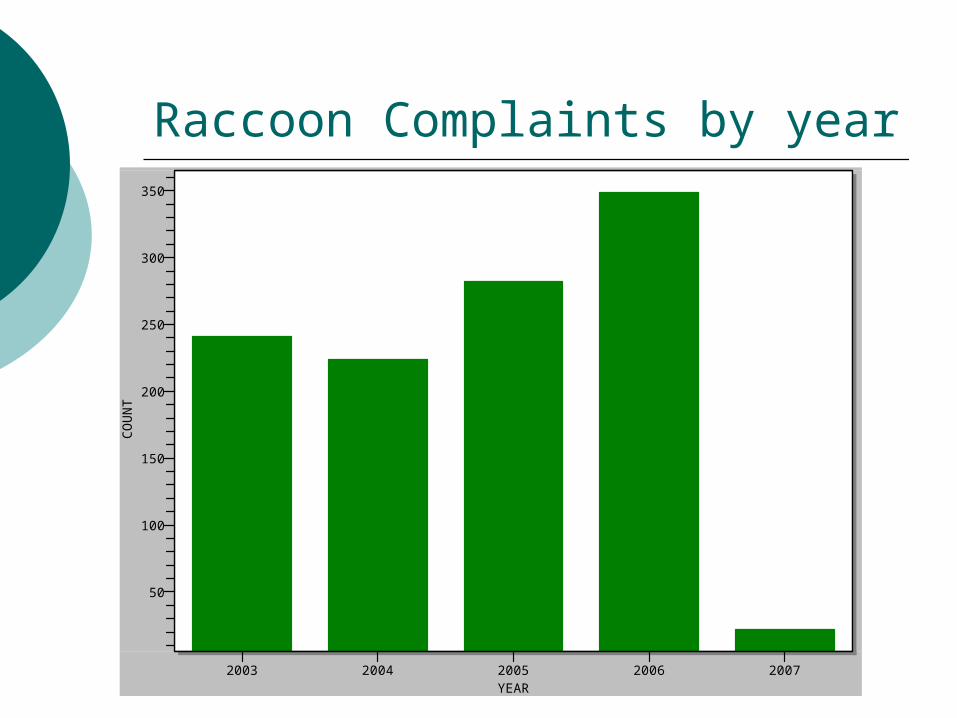
Raccoon Complaints by year
50
100
150
200
250
300
350
CO
UN
T
YEAR2003 2004 2005 2006 2007
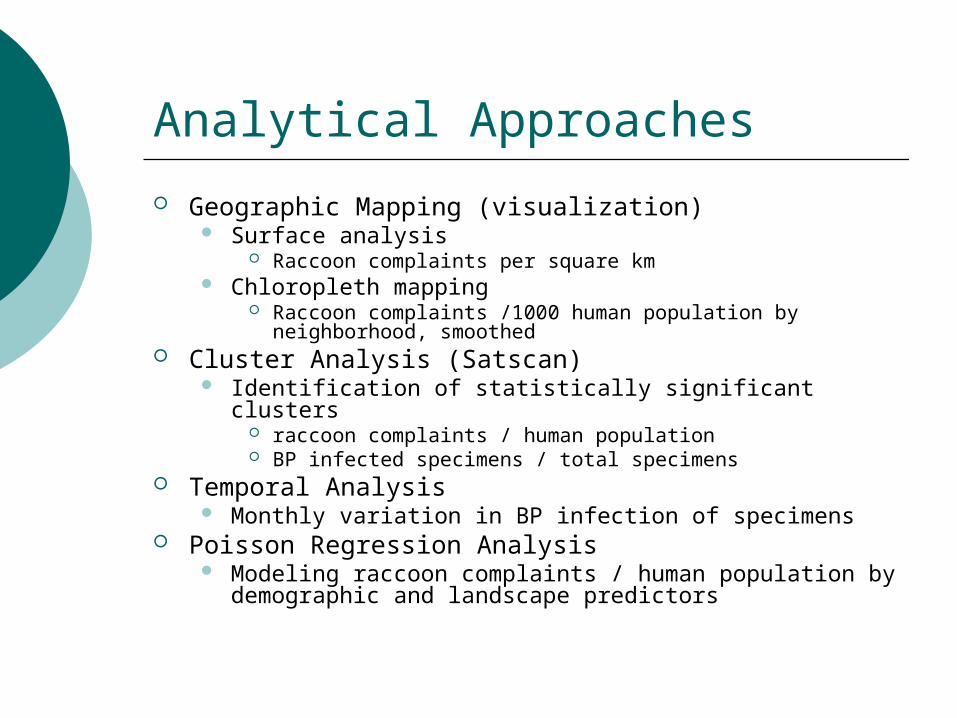
Analytical Approaches
Geographic Mapping (visualization) Surface analysis
Raccoon complaints per square km Chloropleth mapping
Raccoon complaints /1000 human population by neighborhood, smoothed
Cluster Analysis (Satscan) Identification of statistically significant clusters
raccoon complaints / human population BP infected specimens / total specimens
Temporal Analysis Monthly variation in BP infection of specimens
Poisson Regression Analysis Modeling raccoon complaints / human population by
demographic and landscape predictors
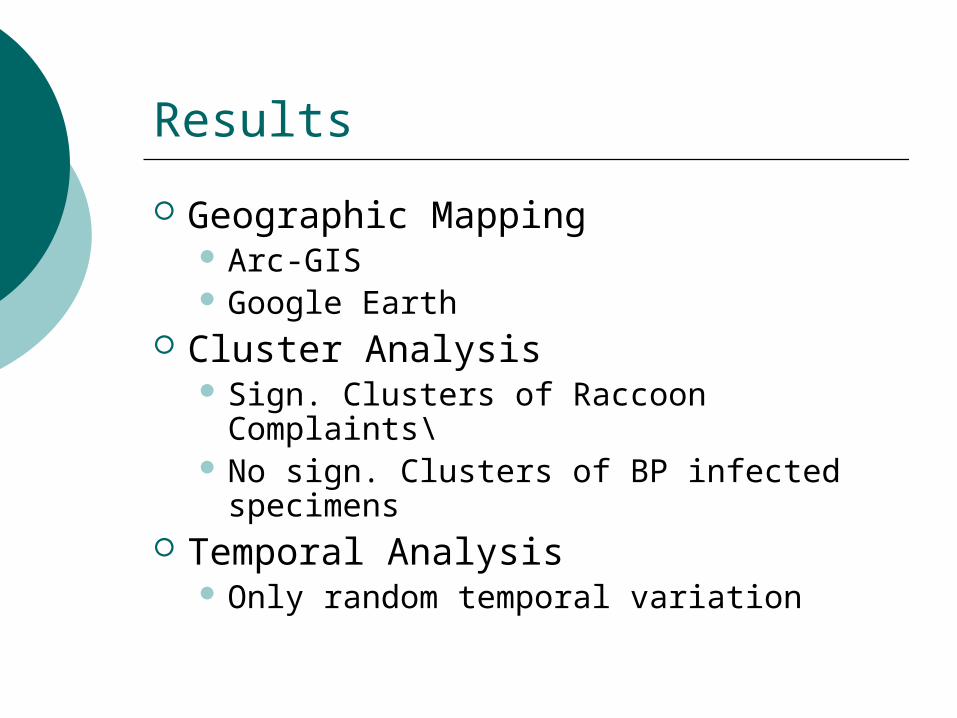
Results
Geographic Mapping Arc-GIS Google Earth
Cluster Analysis Sign. Clusters of Raccoon Complaints\ No sign. Clusters of BP infected
specimens Temporal Analysis
Only random temporal variation
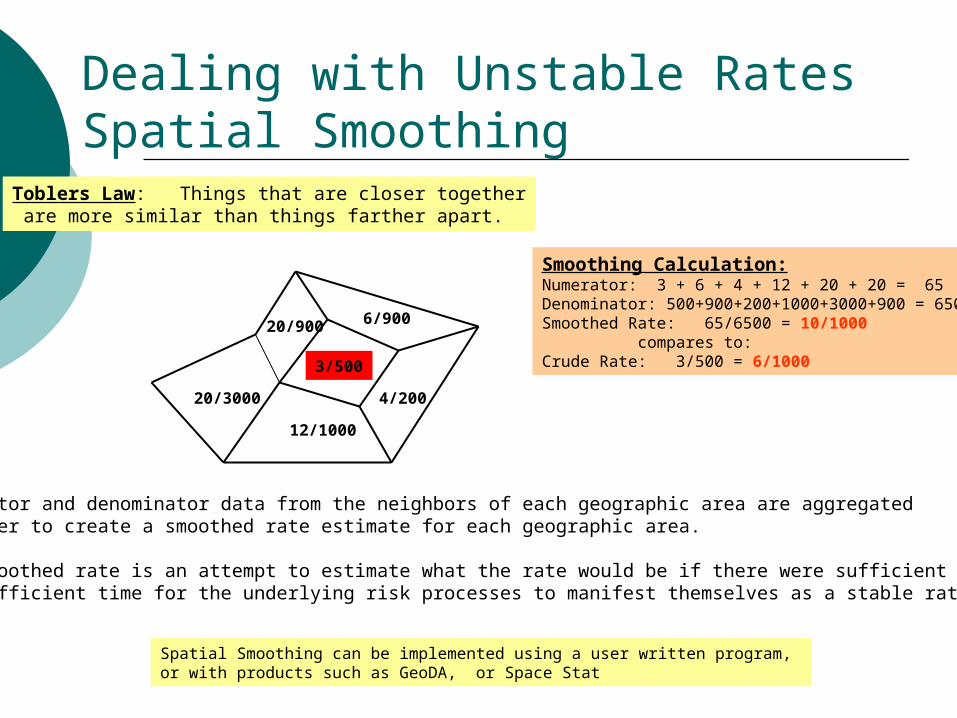
Toblers Law: Things that are closer together are more similar than things farther apart.
Numerator and denominator data from the neighbors of each geographic area are aggregatedin order to create a smoothed rate estimate for each geographic area.
The smoothed rate is an attempt to estimate what the rate would be if there were sufficient populationand sufficient time for the underlying risk processes to manifest themselves as a stable rate.
Smoothing Calculation: Numerator: 3 + 6 + 4 + 12 + 20 + 20 = 65Denominator: 500+900+200+1000+3000+900 = 6500Smoothed Rate: 65/6500 = 10/1000 compares to:Crude Rate: 3/500 = 6/10003/500
12/1000
4/20020/3000
6/90020/900
Spatial Smoothing can be implemented using a user written program, or with products such as GeoDA, or Space Stat
Dealing with Unstable RatesSpatial Smoothing
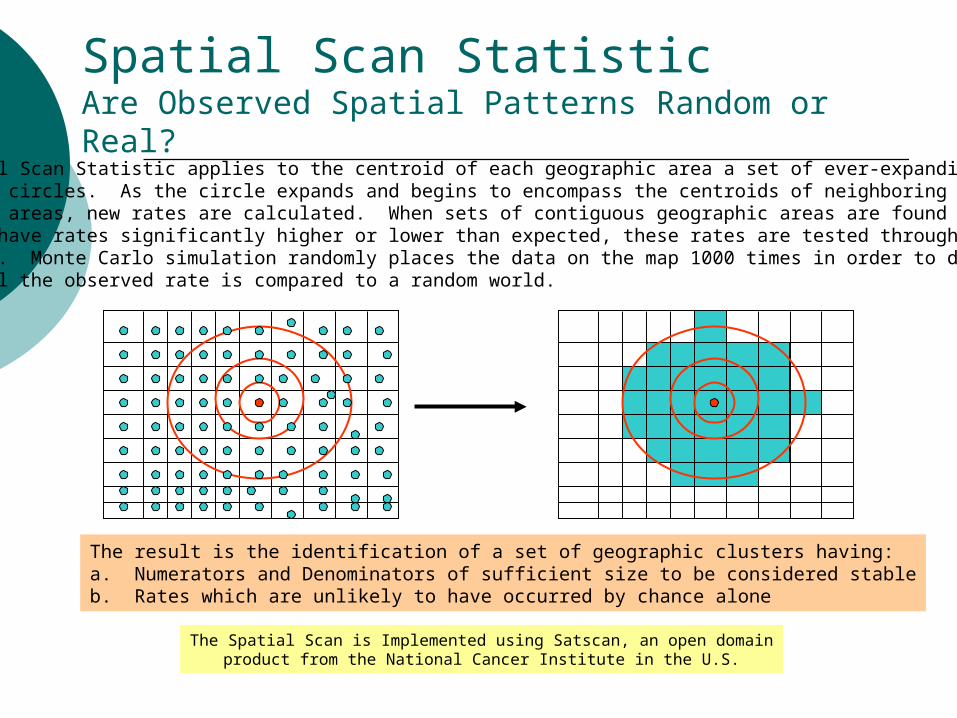
Spatial Scan StatisticAre Observed Spatial Patterns Random or Real?
The Spatial Scan Statistic applies to the centroid of each geographic area a set of ever-expandingconcentric circles. As the circle expands and begins to encompass the centroids of neighboringgeographic areas, new rates are calculated. When sets of contiguous geographic areas are found which appear to have rates significantly higher or lower than expected, these rates are tested through a Monte Carlo simulation. Monte Carlo simulation randomly places the data on the map 1000 times in order to determine how unusual the observed rate is compared to a random world.
The result is the identification of a set of geographic clusters having: a. Numerators and Denominators of sufficient size to be considered stableb. Rates which are unlikely to have occurred by chance alone
The Spatial Scan is Implemented using Satscan, an open domainproduct from the National Cancer Institute in the U.S.