Embed Size (px)
Citation preview
State of Curiosity Report 2016
BE CURIOUS
3 Chapter 1 Curiosity and Breakthroughs4 Chapter 2 Breaking Curiosity Down7 Chapter 3 Who are the Curious?11 Chapter 4 Fostering a Culture Full of Ideas14 Chapter 5 Industry Sectors18 Chapter 6 The Study19 Chapter 7 Conclusion
State of Curiosity Report 2016
Chapter 1
Curiosity and Breakthroughs
“ The important thing is not to stop questioning. Curiosity has its own reason for existing.” Albert Einstein
“ You cannot open a book without learning something.” Confucius
Curiosity. It’s a trait long associated with imagination and cre-ativity, with the artists, inventors, philosophers, and scientists of the world. More recently, we’ve seen how curiosity drives business and product innovation at companies.
A growing body of research tells us that curiosity may also make us better workers. For instance, studies have shown how piqued curiosity primes the brain to better retain new information and tell us that curiosity and effort combined have just as much effect on performance as intelligence. An applicant’s curiosity level may be more predictive of their abil-ity to perform their job and, once hired, curiosity may help the new employee socialize and adapt to the unfamiliar work environment. (See Appendix A for a full list of titles we at Merck identified as appropriately rigorous and explored in our literature review).
We know that curiosity matters. Curiosity and the pursuit of innovation have the potential to drive economic growth and benefit society.
“ Curiosity fuels business development and enables companies like ours to maintain our competitive edge.” Dr. Stefan Oschmann,
Chairman of the Board and CEO of Merck
Curiosity – the desire to learn and discover – is the beating heart of our work at Merck. It’s in our DNA. Our growth from a small pharmacy into a vibrant, global science and technology company is the result of generations of curious people open and willing to challenge the status quo to drive advancement. One gap our review of the literature on curiosity made imme-diately clear: No one has yet attempted to define the state of curiosity in the global workplace. How curious are the world’s employees while on the job? Do their employers value worker curiosity and, if so, do they actively nurture it? How is curiosity valued across industries, across generations, across national cultures? What barriers persist within workplace cultures that suppress curiosity, and what strategies can we identify that might help to eliminate them in order to create work environ-ments built to foster employee curiosity?
Our curiosity piqued, we embarked upon an extended investi-gation of our own to find answers to these questions. Partner-ing with curiosity experts, we built on the existing literature to define curiosity and establish a model by which to measure it. From there, our journey took us through several countries in Europe, across the Atlantic to the United States, and to China, engaging thousands of workers and dozens of academics, sci-entists, and business leaders along the way through surveys, interviews, and focus groups.
The result of our investigative journey, the Merck State of Curiosity Report, is the first-ever broad look at the state of curiosity in the contemporary workplace. It marks a bold first step in the movement to unlock the power of curiosity to drive scientific discoveries, innovation, and economic success in a rapidly changing market.
We’d now like to share what we’ve learned.
Curiosity and Breakthrough Chapter 1 Curiosity Report 3
Chapter 2
Breaking Curiosity Down
In order to measure something like curiosity, it’s helpful to first establish an accepted definition and then to break it down into measurable units.
Early research identified curiosity as a necessary attribute for exploration. A system of categorization was developed that outlined two distinct dimensions of curiosity: In the first, curi-osity becomes activated in response to stimuli and further stimulates a more general desire for knowledge. In the sec-ond, curiosity arises with a desire for a particular piece of information, which leads to a more general desire for stimula-tion, often to avoid boredom.
While these categorizations may help us to understand curios-ity as a concept, we wanted to create a measure to explore curiosity on a more practical level.
If we think about curiosity as a state of being, we might agree that it involves recognizing, seeking out, and even preferring things that are new, unusual, and outside of one’s normal experience.
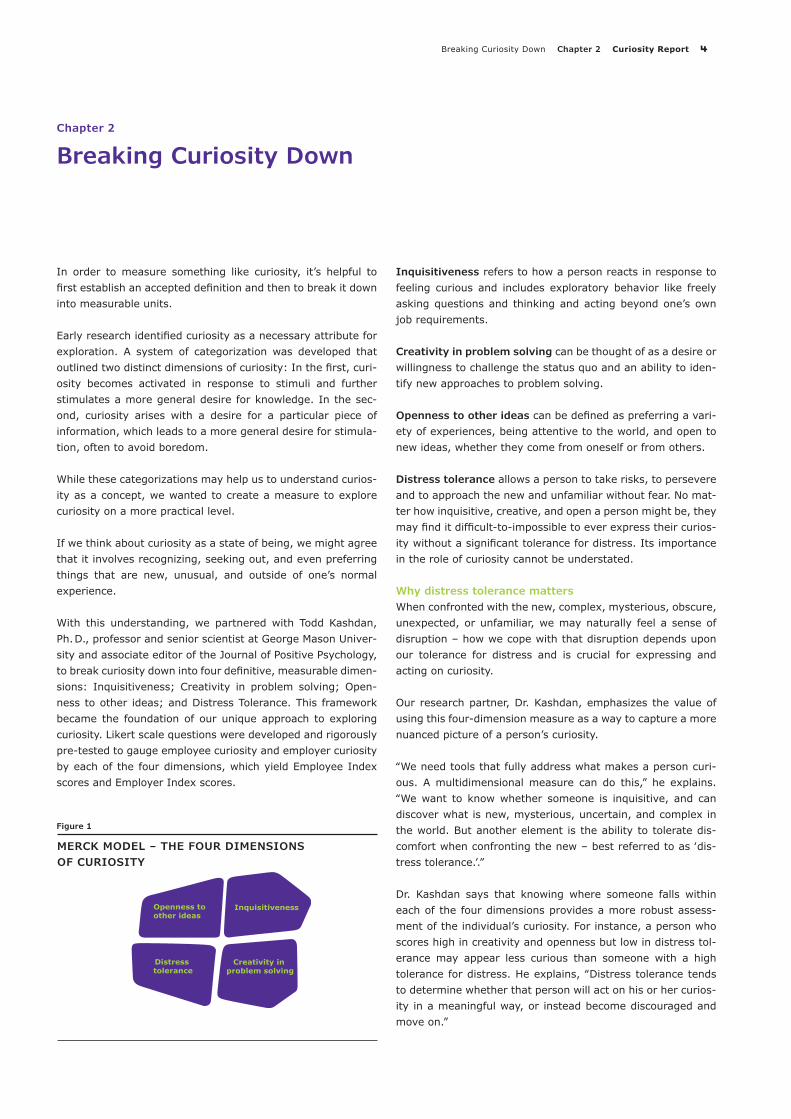
With this understanding, we partnered with Todd Kashdan, Ph. D., professor and senior scientist at George Mason Univer-sity and associate editor of the Journal of Positive Psychology, to break curiosity down into four definitive, measurable dimen-sions: Inquisitiveness; Creativity in problem solving; Open-ness to other ideas; and Distress Tolerance. This framework became the foundation of our unique approach to exploring curiosity. Likert scale questions were developed and rigorously pre-tested to gauge employee curiosity and employer curiosity by each of the four dimensions, which yield Employee Index scores and Employer Index scores.
Figure 1
MERCK MODEL – THE FOUR DIMENSIONS OF CURIOSITY
Inquisitiveness refers to how a person reacts in response to feeling curious and includes exploratory behavior like freely asking questions and thinking and acting beyond one’s own job requirements.
Creativity in problem solving can be thought of as a desire or willingness to challenge the status quo and an ability to iden-tify new approaches to problem solving.
Openness to other ideas can be defined as preferring a vari-ety of experiences, being attentive to the world, and open to new ideas, whether they come from oneself or from others.
Distress tolerance allows a person to take risks, to persevere and to approach the new and unfamiliar without fear. No mat-ter how inquisitive, creative, and open a person might be, they may find it difficult-to-impossible to ever express their curios-ity without a significant tolerance for distress. Its importance in the role of curiosity cannot be understated.
Why distress tolerance mattersWhen confronted with the new, complex, mysterious, obscure, unexpected, or unfamiliar, we may naturally feel a sense of disruption – how we cope with that disruption depends upon our tolerance for distress and is crucial for expressing and acting on curiosity.
Our research partner, Dr. Kashdan, emphasizes the value of using this four-dimension measure as a way to capture a more nuanced picture of a person’s curiosity.
‟We need tools that fully address what makes a person curi-ous. A multidimensional measure can do this,” he explains. ‟We want to know whether someone is inquisitive, and can discover what is new, mysterious, uncertain, and complex in the world. But another element is the ability to tolerate dis-comfort when confronting the new – best referred to as ‛dis-tress tolerance.’.”
Dr. Kashdan says that knowing where someone falls within each of the four dimensions provides a more robust assess-ment of the individual’s curiosity. For instance, a person who scores high in creativity and openness but low in distress tol-erance may appear less curious than someone with a high tolerance for distress. He explains, ‟Distress tolerance tends to determine whether that person will act on his or her curios-ity in a meaningful way, or instead become discouraged and move on.”
Openness to other ideas
Inquisitiveness
Creativity in problem solving
Distress tolerance
Breaking Curiosity Down Chapter 2 Curiosity Report 4
‟We can help people become more curious by providing a safe haven where their anxious feelings and thoughts are vali-dated, understood, and cared for by another person,” Dr. Kashdan concludes. In other words, a workplace environment that provides a safe haven for risk encourages curiosity and innovation in all employees.
What the surveys foundOnline surveys were conducted in China, Germany, and the United States with over 3,000 full-time workers. The research began in 2015 with workers in the United States and was expanded to include China and Germany in 2016. Chapter Six, ‟The Study,” explores the research methodology and the ratio-nale behind why these countries are important for curiosity research.
In each of the surveys, participants responded to questions about their own workplace curiosity across all four dimen-sions, and they also answered questions tagged to each of the four dimensions that gauged how supportive their organiza-tions were of employee curiosity, resulting in two sets of curi-osity measures:
• employee scores: how individual respondents self-reported on their own curiosity across the four dimensions; and
• employer scores: how individual respondents reported on how their organizations support their practice of curiosity across the dimensions.
Below are the overall employee and employer curiosity scores on a scale of 0–100, from all respondents surveyed.
Figure 2
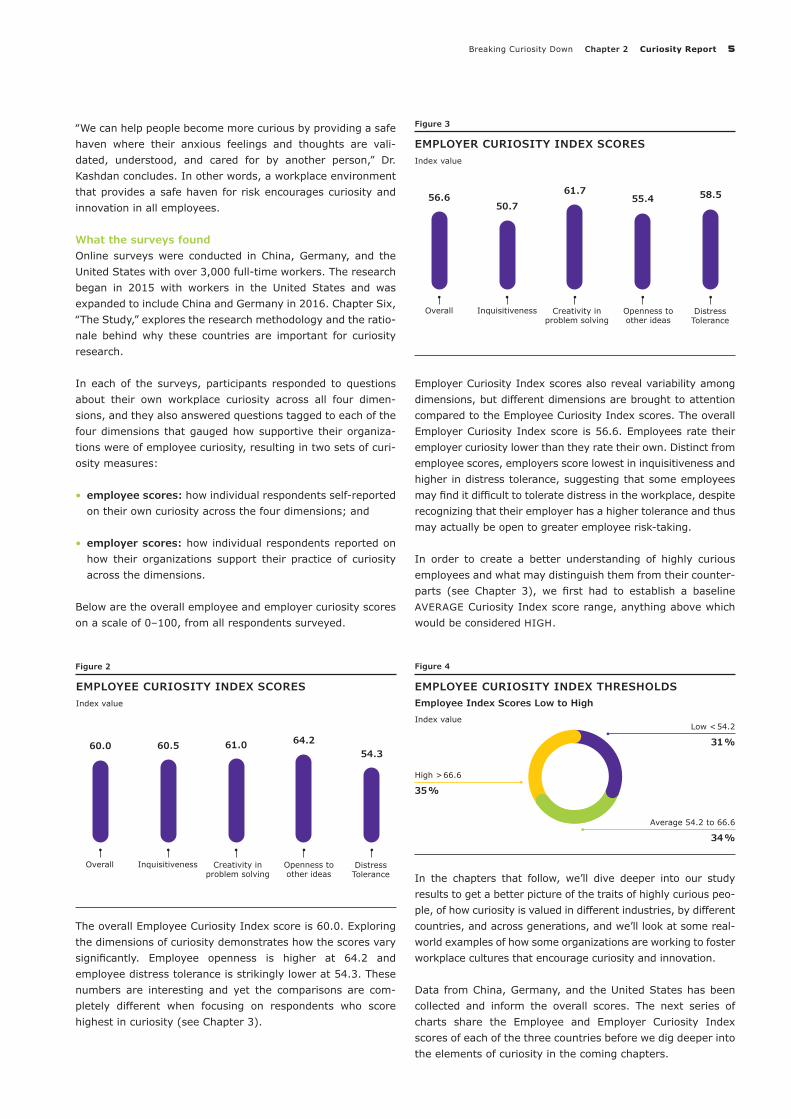
EMPLOYEE CURIOSITY INDEX SCORESIndex value
60.054.3
64.260.5 61.0
The overall Employee Curiosity Index score is 60.0. Exploring the dimensions of curiosity demonstrates how the scores vary significantly. Employee openness is higher at 64.2 and employee distress tolerance is strikingly lower at 54.3. These numbers are interesting and yet the comparisons are com-pletely different when focusing on respondents who score highest in curiosity (see Chapter 3).
Employer Curiosity Index scores also reveal variability among dimensions, but different dimensions are brought to attention compared to the Employee Curiosity Index scores. The overall Employer Curiosity Index score is 56.6. Employees rate their employer curiosity lower than they rate their own. Distinct from employee scores, employers score lowest in inquisitiveness and higher in distress tolerance, suggesting that some employees may find it difficult to tolerate distress in the workplace, despite recognizing that their employer has a higher tolerance and thus may actually be open to greater employee risk-taking.
In order to create a better understanding of highly curious employees and what may distinguish them from their counter-parts (see Chapter 3), we first had to establish a baseline AVERAGE Curiosity Index score range, anything above which would be considered HIGH.
EMPLOYEE CURIOSITY INDEX THRESHOLDSEmployee Index Scores Low to High
Index valueLow < 54.2
31 %
High > 66.6
35 %
Average 54.2 to 66.6
34 %
In the chapters that follow, we’ll dive deeper into our study results to get a better picture of the traits of highly curious peo-ple, of how curiosity is valued in different industries, by different countries, and across generations, and we’ll look at some real-world examples of how some organizations are working to foster workplace cultures that encourage curiosity and innovation.
Data from China, Germany, and the United States has been collected and inform the overall scores. The next series of charts share the Employee and Employer Curiosity Index scores of each of the three countries before we dig deeper into the elements of curiosity in the coming chapters.
Figure 4
Figure 3
EMPLOYER CURIOSITY INDEX SCORESIndex value
Overall Creativity in problem solving
Openness toother ideas
DistressTolerance
56.6 58.555.450.7
61.7
Inquisitiveness
Overall Creativity in problem solving
Openness toother ideas
DistressTolerance
Inquisitiveness
Breaking Curiosity Down Chapter 2 Curiosity Report 5
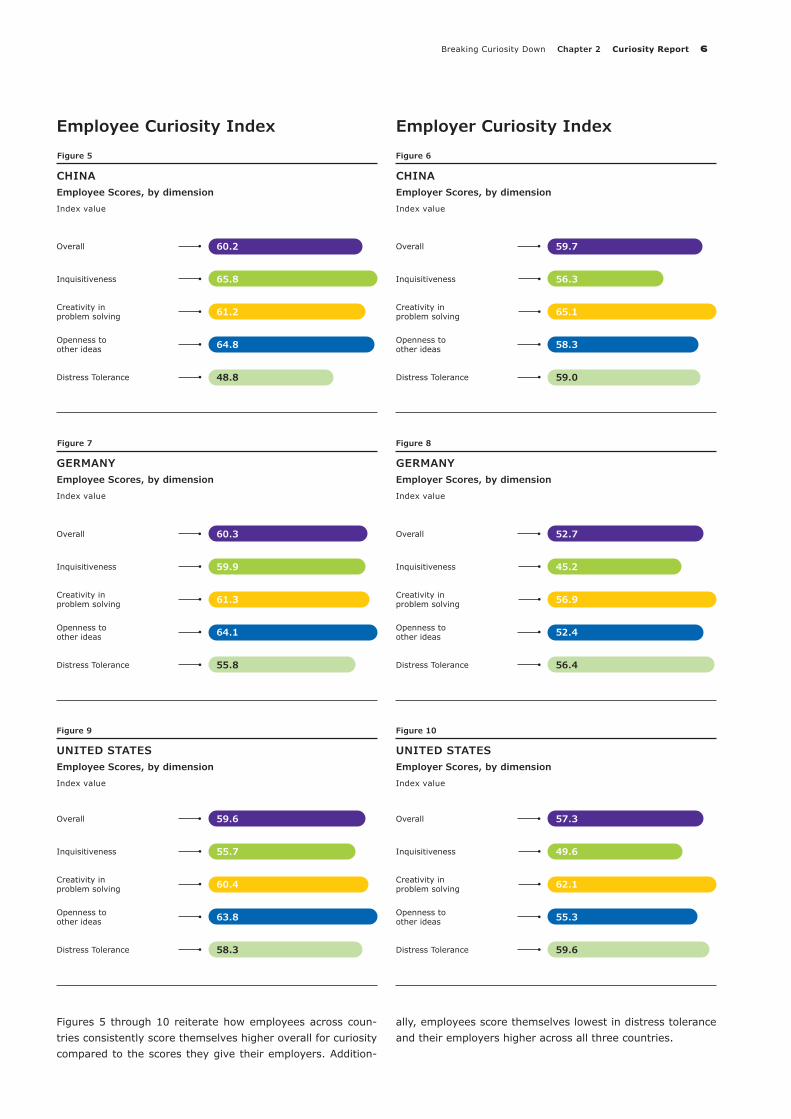
CHINAEmployee Scores, by dimension
Index value
60.2Overall
48.8Distress Tolerance
64.8Openness to other ideas
65.8Inquisitiveness
61.2Creativity in problem solving
CHINAEmployer Scores, by dimension
Index value
59.7Overall
59.0Distress Tolerance
58.3Openness to other ideas
56.3Inquisitiveness
65.1Creativity in problem solving
GERMANYEmployee Scores, by dimension
Index value
60.3Overall
55.8Distress Tolerance
64.1Openness to other ideas
59.9Inquisitiveness
61.3Creativity in problem solving
UNITED STATESEmployee Scores, by dimension
Index value
59.6Overall
58.3Distress Tolerance
63.8Openness to other ideas
55.7Inquisitiveness
60.4Creativity in problem solving
UNITED STATESEmployer Scores, by dimension
Index value
57.3Overall
59.6Distress Tolerance
55.3Openness to other ideas
49.6Inquisitiveness
62.1Creativity in problem solving
Figures 5 through 10 reiterate how employees across coun-tries consistently score themselves higher overall for curiosity compared to the scores they give their employers. Addition-
ally, employees score themselves lowest in distress tolerance and their employers higher across all three countries.
GERMANYEmployer Scores, by dimension
Index value
52.7Overall
56.4Distress Tolerance
52.4Openness to other ideas
45.2Inquisitiveness
56.9Creativity in problem solving
Employee Curiosity Index Employer Curiosity Index
Figure 5
Figure 7
Figure 9 Figure 10
Figure 8
Figure 6
Breaking Curiosity Down Chapter 2 Curiosity Report 6
Chapter 3
Who are the Curious?
‟Curiosity is a must for innovation. It is very important for people who work on R & D. Only if people are curious about something, are they able to come up with new ideas on how to upgrade a product or service, or to improve the current situa-tion.” – Focus group participant, China
‟Curiosity is vital. If you are curious, you might start observing others. Each innovation comes from an idea, which is gener-ated from something else. You can’t innovate if you have noth-ing to look at, to use for reference, or even to mimic.” – Focus group participant, China
Curious employees help companies think about and develop breakthrough innovation. In our last chapter, we outlined a way to measure curiosity; in this chapter we’ll look at what our study tells us about curious people: Who are they? What traits do they exhibit? Are younger people more curious than their elders? What motivates them and what do they bring to the workplace?
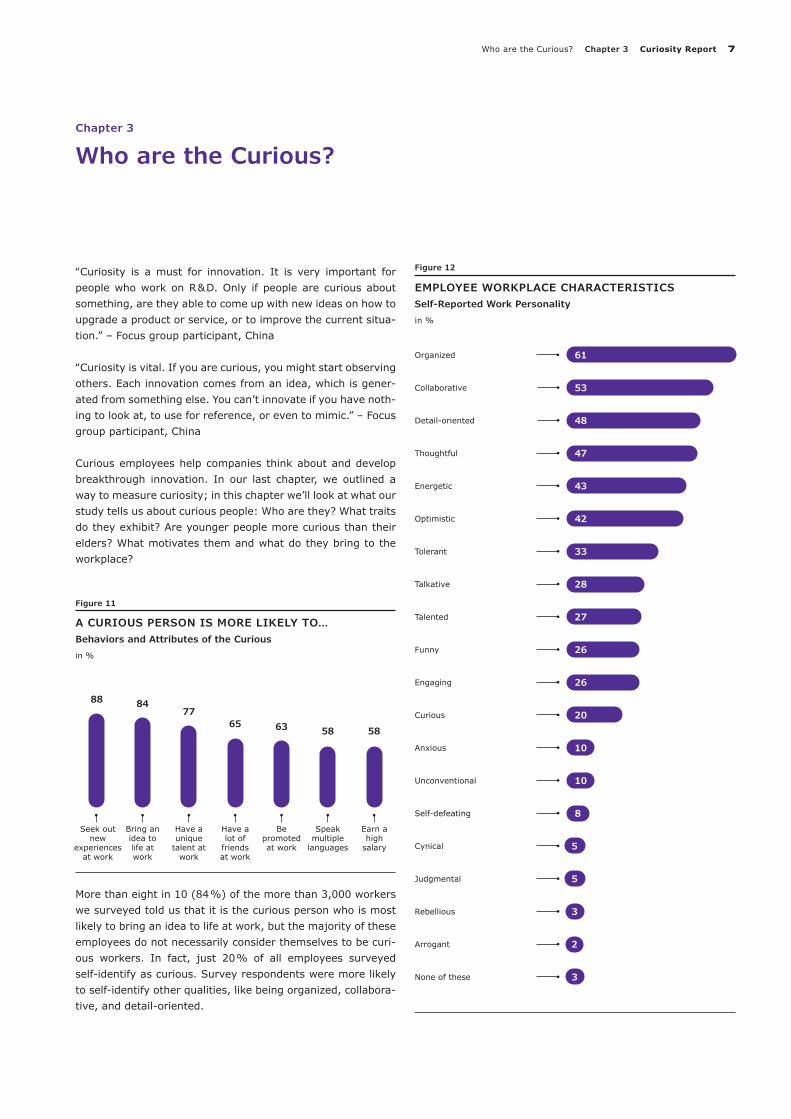
More than eight in 10 (84 %) of the more than 3,000 workers we surveyed told us that it is the curious person who is most likely to bring an idea to life at work, but the majority of these employees do not necessarily consider themselves to be curi-ous workers. In fact, just 20 % of all employees surveyed self-identify as curious. Survey respondents were more likely to self-identify other qualities, like being organized, collabora-tive, and detail-oriented.
EMPLOYEE WORKPLACE CHARACTERISTICSSelf-Reported Work Personality
in %
61Organized
43
42
33
28
27
26
26
20
10
10
8
5
5
3
2
3
Energetic
Optimistic
Tolerant
Talkative
Talented
Funny
Engaging
Curious
Anxious
Unconventional
Self-defeating
Cynical
Judgmental
Rebellious
Arrogant
None of these
47Thoughtful
53Collaborative
48Detail-oriented
Figure 11
A CURIOUS PERSON IS MORE LIKELY TO…Behaviors and Attributes of the Curious
in %
Seek out new
experiencesat work
88
Be promoted at work
63
Speak multiple
languages
58
Earn ahigh
salary
58
Have a lot of
friends at work
65
Bring anidea to life at work
84
Have aunique
talent atwork
77
Figure 12
Who are the Curious? Chapter 3 Curiosity Report 7
This doesn’t mean that workers are necessarily less curious people than they are collaborative; a worker may simply be less apt to express curiosity if curiosity is not recognized and rewarded in the workplace.
In addition, workers who self-identify as curious receive an AVERAGE on the Curiosity Index (65.7). Believing oneself to be curious does not necessarily equate to being curious.
There are, however, traits shared by curious people; for instance, those who scored HIGH on the Curiosity Index tended to say they were decision-makers, have job satisfac-tion, and feel they work at an organization encouraging of curiosity. These workers also feel they are collaborative, orga-nized, and thoughtful.
Decision-makersWhen we break out Curiosity Index scores by how much, if any, decision-making influence an employee has, the workers with final decision-making influence score HIGH in curiosity compared to those with less authority.
Figure 13
EMPLOYEE CURIOSITY INDEX SCORES OF DECISION-MAKERSIndex value
62.2
Some or Siginifcant
Decision-Making Influence
Final Decision-Making
Influence
68.4
51.2
No Decision-Making
Influence
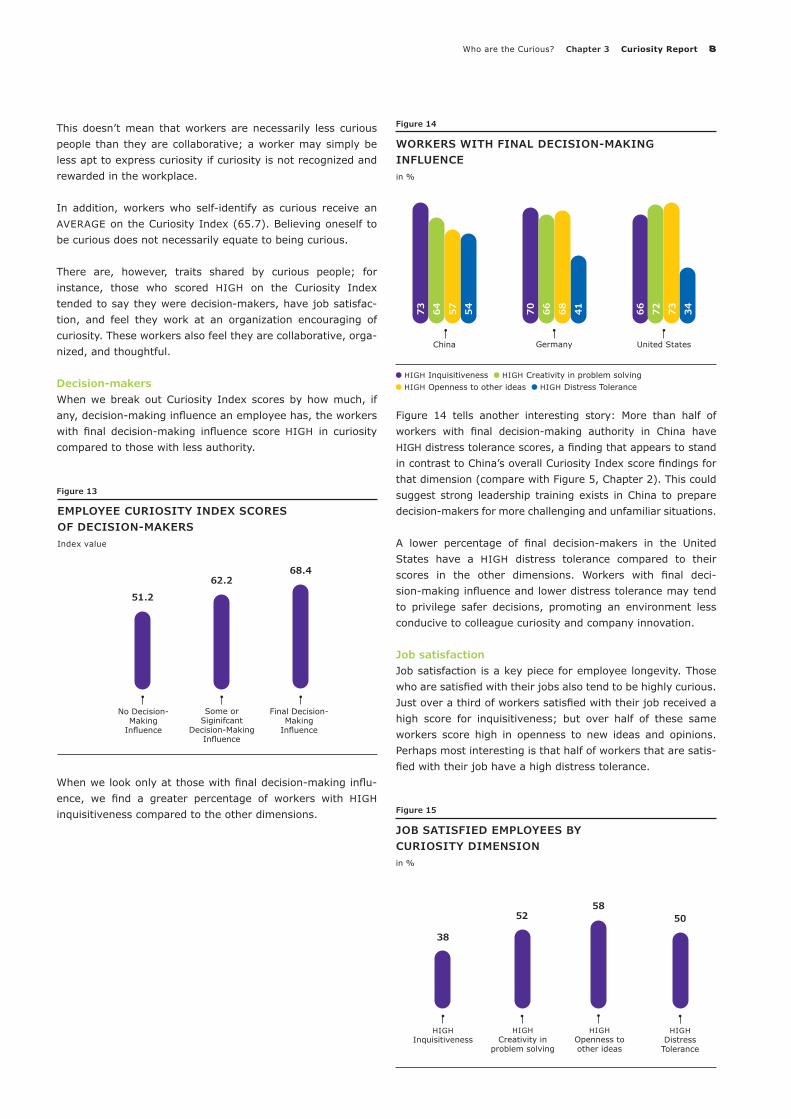
When we look only at those with final decision-making influ-ence, we find a greater percentage of workers with HIGH inquisitiveness compared to the other dimensions.
WORKERS WITH FINAL DECISION-MAKING INFLUENCEin %
China
73 64 5457
Germany
70 66 4168
United States
66 72 3473
HIGH Inquisitiveness HIGH Creativity in problem solving HIGH Openness to other ideas HIGH Distress Tolerance
Figure 14 tells another interesting story: More than half of workers with final decision-making authority in China have HIGH distress tolerance scores, a finding that appears to stand in contrast to China’s overall Curiosity Index score findings for that dimension (compare with Figure 5, Chapter 2). This could suggest strong leadership training exists in China to prepare decision-makers for more challenging and unfamiliar situations.
A lower percentage of final decision-makers in the United States have a HIGH distress tolerance compared to their scores in the other dimensions. Workers with final deci-sion-making influence and lower distress tolerance may tend to privilege safer decisions, promoting an environment less conducive to colleague curiosity and company innovation.
Job satisfactionJob satisfaction is a key piece for employee longevity. Those who are satisfied with their jobs also tend to be highly curious. Just over a third of workers satisfied with their job received a high score for inquisitiveness; but over half of these same workers score high in openness to new ideas and opinions. Perhaps most interesting is that half of workers that are satis-fied with their job have a high distress tolerance.
JOB SATISFIED EMPLOYEES BY CURIOSITY DIMENSIONin %
52
HIGH Creativity in
problem solving
58
HIGH Distress
Tolerance
50
38
HIGH Inquisitiveness
Figure 15
Figure 14
HIGH Openness toother ideas
Who are the Curious? Chapter 3 Curiosity Report 8
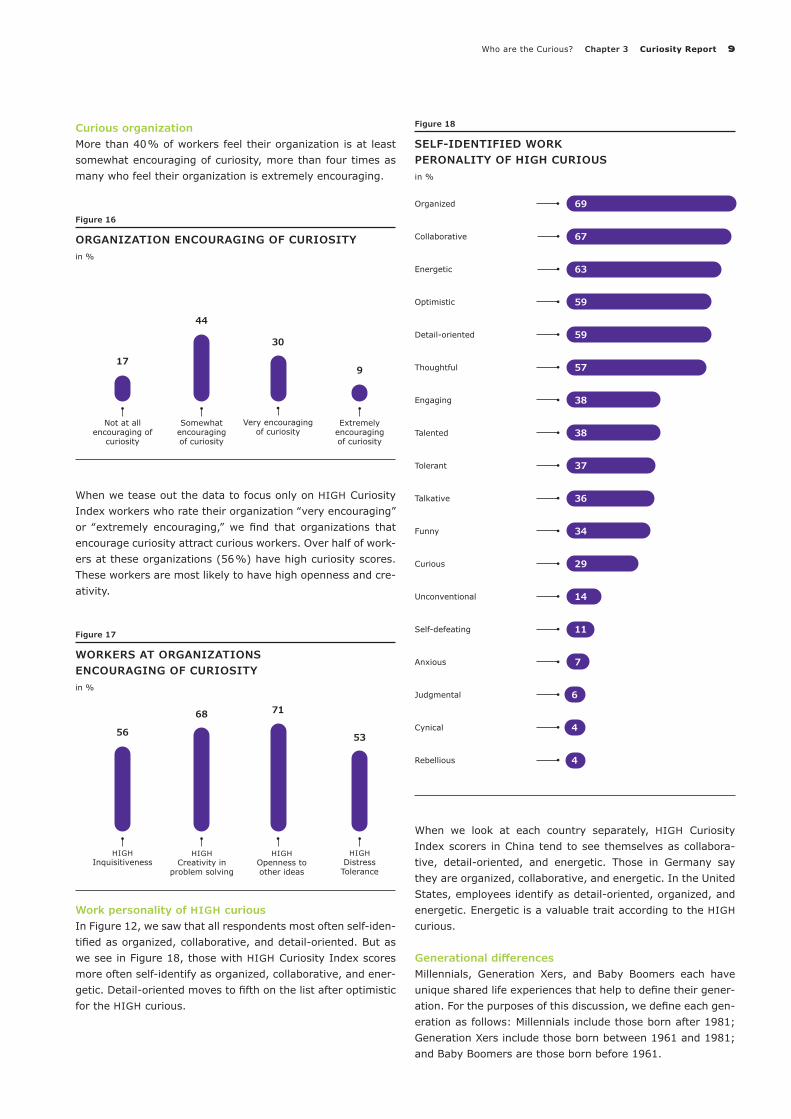
Curious organizationMore than 40 % of workers feel their organization is at least somewhat encouraging of curiosity, more than four times as many who feel their organization is extremely encouraging.
ORGANIZATION ENCOURAGING OF CURIOSITYin %
44
Somewhat encouraging of curiosity
Very encouraging of curiosity
30
Extremely encouraging of curiosity
917
Not at all encouraging of
curiosity
When we tease out the data to focus only on HIGH Curiosity Index workers who rate their organization ‟very encouraging” or ‟extremely encouraging,” we find that organizations that encourage curiosity attract curious workers. Over half of work-ers at these organizations (56 %) have high curiosity scores. These workers are most likely to have high openness and cre-ativity.
WORKERS AT ORGANIZATIONS ENCOURAGING OF CURIOSITYin %
68
HIGH Openness toother ideas
71
HIGH Distress
Tolerance
5356
HIGH Inquisitiveness
Work personality of HIGH curiousIn Figure 12, we saw that all respondents most often self-iden-tified as organized, collaborative, and detail-oriented. But as we see in Figure 18, those with HIGH Curiosity Index scores more often self-identify as organized, collaborative, and ener-getic. Detail-oriented moves to fifth on the list after optimistic for the HIGH curious.
SELF-IDENTIFIED WORK PERONALITY OF HIGH CURIOUSin %
69Organized
59
57
38
38
37
36
34
29
14
11
7
6
4
4
Detail-oriented
Thoughtful
Engaging
Talented
Tolerant
Talkative
Funny
Curious
Unconventional
Self-defeating
Anxious
Judgmental
Cynical
Rebellious
59Optimistic
67Collaborative
63Energetic
When we look at each country separately, HIGH Curiosity Index scorers in China tend to see themselves as collabora-tive, detail-oriented, and energetic. Those in Germany say they are organized, collaborative, and energetic. In the United States, employees identify as detail-oriented, organized, and energetic. Energetic is a valuable trait according to the HIGH curious.
Generational differencesMillennials, Generation Xers, and Baby Boomers each have unique shared life experiences that help to define their gener-ation. For the purposes of this discussion, we define each gen-eration as follows: Millennials include those born after 1981; Generation Xers include those born between 1961 and 1981; and Baby Boomers are those born before 1961.
Figure 16
Figure 17
Figure 18
HIGH Creativity in
problem solving
Who are the Curious? Chapter 3 Curiosity Report 9
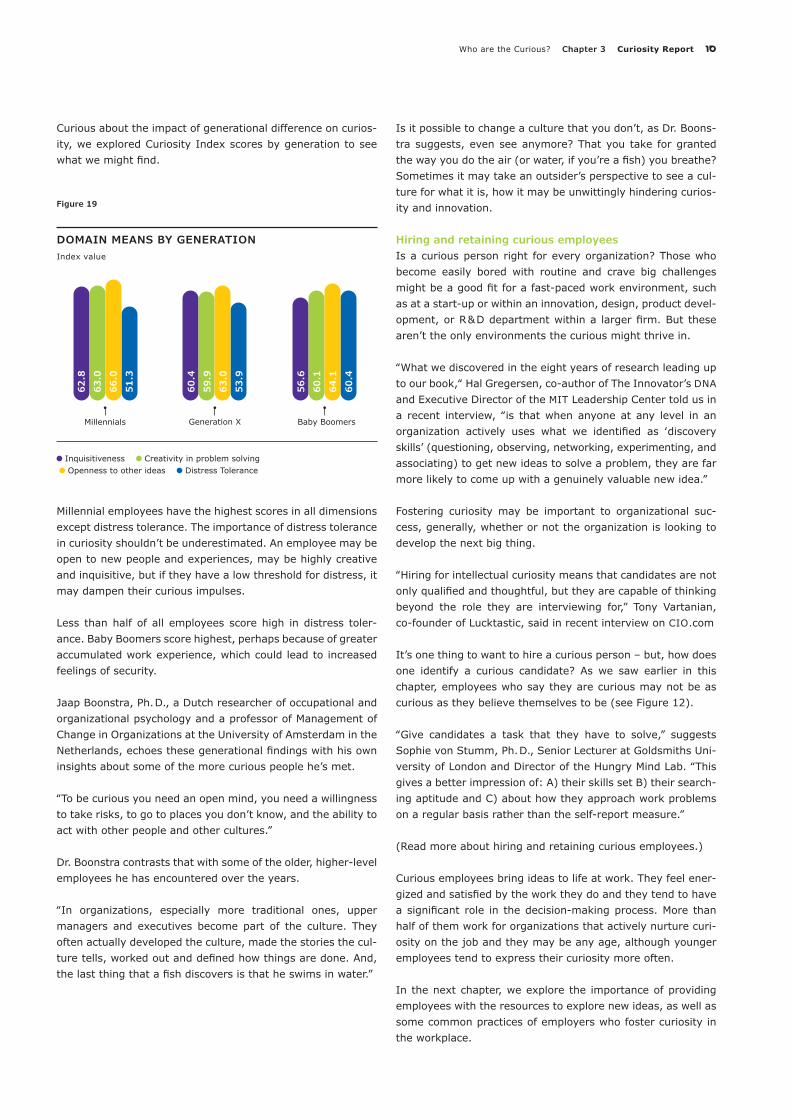
Curious about the impact of generational difference on curios-ity, we explored Curiosity Index scores by generation to see what we might find.
Millennial employees have the highest scores in all dimensions except distress tolerance. The importance of distress tolerance in curiosity shouldn’t be underestimated. An employee may be open to new people and experiences, may be highly creative and inquisitive, but if they have a low threshold for distress, it may dampen their curious impulses.
Less than half of all employees score high in distress toler-ance. Baby Boomers score highest, perhaps because of greater accumulated work experience, which could lead to increased feelings of security.
Jaap Boonstra, Ph. D., a Dutch researcher of occupational and organizational psychology and a professor of Management of Change in Organizations at the University of Amsterdam in the Netherlands, echoes these generational findings with his own insights about some of the more curious people he’s met.
‟To be curious you need an open mind, you need a willingness to take risks, to go to places you don’t know, and the ability to act with other people and other cultures.”
Dr. Boonstra contrasts that with some of the older, higher-level employees he has encountered over the years.
‟In organizations, especially more traditional ones, upper managers and executives become part of the culture. They often actually developed the culture, made the stories the cul-ture tells, worked out and defined how things are done. And, the last thing that a fish discovers is that he swims in water.”
Is it possible to change a culture that you don’t, as Dr. Boons-tra suggests, even see anymore? That you take for granted the way you do the air (or water, if you’re a fish) you breathe? Sometimes it may take an outsider’s perspective to see a cul-ture for what it is, how it may be unwittingly hindering curios-ity and innovation.
Hiring and retaining curious employees Is a curious person right for every organization? Those who become easily bored with routine and crave big challenges might be a good fit for a fast-paced work environment, such as at a start-up or within an innovation, design, product devel-opment, or R & D department within a larger firm. But these aren’t the only environments the curious might thrive in.
‟What we discovered in the eight years of research leading up to our book,‟ Hal Gregersen, co-author of The Innovator’s DNA and Executive Director of the MIT Leadership Center told us in a recent interview, ‟is that when anyone at any level in an organization actively uses what we identified as ‛discovery skills’ (questioning, observing, networking, experimenting, and associating) to get new ideas to solve a problem, they are far more likely to come up with a genuinely valuable new idea.”
Fostering curiosity may be important to organizational suc-cess, generally, whether or not the organization is looking to develop the next big thing.
‟Hiring for intellectual curiosity means that candidates are not only qualified and thoughtful, but they are capable of thinking beyond the role they are interviewing for,” Tony Vartanian, co-founder of Lucktastic, said in recent interview on CIO.com
It’s one thing to want to hire a curious person – but, how does one identify a curious candidate? As we saw earlier in this chapter, employees who say they are curious may not be as curious as they believe themselves to be (see Figure 12).
‟Give candidates a task that they have to solve,” suggests Sophie von Stumm, Ph. D., Senior Lecturer at Goldsmiths Uni-versity of London and Director of the Hungry Mind Lab. ‟This gives a better impression of: A) their skills set B) their search-ing aptitude and C) about how they approach work problems on a regular basis rather than the self-report measure.”
(Read more about hiring and retaining curious employees.)
Curious employees bring ideas to life at work. They feel ener-gized and satisfied by the work they do and they tend to have a significant role in the decision-making process. More than half of them work for organizations that actively nurture curi-osity on the job and they may be any age, although younger employees tend to express their curiosity more often.
In the next chapter, we explore the importance of providing employees with the resources to explore new ideas, as well as some common practices of employers who foster curiosity in the workplace.
Figure 19
DOMAIN MEANS BY GENERATIONIndex value
Millennials
62.8
63.0
51.3
66.0
Generation X
60.4
59.9
53.9
63.0
Baby Boomers
56.6
60.1
60.4
64.1
Inquisitiveness Creativity in problem solving Openness to other ideas Distress Tolerance
Who are the Curious? Chapter 3 Curiosity Report 10
Chapter 4
Fostering a Culture Full of Ideas
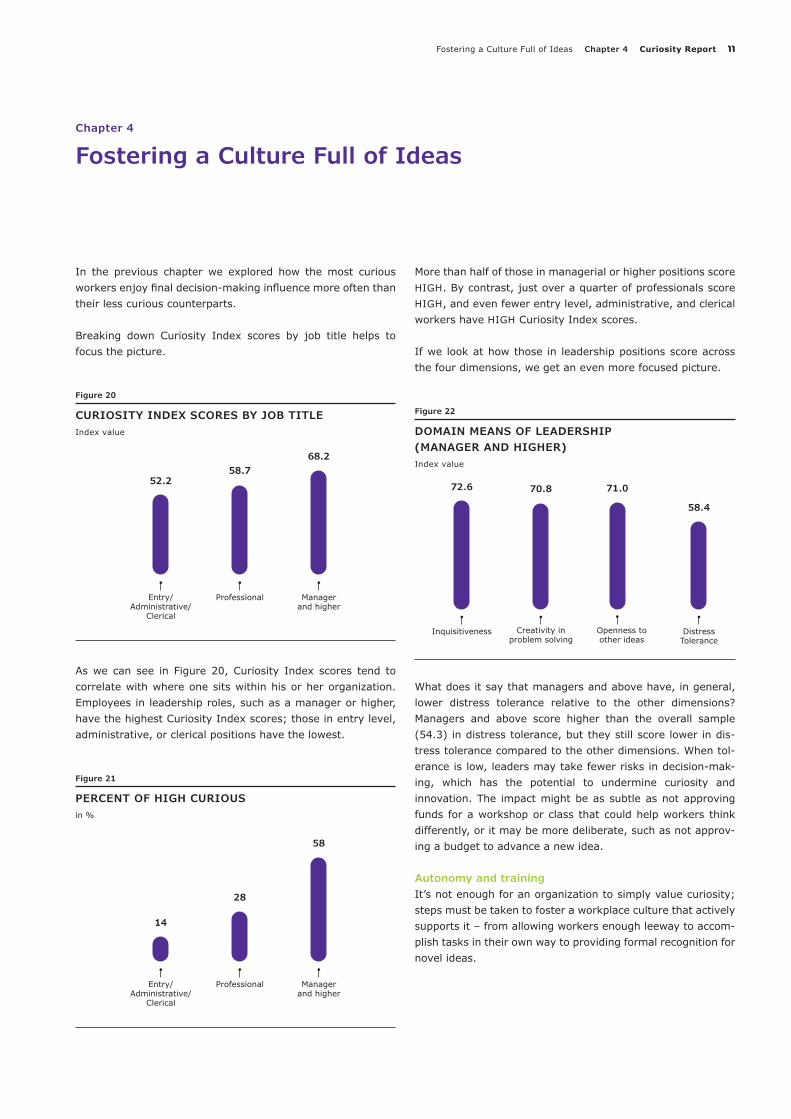
In the previous chapter we explored how the most curious workers enjoy final decision-making influence more often than their less curious counterparts.
Breaking down Curiosity Index scores by job title helps to focus the picture.
CURIOSITY INDEX SCORES BY JOB TITLEIndex value
58.7
Professional Manager and higher
68.2
52.2
Entry/ Administrative/
Clerical
As we can see in Figure 20, Curiosity Index scores tend to correlate with where one sits within his or her organization. Employees in leadership roles, such as a manager or higher, have the highest Curiosity Index scores; those in entry level, administrative, or clerical positions have the lowest.
PERCENT OF HIGH CURIOUSin %
28
Professional Manager and higher
58
14
Entry/ Administrative/
Clerical
More than half of those in managerial or higher positions score HIGH. By contrast, just over a quarter of professionals score HIGH, and even fewer entry level, administrative, and clerical workers have HIGH Curiosity Index scores.
If we look at how those in leadership positions score across the four dimensions, we get an even more focused picture.
DOMAIN MEANS OF LEADERSHIP (MANAGER AND HIGHER)Index value
70.8
Creativity in
problem solving
Openness toother ideas
71.0
Distress
Tolerance
58.4
72.6
Inquisitiveness
What does it say that managers and above have, in general, lower distress tolerance relative to the other dimensions? Managers and above score higher than the overall sample (54.3) in distress tolerance, but they still score lower in dis-tress tolerance compared to the other dimensions. When tol-erance is low, leaders may take fewer risks in decision-mak-ing, which has the potential to undermine curiosity and innovation. The impact might be as subtle as not approving funds for a workshop or class that could help workers think differently, or it may be more deliberate, such as not approv-ing a budget to advance a new idea.
Autonomy and trainingIt’s not enough for an organization to simply value curiosity; steps must be taken to foster a workplace culture that actively supports it – from allowing workers enough leeway to accom-plish tasks in their own way to providing formal recognition for novel ideas.
Figure 20
Figure 21
Figure 22
Fostering a Culture Full of Ideas Chapter 4 Curiosity Report 11
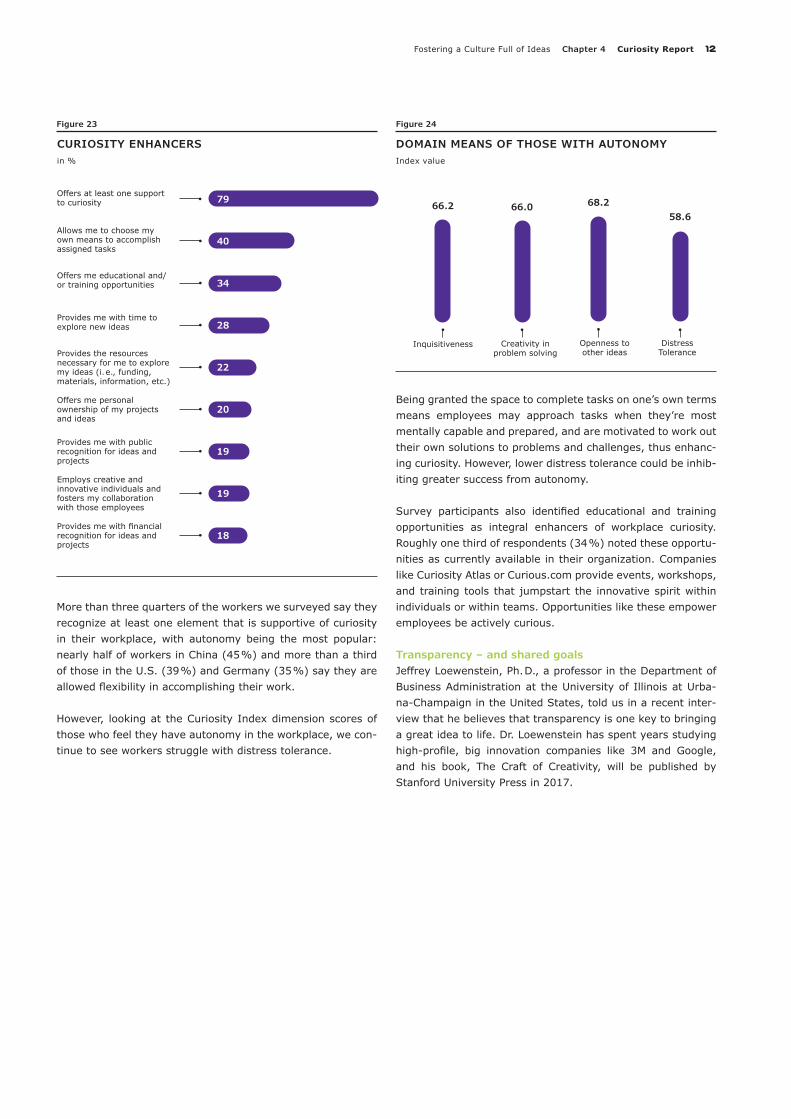
More than three quarters of the workers we surveyed say they recognize at least one element that is supportive of curiosity in their workplace, with autonomy being the most popular: nearly half of workers in China (45 %) and more than a third of those in the U.S. (39 %) and Germany (35 %) say they are allowed flexibility in accomplishing their work.
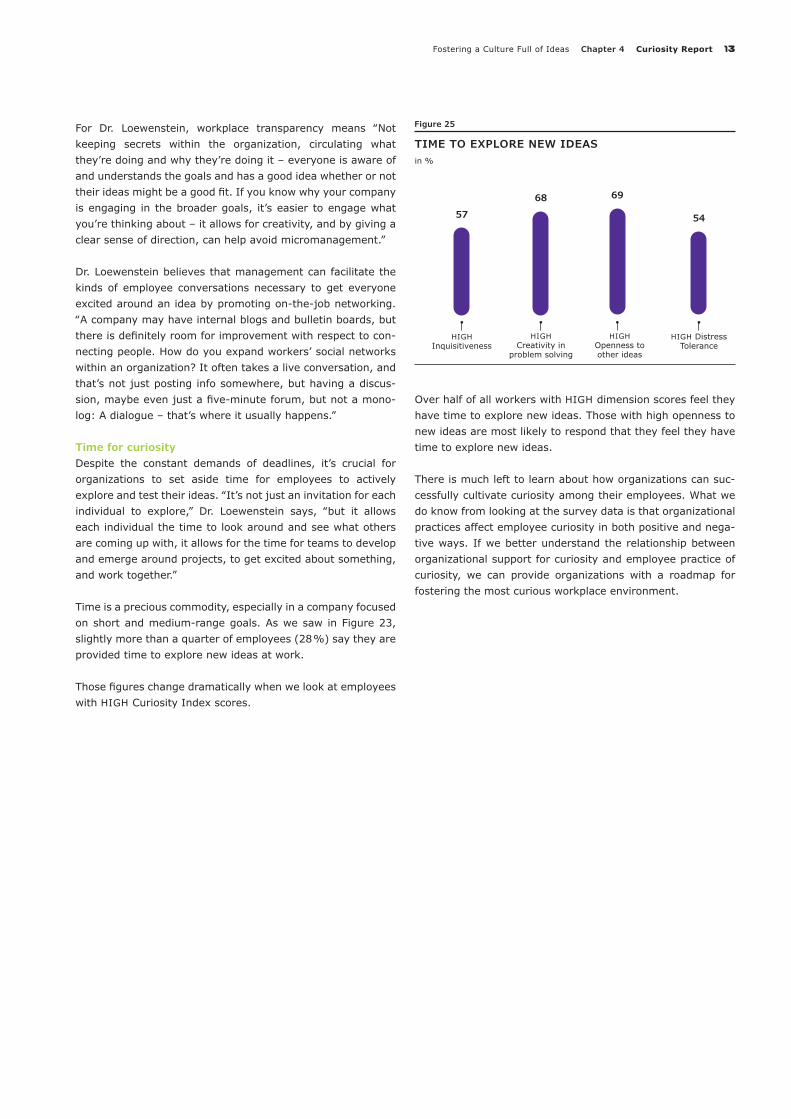
However, looking at the Curiosity Index dimension scores of those who feel they have autonomy in the workplace, we con-tinue to see workers struggle with distress tolerance.
DOMAIN MEANS OF THOSE WITH AUTONOMYIndex value
66.0
Creativity in
problem solving
Openness toother ideas
68.2
Distress
Tolerance
58.666.2
Inquisitiveness
Being granted the space to complete tasks on one’s own terms means employees may approach tasks when they’re most mentally capable and prepared, and are motivated to work out their own solutions to problems and challenges, thus enhanc-ing curiosity. However, lower distress tolerance could be inhib-iting greater success from autonomy.
Survey participants also identified educational and training opportunities as integral enhancers of workplace curiosity. Roughly one third of respondents (34 %) noted these opportu-nities as currently available in their organization. Companies like Curiosity Atlas or Curious.com provide events, workshops, and training tools that jumpstart the innovative spirit within individuals or within teams. Opportunities like these empower employees be actively curious.
Transparency – and shared goalsJeffrey Loewenstein, Ph. D., a professor in the Department of Business Administration at the University of Illinois at Urba-na-Champaign in the United States, told us in a recent inter-view that he believes that transparency is one key to bringing a great idea to life. Dr. Loewenstein has spent years studying high-profile, big innovation companies like 3M and Google, and his book, The Craft of Creativity, will be published by Stanford University Press in 2017.
CURIOSITY ENHANCERSin %
79
22
20
19
19
18
Provides the resources necessary for me to explore my ideas (i. e., funding, materials, information, etc.)
Offers me personal ownership of my projects and ideas
Provides me with time to explore new ideas
Provides me with public recognition for ideas and projects
Offers me educational and/or training opportunities
Provides me with financial recognition for ideas and projects
Offers at least one support to curiosity
28
40
34
Allows me to choose my own means to accomplish assigned tasks
Employs creative and innovative individuals and fosters my collaboration with those employees
Figure 23 Figure 24
Fostering a Culture Full of Ideas Chapter 4 Curiosity Report 12
For Dr. Loewenstein, workplace transparency means ‟Not keeping secrets within the organization, circulating what they’re doing and why they’re doing it – everyone is aware of and understands the goals and has a good idea whether or not their ideas might be a good fit. If you know why your company is engaging in the broader goals, it’s easier to engage what you’re thinking about – it allows for creativity, and by giving a clear sense of direction, can help avoid micromanagement.”
Dr. Loewenstein believes that management can facilitate the kinds of employee conversations necessary to get everyone excited around an idea by promoting on-the-job networking. ‟A company may have internal blogs and bulletin boards, but there is definitely room for improvement with respect to con-necting people. How do you expand workers’ social networks within an organization? It often takes a live conversation, and that’s not just posting info somewhere, but having a discus-sion, maybe even just a five-minute forum, but not a mono-log: A dialogue – that’s where it usually happens.”
Time for curiosityDespite the constant demands of deadlines, it’s crucial for organizations to set aside time for employees to actively explore and test their ideas. ‟It’s not just an invitation for each individual to explore,” Dr. Loewenstein says, ‟but it allows each individual the time to look around and see what others are coming up with, it allows for the time for teams to develop and emerge around projects, to get excited about something, and work together.”
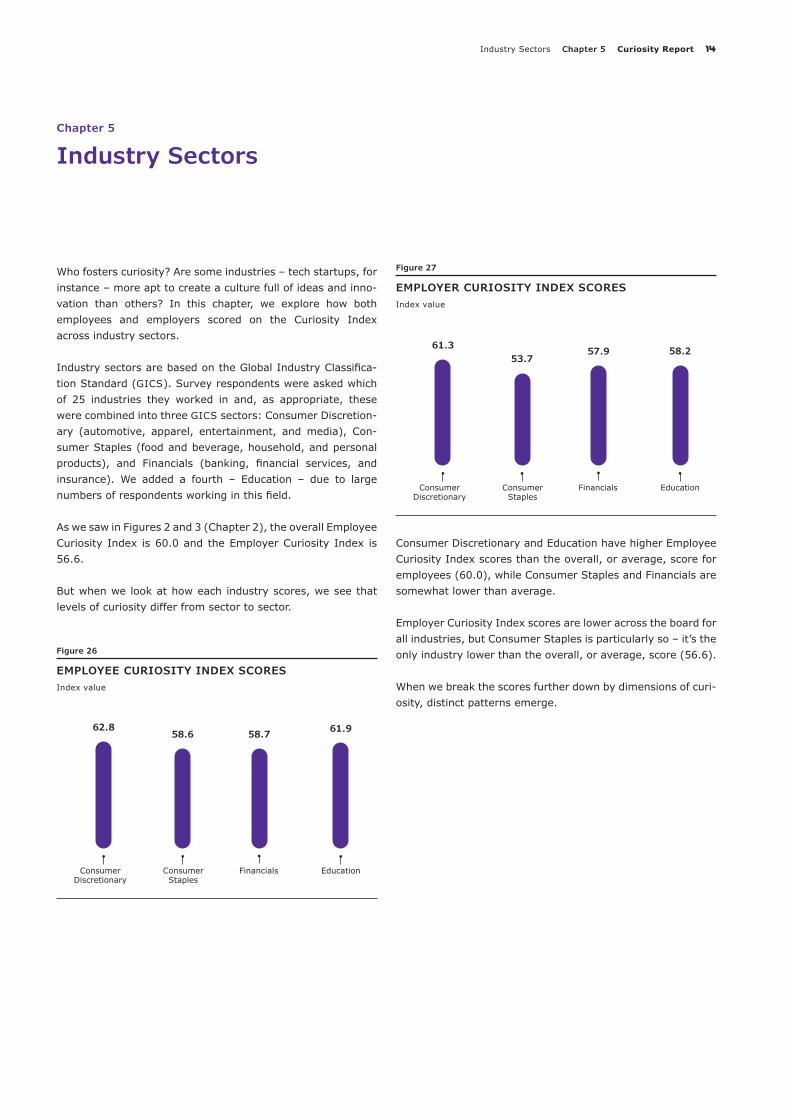
Time is a precious commodity, especially in a company focused on short and medium-range goals. As we saw in Figure 23, slightly more than a quarter of employees (28 %) say they are provided time to explore new ideas at work.
Those figures change dramatically when we look at employees with HIGH Curiosity Index scores.
TIME TO EXPLORE NEW IDEASin %
68
HIGH Creativity in
problem solving
HIGH Openness to other ideas
69
HIGH Distress Tolerance
5457
HIGH Inquisitiveness
Over half of all workers with HIGH dimension scores feel they have time to explore new ideas. Those with high openness to new ideas are most likely to respond that they feel they have time to explore new ideas.
There is much left to learn about how organizations can suc-cessfully cultivate curiosity among their employees. What we do know from looking at the survey data is that organizational practices affect employee curiosity in both positive and nega-tive ways. If we better understand the relationship between organizational support for curiosity and employee practice of curiosity, we can provide organizations with a roadmap for fostering the most curious workplace environment.
Figure 25
Fostering a Culture Full of Ideas Chapter 4 Curiosity Report 13
Chapter 5
Industry Sectors
Who fosters curiosity? Are some industries – tech startups, for instance – more apt to create a culture full of ideas and inno-vation than others? In this chapter, we explore how both employees and employers scored on the Curiosity Index across industry sectors.
Industry sectors are based on the Global Industry Classifica-tion Standard (GICS). Survey respondents were asked which of 25 industries they worked in and, as appropriate, these were combined into three GICS sectors: Consumer Discretion-ary (automotive, apparel, entertainment, and media), Con-sumer Staples (food and beverage, household, and personal products), and Financials (banking, financial services, and insurance). We added a fourth – Education – due to large numbers of respondents working in this field.
As we saw in Figures 2 and 3 (Chapter 2), the overall Employee Curiosity Index is 60.0 and the Employer Curiosity Index is 56.6.
But when we look at how each industry scores, we see that levels of curiosity differ from sector to sector.
EMPLOYEE CURIOSITY INDEX SCORESIndex value
58.6
Consumer Staples
Financials
58.7
Education
61.962.8
Consumer Discretionary
EMPLOYER CURIOSITY INDEX SCORESIndex value
53.7
Consumer Staples
Financials
57.9
Education
58.261.3
Consumer Discretionary
Consumer Discretionary and Education have higher Employee Curiosity Index scores than the overall, or average, score for employees (60.0), while Consumer Staples and Financials are somewhat lower than average.
Employer Curiosity Index scores are lower across the board for all industries, but Consumer Staples is particularly so – it’s the only industry lower than the overall, or average, score (56.6).
When we break the scores further down by dimensions of curi-osity, distinct patterns emerge.
Figure 26
Figure 27
Industry Sectors Chapter 5 Curiosity Report 14
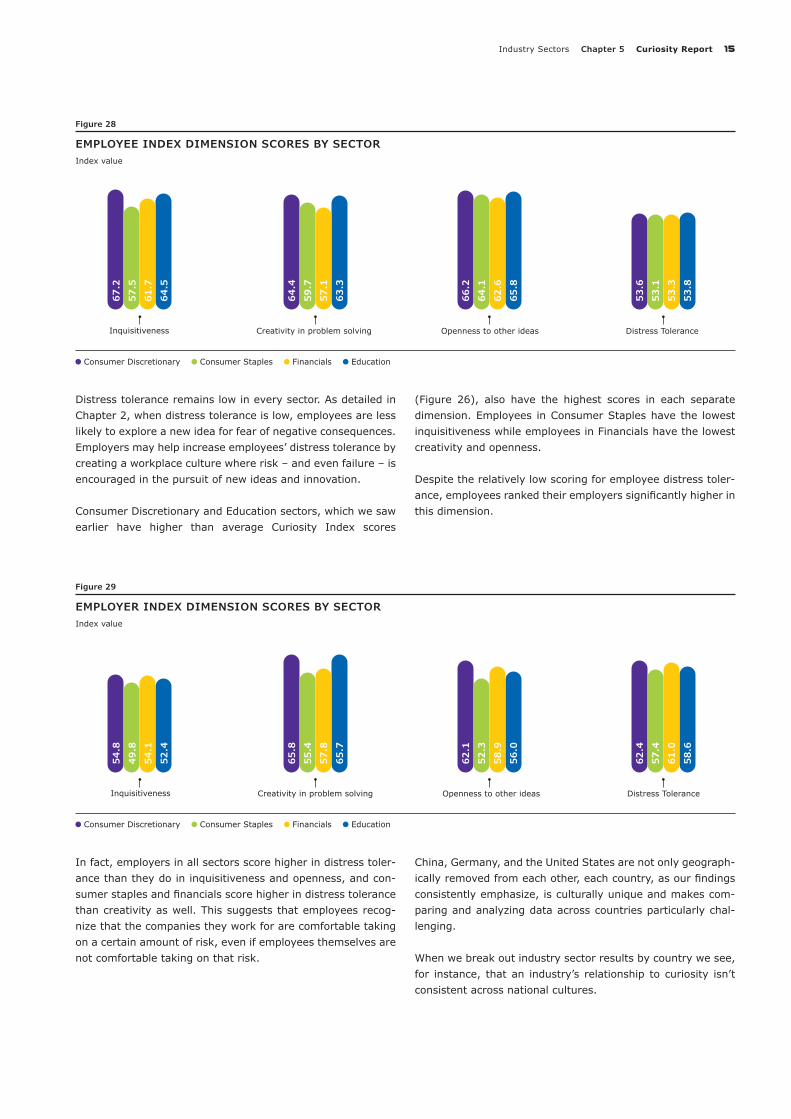
EMPLOYEE INDEX DIMENSION SCORES BY SECTORIndex value
Inquisitiveness
67.2
57.5
64.5
61.7
Creativity in problem solving
64.4
59.7
63.3
57.1
Openness to other ideas
66.2
64.1
65.8
62.6
Distress Tolerance
53.6
53.1
53.8
53.3
Consumer Discretionary Consumer Staples Financials Education
EMPLOYER INDEX DIMENSION SCORES BY SECTORIndex value
54.8
49.8
52.4
54.1
65.8
55.4
65.7
57.8
62.1
52.3
56.0
58.9
62.4
57.4
58.6
61.0
Consumer Discretionary Consumer Staples Financials Education
Distress tolerance remains low in every sector. As detailed in Chapter 2, when distress tolerance is low, employees are less likely to explore a new idea for fear of negative consequences. Employers may help increase employees’ distress tolerance by creating a workplace culture where risk – and even failure – is encouraged in the pursuit of new ideas and innovation.
Consumer Discretionary and Education sectors, which we saw earlier have higher than average Curiosity Index scores
(Figure 26), also have the highest scores in each separate dimension. Employees in Consumer Staples have the lowest inquisitiveness while employees in Financials have the lowest creativity and openness. Despite the relatively low scoring for employee distress toler-ance, employees ranked their employers significantly higher in this dimension.
In fact, employers in all sectors score higher in distress toler-ance than they do in inquisitiveness and openness, and con-sumer staples and financials score higher in distress tolerance than creativity as well. This suggests that employees recog-nize that the companies they work for are comfortable taking on a certain amount of risk, even if employees themselves are not comfortable taking on that risk.
China, Germany, and the United States are not only geograph-ically removed from each other, each country, as our findings consistently emphasize, is culturally unique and makes com-paring and analyzing data across countries particularly chal-lenging.
When we break out industry sector results by country we see, for instance, that an industry’s relationship to curiosity isn’t consistent across national cultures.
Figure 28
Figure 29
Inquisitiveness Creativity in problem solving Openness to other ideas Distress Tolerance
Industry Sectors Chapter 5 Curiosity Report 15
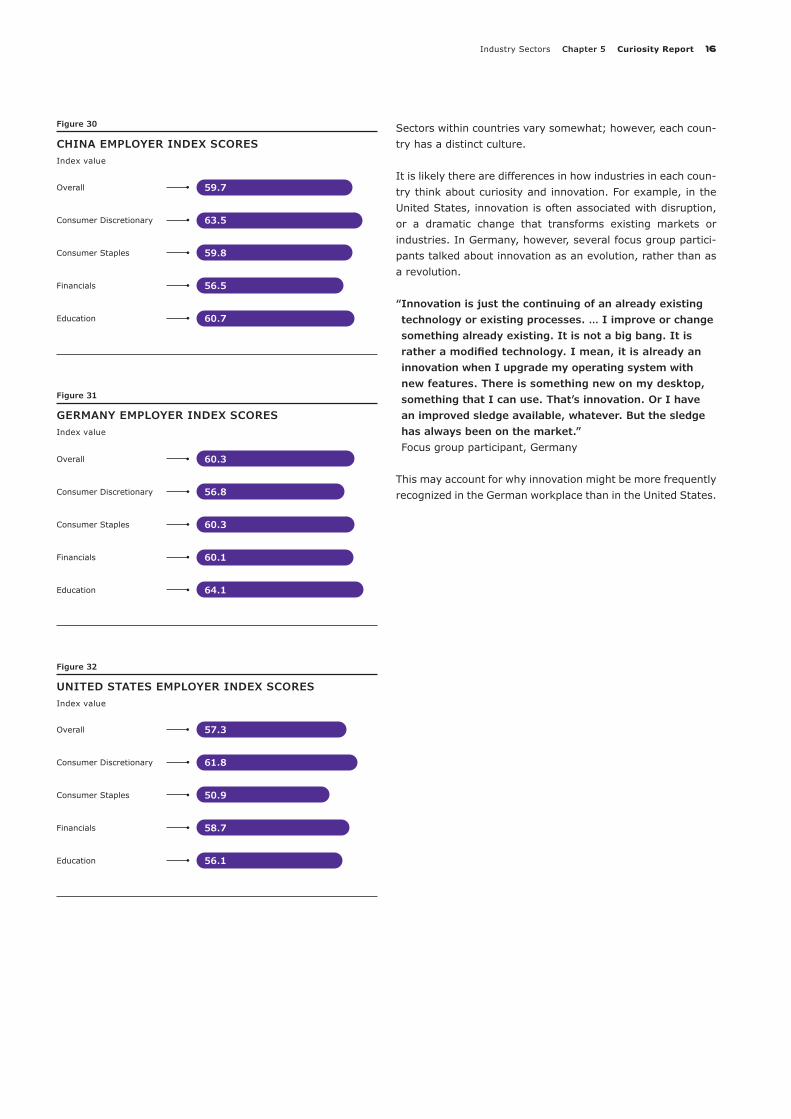
CHINA EMPLOYER INDEX SCORESIndex value
59.7Overall
60.7Education
56.5Financials
63.5Consumer Discretionary
59.8Consumer Staples
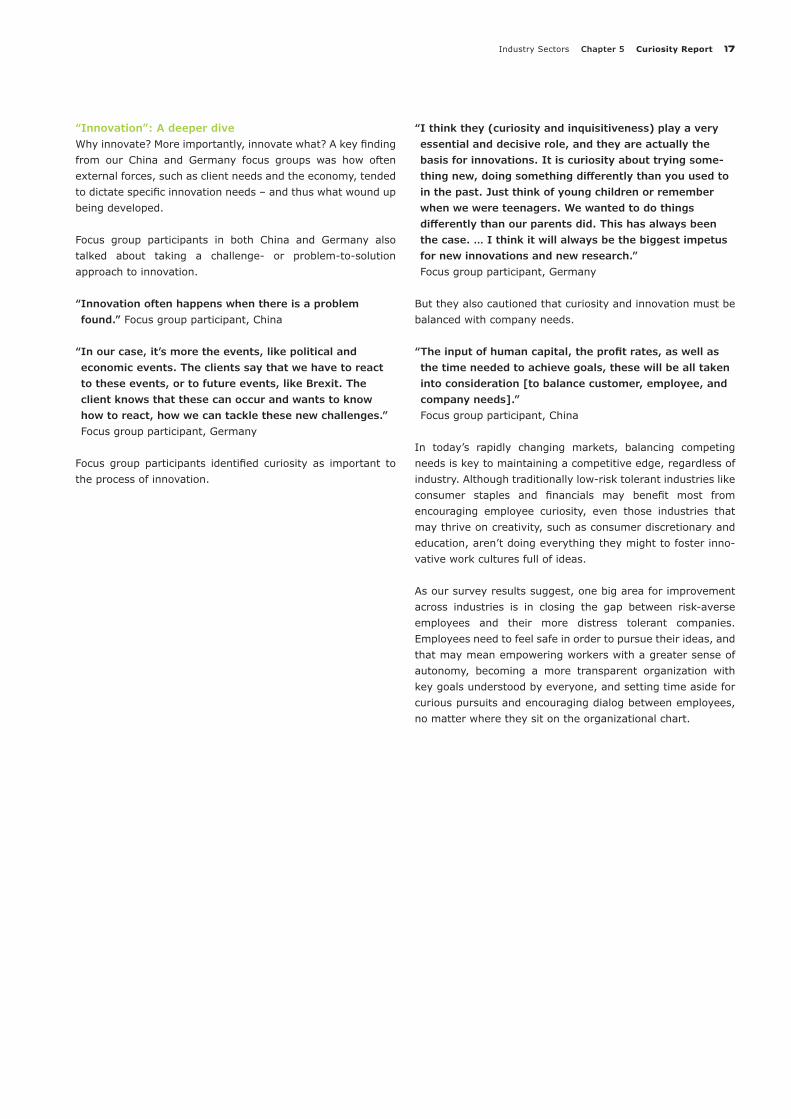
GERMANY EMPLOYER INDEX SCORESIndex value
60.3Overall
64.1Education
60.1Financials
56.8Consumer Discretionary
60.3Consumer Staples
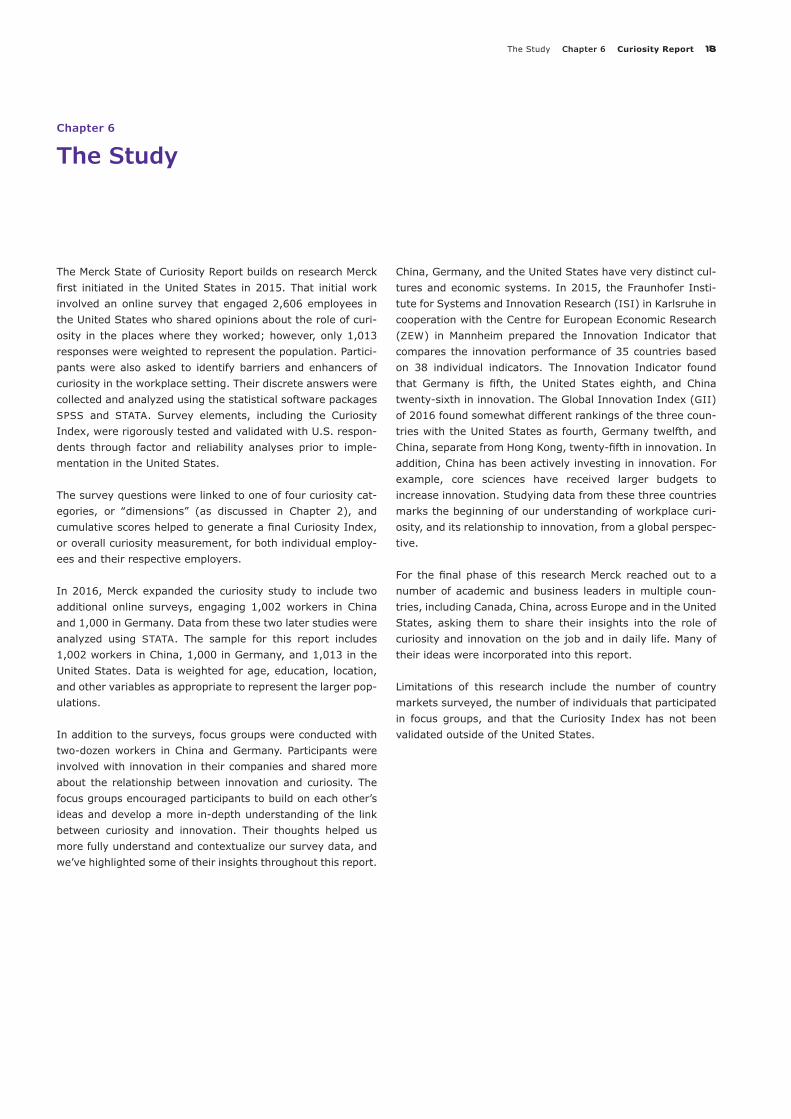
UNITED STATES EMPLOYER INDEX SCORESIndex value
57.3Overall
56.1Education
58.7Financials
61.8Consumer Discretionary
50.9Consumer Staples
Sectors within countries vary somewhat; however, each coun-try has a distinct culture.
It is likely there are differences in how industries in each coun-try think about curiosity and innovation. For example, in the United States, innovation is often associated with disruption, or a dramatic change that transforms existing markets or industries. In Germany, however, several focus group partici-pants talked about innovation as an evolution, rather than as a revolution.
“ Innovation is just the continuing of an already existing technology or existing processes. … I improve or change something already existing. It is not a big bang. It is rather a modified technology. I mean, it is already an innovation when I upgrade my operating system with new features. There is something new on my desktop, something that I can use. That’s innovation. Or I have an improved sledge available, whatever. But the sledge has always been on the market.” Focus group participant, Germany
This may account for why innovation might be more frequently recognized in the German workplace than in the United States.
Figure 30
Figure 31
Figure 32
Industry Sectors Chapter 5 Curiosity Report 16
“Innovation”: A deeper diveWhy innovate? More importantly, innovate what? A key finding from our China and Germany focus groups was how often external forces, such as client needs and the economy, tended to dictate specific innovation needs – and thus what wound up being developed.
Focus group participants in both China and Germany also talked about taking a challenge- or problem-to-solution approach to innovation.
“ Innovation often happens when there is a problem found.” Focus group participant, China
“ In our case, it’s more the events, like political and economic events. The clients say that we have to react to these events, or to future events, like Brexit. The client knows that these can occur and wants to know how to react, how we can tackle these new challenges.” Focus group participant, Germany
Focus group participants identified curiosity as important to the process of innovation.
“ I think they (curiosity and inquisitiveness) play a very essential and decisive role, and they are actually the basis for innovations. It is curiosity about trying some-thing new, doing something differently than you used to in the past. Just think of young children or remember when we were teenagers. We wanted to do things differently than our parents did. This has always been the case. … I think it will always be the biggest impetus for new innovations and new research.” Focus group participant, Germany
But they also cautioned that curiosity and innovation must be balanced with company needs.
“ The input of human capital, the profit rates, as well as the time needed to achieve goals, these will be all taken into consideration [to balance customer, employee, and company needs].” Focus group participant, China
In today’s rapidly changing markets, balancing competing needs is key to maintaining a competitive edge, regardless of industry. Although traditionally low-risk tolerant industries like consumer staples and financials may benefit most from encouraging employee curiosity, even those industries that may thrive on creativity, such as consumer discretionary and education, aren’t doing everything they might to foster inno-vative work cultures full of ideas.
As our survey results suggest, one big area for improvement across industries is in closing the gap between risk-averse employees and their more distress tolerant companies. Employees need to feel safe in order to pursue their ideas, and that may mean empowering workers with a greater sense of autonomy, becoming a more transparent organization with key goals understood by everyone, and setting time aside for curious pursuits and encouraging dialog between employees, no matter where they sit on the organizational chart.
Industry Sectors Chapter 5 Curiosity Report 17
Chapter 6
The Study
The Merck State of Curiosity Report builds on research Merck first initiated in the United States in 2015. That initial work involved an online survey that engaged 2,606 employees in the United States who shared opinions about the role of curi-osity in the places where they worked; however, only 1,013 responses were weighted to represent the population. Partici-pants were also asked to identify barriers and enhancers of curiosity in the workplace setting. Their discrete answers were collected and analyzed using the statistical software packages SPSS and STATA. Survey elements, including the Curiosity Index, were rigorously tested and validated with U.S. respon-dents through factor and reliability analyses prior to imple-mentation in the United States.
The survey questions were linked to one of four curiosity cat-egories, or ‟dimensions” (as discussed in Chapter 2), and cumulative scores helped to generate a final Curiosity Index, or overall curiosity measurement, for both individual employ-ees and their respective employers.
In 2016, Merck expanded the curiosity study to include two additional online surveys, engaging 1,002 workers in China and 1,000 in Germany. Data from these two later studies were analyzed using STATA. The sample for this report includes 1,002 workers in China, 1,000 in Germany, and 1,013 in the United States. Data is weighted for age, education, location, and other variables as appropriate to represent the larger pop-ulations.
In addition to the surveys, focus groups were conducted with two-dozen workers in China and Germany. Participants were involved with innovation in their companies and shared more about the relationship between innovation and curiosity. The focus groups encouraged participants to build on each other’s ideas and develop a more in-depth understanding of the link between curiosity and innovation. Their thoughts helped us more fully understand and contextualize our survey data, and we’ve highlighted some of their insights throughout this report.
China, Germany, and the United States have very distinct cul-tures and economic systems. In 2015, the Fraunhofer Insti-tute for Systems and Innovation Research (ISI) in Karlsruhe in cooperation with the Centre for European Economic Research (ZEW) in Mannheim prepared the Innovation Indicator that compares the innovation performance of 35 countries based on 38 individual indicators. The Innovation Indicator found that Germany is fifth, the United States eighth, and China twenty-sixth in innovation. The Global Innovation Index (GII) of 2016 found somewhat different rankings of the three coun-tries with the United States as fourth, Germany twelfth, and China, separate from Hong Kong, twenty-fifth in innovation. In addition, China has been actively investing in innovation. For example, core sciences have received larger budgets to increase innovation. Studying data from these three countries marks the beginning of our understanding of workplace curi-osity, and its relationship to innovation, from a global perspec-tive.
For the final phase of this research Merck reached out to a number of academic and business leaders in multiple coun-tries, including Canada, China, across Europe and in the United States, asking them to share their insights into the role of curiosity and innovation on the job and in daily life. Many of their ideas were incorporated into this report.
Limitations of this research include the number of country markets surveyed, the number of individuals that participated in focus groups, and that the Curiosity Index has not been validated outside of the United States.
The Study Chapter 6 Curiosity Report 18
Chapter 7
Conclusion
If nurtured and encouraged, curiosity can lead us to solve many present and future challenges, to stay one step ahead of an ever-changing market, to imagine and design the products that will keep us healthier, our environment cleaner – and even to delight and amuse us.
Curiosity motivates many. It has a real connection to innova-tion, it drives countless successful careers and businesses, and there’s no reason we all can’t take a lesson from for-ward-thinking companies and managers carving out time and making resources available for ideas to grow. Working together, we can unleash the potential of curiosity at all levels of the workplace.
Curious people bring ideas to fruition. Curious workers learn quicker, retain information better, and they’re more positive about their role – whatever that role may be. Curious employ-ees contribute to the decision-making process. They’re highly motivated, organized, thoughtful, and energetic. Curiosity knows no age, but Millennials know the future belongs to them, and they seek out innovative workplaces, places where change happens, where ‟disruption” is not just a word people toss around.
How difficult is it to put curiosity into practice? It requires a clear set of objectives, an eye focused unflinchingly on the horizon, the future. It requires knowing what the goal is, and being able to communicate that goal to everyone involved. Fostering curiosity requires letting go of the need to control, despite external pressure to meet short-term goals. It requires being prepared to take risks, to accept failure as not just a possibility, but a fact, even a stepping stone.
Because our future matters. And our curiosity will define it.
Still curious? Read more about unlocking the power of curios-ity on our digital platform where you’ll find a wealth of curios-ity content, including our Curiosity Self-Test, and further research findings.
Appendix A | Literature Review
1. Arnone M. & Small R. (1995) Arousing and Sustaining Curi-osity: Lessons from the ARCS Model. Proceedings of the 1995 Annual Conference of the Association for Educational Communications and Technology, Anaheim, California.
2. Arnone M., Small R., Chauncey S., McKenna HP. (2011) Curiosity, interest and engagement in technology-pervasive learning environments: a new research agenda. Education Tech Research Dev, 59:181–198. Association for Educa-tional Communications and Technology.
3. Berlyne D. (1954) A Theory of Human Curiosity. British Journal of Psychology, 45, 180–191.
4. Berlyne D. (1967) Arousal and Reinforcement. In D. Levine (Ed.), Nebraska Symposium on Motivation (pp. 1–110). Lincoln: University of Nebraska Press.
5. Bruner J. (1966). Toward a theory of instruction, Cambridge, Mass.: Belkapp Press.
6. Collins R., Litman J., Spielberger C. (2004) The Measure-ment of Perceptual Curiosity. Personality and Individual Dif-ferences 36 1127–1141.
7. Day H. I. (1982) Curiosity and the interested explorer. NSPI Journal, May Issue, 19–22.
8. Deci EL. (1975) Intrinsic Motivation. New York: Plenum.
9. Ellaway R. (2014) When I say… epistemic curiosity. Medical Education 2014: 48: 113–114.
Conclusion Chapter 7 Curiosity Report 19
10. Gruber M., Gelman B., Ranganath C. (2014) States of Curi-osity Modulate Hippocampus-Dependent Learning via the Dopaminergic Circuit. Neuron, 84, 486–496.
11. Jepma M. et al. (2012) Neural Mechanisms Underlying the Induction and Relief of Perceptual Curiosity. Frontiers in Behavioral Neuroscience. 6: 5.
12. Kahneman D., Tversky A. (1979) Prospect Theory: An Anal-ysis of Decision Under Risk. Econometrica, 47, 263–291.
13. Kang M. et al. (2009) The Wick in the Candle of Learning: Epistemic Curiosity Activates Reward Circuitry and Enhances Memory. Psychological Science August issue vol. 20 no. 8, 963–973.
14. Kashdan T., Rose P., Fincham F. (2004) Curiosity and Exploration: Facilitating Positive Subjective Experiences and Personal Growth Opportunities. Journal of Personality Assessment, 82:3, 291–305.
15. Kashdan T., Steger M. (2007) Curiosity and Pathways to Well-Being and Meaning in Life: Traits, States and Every-day Behaviors. Motivation and Emotion, Vol 31(3), Sep Issue, 159–173. Publisher: Springer.
16. Koffka K. (1935) The Principles of Gestalt Psychology. New York: Harcourt Press.
17. Litman J., Silvia P. (2006). The Latent Structure of Trait Curi-osity: Evidence or Interest and Deprivation Curiosity Dimen-sions. Journal of Personality Assessment, 86, 318–328.
18. Litman J., Spielberger C. (2003) Measuring Epistemic Curi-osity and Its Diversive and Specific Components. Journal of Personality Assessment, 80(1), 75–86.
19. Loewenstein G. (1994) The Psychology of Curiosity: A Review and Reinterpretation. Psychological Bulletin 1994, Vol. 116, No. 1, 75–98. The American Psychological Asso-ciation.
20. Mussel P. (2012) Introducing the construct curiosity for predicting job performance. Journal of Organizational Behavior 34(4):453 Wiley-Blackwell 20130501.
21. Naylor F. D. (1981) A state-trait curiosity inventory. ‟Aus-tralian Psychologist,” 16(2), 172–183.
22. Piaget J. (1945) La formation du symbole chez l’enfant. Neuchatel: Delachaux and Niestle. (Play, Dreams and Imi-tation in Childhood. New York: Norton, 1951).
23. Rotgans J., Schmidt H. (2014) Situational interest and learning: Thirst for knowledge. Learning and Instruction 32:37 Elsevier 20140801.
24. Silvia P., Kashdan T. (2009) Interesting things and curious people: Exploration and engagement as transient states and enduring strengths. Social and Personality Psychology Compass 3(5):785 Wiley 20090901.
25. Skinner BF. (1953) Science and Human Behavior. New York: Macmillan.
26. Vygotsky, L. (1978). Mind in society: The development of higher psychological processes Cambridge, Mass.: Har-vard University Press.
Conclusion Chapter 7 Curiosity Report 20

curiosity.merckgroup.com
Published in October 2016Merck KGaA, Group Communications Frankfurter Str. 25064293 DarmstadtGermany
Phone: + 49 6151 72- [email protected]
Curiosity Report 21
curiosity.merckgroup.com