Embed Size (px)
Citation preview
Becoming the leader in intelligent cargo handling
Investor presentation, October 2017
October 2017 1Investor presentation
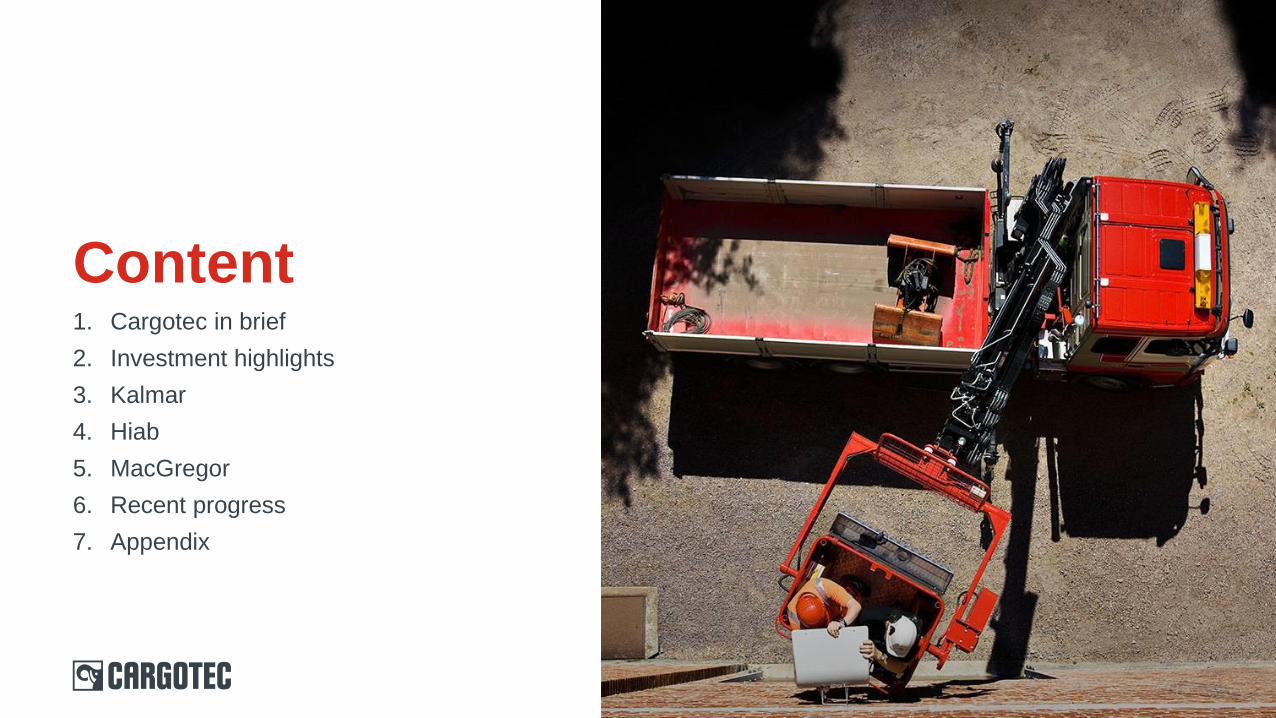
Content1. Cargotec in brief
2. Investment highlights
3. Kalmar
4. Hiab
5. MacGregor
6. Recent progress
7. Appendix
Cargotecin brief
October 2017Investor presentation 3
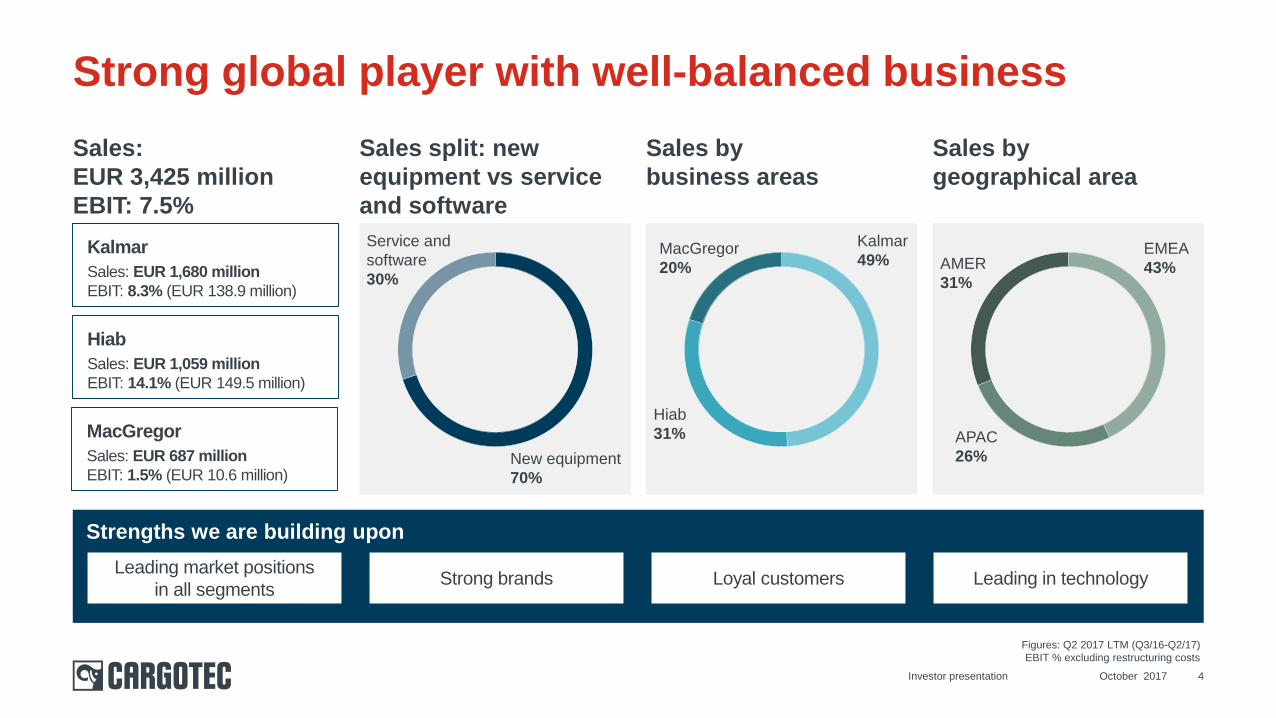
Sales:
EUR 3,425 million
EBIT: 7.5%
Strengths we are building upon
Sales split: new
equipment vs service
and software
October 2017Investor presentation 4
Strong global player with well-balanced business
Sales by
geographical area
Sales by
business areas
Kalmar
49%
Hiab
31%
MacGregor
20% AMER
31%
EMEA
43%
APAC
26%
Service and
software
30%
New equipment
70%
Figures: Q2 2017 LTM (Q3/16-Q2/17)
EBIT % excluding restructuring costs
Leading market positions
in all segmentsStrong brands Loyal customers Leading in technology
Kalmar
Sales: EUR 1,680 million
EBIT: 8.3% (EUR 138.9 million)
Hiab
Sales: EUR 1,059 million
EBIT: 14.1% (EUR 149.5 million)
MacGregor
Sales: EUR 687 million
EBIT: 1.5% (EUR 10.6 million)
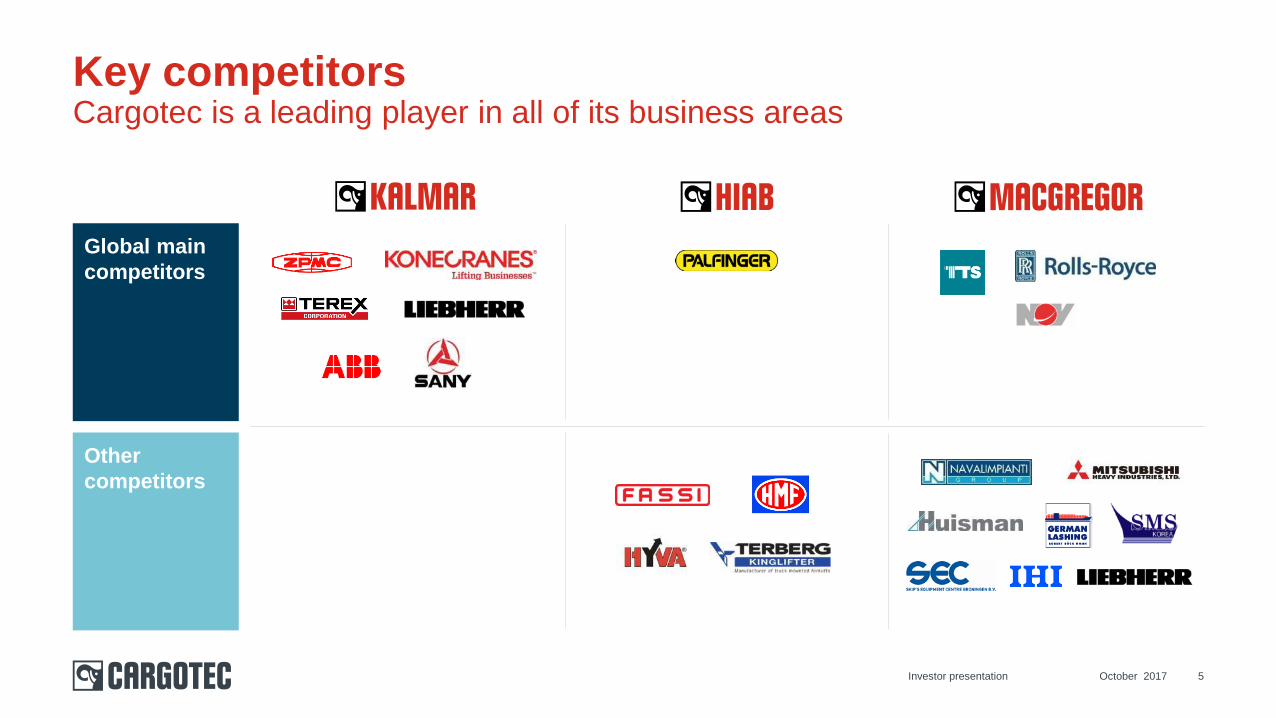
Key competitorsCargotec is a leading player in all of its business areas
October 2017Investor presentation 5
Global main
competitors
Other
competitors
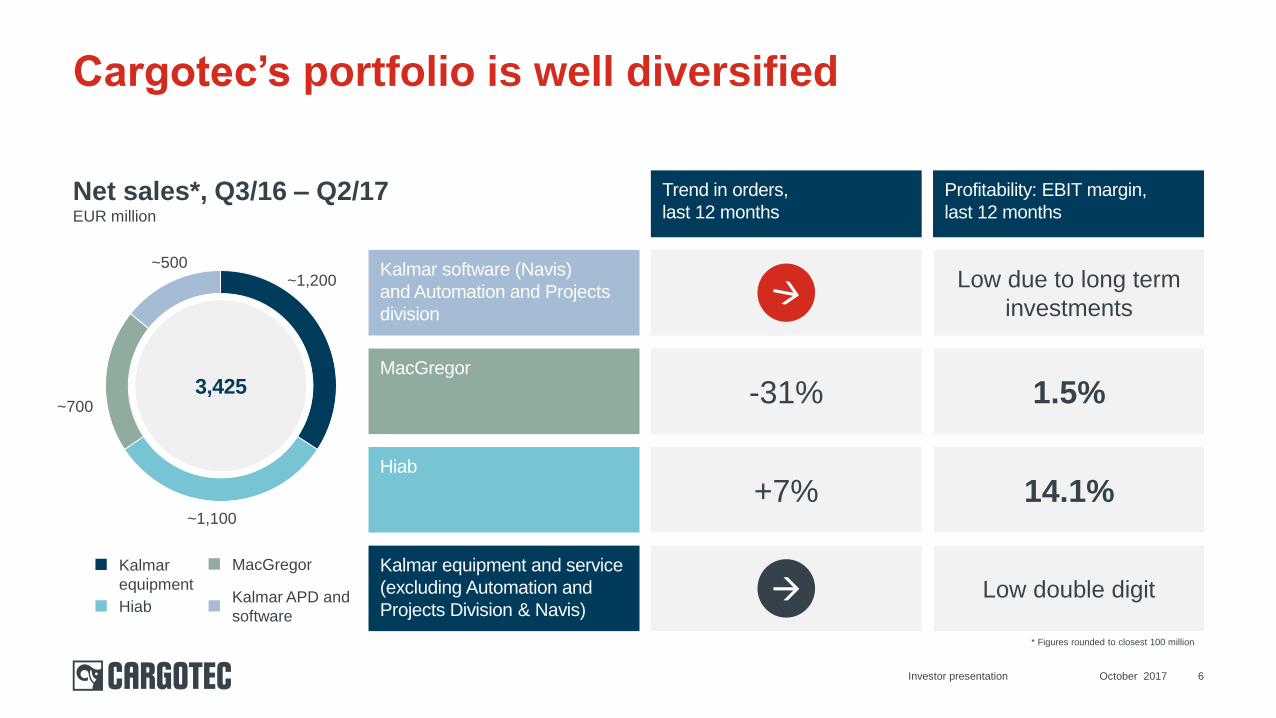
Cargotec’s portfolio is well diversified
October 2017Investor presentation 6
Net sales*, Q3/16 – Q2/17EUR million
Trend in orders,
last 12 months
Profitability: EBIT margin,
last 12 months
Kalmar software (Navis)
and Automation and Projects
division
MacGregor
-31%
Hiab
+7%
Kalmar equipment and service
(excluding Automation and
Projects Division & Navis)
Low due to long term
investments
1.5%
14.1%
Low double digit
* Figures rounded to closest 100 million
~1,100
~1,200
3,425
Kalmar
equipment
Hiab
MacGregor
Kalmar APD and
software
~500
~700
Investment highlights
October 2017Investor presentation 7
1. Technology leader and strong market
positions, leading brands in markets with
long term growth potential
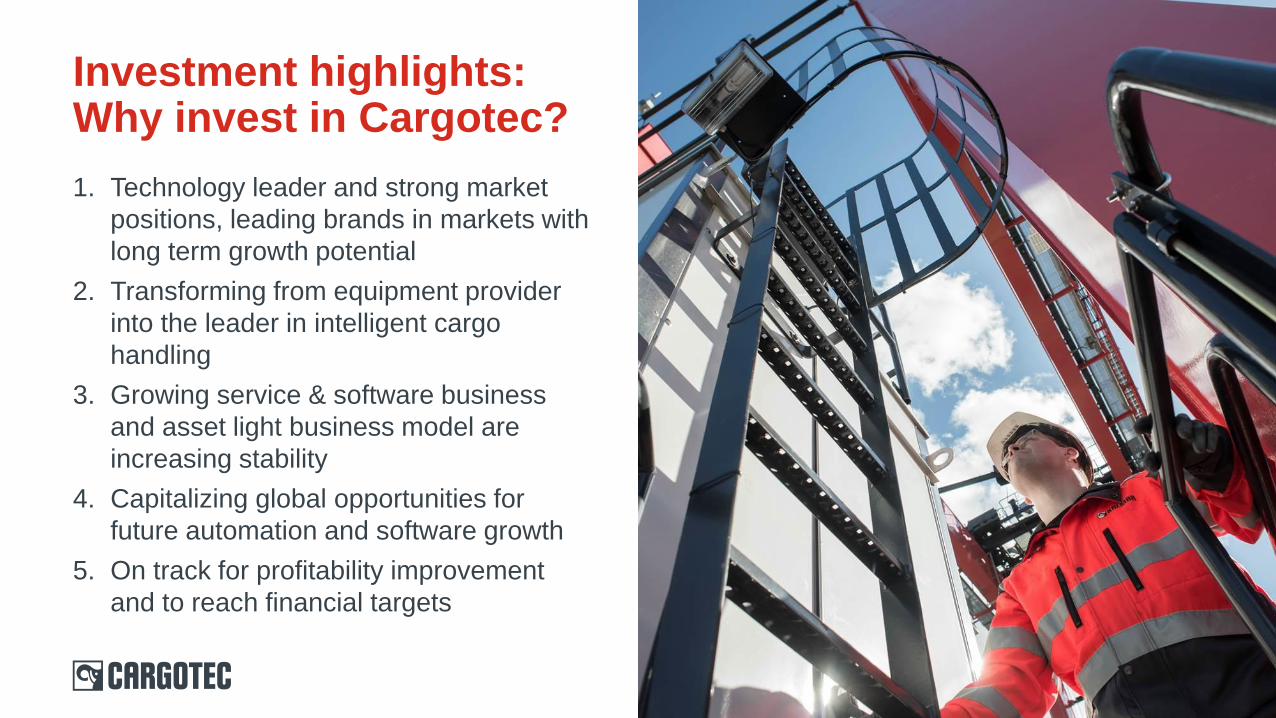
2. Transforming from equipment provider
into the leader in intelligent cargo
handling
3. Growing service & software business
and asset light business model are
increasing stability
4. Capitalizing global opportunities for
future automation and software growth
5. On track for profitability improvement
and to reach financial targets
Investment highlights: Why invest in Cargotec?
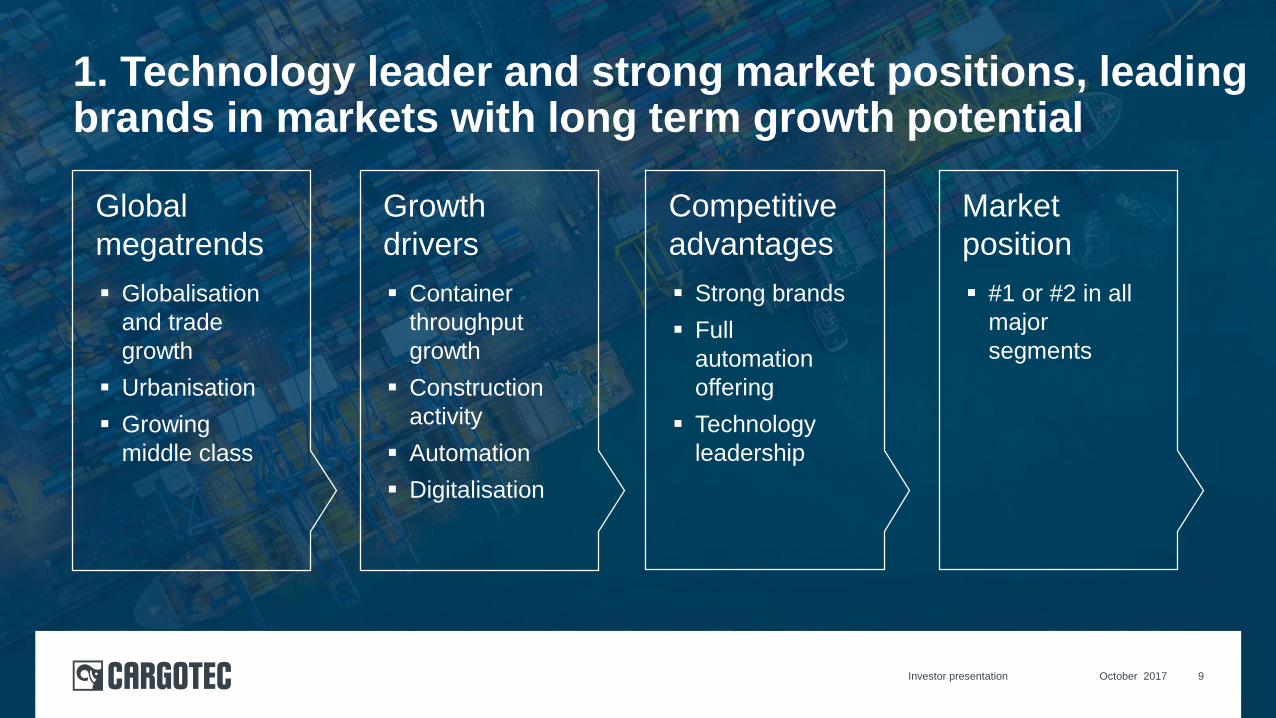
1. Technology leader and strong market positions, leading brands in markets with long term growth potential
October 2017Investor presentation 9
Global
megatrends
Globalisation
and trade
growth
Urbanisation
Growing
middle class
Growth
drivers
Container
throughput
growth
Construction
activity
Automation
Digitalisation
Competitive
advantages
Strong brands
Full
automation
offering
Technology
leadership
Market
position
#1 or #2 in all
major
segments
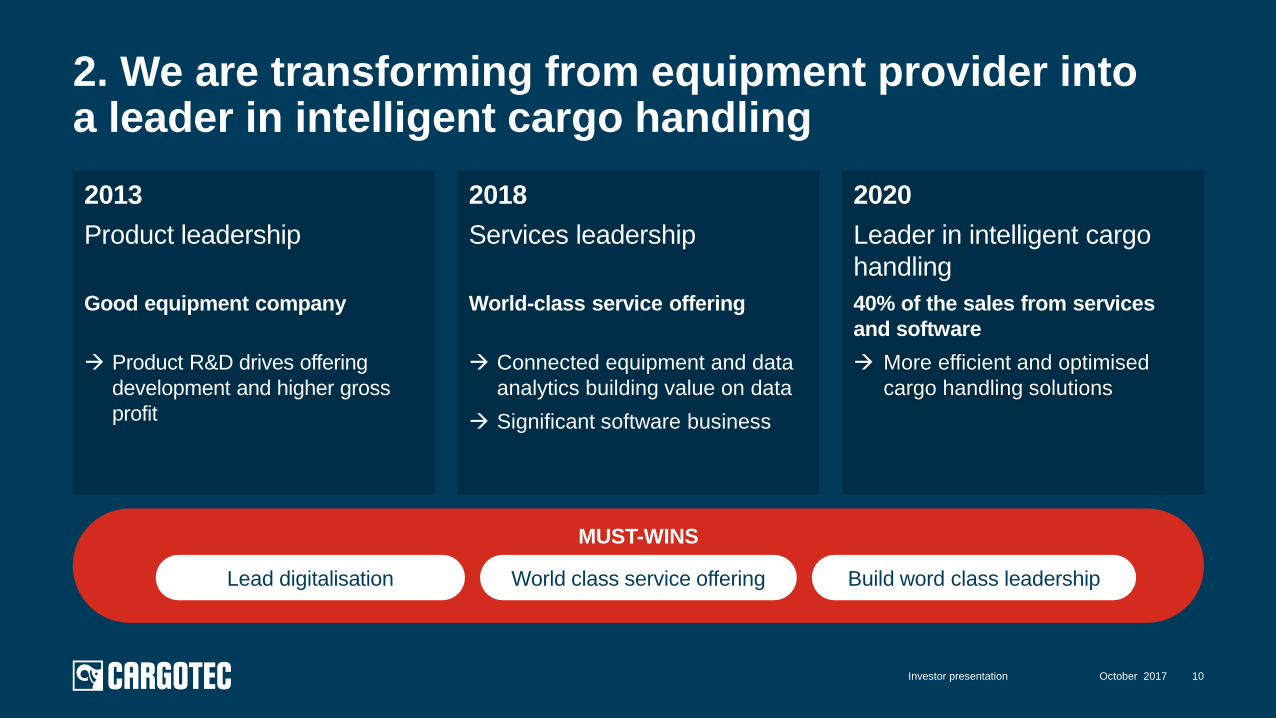
MUST-WINS
2013
Product leadership
Good equipment company
Product R&D drives offering
development and higher gross
profit
2018
Services leadership
World-class service offering
Connected equipment and data
analytics building value on data
Significant software business
2020
Leader in intelligent cargo
handling
40% of the sales from services
and software
More efficient and optimised
cargo handling solutions
2. We are transforming from equipment provider intoa leader in intelligent cargo handling
October 2017Investor presentation 10
Lead digitalisation World class service offering Build word class leadership
October 2017Investor presentation 11
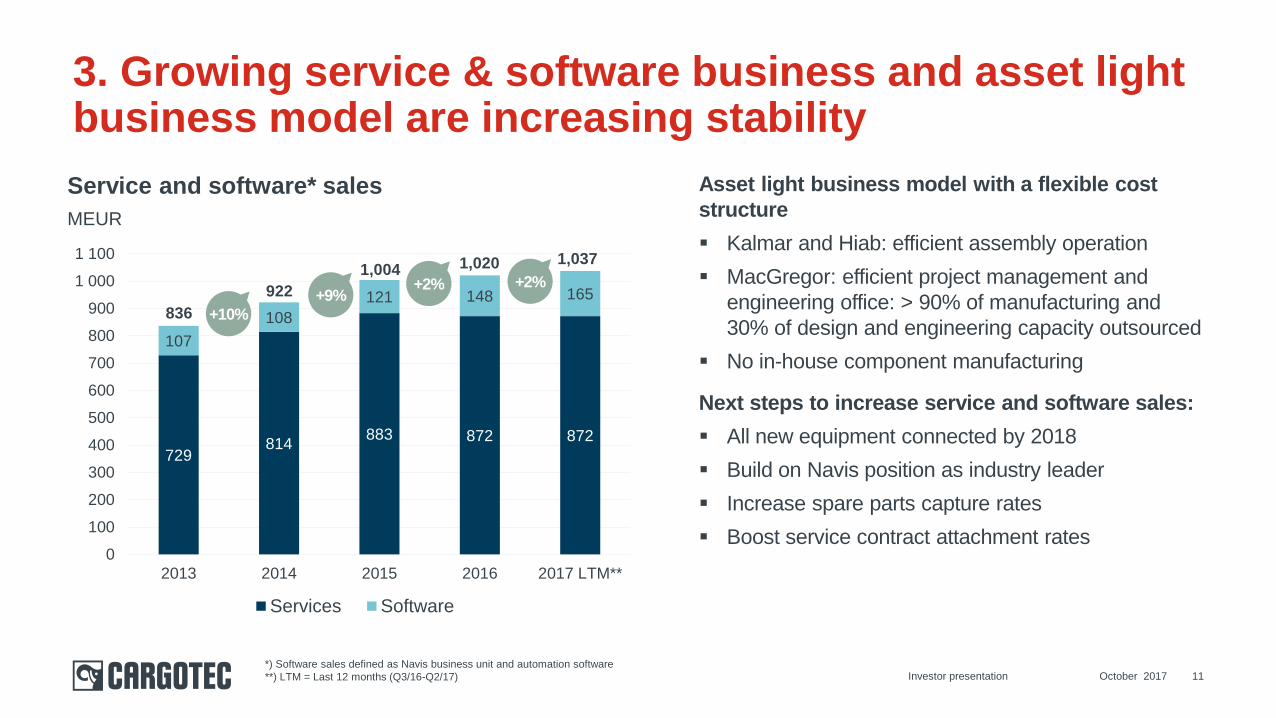
3. Growing service & software business and asset light business model are increasing stability
Asset light business model with a flexible cost
structure
Kalmar and Hiab: efficient assembly operation
MacGregor: efficient project management and
engineering office: > 90% of manufacturing and
30% of design and engineering capacity outsourced
No in-house component manufacturing
Next steps to increase service and software sales:
All new equipment connected by 2018
Build on Navis position as industry leader
Increase spare parts capture rates
Boost service contract attachment rates
Service and software* sales
MEUR
729814
883 872 872
107
108
121 148 165
0
100
200
300
400
500
600
700
800
900
1 000
1 100
2013 2014 2015 2016 2017 LTM**
Services Software
+10%
+9%+2% +2%
836
922
1,004 1,020 1,037
*) Software sales defined as Navis business unit and automation software
**) LTM = Last 12 months (Q3/16-Q2/17)
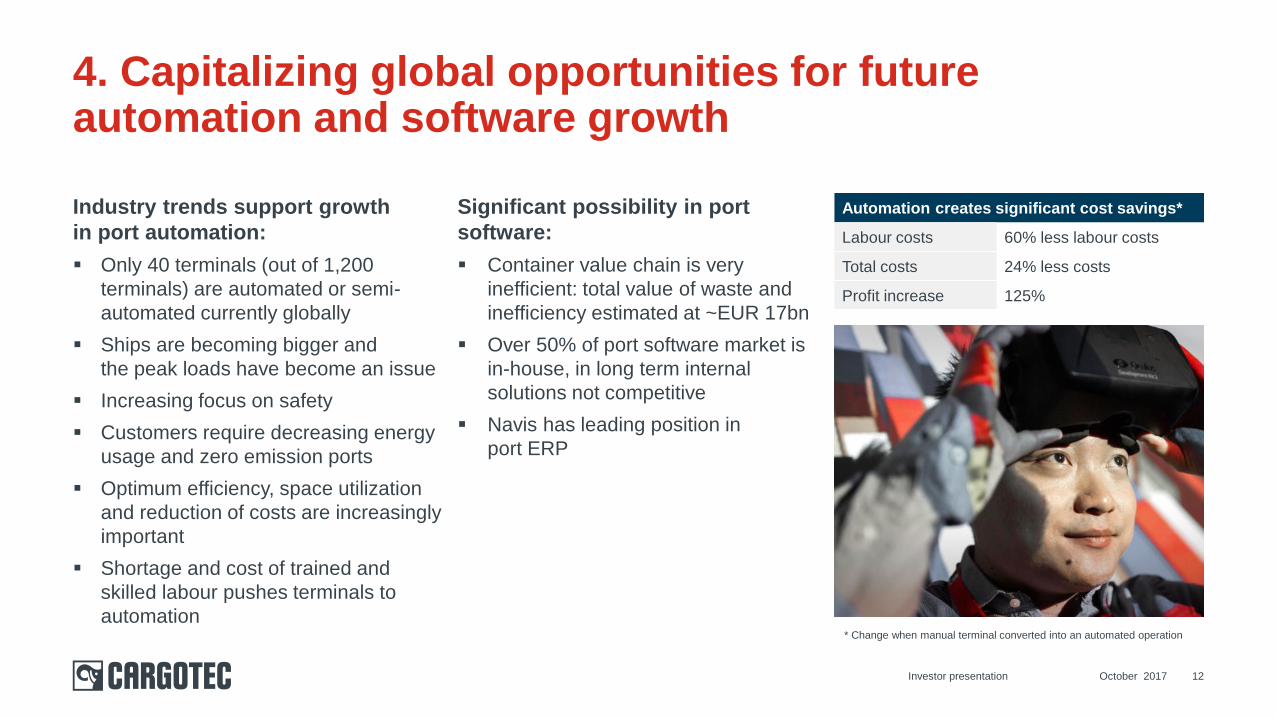
Industry trends support growth
in port automation:
Only 40 terminals (out of 1,200
terminals) are automated or semi-
automated currently globally
Ships are becoming bigger and
the peak loads have become an issue
Increasing focus on safety
Customers require decreasing energy
usage and zero emission ports
Optimum efficiency, space utilization
and reduction of costs are increasingly
important
Shortage and cost of trained and
skilled labour pushes terminals to
automation
October 2017Investor presentation 12
4. Capitalizing global opportunities for future automation and software growth
Significant possibility in port
software:
Container value chain is very
inefficient: total value of waste and
inefficiency estimated at ~EUR 17bn
Over 50% of port software market is
in-house, in long term internal
solutions not competitive
Navis has leading position in
port ERP
Automation creates significant cost savings*
Labour costs 60% less labour costs
Total costs 24% less costs
Profit increase 125%
* Change when manual terminal converted into an automated operation
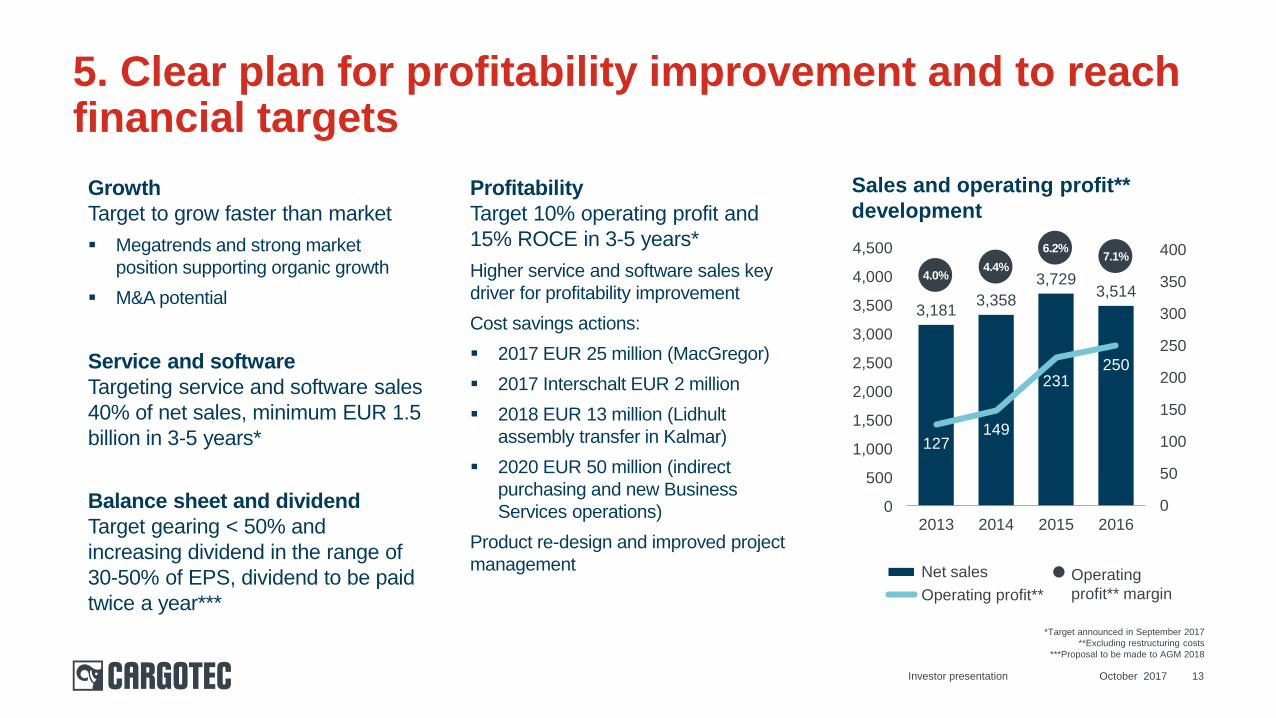
3,1813,358
3,7293,514
127149
231250
0
50
100
150
200
250
300
350
400
2013 2014 2015 2016
Net sales
Operating profit**
5. Clear plan for profitability improvement and to reach financial targets
October 2017Investor presentation 13
Growth
Target to grow faster than market
Megatrends and strong market
position supporting organic growth
M&A potential
Balance sheet and dividend
Target gearing < 50% and
increasing dividend in the range of
30-50% of EPS, dividend to be paid
twice a year***
Profitability
Target 10% operating profit and
15% ROCE in 3-5 years*
Higher service and software sales key
driver for profitability improvement
Cost savings actions:
2017 EUR 25 million (MacGregor)
2017 Interschalt EUR 2 million
2018 EUR 13 million (Lidhult
assembly transfer in Kalmar)
2020 EUR 50 million (indirect
purchasing and new Business
Services operations)
Product re-design and improved project
management
Sales and operating profit**
development
*Target announced in September 2017
**Excluding restructuring costs
***Proposal to be made to AGM 2018
4.0%4.4%
6.2%7.1%
Operating
profit** margin
4,500
4,000
3,500
3,000
2,500
2,000
1,500
1,000
500
0
Service and software
Targeting service and software sales
40% of net sales, minimum EUR 1.5
billion in 3-5 years*
Kalmar
October 2017Investor presentation 14
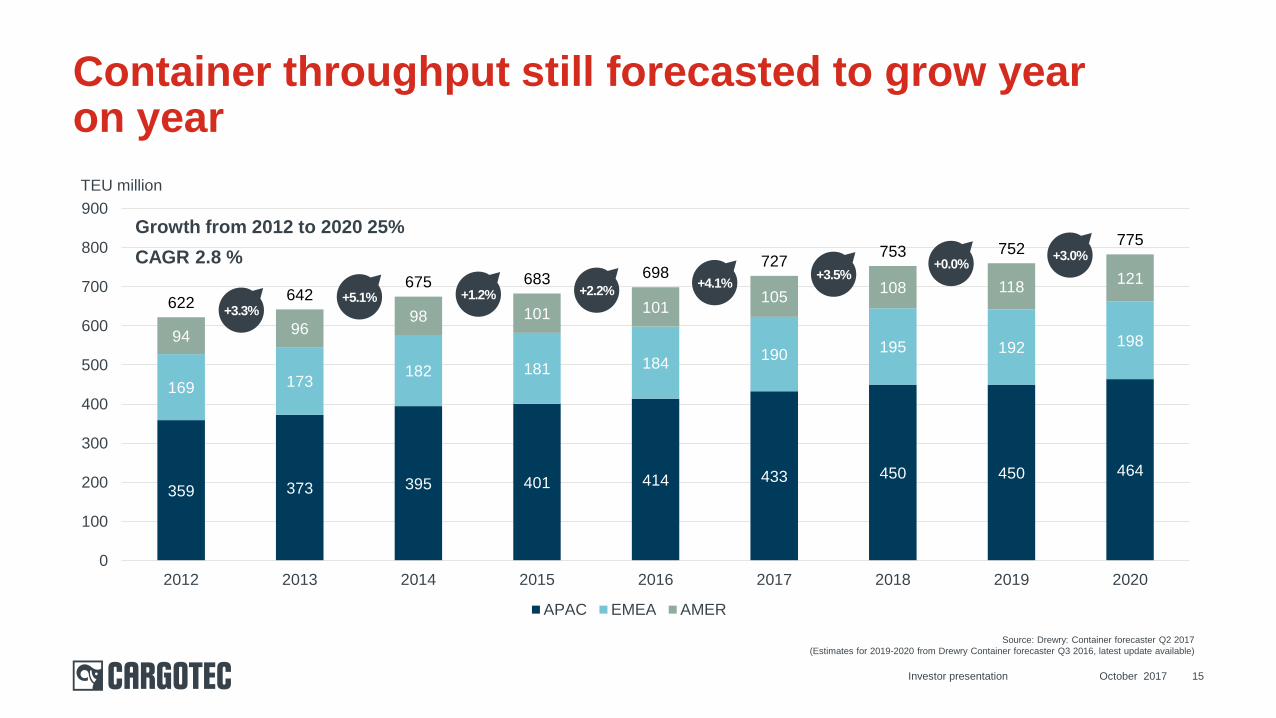
359 373 395 401 414 433 450 450 464
169 173182 181 184
190195 192 19894 96
98 101 101105
108 118121
622642
675 683 698727
753 752775
0
100
200
300
400
500
600
700
800
900
2012 2013 2014 2015 2016 2017 2018 2019 2020
APAC EMEA AMER
Container throughput still forecasted to grow yearon year
TEU million
+3.3%+5.1% +1.2% +2.2%
+4.1%+3.5%
+0.0%+3.0%
Growth from 2012 to 2020 25%
CAGR 2.8 %
Source: Drewry: Container forecaster Q2 2017
(Estimates for 2019-2020 from Drewry Container forecaster Q3 2016, latest update available)
October 2017Investor presentation 15
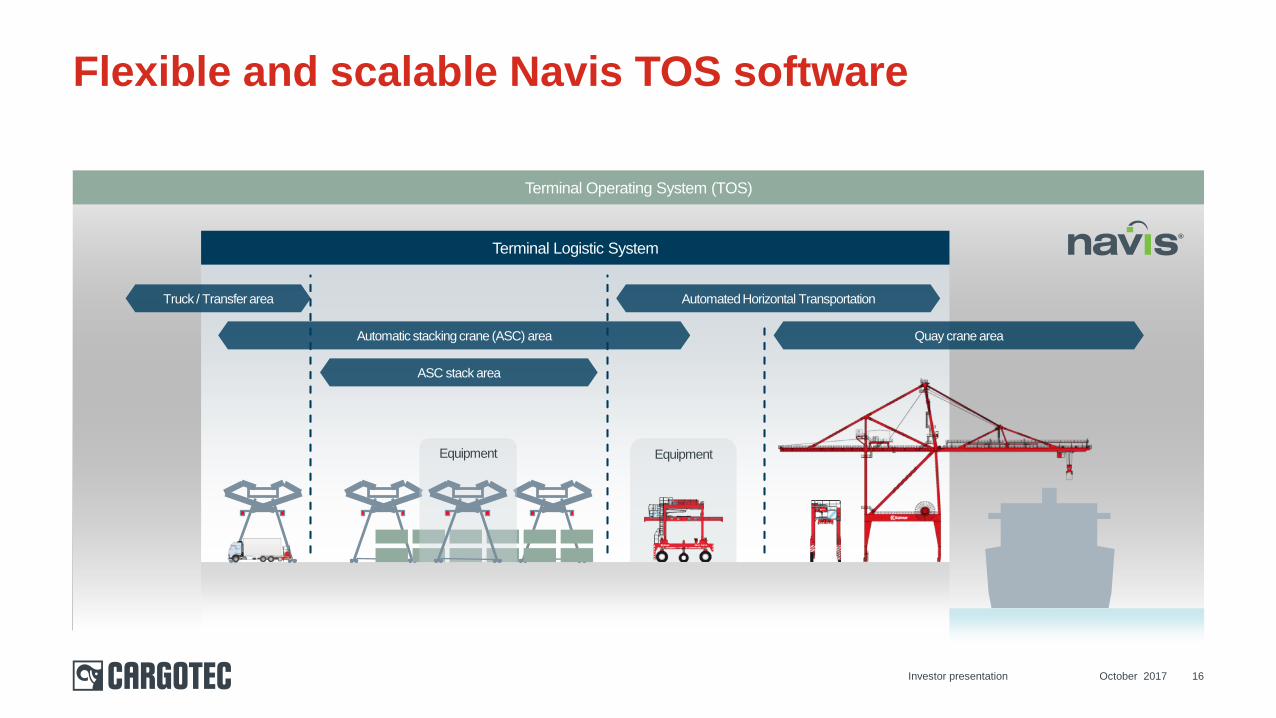
Flexible and scalable Navis TOS software
October 2017Investor presentation 16
Terminal Logistic System
Truck / Transfer area
ASC stack area
Automatic stacking crane (ASC) area
Automated Horizontal Transportation
Quay crane area
Equipment Equipment
Terminal Operating System (TOS)
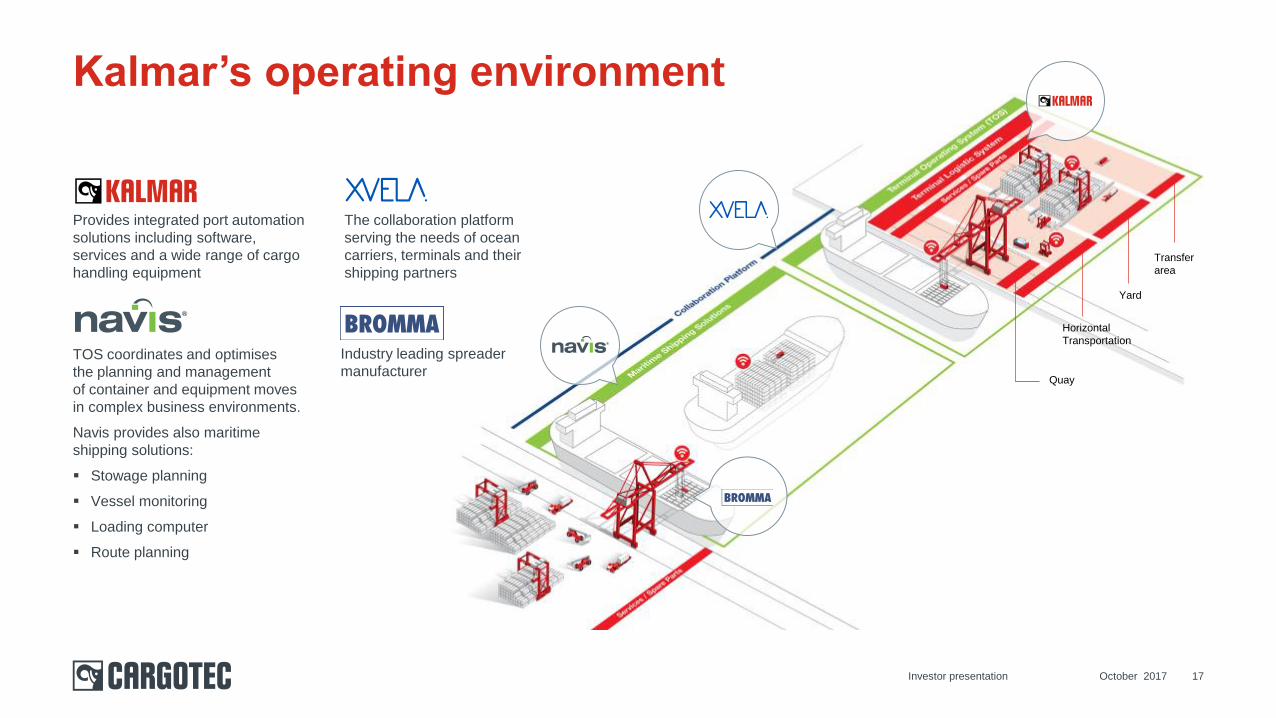
Kalmar’s operating environment
October 2017Investor presentation 17
Provides integrated port automation
solutions including software,
services and a wide range of cargo
handling equipment
TOS coordinates and optimises
the planning and management
of container and equipment moves
in complex business environments.
Navis provides also maritime
shipping solutions:
Stowage planning
Vessel monitoring
Loading computer
Route planning
Quay
Horizontal
Transportation
Yard
Transfer
area
Industry leading spreader
manufacturer
The collaboration platform
serving the needs of ocean
carriers, terminals and their
shipping partners
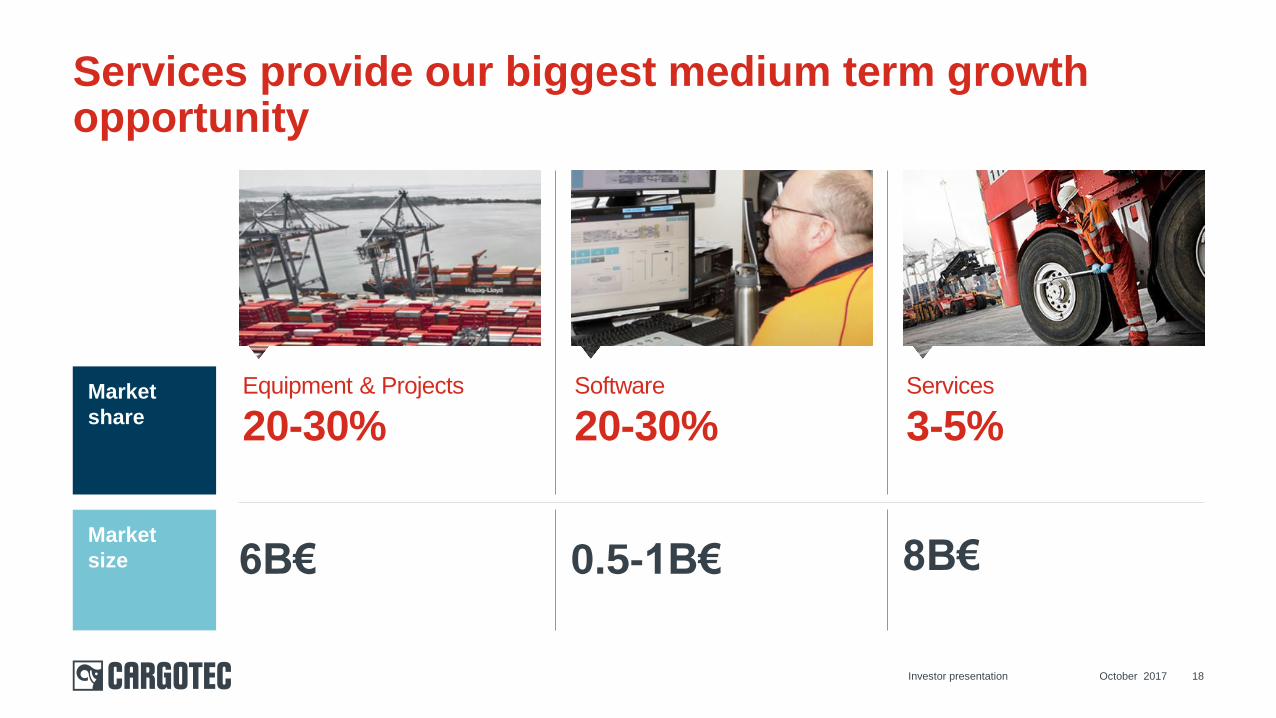
Services provide our biggest medium term growthopportunity
Market
share
Market
size
Services
3-5%
8B€
Equipment & Projects
20-30%
6B€ 0.5-1B€
Software
20-30%
October 2017Investor presentation 18
0
20
40
60
80
100
120
140
160
1990-1999 2000-2009 2010-2016 2017-2020
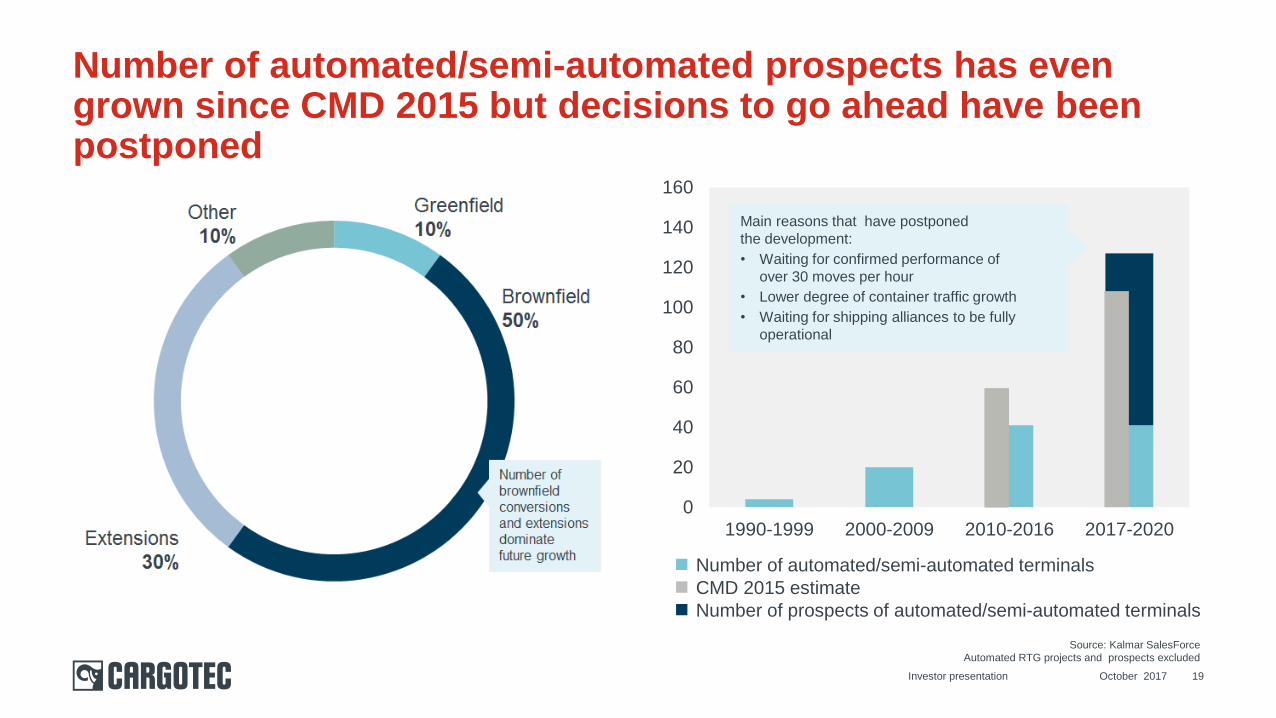
Number of automated/semi-automated prospects has even grown since CMD 2015 but decisions to go ahead have been postponed
Main reasons that have postponed
the development:
• Waiting for confirmed performance of
over 30 moves per hour
• Lower degree of container traffic growth
• Waiting for shipping alliances to be fully
operational
Number of automated/semi-automated terminals
Number of prospects of automated/semi-automated terminals
CMD 2015 estimate
Source: Kalmar SalesForce
Automated RTG projects and prospects excluded
October 2017Investor presentation 19
Hiab
October 2017Investor presentation 20
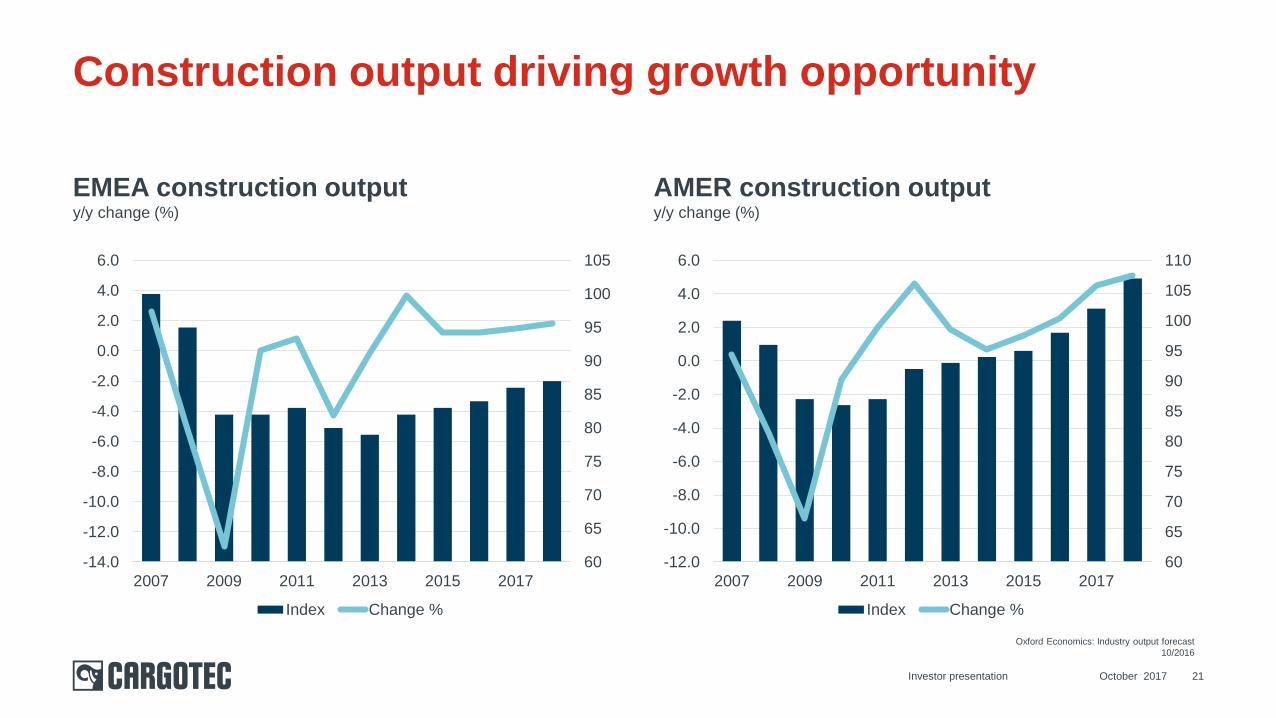
EMEA construction outputy/y change (%)
AMER construction outputy/y change (%)
Construction output driving growth opportunity
Oxford Economics: Industry output forecast
10/2016
-14.0
-12.0
-10.0
-8.0
-6.0
-4.0
-2.0
0.0
2.0
4.0
6.0
2007 2009 2011 2013 2015 2017
60
65
70
75
80
85
90
95
100
105
Index Change %
-12.0
-10.0
-8.0
-6.0
-4.0
-2.0
0.0
2.0
4.0
6.0
2007 2009 2011 2013 2015 2017
60
65
70
75
80
85
90
95
100
105
110
Index Change %
October 2017Investor presentation 21

Strong market positions in all product lines
October 2017Investor presentation 22
MARKET SIZE*
(EUR billion)
KEY
SEGMENTS
HIAB POSITION
& TREND
*) Cargotec estimate
~1.3
~0.5
~0.5
~0.3
~0.2
Retail
Logistics
Waste and
Recycling
Construction
and Logistics
Timber, Pulp
and Paper
Construction
and Logistics#1-2
#1
#1
#1
#2
LOADER
CRANES
TAIL
LIFTS
DEMOUNTABLES
TRUCK MOUNTED
FORK LIFTS
FORESTRY
CRANES
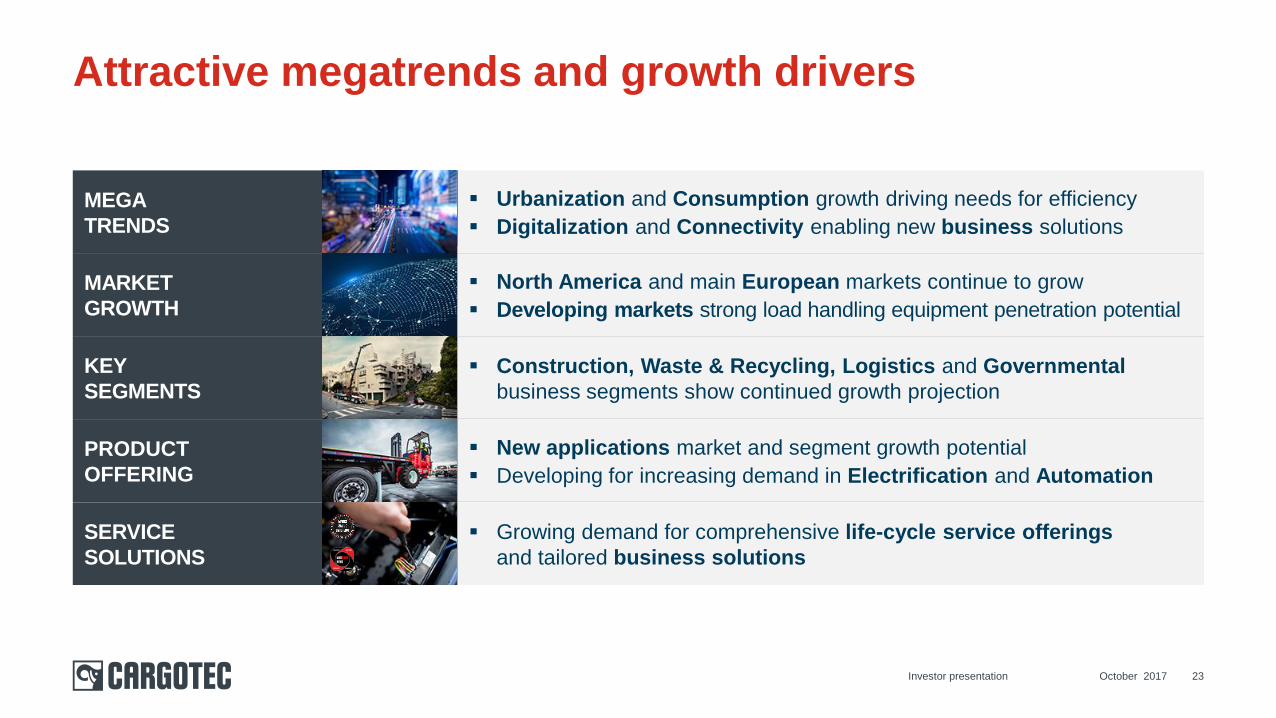
Urbanization and Consumption growth driving needs for efficiency
Digitalization and Connectivity enabling new business solutions
North America and main European markets continue to grow
Developing markets strong load handling equipment penetration potential
Construction, Waste & Recycling, Logistics and Governmental
business segments show continued growth projection
New applications market and segment growth potential
Developing for increasing demand in Electrification and Automation
Growing demand for comprehensive life-cycle service offerings
and tailored business solutions
Attractive megatrends and growth drivers
October 2017Investor presentation 23
MEGA
TRENDS
MARKET
GROWTH
KEY
SEGMENTS
PRODUCT
OFFERING
SERVICE
SOLUTIONS
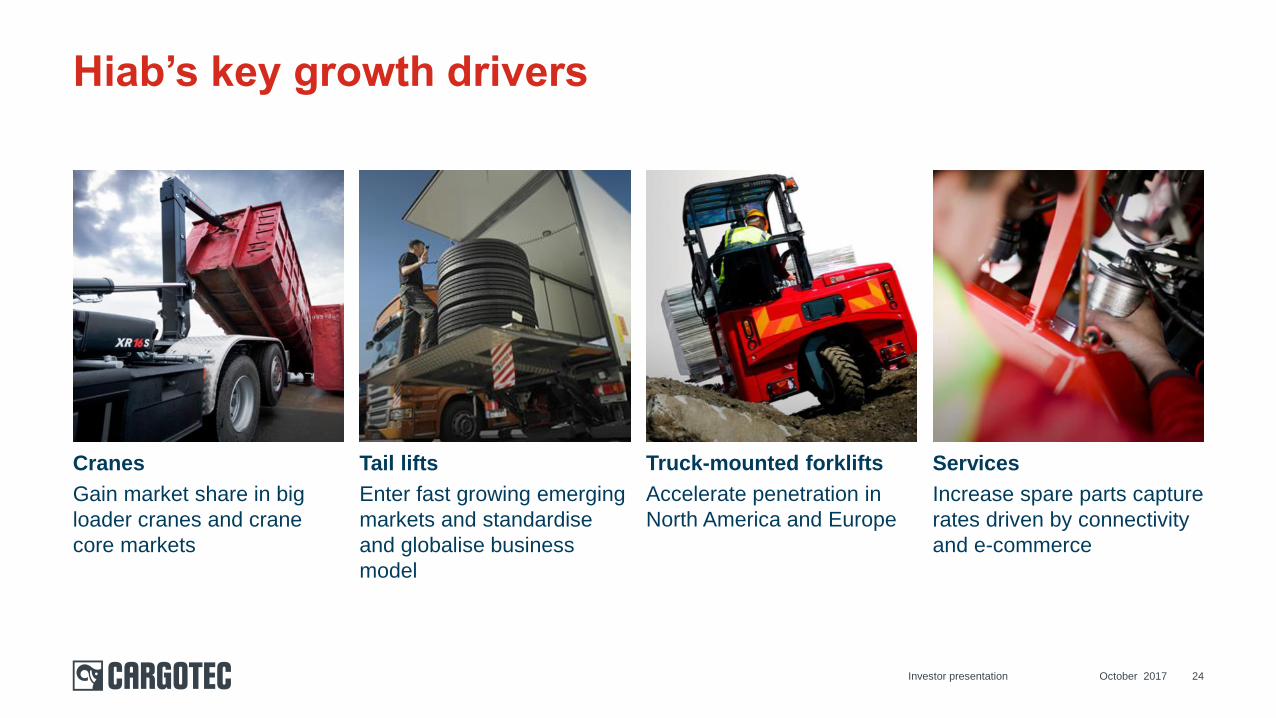
Hiab’s key growth drivers
October 2017Investor presentation 24
Cranes
Gain market share in big
loader cranes and crane
core markets
Tail lifts
Enter fast growing emerging
markets and standardise
and globalise business
model
Truck-mounted forklifts
Accelerate penetration in
North America and Europe
Services
Increase spare parts capture
rates driven by connectivity
and e-commerce
MacGregor
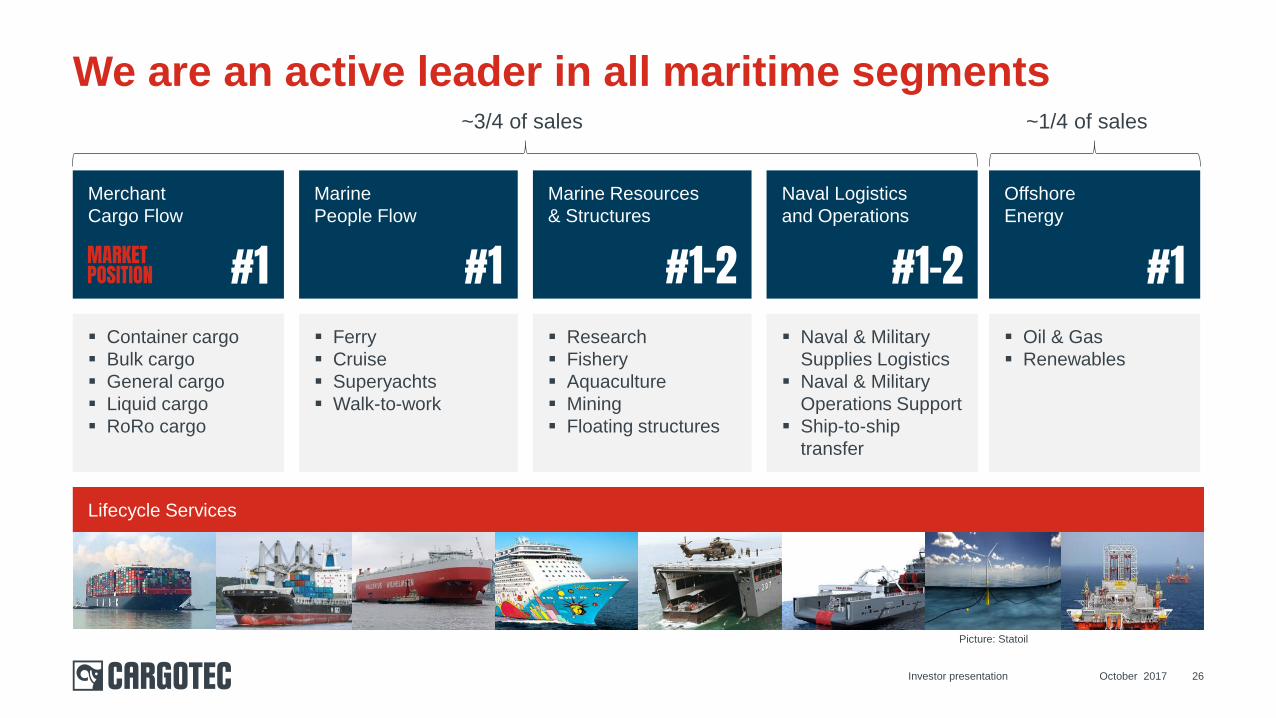
We are an active leader in all maritime segments
October 2017Investor presentation 26
Merchant
Cargo Flow
Marine
People Flow
Offshore
Energy
Marine Resources
& Structures
Naval Logistics
and Operations
Container cargo
Bulk cargo
General cargo
Liquid cargo
RoRo cargo
Ferry
Cruise
Superyachts
Walk-to-work
Oil & Gas
Renewables
Research
Fishery
Aquaculture
Mining
Floating structures
Naval & Military
Supplies Logistics
Naval & Military
Operations Support
Ship-to-ship
transfer
Lifecycle Services
Picture: Statoil
~3/4 of sales ~1/4 of sales
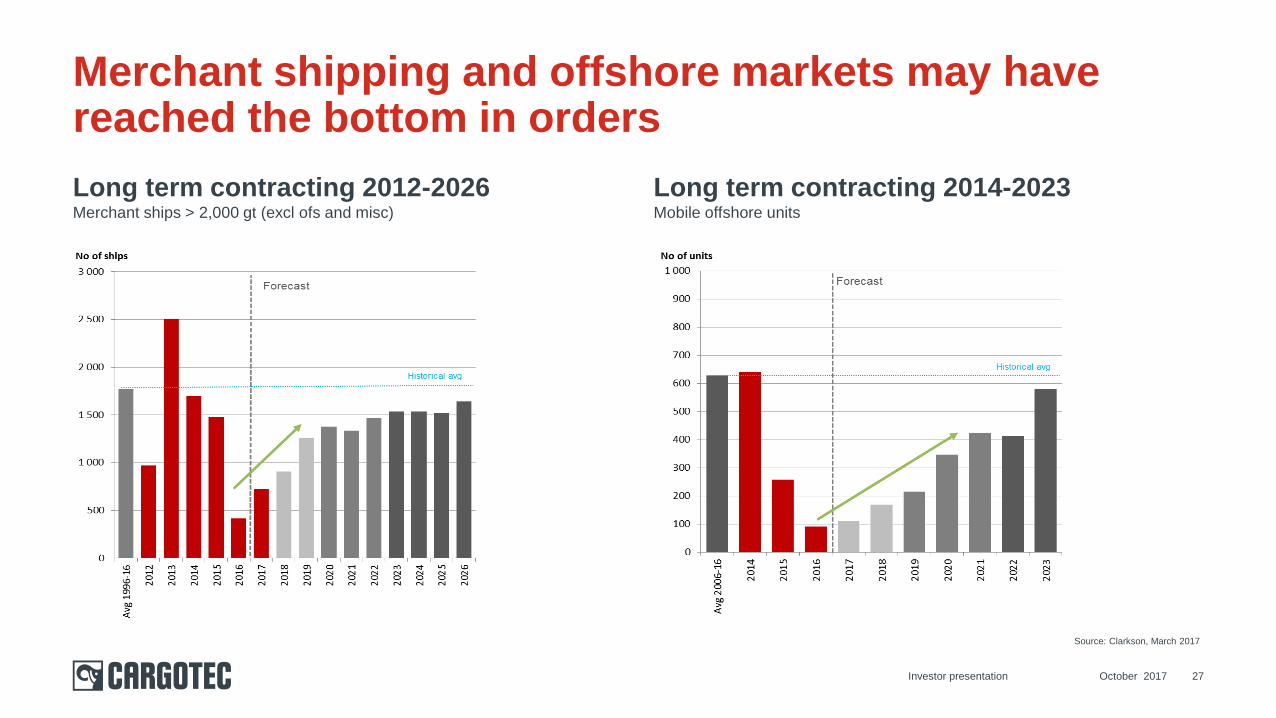
Long term contracting 2012-2026Merchant ships > 2,000 gt (excl ofs and misc)
Long term contracting 2014-2023Mobile offshore units
Merchant shipping and offshore markets may have reached the bottom in orders
October 2017Investor presentation 27
Source: Clarkson, March 2017
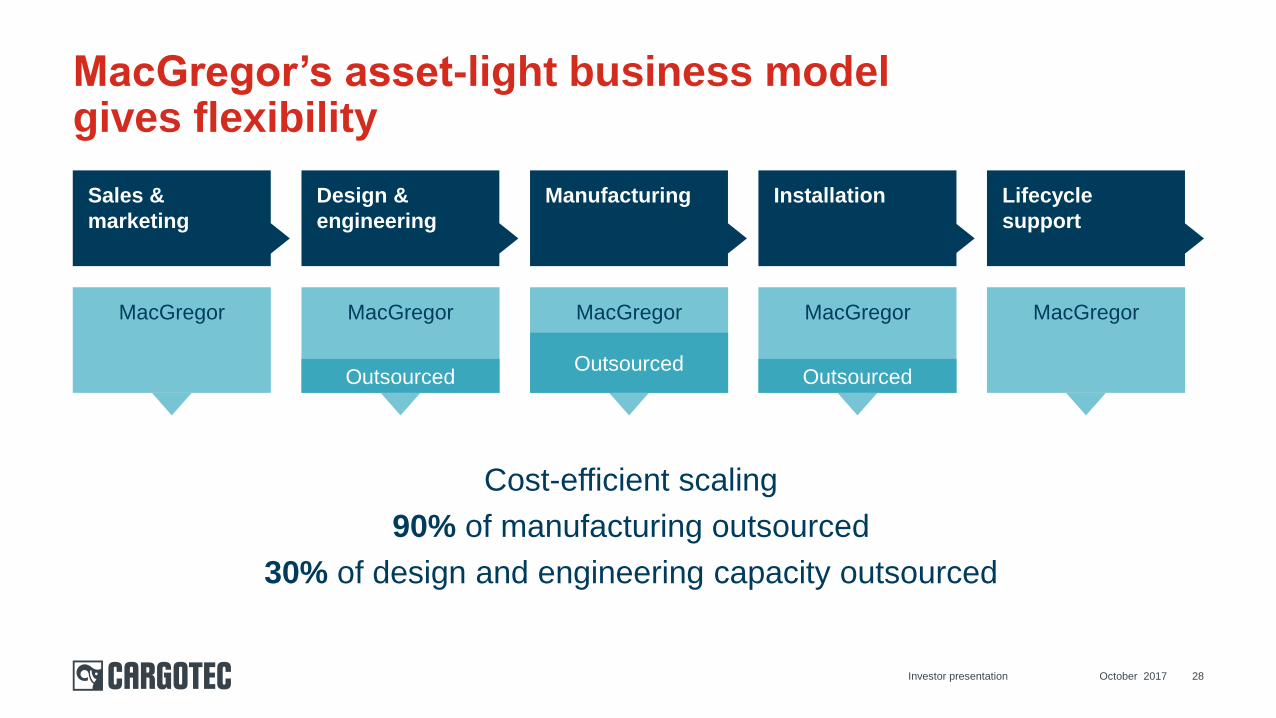
MacGregor’s asset-light business modelgives flexibility
October 2017Investor presentation 28
Sales &
marketing
Design &
engineering
Manufacturing Installation Lifecycle
support
MacGregor MacGregor MacGregor MacGregor MacGregor
OutsourcedOutsourced
Outsourced
Cost-efficient scaling
90% of manufacturing outsourced
30% of design and engineering capacity outsourced
Recent progress
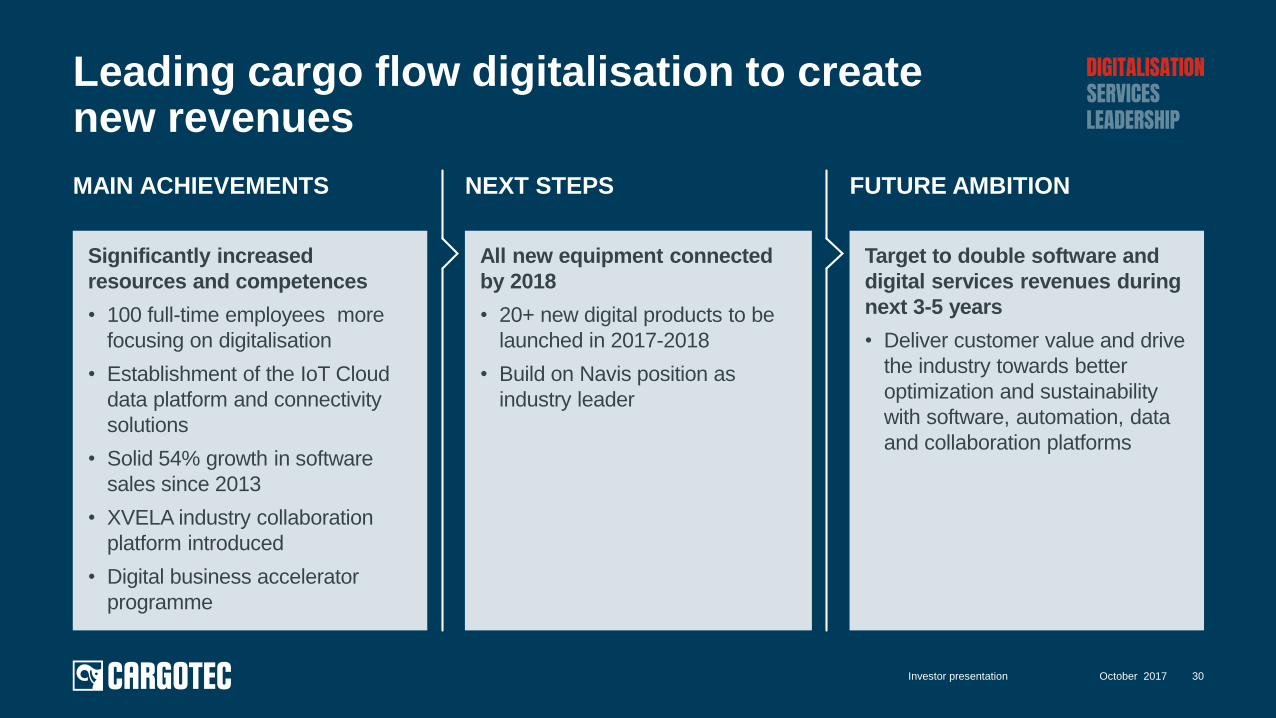
Leading cargo flow digitalisation to createnew revenues
October 2017Investor presentation 30
Significantly increased
resources and competences
• 100 full-time employees more
focusing on digitalisation
• Establishment of the IoT Cloud
data platform and connectivity
solutions
• Solid 54% growth in software
sales since 2013
• XVELA industry collaboration
platform introduced
• Digital business accelerator
programme
MAIN ACHIEVEMENTS NEXT STEPS
All new equipment connected
by 2018
• 20+ new digital products to be
launched in 2017-2018
• Build on Navis position as
industry leader
FUTURE AMBITION
Target to double software and
digital services revenues during
next 3-5 years
• Deliver customer value and drive
the industry towards better
optimization and sustainability
with software, automation, data
and collaboration platforms
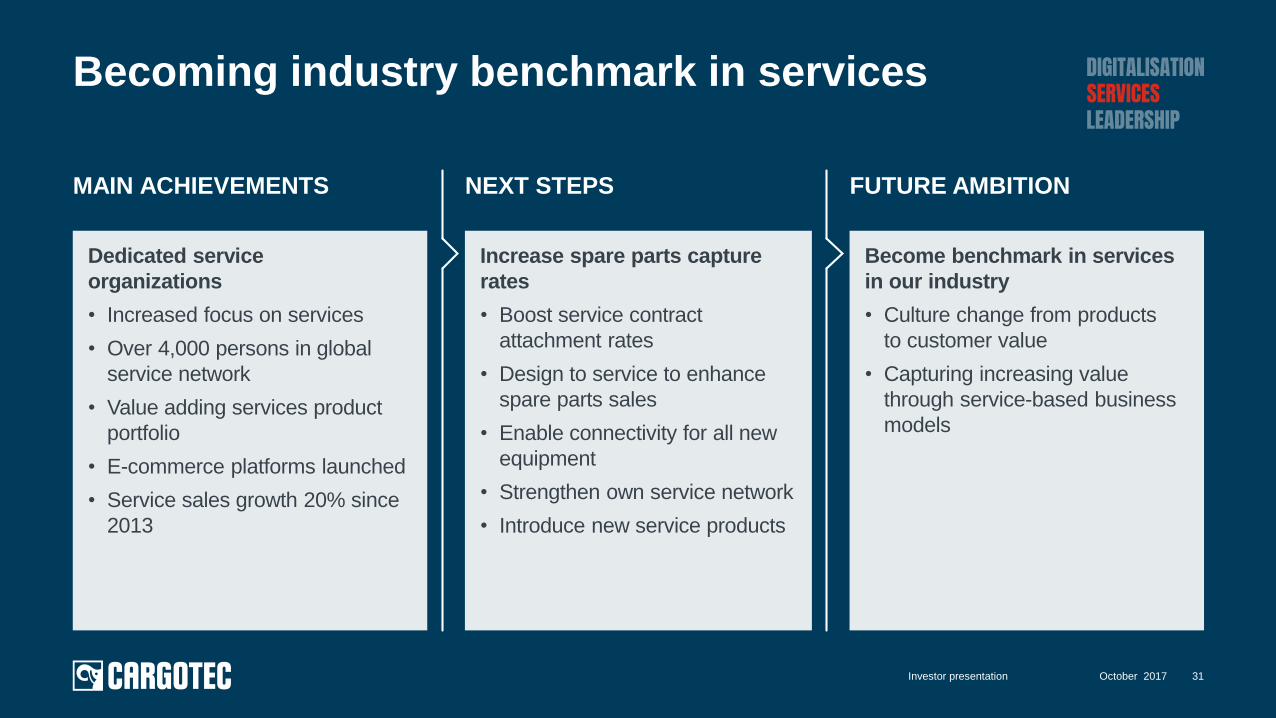
Becoming industry benchmark in services
October 2017Investor presentation 31
Dedicated service
organizations
• Increased focus on services
• Over 4,000 persons in global
service network
• Value adding services product
portfolio
• E-commerce platforms launched
• Service sales growth 20% since
2013
MAIN ACHIEVEMENTS NEXT STEPS
Increase spare parts capture
rates
• Boost service contract
attachment rates
• Design to service to enhance
spare parts sales
• Enable connectivity for all new
equipment
• Strengthen own service network
• Introduce new service products
FUTURE AMBITION
Become benchmark in services
in our industry
• Culture change from products
to customer value
• Capturing increasing value
through service-based business
models
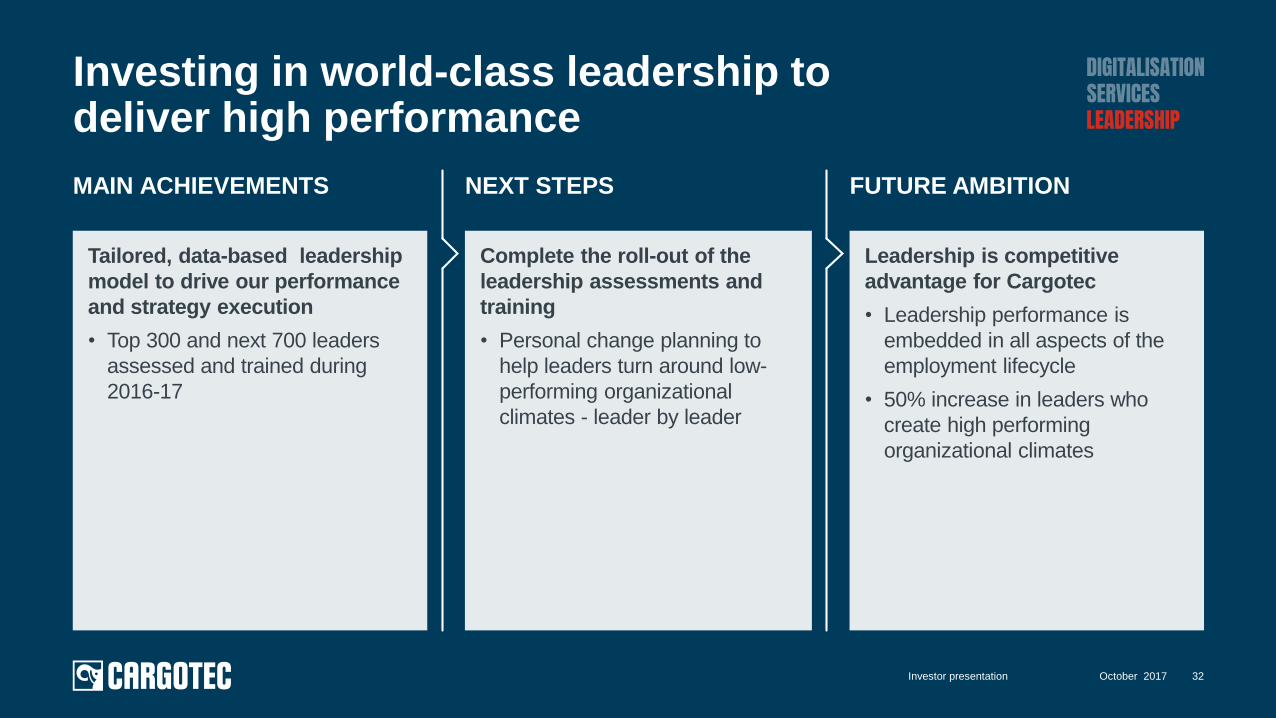
Investing in world-class leadership todeliver high performance
October 2017Investor presentation 32
Tailored, data-based leadership
model to drive our performance
and strategy execution
• Top 300 and next 700 leaders
assessed and trained during
2016-17
MAIN ACHIEVEMENTS NEXT STEPS
Complete the roll-out of the
leadership assessments and
training
• Personal change planning to
help leaders turn around low-
performing organizational
climates - leader by leader
FUTURE AMBITION
Leadership is competitive
advantage for Cargotec
• Leadership performance is
embedded in all aspects of the
employment lifecycle
• 50% increase in leaders who
create high performing
organizational climates
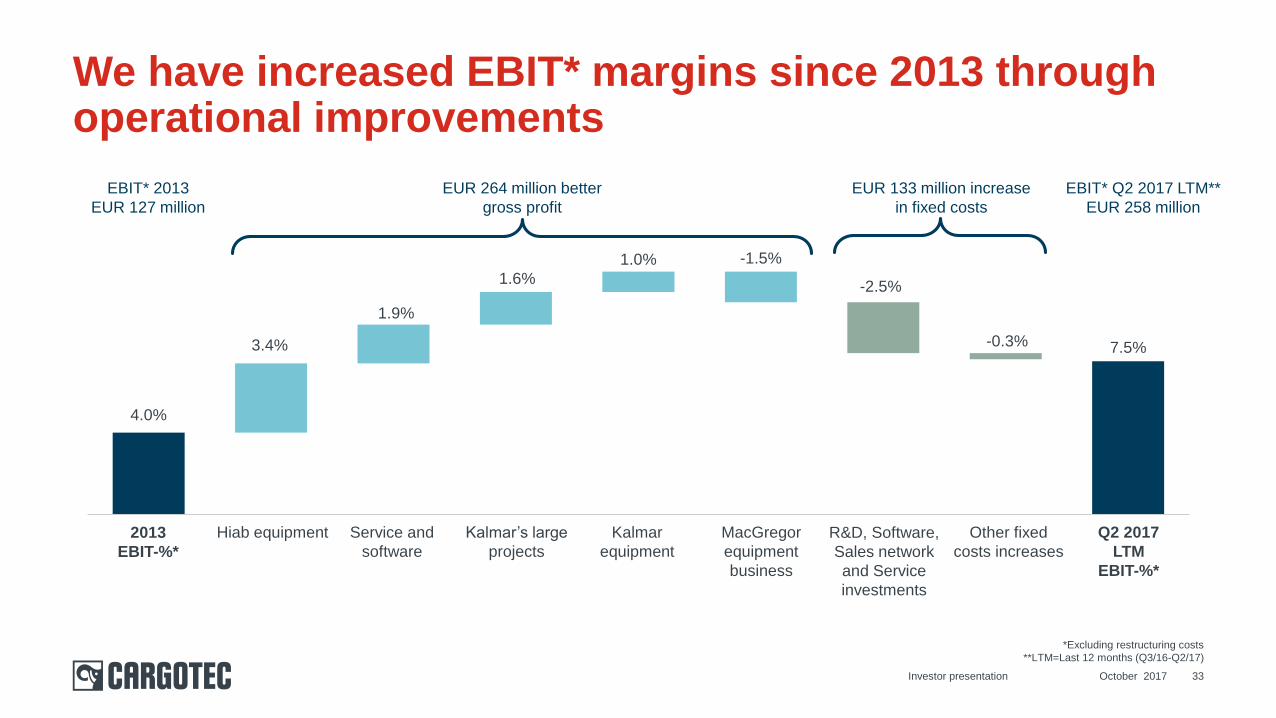
4.0%
7.5%3.4%
1.9%
1.6%
1.0% -1.5%
-2.5%
-0.3%
October 2017Investor presentation 33
We have increased EBIT* margins since 2013 through operational improvements
*Excluding restructuring costs
**LTM=Last 12 months (Q3/16-Q2/17)
2013
EBIT-%*
Hiab equipment Service and
software
Kalmar’s large
projects
Kalmar
equipment
MacGregor
equipment
business
R&D, Software,
Sales network
and Service
investments
Other fixed
costs increases
Q2 2017
LTM
EBIT-%*
EBIT* 2013
EUR 127 million
EUR 264 million better
gross profit
EUR 133 million increase
in fixed costs
EBIT* Q2 2017 LTM**
EUR 258 million
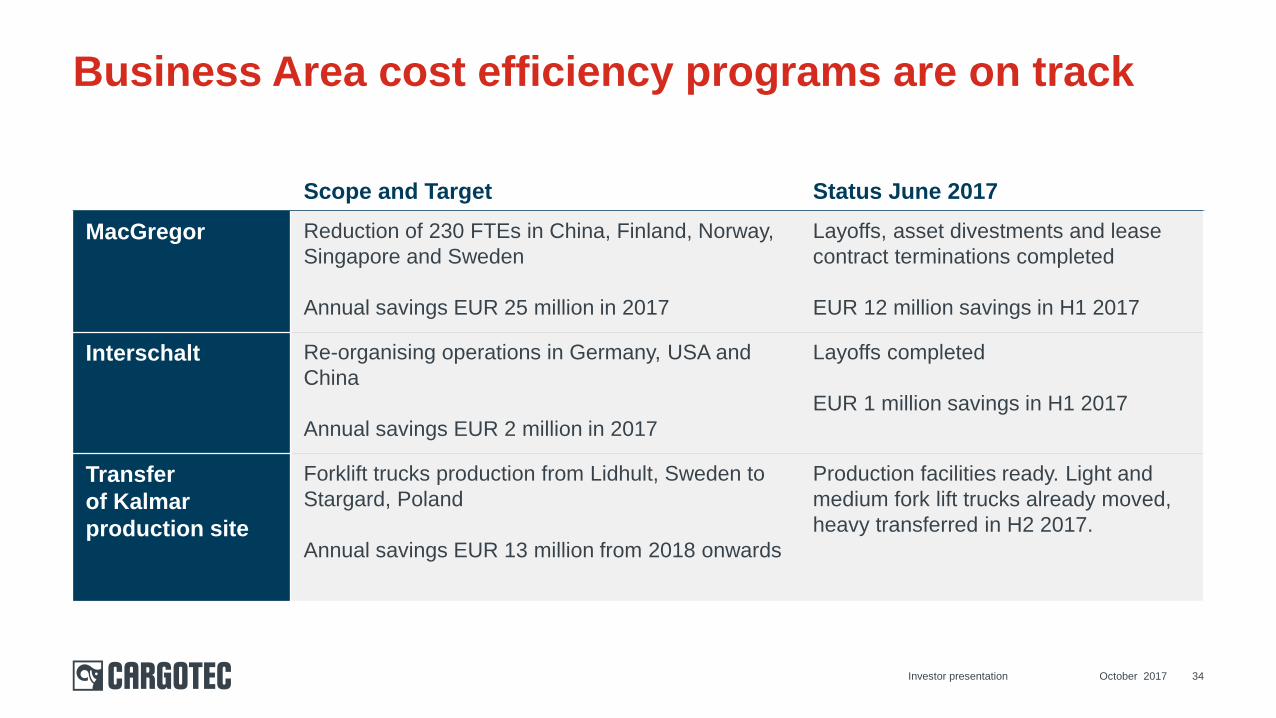
October 2017Investor presentation 34
Business Area cost efficiency programs are on track
Scope and Target Status June 2017
MacGregor Reduction of 230 FTEs in China, Finland, Norway,
Singapore and Sweden
Annual savings EUR 25 million in 2017
Layoffs, asset divestments and lease
contract terminations completed
EUR 12 million savings in H1 2017
Interschalt Re-organising operations in Germany, USA and
China
Annual savings EUR 2 million in 2017
Layoffs completed
EUR 1 million savings in H1 2017
Transfer
of Kalmar
production site
Forklift trucks production from Lidhult, Sweden to
Stargard, Poland
Annual savings EUR 13 million from 2018 onwards
Production facilities ready. Light and
medium fork lift trucks already moved,
heavy transferred in H2 2017.
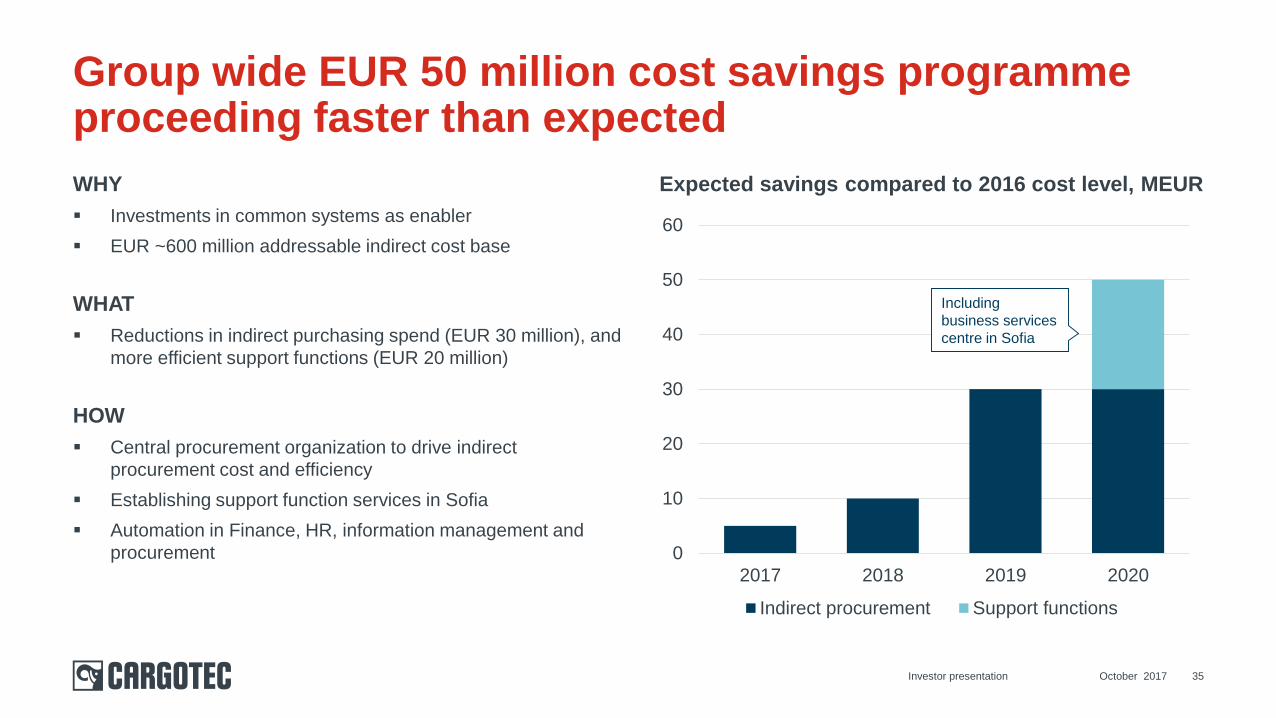
WHY
Investments in common systems as enabler
EUR ~600 million addressable indirect cost base
WHAT
Reductions in indirect purchasing spend (EUR 30 million), and
more efficient support functions (EUR 20 million)
HOW
Central procurement organization to drive indirect
procurement cost and efficiency
Establishing support function services in Sofia
Automation in Finance, HR, information management and
procurement 0
10
20
30
40
50
60
2017 2018 2019 2020
Indirect procurement Support functions
October 2017Investor presentation 35
Group wide EUR 50 million cost savings programme proceeding faster than expected
Expected savings compared to 2016 cost level, MEUR
Including
business services
centre in Sofia
October 2017Investor presentation 36
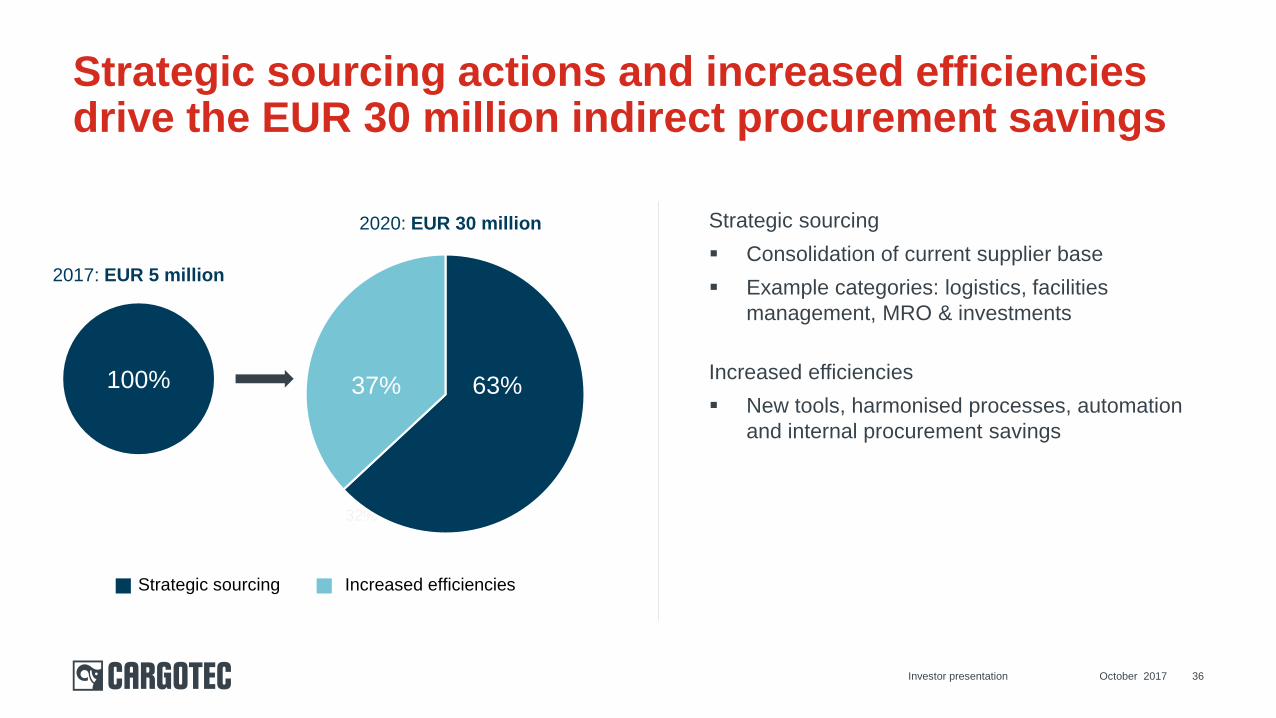
Strategic sourcing actions and increased efficiencies drive the EUR 30 million indirect procurement savings
Key actions
100%
32%
37%
100% 63%37%
2017: EUR 5 million
2020: EUR 30 million
Increased efficienciesStrategic sourcing
Strategic sourcing
Consolidation of current supplier base
Example categories: logistics, facilities
management, MRO & investments
Increased efficiencies
New tools, harmonised processes, automation
and internal procurement savings
Savings from consolidation, outsourcing of certain
activities, labour arbitrage and robotics
Scope: Finance, Human Resources, Information
Management and Indirect Procurement services
primarily from Sofia, Bulgaria
Good progress in establishing Cargotec Business
Services
– Infrastructure ready, key positions manned
– First 53 employees joined on 1st of August, induction
has started
Finland as pilot, cooperation negotiations
completed in June 2017
October 2017Investor presentation 37
We establish Cargotec Business Services in Sofia to improve support function efficiency by EUR 20 million
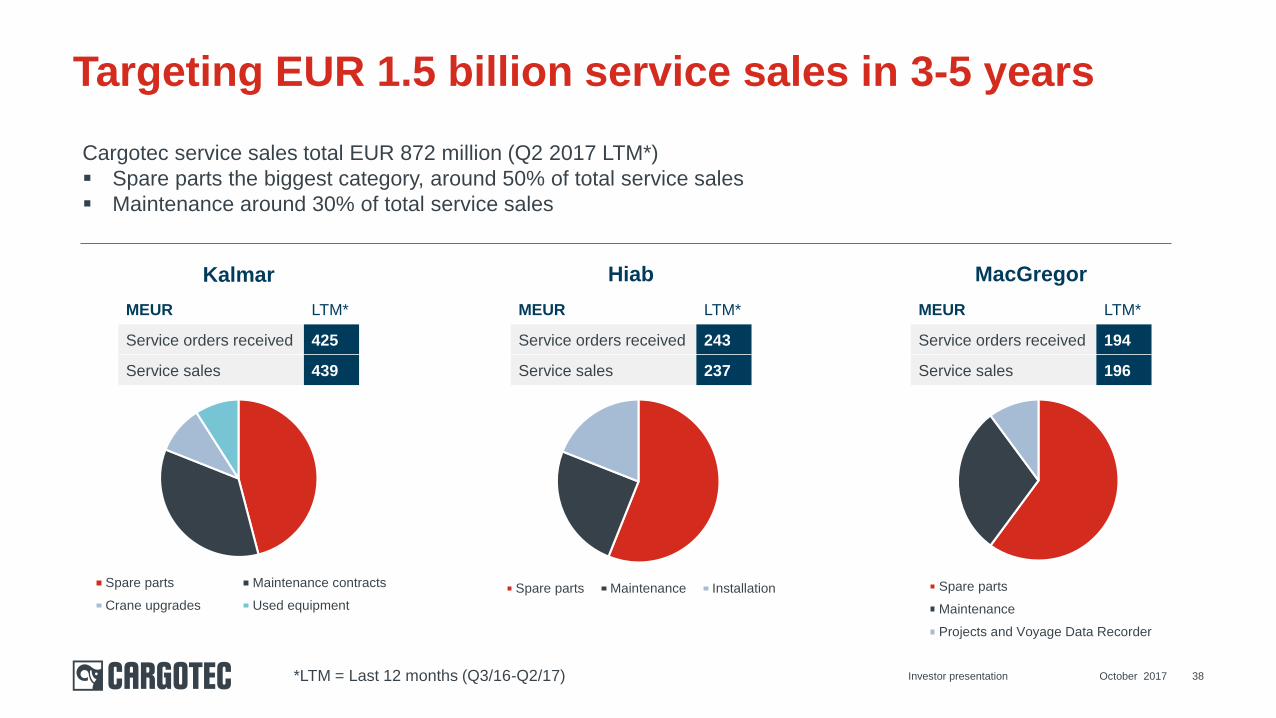
Targeting EUR 1.5 billion service sales in 3-5 years
October 2017Investor presentation 38
Spare parts Maintenance contracts
Crane upgrades Used equipment
Spare parts Maintenance Installation Spare parts
Maintenance
Projects and Voyage Data Recorder
Cargotec service sales total EUR 872 million (Q2 2017 LTM*)
Spare parts the biggest category, around 50% of total service sales
Maintenance around 30% of total service sales
MEUR LTM*
Service orders received 425
Service sales 439
Kalmar
MEUR LTM*
Service orders received 243
Service sales 237
Hiab
MEUR LTM*
Service orders received 194
Service sales 196
MacGregor
*LTM = Last 12 months (Q3/16-Q2/17)
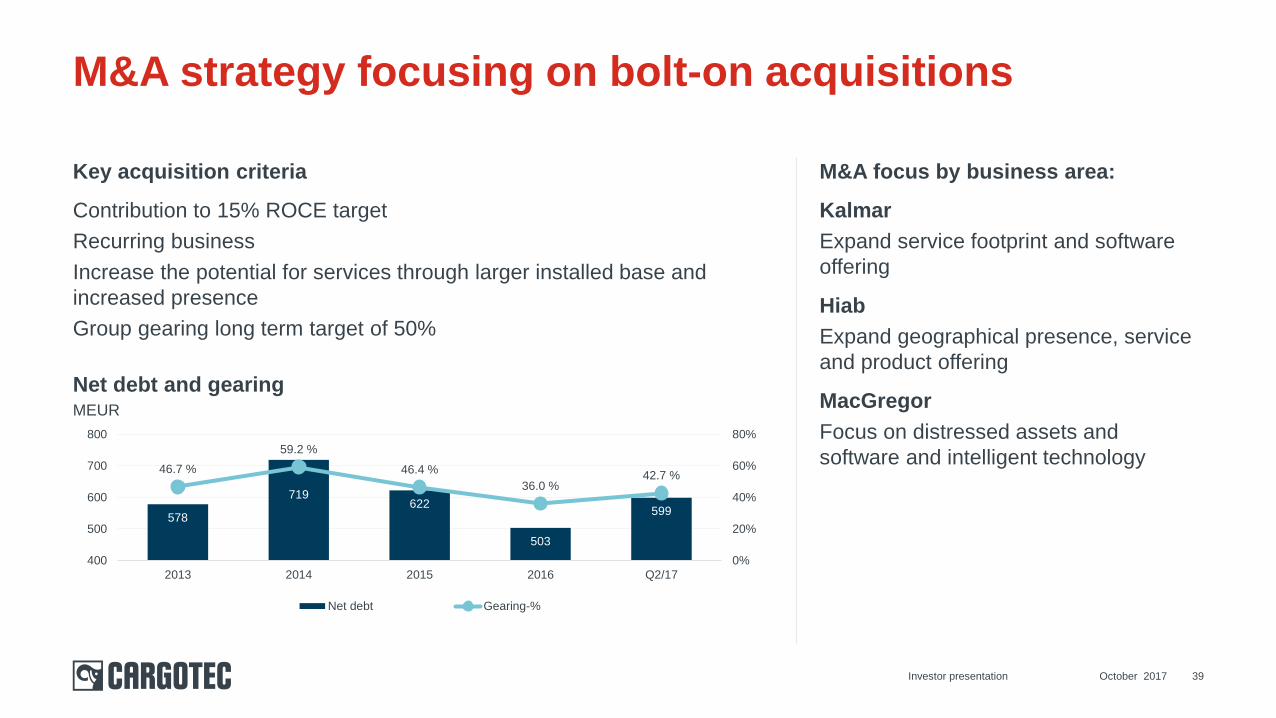
M&A strategy focusing on bolt-on acquisitions
October 2017Investor presentation 39
M&A focus by business area:
Kalmar
Expand service footprint and software
offering
Hiab
Expand geographical presence, service
and product offering
MacGregor
Focus on distressed assets and
software and intelligent technology
578
719622
503
599
46.7 %
59.2 %
46.4 %
36.0 %42.7 %
0%
20%
40%
60%
80%
400
500
600
700
800
2013 2014 2015 2016 Q2/17
Net debt Gearing-%
Net debt and gearingMEUR
Key acquisition criteria
Contribution to 15% ROCE target
Recurring business
Increase the potential for services through larger installed base and
increased presence
Group gearing long term target of 50%
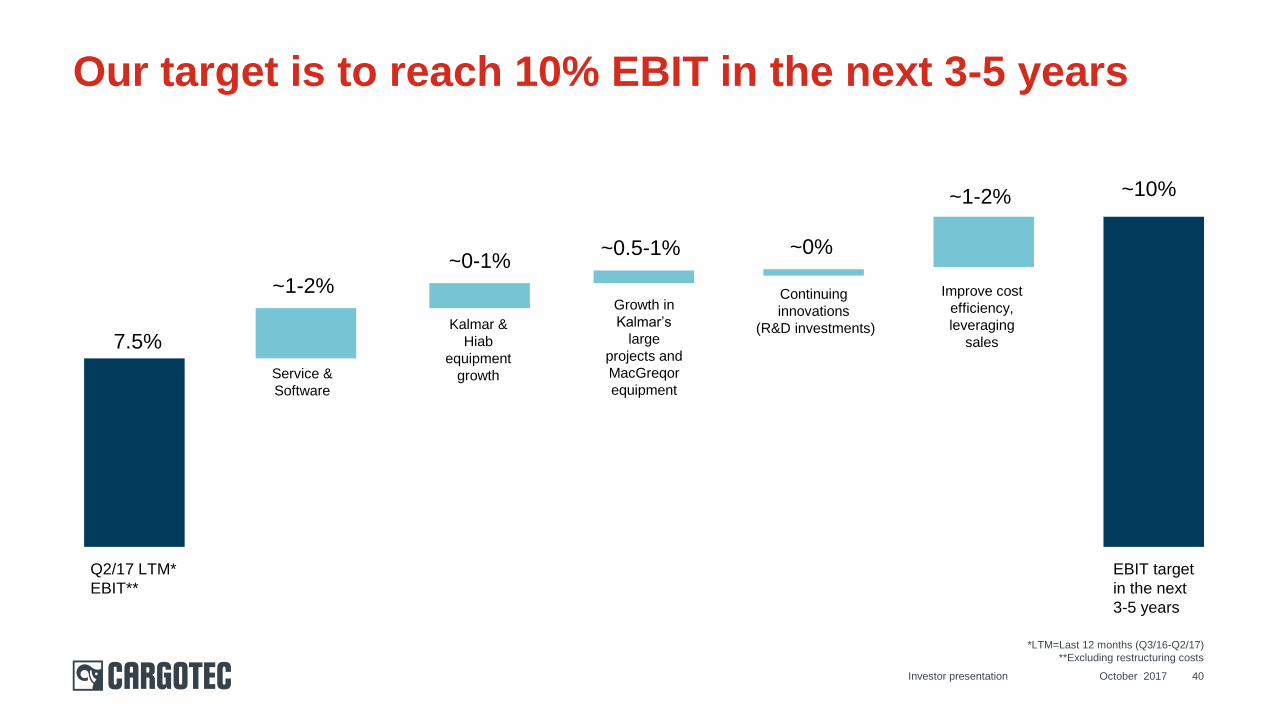
Our target is to reach 10% EBIT in the next 3-5 years
October 2017 40
Q2/17 LTM*
EBIT**
7.5%
Service &
Software
Kalmar &
Hiab
equipment
growth
Growth in
Kalmar’s
large
projects and
MacGreqor
equipment
Continuing
innovations
(R&D investments)
Improve cost
efficiency,
leveraging
sales
~10%
EBIT target
in the next
3-5 years
~1-2%
~0-1%~0.5-1% ~0%
~1-2%
Investor presentation
*LTM=Last 12 months (Q3/16-Q2/17)
**Excluding restructuring costs
October 2017Investor presentation 41
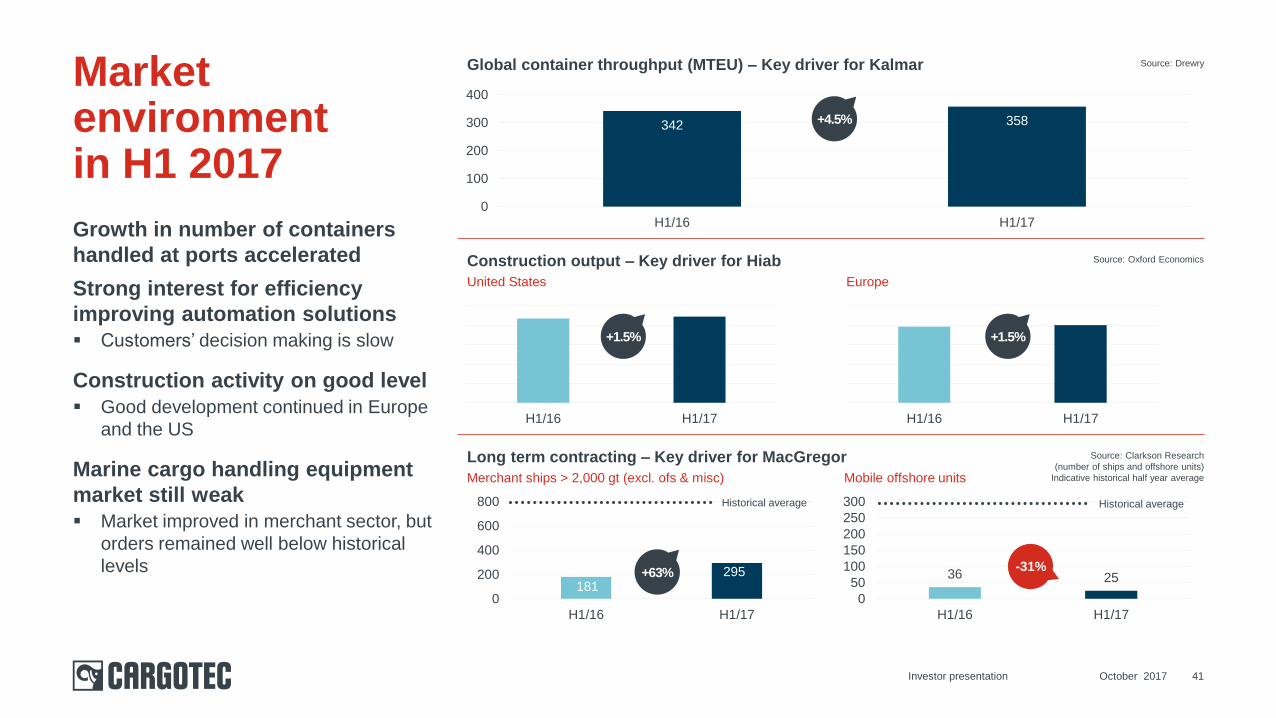
Growth in number of containers
handled at ports accelerated
Strong interest for efficiency
improving automation solutions
Customers’ decision making is slow
Construction activity on good level
Good development continued in Europe
and the US
Marine cargo handling equipment
market still weak
Market improved in merchant sector, but
orders remained well below historical
levels
Market environmentin H1 2017
Source: Clarkson Research
(number of ships and offshore units)
Indicative historical half year average
181295
0
200
400
600
800
H1/16 H1/17
36 25
0
50
100
150
200
250
300
H1/16 H1/17
H1/16 H1/17 H1/16 H1/17
342 358
0
100
200
300
400
H1/16 H1/17
Long term contracting – Key driver for MacGregor
Construction output – Key driver for Hiab
Global container throughput (MTEU) – Key driver for Kalmar
Merchant ships > 2,000 gt (excl. ofs & misc) Mobile offshore units
United States Europe
Source: Oxford Economics
Source: Drewry
+1.5% +1.5%
+4.5%
Historical average Historical average
+63% -31%
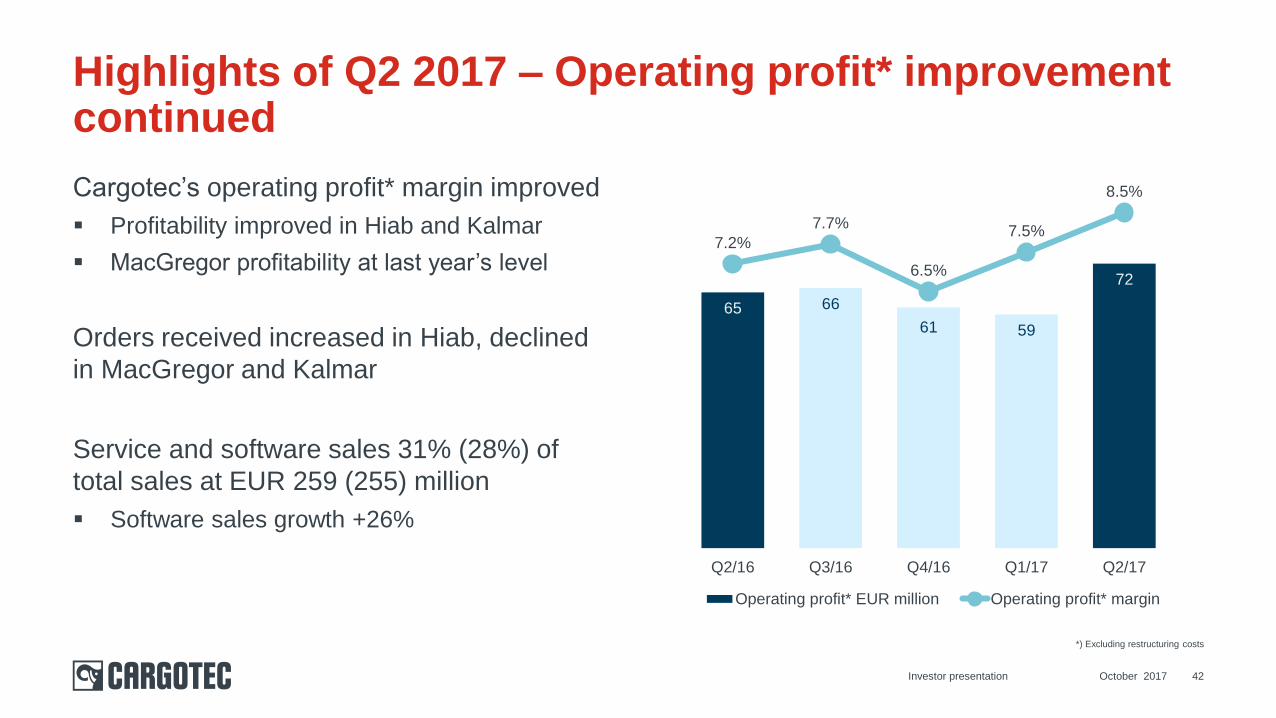
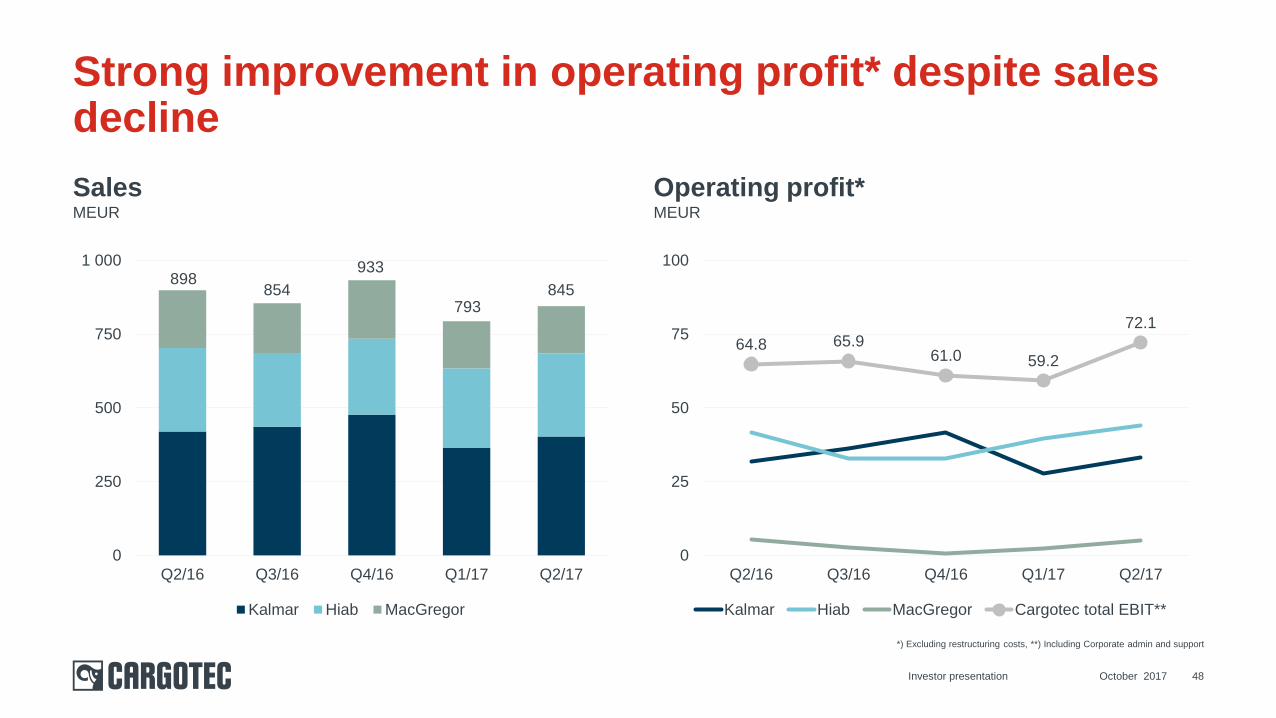
Cargotec’s operating profit* margin improved
Profitability improved in Hiab and Kalmar
MacGregor profitability at last year’s level
Orders received increased in Hiab, declined
in MacGregor and Kalmar
Service and software sales 31% (28%) of
total sales at EUR 259 (255) million
Software sales growth +26%
65 66
61 59
72
7.2%
7.7%
6.5%
7.5%
8.5%
Q2/16 Q3/16 Q4/16 Q1/17 Q2/17
Operating profit* EUR million Operating profit* margin
42
Highlights of Q2 2017 – Operating profit* improvement continued
October 2017Investor presentation
*) Excluding restructuring costs
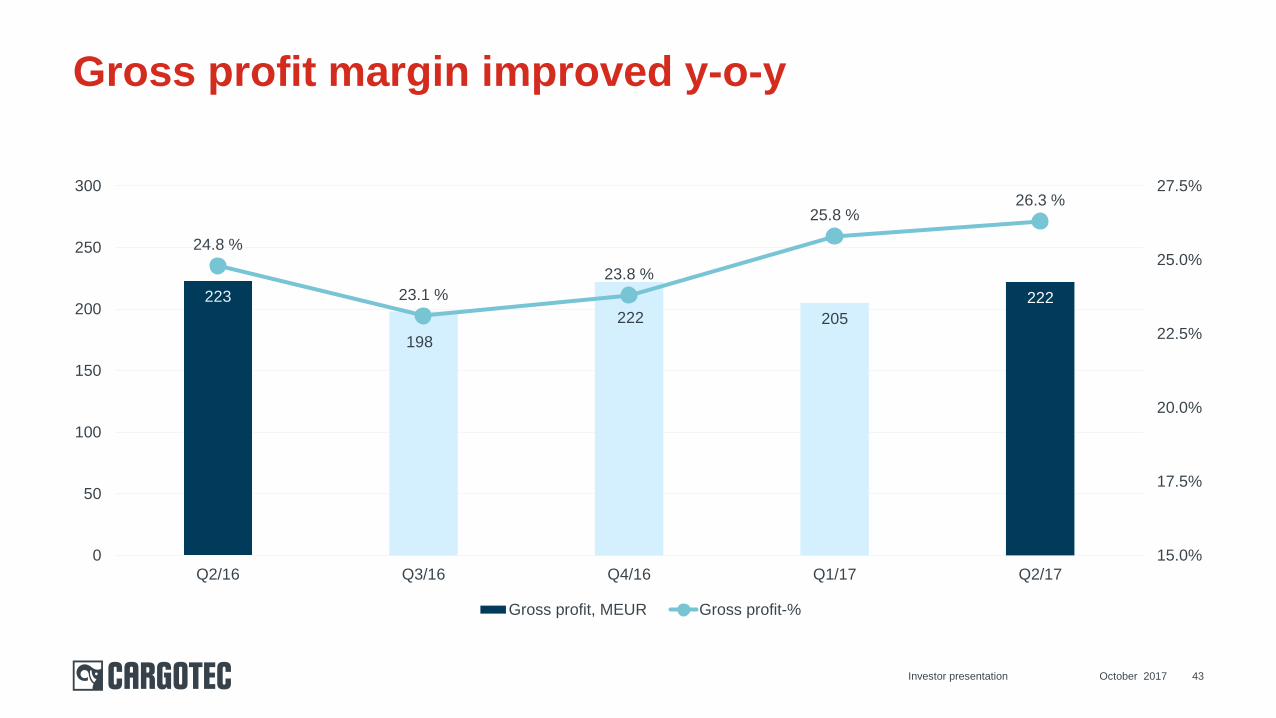
43
Gross profit margin improved y-o-y
223
198
222 205
222
24.8 %
23.1 %
23.8 %
25.8 %26.3 %
15.0%
17.5%
20.0%
22.5%
25.0%
27.5%
0
50
100
150
200
250
300
Q2/16 Q3/16 Q4/16 Q1/17 Q2/17
Gross profit, MEUR Gross profit-%
October 2017Investor presentation
October 2017Investor presentation 44
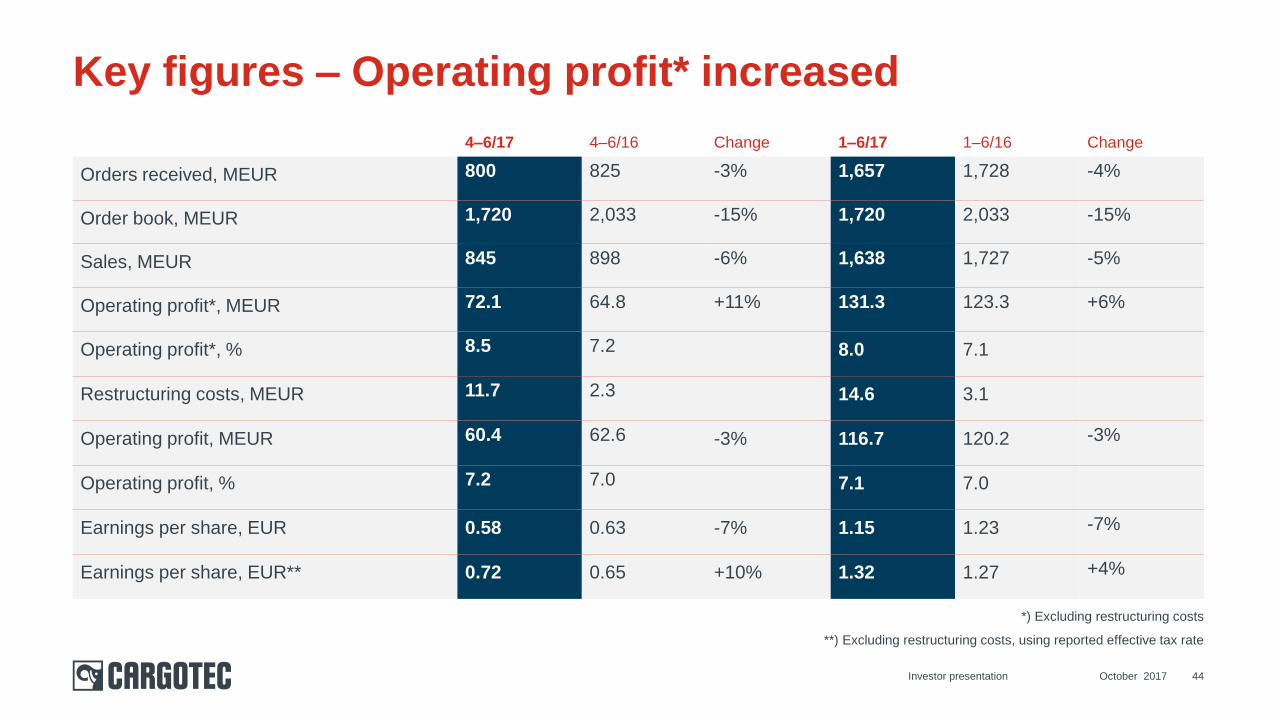
Key figures – Operating profit* increased
4–6/17 4–6/16 Change 1–6/17 1–6/16 Change
Orders received, MEUR 800 825 -3% 1,657 1,728 -4%
Order book, MEUR 1,720 2,033 -15% 1,720 2,033 -15%
Sales, MEUR 845 898 -6% 1,638 1,727 -5%
Operating profit*, MEUR 72.1 64.8 +11% 131.3 123.3 +6%
Operating profit*, % 8.5 7.2 8.0 7.1
Restructuring costs, MEUR 11.7 2.3 14.6 3.1
Operating profit, MEUR 60.4 62.6 -3% 116.7 120.2 -3%
Operating profit, % 7.2 7.0 7.1 7.0
Earnings per share, EUR 0.58 0.63 -7% 1.15 1.23 -7%
Earnings per share, EUR** 0.72 0.65 +10% 1.32 1.27 +4%
*) Excluding restructuring costs
**) Excluding restructuring costs, using reported effective tax rate
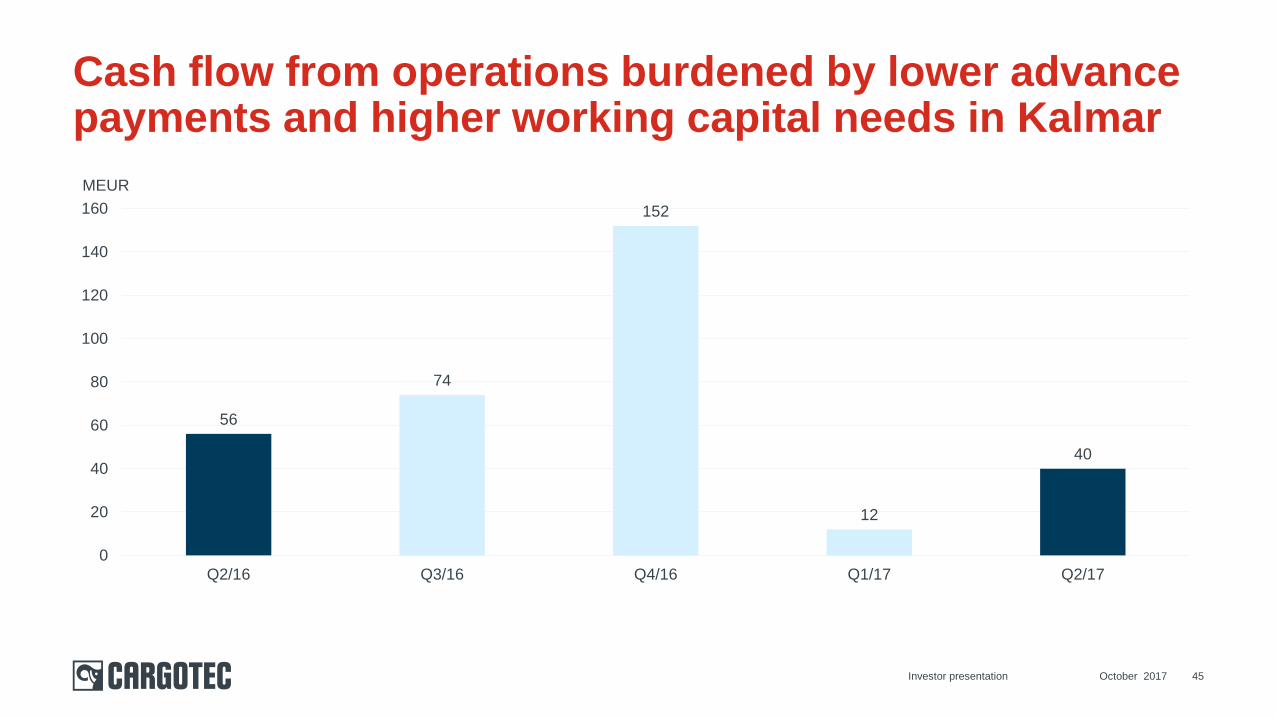
45
Cash flow from operations burdened by lower advance payments and higher working capital needs in Kalmar
56
74
152
12
40
0
20
40
60
80
100
120
140
160
Q2/16 Q3/16 Q4/16 Q1/17 Q2/17
October 2017Investor presentation
MEUR
0
200
400
600
800
1 000
Q2/16 Q3/16 Q4/16 Q1/17 Q2/17
Kalmar Hiab MacGregor
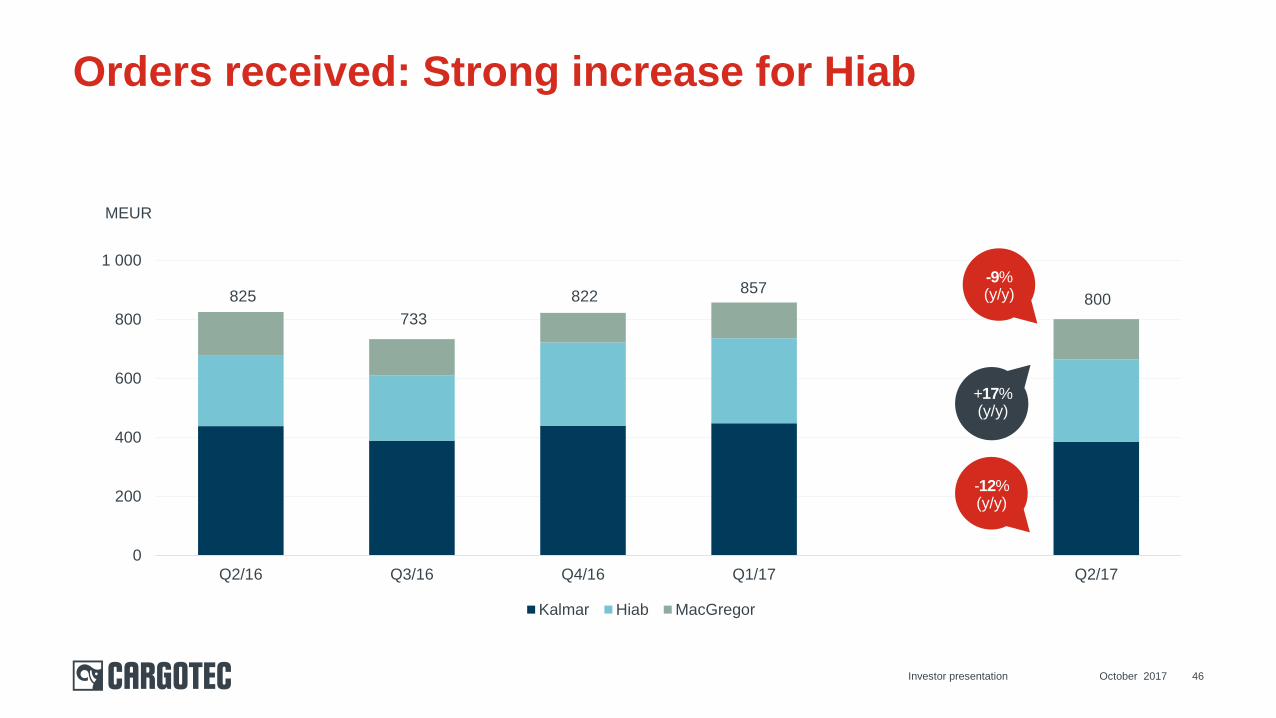
46
Orders received: Strong increase for Hiab
825
733
822857
+17%(y/y)
-9%(y/y)
October 2017Investor presentation
MEUR
800
-12%(y/y)
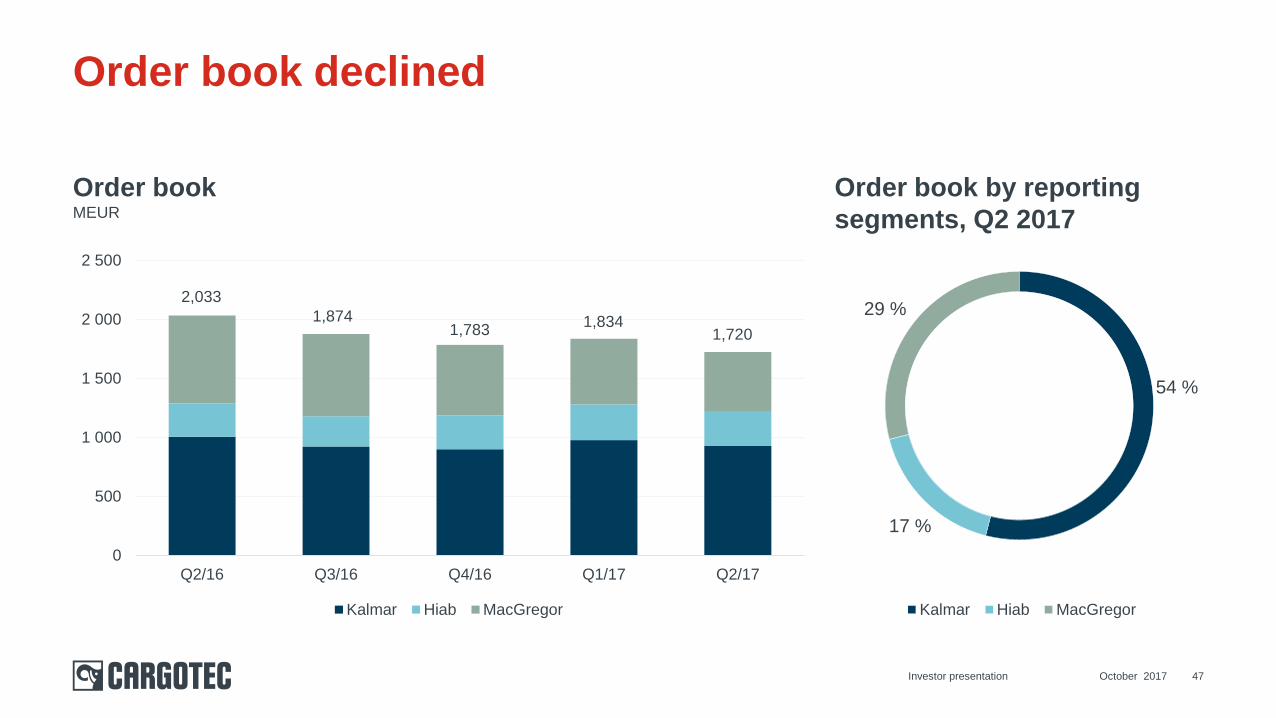
Order bookMEUR
October 2017Investor presentation 47
Order book declined
Order book by reporting
segments, Q2 2017
0
500
1 000
1 500
2 000
2 500
Q2/16 Q3/16 Q4/16 Q1/17 Q2/17
Kalmar Hiab MacGregor
54 %
17 %
29 %
Kalmar Hiab MacGregor
2,033
1,8741,783
1,8341,720
SalesMEUR
Operating profit*MEUR
48
Strong improvement in operating profit* despite sales decline
0
250
500
750
1 000
Q2/16 Q3/16 Q4/16 Q1/17 Q2/17
Kalmar Hiab MacGregor
845
64.8 65.961.0 59.2
72.1
0
25
50
75
100
Q2/16 Q3/16 Q4/16 Q1/17 Q2/17
Kalmar Hiab MacGregor Cargotec total EBIT**
*) Excluding restructuring costs, **) Including Corporate admin and support
898854
933
October 2017Investor presentation
793
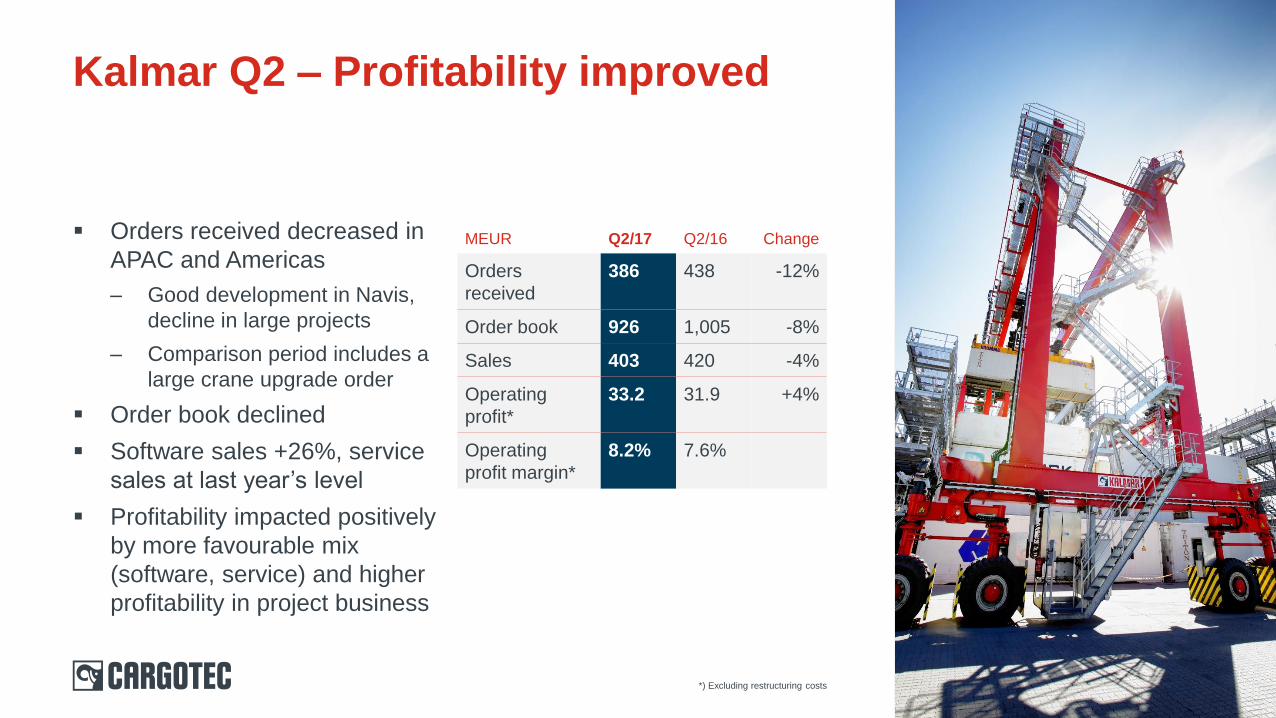
MEUR Q2/17 Q2/16 Change
Orders
received
386 438 -12%
Order book 926 1,005 -8%
Sales 403 420 -4%
Operating
profit*
33.2 31.9 +4%
Operating
profit margin*
8.2% 7.6%
Orders received decreased in
APAC and Americas
– Good development in Navis,
decline in large projects
– Comparison period includes a
large crane upgrade order
Order book declined
Software sales +26%, service
sales at last year’s level
Profitability impacted positively
by more favourable mix
(software, service) and higher
profitability in project business
Kalmar Q2 – Profitability improved
*) Excluding restructuring costs
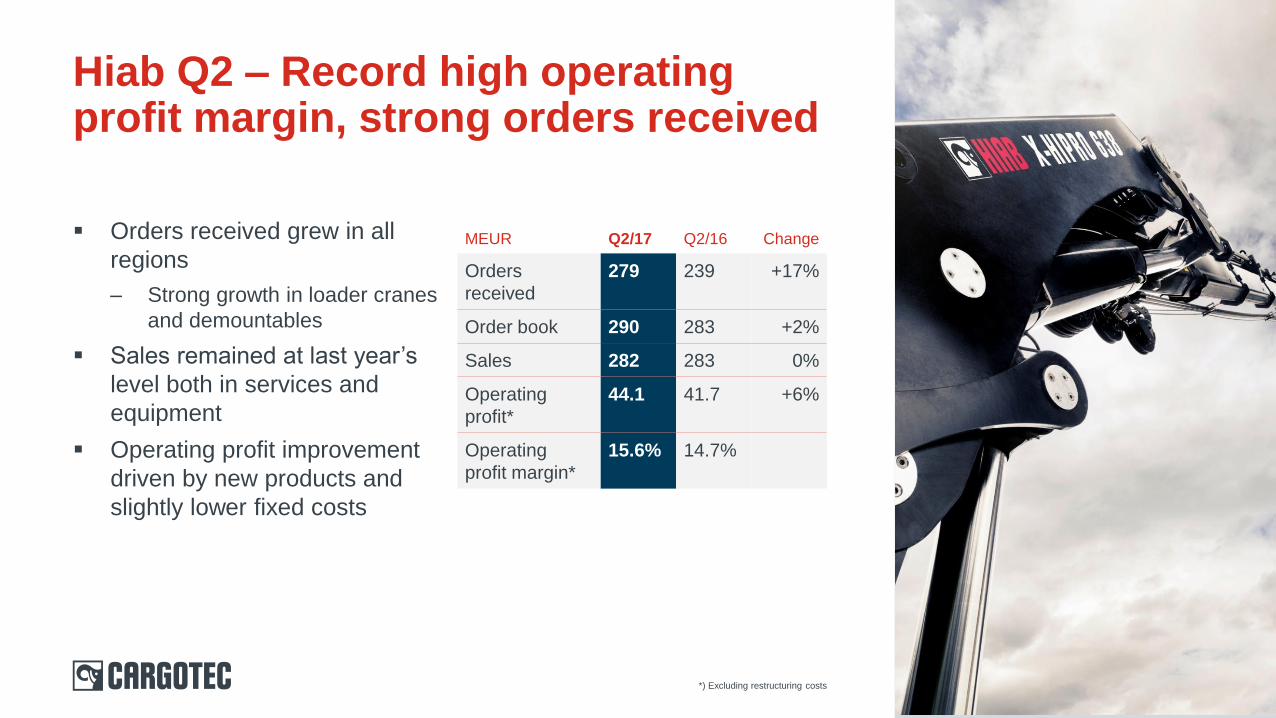
MEUR Q2/17 Q2/16 Change
Orders
received
279 239 +17%
Order book 290 283 +2%
Sales 282 283 0%
Operating
profit*
44.1 41.7 +6%
Operating
profit margin*
15.6% 14.7%
Orders received grew in all
regions
– Strong growth in loader cranes
and demountables
Sales remained at last year’s
level both in services and
equipment
Operating profit improvement
driven by new products and
slightly lower fixed costs
Hiab Q2 – Record high operating profit margin, strong orders received
*) Excluding restructuring costs
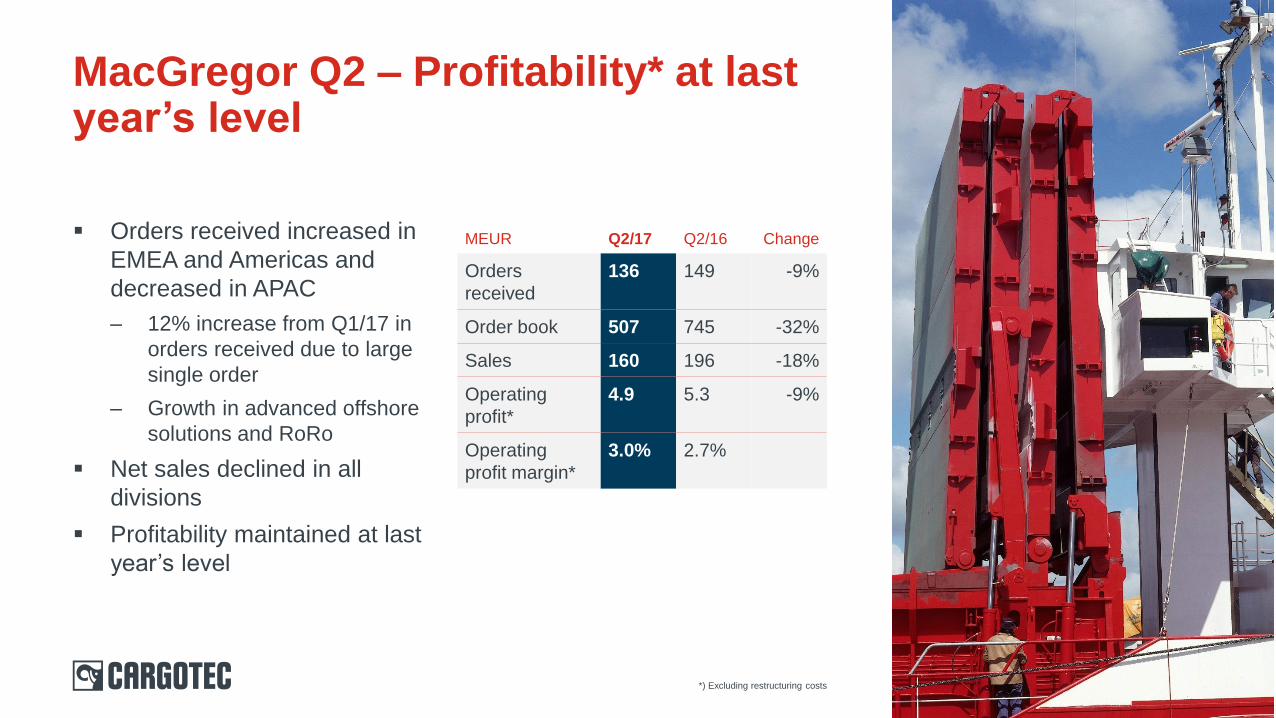
MEUR Q2/17 Q2/16 Change
Orders
received
136 149 -9%
Order book 507 745 -32%
Sales 160 196 -18%
Operating
profit*
4.9 5.3 -9%
Operating
profit margin*
3.0% 2.7%
Orders received increased in
EMEA and Americas and
decreased in APAC
– 12% increase from Q1/17 in
orders received due to large
single order
– Growth in advanced offshore
solutions and RoRo
Net sales declined in all
divisions
Profitability maintained at last
year’s level
MacGregor Q2 – Profitability* at last year’s level
*) Excluding restructuring costs
October 2017Investor presentation 52
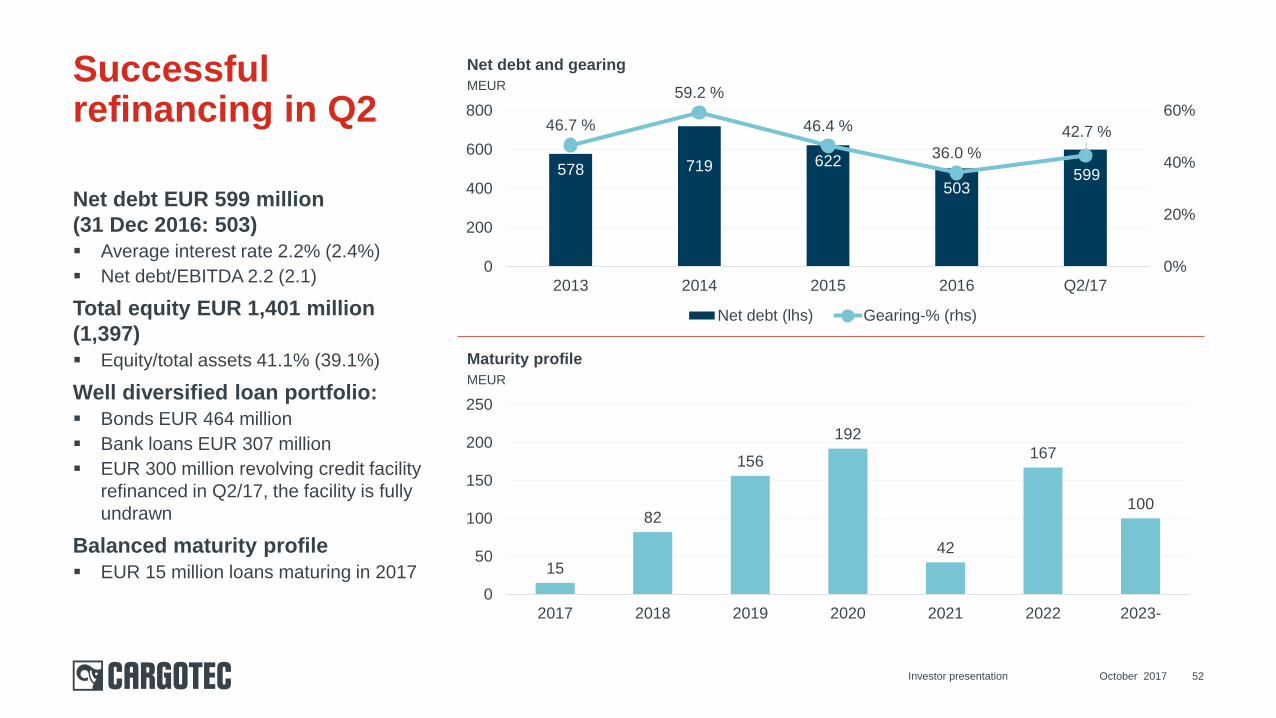
Net debt EUR 599 million
(31 Dec 2016: 503)
Average interest rate 2.2% (2.4%)
Net debt/EBITDA 2.2 (2.1)
Total equity EUR 1,401 million
(1,397)
Equity/total assets 41.1% (39.1%)
Well diversified loan portfolio:
Bonds EUR 464 million
Bank loans EUR 307 million
EUR 300 million revolving credit facility
refinanced in Q2/17, the facility is fully
undrawn
Balanced maturity profile
EUR 15 million loans maturing in 2017
Successful refinancing in Q2
15
82
156
192
42
167
100
0
50
100
150
200
250
2017 2018 2019 2020 2021 2022 2023-
578 719 622
503599
46.7 %
59.2 %
46.4 %
36.0 %
42.7 %
0%
20%
40%
60%
0
200
400
600
800
2013 2014 2015 2016 Q2/17
Net debt (lhs) Gearing-% (rhs)
Maturity profile
Net debt and gearing
MEUR
MEUR
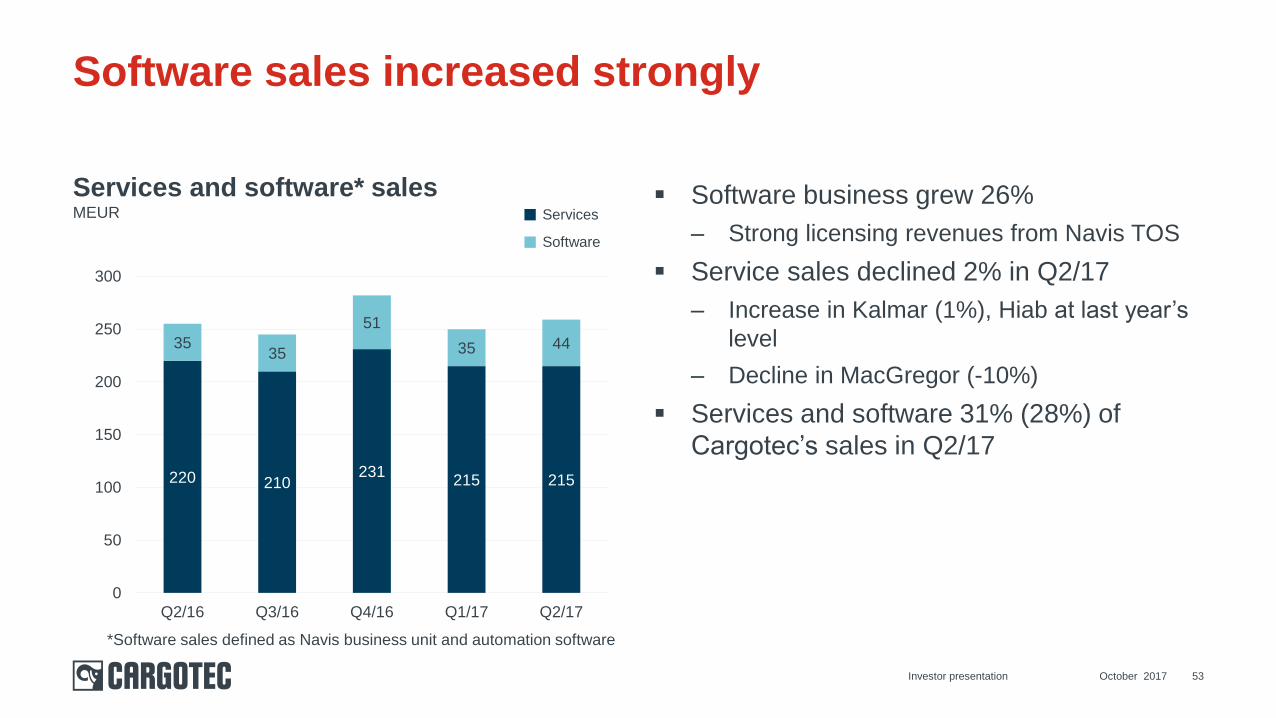
Services and software* salesMEUR
220 210231
215 215
3535
51
35 44
0
50
100
150
200
250
300
Q2/16 Q3/16 Q4/16 Q1/17 Q2/17
Software business grew 26%
– Strong licensing revenues from Navis TOS
Service sales declined 2% in Q2/17
– Increase in Kalmar (1%), Hiab at last year’s
level
– Decline in MacGregor (-10%)
Services and software 31% (28%) of
Cargotec’s sales in Q2/17
53
Software sales increased strongly
October 2017Investor presentation
*Software sales defined as Navis business unit and automation software
Services
Software
2017 outlook – as given 8 February 2017
Operating profit excluding restructuring costs for 2017
is expected to improve from 2016 (EUR 250.2 million)
October 2017Investor presentation 54
Appendix 1. Largest shareholders and financials
2. Sustainability
3. Kalmar
4. Hiab
5. MacGregor
October 2017Investor presentation 55
14.1 %
12.3 %
10.5 %
3.0 %
60.1 %
Wipunen varainhallinta Oy Mariatorp Oy
Pivosto Oy KONE Foundation
Others
October 2017Investor presentation 56
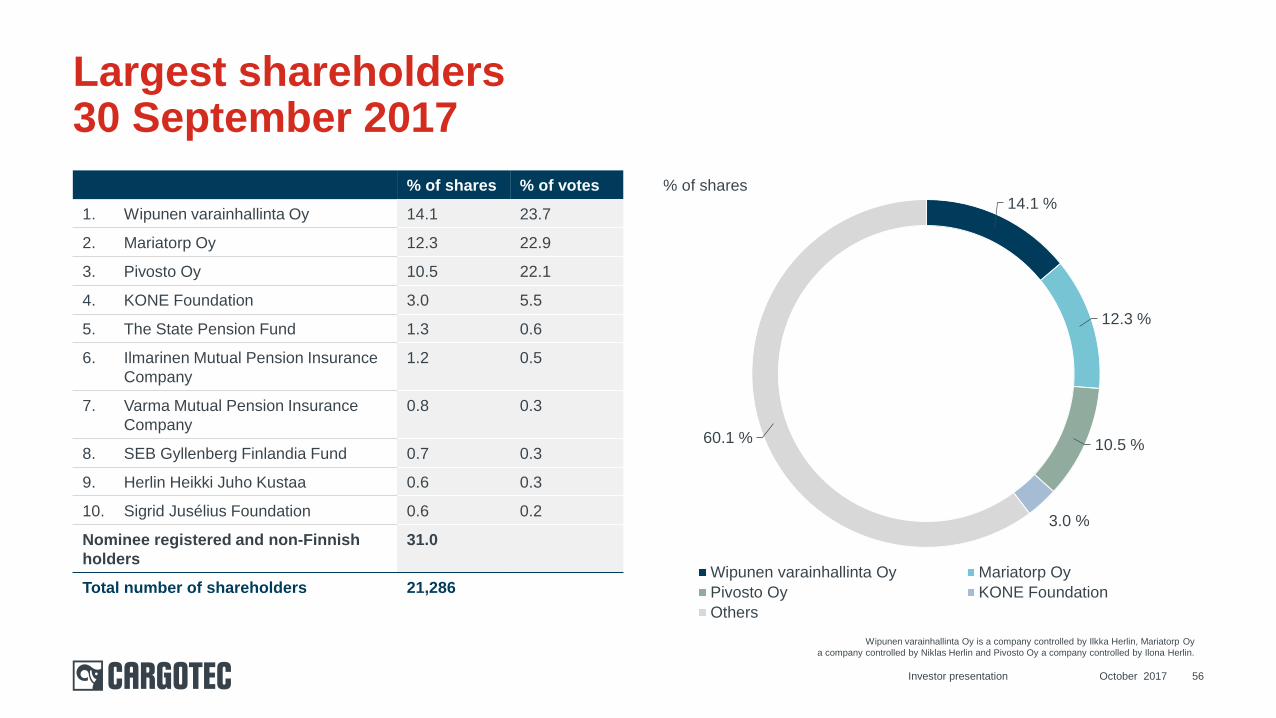
Largest shareholders30 September 2017
% of shares % of votes
1. Wipunen varainhallinta Oy 14.1 23.7
2. Mariatorp Oy 12.3 22.9
3. Pivosto Oy 10.5 22.1
4. KONE Foundation 3.0 5.5
5. The State Pension Fund 1.3 0.6
6. Ilmarinen Mutual Pension Insurance
Company
1.2 0.5
7. Varma Mutual Pension Insurance
Company
0.8 0.3
8. SEB Gyllenberg Finlandia Fund 0.7 0.3
9. Herlin Heikki Juho Kustaa 0.6 0.3
10. Sigrid Jusélius Foundation 0.6 0.2
Nominee registered and non-Finnish
holders
31.0
Total number of shareholders 21,286
Wipunen varainhallinta Oy is a company controlled by Ilkka Herlin, Mariatorp Oy
a company controlled by Niklas Herlin and Pivosto Oy a company controlled by Ilona Herlin.
% of shares
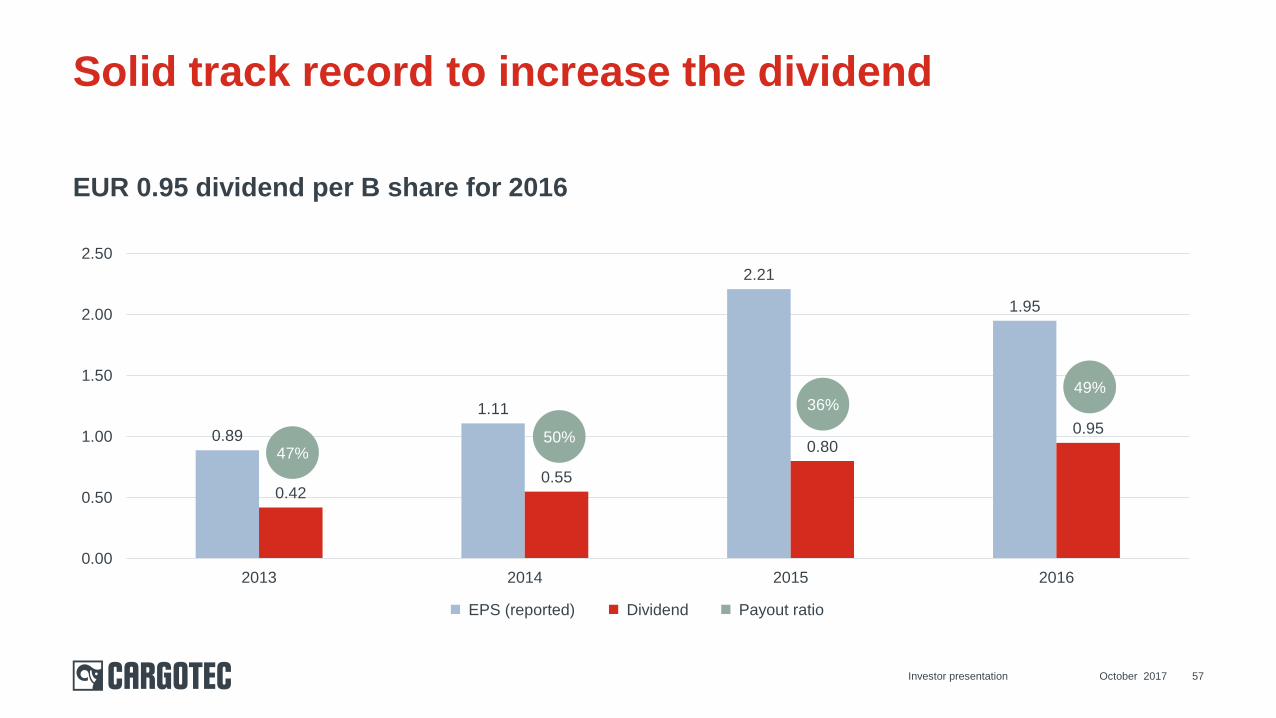
0.89
1.11
2.21
1.95
0.420.55
0.800.95
0.00
0.50
1.00
1.50
2.00
2.50
2013 2014 2015 2016
EUR 0.95 dividend per B share for 2016
October 2017Investor presentation 57
Solid track record to increase the dividend
Dividend EPS (reported) Payout ratio
50%
36%49%
47%
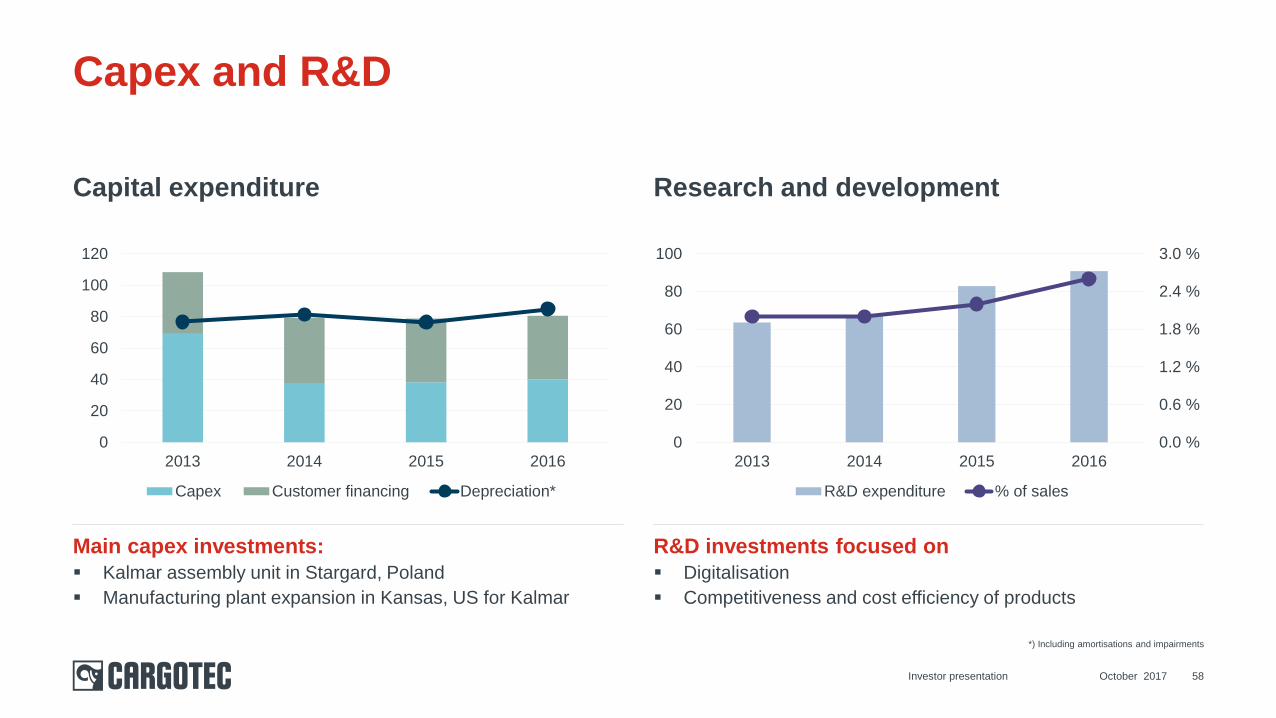
Capital expenditure
0
20
40
60
80
100
120
2013 2014 2015 2016
Capex Customer financing Depreciation*
Research and development
0.0 %
0.6 %
1.2 %
1.8 %
2.4 %
3.0 %
0
20
40
60
80
100
2013 2014 2015 2016
R&D expenditure % of sales
October 2017Investor presentation 58
Capex and R&D
*) Including amortisations and impairments
Main capex investments:
Kalmar assembly unit in Stargard, Poland
Manufacturing plant expansion in Kansas, US for Kalmar
R&D investments focused on
Digitalisation
Competitiveness and cost efficiency of products
59
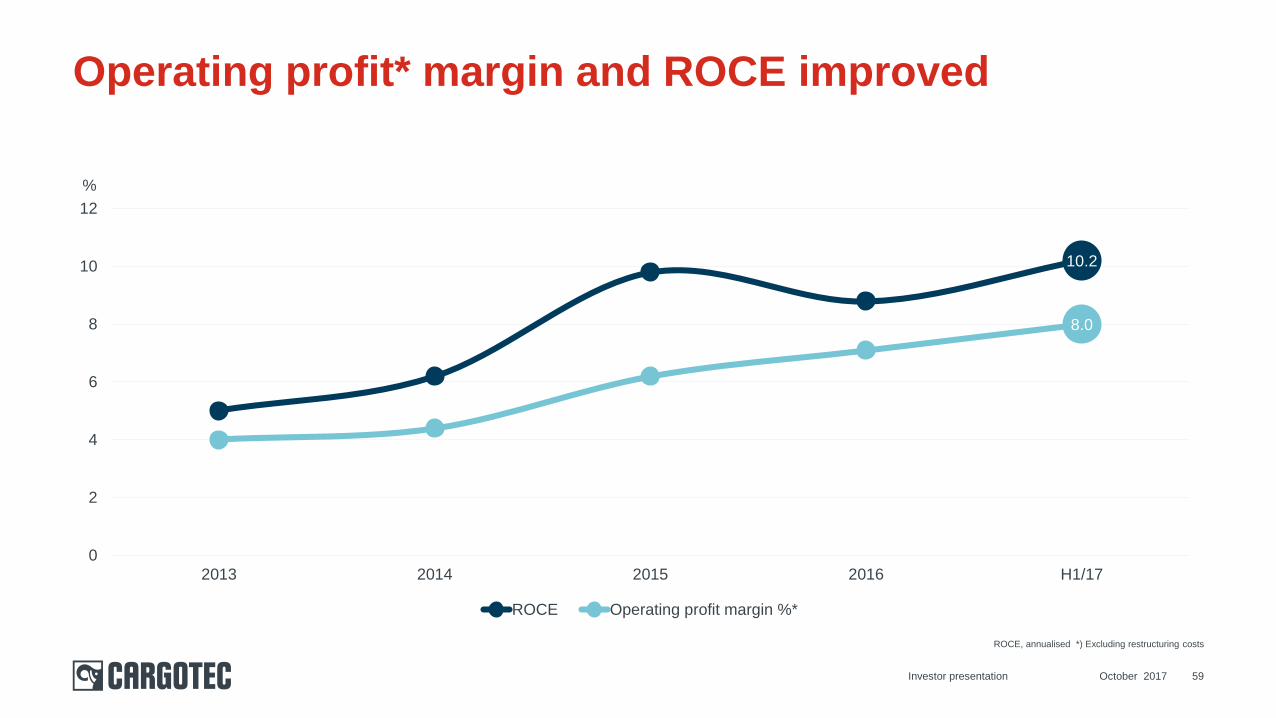
Operating profit* margin and ROCE improved
10.2
8.0
0
2
4
6
8
10
12
2013 2014 2015 2016 H1/17
ROCE Operating profit margin %*
October 2017Investor presentation
%
ROCE, annualised *) Excluding restructuring costs
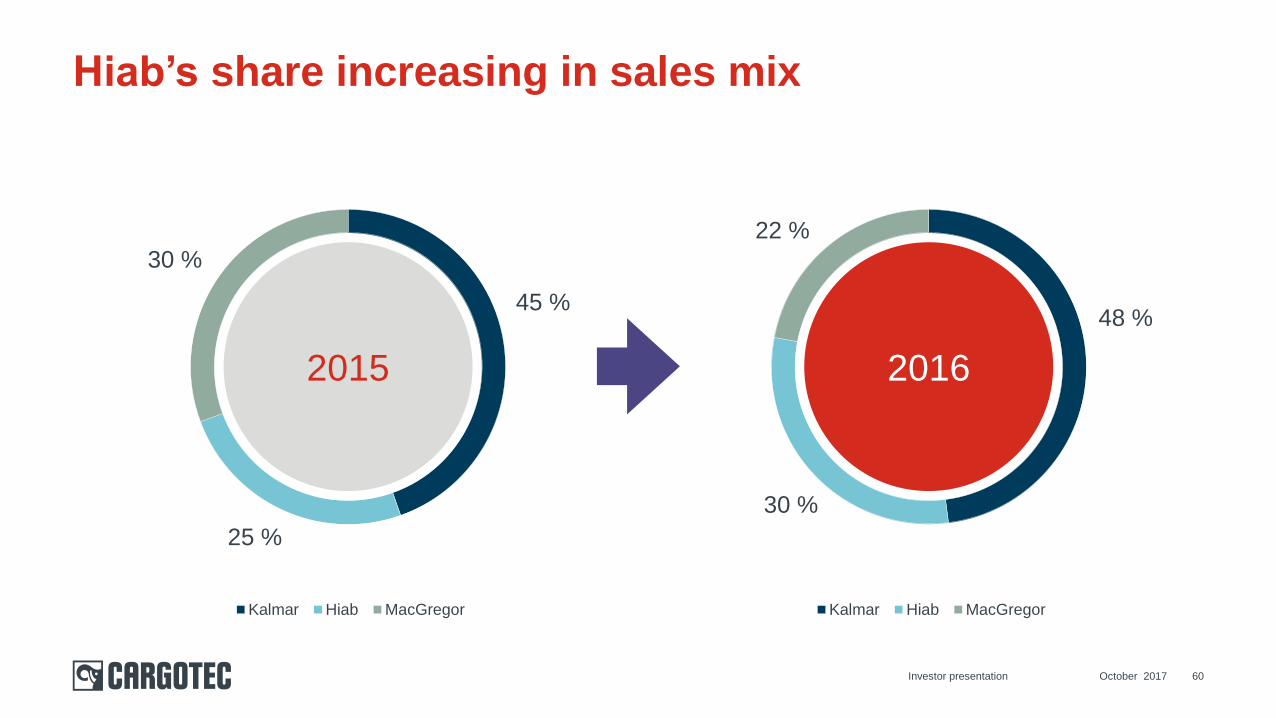
October 2017Investor presentation 60
Hiab’s share increasing in sales mix
(33)
45 %
25 %
30 %
Kalmar Hiab MacGregor
48 %
30 %
22 %
Kalmar Hiab MacGregor
2015 2016
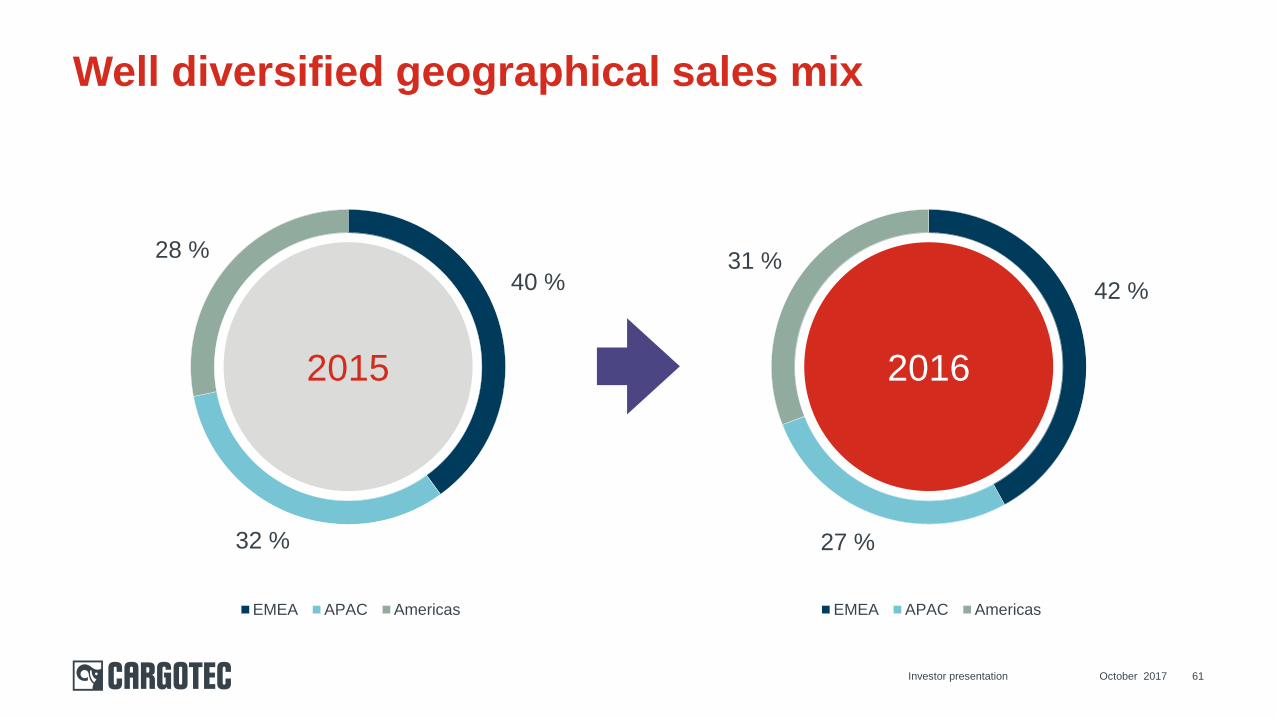
October 2017Investor presentation 61
Well diversified geographical sales mix
(33)
40 %
32 %
28 %
EMEA APAC Americas
42 %
27 %
31 %
EMEA APAC Americas
2015 2016
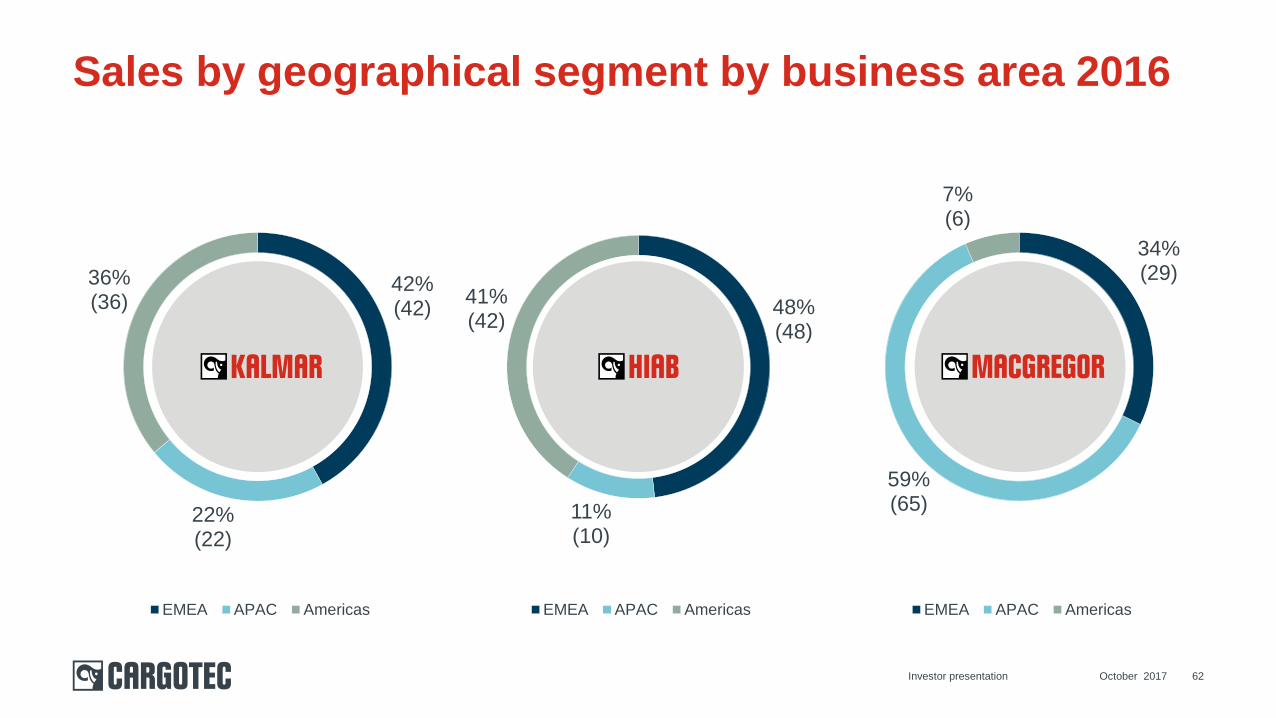
October 2017Investor presentation 62
Sales by geographical segment by business area 2016
42%(42)
22%(22)
36%(36)
EMEA APAC Americas
48%(48)
11%(10)
41%(42)
EMEA APAC Americas
34%(29)
59%(65)
7%(6)
EMEA APAC Americas
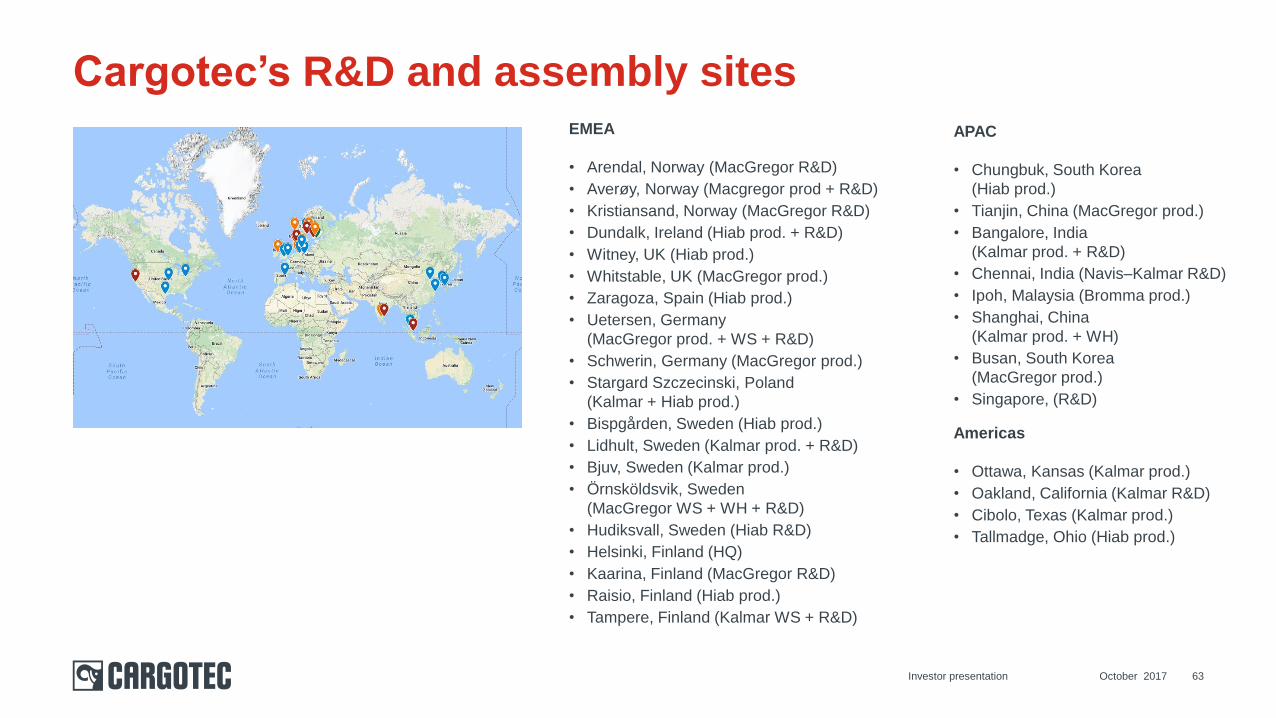
October 2017Investor presentation 63
Cargotec’s R&D and assembly sites
Americas
• Ottawa, Kansas (Kalmar prod.)
• Oakland, California (Kalmar R&D)
• Cibolo, Texas (Kalmar prod.)
• Tallmadge, Ohio (Hiab prod.)
EMEA
• Arendal, Norway (MacGregor R&D)
• Averøy, Norway (Macgregor prod + R&D)
• Kristiansand, Norway (MacGregor R&D)
• Dundalk, Ireland (Hiab prod. + R&D)
• Witney, UK (Hiab prod.)
• Whitstable, UK (MacGregor prod.)
• Zaragoza, Spain (Hiab prod.)
• Uetersen, Germany
(MacGregor prod. + WS + R&D)
• Schwerin, Germany (MacGregor prod.)
• Stargard Szczecinski, Poland
(Kalmar + Hiab prod.)
• Bispgården, Sweden (Hiab prod.)
• Lidhult, Sweden (Kalmar prod. + R&D)
• Bjuv, Sweden (Kalmar prod.)
• Örnsköldsvik, Sweden
(MacGregor WS + WH + R&D)
• Hudiksvall, Sweden (Hiab R&D)
• Helsinki, Finland (HQ)
• Kaarina, Finland (MacGregor R&D)
• Raisio, Finland (Hiab prod.)
• Tampere, Finland (Kalmar WS + R&D)
APAC
• Chungbuk, South Korea
(Hiab prod.)
• Tianjin, China (MacGregor prod.)
• Bangalore, India
(Kalmar prod. + R&D)
• Chennai, India (Navis–Kalmar R&D)
• Ipoh, Malaysia (Bromma prod.)
• Shanghai, China
(Kalmar prod. + WH)
• Busan, South Korea
(MacGregor prod.)
• Singapore, (R&D)
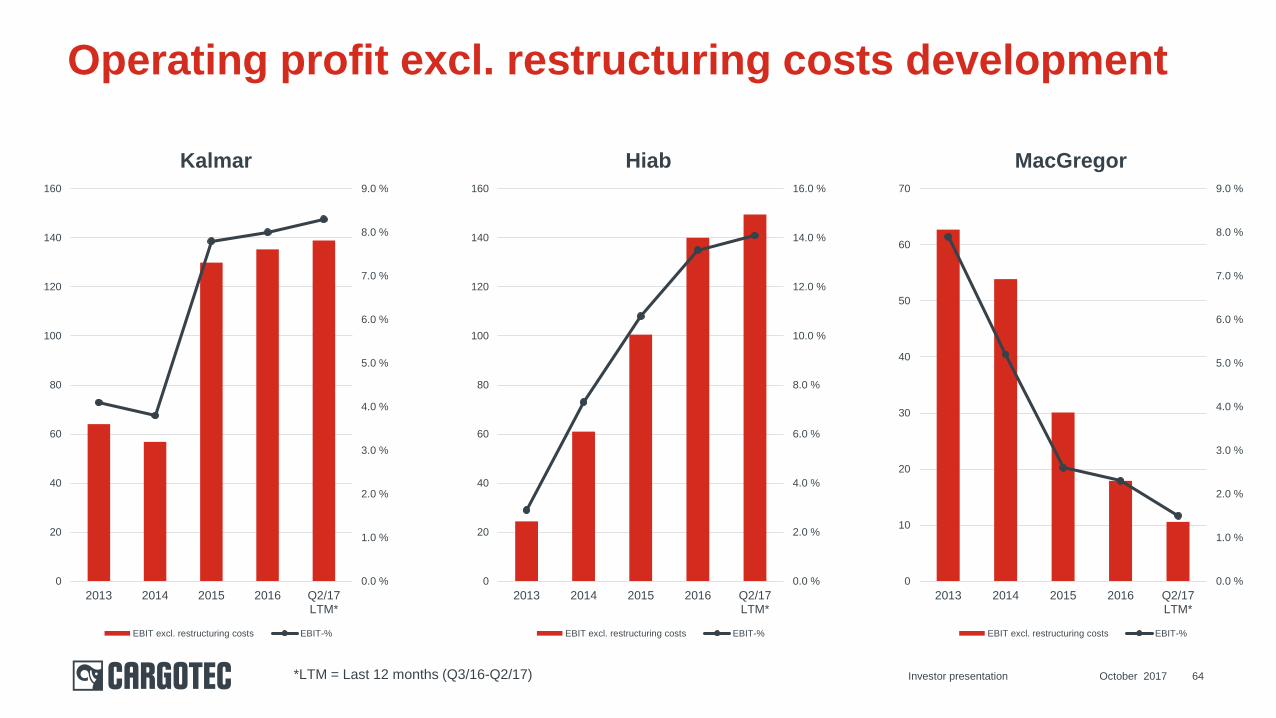
Operating profit excl. restructuring costs development
October 2017 64
0.0 %
1.0 %
2.0 %
3.0 %
4.0 %
5.0 %
6.0 %
7.0 %
8.0 %
9.0 %
0
20
40
60
80
100
120
140
160
2013 2014 2015 2016 Q2/17LTM*
Kalmar
EBIT excl. restructuring costs EBIT-%
0.0 %
2.0 %
4.0 %
6.0 %
8.0 %
10.0 %
12.0 %
14.0 %
16.0 %
0
20
40
60
80
100
120
140
160
2013 2014 2015 2016 Q2/17LTM*
Hiab
EBIT excl. restructuring costs EBIT-%
0.0 %
1.0 %
2.0 %
3.0 %
4.0 %
5.0 %
6.0 %
7.0 %
8.0 %
9.0 %
0
10
20
30
40
50
60
70
2013 2014 2015 2016 Q2/17LTM*
MacGregor
EBIT excl. restructuring costs EBIT-%
Investor presentation*LTM = Last 12 months (Q3/16-Q2/17)
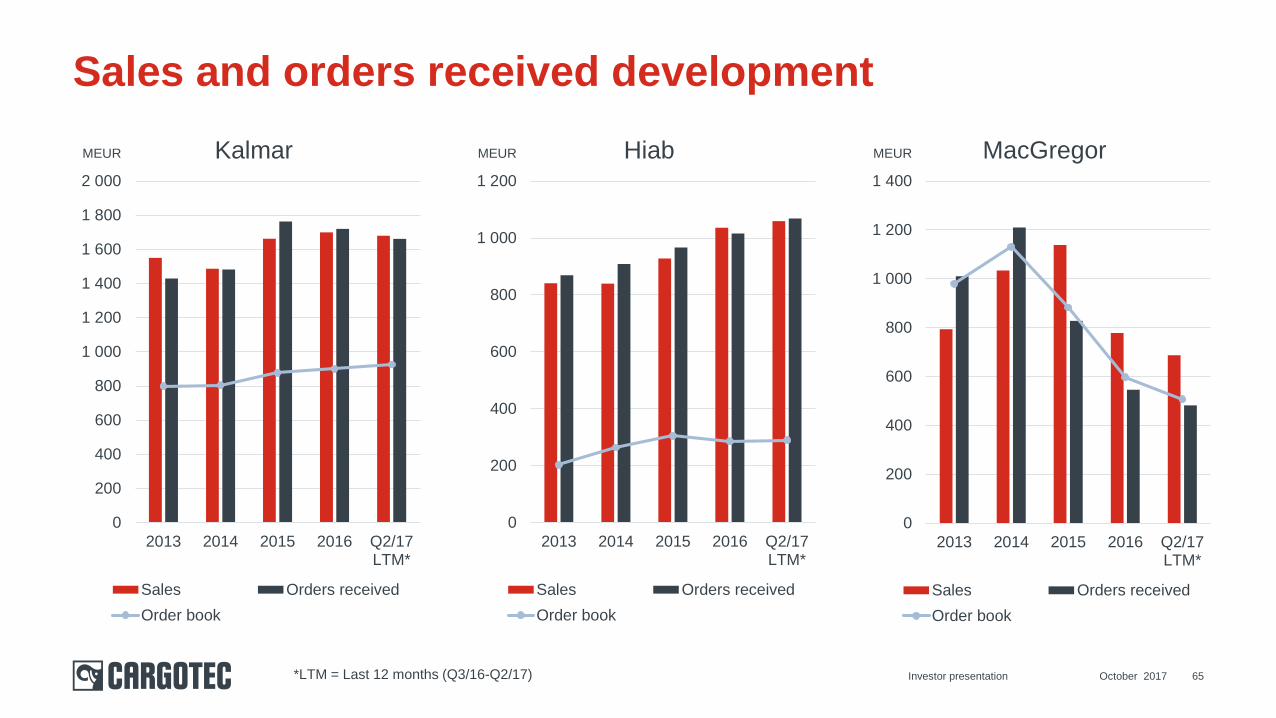
Sales and orders received development
October 2017 65Investor presentation
0
200
400
600
800
1 000
1 200
1 400
1 600
1 800
2 000
2013 2014 2015 2016 Q2/17LTM*
Kalmar
Sales Orders received
Order book
0
200
400
600
800
1 000
1 200
2013 2014 2015 2016 Q2/17LTM*
Hiab
Sales Orders received
Order book
0
200
400
600
800
1 000
1 200
1 400
2013 2014 2015 2016 Q2/17LTM*
MacGregor
Sales Orders received
Order book
MEUR MEUR MEUR
*LTM = Last 12 months (Q3/16-Q2/17)
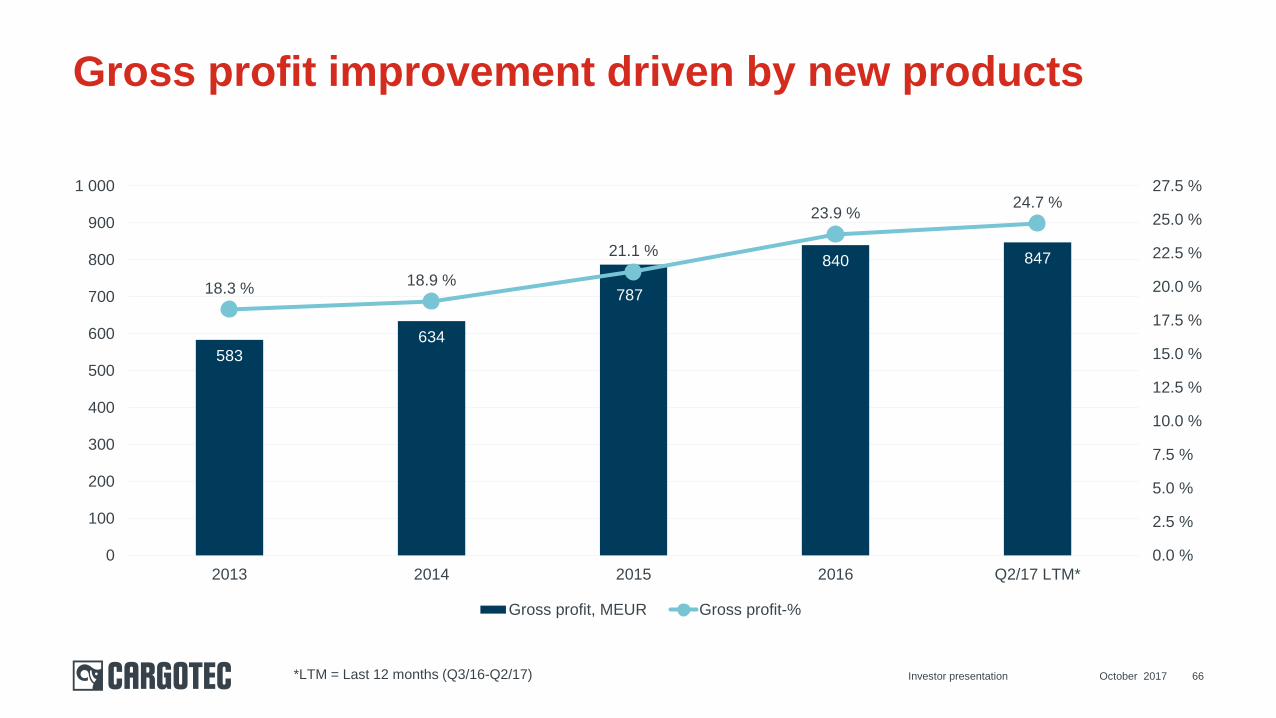
66
Gross profit improvement driven by new products
583
634
787
840 847
18.3 %18.9 %
21.1 %
23.9 %24.7 %
0.0 %
2.5 %
5.0 %
7.5 %
10.0 %
12.5 %
15.0 %
17.5 %
20.0 %
22.5 %
25.0 %
27.5 %
0
100
200
300
400
500
600
700
800
900
1 000
2013 2014 2015 2016 Q2/17 LTM*
Gross profit, MEUR Gross profit-%
October 2017Investor presentation*LTM = Last 12 months (Q3/16-Q2/17)
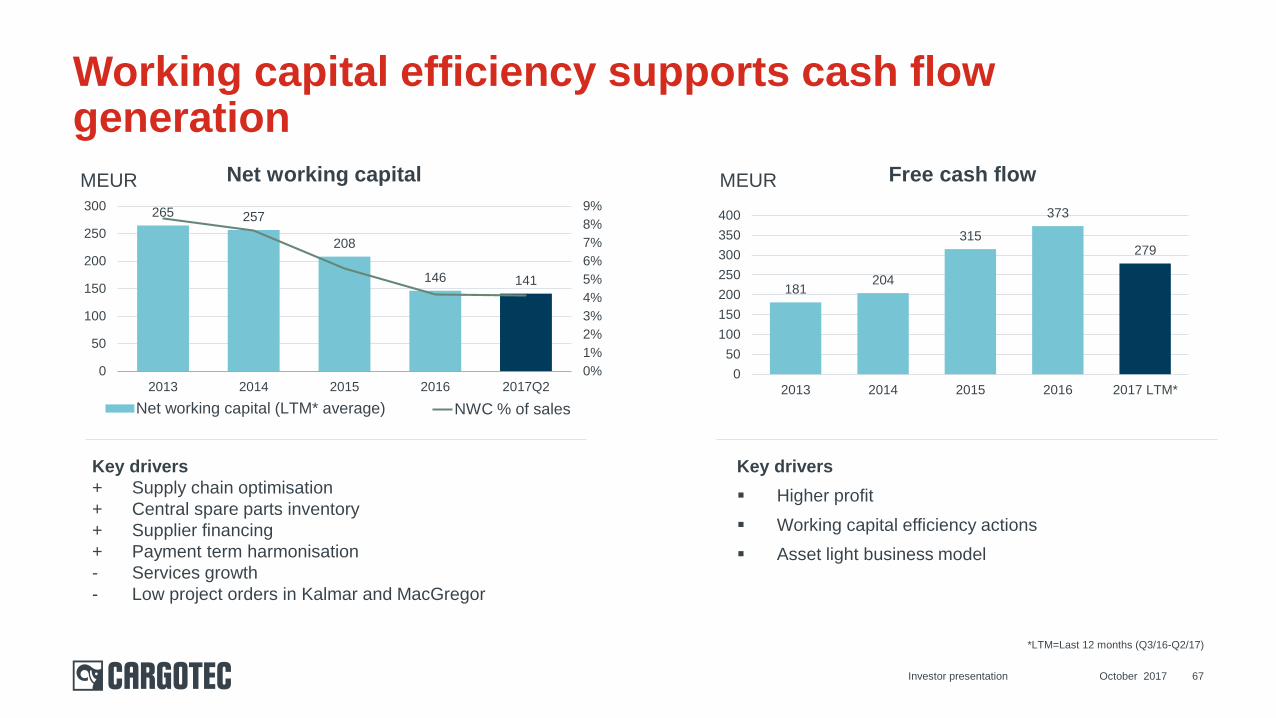
October 2017Investor presentation 67
Working capital efficiency supports cash flow generation
181204
315
373
279
0
50
100
150
200
250
300
350
400
2013 2014 2015 2016 2017 LTM*
MEUR
265 257
208
146 141
0%
1%
2%
3%
4%
5%
6%
7%
8%
9%
0
50
100
150
200
250
300
2013 2014 2015 2016 2017Q2
Net Working Capital (r12m) NWC % of Sales
Key drivers
+ Supply chain optimisation
+ Central spare parts inventory
+ Supplier financing
+ Payment term harmonisation
- Services growth
- Low project orders in Kalmar and MacGregor
Free cash flow
Key drivers
Higher profit
Working capital efficiency actions
Asset light business model
Net working capitalMEUR
Net working capital (LTM* average) NWC % of sales
*LTM=Last 12 months (Q3/16-Q2/17)
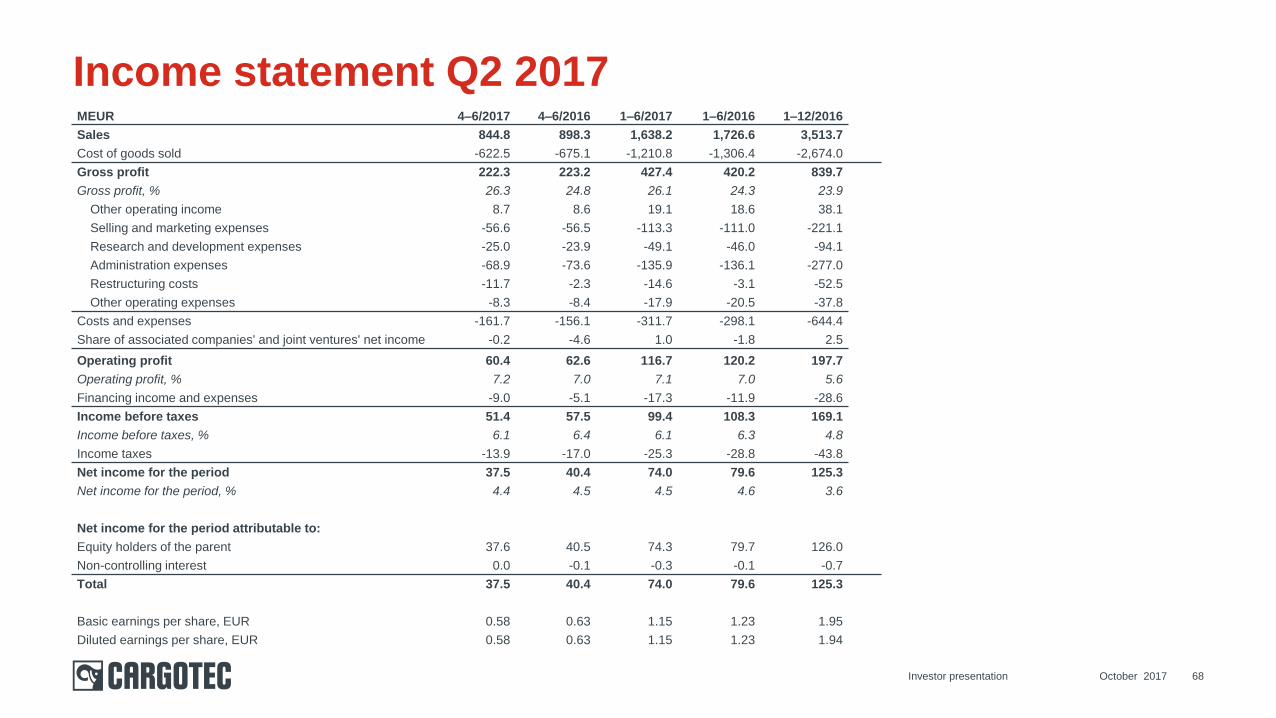
Income statement Q2 2017
Investor presentation 68October 2017
MEUR 4–6/2017 4–6/2016 1–6/2017 1–6/2016 1–12/2016
Sales 844.8 898.3 1,638.2 1,726.6 3,513.7
Cost of goods sold -622.5 -675.1 -1,210.8 -1,306.4 -2,674.0
Gross profit 222.3 223.2 427.4 420.2 839.7
Gross profit, % 26.3 24.8 26.1 24.3 23.9
Other operating income 8.7 8.6 19.1 18.6 38.1
Selling and marketing expenses -56.6 -56.5 -113.3 -111.0 -221.1
Research and development expenses -25.0 -23.9 -49.1 -46.0 -94.1
Administration expenses -68.9 -73.6 -135.9 -136.1 -277.0
Restructuring costs -11.7 -2.3 -14.6 -3.1 -52.5
Other operating expenses -8.3 -8.4 -17.9 -20.5 -37.8
Costs and expenses -161.7 -156.1 -311.7 -298.1 -644.4
Share of associated companies' and joint ventures' net income -0.2 -4.6 1.0 -1.8 2.5
Operating profit 60.4 62.6 116.7 120.2 197.7
Operating profit, % 7.2 7.0 7.1 7.0 5.6
Financing income and expenses -9.0 -5.1 -17.3 -11.9 -28.6
Income before taxes 51.4 57.5 99.4 108.3 169.1
Income before taxes, % 6.1 6.4 6.1 6.3 4.8
Income taxes -13.9 -17.0 -25.3 -28.8 -43.8
Net income for the period 37.5 40.4 74.0 79.6 125.3
Net income for the period, % 4.4 4.5 4.5 4.6 3.6
Net income for the period attributable to:
Equity holders of the parent 37.6 40.5 74.3 79.7 126.0
Non-controlling interest 0.0 -0.1 -0.3 -0.1 -0.7
Total 37.5 40.4 74.0 79.6 125.3
Basic earnings per share, EUR 0.58 0.63 1.15 1.23 1.95
Diluted earnings per share, EUR 0.58 0.63 1.15 1.23 1.94
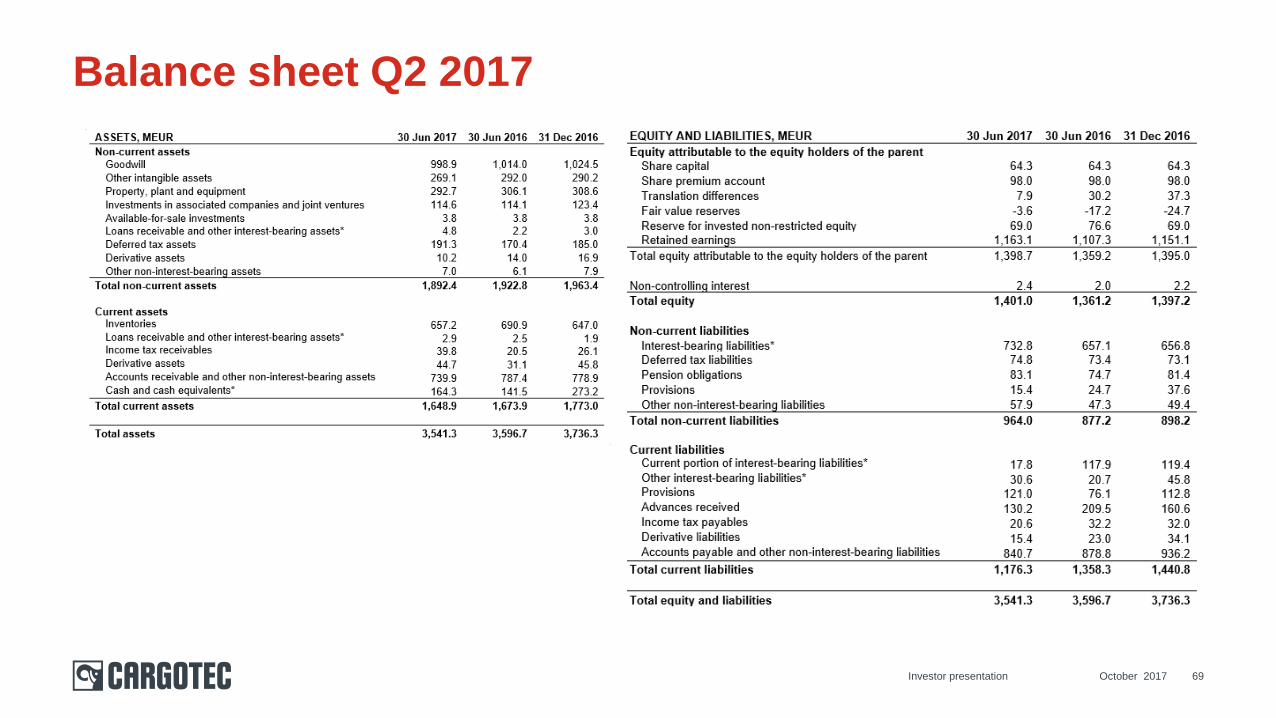
Balance sheet Q2 2017
Investor presentation 69October 2017
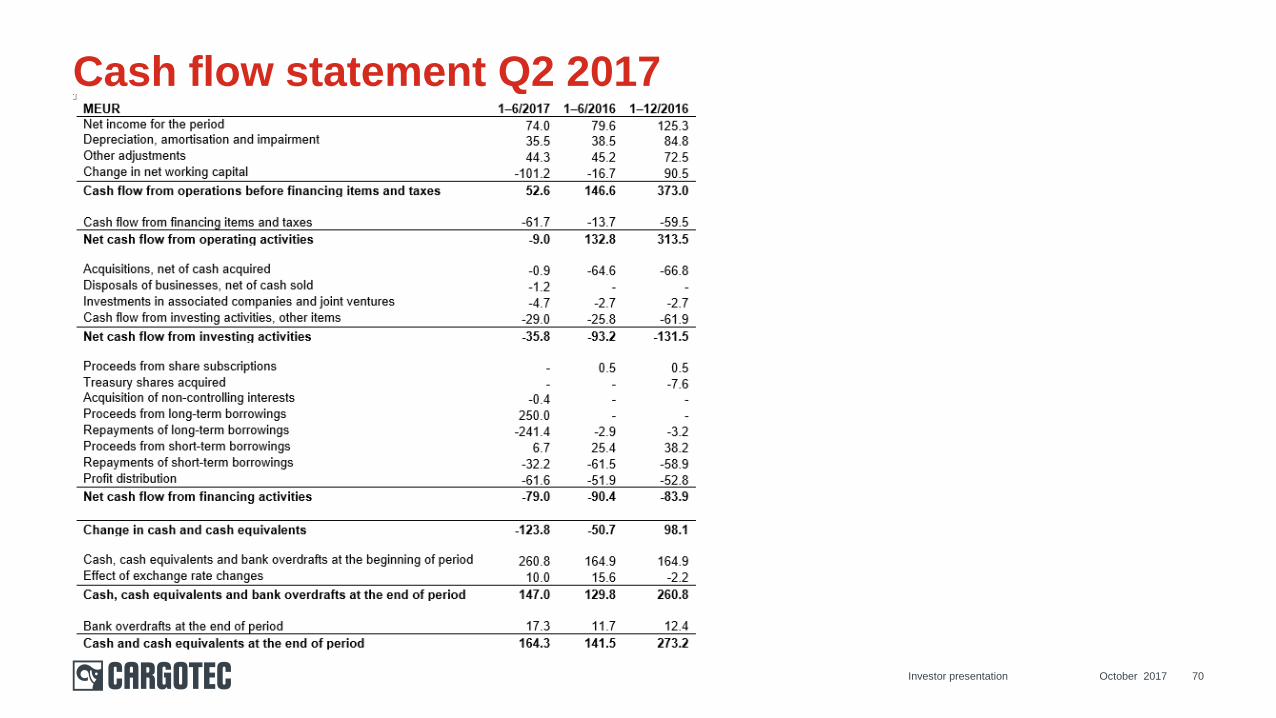
Cash flow statement Q2 2017
Investor presentation 70October 2017
Sustainability
October 2017Investor presentation 71
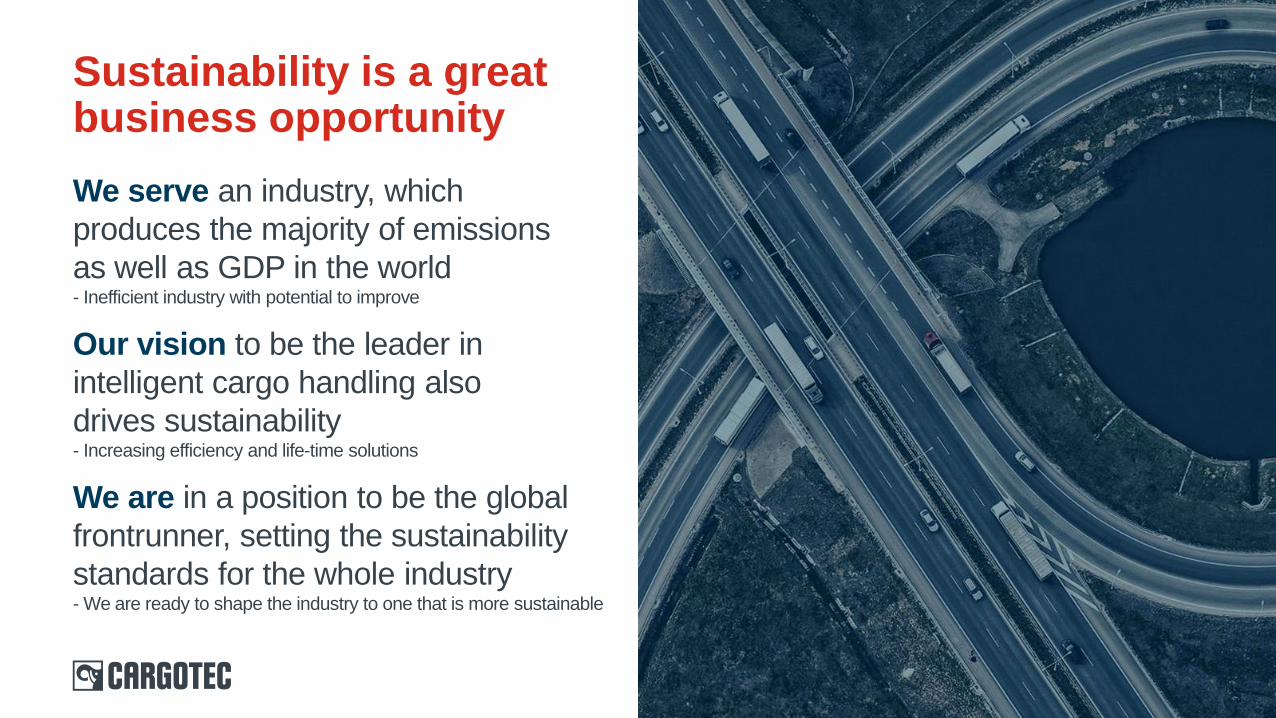
We serve an industry, which
produces the majority of emissions
as well as GDP in the world- Inefficient industry with potential to improve
Our vision to be the leader in
intelligent cargo handling also
drives sustainability- Increasing efficiency and life-time solutions
We are in a position to be the global
frontrunner, setting the sustainability
standards for the whole industry- We are ready to shape the industry to one that is more sustainable
Sustainability is a great business opportunity
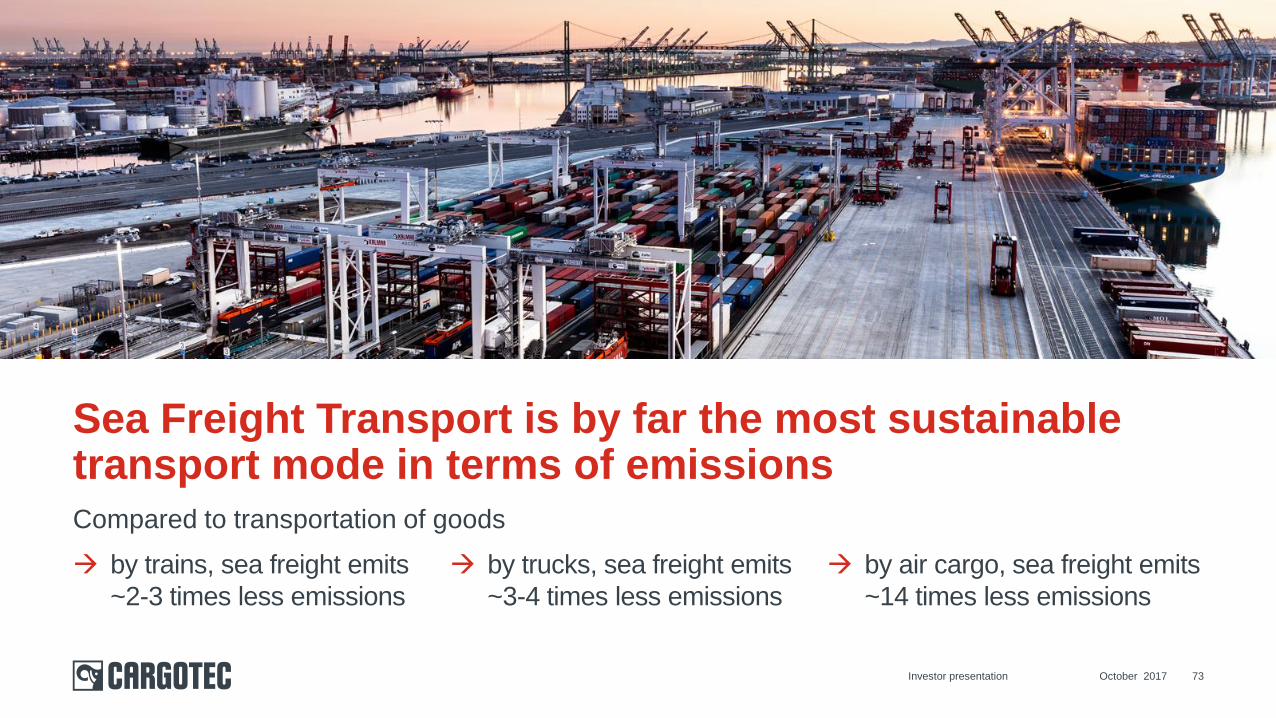
Sea Freight Transport is by far the most sustainable transport mode in terms of emissions
by trains, sea freight emits
~2-3 times less emissions
October 2017Investor presentation 73
by trucks, sea freight emits
~3-4 times less emissions
by air cargo, sea freight emits
~14 times less emissions
Compared to transportation of goods
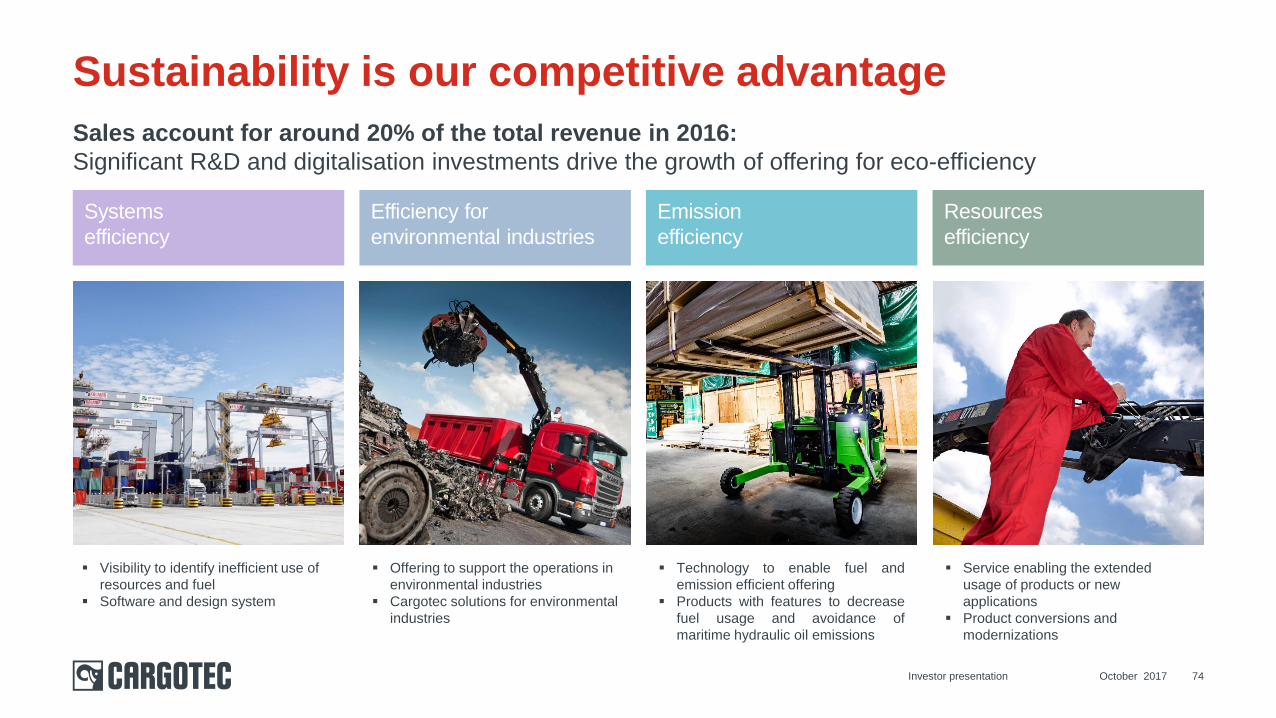
Sales account for around 20% of the total revenue in 2016:
Significant R&D and digitalisation investments drive the growth of offering for eco-efficiency
October 2017Investor presentation 74
Sustainability is our competitive advantage
Systems
efficiency
Efficiency for
environmental industries
Emission
efficiency
Resources
efficiency
Visibility to identify inefficient use of
resources and fuel
Software and design system
Offering to support the operations in
environmental industries
Cargotec solutions for environmental
industries
Technology to enable fuel and
emission efficient offering
Products with features to decrease
fuel usage and avoidance of
maritime hydraulic oil emissions
Service enabling the extended
usage of products or new
applications
Product conversions and
modernizations
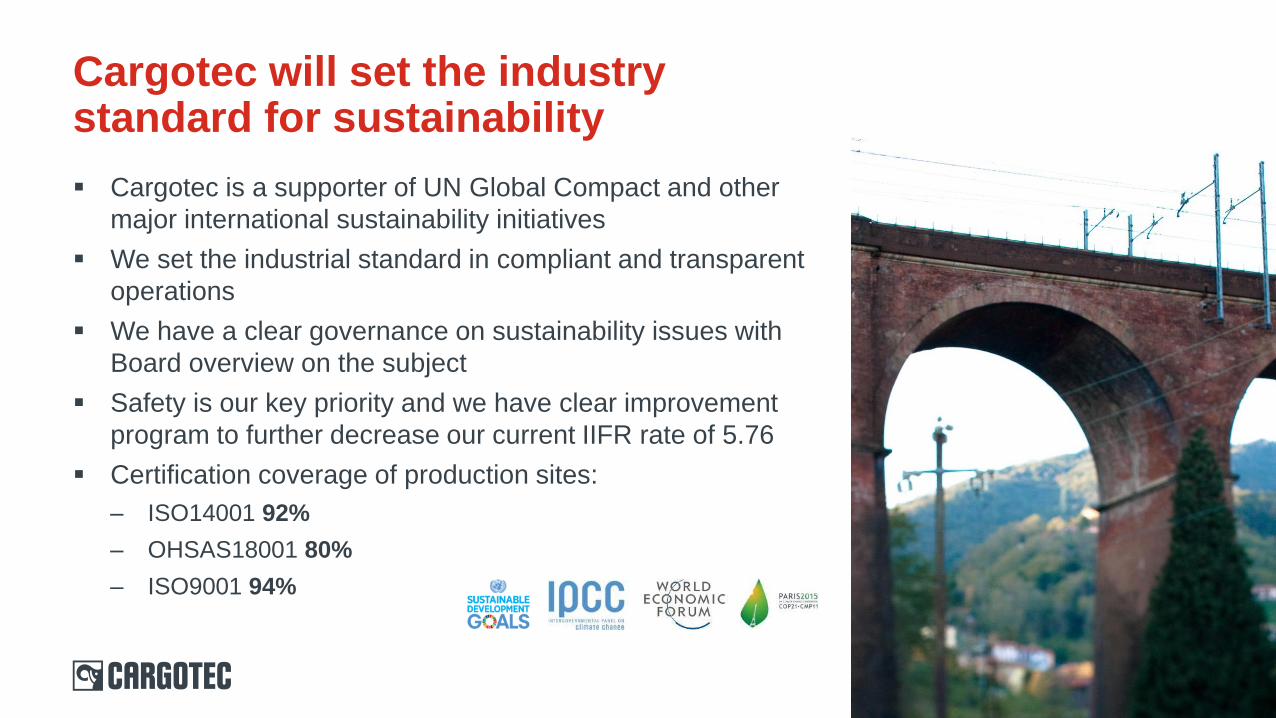
Cargotec is a supporter of UN Global Compact and other
major international sustainability initiatives
We set the industrial standard in compliant and transparent
operations
We have a clear governance on sustainability issues with
Board overview on the subject
Safety is our key priority and we have clear improvement
program to further decrease our current IIFR rate of 5.76
Certification coverage of production sites:
– ISO14001 92%
– OHSAS18001 80%
– ISO9001 94%
Cargotec will set the industry standard for sustainability
Kalmar appendix
October 2017Investor presentation 76
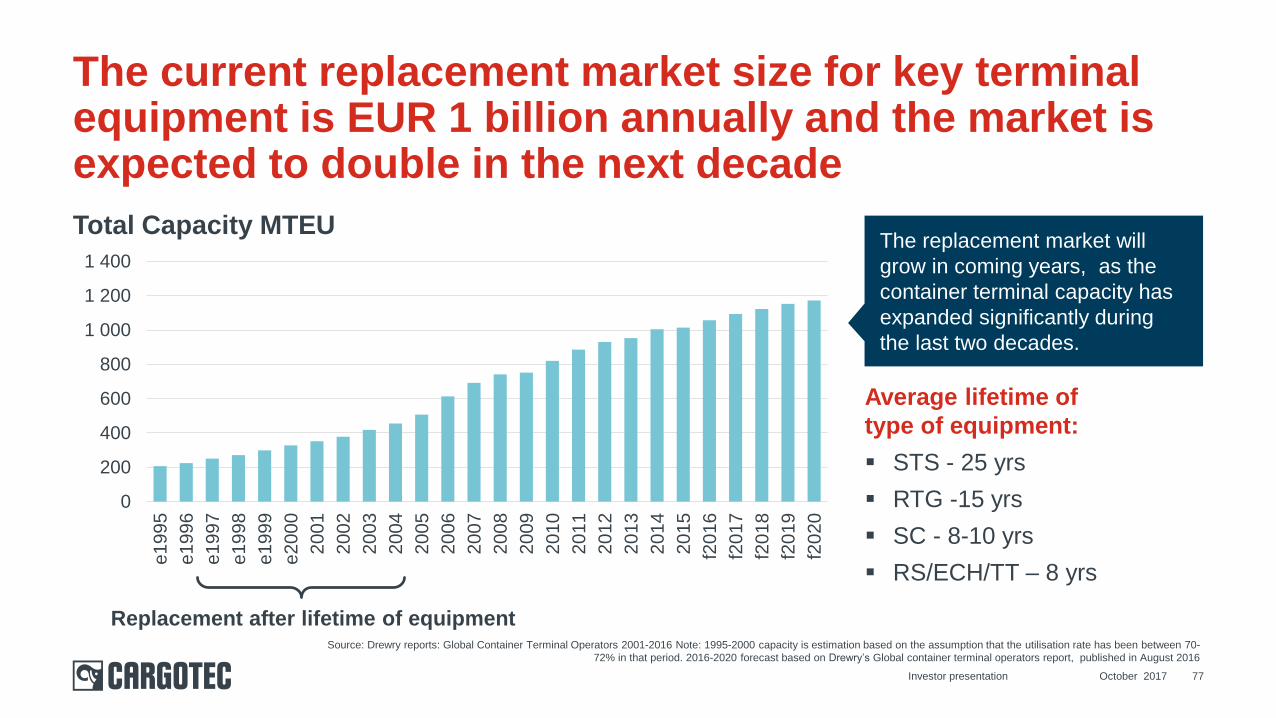
Total Capacity MTEU
The current replacement market size for key terminal equipment is EUR 1 billion annually and the market is expected to double in the next decade
0
200
400
600
800
1 000
1 200
1 400
e1995
e1996
e1997
e1998
e1999
e2000
2001
2002
2003
2004
2005
2006
2007
2008
2009
2010
2011
2012
2013
2014
2015
f20
16
f20
17
f20
18
f20
19
f20
20
Replacement after lifetime of equipment
The replacement market will
grow in coming years, as the
container terminal capacity has
expanded significantly during
the last two decades.
Average lifetime of
type of equipment:
STS - 25 yrs
RTG -15 yrs
SC - 8-10 yrs
RS/ECH/TT – 8 yrs
Source: Drewry reports: Global Container Terminal Operators 2001-2016 Note: 1995-2000 capacity is estimation based on the assumption that the utilisation rate has been between 70-
72% in that period. 2016-2020 forecast based on Drewry’s Global container terminal operators report, published in August 2016
October 2017Investor presentation 77
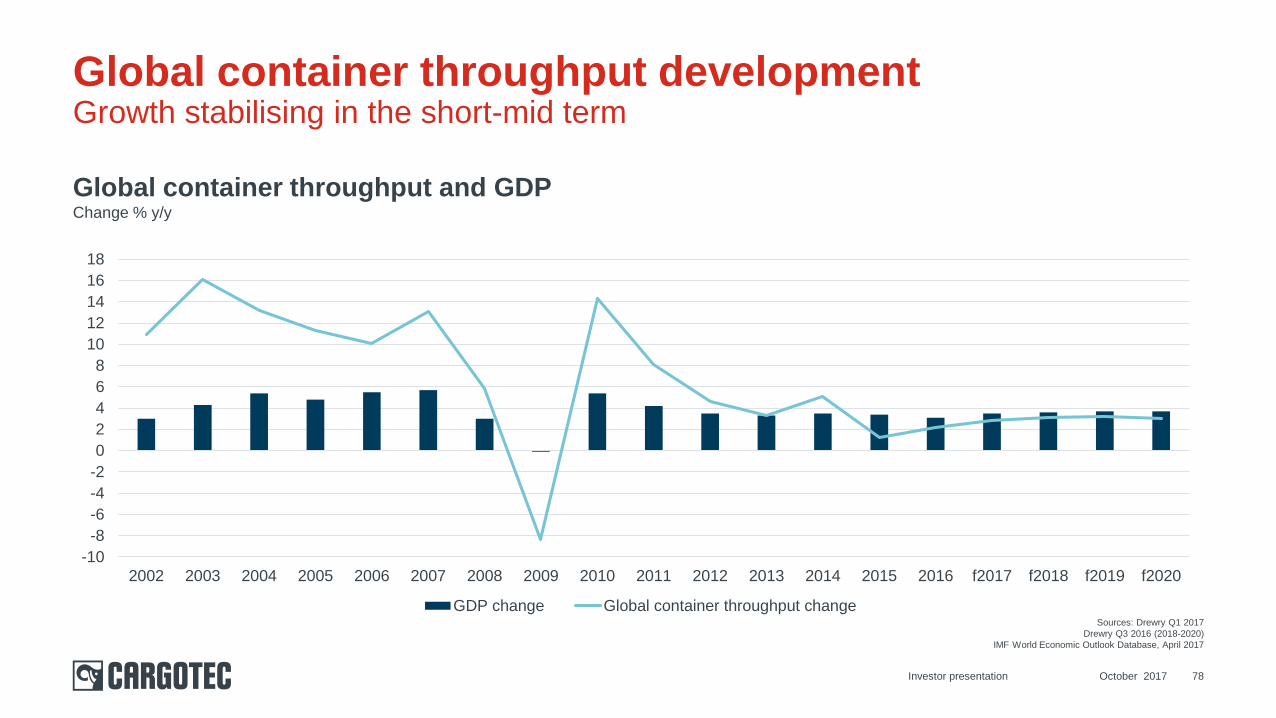
Global container throughput and GDPChange % y/y
October 2017 78
Global container throughput developmentGrowth stabilising in the short-mid term
Sources: Drewry Q1 2017
Drewry Q3 2016 (2018-2020)
IMF World Economic Outlook Database, April 2017
Investor presentation
-10
-8
-6
-4
-2
0
2
4
6
8
10
12
14
16
18
2002 2003 2004 2005 2006 2007 2008 2009 2010 2011 2012 2013 2014 2015 2016 f2017 f2018 f2019 f2020
GDP change Global container throughput change
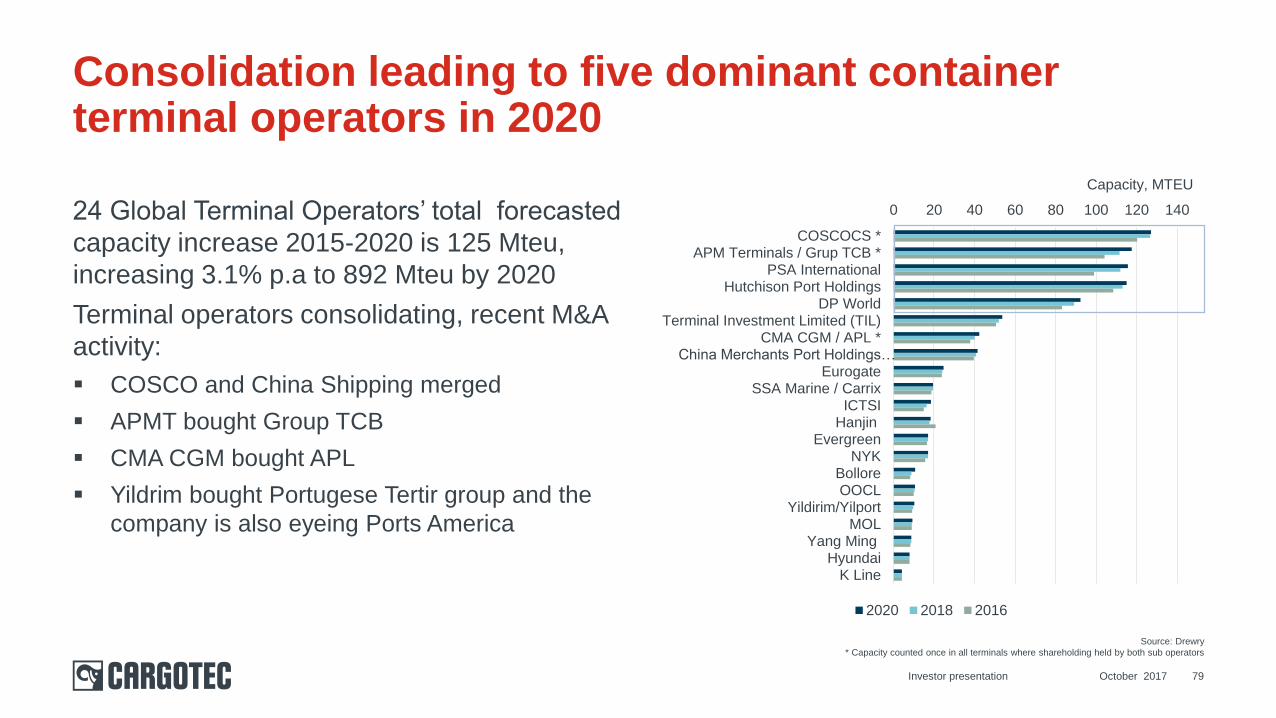
24 Global Terminal Operators’ total forecasted
capacity increase 2015-2020 is 125 Mteu,
increasing 3.1% p.a to 892 Mteu by 2020
Terminal operators consolidating, recent M&A
activity:
COSCO and China Shipping merged
APMT bought Group TCB
CMA CGM bought APL
Yildrim bought Portugese Tertir group and the
company is also eyeing Ports America
October 2017 79
Consolidation leading to five dominant container terminal operators in 2020
Capacity, MTEU
Source: Drewry
* Capacity counted once in all terminals where shareholding held by both sub operators
0 20 40 60 80 100 120 140
COSCOCS *APM Terminals / Grup TCB *
PSA InternationalHutchison Port Holdings
DP WorldTerminal Investment Limited (TIL)
CMA CGM / APL *China Merchants Port Holdings…
EurogateSSA Marine / Carrix
ICTSIHanjin
EvergreenNYK
BolloreOOCL
Yildirim/YilportMOL
Yang MingHyundai
K Line
2020 2018 2016
Investor presentation
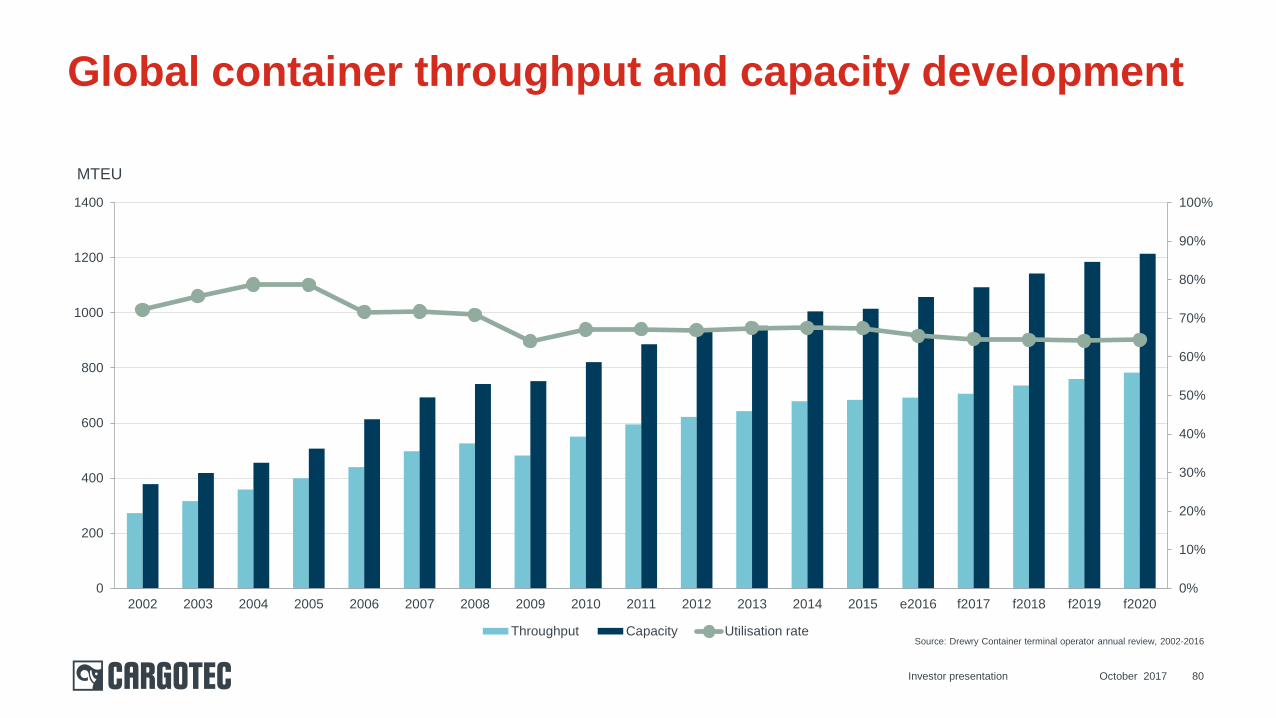
Global container throughput and capacity development
October 2017 80
0%
10%
20%
30%
40%
50%
60%
70%
80%
90%
100%
0
200
400
600
800
1000
1200
1400
2002 2003 2004 2005 2006 2007 2008 2009 2010 2011 2012 2013 2014 2015 e2016 f2017 f2018 f2019 f2020
Throughput Capacity Utilisation rate
MTEU
Source: Drewry Container terminal operator annual review, 2002-2016
Investor presentation
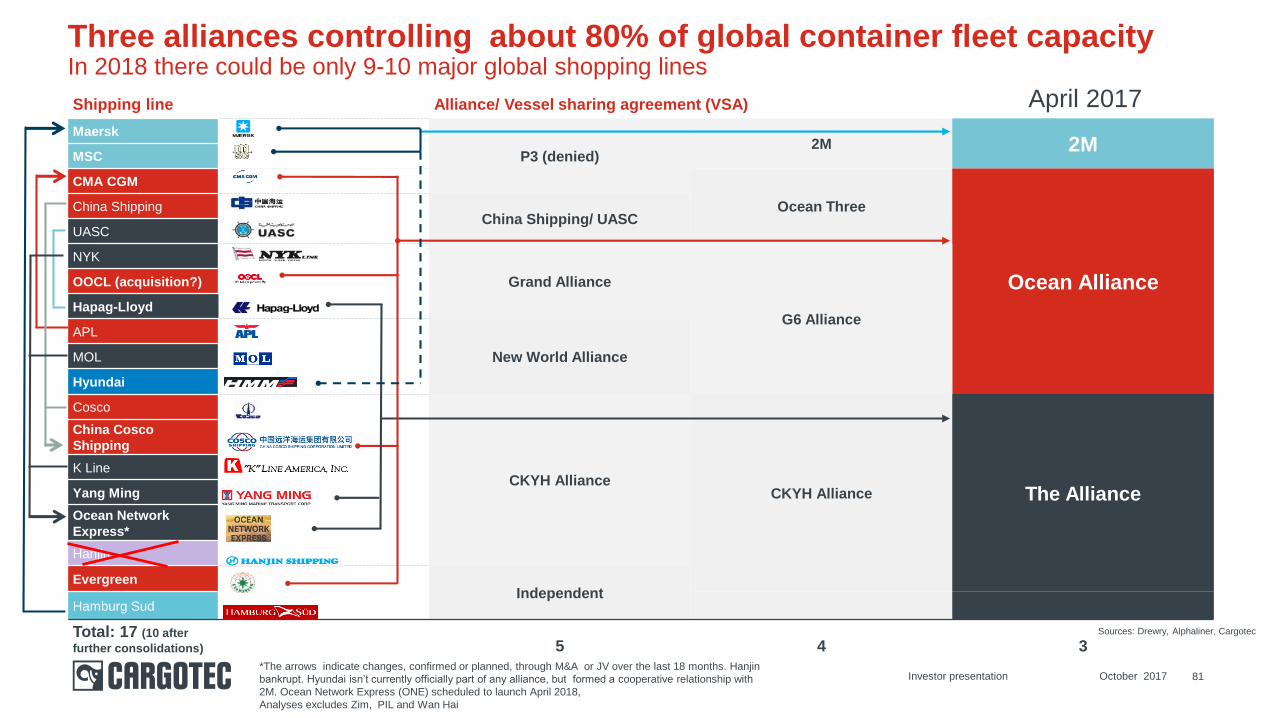
Three alliances controlling about 80% of global container fleet capacityIn 2018 there could be only 9-10 major global shopping lines
Shipping line Alliance/ Vessel sharing agreement (VSA)
Maersk
P3 (denied)2M 2M
MSC
CMA CGM
Ocean Three
Ocean Alliance
China ShippingChina Shipping/ UASC
UASC
NYK
Grand Alliance
G6 Alliance
OOCL (acquisition?)
Hapag-Lloyd
APL
New World AllianceMOL
Hyundai
Cosco
CKYH AllianceCKYH Alliance The Alliance
China Cosco
Shipping
K Line
Yang Ming
Ocean Network
Express*
Hanjin
EvergreenIndependent
Hamburg Sud
Total: 17 (10 after
further consolidations) 5 4 3
April 2017
*The arrows indicate changes, confirmed or planned, through M&A or JV over the last 18 months. Hanjin
bankrupt. Hyundai isn’t currently officially part of any alliance, but formed a cooperative relationship with
2M. Ocean Network Express (ONE) scheduled to launch April 2018,
Analyses excludes Zim, PIL and Wan Hai
81
Sources: Drewry, Alphaliner, Cargotec
Investor presentation October 2017
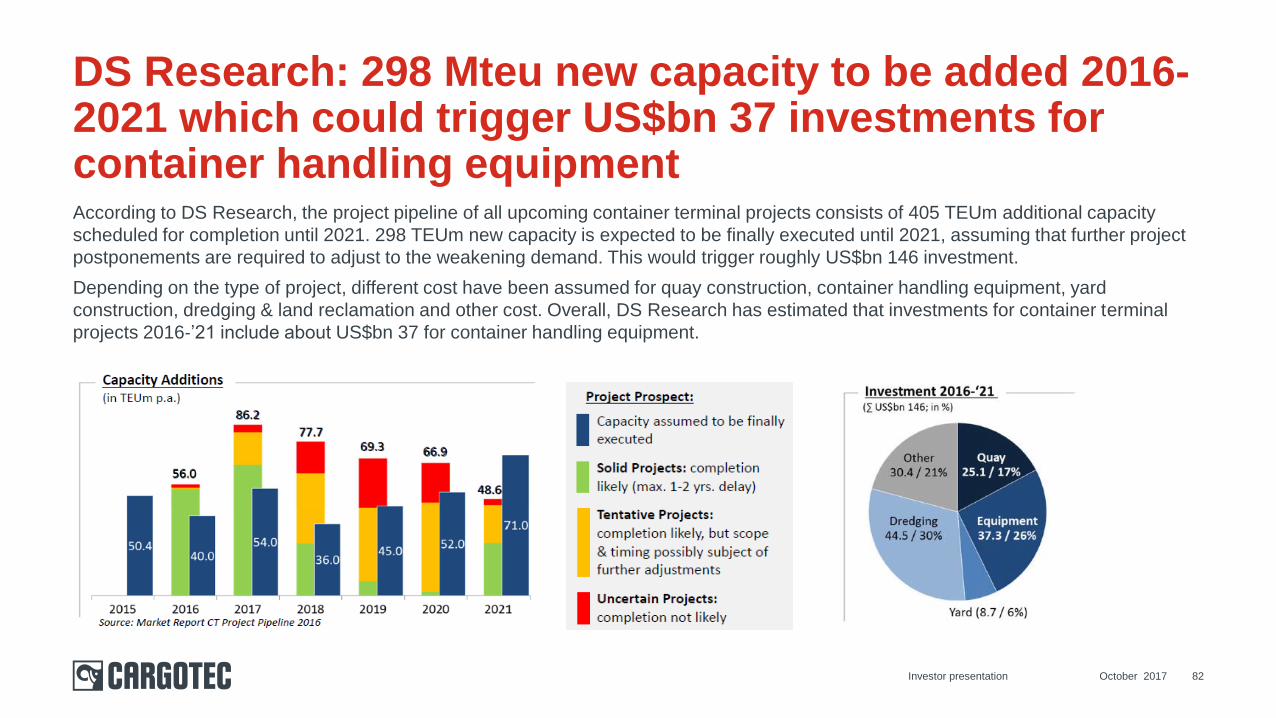
According to DS Research, the project pipeline of all upcoming container terminal projects consists of 405 TEUm additional capacity
scheduled for completion until 2021. 298 TEUm new capacity is expected to be finally executed until 2021, assuming that further project
postponements are required to adjust to the weakening demand. This would trigger roughly US$bn 146 investment.
Depending on the type of project, different cost have been assumed for quay construction, container handling equipment, yard
construction, dredging & land reclamation and other cost. Overall, DS Research has estimated that investments for container terminal
projects 2016‐’21 include about US$bn 37 for container handling equipment.
October 2017 82
DS Research: 298 Mteu new capacity to be added 2016-2021 which could trigger US$bn 37 investments for container handling equipment
Investor presentation
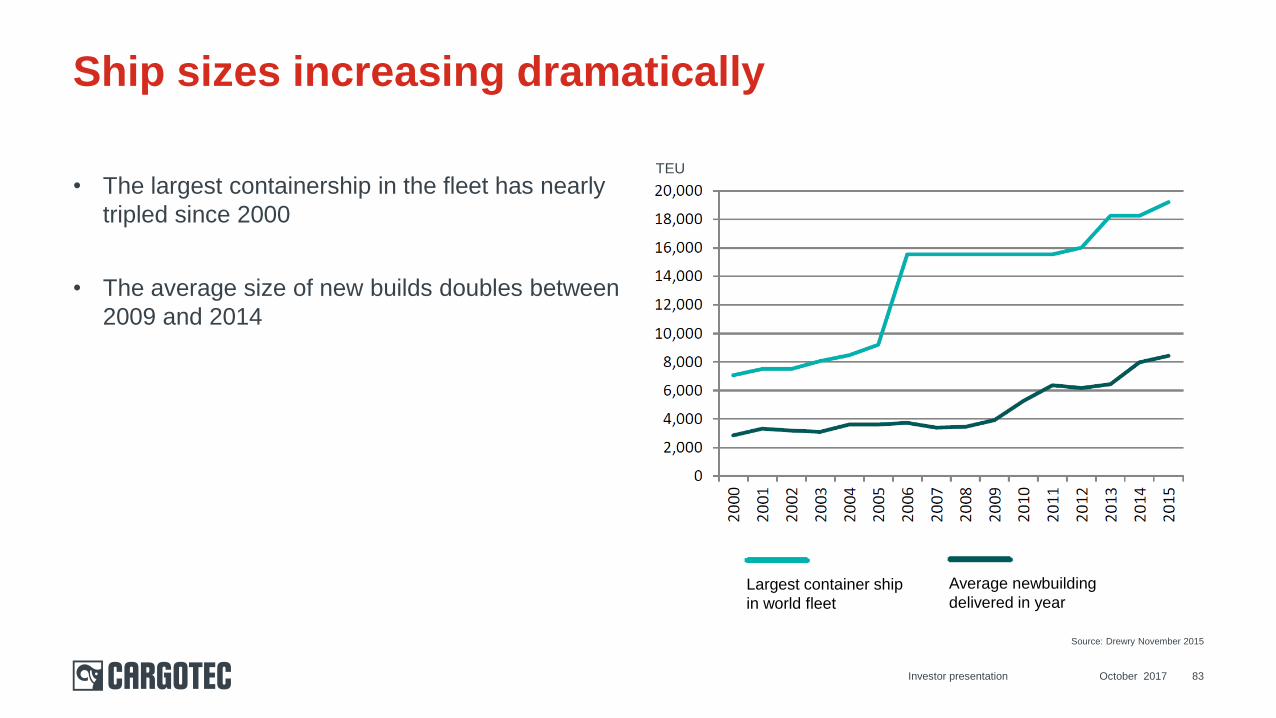
• The largest containership in the fleet has nearly
tripled since 2000
• The average size of new builds doubles between
2009 and 2014
October 2017 83
Ship sizes increasing dramatically
Average newbuilding
delivered in year Largest container ship
in world fleet
Source: Drewry November 2015
Investor presentation
TEU
Hiab appendix
October 2017Investor presentation 84
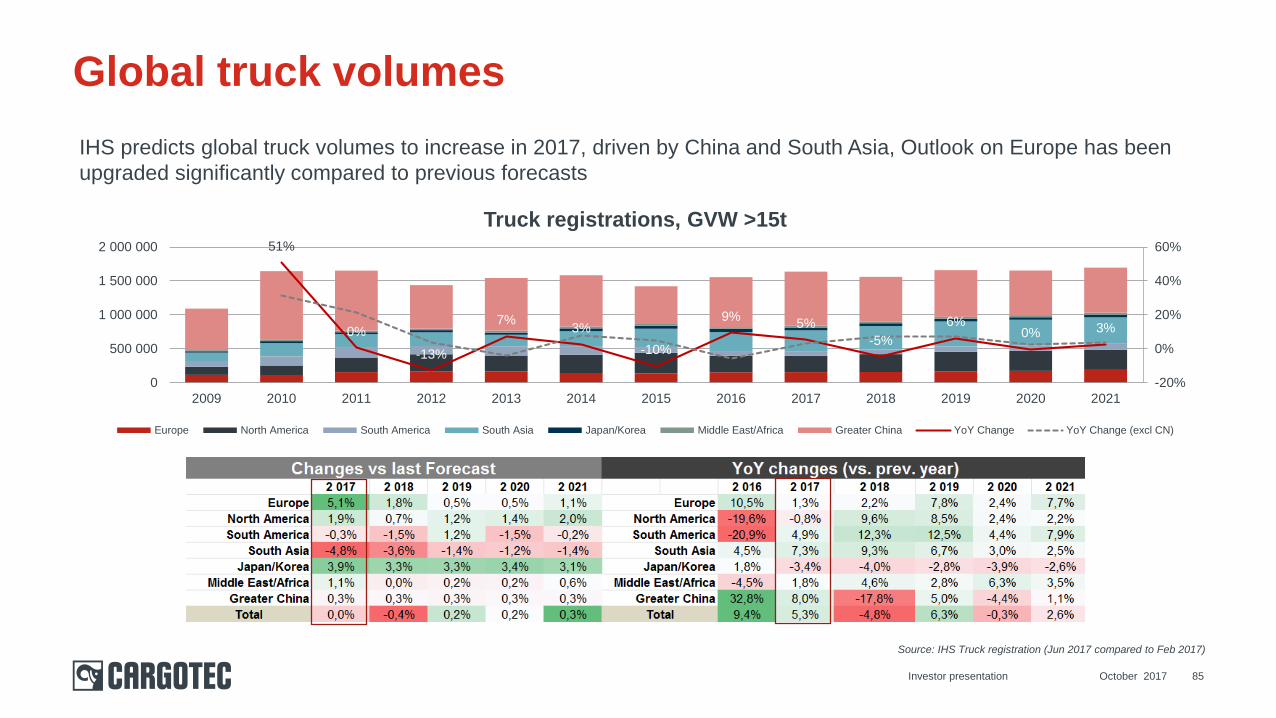
Source: IHS Truck registration (Jun 2017 compared to Feb 2017)
51%
0%
-13%
7%3%
-10%
9%5%
-5%
6%0% 3%
-20%
0%
20%
40%
60%
0
500 000
1 000 000
1 500 000
2 000 000
2009 2010 2011 2012 2013 2014 2015 2016 2017 2018 2019 2020 2021
Truck registrations, GVW >15t
Europe North America South America South Asia Japan/Korea Middle East/Africa Greater China YoY Change YoY Change (excl CN)
85
Global truck volumes
IHS predicts global truck volumes to increase in 2017, driven by China and South Asia, Outlook on Europe has been
upgraded significantly compared to previous forecasts
October 2017Investor presentation
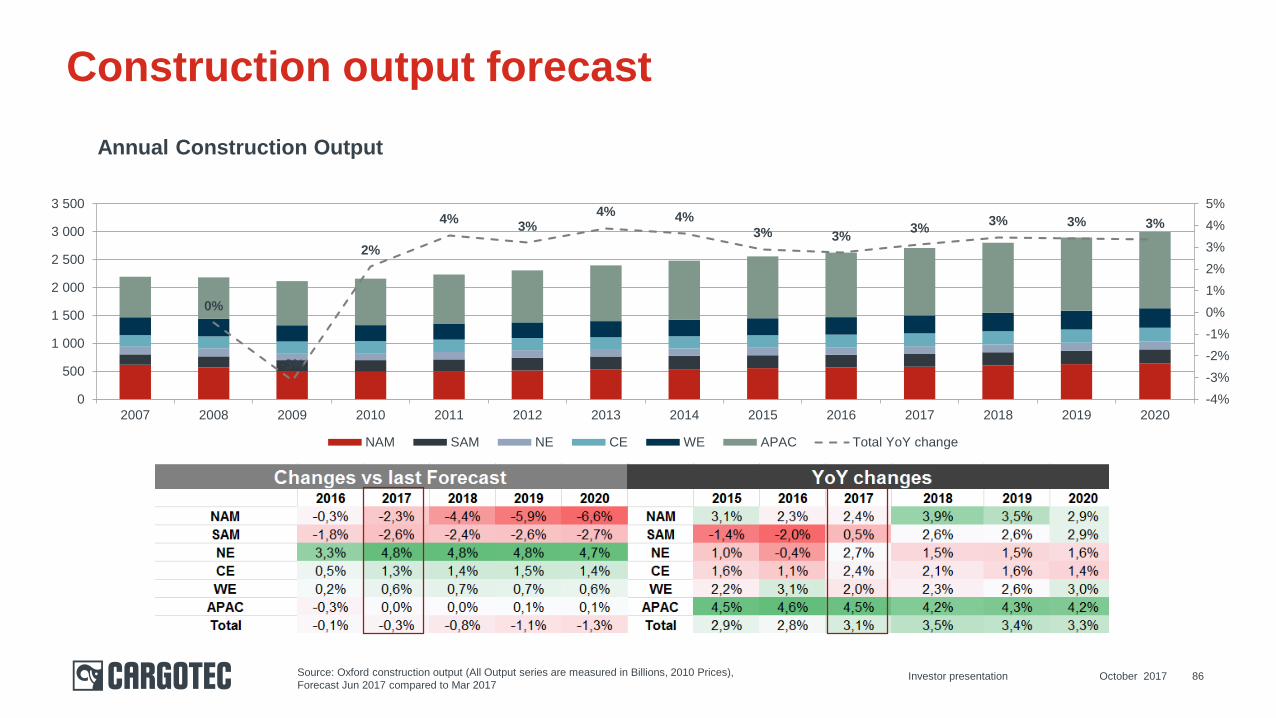
Source: Oxford construction output (All Output series are measured in Billions, 2010 Prices),
Forecast Jun 2017 compared to Mar 2017
0%
-3%
2%
4%3%
4% 4%
3% 3%3%
3% 3% 3%
-4%
-3%
-2%
-1%
0%
1%
2%
3%
4%
5%
0
500
1 000
1 500
2 000
2 500
3 000
3 500
2007 2008 2009 2010 2011 2012 2013 2014 2015 2016 2017 2018 2019 2020
NAM SAM NE CE WE APAC Total YoY change
86
Construction output forecast
Annual Construction Output
October 2017Investor presentation
MacGregor appendix
October 2017Investor presentation 87
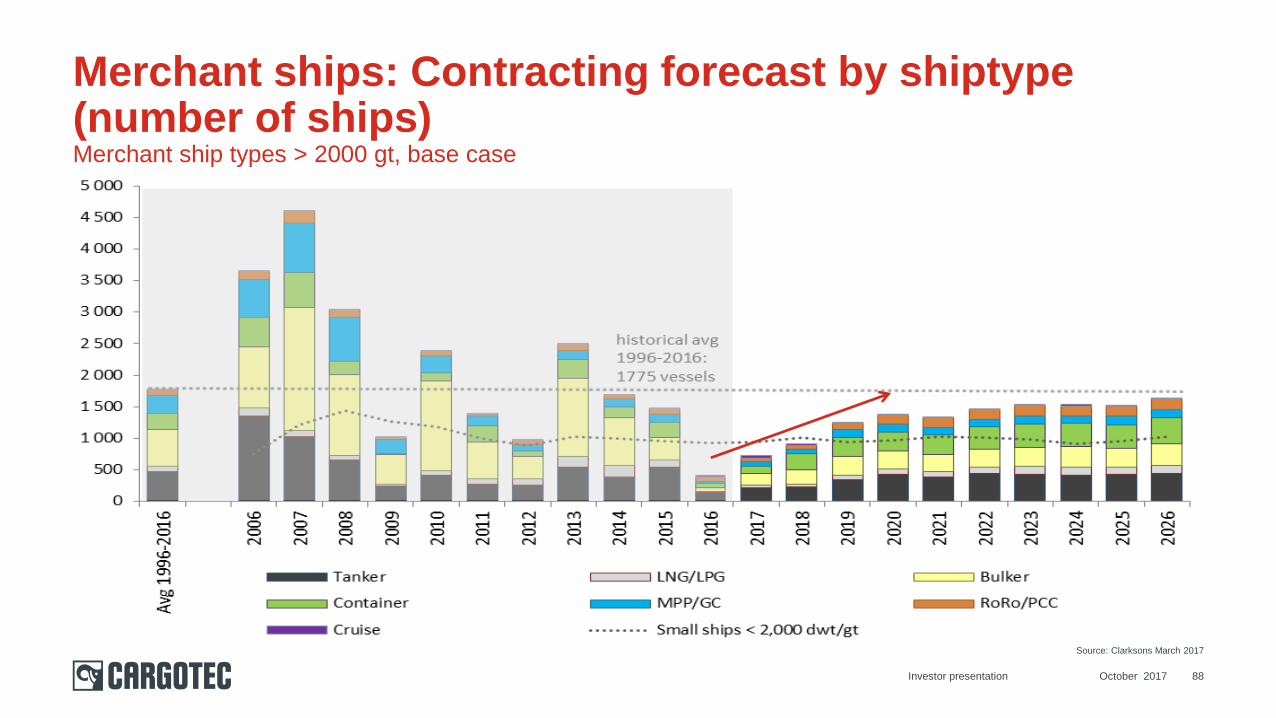
October 2017 88
Merchant ships: Contracting forecast by shiptype (number of ships)Merchant ship types > 2000 gt, base case
Source: Clarksons March 2017
Investor presentation
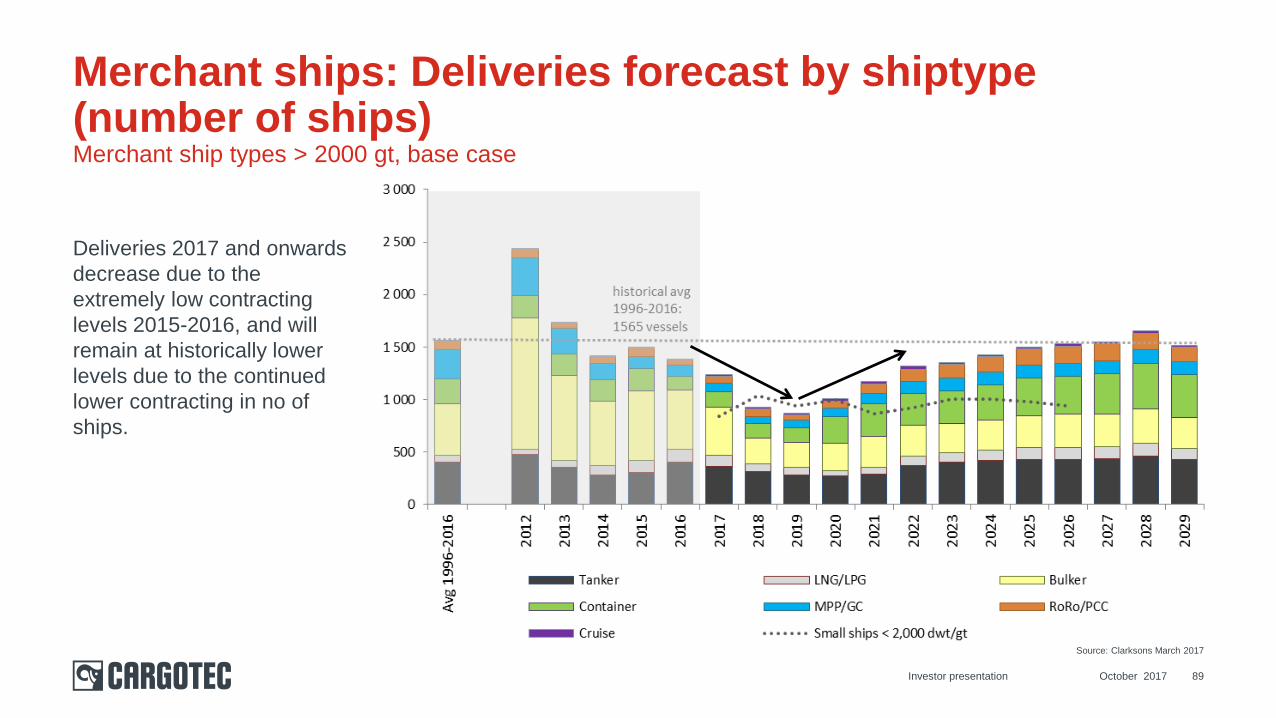
Deliveries 2017 and onwards
decrease due to the
extremely low contracting
levels 2015-2016, and will
remain at historically lower
levels due to the continued
lower contracting in no of
ships.
October 2017 89
Merchant ships: Deliveries forecast by shiptype (number of ships)Merchant ship types > 2000 gt, base case
Source: Clarksons March 2017
Investor presentation
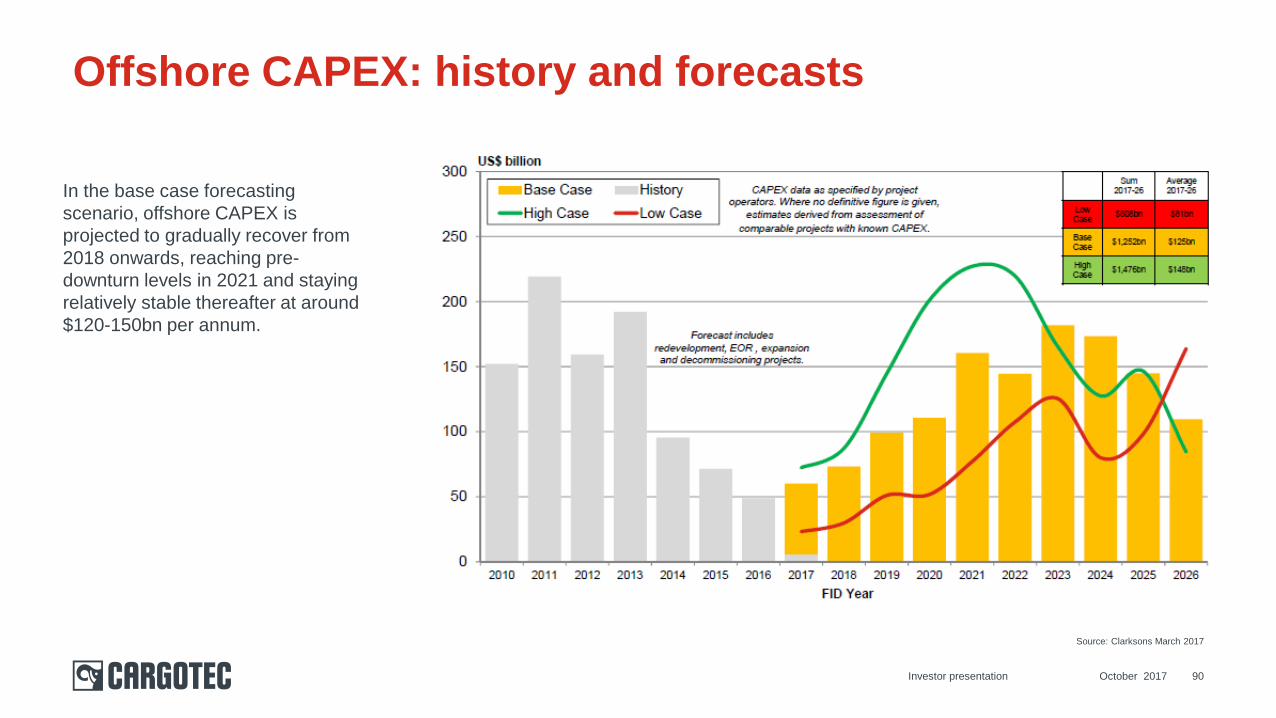
Offshore CAPEX: history and forecasts
October 2017 90
Source: Clarksons March 2017
Investor presentation
In the base case forecasting
scenario, offshore CAPEX is
projected to gradually recover from
2018 onwards, reaching pre-
downturn levels in 2021 and staying
relatively stable thereafter at around
$120-150bn per annum.
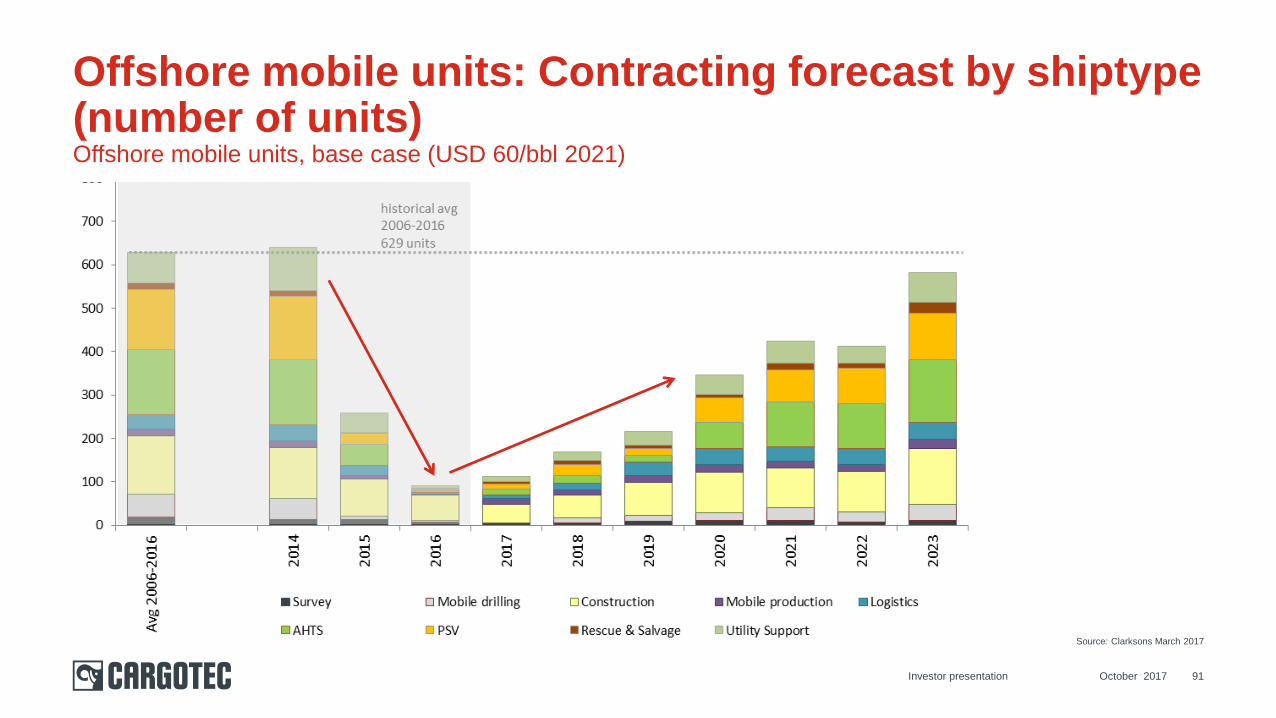
Offshore mobile units: Contracting forecast by shiptype (number of units)Offshore mobile units, base case (USD 60/bbl 2021)
October 2017 91
Source: Clarksons March 2017
Investor presentation
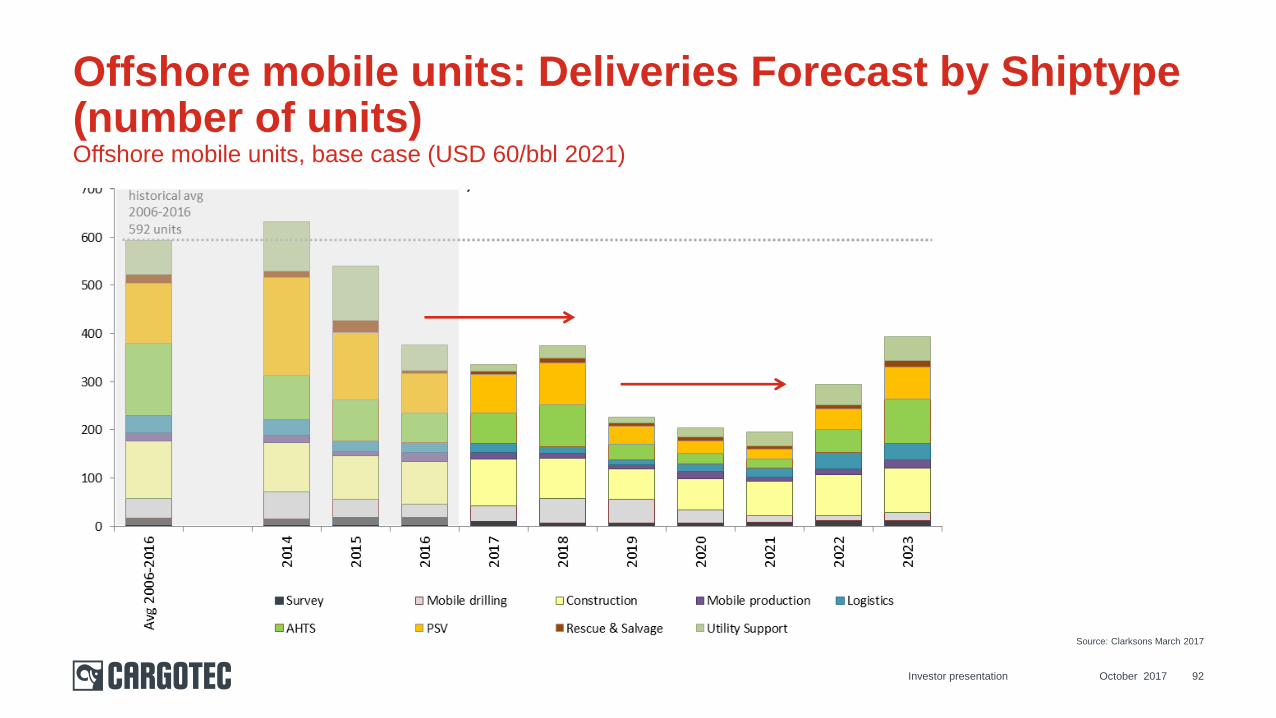
Offshore mobile units: Deliveries Forecast by Shiptype (number of units)Offshore mobile units, base case (USD 60/bbl 2021)
October 2017 92
Source: Clarksons March 2017
Investor presentation
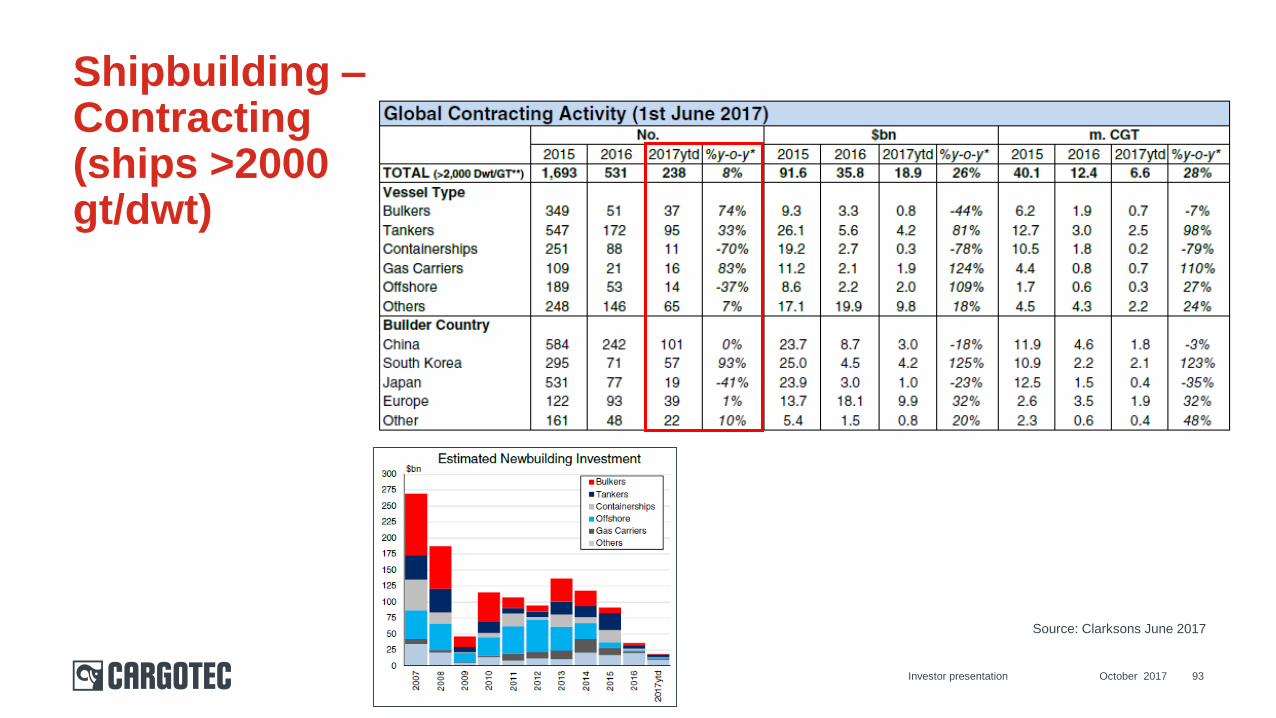
Source: Clarksons June 2017
93
Shipbuilding –Contracting(ships >2000gt/dwt)
October 2017Investor presentation
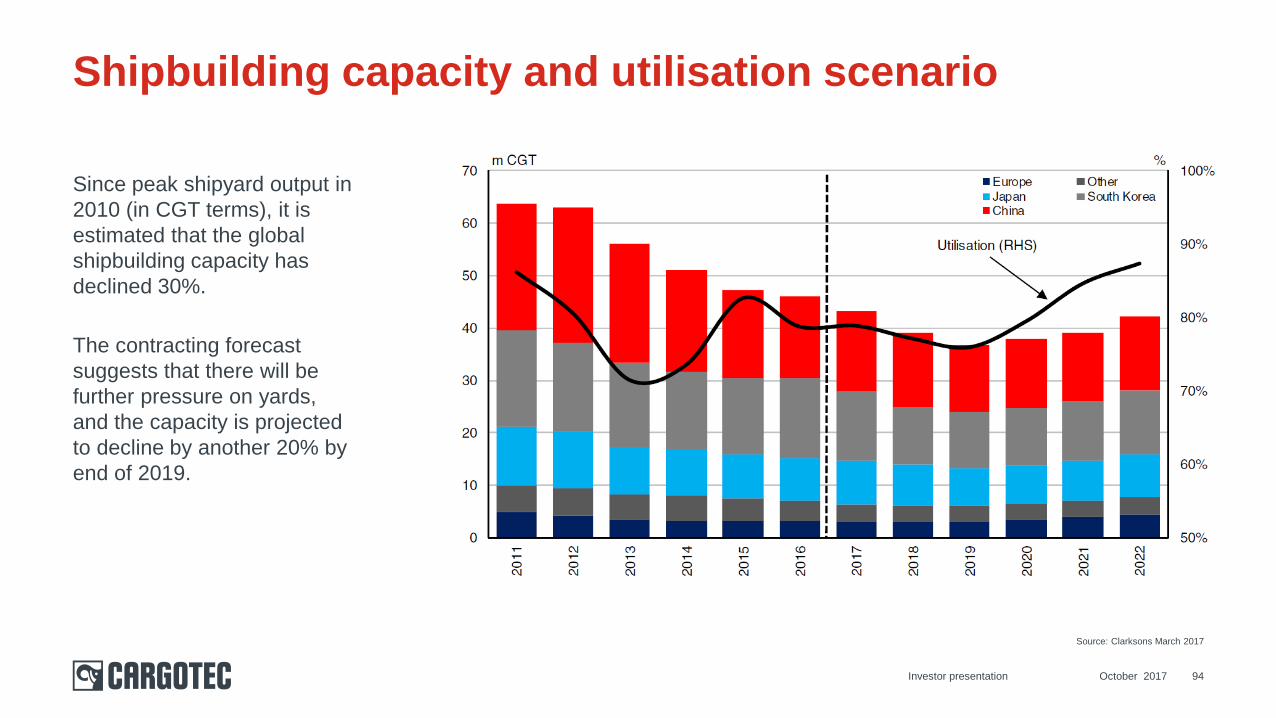
Since peak shipyard output in
2010 (in CGT terms), it is
estimated that the global
shipbuilding capacity has
declined 30%.
The contracting forecast
suggests that there will be
further pressure on yards,
and the capacity is projected
to decline by another 20% by
end of 2019.
October 2017 94
Shipbuilding capacity and utilisation scenario
Source: Clarksons March 2017
Investor presentation
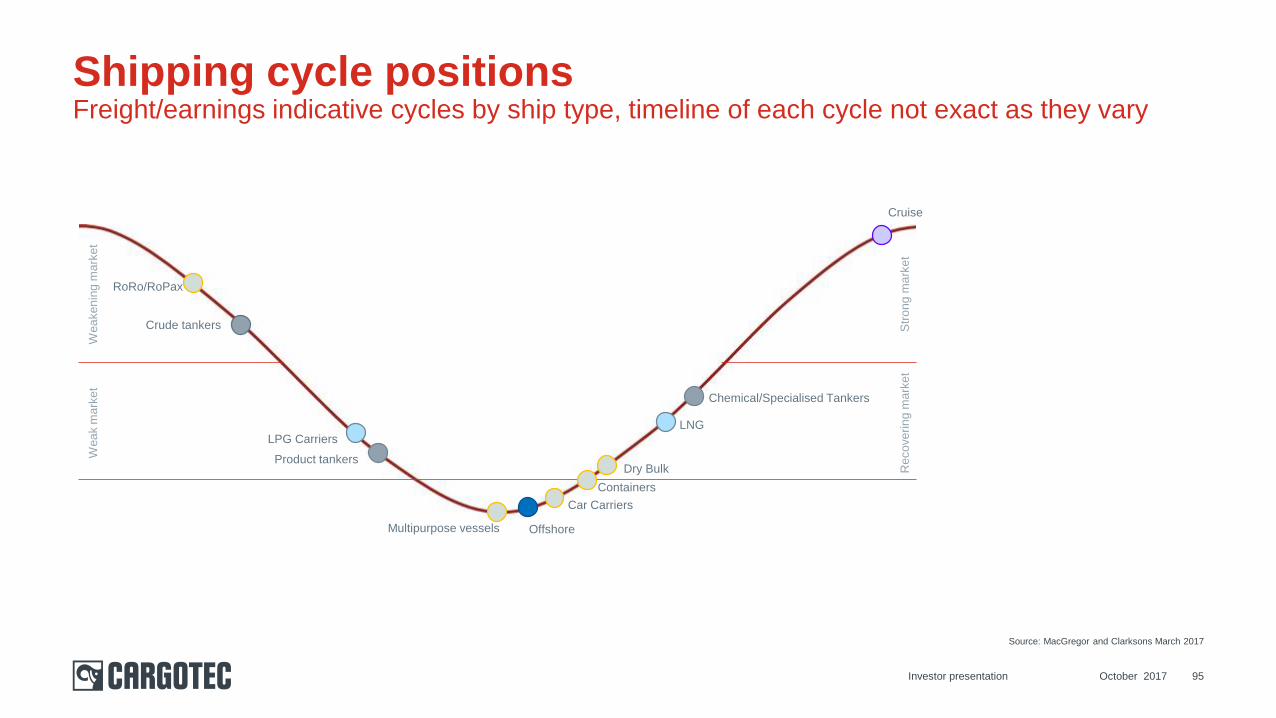
October 2017 95
Shipping cycle positionsFreight/earnings indicative cycles by ship type, timeline of each cycle not exact as they vary
Source: MacGregor and Clarksons March 2017
Investor presentation
Wea
ken
ing
ma
rke
tW
ea
k m
ark
et
Str
on
g m
ark
et
Reco
ve
rin
g m
ark
et
Crude tankers
Dry Bulk
Containers
Offshore
Chemical/Specialised Tankers
LNG
Multipurpose vessels
Car Carriers
Product tankers
LPG Carriers
RoRo/RoPax
Cruise
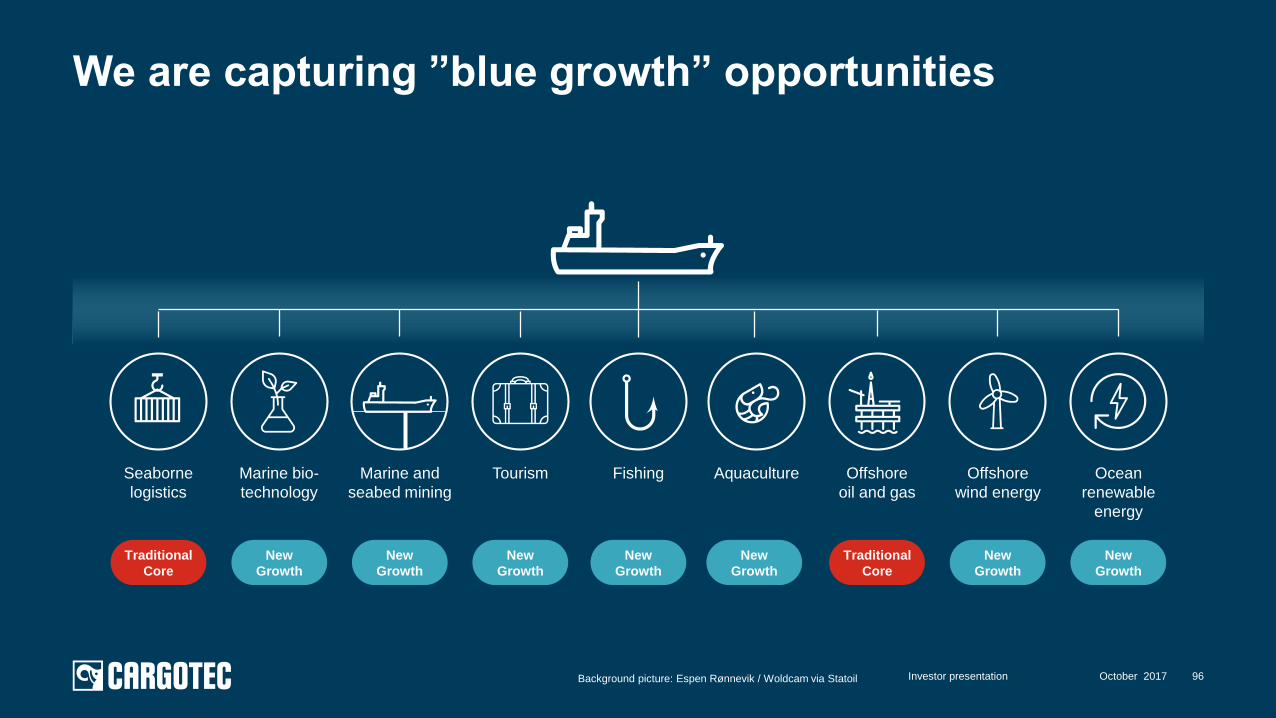
We are capturing ”blue growth” opportunities
Seaborne
logistics
Marine bio-
technology
Marine and
seabed mining
Tourism Fishing Aquaculture Offshore
oil and gas
Offshore
wind energy
Ocean
renewable
energy
Traditional
Core
New
Growth
New
Growth
New
Growth
New
Growth
New
Growth
Traditional
Core
New
Growth
New
Growth
October 2017Investor presentation 96Background picture: Espen Rønnevik / Woldcam via Statoil