Embed Size (px)
Citation preview
Behaviour in a Canadian
multi-payer, multi-provider health care market:
the case of the physiotherapy market in Ontario
by
Paul D. Holyoke
A thesis submitted in conformity with the requirements
for the degree of Doctor of Philosophy
Department of Health Policy, Management and Evaluation
University of Toronto
© Paul Holyoke 2009

ii
Behaviour in a Canadian multi-payer, multi-provider health care market: the case of the physiotherapy market in Ontario
Ph.D., 2009
Paul D. Holyoke
Department of Health Policy, Management and Evaluation, Faculty of Medicine, University of Toronto
Abstract
This is a study of several contentious issues in Canadian health policy involving the
interaction of public and private payers and for-profit (FP) and not-for-profit (NFP) providers;
the influence of health professionals on market structure; and the role of foreign investment. A
case study was used, the Ontario physiotherapy market in 2003-2005, with its complex mix of
payers and providers and foreign investment opportunities.
Key market features were: fragmented but substantial payer influence, effective though
uncoordinated cost control across payers, constrained labour supply, and fragmented patient
referral sources. These features increased the complexity of providers’ interactions with patients
and payers, reducing standardization and therefore favouring local, professional-owned small
business FP providers (FP/s) for ambulatory care. NFP Hospitals’ market share declined.
The findings generally confirmed expected behavioural differences between FP and NFP
providers but expected differences between investor-owned FP providers (FP/c) and FP/s
providers were not generally found. FP/s dominated the market, and FP/c providers appeared to
mimic FP/s market behaviours, competing in local sub-markets.
With no single or dominant payer, cost control difficulties were expected, but all 11 payer
categories (public and private) used various cost control mechanisms, resulting in significant
iii
collective but uncoordinated influence. Generally, no payer alone supported a provider’s
operations.
The dominant labour suppliers, regulated physiotherapists, were scarce and exerted
significant pressure, affecting market structure by asserting individual preferences and
professional interests. FP/s dominance resulted, supported by the traditional patient referral
source, physicians in small practices.
Very little foreign investment was found despite little protection for domestic providers
under NAFTA.
In sum, this study showed FP and NFP provider stereotypes are subject to payer pressure:
FP/c organizations can adapt by mimicking FP/s, and payers can modify NFPs’ assumed
community orientation. Labour shortages and historical referral patterns can make individual
professionals and their preferences more influential than their collective profession without
diminishing the importance of professional interests. The degree and structure of payer control
can make a market unattractive to foreign investors. Finally, this market – neither a planned or
standard market – had a service provision pattern more broadly influenced by professionalism
and practitioner interests than policies or prices.
iv
Acknowledgements
I want to acknowledge the tremendous level of professional support I received during the
preparation of this dissertation from the members of my thesis committee. Dr. Raisa Deber, my
supervisor, was supportive and challenging the entire time, providing me with valuable
mentorship, and helpful guidance and suggestions. Raisa also helped me keep the doctoral work
in perspective with lively discussions about popular music and Canadian and American politics.
Professor Molly Verrier, a member of my thesis committee, contributed substantially with very
helpful challenges to the analysis of the physiotherapy market as it emerged, ensuring a good
balance among the various disciplinary perspectives I was trying to reflect in this work. Dr. Tony
Culyer, also a member of my thesis committee, was very supportive through the entire process.
He provided excellent critiques and suggestions for improvements, and provided very useful
advice on a number of fronts.
I also want to thank Dr. Karen Spalding, Dr. Sharon Switzer-McIntrye and Dr. Rhonda
Cockerill for agreeing to be reviewers for the defence of my dissertation. They asked some
provocative and probing questions, and the dissertation was improved as a result.
Many other people provided support throughout the entire process. I would like to
acknowledge Dr. Michel Landry, who gave helpful suggestions during the formulation of the
research questions and the data collection phase, and was a good sounding board for some of the
interesting and challenging issues that arose. Cindy Gauvreau, also doing doctoral work in the
Department of Health Policy, Management and Evaluation, provided support and help with some
of the methodological issues. Exceptional assistance during the data collection phase was also
provided by Dr. Nibal Lubbad, Jonah Perucha, Philip Galacgac, and Känecy Oñate.
Of course, I will always be grateful to my family – Daisy, Grace and Alice – who were
always encouraging and supportive and interested in my work, and who helped me balance my
academic work with a rich home life.
Finally, I wish to acknowledge the financial support of the Canadian Institutes for Health
Research in the form of a Doctoral Research Award.

v
Table of Contents
Abstract .......................................................................................................................... ii Acknowledgements ...................................................................................................... iv List of acronyms and terms ....................................................................................... viii List of tables ................................................................................................................ xiv List of figures ............................................................................................................. xvii List of appendices .................................................................................................... xviii
Chapter 1 – Introduction and overview ................................................... 1
1.1 Statement of the issues ........................................................................................... 1
1.1.1 Public & private financing and FP & NFP delivery of health care ................ 3 1.1.2 The role of health professionals ..................................................................... 4 1.1.3 Investment in a health care market ................................................................. 5
1.2 Organization of the report ....................................................................................... 7
Chapter 2 – The structure of health care markets .................................. 9
2.1 Ideal markets and health care markets .................................................................. 9
2.1.1 Uncertainty of demand .................................................................................. 10 2.1.2 Asymmetry of information ............................................................................. 11 2.1.3 Insurance as a response to the uncertainty of demand ............................. 12 2.1.4 Regulation to address provider moral hazard ............................................. 13 2.1.5 Government involvement .............................................................................. 15
2.2 Porter’s model applied to health care markets ................................................... 16
2.2.1 Outline of Porter’s model .............................................................................. 16 2.2.2 Rivalry among existing providers in a market ............................................. 18 2.2.3 Buyer power .................................................................................................... 33 2.2.4 Supplier power ............................................................................................... 40 2.2.5 Threat of new entrants ................................................................................... 42 2.2.6 Threat of substitutes ...................................................................................... 51
2.3 Research questions ............................................................................................... 52
Chapter 3 – Study design and methods ................................................ 56
3.1 Case study – the physiotherapy market in Ontario ............................................ 56 3.2 Data collection and analysis ................................................................................. 59
3.2.1 Documents ...................................................................................................... 59 3.2.2 Secondary analysis of existing data files .................................................... 62 3.2.3 Market Participants Database ....................................................................... 67 3.2.4 Survey of physiotherapy provider organizations in 12 counties ............... 70
vi
3.2.5 Key informant interviews ............................................................................... 77 3.2.6 Ethics and confidentiality .............................................................................. 82
3.3 Outline of subsequent chapters ........................................................................... 83
Chapter 4 – Overview of the physiotherapy market ............................. 85
4.1 Need for physiotherapy services .......................................................................... 85 4.2 Buyers and sellers ................................................................................................. 88 4.3 Services being bought and sold ........................................................................... 91 4.4 Eligible labour supply ............................................................................................ 95
4.4.1 Practitioners ................................................................................................... 95 4.4.2 Services provided by registered physiotherapists ................................... 100 4.4.3 Supporting and assisting personnel .......................................................... 103
4.5 Registered physiotherapists ............................................................................... 106
4.5.1 High demand for labour ............................................................................... 106 4.5.2 Number of registered physiotherapists ..................................................... 109 4.5.3 Geographic distribution of registered physiotherapists .......................... 110 4.5.4 Two cohorts of physiotherapists ................................................................ 117
4.6 Review of findings in this chapter ...................................................................... 119
Chapter 5 – Revenue sources, buyer power ....................................... 122
5.1 Revenue sources in the physiotherapy market ................................................. 122
5.1.1 Revenue sources’ terms and conditions ................................................... 122 5.1.2 Complexity of the revenue sources ............................................................ 140 5.1.3 Negotiation of fees ....................................................................................... 145 5.1.4 Relative value of revenue sources .............................................................. 148 5.1.5 Specific revenue sources and revenue mixes ........................................... 150
5.2 Strategic provider groups and four revenue sources ...................................... 156
5.2.1 Highest revenue fee – MVA insurance ....................................................... 156 5.2.2 Lowest revenue fee – WSIB ......................................................................... 157 5.2.3 Niches with low administrative burden ...................................................... 164
5.3 Overview of findings in this chapter .................................................................. 167
Chapter 6 – Rivalry among strategic groups of providers ................ 171
6.1 Perceptions of competition ................................................................................. 172
6.1.1 The amount of competition ......................................................................... 172 6.1.2 Competing with whom? ............................................................................... 174 6.1.3 Competition and service mix....................................................................... 178
vii
6.1.4 Competition for the supply of patients ....................................................... 179
6.2 Variety of services and patients in the market .................................................. 181
6.2.1 Variety of services ........................................................................................ 181 6.2.2 Mix of patients .............................................................................................. 185
6.3 Wait lists ............................................................................................................... 196 6.4 Overview of findings in this chapter .................................................................. 199
Chapter 7 – The threat of new entrants ............................................... 202
7.1 Survival in the physiotherapy market ................................................................ 202
7.1.1 Entry and survival rates ............................................................................... 203 7.1.2 Survival ......................................................................................................... 209
7.2 Foreign investment in the market ....................................................................... 214
7.2.1 Insurers ......................................................................................................... 214 7.2.2 Provider organizations ................................................................................ 217
7.3 Overview of findings in this chapter .................................................................. 225
Chapter 8 – Discussion and conclusions ........................................... 228
8.1 Review of findings ............................................................................................... 228
8.1.1 Research Question 1: Behaviour of FP and NFP provider organizations 228 8.1.2 Research Question 2: Fragmented payers and cost control .................... 231 8.1.3 Research Question 3: Labour supply and supply of patients .................. 233 8.1.4 Research Question 4: Entry, exit and survival in this market .................. 235 8.1.5 Research Question 5: Foreign investment................................................. 236 8.1.6 Key organization-level features of the market ........................................... 236 8.1.7 Market-level observations – neither planned nor ideal ............................. 241
8.2 Implications for the future of the physiotherapy market .................................. 244 8.3 Implications for Canadian health policy ............................................................ 247 8.4 Study challenges and limitations – opportunities for research ....................... 251
8.4.1 Methodological challenges.......................................................................... 251 8.4.2 Limitations and opportunities for future research .................................... 253

viii
List of acronyms and terms
Acronyms CCAC Community Care Access Centre
CPO College of Physiotherapists of Ontario. See Chapter 2, section 2.1.4.
FP For-profit. The presumed dominant motivation of a FP business is the pursuit of an excess of revenues over costs (profit) that can be distributed to owners of or investors in the business. See Chapter 2, section 2.2.2.3.
FP/c A FP/c organization is a FP business corporation that is predominantly or exclusively owned by investors other than the principal managers or employees of the business. See Chapter 2, section 2.2.2.3.
FP/s A FP/s organization is a FP business that is owned predominantly or exclusively by the principal managers or employees of the business. See Chapter 2, section 2.2.2.3.
FSCO Financial Services Commission of Ontario
IBC Insurance Bureau of Canada
MOHLTC Ontario’s Ministry of Health and Long-Term Care
MVA Motor vehicle accident
NFP Not for profit. The presumed dominant motivation of a NFP organization is something other than the pursuit of profits. See Chapter 2, section 2.2.2.3.
OHIP Ontario Health Insurance Plan
PAF Pre-Approved Framework. A protocol or guideline for treating whiplash injuries established by the Financial Services Commission of Ontario. See Chapter 5, section 5.1.1.8.
WSIB Workplace Safety and Insurance Board
Terms Access (to health care) If patients have good access to health care, they are able to receive
necessary health care.1 Access can be influenced by financial, physical, institutional and social factors.2
Acute care “Acute care includes health services provided to persons suffering from serious and sudden health conditions that require ongoing professional nursing care and observation. Examples of acute care include post-operative observation in an intensive care unit, and care and observation while waiting for emergency surgery.”3
ix
Ancillary services In this study, “ancillary services” are those services listed in the Survey of Physiotherapy Provider Organizations (see Chapter 3, section 3.2.4) that were offered by less than a third of all respondents to the survey (see Chapter 4, section 4.3).
Canada Health Act The Canada Health Act is a federal law specifying the terms and conditions that provincial public health insurance plans must meet to be eligible to receive federal funding for health. The principal terms and conditions are these: accessibility, portability, public administration, universality and comprehensiveness of the provincial plans.4
Common services In this study, “common services” are those services listed in the
Survey of Physiotherapy Provider Organizations (see Chapter 3, section 3.2.4) that were offered by more than a third of all respondents to the survey (see Chapter 4, section 4.3).
Community Care Access Community Care Access Centres (CCACs) are NFP corporations Centres established under the Community Care Access Centres Act, 2001,5
and are designated as the eligible recipients of public funding from the MOHLTC under the Long-Term Care Act, 1994.6 They provide home care services (including physiotherapy services) to people who need them. See Chapter 5, section 5.1.1.5.
Delivery “Delivery” of health care services refers to the organization, management and provision of health care services.7
Demand “Demand” is the expression of an individual’s desire to purchase something; in the health care context, this can be different from need. See Chapter 2, section 2.1.1.
Designated clinic A “designated clinic” is a health care provider organization named by the Ontario Ministry of Health and Long-Term Care as eligible to receive public funding for the provision of physiotherapy to certain patients under OHIP. See Chapter 5, section 5.1.1.2.
Economies of scale There are economies of scale for a producer of goods or services when the “amount of resource used per unit of output falls at higher output rates”.2
Entry In the analysis of provider organizations’ entry into the physiotherapy market in this study, “entry” means that an organization was not in business in 2003 but was in business in 2005. See Chapter 3, section 3.2.3.2.
Exit In the analysis of provider organizations’ exit from the physiotherapy market in this study, “exit” means that an organization was in business in 2003 but was not in business in 2005. See Chapter 3, section 3.2.3.2.
x
Fee for service A fee for service is “a method of remunerating professionals … according to an agreed fee-schedule specifying what is payable for each item of service supplied.”2
Financing “Financing” refers to “how services are paid for.”7
Foreign investment “Foreign investment” is investment in businesses in Canada by corporations or individuals that do not reside in Canada.8
Global budget A global budget is an amount of money granted to a health care provider organization to provide services to a segment of the population. Subject to any constraints imposed by the grantor, the provider organization decides how to allocate the budget among possible programs and services.
Health profession, health In this study, a “health professional” is a member of a college of a professional “health profession” as defined in, regulated under and given
occupational protection by the Ontario Regulated Health Professionals Act.9 Under that Act, the regulated health professions include physiotherapy, medicine, and nursing.
Market A market is a mechanism through which consumers (buyers) express their demand for goods and services and producers (sellers) make goods and services available. The market enables the exchange of those goods and services. See Chapter 2, section 2.1.
Medicare “Canada's national health insurance program, often referred to as "Medicare", is designed to ensure that all residents have reasonable access to medically necessary hospital and physician services, on a prepaid basis. Instead of having a single national plan, [there is] a national program that is composed of 13 interlocking provincial and territorial health insurance plans, all of which share certain common features and basic standards of coverage.”10 With public insurance, access to health care services is on the basis of an individual’s need rather than on the ability to pay.
Motor vehicle accident The risk of motor vehicle accidents is insurable in Ontario with (MVA) insurance MVA insurance, also known as automobile or auto insurance.
MVA insurance is a revenue source for physiotherapy providers in Ontario. See Chapter 5, section 5.1.1.8.
Need A person’s “need” for health care services refers to the potential
for those services to make a positive impact on that person’s health status. Generally, decisions about “need” are guided or entirely made by health professionals and practitioners. See Chapter 2, section 2.1.1.
Niche market A niche market is “a specialized but profitable corner of the market”.11
OHIP designated clinic See “designated clinic”.

xi
Ontario Health Insurance The Ontario Health Insurance Plan or OHIP is constituted under Plan Ontario’s Health Insurance Act12 to administer publicly-funded
health insurance, Medicare, in Ontario. Payer In this study, “payer” refers to one of the revenue sources (Chapter
5, section 5.1) for physiotherapy provider organizations.
Physiotherapist/ Following the Physiotherapy Act, 199113, this study uses the term Physical Therapist “physiotherapist” to describe only physiotherapists registered with
the College of Physiotherapists of Ontario, the organization given the responsibility to regulate the physiotherapy health profession. “Physical therapist” is another term reserved exclusively for the professionals regulated under the Physiotherapy Act and it is therefore interchangeable for “physiotherapist”. For consistency, however, “physiotherapist” rather than rather “physical therapist” is used in this study.
Other therapists who provide physiotherapy services but who are
not registered are labelled more generically in this study, for example, as “therapists” or “other practitioners”; where they are members of other regulatory Colleges such as chiropractors or physicians, those regulated terms are used.
Physiotherapy/ Physiotherapy is a health profession in Ontario. The practice of Physical Therapy physiotherapy is described by the Ontario Physiotherapy Act13 as
follows: The practice of physiotherapy is the assessment of physical
function and the treatment, rehabilitation and prevention of physical dysfunction, injury or pain, to develop, maintain, rehabilitate or augment function or to relieve pain.
“Physical therapy” is a term also used to describe the profession regulated under the Physiotherapy Act and it is interchangeable for “physiotherapy”. For consistency, however, “physiotherapist” rather than rather “physical therapist” is used in this study.
Practitioner A “practitioner” is “a person practicing a profession…; a person who regularly does a particular activity, esp. one requiring skill”.14 In this study, this term includes health professionals.
Private “Private” refers to activities, assets, resources or organizations that are not of a government, not public. Private organizations may be operated on a FP or NFP basis.
Private health insurance “Private health insurance” refers to insurance policies to insure specified health care services not insured publicly under Medicare. See Chapter 5, section 5.1.1.11.
xii
Program of Care One of a number of protocols for treating injuries, including soft tissue injury, established by the Workplace Safety and Insurance Board. See Chapter 5, section 5.1.1.9.
Provider “Provider” means an individual, partnership or corporation that produces health care services for patients.
Provider organization A “provider organization” is a provider’s outlet or setting for providing health care services to patients. A provider organization may be constituent part or subsidiary of a larger corporation (including a hospital corporation) that owns other provider organizations or undertakes other activities; if not a constituent part or subsidiary, it is a legal entity separate from all others.
Public “Public” refers to activities, assets, resources or organizations that are of a government, not private.
Quality (of health care) Quality of health care refers to “the extent to which care meets accepted standards.”1
Scope of practice A “scope of practice” is specified in each of the laws constituting regulatory organizations (Colleges) for health professions in Ontario, and states what services members of the profession can provide. In the case of physiotherapy, section 3 of the Physiotherapy Act, 1991,13 states as follows:
The practice of physiotherapy is the assessment of physical function and the treatment, rehabilitation and prevention of physical dysfunction, injury or pain, to develop, maintain, rehabilitate or augment function or to relieve pain.
Strategic groups “Strategic groups” refers to groups of firms or organizations in a market that use similar approaches to the market and to competition.15 See Chapter 2, section 2.2.2.1.
Strategic provider groups See “strategic groups”.
Survival In the analysis of provider organizations’ survival in the physiotherapy market in this study, “survival” means that an organization was in business in 2003 and was also in business in 2005. “Survivor” has a corresponding meaning. See Chapter 3, section 3.2.3.2.
Therapist See “physiotherapist”.
Trade treaty A trade treaty is a formal agreement binding at least two states regarding matters of trade in goods, services or both.

xiii
Workplace Safety and The Workplace Safety and Insurance Board (WSIB) is a NFP Insurance Board statutory corporation established in 1917 to provide no-fault
insurance coverage for almost 70% of Ontario workers if they are injured or contract diseases as a result of their work.16 It is the workers’ compensation authority in Ontario. See Chapter 5, section 5.1.1.9.
xiv
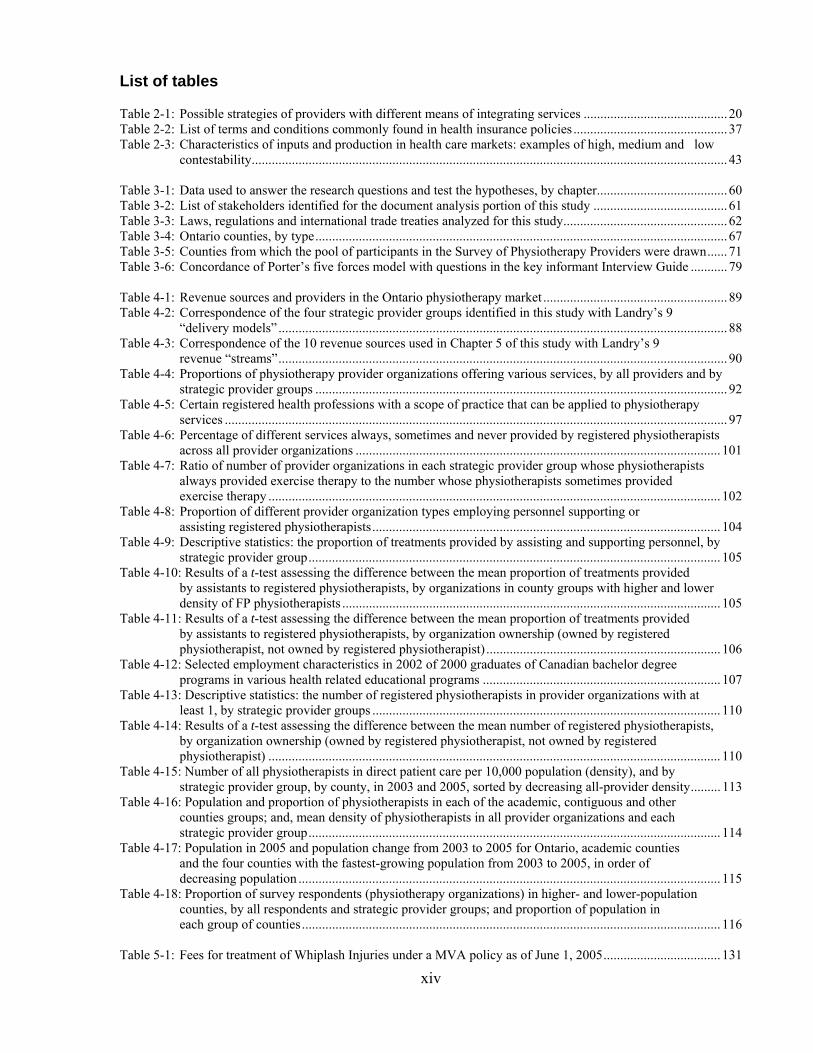
List of tables
Table 2-1: Possible strategies of providers with different means of integrating services ........................................... 20 Table 2-2: List of terms and conditions commonly found in health insurance policies .............................................. 37 Table 2-3: Characteristics of inputs and production in health care markets: examples of high, medium and low
contestability .............................................................................................................................................. 43 Table 3-1: Data used to answer the research questions and test the hypotheses, by chapter ....................................... 60 Table 3-2: List of stakeholders identified for the document analysis portion of this study ........................................ 61 Table 3-3: Laws, regulations and international trade treaties analyzed for this study ................................................. 62 Table 3-4: Ontario counties, by type ........................................................................................................................... 67 Table 3-5: Counties from which the pool of participants in the Survey of Physiotherapy Providers were drawn ...... 71 Table 3-6: Concordance of Porter’s five forces model with questions in the key informant Interview Guide ........... 79 Table 4-1: Revenue sources and providers in the Ontario physiotherapy market ....................................................... 89 Table 4-2: Correspondence of the four strategic provider groups identified in this study with Landry’s 9 “delivery models” ...................................................................................................................................... 88 Table 4-3: Correspondence of the 10 revenue sources used in Chapter 5 of this study with Landry’s 9 revenue “streams” ...................................................................................................................................... 90 Table 4-4: Proportions of physiotherapy provider organizations offering various services, by all providers and by
strategic provider groups ........................................................................................................................... 92 Table 4-5: Certain registered health professions with a scope of practice that can be applied to physiotherapy services ...................................................................................................................................................... 97 Table 4-6: Percentage of different services always, sometimes and never provided by registered physiotherapists
across all provider organizations ............................................................................................................. 101 Table 4-7: Ratio of number of provider organizations in each strategic provider group whose physiotherapists always provided exercise therapy to the number whose physiotherapists sometimes provided exercise therapy ....................................................................................................................................... 102 Table 4-8: Proportion of different provider organization types employing personnel supporting or assisting registered physiotherapists ........................................................................................................ 104 Table 4-9: Descriptive statistics: the proportion of treatments provided by assisting and supporting personnel, by
strategic provider group ........................................................................................................................... 105 Table 4-10: Results of a t-test assessing the difference between the mean proportion of treatments provided by assistants to registered physiotherapists, by organizations in county groups with higher and lower density of FP physiotherapists ................................................................................................................. 105 Table 4-11: Results of a t-test assessing the difference between the mean proportion of treatments provided by assistants to registered physiotherapists, by organization ownership (owned by registered physiotherapist, not owned by registered physiotherapist) ...................................................................... 106 Table 4-12: Selected employment characteristics in 2002 of 2000 graduates of Canadian bachelor degree programs in various health related educational programs ....................................................................... 107 Table 4-13: Descriptive statistics: the number of registered physiotherapists in provider organizations with at least 1, by strategic provider groups ........................................................................................................ 110 Table 4-14: Results of a t-test assessing the difference between the mean number of registered physiotherapists, by organization ownership (owned by registered physiotherapist, not owned by registered physiotherapist) ....................................................................................................................................... 110 Table 4-15: Number of all physiotherapists in direct patient care per 10,000 population (density), and by strategic provider group, by county, in 2003 and 2005, sorted by decreasing all-provider density ......... 113 Table 4-16: Population and proportion of physiotherapists in each of the academic, contiguous and other counties groups; and, mean density of physiotherapists in all provider organizations and each strategic provider group ........................................................................................................................... 114 Table 4-17: Population in 2005 and population change from 2003 to 2005 for Ontario, academic counties and the four counties with the fastest-growing population from 2003 to 2005, in order of decreasing population .............................................................................................................................. 115 Table 4-18: Proportion of survey respondents (physiotherapy organizations) in higher- and lower-population counties, by all respondents and strategic provider groups; and proportion of population in each group of counties ............................................................................................................................. 116 Table 5-1: Fees for treatment of Whiplash Injuries under a MVA policy as of June 1, 2005 ................................... 131
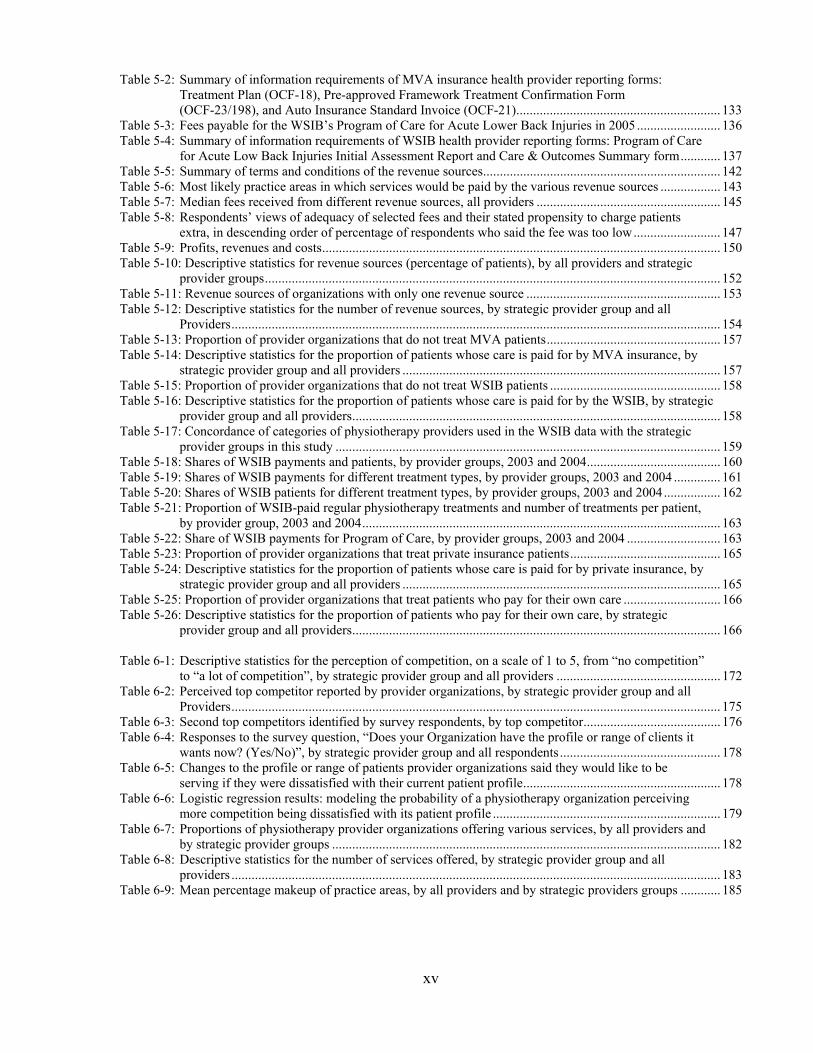
xv
Table 5-2: Summary of information requirements of MVA insurance health provider reporting forms: Treatment Plan (OCF-18), Pre-approved Framework Treatment Confirmation Form (OCF-23/198), and Auto Insurance Standard Invoice (OCF-21) ............................................................. 133 Table 5-3: Fees payable for the WSIB’s Program of Care for Acute Lower Back Injuries in 2005 ......................... 136 Table 5-4: Summary of information requirements of WSIB health provider reporting forms: Program of Care for Acute Low Back Injuries Initial Assessment Report and Care & Outcomes Summary form ............ 137 Table 5-5: Summary of terms and conditions of the revenue sources ....................................................................... 142 Table 5-6: Most likely practice areas in which services would be paid by the various revenue sources .................. 143 Table 5-7: Median fees received from different revenue sources, all providers ....................................................... 145 Table 5-8: Respondents’ views of adequacy of selected fees and their stated propensity to charge patients extra, in descending order of percentage of respondents who said the fee was too low .......................... 147 Table 5-9: Profits, revenues and costs ....................................................................................................................... 150 Table 5-10: Descriptive statistics for revenue sources (percentage of patients), by all providers and strategic provider groups ........................................................................................................................................ 152 Table 5-11: Revenue sources of organizations with only one revenue source .......................................................... 153 Table 5-12: Descriptive statistics for the number of revenue sources, by strategic provider group and all Providers .................................................................................................................................................. 154 Table 5-13: Proportion of provider organizations that do not treat MVA patients .................................................... 157 Table 5-14: Descriptive statistics for the proportion of patients whose care is paid for by MVA insurance, by strategic provider group and all providers ............................................................................................... 157 Table 5-15: Proportion of provider organizations that do not treat WSIB patients ................................................... 158 Table 5-16: Descriptive statistics for the proportion of patients whose care is paid for by the WSIB, by strategic provider group and all providers .............................................................................................................. 158 Table 5-17: Concordance of categories of physiotherapy providers used in the WSIB data with the strategic provider groups in this study ................................................................................................................... 159 Table 5-18: Shares of WSIB payments and patients, by provider groups, 2003 and 2004 ........................................ 160 Table 5-19: Shares of WSIB payments for different treatment types, by provider groups, 2003 and 2004 .............. 161 Table 5-20: Shares of WSIB patients for different treatment types, by provider groups, 2003 and 2004 ................. 162 Table 5-21: Proportion of WSIB-paid regular physiotherapy treatments and number of treatments per patient, by provider group, 2003 and 2004 ........................................................................................................... 163 Table 5-22: Share of WSIB payments for Program of Care, by provider groups, 2003 and 2004 ............................ 163 Table 5-23: Proportion of provider organizations that treat private insurance patients ............................................. 165 Table 5-24: Descriptive statistics for the proportion of patients whose care is paid for by private insurance, by strategic provider group and all providers ............................................................................................... 165 Table 5-25: Proportion of provider organizations that treat patients who pay for their own care ............................. 166 Table 5-26: Descriptive statistics for the proportion of patients who pay for their own care, by strategic provider group and all providers .............................................................................................................. 166 Table 6-1: Descriptive statistics for the perception of competition, on a scale of 1 to 5, from “no competition” to “a lot of competition”, by strategic provider group and all providers ................................................. 172 Table 6-2: Perceived top competitor reported by provider organizations, by strategic provider group and all Providers .................................................................................................................................................. 175 Table 6-3: Second top competitors identified by survey respondents, by top competitor ......................................... 176 Table 6-4: Responses to the survey question, “Does your Organization have the profile or range of clients it wants now? (Yes/No)”, by strategic provider group and all respondents ................................................ 178 Table 6-5: Changes to the profile or range of patients provider organizations said they would like to be serving if they were dissatisfied with their current patient profile ........................................................... 178 Table 6-6: Logistic regression results: modeling the probability of a physiotherapy organization perceiving more competition being dissatisfied with its patient profile .................................................................... 179 Table 6-7: Proportions of physiotherapy provider organizations offering various services, by all providers and by strategic provider groups .................................................................................................................... 182 Table 6-8: Descriptive statistics for the number of services offered, by strategic provider group and all providers .................................................................................................................................................. 183 Table 6-9: Mean percentage makeup of practice areas, by all providers and by strategic providers groups ............ 185

xvi
Table 6-10: Descriptive statistics of the number of provider organizations’ practice areas, by all providers and by strategic provider group ...................................................................................................................... 186 Table 6-11: Descriptive statistics for the proportion of providers’ patients with orthopaedic and musculoskeletal conditions (other than sports medicine patients), by strategic provider group and all providers ............. 188 Table 6-12: Descriptive statistics for the proportion of providers’ patients in the practice area of sports medicine, by strategic provider group and all providers .......................................................................................... 190 Table 6-13: Descriptive statistics for the proportion of prevention and health promotion patients, by strategic provider group and all providers .............................................................................................................. 192 Table 6-14: Characteristics of providers with more and less than 10% of their clients receiving prevention and health promotion services (PHPS) ........................................................................................................... 193 Table 6-15: Results of 14 t-tests comparing the mean proportion of clients whose care was paid by different revenue sources, by two groups, those with more than 10% of clients receiving prevention and health promotion services (PHPS) and those with less than 10% ............................................................ 194 Table 6-16: Descriptive statistics for the proportion of neurology/neurotrauma patients, by strategic provider group and all providers ............................................................................................................................ 194 Table 6-17: Reported length of wait lists, all respondents ......................................................................................... 196 Table 6-18: Descriptive statistics for the reported length of wait lists, in weeks, for physiotherapy services, by strategic provider group and all providers ............................................................................................... 197 Table 6-19: Providers’ stated propensity to refer patients to another provider organization in the face of a wait list, by strategic provider group ............................................................................................................... 198 Table 7-1: Ontario and county level provider organization numbers in 2003 and 2005, and exits, survival rates, net gains, net growth rate, and proportion of new provider organizations among providers existing in 2005 (in descending order of survival rate) ......................................................................................... 204 Table 7-2: Provider organization numbers in 2003 and 2005, by consolidated groups of academic, contiguous and other counties, and exits, survival rates, net gains, net growth rate, and proportion of new provider organizations among providers existing in 2005 ....................................................................... 206 Table 7-3: Mean number of registered physiotherapists per CPO organization, 2003 and 2005, and change from 2003 to 2005 ................................................................................................................................... 207 Table 7-4: Mean number of registered physiotherapists per CPO provider organization ......................................... 208 Table 7-5: Survival rates and new providers across Ontario, by all provider organizations in the Market Participant Database, and in subsets of the Database .............................................................................. 210 Table 7-6: Survival rates of provider organizations in subgroups of the Market Participants Database, compared with the survival rates of provider organizations not in the subgroups, with chi-square statistics .................................................................................................................................. 210 Table 7-7: MVA insurance companies in Ontario with more than 1% market share in 2005 (with insurance companies with common corporate ownership grouped together), by market share and by
ownership/control .................................................................................................................................... 216 Table 7-8: Responses to question about where a provider organization was based, if a corporation or a partnership ............................................................................................................................................... 218
xvii
List of figures
Figure 2-1: Forces driving industry competition (Porter’s ‘five forces model’) .......................................................... 17 Figure 3-1: Locations of the three categories of Ontario counties ............................................................................... 68 Figure 3-2: Comparison of proportion of provider organizations in each county, in the CPO list and among survey respondents .................................................................................................................................... 76 Figure 5-1: OHIP payments to Designated Clinics and under the Alternative Payment Program for Long-Term Care Homes, 2000/01-2005/06, in millions of dollars ............................................................................. 126 Figure 5-2: Revenue Relative Value Index (RRVI) for each revenue source ............................................................ 150 Figure 6-1: Proportion of survey respondents’ perceptions of competition, by strategic provider group ................. 173 Figure 6-2: Proportion of each strategic provider group reporting wait lists of different lengths ............................. 197 Figure 8-1: Competitive forces in Ontario’s physiotherapy market .......................................................................... 237

xviii
List of appendices
Appendix 1: Survey Questionnaire ........................................................................................................................... 279 Appendix 2: Survey – First Information Letter ........................................................................................................ 292 Appendix 3: Survey – Reminder Card ...................................................................................................................... 294 Appendix 4: Survey – Second Information Letter .................................................................................................... 296 Appendix 5: Survey – Codebook .............................................................................................................................. 299 Appendix 6: Key Informants Interview Guide ......................................................................................................... 312 Appendix 7: Key Informants Interviews – Information Letter and Invitation to Participate .................................... 319 Appendix 8: Survey – Original Ethics Approval ...................................................................................................... 321 Appendix 9: Survey – Protocol Amendment Approval ............................................................................................ 324 Appendix 10: Survey – First Ethics Approval Renewal ............................................................................................ 326 Appendix 11: Survey – Second Ethics Approval Renewal ....................................................................................... 328 Appendix 12: Survey – Third Ethics Approval Renewal .......................................................................................... 330 Appendix 13: Key Informants Interviews – Ethics Approval ................................................................................... 332 Appendix 14: Key Informants Interviews – Consent Form ....................................................................................... 334 Appendix 15: Forms for Completion by Physiotherapy Provider Organizations and Others .................................... 336 Appendix 16: Details of the Results of Specific Statistical Texts ............................................................................. 353

1
Chapter 1 – Introduction and overview
1.1 Statement of the issues
This is a study of several contentious and important issues in Canadian health policy. The
issues, all involving the operation of health care markets, include (1) the impact of the interaction
of public and private payers and for-profit (FP) and not-for-profit (NFP) providers; (2) the
influence of health care professionals on the structure of a market and on the activities of
provider organizations in that market; (3) the factors influencing provider organizations’ entry
into, survival in and exit from health care markets; and, (4) the role of foreign investors in
Canadian health care.
There is little room or opportunity for direct investigation of these issues, particularly on
a comparative basis, when looking at the dominant health care sub-sectors – hospitals and
physicians – in Canadian health care. Medicare, now embodied in the Canada Health Act,17 was
an innovation of the 1950s, 1960s and 1970s in the method of financing of health care provided
by these sub-sectors, and in securing universal access for Canadians to these kinds of health care
services. Several of the issues mentioned above appear to have been settled within Medicare in
the early years of innovation, either explicitly or passively, though there is continuing interest in
the policy choices that have been made over the years. For example, the question of whether
public and private payers should co-exist was resolved in favour of a single public payer in each
province for hospital and physician services, but the question about the usefulness of adding
payers, including private payers, continues to be raised.
Citizens, policy makers, and researchers who search for evidence-based policy options
for modifications to the health care system commonly look to jurisdictions outside Canada and
their experience with issues like private financing, for-profit delivery of health care, alternative
approaches to health human resources supply, and the role of corporate investors in the provision
of health care services. Of course, Canada’s proximity to the United States means that the
American health care system is examined often but some look to European and Australian
models.18-22 Regarding foreign investment questions, researchers look to other sectors of the
economy, notably to manufacturing. Some of the debate that results from these investigations of
foreign or “international” health care systems or other sectors is about the generalizability of the
findings to the Canadian health care sphere: can the Dutch experience with private health
insurance, for example, be used to understand how private health insurance would work in and
affect the Canadian health care system23 or can findings about the effect of parallel private health
2
insurance schemes on wait times in a publicly-funded system in England and New Zealand24 be
applied in Canada?
This study takes a different approach to studying these issues. Instead of examining
foreign models and experiences, or the experience in manufacturing, this study examines in
considerable detail a Canadian health care market that has many of the attributes of interest in
Canadian health care policy and research: the Ontario physiotherapy market in the period 2003 to
2005.
This market has a broad mix of private and public payers, some regulated heavily, some
not. It has a mix of NFP provider organizations and FP provider organizations, both small
businesses and investor-owned corporations. At its core are self-regulated health professionals –
physiotherapists – with protection of occupational title but not of scope of practice.
Consequently, there are other health professionals and some unregulated practitioners in this
market. Also, in many respects the market is open to foreign investment in that there are no
market-wide protections in international trade treaties for domestic providers.
The physiotherapy market and the buyers and sellers in it have experienced a number of
interesting policy changes in the last ten years, and the effects of most of these changes had been
in place by the study period 2003-2005. For example, in the 1990s there were significant changes
in the pattern of buying services in two important sectors, motor vehicle accident (MVA)
insurance and workers’ compensation. In the study period, however, there were also abrupt
reductions of fees without the input of providers and the introduction of proposals for new
regulations for more overlapping and potentially substitute professional groups. Also, the market
was and continues to be working within a context of an aging population, which brings signs that
the demand for services from this market will increase.
Physiotherapy services and services related to physiotherapy are of course bought and
sold in this market. Ontario’s Physiotherapy Act13 defines “physiotherapy” as follows:
The practice of physiotherapy is the assessment of physical function and the treatment, rehabilitation and prevention of physical dysfunction, injury or pain, to develop, maintain, rehabilitate or augment function or to relieve pain.
The Ontario Physiotherapy Association,25 the association for physiotherapists in Ontario
describes the scope and value of physiotherapy services more expansively, though consistent
1with its members’ interests, it only refers to “physiotherapists” as providing these services and
not others:

3
Physiotherapy is a drug-free health care practice. Physiotherapists work in partnership with individuals of all ages to break down the barriers to physical function whether that means working with patients pre and post surgery, helping people come back from illness and chronic disease, injury, industrial and motor vehicle accidents and age related conditions. Physiotherapists also play an important role in health promotion and disease prevention.
Physiotherapy can play a role before a patient receives acute care services (such as surgery) as
well as after patients have passed through an acute phase of their disability, whether they have
received other health care services or not during an acute phase. Physiotherapy services can also
be used by individuals who want to avoid injury and disability by maintaining their health status
and physical functioning. Thus, the physiotherapy market is not an isolated niche market;
instead, it touches on a great many areas of the whole health care system.
This study takes this interesting market and examines it from several perspectives to look
at the issues mentioned – public and private financing; FP and NFP delivery of health services;
the influence of health professionals; entry, exit and survival patterns of health care provider
organizations; and, foreign investment. An introduction to each of these issues follows, with the
specific research questions that are addressed in this study.
1.1.1 Public & private financing and FP & NFP delivery of health care
A significant part of the national debate over health care in Canada continues to be
whether private FP delivery of health care is to be avoided or encouraged. Most hospital services
are delivered by NFP organizations (either public or private) and most physician services in
Canada are delivered through private FP organizations, practices owned by physicians. However,
faced with financial pressures exerted by public payers and with changes in technology and
preferences for community- rather than hospital-based delivery of some health services, NFP
hospitals have shed, or ‘passively privatized’, services 21;26-28and where possible, FP providers
are picking up the business. Many in Canada hoped that the Report of the Commission on the
Future of Health Care in Canada18 (the ‘Romanow Report’) in 2002 would settle the issues of
privatization and “profitization”29 in Canadian health care since it weighed heavily in support of
continued and increased NFP delivery of services traditionally covered by Medicare for reasons
of potential superior capacity for cost containment, quality and equitable access. However,
advocates for increased involvement of the private FP providers continue to raise the issues,
pressing for expansion of FP services, arguing that they can provide cost advantages and more
efficient and more innovative delivery.30-32 Advocates of private insurance argue that more

4
private financing options can increase consumer choice, access and efficiency of the health care
system.32-34
In Ontario’s physiotherapy market, there is a rich mix of FP and NFP providers, and this
study tests a number of theories about behaviours of FP and NFP providers – for example, how
they position themselves in the market and how they respond to financial incentives. The study
specifically answers the following research question:
Research Question 1: Do provider organizations supply health care services
differently depending on their FP and NFP status and their corporate form?
With respect to financing or payment for health care services, a commonly identified
strength of the Medicare program in Canada is the single public payer in each provincial
jurisdiction (mandated by the Canada Health Act4) with the power to influence substantially the
terms and conditions of the delivery of care and, particularly, costs.18;35 Advocates of increased
involvement of private insurers of course would like to move beyond the single public payer, and
they stress positive aspects of multiple payers, including patient choice and beneficial effects of
competition.30-32 As will be seen, 11 different types of payers in the Ontario physiotherapy
market are identified in this study, including both private and public insurers. This market
therefore allows a look at the role that the various payers have as they buy services, and how
they affect the kind and range of services that are made available to patients. The study answers
this research question:
Research Question 2: Are public and private payers in a health care market similar
or different in their approach to and relationship with providers, and what effect do
they have on the supply of services in a health care market?
1.1.2 The role of health professionals
Physicians have been the subject of much study in the literature, and many of the theories
of health professional behaviour are based on this traditionally powerful profession. The
physiotherapy market depends heavily on the regulated physiotherapy profession, but the
profession in Ontario has a short regulatory history, having had a regulatory regime like
physicians’ (which dates from 186936) only since 1991.13 In addition, the occupational protection
that physiotherapists have is of their title only: other practitioners cannot legally call themselves
“physiotherapists.” However, the range and scope of the services physiotherapists offer in the
5
health care market can be offered by a number of other regulated and unregulated practitioners.
The effect of this less restrictive scheme of professional regulation is examined in this study, in
circumstances of a relatively constrained supply of physiotherapists.
Though the regulatory scheme permits patients’ direct access to physiotherapists,
historical patterns of referrals from physicians to physiotherapists (reflecting patterns established
before regulation)36 and the common place of physiotherapy services within a continuum of care,
mean that providers rely heavily on relationships with other health professionals and health care
institutions for business. The effect of this practical integration of patient supply across
professional groups without, as will be seen, the financial supports for clinical integration is
interesting and will be shown to have important effects on the structure of the market.
Research Question 3: What role do the supply of labour and the pattern of supply of
patients to health care providers have in the structure of the provider organizations
in a health care market?
1.1.3 Investment in a health care market
The factors that have influenced entry and exit in the physician part of Medicare markets
are generally assumed to be relatively personal and professional. In addition to the numbers of
medical students graduating from Canadian medical schools, factors include physicians’
preferences for practice style, the place of their education, their gender and age, their ability to
move to other jurisdictions (including the United States where, for some physicians, overall
market conditions are perceived as better than in Canada), and the availability of bonus payments
for practice in areas perceived by physicians to be less desirable.37;38 For hospitals,
predominantly NFP in Canada, there is less influence of market factors than governmental and
policy factors. Investments in new hospitals are organized by provincial governments (even if
some of the capital comes from sources other than taxes) and entry and exit of hospitals has been
decided by government policy and legislation.39;40 Overall, and despite the pressures commonly
perceived in these markets, researchers have remarked on substantial stability in these markets
due to the underlying societal and institutional power physicians and hospitals have enjoyed in
Canada before and after Medicare was introduced.41
The factors motivating entry and exit of provider organizations from Canadian health
care markets in which there is a greater influence of market forces and competition are not
widely known but it could be assumed that, as participants in the market drive toward greater

6
market share and economies of scale, there would be a trend toward fewer, larger corporations
owning chains of health care provider organizations.42 Potentially, such chains could, as in the
United States, be purchased by or enter into arrangements with organizations like Wal-Mart
Stores Inc. to offer services in multiple locations in a retail rather than health care setting,43;44
dramatically changing the nature of the health care delivered.45 This study uncovers patterns of
entry, exit and survival in the physiotherapy market and some of the factors influencing these
phenomena, in response to the following research question:
Research Question 4: What characterizes the organizations that survive in a
contestable health care market and those that exit and enter?
Another significant debate that has arisen since negotiations over the North American
Free Trade Agreement (NAFTA)46 in the late 1980s and early 1990s is about special protections
from foreign competition for Canadian health care providers. Under NAFTA, there are no
specific exceptions for domestic health care providers, though there are general provisions
governing governmental programs and programs with a social purpose. The General Agreement
on Trade in Services (GATS),47 in effect from 1995, specifically allows foreign competition in
health insurance other than for services covered by Medicare – medically necessary physician
and hospital services. Some commentators argue persuasively that the Canadian hospital and
physician markets are not open to foreign investors under the NAFTA or the GATS because they
are parts of governmental financing programs and are not open to commercial activity.48;49
However, if these markets – or indeed, other health care markets – were open to commercial
activity, there is concern about the potential for the application of the trade rules to
fundamentally change the makeup of these markets. Some fear that global firms, given the
opportunity, would penetrate the Canadian market and overwhelm smaller Canadian firms,
using, where available, cross-border economies of scale and expertise in competitive health care
markets.
Discovering the degree to which the Ontario physiotherapy market is fundamentally
globalized – that is, whether foreign insurers and providers participate in the market – is one of
the goals of this study. The fifth research question poses the issue in the following manner:
Research Question 5: Is there a significant presence of foreign investors or foreign
corporate providers in health care markets? What mechanisms help produce this
pattern?
7
1.2 Organization of the report
Because of the wide range and large number of market issues raised by the research
questions, a framework for a systematic review of the physiotherapy market was necessary.
Michael Porter’s generic model of the five ‘forces” that structure a market15 has been adapted for
this purpose. The five forces are: the relationships among existing sellers (providers) in a market,
the power of buyers, the power of suppliers, the potential threat of new entrants to a market, and
the role of substitute products and services. The discussion of these five forces provides a
structure for the chapters and the discussion of the issues in this study.
Chapter 2 clarifies some basic features of markets in general and how health care markets
differ from other markets. The chapter then amplifies the theory, the literature and other sources
briefly mentioned in this introductory chapter to illuminate the five formal research questions
and to provide the basis for the hypotheses tested in this study. Chapter 3 discusses the study
design, as well as further explanation of the use of the physiotherapy market as a case study to
explore the research questions. Chapter 3 also outlines the methods and data used in the study.
The fourth chapter provides more general contextual information about the physiotherapy
market, including assessments of the need for physiotherapy services and a description of the
major groups of providers (organized by their FP or NFP status and corporate form) and payers
(or buyers). There is also a discussion of the variety of services that are bought and sold in the
market. Chapter 4 also reviews the labour supply that is able to participate in the market, the
services provided by registered (or regulated) physiotherapists and by others, as well as the
numbers and distributions of physiotherapists across Ontario.
Chapter 5 contains a discussion of the revenue sources or buyers in the market, covering
first the terms and conditions that govern the payments made by 11 different revenue sources.
The chapter then turns to a discussion of the relationships between specific revenue sources and
different groups of providers.
The sixth chapter discusses the perceptions of provider organizations in the market about
competition generally among themselves and with others, and about competition for the supply
of patients. There is also a comparative analysis of the kinds of services different provider groups
offer in the market, the mix of patients that each serves, and the issue of wait lists for service.
Chapter 7 discusses the issues of entry into and exit from the market by providers, and
characteristics of provider organizations that may influence their ability to survive in the

8
physiotherapy market. It also deals with the question of the extent of foreign investment and
ownership in both the buyer and provider sides of the market.
The final Chapter, 8, provides a summary of the findings in the study and the answers to
the research questions. It also provides reflections on the future of the physiotherapy market in
light of the findings and implications for other health care markets. Because of the novel
approach taken in this study – the examination of a complex Canadian health care market with
multiple payers and providers – there is also a reflection on some of the methodological issues
that arose during the study, the study’s limitations, and opportunities for future research.

9
Chapter 2 – The structure of health care markets
This chapter deals with the literature and theory that frame the research study and put it in
context. To provide a foundation for the examination of the research questions, section 2.1
reviews essential features of ideal markets and two dimensions on which health care markets are
generally said to diverge significantly from the ideal: uncertainty of demand for health care and
asymmetry of information between providers and patients.
In section 2.2, the general features of health care markets (including the two divergent
dimensions) are integrated into a generic model for analyzing a market, Porter’s15 ‘five forces
model.’ The Porter model provides a way to assess providers’ performance and sustainability in
a market. The five forces in the model are:
• Rivalry among existing sellers
• Buyer power
• Supplier power
• Threat of new entrants
• Threat of substitutes
Section 2.3 reviews the theory and literature pertaining to each of these forces in turn.
The fleshed-out model of a health care market provides the structure to generate
hypotheses in relation to the research questions. These hypotheses follow the review of the
literature that gives rise to each, and at the end of this chapter, in section 2.4, the hypotheses are
presented together.
2.1 Ideal markets and health care markets
A market is a mechanism through which consumers (buyers) express their demand for
goods and services and producers (sellers) make goods and services available. The market
enables the exchange of those goods and services, and one of the key pieces of information that
enables the exchange is price. From the sellers’ perspective, there is a range (or “vector” in the
terminology of economists) of minimum prices that they must receive to produce different
quantities of the good or services; there is also a vector of maximum prices that sellers are
willing to pay for different quantities of those goods or services. Where the two vectors intersect,
there is neither excess demand nor excess supply and the market is said to have cleared.50

10
Ideal markets are information-rich arenas in which buyers seek sellers with specific
products or services at a price acceptable to them. Buyers participate in the market with a level of
certainty about the nature of sellers and about the products and services those sellers can supply.
In an ideal market, there are enough buyers and sellers so that none, individually or collectively,
can influence the market as a whole. The sellers compete to supply goods and services at prices
that satisfy buyers’ demands. High-price sellers reduce their prices to meet their competitors’ or
differentiate their goods and services.
While all the ideal characteristics for markets to clear rarely co-exist in actual markets,
many markets are assumed to have them in some measure, moving toward a state of equilibrium
in which competition among sellers induces cost- and price-cutting or differentiation on quality,
and in which buyers’ demands are satisfied. Sources of innovation, including technological
innovation and new kinds of demands from buyers, can upset the path to equilibrium. Sellers and
buyers make adjustments in reaction to these disturbances and eventually the market moves
toward equilibrium again. Some markets, however, may remain out of equilibrium for long
periods of time.
There is a general consensus in the literature42;50-52 that health care markets have certain
features that mean they are not ideal markets. Two of these features are uncertainty of demand
for health care (which gives rise to a demand for insurance) and asymmetry of information
between health care providers and patients. Drawing on several sources,42;50-52 these features are
reviewed in the next section, along with common responses from the market and from
governments.
2.1.1 Uncertainty of demand
Generally, there is more uncertainty about purchasing health care than about purchasing
other goods and services. People do not usually plan to consume health care as they might plan
to purchase consumer goods because illness occurs relatively randomly: people do not generally
know when they may become ill and need health services, except perhaps for regular checkups
and preventative care. Furthermore, with health care, there is a difference between “need” and
“demand” though both are commonly cited as the appropriate information on which to make
societal resource allocations.42 “Need” refers to the potential for health care to make a positive
impact on a person’s health status and generally, consumers’ decisions about “need” are guided
or entirely made by health service providers. “Demand,” on the other hand, is the expression of
an individual’s desire to purchase something. Unlike ordinary consumer goods, it is thought that

11
people ought not to consume health services that they do not need, and prices for health services
ought not to be at such a level that individuals who need them cannot get them.53
The unknowns and uncertainties, and the differences between demand and need, mean
that health care markets are not ideal for patients to gather information and make rational choices
about what health services they could benefit from. In light of the uncertainties, people often turn
to insurance, the role of which is discussed in section 2.1.3.
2.1.2 Asymmetry of information
In an ideal market, consumers are able to obtain information about options so that they
can satisfy their own interests and preferences, and can decide whether to allocate their resources
to one good or service rather than another. Patients are generally not interested so much in
buying health care as they are in being healthy or becoming healthier, and they are unsure about
the way their health status may be enhanced by the consumption or use of health services.42;51
Even where information is available, providers and not patients are in control of many of the
consumption decisions since health practitioners usually have much more knowledge about the
technical aspects of care than patients. Providers interpret a patient’s symptoms into a diagnosis
and then, drawing from their training and experience, they prescribe and often implement what
they see as the measures that constitute the care that is “needed” by a patient or that is
“necessary”.
The imbalance of information between the patient and the health practitioner is called
‘asymmetry of information’, and in these circumstances, the health practitioner acts as the agent
of the patient (the principal). Agency theory says that as long as their respective interests and
their tolerance for risk and cost are the same, the agent will act as the principal would act if he or
she knew what the agent knows. However, the interests and risk tolerance may not align, and if
they do not, there will be conflict.54 “Conflict of interest” situations are an example: when
providers refer patients to themselves or to other organizations in which they have a pecuniary
interest,55 the providers’ interest may eclipse the patients’. There may also be instances when the
health care services that are defined by providers as “needed” are in fact detrimental to a
person’s health or have a negligible positive effect. Furthermore, health practitioners act as
“gatekeepers” for many services – patients cannot purchase most surgical procedures or
prescription drugs, for example, unless practitioners authorize them.
Some researchers argue that technological advances, including the Internet, will make
useful information available to patients to make them true consumers of health care as in other

12
markets and reduce both the asymmetry of information and the possibility of unchecked
dissonance between agents’ and principals’ interests.56;57 However, even where there is already a
relative abundance of information about an illness and the treatment options, patients still prefer
substantial input from their health service providers or are prepared to hand over decision-
making completely.58
To redress some of the potential conflicts between these principals and agents,
governments have developed regulatory schemes to assist in aligning the interests (to emphasize
the patient’s interest) and to require additional information to be disclosed when patients
complain about their health professional-agents.59 These regulatory schemes are discussed in
more detail in section 2.1.4. But the principal-agent conflicts become more complicated when
insurers are involved.
2.1.3 Insurance as a response to the uncertainty of demand
The uncertainty of demand among potential consumers in health care markets, coupled
with a finite probability of high (unaffordable) costs, usually means that there is a demand for
insurance. Insurance pools or groups the individual-level risks of needing health care on the
assumption that an insurer can assess group-level incidence patterns and costs even if no one is
able to predict which particular individuals will become ill. In return for the payment of an
insurance premium and usually in the hope that they will never personally have to collect on the
promise, people get an undertaking from the insurer that it will pay for the health care they need,
subject to the conditions and limits in the promise. Insurance in a market brings its own
complications to a market, two of which are consumer50 and provider moral hazard.
There are two types of consumer moral hazard. First, after insurance is in place,
consumers may be less inclined to avoid risky behaviours, for example, forgoing healthy lifestyle
practices because they will bear less responsibility to pay for health services if they require them.
This is called “ex ante moral hazard,” since the possible behavioural change predates the
occurrence of an insured risk. Second, once an insured consumer realizes an insured risk, he or
she may consume costlier services than necessary or than he or she would otherwise choose. For
example, a patient might insist on more expensive non-generic pharmaceuticals because they
come at zero or relatively minimal cost under the insurance contract. This is called “ex post
moral hazard” reflecting a behavioural change after a risk has materialized.
However, people are unlikely to injure themselves because their health care will be
covered by an insurance policy. Therefore, the problem of ex ante moral hazard is likely limited
13
for health insurance.60;61 Also, as a result of information problems in health care markets,
patients make fewer of the decisions to consume services than in other markets, and rely on
providers to recommend treatment. Aside from initial visits or from failure to comply with
treatment recommendations of providers (if that results in complications requiring more care),
the ex post moral hazard emerging from consumer behaviour is also likely limited by the health
provider’s role.42
Another problem with insurance is “provider moral hazard.”50 Sometimes this
phenomenon is analyzed as “supplier induced demand,”42 and it arises as a consequence of the
information held by the provider and the provider’s role. Health service providers may overstate
the positive effects certain services are likely to have or they may overstate the negative
consequences of a patient not receiving certain services. This does not necessarily imply that
health services providers intentionally distort the truth and mislead their patients. Health
professionals are simply seen as unlikely to be able to act as their patients’ perfect agents – that
is, make the same choices that the patient would make if he or she had all the provider’s
information – because they cannot possibly know a patient’s entire range of preferences, nor will
health professionals be able to detach themselves completely from their own preferences and
interests. Also, because health professionals’ judgment can be brought into question in lawsuits
and in professional misconduct hearings, health professionals may defensively overprescribe
diagnostic testing and treatment. Since they bear few of the financial risks or costs of the
consequences of their decisions, health service providers may not be aware of the cost
implications of their recommendations for their patients or of additional exculpatory diagnostic
tests, whether those costs are borne by an insurer or by the patient.
2.1.4 Regulation to address provider moral hazard
One common method to address provider moral hazard is for governments to provide
mechanisms for the regulation of health care providers.62 In recognition of the special knowledge
of cohesive groups of practitioners, legislatures have granted occupational protection,63;64 and
have devolved to statutory bodies the duty of self-regulation to ensure high levels of competency
among practitioners, and the responsibility to protect the “public interest” rather than the
interests of the individual practitioners.63;65 In Ontario66 and in most other Canadian jurisdictions,
the Colleges are governed largely by representatives from the practitioner community. Each
group of practitioners given occupational protection and the duty of self-regulation is called a
“profession” or “health profession”. Individual practitioners are called “health professionals”.
14
A representative statutory scheme is Ontario’s Physiotherapy Act, 1991,13 which
provides, under s.3(2) of the Health Professions Procedural Code, that, “[i]n carrying out its
objects, the College [of Physiotherapists of Ontario] has a duty to serve and protect the public
interest.” The list of duties in subsection 3(1) includes:
… 2. To develop, establish and maintain standards of qualification for persons to be
issued certificates of registration. 3. To develop, establish and maintain programs and standards of practice to assure
the quality of the practice of the profession. 4. To develop, establish and maintain standards of knowledge and skill and
programs to promote continuing competence among the members. 5. To develop, establish and maintain standards of professional ethics for the
members. 6. To develop, establish and maintain programs to assist individuals to exercise
their rights under this Code and the Regulated Health Professions Act, 1991.
The first duty listed, setting qualifications for registration, signals that the regulatory
College itself determines who is eligible to practice as a physiotherapist. The College of
Physiotherapists of Ontario (CPO) requires registrants to have at least a baccalaureate degree in
physiotherapy from a Canadian university or an equivalent foreign institution. They must also
pass an examination approved by the CPO; be a Canadian citizen, permanent resident or refugee
claimant; and, have practised 1200 hours of physiotherapy in the most recent five years.67 To
deny an applicant the privilege of registration, all Colleges are required to proceed through a
rigorous quasi-judicial process laid out in the Health Professionals Procedural Code, with the
right of appeal to an independent tribunal, the Health Professions Appeal and Review Board.68
In Ontario, there are now 26 regulatory colleges for health professionals,66 and the legal
framework for these colleges provides three kinds of protection for the specified occupational
groups.
First, the registered members of the Colleges are granted exclusive use of the titles for
their health professions. This means that only members of a College can hold themselves out as
titled professionals. For example, only members of the College of Nurses of Ontario can call
themselves a “nurse”, “nurse practitioner”, “registered nurse” or “registered practical nurse;”69
only members of the College of Physiotherapists of Ontario can call themselves
“physiotherapists” or “physical therapists.”13
Second, each profession is granted a “scope of practice” that delimits the health services
that members of each occupational group are able to provide. However, unlike the titles, there is
15
overlap of the scopes of practice. Other practitioners, including practitioners who are not
regulated under these sorts of statutory schemes, may be able to offer services that are within the
scope of practice of those professions as long as they do not call themselves, for example,
“nurses”,69 “chiropractors”,70 “physiotherapists”,13 or “acupuncturists”.71
2.1.5 Government involvement
Aside from this sort of regulation of the kinds of professionals who may be involved in
the provision of care, in developed countries, health care markets have a high degree of
government involvement regulation in other areas as well.52 In the final report of the
Commission on the Future of Health Care in Canada,18 Commissioner Roy Romanow said that
“Canadians view medicare as a moral enterprise, not a business venture.” With this rhetorical
flourish, Romanow reflected a general sentiment in Canada that health care is essential to all
citizens, and that federal and provincial governments in Canada and health care providers should
alter the incentives and resource allocations that would result from purely market-based
exchange mechanisms.
One of the most important mechanisms to control health care in this way is the Canada
Health Act17 and the related provincial laws. Under the Canada Health Act, certain federal
funding flows to the provinces and territories if their public health insurance plans satisfy five
criteria: accessibility, portability, public administration, universality and comprehensiveness of
the provincial plans. The institution of a single public payer in each jurisdiction under the third
criterion provides a significant potential – and, given limited financial resources, the need – for
planning to achieve the criterion of universal access by all eligible residents of Canada based on
need for health care rather than the ability of individuals to pay for it. Governments have
therefore defined the providers who are eligible to receive public funding for health care
services. They also have the capacity to influence entry, exit and survival of providers in the
market through various mechanisms such as organizing capital financing for hospitals;
consolidating, amalgamating and dissolving provider organizations through regulation and
legislation;39;40;72 and controlling health professional education policy and funding.

16
2.2 Porter’s model applied to health care markets
Porter’s ‘five forces model’ has been used in this study to look at the structure of the
physiotherapy market in Ontario. In his book that introduced the model, Competitive strategy:
techniques for analyzing industries and competitors,15Porter discussed and illustrated the five
forces with observations about how different combinations of the forces have influenced market
structure in specific situations. However, he argued that each market should be analyzed on its
own terms. In this sense, his model is a generic one that provides a structure for classifying and
analyzing a wide range of influences and interactions in a market, but it makes no specific
predictions about the constitution or structure of any market. In this study, the model is used first
to organize the literature and the theory pertaining to each of ‘five forces’, and then, in
subsequent chapters, to analyze the physiotherapy market.
2.2.1 Outline of Porter’s model
In Porter’s model, sellers are assumed to be constantly tested to manage their revenue and
costs and their continued viability. The amount of a seller’s revenue is the quantity of a good or
service sold times the price per unit of the good or service obtained from buyers. When more
than one good or service is sold, the revenue is the sum of the revenue from each of the goods
and services. A seller’s costs of a good or service can include taxes, the cost of capital assets
used in production, the wages of employees, the costs of marketing, selling and distributing
services, and the costs of providing compensation to buyers when the goods or service turn out to
be substandard. Profit (or “surplus” in the case of NFP organizations) is the difference between
revenue and costs.
Porter argued that the ideal market does not exist; instead there are significant forces at
play, applying pressure on sellers. All sellers need to consider not only such factors as general
economic conditions in a region and the demographics of the potential buyers but more
importantly, five “forces” in a market, and they are illustrated in Figure 2-1.
The specific strength of each of the five forces reflects the structure of the industry, and
their combined effect determines how potentially profitable and therefore attractive the industry
is for new and established sellers. Thus, while in the ideal market no seller dominates to the point
that it, alone or in conjunction with others, can influence the market as a whole, Porter’s model
provides a way, within the first force of assessing the effect of a seller or groups of sellers that do

17
dominate. Similarly, even a dominant seller may encounter limits on its capacity for growth and
profitability in a market if, for example, suppliers have an especially strong position or there is
strong competition from the producer of a substitute good or service.
Of course, as noted above, the regulation of markets or market participants can have a
significant effect on a particular seller, on all sellers, or on the whole market. However, Porter
does not conceive regulators as being competitive threats as the five forces are; rather, a
regulator can influence the strength of the competitive threat of any market participant (other
sellers, buyers, new entrants, suppliers and substitutes).
In sum, the model provides a framework for examining the principal components of a
market in a holistic way, and to link various features of a market and study them as an integrated
POTENTIAL ENTRANTS
1. Rivalry among existing sellers
INDUSTRY COMPETITORS
SUPPLIERS BUYERS
SUBSTITUTES
5. Threat of substitute products
or services
4. Threat of new entrants
3. Supplier power 2. Buyer power
Figure 2-1: Porter’s “five forces” model
POTENTIAL ENTRANTS
1. Rivalry among existing sellers
INDUSTRY COMPETITORS
SUPPLIERS BUYERS
SUBSTITUTES
5. Threat of substitute products
or services
4. Threat of new entrants
3. Supplier power 2. Buyer power
Figure 2-1: Porter’s “five forces” model

18
structure. The five sections that follow, 2.2.2 to 2.2.6 provide descriptions of the five competitive
forces in their generic form along with a consideration of the particularities of health care
markets and some of the key assumptions about how each of these forces works.
2.2.2 Rivalry among existing providers in a market
2.2.2.1 GENERAL CONSIDERATIONS For any seller or potential seller in a market, it is imperative to know the characteristics
of the other sellers in the market. Though in many respects sellers can be expected to be
constantly adjusting to changing market conditions, their characteristics at any one time
represent their organizations’ reactions and their collective reaction to the five competitive forces
as perceived for the present and the future.
Porter said that the result of rivalry among incumbent firms is the use by sellers of
various competitive tactics, including cutting prices, searching for new referral sources,
introducing new services, opening new locations, improving customer service, or strengthening
customer loyalty.
When incumbent competitors are diverse with different goals and different strategies to
achieve those goals, Porter said that it may be difficult for individual firms to mimic competitors’
strategies. As an example of the effect of divergent goals, Porter cited owner-operators of small
service firms who may value independence, control and quality, to the extent that they are
willing to accept a lower rate of return on their investment than shareholder-owned firms.
Because of the fundamentally different approaches to market, the shareholder-owned firms may
find it difficult to match the strategies of the owner-operators, and vice versa.
While Porter’s model permits the examination of the goals of incumbent providers with
the assumption that each acts strategically differently from all others, Porter also argued that
within a given industry, it is possible to identify groups of firms – he called them “strategic
groups” – that use similar approaches to the market and to competition. He suggested that
differences among the groups might be drawn on the basis of each group’s choices of such
strategy elements as the degree of specialization by product, customer segments or geography;
service quality or price or cost management; and vertical or horizontal integration. He also said
that once firms in an industry divide into strategic groups, members of a strategic group begin to
resemble one another in more than in strategy; they are also likely to have similar market shares
and respond in similar ways to external events. This echoes the work of Hotelling73 who argued
19
that rather than producing differentiated services, sellers that congregate with others in densely-
populated areas will tend to mimic the service offerings of each other to maximize the likelihood
that the next buyer will be attracted to them rather than to others.
Each strategic group may differ from the others in their bargaining power with suppliers
and buyers and the threat of substitutes. The extent to which these groups differ, though, depends
on a number of factors including whether their customer targets overlap or whether they can
differentiate their services.
This study adopts and develops the concept of strategic groups of providers, primarily
defined in terms of profit orientation (FP and NFP) because a substantial part of the public
dialogue about health care in Canada has centred on the relative merits of FP and NFP delivery
of health care. These discussions and debates largely hinge on perceptions of the motivations
attributable to corporate form and profit orientation and perceptions of how different providers
will act towards each other, towards patients, and towards payers or revenue sources, as a result
of those motivations. The attributes of providers’ corporate forms and orientations to profit are
commonly seen as having significant descriptive or predictive power and the first research
question in this study centres on these distinctions. The hypothesis that is tested in relation to FP
and NFP providers reflects the organization economics and health services literature, reviewed in
sections 2.2.2.2 to 2.2.2.5.
2.2.2.2 TRANSACTION COSTS THEORY AND AGENCY THEORY Two strands of organization economics provide the context for using providers’ corporate
form and profit orientation to distinguish strategic groups. While sometimes seen as in conflict,
the two strands can function together to describe and explain market phenomena and behaviour
patterns.59;74;75
The first strand of organizational economics is transaction costs theory, which provides
insights into organization types, or as Williamson puts it, into the most effective “governance
structures.”76 The unit of analysis for transaction costs theory is a transaction, and the
characteristics of the predominant transaction under consideration give rise to an investigation of
the optimal organizational structure for that transaction. The governance structures for
transactions range from market-based (for example, explicit contracts between corporations or
other organizations for each or all transactions) to hierarchy (for example, using authority and
fiat within an organization to facilitate transactions), with “hybrids” between the two poles. In
health care markets, various transactions can be the subject of study. For example, the production
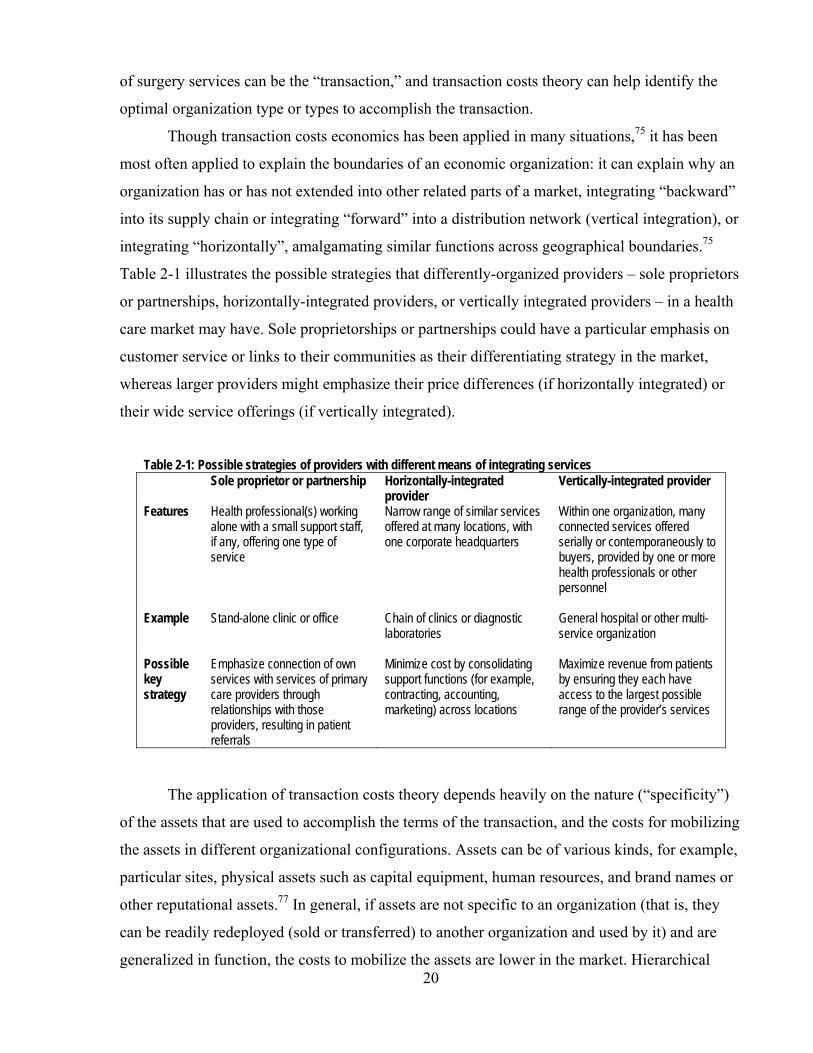
20
of surgery services can be the “transaction,” and transaction costs theory can help identify the
optimal organization type or types to accomplish the transaction.
Though transaction costs economics has been applied in many situations,75 it has been
most often applied to explain the boundaries of an economic organization: it can explain why an
organization has or has not extended into other related parts of a market, integrating “backward”
into its supply chain or integrating “forward” into a distribution network (vertical integration), or
integrating “horizontally”, amalgamating similar functions across geographical boundaries.75
Table 2-1 illustrates the possible strategies that differently-organized providers – sole proprietors
or partnerships, horizontally-integrated providers, or vertically integrated providers – in a health
care market may have. Sole proprietorships or partnerships could have a particular emphasis on
customer service or links to their communities as their differentiating strategy in the market,
whereas larger providers might emphasize their price differences (if horizontally integrated) or
their wide service offerings (if vertically integrated).
Table 2-1: Possible strategies of providers with different means of integrating services Sole proprietor or partnership Horizontally-integrated
provider Vertically-integrated provider
Features Health professional(s) working alone with a small support staff, if any, offering one type of service
Narrow range of similar services offered at many locations, with one corporate headquarters
Within one organization, many connected services offered serially or contemporaneously to buyers, provided by one or more health professionals or other personnel
Example Stand-alone clinic or office Chain of clinics or diagnostic laboratories
General hospital or other multi-service organization
Possible key strategy
Emphasize connection of own services with services of primary care providers through relationships with those providers, resulting in patient referrals
Minimize cost by consolidating support functions (for example, contracting, accounting, marketing) across locations
Maximize revenue from patients by ensuring they each have access to the largest possible range of the provider’s services
The application of transaction costs theory depends heavily on the nature (“specificity”)
of the assets that are used to accomplish the terms of the transaction, and the costs for mobilizing
the assets in different organizational configurations. Assets can be of various kinds, for example,
particular sites, physical assets such as capital equipment, human resources, and brand names or
other reputational assets.77 In general, if assets are not specific to an organization (that is, they
can be readily redeployed (sold or transferred) to another organization and used by it) and are
generalized in function, the costs to mobilize the assets are lower in the market. Hierarchical
21
methods of mobilization (for example, exercise of hierarchical authority within a corporation)
are not required for readily redeployable assets and contracts between organizations can facilitate
the transaction. Furthermore, if the transaction in question relies on a local manager servicing
local needs in a way that is not easily monitored and observed (that is, it is costly to do so), it is
less likely that hierarchical (corporate) organization is optimal.78;79 Consequently, the best
governance structure where assets are readily redeployable and local managers add considerable
but unobservable value is towards the market end of the spectrum rather than at the hierarchy
end.80 In a health care market, this might translate into a predominance of solo practices and
small partnerships rather than large corporate organizations organizing the provision of care to
patients, despite generalized expectations that economies of scale result from consolidation into
larger organizations.
Researchers using transaction costs theory have also investigated contractual
relationships of labour input to the production of a good or service, for example, the role of
labour unions and the phenomenon of worker co-operatives and partnerships. The costs of
monitoring a labour input contract are higher when the contribution of skilled individuals to a
service is hard to monitor or, when individuals work in teams, it is hard to assess individual
efforts. In such cases, it may be advantageous for the team members to monitor one another, with
the assistance of professional standards and a partnership may be more conducive to such a
situation than a corporation.81
Of course, other features of the transaction, such as regulatory requirements, the
involvement of an insurer, or the need to integrate care with other more specialized services
might change the nature of the transaction and its costs to the extent that a more hierarchical or
more market-based governance form might be preferred.82
In general, advocates of transaction costs theory insist that the theory can generate
predictions about organizational form.75 However, because of measurement issues (how to
measure asset specificity, for example) and the importance of institutional context83 – including
the technical, political and cultural features of particular industries82 – transaction costs theory
has generally been applied in single-industry studies where concepts such as asset specificity can
be applied in a relative rather than quantified manner and the context can be explored in
detail.83;84 Thus, transaction costs theory may provide some impetus for forming hypotheses, but
it may be more likely to provide explanations of phenomena uncovered by empirical work.

22
The second strand of organizational economics, agency theory, was touched on
previously in the discussion of the asymmetry of information between patients and health care
providers. In the context of defining strategic groups, aspects of agency theory are applied to
both the corporate form and the profit orientation of different types of provider organizations.
An agency relationship exists when a person or group (the principal) has entered into a
relationship with another person or group (agent) in which the principal relies on the agent to
accomplish certain objectives. The relationship is governed by an implicit or explicit contract.
Agency theory assumes that the principal and the agent each endeavour to maximize their own
different goals. The principal may be satisfied with the outcome of the agent’s pursuit of
different interests, but if not, may attempt to limit the degree of difference by establishing
contractual incentives to align the agent’s interests with the principal’s or by monitoring the
agent’s activities, but in both cases, the agent’s attempts may be limited by the costs of
incentives or information gathering compared to the benefits.85 The principal may also be
assisted by regulations that also align interests through incentives or monitoring.
A FP corporation has three groups of actors* whose actions can be analyzed using these
concepts: the shareholders, who have invested money in return for a share in the profits of the
company; the board of directors, elected or appointed by the shareholders to “supervise the
management of the business and affairs of a corporation;”87;88 and, the management, who are
delegated the responsibility to manage the business affairs of the corporation.89;90 There are two
agency relationships established: between shareholders and board, and between board and
management.
In a private NFP corporation, there are also three groups of actors, though it is
“members” rather than shareholders who elect or appoint the board (there are no shareholders),
and instead of a right to share in profits, they have a right to establish the general objectives of
the corporation.91;92 A government may also operate in a market on a NFP basis but through a
department (or ministry) or public agency rather than as a private NFP corporation. In such a
case, the role of the shareholders (or members) and the board are combined in a government
Minister. In general, NFP corporations’ or government departments’ theoretical agency problems
are similar to those in FP corporations.
* Stakeholders in an organization – its employees, customers, suppliers, its community and the general public – may
also be seen to have contractual or quasi-contractual expectations of the organization; consequently, they may suffer from the agency problems described here.86

23
In a FP corporation with shares traded on a public stock exchange, the shareholders,
board and management are expected by agency theory to have discordant interests. The
management are expected to pursue strategies that deliver the most benefits – for example,
income, perquisites, reputation – that they value and that decrease the corporate value left for
distribution to the shareholders.85;93 The board of directors may have narrower interests than the
body of shareholders. Shareholders may have, in addition to a short-term interest in the flow of
profits to themselves, an interest in the longer-term success of the organization.82 This may
require that earnings that would otherwise be available as dividends payable to shareholders be
retained within the organization to finance capital projects and expansions internally.
The shareholders in such a corporation are generally diverse, with few if any of them
having the capacity to monitor closely the interests and motivations of the board of directors or
the managers of the corporation. Thus, they rely principally on an outcome measure of the
corporation – the level of profit distributed to them or the increase in value of their individual
shares94 – and their principal remedy is their right to sell their shares if the management and the
board to do not produce the return on their investment that matches their expectations.77 The
board exercises oversight of management actions, and endeavours to align the performance
incentives for management with the board’s objectives. This can be through profit-sharing,
bonuses, distribution of shares, or pay for performance.85 The degree to which the board (the
principal) can monitor the activities of the management group depends on the quality and
quantity of information the board receives and uses, and the information they can derive from
advisors, such as independent auditors.
In a corporation with few shareholders, or where there is overlap between membership of
the board and the management of the corporation, or where a government Minister provides the
direction to a department as a board would in a private corporation, the information flow
between the board (or Minister) and the management is likely enhanced. With the information
that is available to them, the shareholders of the corporation (or Minister) can exercise influence
on the behaviour of the management, rather than depending more exclusively on the outcomes of
management behaviour.81 Alternatively, Williamson argued that, given managers’ superior
information and power in the operation of an organization, shareholder interests would be
subordinated to managerial objectives as management representation on a board increases.93 In
either case, a greater coherence of the interests of the shareholders, the board and the
24
management is expected in these kinds of organizations than in FP corporations traded on public
exchanges.
Where the functions of the board and the functions of management are merged in the
same person or group, as is the case in a small business partnership or corporation or a sole
proprietorship, there is maximum coherence of interests and the incentives are aligned.
Furthermore, the costs of monitoring are minimal, and unlike the widely-held corporation which
must bear the costs of monitoring management’s activity and the costs of the management’s
pursuit of its own interests,93 these organizations should generally have, overall, lower costs, all
other factors being equal.
2.2.2.3 STRATEGIC GROUPS Reflecting these theoretical perspectives about the structure of organizations, the intrinsic
conflicts and the means commonly adopted to address the conflicts, Deber7 developed a
taxonomy of private FP and NFP health care providers* and described the expected behaviours of
FP investor-owned corporate providers (FP/c), FP small businesses (FP/s) and NFP providers.
Deber’s split between FP/c and FP/s helpfully distinguishes between the different sets of
motivations and interests that may drive investor-owned organizations and small businesses. In
this study, there is a split in the NFP category to distinguish between the pressures and
opportunities faced by NFP Hospitals and those faced by other NFP organizations.
FP/c providers Deber defined FP/c providers as those organizations whose owners have invested in the
organization (shareholders), and who are different from the organization’s managers. Because
the shareholders have a claim to the profits, they can reasonably be expected to demand that the
FP/c organization generate as big a return on investment for shareholders as possible in the form
of distributed profit or increased share value.
To serve shareholder needs, a combination of revenue maximization95-97 and cost
minimization98 (aside from the costs to satisfy management interests and to align incentives) is
the likeliest objective to be pursued. These maximization and minimization objectives are
balanced by concerns for a reasonable organizational reputation over the medium and long terms
to ensure that an organization remains as a credible choice for buyers over time.99
* Deber also identified and described the expected behaviours of public organizations. However, as will be seen in
Chapter 4, section 4.2, there is a negligible number of public providers in the Ontario physiotherapy market. Consequently, they have not been considered a strategic group for the purposes of this study, and are not discussed in this section.

25
One of the key assumptions commonly made by commentators, particularly among those
who advocate for greater private sector FP involvement in health care,100;101 is that FP firms can
– and if given the opportunity, will – supply the same services in the market as NFPs, and vice
versa. Also, given their obligations in relation to shareholders, it is commonly expected that FP/c
providers will do so in a more efficient manner.
These assumptions about same-market competition directly counter the expectations that
flow from the logic of the corporate ownership form and the underlying rationale for FP/c
organizations. Like all markets, some areas of a health care market will provide better
opportunities for higher revenue, lower costs and higher profits than others. Unless a single
organization dominates an entire market, FP/c organizations should specifically seek out the
most profitable opportunities, leaving some unprofitable sub-markets unserved, whether defined
geographically or by the types of patients served. The assumptions about same-market
competition also run counter to some empirical evidence from the United States: FP firms appear
to tend to locate in wealthier, better-insured areas while NFP firms locate in all areas.102;103
The advocates’ assumptions about efficiency – if that means maximizing revenue at the
minimum possible cost – do flow from the logic of a set of assumed attributes of the investor-
owned corporation – profit maximization as the key and compelling goal – though a substantial
body of empirical evidence about efficiency appears to draw into question the universal validity
of the assumptions. A systematic review of the literature in 2003104 showed that NFPs were more
often found to be superior in cost/efficiency, quality, patient access, and the provision of charity
(free) care than FP organizations. These findings appear to align with the problems identified by
agency theory – the difficulty of aligning incentives across the management, the board and
shareholders – in FP/c firms, but as will be discussed, similar problems arise with NFP
organizations.
Starting with the assumption that FP firms provide different services or serve different
parts of a market and do so in different ways than providers with other attributes, there are many
possible implications of the profit-oriented objectives for the day-to-day, year-to-year activities
of FP/c firms. They will likely be the most responsive to competitive pressures so that they keep
or gain market share rather than lose it. They will, where possible, minimize labour costs;105;106
will seek to address needs in the highest-revenue niche markets; will offer more services to
maximize opportunities for cross-selling or for building a reputation for full service; and, will
minimize wait lists for profitable services by ensuring that demand is reasonably matched by

26
supply of services. These implications of the objectives of FP/c organizations form the
foundation for one part of the hypothesis about relative behaviour of these organizations, and are
compared in that hypothesis to the implications arising from expectations of FP/s and NFP
organizations.
FP/s providers FP small businesses (FP/s)7 are owned privately by small business entrepreneurs and are
not answerable to shareholders as FP/c providers are. The businesses may be owned by the
health professionals who personally deliver the organization’s health services to patients as a
sole proprietorship, as a partnership of two or more health professionals, or as a “professional
corporation”,107;108 a partnership with the tax and limited liability advantages of a corporation.
The effect is that the owners typically seek revenue in the market to pay themselves what they
would probably consider a wage rather than a profit,42 and so their desire to minimize costs
(including their own wages and the conditions of their workplace) and to maximize revenue (by
increasing their workload, for example) may be less than for FP/c providers. When the owners
and the managers are the same, the principal-agent problem of owner-manager conflict
associated with the corporate form does not occur.
If FP/s organizations are owned by health professionals, the extensive socialization of the
owners as they became health professionals will colour their decisions about the business and the
way the business is conducted.64;109 Furthermore, since their own licence to practise is constantly
at risk in their business, their approach to the management of the organization is expected to be
different from the approach of those who employ health professionals. Evans42 called
professionally-owned organizations ‘not only for profit’ organizations, arguing that any profit
and revenue maximization efforts would be tempered by the health professionals’ own ideals and
needs including their practice preferences and desires for leisure, for example, as well as by
regulatory constraints to advocate for patients, to work in the best interests of their patients, and
to uphold the quality standards of their profession. Friedson64 extended this concept when he
argued that insurers’ reimbursement or payment schemes premised on appeals to providers’
financial self interest would alone not be effective for these kinds of organizations. He also said
that incentives based exclusively on inflexible (bureaucratic) rules would not work because they
would supplant discretion, which is essential to the self-image and the societal expectations of
health professionals. He argued that payment schemes that appeal to practitioners’ sense of
professionalism would be the most effective.
27
However, as Robinson82 pointed out, businesses owned by health professionals have a
financial value that can extend beyond an individual professional’s retirement: the practice can
be sold or passed on to a family member or business associate. In such cases, the health
professional may have an interest in building up the value of the small business as well as
extracting ongoing profits as income. Consequently, FP/s organizations may have more
“stakeholders”, even if not shareholders, than simply the health professional owner him or
herself, and so FP/s organizations may be seen to incorporate some aspects of the value-building
goals of FP/c businesses.
NFP providers In discussions of NFP firms in the health care industry, the behaviour of NFP
corporations is generally inferred from the behaviours of FP firms rather than described directly
or from empirical data.7 For example, contrast the following statements by Evans, Barer et al.,110
the first about FP providers, the second about NFP hospitals:
(1) “Publicly traded firms have a legal and financial obligation to their shareholders, and to them alone. Claims to a broader social role, education, say, or the advancement of human health and happiness, are usually just corporate image advertising.”
(2) “Hospitals are (so far) strictly not-for-profit agencies; any surplus of revenue over expenditures must be returned to the reimburser or ploughed back into operations…. Whatever motivations may lie behind hospital behaviour, profit is not among them.” [emphasis added]
While FP firms are assumed to be interested in maximizing profit, NFPs are often
assumed to have behaviour that is more altruistic, benefiting consumers or the poor or the
disadvantaged7;111 with increased trustworthiness that comes from not seeking profits.112;113 One
of the reasons why this behaviour is assumed to be so altruistic is that many have a history as
charities, often with religious origins.114
In Canada, NFP firms are exempt from the income taxes that FP firms pay, and they
generally have more favourable treatment for consumption and property taxes. This results in
their net income or profit being higher than a FP firm would have with the same revenue and
other costs. Further, if a NFP firm is a charity, donors to the charity receive credits that reduce
the income tax they would otherwise pay.115 This form of revenue – tax-creditable donations – is
not open to FP firms. Larger NFP firms are also more likely to benefit from donated labour as

28
people volunteer, for example, to greet patients, seek donations, or generate revenue for the NFP
in retail gift shops.
One of the corollaries of these tax and revenue advantages is the “non-distributional
constraint”. Instead of distributing profits to shareholders as FP firms do (there are no
shareholders in NFP firms), NFP firms incorporated federally or in Ontario must use the surplus
of revenues over expenses within their operations.116;117 If a NFP organization is also a charity,
the Canadian federal income tax law generally requires it to use 80% of its net revenues in a year
on charitable activities of its own within two years, or give the equivalent amount to another
charity for the same purpose.118
NFP providers are by definition not necessarily financial profit maximizers, but the
literature comes to various conclusions about the rationale for and objectives of NFPs. Early
work on NFPs119 emphasized that they are more likely to exist when both the government and
private interests have not provided services when demanded by citizens (“government failure”
and “market failure”). More recent work120 builds on evidence that the public supply of goods
often has been fulfilled by NFP firms, and so they may not be so much the solutions for
“government failure” as they are key partners of government in providing services at the
community level. Others agree that NFPs are usually allied with their communities,121 and so the
NFP’s role is to maximize benefits for the community.
Because of the non-distributional constraint, pressures on managers of NFP firms are
usually understood to be different from those that FP managers face, with different results in the
behaviour of the firms in the marketplace. While the beneficiaries of the NFP organization’s
activities may be seen to have a stake in the NFP’s affairs, they are likely to be too dispersed to
provide effective influence and control over the NFP’s board.* Furthermore, because
beneficiaries are widespread, many NFP boards self-perpetuate, with old members
recommending new members who are likely to adopt similar approaches to their role of
monitoring management and providing strategic direction.123
Some see NFPs’ managers as ideally positioned to influence the direction of the
organization without strong beneficiary-stakeholder pressure.82;124 The managers can be
ideological or altruistic entrepreneurs who use the corporate form to achieve social benefits for
the less-well-served and disadvantaged. As a result, NFPs may not pursue profit and profitable
(or commercial) operations as FP providers do125;126 except to the extent that they are necessary * The case of Chu v. Scarborough Hospital Corporation122 is a rare example of community members asserting their
rights and prevailing over a board’s wishes to exclude them from influencing corporate direction.

29
to support unprofitable (or non-commercial) operations,127-129 sometimes at higher quality levels
than other profit-oriented providers can or want to deliver.130 On the other hand, if managers are
opportunistic rather than altruistic, they may structure decisions and operations to maximize their
own interests, including their perquisites, rather than the interests of the intended beneficiaries93
since the members of the corporation and even its board may not be able to monitor the exercise
of managerial discretion in NFP firms.
NFP organizations are not immune from pressures from shareholder-like influences. As
agency theory predicts, stakeholders may require management to be their agents86 – especially
when the information flows and incentives are aligned – leading the management to deviate from
how they would otherwise behave in a market.120 Examples of such stakeholders are physicians
in a hospital130 who have first-rate access to hospital information and who may derive gains
(utility) for themselves by ensuring their preferred services are offered in circumstances
favourable to them; and, predominant donors or funders who have their own preferences,
especially if they sit on the board of directors124 or they have close relationships with
management.
Like a major private donor or stakeholder, once a government funder becomes important
to an organization, it can make demands on the organization that can skew or inhibit its
organizational and cost structure. For example, a NFP might develop an extraordinarily
bureaucratic structure in order to answer the information or accountability demands of its funder,
it might hire different sorts of managers, or it might provide specific services. Alternatively, the
major funder could skew what would otherwise be the NFP managers’ goals.131 Frumkin132
called this “vendorism”.
Though the literature does not come to a consensus on precisely what NFPs do in a
market nor precisely why, it does generally suggest that, as compared to FP providers, NFP
providers will be less attuned to competition pressures because of different organizational goals;
will focus on relatively underserviced, disadvantaged patients with more complex problems (and
therefore may seek out different revenue sources for the care of these patients than FP providers
do); will be less likely to substitute lower-cost providers to prevent a decline in perceived quality
of care; and will be more willing to extend wait lists to ensure other preferences or needs are
attended to, for example, to manage revenue shortages or to generate prestige and esteem (utility)
for sought-after professionals working in them. Where there are major funders or major donors
30
with contrary demands, any of these expectations may be modified according to the funders’ or
donors’ wishes.
Differentiating NFP Hospitals from Other NFPs NFP hospitals form an important part of the Ontario health care market and, collectively,
have significant power. They are unlike other NFP organizations in the health care market, such
as charitable organizations meeting the needs of patients with a particular disease or condition.
Hospitals as institutions have peculiar characteristics, including the fact that a significant part of
their business is generated by physicians who are not employees of the hospital but who run their
practices independently from the hospital and are paid separately.42;50;52;130 NFP Hospitals in
Ontario have a broad mandate to provide a variety of services relating to acute care or other
specialty care. Consequently, they will have the perspective of a complex, multi-service provider
with a substantial infrastructure.
As well, the vast majority of hospital funding in Ontario – 85.8% in 2005 – comes from
public sources, primarily the Ministry of Health and Long-Term Care133-135 whereas other NFP
organizations usually have a wider variety of sources including individual donors, private
corporate donors, government sources and their own operating revenues. Ontario hospitals are
and have been subject to close scrutiny in at least some of the areas of their operations as a result
of their significant position in the health care spending of the provincial government.136-138
Other than their NFP status, in most respects, including those mentioned, NFP hospitals
are different from other NFP organizations in the health care market in Ontario. Therefore, NFP
hospitals will be treated as a separate organization type in this study, distinct from “Other NFP”
providers. However, it is important to note that this study is not of the functioning of entire
hospitals: as a study of the physiotherapy market, the focus is on the physiotherapy or
rehabilitation unit or department of these hospitals, and “NFP Hospital” in this report means that
unit or department. When the attributes of an entire hospital are discussed, the term “NFP
hospital” or “hospital” is used.
2.2.2.4 THE EFFECT OF COMPETITION ON EXPECTED STRATEGIC GROUPS While the differences in providers’ profit orientation and corporate form provide the core
expectations about provider behaviour in a competitive health care market in this study, there are
other factors that may influence provider behaviour. Specific features of individual markets can
also drive differences in providers’ cost and price.82;139 Some research suggests that the
behaviour of NFPs and FPs is converging in some American health care markets with the result

31
that efficiency outcomes of both look increasingly similar.140;141 Some studies show convergence
in revenue-maximizing behaviour,139;142 in price setting,143 in the “race to the bottom”,7;144 in the
use of advanced technology,145 and in the amount of care provided to the uninsured.102;103;146
In most of these studies, convergent behaviours were attributed to competition between
the two types of providers. Exactly how competition induces similar behaviour is not generally
identified. Grabowski and Hirth have provided some plausible explanations147;148 for the
apparent convergence or, as Duggan139 calls it, the “mimicry” of FP behaviour by NFPs, and vice
versa. They suggest that NFPs provide a trustworthy and trusted reference point on quality
(because they are not motivated by profit) for relatively uninformed consumers who are choosing
a provider. More informed consumers may seek out FP providers who provide quality as least as
high as the NFP provider in order to be competitive. Needleman146 argued that there is little
evidence that consumers are aware of the difference between a FP and a NFP provider and so the
information-oriented explanation is suspect, but Spector149 investigated how nursing home
consumers made their choices and found empirical evidence for aspects of Grabowski and
Hirth’s explanations.
A complementary view, using Porter’s broader strategic management perspective, is that
in markets with high levels of rivalry, competitors will tend to converge in their strategy in the
market to survive. Their convergence can result because, based on their strategic decisions, they
have similar degrees of specialization of services, patients, service and quality, price and cost
management, and revenue sources.
Consequently, if FPs’ and NFPs’ behaviour does not fully conform to expectations based
on their orientation to profit, it is possible to look at the role of competition in producing the
patterns.
2.2.2.5 GEOGRAPHY AND THE DISTRIBUTION OF PROVIDERS Most studies of providers’ location decisions start with concepts developed by
Hotelling.73 Adapted to a health care market context, his approach was this: since providers’
location decisions are guided by their desire to have access to patients, they tend to cluster in
densely-populated areas even if they share the market with other providers. Providers have
proximate access to a greater number of people and this addresses patients’ preferences for
nearby providers of the services they need. Over time, as more providers enter an area, the
density of providers becomes greater until the proportion of patients for each provider starts to
32
decline below an acceptable level for profitability or sustainability. As that occurs, providers
start to look to other, smaller markets in which to locate.52
Several studies in the United States have found that there are few differences in aggregate
access to care within a region that has both FP and NFP provider organizations. However, FP
provider organizations tend to locate in areas that are wealthier and have a greater proportion of
insured persons than the areas NFP providers locate in. Access to the services offered by those
providers therefore varies between areas.102;103;141;150
Expectations about the distribution of health professionals before all areas are saturated
depend upon how the resource is viewed. The distribution of supply of specialist services
requiring a critical mass for viability in a local market should be skewed toward larger markets
encompassing academic health centres with their highly-specialized services.38;151 Practitioners
in academic centres can draw patients across boundaries, resulting in a lower density in
contiguous regions than in both the academic centres and all non-contiguous regions, much as
reported by Rosenthal, Zaslavsky & Newhouse152 with respect to physicians. If health human
resources are distributed based on patient need and not in response to market conditions as
Hotelling described, the number of health professionals would generally be proportionate to the
population in different regions, assuming similar needs and some minimum number of patients
within reasonable distances that make it viable for a critical number of mutually-supporting
professionals to locate in an area.
Tepper et al.153 studied the distribution of general physicians in Ontario, and found a
number of factors that appear to explain patterns of distribution. In the face of homogeneity of
price, they found that general physicians tend to locate in urban rather than rural locations and in
larger centres in remote regions (that is, in areas of northern Ontario). When faced with choices
from among densely-populated areas, physicians’ personal preferences also entered into the
decision-making about location, for example, wishing to be close to the educational institutions
where they trained.
2.2.2.6 RESEARCH QUESTION 1 AND HYPOTHESIS The first research question centres on the different behaviours of FP and NFP health care
providers, and the hypothesis tested in this study reflects the motivations of providers with
different corporate forms and profit orientations described in organizational economics and
health services literature.

33
Research Question 1: Do provider organizations supply a health care market
differently according to their FP and NFP status and their corporate form?
Hypothesis 1: FP/c provider organizations, as compared with NFP provider
organizations, are more likely to:
(a) substitute lower-cost practitioners;
(b) concentrate in larger centres rather than in all areas;
(c) serve higher-revenue niche markets or niche markets with lower
administrative burden;
(d) perceive greater levels of competition;
(e) offer a wider variety of services in addition to physiotherapy services;
(f) serve patients with less complex problems; and,
(g) have shorter wait lists.
Provider organizations operated as small businesses (FP/s), because they are
‘not only for profit’, will, in general, fall in between FP/c and NFP providers.
The NFP Hospitals and Other NFP strategic provider groups will resemble
each other in most respects but will differ on (e). Because of their institutional
mandates, NFP Hospitals will offer a wider variety of services than all the
other strategic provider groups.
2.2.3 Buyer power
2.2.3.1 GENERAL CONSIDERATIONS Porter argued that buyers can have a significant effect on the level of competition in an
industry and on the strategies that firms use to succeed. In a real sense, buyers are competing
with providers over the allocation of resources – do those resources remain in the buyers’ hands
or do they transfer to the providers’ hands? As will be seen in later chapters, the exercise of
buyer power in Ontario’s physiotherapy market has influenced behaviours of providers.
An assessment of the power of buyers and their resulting effects in a health care market
involves a consideration of the role of insurance. Insurance isolates patients from all or part of
the influence that price may play in their demand or need for health services,154 and tends to
substitute insurers as ‘bulk buyers’ of those services. Insurers’ power, therefore, is a critical
element in understanding the structure of a health care market.

34
2.2.3.2 PUBLIC AND PRIVATE INSURER/BUYERS Some of the literature seeks to demonstrate how public insurers and their policies differ
from private insurers and their policies. For example, in Marmor’s expert report155 used for the
Supreme Court of Canada proceeding Chaoulli v. Québec (Attorney General),156 he emphasized
the “different logic” of private and public health insurance arising out of private insurers’
reactions to market forces and of public insurers’ reactions to other forces. Others have identified
that patients with similar conditions may be entitled to different treatments depending on
whether they have public or private insurance.157-160
There is a need to consider not only differences within the public insurance schemes and
the private insurance schemes but the effect that different schemes can have on each other. In
most health care markets in developed counties, private and public insurance policies or schemes
co-exist. Tuohy, Flood & Stabile21 developed a typology of common variations in the mix of
public and private insurance:
1. Parallel public and private systems – the same services are insured publicly and privately in a health care market
2. Co-payment – services are partly insured publicly and partly privately 3. Group-based – public insurance for health services is available to some population
groups and private insurance is available for the others 4. Sectoral – certain health care sectors, such as hospitals and physicians, are insured
publicly, and the others are privately insured. This emphasizes that it is important not just to have regard to the individual buyers in a
market but also the mix for each of these public/private mix types can provide a different array
of pressures on sellers. In parallel and group-based systems, for example, there are by definition
more buyers, formed around each of the public and private insurance streams, or around the
groups. This means that there are more buyers in total buying from each provider than there
would be with only one monopsonist buyer. In consequence, each buyer’s power should be lower
across the market and in relation to each provider. If providers choose strategically to target their
sales only to public or private insurers or to one group of patients or another, and the number of
buyers remains constant, the buyers’ power increases in relation to each provider and to each
strategic group of providers.
2.2.3.3 A SINGLE PAYER VERSUS MULTIPLE PAYERS One of the most commonly cited advantages of the Medicare insurance scheme for
medically-necessary hospital and physician services under the Canada Health Act4 is that it is
not only publicly administered, but there is a single government payer in each of Canada’s

35
provinces. The advantages of a single payer include the power of monopsony, that is, the power
to affect prices in the market.2;18;42;161 There can also be lower administrative costs within a
single payer system, and with a monopsony, the marketing costs that would be necessary in a
multi-payer system, need not be incurred.35;162;163
But even if there are multiple buyers, it is possible for individual buyers to have a
significant effect on price. The pervasive presence of health insurance creates ‘collective’ or
‘bulk’ buyers of health services – the insurers – whose power can be greater than the sum of the
power of the individual purchasers. From among those collective buyers, the more market share
such a specific buyer has or a group of buyers have, the more influence they may have.164;165
Glazer and McGuire166 described the way a (public) payer in the United States with a large but
minority market share was able to continue paying lower fees while other payers in the market,
without the market power to insist on the same fees, paid more. At the same time, they argued,
since providers are not as a practical matter likely able to administer and deliver two levels of
quality, there was unlikely any differentiation on quality in the market, and the payer secured as
high a quality level as the other payers in the market. They called this a “free ride” for the payer
since it enjoyed a cost advantage with relatively no effort and no diminution in quality.
The obverse of free-riding by buyers is “cost shifting” by providers. In the face of low
prices paid by one buyer, it is common, at least for large providers, to cost shift, that is, take fees
from one payer and internally cross-subsidize services provided to another payer’s
patients.154;167-169 This cost shifting may not be as common in smaller providers’ operations as
their scope for doing so can be more limited.170 But for current purposes, it is important to recall
that this practice reflects the power of low-paying buyers over providers: the buyers take
advantage of the willingness of the providers to accept the lower price either because the
providers need all revenue sources to survive or they insist on treating patients whose care is, in
the eyes of the providers and the patients, undervalued by the buyers. If there is a requirement for
a provider organization to engage in internal cost shifting or a financial requirement to ensure
adequate flow of revenues from all sources, the structure of the market may be seen generally as
imposing a requirement on providers to facilitate a “social pooling of health risks”171 and costs.
Some researchers have argued that providers may not actually be able to respond to the
complexity of multiple buyers, each with different objectives and fee structures in place,
especially if the objectives or structures are contradictory94;166;172 and costly to administer and
comply with.173 The inability of providers to respond to complexity may depend on the size of
36
the provider’s organization and the degree to which buyers bring their payment rules into line
with each other or make efforts to streamline their requirements for billing. Providers may react
‘irrationally’ – that is, not respond to incentives that are actually in line with their own strategy
and profit objectives – because they find the burdens of accommodating multiple buyers’
demands too great.
2.2.3.4 REVENUE SOURCES – TERMS AND CONDITIONS Buyers, particularly insurers, are likely to address consumer and provider moral hazard in
a number of ways other than simply by negotiating or setting fee levels. They may seek
assistance through political means, for example, by lobbying a government for assistance
through regulation or de-regulation and if successful, they may enjoy greater power in relation to
moral hazard through these indirect means. Alternatively, they may consolidate their buying
power within their organizations and provide health services directly rather than paying others to
provide them. Thus, through hierarchical means within their own corporation,80 they could
endeavour to control provider moral hazard. However, the more common mechanism for trying
to deal with consumer and provider moral hazard is through contracts with consumers and
providers, constructing a payment or reimbursement scheme that contains the terms and
conditions under which they will pay for health services.
There is a broad consensus in the literature42;50;52;82;94;172 about the effect of various
aspects of payment schemes even if there is no consensus on what might be most effective in
specific circumstances. Drawing on these sources, Table 2-2 outlines the most common terms
and conditions, which Robinson94 called the “structure” of payments. Each of these features
individually or in combination with others provides incentives or exerts pressure in varying
degrees on patients or providers in addition to the pressure that the fee level can have. In the
United States, different patterns of payment structures have been observed between public and
private payers.166 The dominant public payer, Medicare, sets prices for specific services and pays
any provider that wishes to supply the services the established prices. On the other hand, private
payers tend to negotiate prices with providers, and they may pay a different fee to different
providers for the same service for similar patients.
The limits of the exercise of buyer power through payment schemes There are limits to the effect of the terms and conditions in payment schemes. For
example, the principle of patient choice is enshrined in legislation for some public and quasi-
public insurers, and others recognize the principle as well.174;175 To the extent that the principle is

37
Table 2-2: List of terms and conditions commonly found in health insurance policies42;50;52;82;94;172 General features Comments
Remedies for consumer moral hazard Deductibles Patient pays first portion of the health care cost, sometimes at the time of
treatment; insurer pays the balance Reductions in the use of health care are observable and fall disproportionately among poorer and sicker patients176-179 Providers may absorb the deduction or co-payment May be more difficult for providers to collect payments from patients than insurers
Co-payments Patient pays a percentage of the health care cost, sometimes at the time of treatment; insurer pays the balance
Maximum payment limits
Insurer reimburses health care costs up to a maximum May be different limits for categories of health services
Insurer limits total potential liability providing more certainty about costs and protection against future fee escalation Does not address potential issues of inappropriate care, just total cost Allows greater stability of price for insurance product
Conditional cover Insurer covers claims (losses) if patient fulfills conditions such as cooperating in health services
Insurer can hold patient accountable to mitigate his or her loss
No claims bonus Insurer reduces insurance premium if patient claims no benefits over a certain period
Patient has an incentive not to claim benefits even if the insured risk materializes
Remedies for provider moral hazard Provider screening
Insurer reimburses only if health care provider meets a minimum standard (e.g., registration as a health professional) or patient is referred for treatment by a health professional, usually a physician
Insurer depends on the health professional regulatory scheme
Selective contracting
Insurer reimburses only if care is provided by a provider it has contracted with in advance as part of a formal or informal preferred provider network Insurer may negotiate reporting requirements
Insurer takes more responsibility (and has more, contractual rights) for monitoring the health care, but the right to modify the relationship with the preferred provider comes only periodically
Preapprovals Insurer reimburses only if the health care provider has submitted a treatment plan that the insurer agrees to reimburse
Insurer has contractual rights to approve and deny its obligation to pay for certain care Insurer’s right is usually subject to review or appeal, though these mechanisms may be costly for a patient
Practice guidelines
Insurer encourages health care providers to provide care in accord with what experts have decided is best practice
Practice guidelines may not affect the patterns of practice180;181 Can be tension between buyers’ attempt to control the clinical practice of providers182 and the strong norms and traditions of clinical autonomy; tension may mean that a buyer’s attempt to exercise power is defeated.183;184
Protocols Insurer reimburses only if the health care provided is in accord with a standardized protocol or clinical pathway, devised by experts as best practice
Insurer ‘preapproves’ all care provided under the protocol May be a mechanism for consideration of deviations from the protocol (e.g., preapprovals or less remunerative fees) See also comments re Practice guidelines

38
Reporting requirements
Insurer has a right to require the health care provider to provide reports on treatment and patient progress
Insurer has more contractual rights to monitor care as it is provided Costs of monitoring every claim may be considerable
Independent examinations
Insurer has a right to require the patient to be examined by a health professional who has an objective perspective (i.e., no therapeutic relationship with the patient)
Insurer enhances the information it receives to make more fully-informed decisions about contesting care or costs of care
Maximum payment limits
See above, under Remedies of consumer moral hazard
Prospective payment systems
Insurers pay pre-specified amounts for health care for specific conditions or patients Includes global budgets (annual payments for all services for a defined population); capitation (annual payments for all services for each person); program fee (payment for all services for a specific condition)
Insurer limits total potential liability by claim type Providers assume risk that the cost of required care will exceed the insurer’s payment, but also gain if necessary care is less costly than insurer’s payment Insurers have the costs of monitoring risk that providers will not provide care as envisioned (i.e., underprovide or provide at a lower quality) Provides an incentive for providers to be efficient in care provision
Pay for performance
Insurer pays an agreed amount when a specific service is provided Insurer pays only when specific health are procedure(s) provided within a specific timeframe treatment.138;185;186 Works best if services are easily defined and measureable,7;187; is more complicated or impossible if services are complex and need to be coordinated across providers.173
Pay for outcomes Insurer pays an agreed amount for a specified improvement in a patient’s condition
Insurer pays only when the health care has had an intended effect 188;189 Subject to significant problems specifying indicators of improvement in advance when patients are not identical or causal links are tenuous other.190 Unknown whether these mechanisms can be successful unknown.191
Practice profiling Insurer aggregates information about provider performance into a practice profile and reports it
Performance judged by provider’s peers or patients; may promote self-reflection and improvement in provider improve.192 Insurer may identify outliers for focused attention193

39
preserved and honoured, patients (potentially with the assistance of their own chosen health
service providers) may not decide to receive services from a provider that is in an insurer’s
preferred provider network or from a provider that does not respond fully to an insurer’s terms
and conditions. Moreover, insurer/provider relationships are not static and regulatory activity can
ameliorate or disrupt these relationships. Insurers’ reactions to provider behaviour can range
from published changes to the structure of their payment schemes, to changes in emphasis or
activities of their adjusters, or nothing at all.
Providers may react to changes that insurers make to their payment schemes. Providers
can adjust their internal processes and accounting practices to continue to benefit from a payment
scheme even if it is changed by an insurer.194 They can also modify their service offerings to
accommodate fee structures. The intensity of service can change, for example, based on the
relative generosity of each source of payment195 or whether the fee is paid per capita, per
service196 or on a global basis. Providers can also reduce the service provided to each patient but
increase their total number of patients to avoid overall revenue loss.197 Providers can also adjust
the array of services they offer in order to maximize the benefit of a fee structure, or they can
systematically select patients whose care is better remunerated by an insurer, relative to the
patients’ conditions.198 On the other hand, changes in payment practices may have no perceptible
effect at all when the market is complex and multiple factors are at play.199
Thus, while buyers may desire certain outcomes and design payment schemes to achieve
them, providers’ behaviours, preferences and capacities may limit the achievement of the buyers’
goals.
2.2.3.5 RESEARCH QUESTIONS 2 AND 3 AND HYPOTHESES The second research question in this study addresses public and private payers and the
degree to which they are different in their approaches to a market and to the providers in that
market. The hypothesis that is tested in this study in relation to this question flows from the
literature reviewed here.
Research Question 2: Are public and private payers in a health care market
similar or different in their approach to and relationship with providers, and what
effect do they have on the supply of services in a health care market?
Hypothesis 2 (a): Private payers are more attentive to cost control and use
different approaches to paying providers than public payers. (b) However,
40
multiple payers in a market have less control over costs and over the supply of
services than when there is a single payer.
2.2.4 Supplier power
2.2.4.1. DISCUSSION Suppliers of inputs can provide a significant influence on an industry, especially if the
inputs are in short supply or are demanded by other eager buyers. Three categories of suppliers
are important in health care markets: suppliers of equipment, technology and services, suppliers
of labour, and suppliers of patients.
If the suppliers of certain equipment or technology are few in number and the costs of
developing and manufacturing the equipment or technology are high, suppliers are able to apply
significant pressure in terms of price, quality and terms. On the other hand, if the inputs are
widely available or relatively inexpensive to duplicate, the power of suppliers is less.
The power of suppliers of labour to a market depends on their individual and collective
strength, which in turn rests on several factors including their historical and traditional place in a
market and the degree to which they hold a monopoly position in the supply of therapeutic
expertise.42;64 In particular, though, the regulation of the terms of entry of health professionals
can result in significant pressures in a market if the supply is constrained. As well, the exclusive
or overlapping rights of various regulated health professionals can have a significant effect on
the latitude that buyers have to engage different labour suppliers. Exclusivity of rights brings
monopoly power; overlapping rights – which was seen in Section 2.2.4 to be possible in
Ontario’s regulatory scheme – mean the power of certain professionals will be less than
monopolistic.
In addition to these regulatory protections, a common method for a group of labour
suppliers to gain legitimacy and power in a health care market is to acquire collective bargaining
rights under general labour laws. The issue of collective bargaining rights, since it is driven in
Canada by an expressed demand for them by a group of employees,200 must be examined in
terms of the conditions of a particular market.
Providers whose work forces are unionized may have less flexibility in acquiring and
shedding labour and therefore face different competitive pressures than those whose labour
suppliers are not organized. Also, some providers may be constrained in the types of
practitioners they must employ: for example, as a result of labour contracts, funding
arrangements or statutory or regulatory requirements, they may have an obligation to employ

41
registered health professionals with circumscribed labour market entry criteria, tasks and
responsibilities. They will face different competitive pressures than other providers who do not
have those constraints, especially if there is a shortage of suppliers.
Professionals who are not employees can also exert considerable pressure if they are in
short supply: they can demand and get higher compensation from sellers in return for providing
their professional services to encourage them to stay and not move to other organizations or
jurisdictions.
While models of professional self regulation are widespread in health care markets, the
extent of controls on entry and each profession’s exclusivity of title and scope of practice, and
the resulting potential for power of the labour suppliers in a market, must be assessed on a
service-by-service, profession-by-profession, jurisdiction-by-jurisdiction basis.
Finally, the issue of supply of patients may be significant in a market. In some settings,
such as hospital emergency departments, supply of patients is not generally contingent on
referrals from health professionals. In fields such as physiotherapy, access to patients may be less
certain since physiotherapy services are less often patients’ entry point into the health care
system and more often are services that follow on from initial consultation with a physician or
from a hospital stay. In such cases, developing the patterns of referral from upstream sources can
be a source of pressure from suppliers. Revenue sources can also be influential as sources of
patients if they have a right to direct their insured customers to health care providers. If health
professionals have the right to treat patients directly rather than only upon referral, however,
other health professionals and revenue sources are less influential.36;42;64
2.2.4.2. RESEARCH QUESTION 3 AND HYPOTHESIS The third research question centres on the effect of labour suppliers and suppliers of
patients have on providers.
Research Question 3: What role do the supply of labour and the pattern of supply
of patients to health care providers have in the structure of the provider
organizations in a health care market?
Hypothesis 3(a): Labour suppliers exert much pressure on provider organizations
if they are in short supply and have exclusive rights to supply the market.
(b) There is little effect of referral sources on providers if patients have direct
access to the providers.
42
2.2.5 Threat of new entrants
The fourth force facing sellers in a market is the threat of new entrants. New entrants can
threaten incumbents’ market shares; they can disrupt established patterns in a market, imposing
costs on incumbents; and they can introduce innovations that displace incumbents’ advantages
and competitive strategies.
2.2.5.1.CONTESTABILITY OF MARKETS The extent of the threat of new entrants depends on the nature of the market’s entry and
exit barriers. Baumol, Panzar and Willig201;202 called an ideal market with costless entry and no
unrecoverable costs upon exit a “perfectly contestable” market in which the threat new entrants
would be continuous and strong. According to their contestability theory, the effect of the threat
on incumbent sellers in a market would be as great whether new sellers actually entered a market
or not.
In real markets, perfection does not exist, but most markets are contestable to some
extent. In general, entry of new sellers is common across all industries, though survival rates are
not generally as high as entry rates, and the survival rates of new entrants are generally lower
than those of incumbents.203;204 It is the different degrees of contestability in a market that
influence the competitive pressures that incumbent sellers face and have as much or more an
effect on incumbents’ survival in a market as on new sellers’ entry.203;204 Thus, the higher the
contestability of a market, the greater are the entry rate of new providers and the exit rate of
incumbents; conversely, in a market with low contestability, the entry and exit rates will be low.
Survival will be lower in a highly contestable market, and higher in a less contestable market.
Drawing on the organizational economics literature, Preker, Harding and Travis205
developed the concept of contestability specifically in relation to the “production characteristics”
of health care markets. They considered contestability both of inputs to a market (for example,
labour and supplies) as well as of the production process. Table 2-3 illustrates their concept.
Requirements for highly skilled labour indicate low contestability; the possibility of the
use of unskilled, more easily redeployable labour means high contestability and low entry and
exit barriers. With respect to production, ambulatory care is categorized as highly contestable
and inpatient care is categorized as having medium contestability. While both require qualified
personnel, the premises required for ambulatory care are less costly to establish and more easily

43
redeployed to other uses by others upon exit than the premises required for inpatient
accommodation and treatment.
Table 2-3: Characteristics of inputs and production in health care markets: examples of high, medium and low contestability
High contestability (Low entry and exit barriers)
Medium contestability (Medium entry and exit barriers)
Low contestability (High entry and exit barriers)
Inputs Unskilled labour Retail of drugs and equipment
Skilled labour Wholesale of drugs and equipment
Highly skilled labour Production of drugs and high technology equipment
Production Ambulatory care Routine diagnostics
Inpatient care Coordinated care Public health interventions
Care involving high technology
Adapted from Preker, Harding & Travis205
Such features of a market as monopoly market power and geographical advantages of
incumbents increase costs of entry and reduce contestability of the market. Favourable locations
occupied by incumbents, government subsidies, the need to learn through experience in the
market, and general long-term contracting practices also reduce contestability of a market and
therefore reduce the competitive pressures from new entrants. While neither the sheer number of
incumbents nor the concentration or density of sellers in a market appears to have an effect of
reducing entry rates or making entry more difficult, they can make exit a more likely outcome
for new entrants than for incumbents.203
In a contestable market, it is likely that, as has been seen in the United States, the FP
providers tend to increase in size,42 moving toward greater scale as a means of survival204 and
greater success in the market. In such circumstances, the number, proportion and importance of
smaller provider organizations, especially those that are owned by health care professionals,
decrease.42
2.2.5.2 GOVERNMENT POLICY Government policy can also limit entry through mechanisms such as regulation or policy
preferences.15 In a hospital market, for example, a government’s general preference for not-for-
profit (NFP) firms or a requirement for providers to provide relatively unprofitable services
could be significant barriers to entry for for-profit (FP) firms. Furthermore, governments may
decrease contestability by imposing licencing requirements for facilities in which services are
provided or may require individual service providers to be licensed and regulated.
44
There are two additional and significant areas of government policy and regulation that
should have a significant effect on the level of threat of new foreign entrants in Canadian health
care markets: a significant general policy orientation against the commercialization of health care
markets and international trade treaties.
In Commissioner Roy Romanow’s statement18 that “Canadians view medicare as a moral
enterprise, not a business venture,” he summarized the general views of those who oppose the
commercialization of health care in Canada, and whose sentiments on this subject echo the
winning side of the fight for Medicare – the public rather than private insurance of hospital and
physician services – in the 1960s and 1970s.206-208 Commercialization in this context means the
opening of parts of the health care system to private FP funding or delivery of the health care,
with allocation of resources decided through market mechanisms rather than centralized
bureaucratic mechanisms. Others call this “profitization”.29
While there is considerable private financing of health care in Canada – 30% is privately
financed across Canada, 31% in Ontario209 – and while private delivery of health care
predominates through NFP hospitals (in Ontario) and FP/s medical practices,7 there is a
predominant policy orientation in support of “public” health care and against “private”,
particularly FP/c, health care,18;210 and advocates of increased commercialism are clearly in the
minority.
For example, in 2005, the Alberta government issued a draft policy framework called
Getting on with better health care, outlining a “third way” in health care financing, including
private funding and delivery.211 One of the proposals in the framework was to study the role that
private supplemental insurance could have in funding continuing care, drugs and non-emergency
health services.212 The general public reaction was strongly against this ‘third way’,213 reflecting
a concern that it would open the door to private financing of traditional Medicare (physician and
hospital services). A revised health policy framework was issued excising all mention of private
supplemental insurance and expanded private, FP delivery.214
The Liberal government of Ontario included a preference for NFP providers in the
preamble to the Local Health System Integration Act, 2005:
The people of Ontario and their government: … (b) are committed to the promotion of the delivery of public health services by not-for-profit organizations….215
45
In early 2007, the Ontario government received a proposal from a regulated private
hospital, Don Mills Surgical Unit Ltd., to which it continues to pay public health insurance
payments to provide some surgical procedures, to carry out 1600 additional knee replacements
per year. The Minister of Health responded by saying, “I will never support the outsourcing of
those knee surgeries to any private, for-profit-motivated organization.”216
The example from Alberta illustrates the ability of public opinion against private
insurance and FP delivery to change a policy proposal that suggests increasing commercial
activity in the health care sector. The Ontario example reflects the embedded norm of anti-
commercialization, despite the significant presence of private, FP providers who established their
place in health care markets in the past, and who remain.
The examples also reflect the general view of Canadians captured in periodic public
opinion surveys that show that the majority strongly support a publicly-financed health care
system even if some perceive some potential value in privately-financed services as well to deal
with gaps in service and waiting lists.217 Explanations of the acceptability of private finance have
been explained with the observation that many Canadians have private insurance for at least
some non-Medicare health care.
2.2.5.3. DOMICILE OF OWNERS OF COMMERCIALIZED HEALTH CARE PROVIDERS Supporters of increased commercialization in health care appear to be indifferent to the
location of the headquarters or the citizenship of the providers.30;31;100;210;218 Opponents, though,
are concerned about the threat of foreign corporations in particular. The question remains: given
the discussion about the orientation of FP/c providers earlier in this chapter, would a Canadian
FP corporation not have the same attributes as a foreign FP corporation?
One reason for differentiating Canadian and foreign providers is based on a perception of
inferiority: Canadian businesses in general are thought to be relatively underdeveloped and will
not – cannot – step forward to participate in market-based exchange in health care services.206
Highly developed businesses nearby in the United States would be eager to bring cross-border
economies of scale and expertise in foreign competitive health care markets.29;49;206;207;219;220
Once in place, foreign firms are thought by some to reduce Canadian control and
influence to dangerous levels. In the broader business forum, Arthurs221 argued that foreign
corporations doing business in Canada have a tendency to replace Canadian members of boards
of directors with foreigners. Aside from the effect on the employment of some Canadians, also
known as the ‘hollowing out of corporate Canada’, the foreigners bring their norms and values,

46
running their businesses and influencing Canadian policy makers differently than Canadians
would do.206;222 More recently, Martin and Nixon223 argued that foreign corporations prefer to
run Canadian subsidiaries from global headquarters. This results, they said, in Canadians’ views
becoming irrelevant unless ignoring them degrades the corporations’ profit maximization goal
through negative public perceptions.
Another view would focus more on the general values of a new class of entrepreneurial
health care providers. McDougall224 argued that the interpenetration of business elites of Canada
and the United States develops common values about government and market performance. This
builds momentum that may eventually overwhelm Canadian values.
McDougall’s arguments in many ways build from Arthurs’221 view of the impact of
foreign direct investment in Canada. But Carroll’s study225 of interlocking directorships of
Canadian businesses showed, contrary to Arthurs’ findings, that there were fewer such
interlocking links across borders than previously, and that the linkages within the Canadian
corporate elite remained as strong if not stronger than in earlier periods. He said, “This resilience
of the national factor in elite organization urges us not to overestimate the disorganizing impact
of recent globalization.” (p.209) Nonetheless, Carroll documented and argued that their common
modes of action and institutional links across boundaries are even more important than personal
relationships among business executives.
The feared ultimate result from foreign involvement and influence is that it will reduce
the capacity of the Canadian state to regulate markets, reduce the capacity of Canadians to shape
their own futures through social programs206;226;227 and reduce Canada’s relevancy as an
economic power in the world.223
The assumption about Canadian susceptibility echoes claims about globalization and the
dichotomy that develops between ‘core’ to ‘peripheral’ economies in the manufacturing sector –
that is, between regions with developed economies, wealth and growth, and poorer, subordinate,
less-developed areas.228 Core economies are understood to take advantage of the peripheral areas
by exporting goods from the core and importing raw materials from the periphery. Eventually,
the peripheral economies develop a competitive advantage though lower transportation costs,
changes in technology and such other factors as low wages and low levels of regulation of
production. As a consequence, some manufacturing owned by capital in the core economies
moves to the periphery, potentially at the expense of the core economy.229
47
Clarkson230 has argued that in some respects Canada is a core economy, and in others, a
peripheral economy. In health insurance, some Canadian companies have ambitions to compete
globally and this has manifested in substantial reciprocal openness of the health insurance
markets within international trade treaties. This would classify Canada as a core country in this
sector. There are also some areas, such as in telemedicine and health services education, in which
Canadian companies would like to engage the world;18 in other areas, the question remains open
as to whether Canada is periphery or core. From an advocacy point of view, supporters of free
trade in health services would want Canada to be a core state and opponents consider Canada to
be a peripheral state, susceptible to the consequences of investment from foreign core
economies.49;226
Increased economic integration is said by globalization supporters to result in ‘a rising
tide’231 that is, the income of everyone rises, including the income of those in peripheral
economies as they experience the influx of jobs and capital.232;233 But opponents are less
concerned about an influx of jobs and capital from abroad and point instead to the rise in the
dominance of corporations, especially multinational corporations, the exploitation of labour,
consumers and resources in peripheral regions, and the dilution of domestic intellectual
capital.226;234
2.2.5.4 THE IMPORTANCE OF TRADE BARRIERS AND TRADE TREATIES To opponents of foreign involvement in Canadian health care, the accession of Canada to
two international treaties in the 1990s, the North American Free Trade Agreement (NAFTA)46
and the General Agreement on Trade in Services (GATS),47 signalled the possibility that
governments, through naïveté or design, opened up health care markets to foreign investment as
they had not been open before.49;207;235 It is useful to review the provisions of these treaties as
they apply to health care markets in Canada.48;219;236-238
NAFTA NAFTA came into effect in 1994, and provides generally for free trade and investment in
Canada, Mexico and the United States. There are two significant groups of obligations that may
affect trade and investment in health services, those that are subject to “reservations” and those
that are not.
There are two main reservations, or exceptions, to the general rules of NAFTA. First, any
provincial measure that existed on January 1, 1994, continues to apply even if it does not
conform to the rules under NAFTA. However, if the measures that are allowed under NAFTA
48
because of this reservation are amended to be more in conformity with NAFTA, a government
cannot return to or rely on the January 1, 1994, non-conforming measure; it must rely on its
amended measure. In this way, this reservation can only result in more compliance with NAFTA
over time, not less.
Second, the NAFTA rules do not apply to “social services established or maintained for a
public purpose”, including health care. This phrase includes public insurance for health care, and
it may include services that are provided by private NFP providers,48 but probably does not
include services that are provided by a mix of FP and NFP providers.48;49
Subject to these two reservations, under NAFTA, Canada and the provinces must treat
American and Mexican investors and service providers as favourably as Canadian investors and
service providers are treated. Accordingly, if Canadian providers are permitted to offer certain
services in a province, American and Mexican providers must also be permitted to offer these
services. Provincial governments can set fees for certain health services as long as investors and
providers from all three countries are eligible for them.
Governments cannot impose requirements for investors or providers from the three
countries to purchase or use goods or services in Canada or a specific province, nor can there be
requirements for senior management or boards of directors to have only Canadian directors.
Finally, there cannot be a requirement to have an actual presence, such as a sales office or clinic,
in Canada or a specific province.
NAFTA provides that if Canada or a province proposes to nationalize or expropriate a
business, it must pay compensation to the person or corporation whose business or business
opportunity is removed by the nationalization and expropriation. This right extends not only to
outright expropriations, but also to measures that have the effect of taking away the benefit of a
party’s investment. For example, in a controversial case, Metalclad v. the United Mexican
States,239 a Mexican environmental regulation essentially meant that the American investor’s
proposed mine could not be developed, and the investor successfully collected compensation
from the Mexican government.
Another NAFTA requires that licensing and certification requirements (such as the
qualifications for registration as a health professional) be based on “objective and transparent
criteria, such as competence and the ability to provide a service; is not more burdensome than
necessary to ensure the quality of a service; and does not constitute a disguised restriction on the
cross-border provision of a service.”

49
Finally, Canada can continue a monopoly that existed prior to January 1, 1994, or subject
to certain notice provisions and a potential obligation to compensate investors, can create a
monopoly. Provincial government monopolies are not subject to the NAFTA monopoly
provisions, though federal and private monopolies are. State monopolies cannot abuse the
benefits they gain from their monopoly status in relation to “regulatory, administrative or other
governmental authority” outside their monopoly, and they must not discriminate. In a recent
decision in the case of United Parcel Service v. Canada,240 it was clarified that commercial
activities by a state enterprise outside its monopoly are not exercised as a “governmental
authority”, and so were not subject to attack by foreign investors for compensation.
GATS The GATS came into effect on January 1, 1995, and Canada agreed to be bound by it.
Unlike NAFTA, the GATS applies only to sectors about which a government has made a specific
commitment. Canada’s commitments do not include health care, but they do include health
insurance. However, even in committed sectors, GATS does not apply to any service “supplied
in the exercise of governmental authority”, which is defined to mean any “service that is supplied
neither on a commercial basis nor in competition with one or more service suppliers”.
2.2.5.5 FACTORS IN FOREIGN INVESTMENT IN A HEALTH CARE MARKET What is known about general patterns of foreign investment in a country’s health care
markets? Smith’s review of the literature241 showed that there is little empirical evidence of the
causes or effects of foreign direct investment or trade in health services anywhere in the world,
though he reported that the literature is long on speculation and polemical argumentation.
There appears to be no study reported in the literature concerning multinational health
care service providers’ decisions of foreign firms or investors to invest in Canada, though there
are some examples of investments in other countries cited in the literature.242;243 These are cases
primarily of developing countries where different factors may be at play than would be relevant
in the Canadian context with its developed health system infrastructure.
In their general reviews of Canadian academics’ discussions of globalization, Hoberg244
and Skogstad245 concluded that, notwithstanding a growing literature, little is known about the
decisions of transnationals to invest in Canada in any industry. The absence of trade barriers and
lower levels of regulation of foreign investment appear to be associated with increased levels of
foreign investment, but the effects are not uniform across all industries.246
50
In a study of the effects of NAFTA on multinational manufacturers’ decisions to invest,
the Conference Board of Canada247 found that many multinationals that invest in Canada were
not so much concerned with overcoming the effect of trade barriers as such, but instead wanted
closer access to the Canadian market than they would get if they were located outside the
country, wanted closer access to Canadian natural resources, and wanted the opportunity to
develop sets of expertise that the Canadian market uniquely offered.
Of these factors, the first and the third appear to have some potential application in
Canadian health care markets. It is clear that in an industry that still depends on “hands on”
service such as nursing and physiotherapy, access to the Canadian market would require a
commercial presence in Canada, and locating outside the country would not likely be as
effective. Where cross border electronic delivery of services is possible, such as in radiology and
interpretation of laboratory tests, there appears to be a greater likelihood that there might not be
direct investment in a Canadian presence though there may be legal restrictions. Also, there is a
possibility that some of the unique features of the Canadian health care market, with its particular
mix of public and private funding, might offer an opportunity to develop an expertise that could
be taken abroad. But more likely, the expertise acquired by a multinational corporation abroad in
more commercially-oriented health care markets than Canada’s might be applied in Canada.
Hoberg, Banting and Simeon248 reviewed the state of nine social program areas in Canada
and argued that there is little evidence that the existence of the trade treaties has negatively
affected Canadian social policy in general and health policy in particular. They concluded that
after NAFTA was in place, social policy fields, including health care, remained resistant to
convergence with foreign norms and values, and to investment. Consistent with their findings,
Baldwin, Gellatly and Sabourin246 found that the percentage of assets and revenues under foreign
control in the “education, healthcare and social assistance” sector in Canada is small and getting
smaller, from 3.4% in 2000 to 1.4% in 2003. As discussed, domestic health care providers are
largely but not completely protected from foreign entrants by NAFTA and the GATS, and as will
be discussed in Chapter 7, domestic providers in the Ontario physiotherapy market are largely
unprotected.
2.2.5.6 RESEARCH QUESTIONS 4 AND 5 AND HYPOTHESES Research Question 4 centres on the general issue of the factors that characterize surviving
providers, and the hypothesis looks to key factors in a market that present barriers to new
entrants but that are addressed satisfactorily by incumbent providers:

51
Research Question 4: What characterizes the organizations that survive in a
contestable market?
Hypothesis 4(a): In a contestable market, there is a consolidation over time of
provider organizations into a smaller number of corporately-owned organizations.
(b) As well, the providers that survive in a market address the production
characteristics of the market that pose significant barriers to entry.
In chapters 4, 5 and 7, two production characteristics will be identified as important to
providers in Ontario’s physiotherapy market: the use of skilled registered physiotherapists and
efforts to secure a flow of patients through marketing and preferred provider arrangements.
These will be used to test Hypothesis 4(b).
With respect to foreign investors, while the anti-commercialization orientation of
government policy may influence foreign investment patterns, it is the absence of protection for
domestic providers in NAFTA that has generated the hypothesis for the fifth research question.
Research Question 5: Is there a significant presence of foreign investors or
foreign corporate providers in health care markets? What mechanisms help
produce this pattern?
Hypothesis 5: If a market is contestable, foreign corporate providers and insurers
will have a significant presence in a market if they have experiential and financial
advantages and trade treaties do not specifically protect domestic providers and
insurers.
2.2.6 Threat of substitutes
Substitutes are goods or services that in a buyer’s mind constitute reasonable alternatives
that perform the same function as another good or service, or produce the same outcome. For
example, a person who is suffering from severe lower back pain may be presented with two
alternatives: physiotherapy and surgery. The person’s choice between the alternatives will be
based on a comparison of the costs (including financial costs and risks) and likely benefits from
each.

52
One of the key constraints on the threat of substitutes is the heavy regulation of labour
supply, and the resulting constraints on the occupational groupings that are permitted to perform
certain functions. If two professional groups provide different services but claim to produce the
same outcome for a patient, they may be seen as substitutes in the market.
In a health care market, the gatekeeper function of specific professions (discussed above
in section 2.1.2), particularly physicians, can have many repercussions throughout a health care
market, such as advising buyers about appropriate care, influencing the supply of patients to
provider organizations, and determining the range of acceptable substitutes.
Also, with the importance of insurance in Canadian health care markets, it is essential to
note that insurers likely have a significant role to play in determining the level of threat of
substitutes. Their influence could affect the array of substitutes that are paid for and that are
therefore available to patients at less cost to them personally.
Finally, there are important issues of ‘brand identity’ among various providers of health
services that limit the range of substitutes. For example, professionals such as physicians have
strong historical as well as legal claims to the preferred and exclusive provision of certain
services, and it is difficult for other professions to establish their status firmly as providers of
equivalent services.249 Similarly, institutions such as hospitals may have credibility and trust
among patients and insurers attributable at least in part to their history and traditional place in
health care systems that others may not easily match; instead, those others may instead need to
respond to the hospitals’ strong branding with a strategy of differentiation in order to gain a
foothold in a market.
No hypothesis was generated in relation to the power of substitutes, but certain
developments in the Ontario physiotherapy market discussed in Chapter 6 may have an effect in
the future.
2.3 Research questions
This review of the literature and theory surrounding the operation of health care markets
provides the basis for the five research questions outlined briefly in Chapter 1. While the
individual research questions have been discussed above, they are reiterated for convenience.
The first research question is as follows:
Research Question 1: Do provider organizations supply a health care market
differently according to their FP and NFP status and their corporate form?

53
The hypothesis that is investigated in relation to the first question reflects the organizational
economics literature and health services literature descriptions of the motivations of providers
with different corporate forms and profit orientations. This hypothesis will be tested in the light
of the effect of the five competitive forces within their market:
Hypothesis 1: FP/c provider organizations, as compared with NFP provider
organizations, are more likely to:
(a) substitute lower-cost practitioners;
(b) concentrate in larger centres rather than in all areas;
(c) serve higher-revenue niche markets or niche markets with lower
administrative burden;
(d) perceive greater levels of competition;
(e) offer a wider variety of services in addition to physiotherapy services;
(f) serve patients with less complex problems; and,
(g) have shorter wait lists.
Provider organizations operated as small businesses (FP/s), because they are ‘not
only for profit’, will, in general, fall in between FP/c and NFP providers. The NFP
Hospitals and Other NFP strategic provider groups will resemble each other in
most respects but will differ on (e). Because of their institutional mandates, NFP
Hospitals will offer a wider variety of services than all the other strategic provider
groups.
The second research question seeks to clarify the roles and approaches of different kinds
of payers in a market and their effect, and the hypothesis to be tested centres on the different
expectations of public and private payers, and on the effect of multiple payers in a market rather
than, as in Medicare markets in Canada, a single public payer.
Research Question 2: Are public and private payers in a health care market
similar or different in their approach to and relationship with providers, and what
effect do they have on the supply of services in a health care market?
Hypothesis 2(a): Private payers are more attentive to cost control and use
different approaches to paying providers than public payers. (b) However,
multiple payers in a market have less control over costs and over the supply of
services than when there is a single payer.

54
The power of suppliers of labour and of patients to provider organizations is the subject
of the investigation arising out of the third research question, and the hypothesis points to effects
of exclusivity rights of professional groups and patients’ rights of direct access to health
professionals (without referrals) as factors.
Research Question 3: What role do the supply of labour and the pattern of
supply of patients to health care providers have in the structure of the providers in
a health care market?
Hypothesis 3(a): Labour suppliers exert much pressure on provider organizations
if they are in short supply and have exclusive rights to supply the market. (b)
There is little effect of referral sources on providers if patients have direct access
to the providers.
The fourth research question and the related hypothesis focus on the cumulative effects of
the five competitive forces on potential entrants and incumbents as they enter and exit the
Ontario physiotherapy market:
Research Question 4: What characterizes the organizations that survive in a
contestable market?
Hypothesis 4(a): In a contestable market, there is a consolidation over time of
provider organizations into a smaller number of corporately-owned organizations.
(b) As well, the providers that survive in a market address the production
characteristics of the market that pose significant barriers to entry.
Research Question 5 focuses on the question of potential new entrants into the market
from outside Canada:
Research Question 5: Is there a significant presence of foreign investors or
foreign corporate providers in health care markets? What mechanisms help
produce this pattern?

55
The related hypothesis focuses on the five competitive forces, with particular emphasis in
the first instance on the nature of trade barriers:
Hypothesis 5: If a market is contestable, foreign corporate providers and insurers
will have a significant presence in a market if they have experiential and financial
advantages and trade treaties do not specifically protect domestic providers and
insurers.
With the theoretical basis for the research questions and hypotheses established in this
chapter, the next chapter turns to the rationale for the selection of the Ontario physiotherapy
market as the case with which to examine these questions. The chapter also describes the
methods that were employed to collect and analyze the data.
56
Chapter 3 – Study design and methods
3.1 Case study – the physiotherapy market in Ontario
A case study was used to elicit a rich appreciation of the current functioning of the
Ontario physiotherapy market, about which little is known. Yin250 argued that case studies are
ideal for the study of contemporary events when no control over the behaviour of the participants
is possible and it is not known the extent to which the phenomenon and its context interact and
interrelate. Yin said that a case study can be “revelatory” or “critical”250 (or as King, Keohane
and Verba251 call it, “crucial”). A revelatory case is one that opens for the first time phenomena
that have not yet been the subject to scientific scrutiny. If a case displays features about which
theory has generated predictions, it is “critical” and it presents a robust opportunity to test
dimensions of that theory.
The Ontario physiotherapy market can be seen to be both a critical and a revelatory case
with respect to the research questions. First, the physiotherapy market provides an opportunity to
study the interrelationships among multiple for-profit (FP) and not-for-profit (NFP) providers
and public and private buyers that appear not to have been observed in the context of Canadian
health care before, but about which there is a substantial body of theory. It also reveals patterns
of market entry, exit and survival in a contestable health care market in Canada, and the patterns
of foreign influence and investment that are possible when international trade treaties encourage
foreign trade and investment. In this area, the theory is less well formed, and prevailing ideas
about the issues are founded on experience in other industries, or on the basis of limited
empirical research.
The choice of the timeframe of 2003 to 2005 for this study of the physiotherapy market is
important. The physiotherapy market had experienced substantial upheaval in the period 1989 to
2000 as the reform of the MVA insurance regime in Ontario took hold, creating substantially
greater opportunities for physiotherapy services delivered outside hospitals in FP settings, and as
program delivery reforms at the WSIB encouraged similar opportunities. As these changes were
taking place, it would have been difficult to assess which features of the market were transitory
and which were more enduring. By contrast, in the time period for this study, from 2003 to 2005,
the market had apparently absorbed the reforms and delivery changes in the 1990s, resulting in
complex relationships among providers and buyers, relatively stable entry and exit patterns, and
stabilized levels of foreign investment, all of which are of interest in this study. Nonetheless,

57
there were two additional developments – a disruption in fee levels in the MVA revenue source
in 2003 (discussed in further detail in Chapter 5, section 5.1.1.8) and some disruption in 2005 in
the eligibility criteria for patients whose care in designated clinics was paid by OHIP (see
Chapter 5, section 5.1.1.2). These developments along with the relatively stable market
conditions from 2003-2005 have been placed in their historical context using various data
sources, including documents (section 3.2.1), some of the existing data files (section 3.2.2) and
parts of the key informant interviews (section 3.2.5).
Case studies allow a certain degree of flexibility in approach and direction in the data
collection and analysis phases to accommodate issues that emerge. For example, as will be
explained more fully below, while compiling a list of potential survey respondents over a period
of a few months and conducting the survey itself, it appeared that there was substantial
fluctuation in the participants in the market over time. Consequently, additional data were
collected to allow this fluctuation to be measured and assessed.
While case studies are widely used in social science, they differ from the norms and
expectations of experimental research designs.252 Accordingly, approaches and techniques have
been developed to ensure that case studies, which can be rich in detail, are robust enough to meet
high standards of scientific scrutiny. Like other scientific inquiries, case studies must consider
reliability and validity,250;251;253 of which there are three types: internal validity, external validity
and construct validity.
‘Reliability’ refers to whether the case study could be repeated by another researcher with
the same results. To promote reliability, it is necessary to record the steps taken to conduct the
research. The methods used in this study and the steps taken in the collection and analysis appear
in this chapter and in the chapters in which the analysis of those data are used. In addition,
reliability is enhanced when the measures used in a study are clear and repeatable by others.
Consequently, in the course of this study design and its execution, reliability was enhanced with
more straightforward, less ambiguous measures where possible,253 and with the use of more than
one measure of a concept where a concept is harder to measure without ambiguity. For example,
one indicator of a provider’s presence in the physiotherapy market used in this study is whether
the provider appeared in the Yellow Pages or not at two different times; there is no ambiguity in
this measure. Measuring the perceptions of competition in the market is a more ambiguous task,
for, as Porter’s model makes it clear, there can be competition from each of the five forces.
Accordingly, to measure competition, a survey of provider organizations (section 3.3.4) asked
58
for providers’ rating of the competition they faced on a 5-point Likert scale. In addition, in a
series of interviews (section 3.3.5), key informants were asked a series of questions to uncover
and probe the various sources and magnitude of competition providers face.
The second consideration is whether a case study has internal validity, that is, when
causal chains are not directly observable, whether the inferences drawn are appropriately drawn
from the data and whether there are omitted variables that may actually be at work in the causal
chain but are not considered in the case. The remedies for this problem in this study are the
comparison of patterns found in the case to patterns in other situations250 (for example, several
practice areas the strategic provider groups specialize in are examined and compared) and the
analysis of data from multiple perspectives (for example, a survey of providers and interviews
with key informants gave different perspectives on certain variables) so that potential alternative
influential factors are considered.
A third consideration is external validity: to what extent could the causal or correlated
factors or patterns identified in this study be found in other markets? As Campbell and Stanley252
pointed out, the very techniques for increasing internal validity can jeopardize the more general
applicability of the findings. Internal validity can be increased as the place, time and
circumstances of the case are specified in more detail, but the generalizability of the case may
decrease as the case becomes more and more particular. But the issue of generalizability turns on
the proximity or similarity of factors at work in two situations and an assessment whether, given
the similarities and differences between the two, the findings from one are applicable in another.
To address the issue of generalizability of this study, a thick description of the case is
provided. This will allow the question of whether the findings can be applied in other markets to
be more easily answered. In addition, when phenomena are identified, their frequency and their
relative importance are noted to facilitate potential future decisions whether the findings should
appropriately be applied in other situations.
The fourth consideration, construct validity, deals with the general issue of preventing
‘measurement error,’250 ensuring that the measures in this study are good measures of the
underlying concepts being studied. As well, though two sets of measurements may be found to
be correlated, it is necessary that some underlying theoretical relationship between the two
measured factors be identified.253 Construct validity can be enhanced by a number of strategies,
including comparing cases within a case251 to ensure that meaning is drawn from as many
observations as possible and reflects (or is found not to reflect) the relationships predicted by
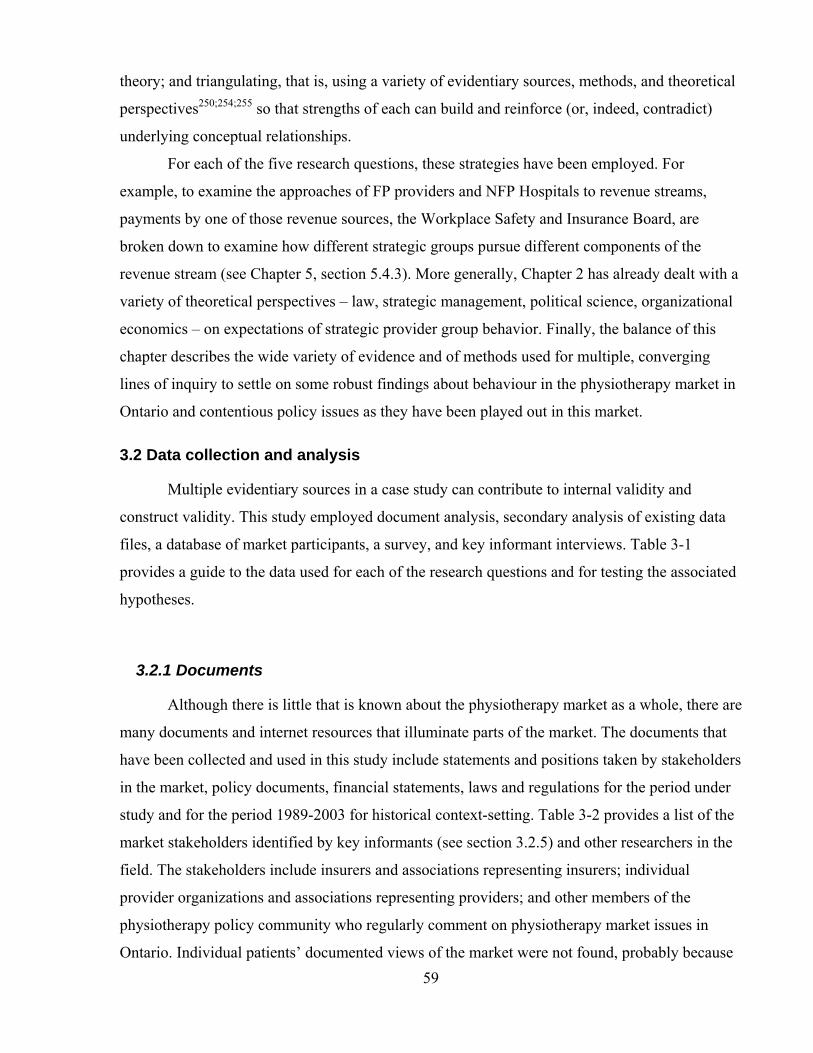
59
theory; and triangulating, that is, using a variety of evidentiary sources, methods, and theoretical
perspectives250;254;255 so that strengths of each can build and reinforce (or, indeed, contradict)
underlying conceptual relationships.
For each of the five research questions, these strategies have been employed. For
example, to examine the approaches of FP providers and NFP Hospitals to revenue streams,
payments by one of those revenue sources, the Workplace Safety and Insurance Board, are
broken down to examine how different strategic groups pursue different components of the
revenue stream (see Chapter 5, section 5.4.3). More generally, Chapter 2 has already dealt with a
variety of theoretical perspectives – law, strategic management, political science, organizational
economics – on expectations of strategic provider group behavior. Finally, the balance of this
chapter describes the wide variety of evidence and of methods used for multiple, converging
lines of inquiry to settle on some robust findings about behaviour in the physiotherapy market in
Ontario and contentious policy issues as they have been played out in this market.
3.2 Data collection and analysis
Multiple evidentiary sources in a case study can contribute to internal validity and
construct validity. This study employed document analysis, secondary analysis of existing data
files, a database of market participants, a survey, and key informant interviews. Table 3-1
provides a guide to the data used for each of the research questions and for testing the associated
hypotheses.
3.2.1 Documents
Although there is little that is known about the physiotherapy market as a whole, there are
many documents and internet resources that illuminate parts of the market. The documents that
have been collected and used in this study include statements and positions taken by stakeholders
in the market, policy documents, financial statements, laws and regulations for the period under
study and for the period 1989-2003 for historical context-setting. Table 3-2 provides a list of the
market stakeholders identified by key informants (see section 3.2.5) and other researchers in the
field. The stakeholders include insurers and associations representing insurers; individual
provider organizations and associations representing providers; and other members of the
physiotherapy policy community who regularly comment on physiotherapy market issues in
Ontario. Individual patients’ documented views of the market were not found, probably because

60
Table 3-1: Data used to answer the research questions and test the hypotheses, by chapter Chapter 4:
Overview of the physiotherapy
market
Chapter 5: Revenue sources,
buyer power
Chapter 6: Rivalry among
strategic groups of providers
Chapter 7: The threat of new
entrants
Research Question 1: FP and NFP providers’ approach to the market
• Section 4.4 • Section 4.5.3 Data used: • Survey • Documents • Key information
interviews
• Section 5.2 Data used: • Survey • Documents • Key informant
interviews WSIB database
• Sections 6.1.1-6.1.3
• Section 6.2.2 • Section 6.3 Data used: • Survey • Key informant
interviews
Research Question 2: Public & private payer approaches to and relationships with providers
• Section 5.1 Data used: • Survey • Documents • Key informant
interviews
Research Question 3: Role of suppliers of labour and patients
• Sections 4.4 – 4.5 Data used: • Survey • CPO database • Statistics Canada
data • Documents • Key informant
interviews
• Section 6.1.4 Data used: • Key informant
interviews
Research Question 4: Characteristics of surviving organizations
• Section 7.1 Data used: • Market participants
database • Key informant
interviews Research Question 5: Foreign investment patterns
• Section 7.2 Data used: • Documents • Key informant
interviews
of the heterogeneity of individual uninsured patients and the apparent absence of organizations
that might collate and represent patients’ views.
Documents published by the stakeholders, including their websites where applicable,
were reviewed to identify statements and positions that the stakeholders have taken on
physiotherapy services specifically and rehabilitation generally; the goals and market positioning
of particular players in the market; and, the relationships among stakeholders in the market. For
example, the Ministry of Health and Long-Term Care’s media releases and backgrounders
regarding changes in the period 2003 to 2005 to the payment structure for community-based

61
Table 3-2: List of stakeholders identified for the document analysis portion of this study Individual Buyers
• Community Care Access Centres (CCACs) • Department of Veterans Affairs Canada • Largest motor vehicle insurance companies and selected smaller companies operating in
Ontario • Largest life and health insurance companies operating in Ontario • Ontario Ministry of Health and Long-Term Care • Workplace Safety and Insurance Board
Buyer associations • Canadian Life and Health Insurance Association Inc. • Insurance Bureau of Canada • Ontario Association of Community Care Access Centres
Individual providers
• Approximately 250 smaller provider organizations identified in Market Participants Database1 and CPO database2
• 4 FP/c organizations (as well as any former corporate shareholders in the United States), 2 networks of FP/s providers, and all NFP Hospitals in the CPO database
Associations of providers • Canadian Physiotherapy Association
• College of Physiotherapists of Ontario • Ontario Athletic Therapists Association • Ontario Chiropractic Association • Ontario Hospital Association • Ontario Physiotherapy Association
Other policy community participants
• Arthritis Community Research & Evaluation Unit, Toronto • Financial Services Commission of Ontario • Health Professionals Regulatory Advisory Council • Ontario Ministry of Health and Long-Term Care • Ontario Ministry of Training, Colleges and Universities
1 See section 3.2.3 below. 2 See section 3.2.2.1 below.
physiotherapy services were reviewed and cross-referenced with legislation and regulations.
More specialized documents relating to the period under study, 2003 to 2005 (and in a more
limited way, relating to the period 1989 to 2003 for historical context) were also collected and
analyzed, such as financial statements of foreign companies that owned physiotherapy services
organizations in Ontario; press releases and filings with Securities and Exchange Commission in
the United States about known foreign investors’ activities in Canada; and such sources as the
website of a Canadian private equity firm (www.callistopartners.com) that facilitated the
management buyout of the subsidiary of an American firm in the physiotherapy market.
As outlined in Chapter 2, health care markets generally have a high degree of
governmental regulation. Accordingly, there was a review of federal and provincial laws and
international trade treaties that govern particular actors or activities in the physiotherapy market,
including insurers, providers, regulators, and health professionals. The laws that were reviewed
are listed in Table 3-3. Most affected the case study time period, several related to the historical
62
context, and some, dated after 2005, deal with developments formalized since the study time
frame, particularly in the area of regulation of new health professions.
Table 3-3: Laws, regulations and international trade treaties analyzed for this study Constitutional Constitution Act, 1982256 Federal laws Canada Corporations Act257
Canada Health Act4 Department of Veterans Affairs Act258 Income Tax Act259 Veterans Health Care Regulations260
Ontario laws Business Corporations Act261 Chiropractic Act, 1991262 Commitment to the Future of Medicare Act, 1994263 Community Care Access Centres Act, 20015 Compulsory Automobile Insurance Act264 Consumer Protection Act265 Corporations Act266 Drugless Practitioners Act267 Financial Services Commission of Ontario Act268 Health Insurance Act12 and regulations under the Act269 Insurance Act270 and regulations under the Act relating to motor vehicle insurance271-273 Kinesiology Act, 2007274 Labour Relations Act, 1995200 Local Health System Integration Act, 2006275 Long-Term Care Act, 19946 Massage Therapy Act, 1991276 Medicine Act, 1991277 Naturopathy Act, 2007278 Nursing Act, 199169 Occupational Therapy Act, 1991279 Ontario Agency of Health Protection and Promotion Act, 2007280 Physiotherapy Act, 199113 Private Hospitals Act281 Public Hospitals Act282 Regulated Health Professions Act, 199166 Traditional Chinese Medicine Act, 200671 Workplace Safety and Insurance Act, 199716
International trade treaties
North American Free Trade Agreement46 General Agreement on Trade in Services47
3.2.2 Secondary analysis of existing data files
Two administrative databases have been used (one from data published by a regulator in
the market on the Internet and the other from two data files supplied by a large insurer involved
in the physiotherapy market) as well as a dataset complied by Statistics Canada from
administrative data. The advantages and disadvantages of using administrative databases all stem
from the fact that the databases were not developed for the purposes of the research. This means
that the data are not biased by the data suppliers’ view of the possible use of their data in the
63
research, but it also means that the data do not always address all the broad needs of a research
project (including issues of inclusion or exclusion of subjects), and consequently,
accommodations needed to be made in the use and interpretation of the data to assist in
answering specific research questions.
3.2.2.1 COLLEGE OF PHYSIOTHERAPISTS DATABASE The only source for a comprehensive list or register of physiotherapists in Ontario is the
College of Physiotherapists of Ontario (CPO), which has the statutory mandate to regulate the
practice of physiotherapy in Ontario under the Physiotherapy Act, 1991.13 However, it is
important to note that the CPO’s register includes only those practitioners who ‘hold themselves
out’ as “physiotherapists”*, as the College itself describes it.283 Consequently, though use of data
from the CPO gives an insight into the registered physiotherapist market in Ontario, there is a
broader range of regulated and unregulated practitioners also providing physiotherapy services in
the province. (The Market Participants Database, described in section 3.3.3, addresses the other
practitioners.)
As a public service, the CPO maintains a website with a comprehensive listing of
registered physiotherapists engaged in direct patient care, including the full names of
physiotherapists and the name and address of the organization or organizations each
physiotherapist works for. In the case of a physiotherapist who works on his or her own at least
part of the time, the organization name is the physiotherapist’s name. The information is derived
from the mandatory annual filing by all physiotherapists to keep their registration with the CPO
current. The 2003 list consisted of 4,728 physiotherapists in direct patient care in Ontario as of
October 4, 2003 (of whom 4,110 (86.9%) reported only one workplace address), and the 2005
list consisted of 4,835 physiotherapists as of October 11, 2005 (of whom 3,848 (79.6%) reported
one workplace address).
One of the uses of this database (Chapter 7, section 7.1.2.2), was to examine the changes
from 2003 to 2005 in the size or capacity of provider organizations, as measured by the number
of registered physiotherapists in each.
The other principal use of this database in this study was to calculate the densities of
physiotherapists in different geographic regions (Chapter 4, section 4.5.3). Measuring the
* Following the Physiotherapy Act, 199113, this study uses the term “physiotherapist” to describe only
physiotherapists registered with the CPO. Other therapists who provide physiotherapy services but who are not registered are labelled more generically, for example, as “therapists” or “other practitioners”; where they are members of other regulatory Colleges such as chiropractors or physicians, those regulated terms are used.
64
distribution of health practitioners by examining the ratio of health practitioners to local
populations is common38;153;284;285 but Pong and Pitblado286 pointed out that there are some
drawbacks to calculating densities using only the numbers of practitioners; they suggested that
what is more important than basic numbers is some measure of the actual provision of care (such
as using ‘Full Time Equivalents’ as a standardized measure of human resources). It is important
to note that using a density approach alone does not permit discussion about the adequacy of
physiotherapist supply in any region or across the province to meet patient needs. Comparative
densities can only reveal variation of distribution of practitioners among regions.
While other researchers who have used these or similar data have used only the first
(“primary”) workplace reported by the physiotherapists,28;287 this study addressed the Full Time
Equivalent issue. Though the web-based CPO database does not contain information about the
hours that physiotherapists work, nor the proportion of time each spends in multiple workplaces,
when physiotherapists reported more than one workplace in the CPO database, their availability
for direct patient care in two settings was arbitrarily established as 50% in each, as 33.33%
where there were three settings, and so on. When the term ‘number of physiotherapists’ is used
in relation to this database, it means the number of physiotherapists attributed using these
criteria. The active employment pattern likely did not conform to these arbitrary assignments, but
this approach allowed the use of the additional information available in the database to calculate
densities of registered physiotherapists working in FP and NFP settings reflecting part-time work
in both.
Physiotherapists indicating a hospital workplace were coded as working in a NFP
Hospital. Workplaces such as the Arthritis Society and other commonly-known charitable
organizations were coded as Other NFP organizations. Long-term care homes and some
rehabilitation corporations were identified as possible NFP organizations, and Internet searches
(using primarily www.google.ca and the websites of the organizations involved) were conducted
to confirm the status of the organization. All other organizations were coded as for-profit (FP)
organizations. It was possible from accumulated knowledge of the market to identify some
organizations as either FP/c or FP/s. However, for the others, available and relevant websites
rarely precisely identified the ownership structure of an organization. Consequently, it was
decided not to differentiate any FP firms into the FP/c and FP/s types for this database.
To compare densities, a density measure was calculated for each of 2003 and 2005
(number of registered physiotherapists in direct patient care per 10,000 population) for Ontario
65
and for each county for all physiotherapists, hospital-based physiotherapists, non-hospital
physiotherapists. The population data were from the Statistics Canada’s Annual Demographic
Statistics publications for 2003 and 2005.288;289
There was some difficulty identifying whether some physiotherapy organizations
persisted in the market between 2003 and 2005, because names and addresses of some
physiotherapy organizations varied over time. When organizations appeared to be similar (that is,
they had one or more but not all of the following: similar names, addresses, telephone numbers,
postal codes), various internet searches were conducted using www.google.ca,
www.yellowpages.ca, www.superpages.ca, provider organizations’ individual websites, where
possible, or the websites of the known chains of physiotherapy clinics (for example, LifeMark
Health’s website (www.lifemark.ca) and the CBI Health website (www.cbi.ca)) to decide
whether two or more named organizations were indeed the same or were different.
Statistics Canada’s Postal Code Conversion File290;291 was used to identify the county for
each of the organizations in the CPO list. “County” was defined as including the several ‘upper
tier municipality’ configurations in Ontario, for example, cities, districts, regional municipalities,
united counties and counties. The 49 upper tier municipalities constitute Statistics Canada
Census Divisions.
An alternative approach to using counties to analyze the geographic distribution of
physiotherapists would have been to use the territories of Local Health Integration Networks, or
LHINs, established under the Local Health System Integration Act, 2006,275 though they were
not in existence at the time this study was conceived and commenced. The territories of the 14
LHINs in Ontario are quite different from the 49 counties, with most covering more than one
county and one being smaller than the county it is in (the Toronto Central LHIN comprises only
part of the city of Toronto, which is a Statistics Canada Census Division). Accordingly, using
county boundaries rather than LHIN boundaries allowed a study of a larger number of cases.
Furthermore, the LHINs are not involved in all aspects of the physiotherapy market being
examined in this study. They were constituted primarily to deal with a range of publicly-funded
services. LHIN boundaries are based predominantly on referral patterns to several hospitals
within a region.292 With the share of the physiotherapy market declining for NFP Hospitals (see
Chapter 4, section 4.5.2 and Landry28), it was less relevant to consider LHIN boundaries, based
on hospital-centred criteria, than county boundaries. Seventy-eight per cent of respondents to the
Survey of Physiotherapy Organizations (n=330) (see below, section 3.2.5) reported that 80% or

66
more of their patients were from within their county and so counties constitute better geographic
areas for the purposes of calculating and comparing physiotherapy densities in this study.
To analyze the distribution patterns, the counties were divided into three categories*
(Table 3-4 and Figure 3-1): the six counties with academic physiotherapy training programs in
them (“academic counties”), the 23 contiguous with academic counties (“contiguous counties”),
and the other 20 other counties (“all other counties”). For some analyses, contiguous counties
and all other counties were combined into a category called “non-academic counties.”
3.2.2.2 WSIB PHYSIOTHERAPY PAYMENTS DATA Two physiotherapy payment data files were obtained from the WSIB, one for each of
2003 and 2004. These data were used to elaborate some of the differences in approach to the
market by FP and NFP providers, and the results of the analysis are in Chapter 5, section 5.2.2.
The elements in the data files included the total value of payments made by the WSIB in each
year, the total number of workers (claims) receiving service, and the total number of treatments
paid for, organized by provider’s county, provider type and billing code (which describes the
type of service paid for).
An additional subset of the data with finer detail was obtained to clarify the WSIB’s
provider definitions. Because in some of the smaller counties it would be possible to identify
individual providers and the amounts they billed from this subset, an undertaking of
confidentiality was signed in which it was agreed not to reveal the details and to use the data
only at an aggregated level.
3.2.2.3 STATISTICS CANADA PHYSIOTHERAPIST EMPLOYMENT DATASET A small dataset compiled by Statistics Canada regarding the employment patterns of
graduates of physiotherapy and other health and health-related education programs was obtained
upon special request.293 This dataset had been produced in 2006 as background work for a major
project on physiotherapy human resources.294
* These categories of counties reflect the analysis of Rosenthal, Zaslavsky and Newhouse152 so that their
observations about distribution of health professionals could be compared with the results in this study – see Chapter 4, section 4.7.3.3.

67
Table 3-4: Ontario counties, by type
Academic counties (n=6) Non-academic counties (n=43) Contiguous counties (n=23) All other counties (n=20)
Frontenac Queen’s University
Hamilton
McMaster University Middlesex
University of Western Ontario Ottawa
University of Ottawa Thunder Bay
* Toronto
University of Toronto
Lanark Leeds & Grenville Lennox & Addington Stormont, Glengarry & Dundas Brant Halton Niagara Waterloo Wellington Chatham-Kent Elgin Huron Lambton Oxford Perth Lanark Leeds & Grenville Prescott & Russell Renfrew Algoma Kenora Rainy River Durham Peel York
Bruce Cochrane Dufferin Essex Greater Sudbury Grey Haldimand-Norfolk Haliburton Hastings Kawartha Manitoulin Muskoka Nipissing Northumberland Parry Sound Peterborough Prince Edward Simcoe Sudbury District Timiskaming
* Of the six “academic counties”, only Thunder Bay did not have a medical school in the period under study nor an academic centre with an entry-to-practice program in physiotherapy. However, Hamilton’s McMaster University’s “northern stream” physiotherapist program in collaboration with Lakehead University allowed McMaster physiotherapist students to have their clinical education placements in the Thunder Bay area.295 For this reason, Thunder Bay is included as an “academic county”.
3.2.3 Market Participants Database
3.2.3.1 COMPILING THE DATABASE There is no single list or registry of provider organizations providing physiotherapy.
Since no single payer for services deals with all provider organizations, lists are not available
from the wide variety of payers (including individual patients) and there is no regulatory scheme
that covers all providers in this market. To assist in providing a description of the market, it was
necessary to create a list of provider organizations, and the work to develop this database (as
well as subsequent assistance with data entry and coding) was conducted under the auspices of
the project funded by the Canadian Institutes for Health Research called “Public & Private in
Financing & Delivery: Trends in Private Sector Delivery of Health Care Services in Key Sectors
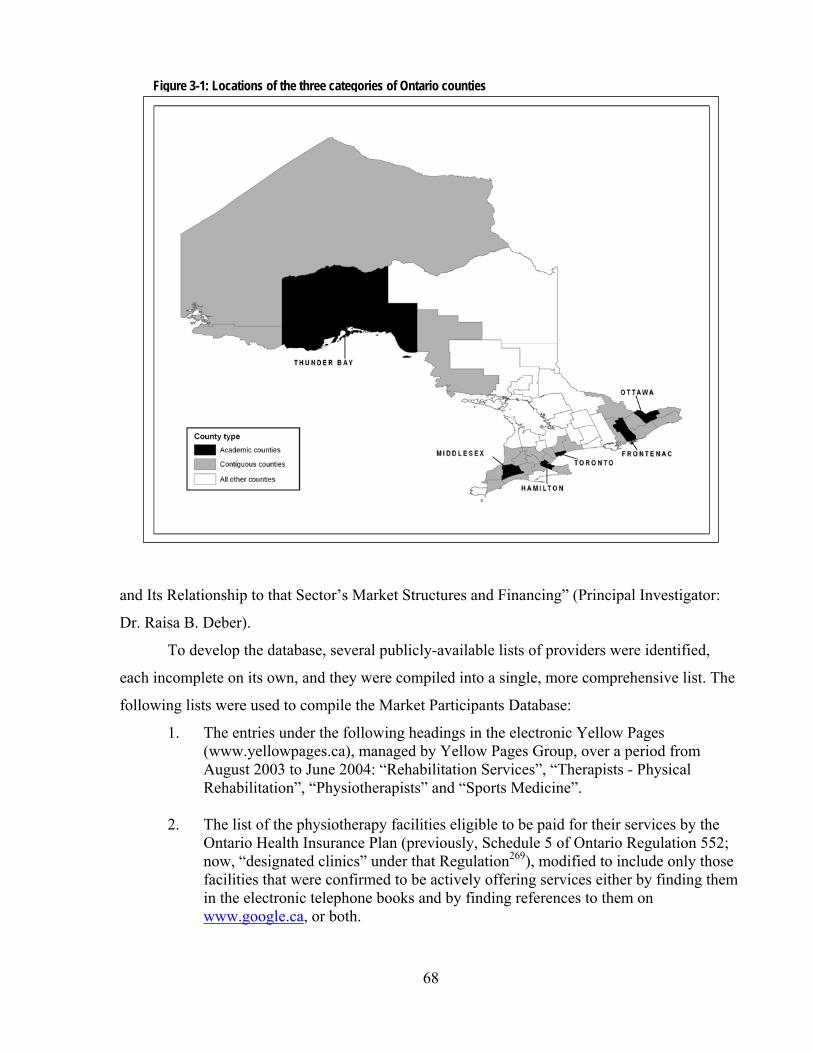
68
and Its Relationship to that Sector’s Market Structures and Financing” (Principal Investigator:
Dr. Raisa B. Deber).
To develop the database, several publicly-available lists of providers were identified,
each incomplete on its own, and they were compiled into a single, more comprehensive list. The
following lists were used to compile the Market Participants Database:
1. The entries under the following headings in the electronic Yellow Pages (www.yellowpages.ca), managed by Yellow Pages Group, over a period from August 2003 to June 2004: “Rehabilitation Services”, “Therapists - Physical Rehabilitation”, “Physiotherapists” and “Sports Medicine”.
2. The list of the physiotherapy facilities eligible to be paid for their services by the
Ontario Health Insurance Plan (previously, Schedule 5 of Ontario Regulation 552; now, “designated clinics” under that Regulation269), modified to include only those facilities that were confirmed to be actively offering services either by finding them in the electronic telephone books and by finding references to them on www.google.ca, or both.
Figure 3-1: Locations of the three categories of Ontario counties
69
3. The list of “community clinics” that provided services to injured workers and were eligible to bill the Workplace Safety and Insurance Board (www.wsib.on.ca/wsib/ wsiblocator.nsf/ClinicLocator? OpenForm) as of October 2003.
4. The list of organizations under contract to provide rehabilitation services to
Community Care Access Centre (CCAC) clients, as recorded on the websites of all the CCACs across Ontario in the summer and fall of 2001.
5. The “Clinics in Ontario” page of the website of the Ontario Athletic Therapist
Association (http://www.athletictherapist.on.ca) as of the fall of 2003. 6. The CPO Database (described above in section 3.3.2.1).
For each of the entries on the composite list, the name of the individual or organization
was recorded as well as the address, telephone number and postal code. Three part-time research
assistants (NL, JP and PG) helped consolidate the list of organizations. The same sorts of issues
emerged with duplications and similarities as for the CPO database, and the same techniques
were used to resolve them. As well, the findings for the CPO database informed some of the
decisions for the larger composite database.
3.2.3.2 ANALYSIS OF THE DATA In October to December 2004, before the composite list was finalized for analysis for the
purposes of this study, the list as it existed at that point was used to draw up the list of potential
participants for the survey of physiotherapy organizations in 12 counties, described below in
section 3.3.4.
After the first mailing of survey questionnaires, it became apparent that a significant
number of the organizations in the 12-county list had disappeared from the market (for example,
their questionnaires were returned by Canada Post as undeliverable). This confirmed a finding
that also emerged during the development of the CPO list, that there was considerable movement
in this market. Consequently, it was decided to investigate the phenomena of entry, exit and
survival formally but given the status of the data collection efforts, in a limited way. Research
Question 4 was formulated, and further readily available data were collected, expanding the
database. Each of the sources for the composite list again in a second wave in the first three
months of 2005 to provide an opportunity to assess the fluctuations in the market; the list of
CCAC contractors was updated in January 2006.
For each of the sources, and for each of the first and second waves, the organizations
were coded as ‘0’ or ‘1’ for each source, with ‘0’ signifying that an organization did not appear

70
in a particular source list in a particular wave, and ‘1’ if it did. In addition, Statistics Canada’s
Postal Code Conversion File290;291 was used to identify the county for each of the organizations
in the composite list.
In the analysis of entry, exit and survival in the market in section 7.2, Chapter 7, presence
in the market means that in 2003 or 2005, there was at least one ‘1’ recorded in the database.
Entry into the market means that an organization was not present in 2003 but was present in
2005. Exiting the market means that an organization was present in 2003 but not in 2005.
“Survivor” means that an organization was present in the market in 2003 and was also present in
2005; “survival” has a corresponding meaning, and “survival rate” is the percentage of
organizations present in the market in 2003 that were also present in 2005. An organization
categorized as a “preferred provider” means that it was identified from the lists of WSIB
providers, OHIP designated clinics, and providers with contracts with CCACs. An organization
identified as a “CPO organization” appeared in the CPO database (section 3.3.2.1).
3.2.4 Survey of physiotherapy provider organizations in 12 counties
To answer the research questions about certain predicted market behaviours of the
strategic provider groups and about foreign investment in the market, original data were
collected by way of a survey to supplement the data described above. The necessary information
was in these categories:
the corporate structure, ownership, and for-profit/not-for-profit status of
provider organizations;
the kinds of therapists involved in the organizations;
the kinds of clients served by the organizations;
the kinds of services organizations provided in addition to physiotherapy
services;
the profile of the organizations’ revenue sources;
the length of organizations’ wait lists; and,
the competition organizations faced.
Funding for the administration of the survey and the subsequent coding was also
provided under the auspices of the project funded by the Canadian Institutes for Health Research
and referred to above, called “Public & Private in Financing & Delivery: Trends in Private
Sector Delivery of Health Care Services in Key Sectors and Its Relationship to that Sector’s
Market Structures and Financing”.
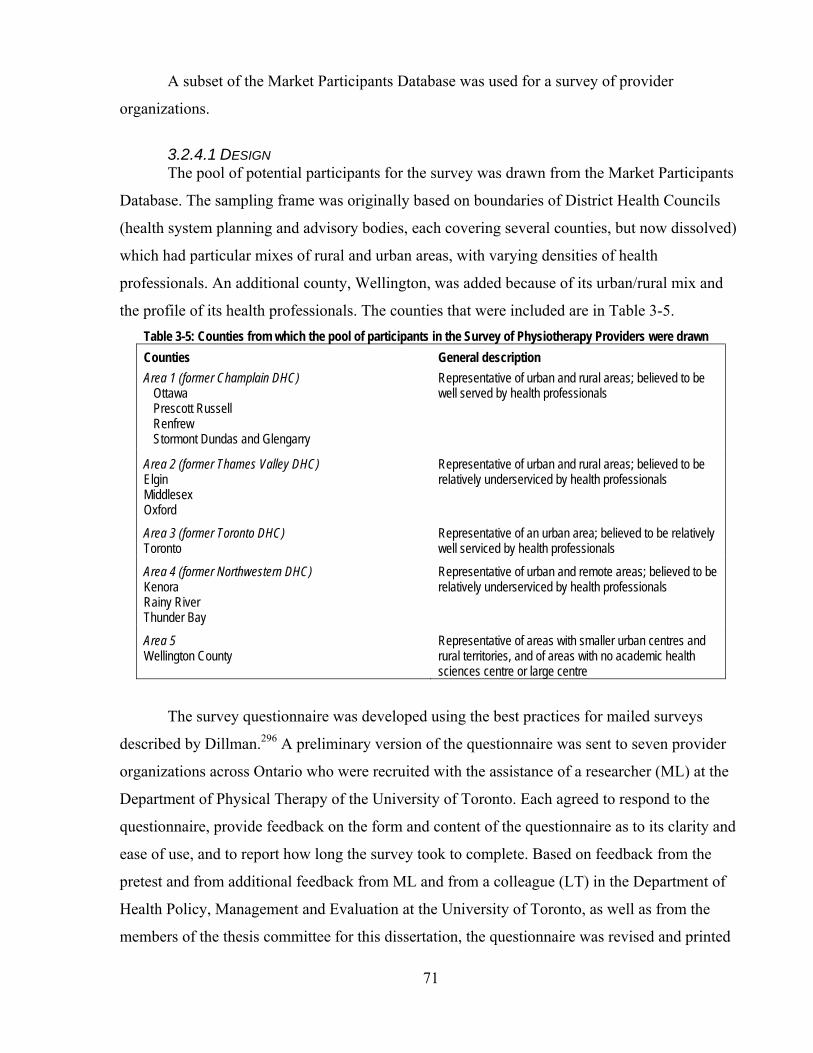
71
A subset of the Market Participants Database was used for a survey of provider
organizations.
3.2.4.1 DESIGN The pool of potential participants for the survey was drawn from the Market Participants
Database. The sampling frame was originally based on boundaries of District Health Councils
(health system planning and advisory bodies, each covering several counties, but now dissolved)
which had particular mixes of rural and urban areas, with varying densities of health
professionals. An additional county, Wellington, was added because of its urban/rural mix and
the profile of its health professionals. The counties that were included are in Table 3-5. Table 3-5: Counties from which the pool of participants in the Survey of Physiotherapy Providers were drawn Counties General description Area 1 (former Champlain DHC)
Ottawa Prescott Russell Renfrew Stormont Dundas and Glengarry
Representative of urban and rural areas; believed to be well served by health professionals
Area 2 (former Thames Valley DHC) Elgin Middlesex Oxford
Representative of urban and rural areas; believed to be relatively underserviced by health professionals
Area 3 (former Toronto DHC) Toronto
Representative of an urban area; believed to be relatively well serviced by health professionals
Area 4 (former Northwestern DHC) Kenora Rainy River Thunder Bay
Representative of urban and remote areas; believed to be relatively underserviced by health professionals
Area 5 Wellington County
Representative of areas with smaller urban centres and rural territories, and of areas with no academic health sciences centre or large centre
The survey questionnaire was developed using the best practices for mailed surveys
described by Dillman.296 A preliminary version of the questionnaire was sent to seven provider
organizations across Ontario who were recruited with the assistance of a researcher (ML) at the
Department of Physical Therapy of the University of Toronto. Each agreed to respond to the
questionnaire, provide feedback on the form and content of the questionnaire as to its clarity and
ease of use, and to report how long the survey took to complete. Based on feedback from the
pretest and from additional feedback from ML and from a colleague (LT) in the Department of
Health Policy, Management and Evaluation at the University of Toronto, as well as from the
members of the thesis committee for this dissertation, the questionnaire was revised and printed

72
(Appendix 1). In addition, between the first and second mailings of the survey questionnaire,
complaints were received from two representatives of the Ontario Athletic Therapist Association
(OATA) regarding the wording of the heading for Question 2(b), “Assistants to regulated health
professionals”. The OATA representatives said that athletic therapists consider themselves
“professionals” and not “assistants” and said that they would encourage their members not to
complete the survey if the heading was not changed. Since the wording of the headings in
Question 2 of the survey had been intended to assist respondents through a lengthy list of
potential responses to Question 2 and not as an analytical assessment of the role of any of the
occupational groups, the heading was changed for the second mailing to “Other practitioners”.
The unit of analysis in the survey, as for the study generally, was the individual
“physiotherapy provider organization” or “provider organization” in which or through which
care was provided, not the individual health professional or practitioner. If a number of
“provider organizations” were owned by a corporation, there were specific questions asked in the
survey questionnaire (Questions 20-23) to establish the affiliation of those provider organizations
with the larger corporate body. In the survey questionnaire, the term used for the individual
provider organization was “setting” and corporately-affiliated “settings” were called the
“organization”. These terms were pre-tested and had resonance from the pre-test respondents.
The method of recruitment was an invitation/information letter mailed with a copy of the
questionnaire. The first invitation/information letter (Appendix 2) was mailed in early 2005.
Responses to the first invitation were monitored, and those potential participants who did not
respond within three weeks were sent a reminder card (Appendix 3). Those who did not respond
within another three weeks were sent a second invitation/information letter (Appendix 4) with a
second copy of the questionnaire.
Approximately seven business days after the second invitation/information letter was
mailed, a phone call was made to all potential participants to ensure that the survey had been
received, and if not, another survey was mailed. In the same telephone call, if possible, the
question was asked whether the organization provided physiotherapy services to help establish
whether it was appropriate to mail a third copy of the questionnaire. The answer to this question
was recorded by the research assistants who made the telephone calls. If the answer was ‘yes’
and no survey had been received or another copy was requested, another questionnaire was sent.
If the answer was ‘no’, no further communication with the organization was undertaken.
73
The survey was mailed to 1310 organizations identified as potentially providing
physiotherapy services. The overall response rate was 52.1%, after removing those organizations
(n=351) that appeared to have gone out of business by the time of the survey (because their
questionnaires were returned by Canada Post as undeliverable or no telephone could be found to
confirm their continued presence in the market) or who were additionally identified as
duplicates. Of the 500 responses received, 346 respondents returned questionnaires indicating
that they provided physiotherapy services.
Since the majority of the questions in the survey were focused on the business side of the
provider organization (staff makeup, revenues, fees charged and competition, for example) rather
than clinical aspects, it was suggested both on the survey form and in the information/invitation
letter that:
The onsite Administrator or Manager of your Organization, or other person who knows about the services you have provided and the clients you have served, should complete this questionnaire. If your Organization is a hospital, long-term care facility, workplace, school or other institution, the Administrator or Manager of the rehabilitation or physiotherapy unit may be the best person to complete this questionnaire.
As is common in surveys, not all respondents answered all the questions. For example,
not all hospital respondents to the survey answered the question about whether they had NFP
status (Question 25), but the hospitals’ NFP status was imputed after examining the respondents’
answers to Questions 23 (corporate form), Question 15 (sites for delivery of physiotherapy
services, including inpatient and outpatient hospital sites), Question 9 (proportion of revenue
from a hospital’s global budget, and sometimes the original organization listing and relevant
websites (corporate or www.google.ca, www.yellowpages.ca).
As well, another key independent variable in this study is ownership of a physiotherapy
organization, that is, whether it is owned by a registered physiotherapist or not. Not all
respondents answered the question (Question 22) directly. For example, some responses from
NFP corporations left this question blank. This is understandable because the identity of the
owner of such a corporation is difficult: as a legal matter, there is no “owner” other than the
corporation itself, and the members control but do not own the corporation through their
appointments to a board of directors (see Chapter 2, section 2.2.2.3). Where the ownership
question was not answered, it was imputed from Question 25 (non-profit status), Question 23
(corporate form) and Question 24 (corporate/partnership domicile). In the few cases in which
74
there was still some doubt about the status, additional sources such as original database listing
and relevant websites were used to validate it.
Another example of imputation is the case in which a provider organization responded to
a question asking for the percentages of patients, services or revenues in various categories but
the total of their recorded percentages was, for example, 99% or 101% rather than 100%. In such
cases, the decision was made, rather than to discard these responses, to adjust them to total 100%
while retaining the proportions actually recorded by the respondents by multiplying each
recorded percentage by 100/99 if they totaled 99%, for example.
In the case of each of seven provider organizations in this survey, two survey
questionnaires were mailed in and received. This appears to have occurred because a reminder
card was sent out while the first response was on its way from the provider organization and the
provider organization, upon receiving the reminder, filled in the survey and submitted it again. A
decision was made to record the response received second as a duplicate and to exclude it from
the analysis.
All data were entered by a single individual (JP) into a SAS database, using the
Codebook in Appendix 5. After the data were entered, the data were examined question by
question for outliers and unusual or unlikely values or responses, and the original survey
questionnaires were examined to ensure accurate recording in such cases. If errors were found,
necessary corrections were made.
Using the unique identifier recorded in the database of potential respondents and the
identifier on the response forms, each respondent’s county was recorded in the database as well.
3.2.4.2 SAMPLE SIZE Since this survey appears from a review of the peer-reviewed literature and grey literature
to be the first of its kind and breadth to be conducted in this market, no guidance as to
appropriate sample size could be gained from reports in the literature of pilot studies or previous
studies in the literature, as is commonly recommended.297 It was also not feasible to conduct a
preliminary sample. Consequently, the sampling frame was chosen broadly, and the adequacy
and validity of the sample of responses to the survey were assessed by comparing the
respondents’ geographical distribution and organization size as measured by head count of
regulated therapists against the physiotherapy organizations available from the list on the website
of the College of Physiotherapists of Ontario. Necessarily, this meant that the validation was
possible with respect only to the part of the market that engages regulated therapists.
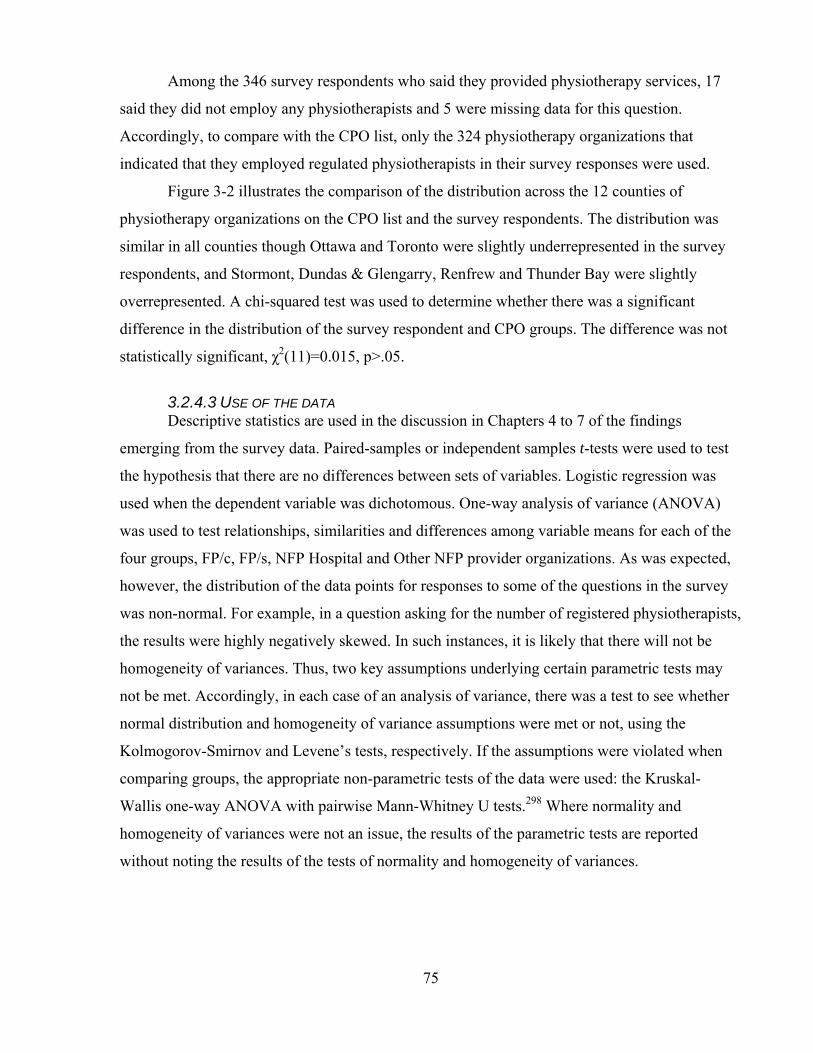
75
Among the 346 survey respondents who said they provided physiotherapy services, 17
said they did not employ any physiotherapists and 5 were missing data for this question.
Accordingly, to compare with the CPO list, only the 324 physiotherapy organizations that
indicated that they employed regulated physiotherapists in their survey responses were used.
Figure 3-2 illustrates the comparison of the distribution across the 12 counties of
physiotherapy organizations on the CPO list and the survey respondents. The distribution was
similar in all counties though Ottawa and Toronto were slightly underrepresented in the survey
respondents, and Stormont, Dundas & Glengarry, Renfrew and Thunder Bay were slightly
overrepresented. A chi-squared test was used to determine whether there was a significant
difference in the distribution of the survey respondent and CPO groups. The difference was not
statistically significant, χ2(11)=0.015, p>.05.
3.2.4.3 USE OF THE DATA Descriptive statistics are used in the discussion in Chapters 4 to 7 of the findings
emerging from the survey data. Paired-samples or independent samples t-tests were used to test
the hypothesis that there are no differences between sets of variables. Logistic regression was
used when the dependent variable was dichotomous. One-way analysis of variance (ANOVA)
was used to test relationships, similarities and differences among variable means for each of the
four groups, FP/c, FP/s, NFP Hospital and Other NFP provider organizations. As was expected,
however, the distribution of the data points for responses to some of the questions in the survey
was non-normal. For example, in a question asking for the number of registered physiotherapists,
the results were highly negatively skewed. In such instances, it is likely that there will not be
homogeneity of variances. Thus, two key assumptions underlying certain parametric tests may
not be met. Accordingly, in each case of an analysis of variance, there was a test to see whether
normal distribution and homogeneity of variance assumptions were met or not, using the
Kolmogorov-Smirnov and Levene’s tests, respectively. If the assumptions were violated when
comparing groups, the appropriate non-parametric tests of the data were used: the Kruskal-
Wallis one-way ANOVA with pairwise Mann-Whitney U tests.298 Where normality and
homogeneity of variances were not an issue, the results of the parametric tests are reported
without noting the results of the tests of normality and homogeneity of variances.
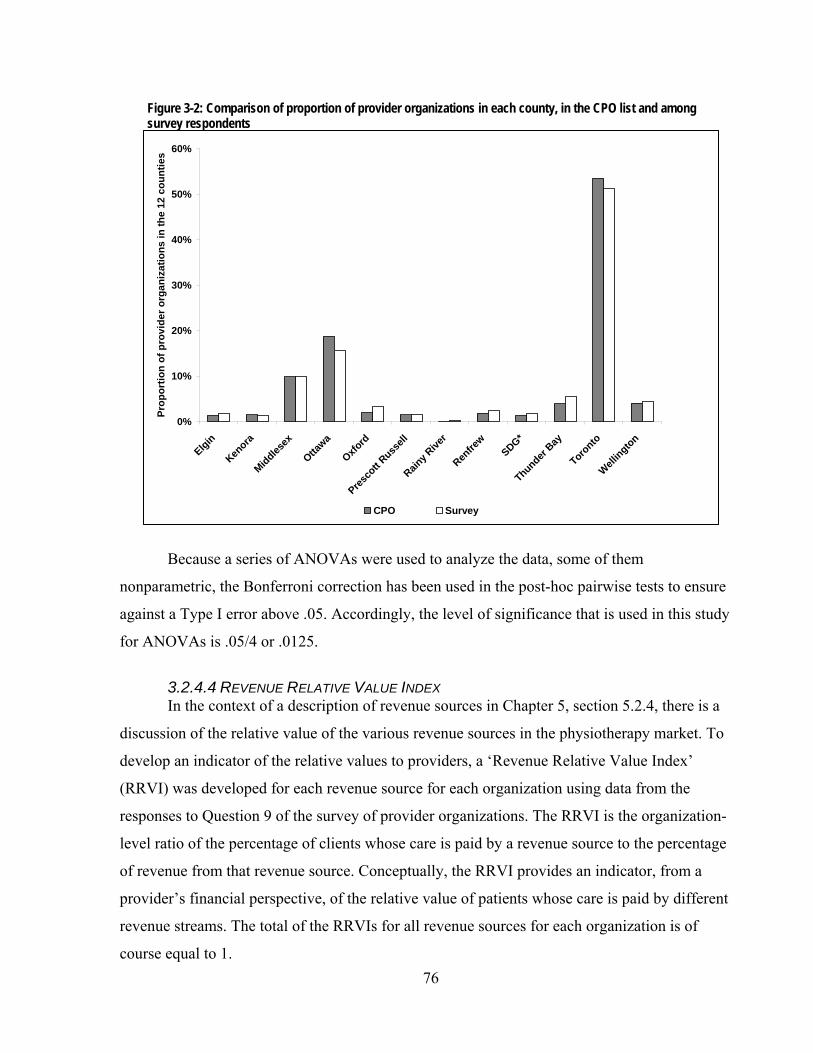
76
Because a series of ANOVAs were used to analyze the data, some of them
nonparametric, the Bonferroni correction has been used in the post-hoc pairwise tests to ensure
against a Type I error above .05. Accordingly, the level of significance that is used in this study
for ANOVAs is .05/4 or .0125.
3.2.4.4 REVENUE RELATIVE VALUE INDEX In the context of a description of revenue sources in Chapter 5, section 5.2.4, there is a
discussion of the relative value of the various revenue sources in the physiotherapy market. To
develop an indicator of the relative values to providers, a ‘Revenue Relative Value Index’
(RRVI) was developed for each revenue source for each organization using data from the
responses to Question 9 of the survey of provider organizations. The RRVI is the organization-
level ratio of the percentage of clients whose care is paid by a revenue source to the percentage
of revenue from that revenue source. Conceptually, the RRVI provides an indicator, from a
provider’s financial perspective, of the relative value of patients whose care is paid by different
revenue streams. The total of the RRVIs for all revenue sources for each organization is of
course equal to 1.
Figure 3-2: Comparison of proportion of provider organizations in each county, in the CPO list and among survey respondents
0%
10%
20%
30%
40%
50%
60%
Elgin
Kenora
Middlesex
Ottawa
Oxford
Presco
tt Russ
ell
Rainy R
iver
Renfre
wSDG*
Thunder Bay
Toronto
Wellington
Prop
ortio
n of
pro
vide
r org
aniz
atio
ns in
the
12 c
ount
ies
CPO Survey

77
3.2.5 Key informant interviews
An additional source of data for this study was a series of key informant interviews.
There were two main objectives in interviewing key informants. The first was to validate and
refine some of the observations that emerged from the other data sources. The key informant
interviews afforded the opportunity to probe alternative explanations for certain patterns with
people who were knowledgeable and active in the market. To accommodate this first objective,
the interviews were conducted in January, February and March 2007, after the preliminary
analysis of documents (section 3.2.1), existing data files (section 3.2.2), the market participants
database (section 3.2.3), and the survey of physiotherapy provider organizations (section 3.2.4).
The second objective was to find out from key informants how they weigh, prioritize and
integrate information and beliefs about the physiotherapy market in Ontario to address the
challenges and opportunities of that market.
3.2.5.1 DESIGN When the key informant interview protocol and questions were conceived, it was
considered that subjects would be leaders in the physiotherapy or rehabilitation market having
considerable experience and knowledge, particularly with knowledge of the pattern of domestic
and foreign investment in the physiotherapy market as well as of the motivations of former,
actual and potential new domestic and foreign investors. The list of individuals invited to
participate included researchers, professional advisors to investors (for example, lawyers) as well
as executives of provider organizations, insurers and other organizations involved in the market.
Given the makeup of the group of potential participants, the interview questions and
process were designed with “elite” interviewees in mind. This meant the questions were designed
to pursue a “receptive strategy”, that is, generally using open questions to allow interviewees
freedom to respond beyond the theory-driven expectations. However, this initial strategy was
designed to be supplemented by a more “assertive strategy” in the prompts and questions about
comparative effects of different, theory-driven factors on different organization types.299;300 The
interviews were semi-structured so that there was a standardized set of established questions to
ensure coverage of all the issues under investigation in this phase of data collection and
comparability of data collected but the questions were able to be modified during the interviews
as necessary to adapt to the situations, to the interviewees and to the conversations as they
unfolded.301

78
The Interview Guide that was used in the interviews is in Appendix 6. As the Guide
shows, there was a wide variety of questions, from broad to relatively narrow maximize
opportunities for participants to expound on the broad features of the market with which they
were most familiar. The interviews started with broad questions about the general health care
environment in Ontario, then moved to more specific questions (for example, asking participants
to assess the attractiveness of specific payers) and then reverted to general, broad questions
asking for an assessment of the attractiveness of the market from a foreign investor’s
perspective.
The dynamism in the interviews provided different paths through the Interview Guide.
For example, the first substantive question in the Interview Guide and in the interviews was
about the factors in the general health care environment of Ontario that affect providers’
decisions to enter, stay in or leave the physiotherapy market. Some key informants, upon being
asked the first question, chose to discuss issues that could have been raised in response to more
specific questions later in the interview. Their responses were recorded as they were given, and
key informants were prompted where necessary for more information or detail. Any aspects of
the later questions not covered were specifically asked by the end of the interview.
One of the last questions in the interview was about whether American investors should
be interested in entering the Ontario physiotherapy market. This question was designed to serve
two purposes: (1) to prompt key informants to provide the highlights of the answers they had
given throughout the interview as the most salient features of the market from a provider’s point
of view, and (2) to probe the key informants to reflect on the issue as if they were not involved in
the market, to separate their own current attachment to the market from their comments.
The content of the questions was designed and structured to capture elements of Porter’s
five-forces model15 described in Chapter 2. Table 3-6 provides a concordance of the questions in
the Interview Guide with the competitive strategy concepts Porter used in his model.
3.2.5.2 CONDUCT AND REPORTING OF THE INTERVIEWS Invitations to participate were sent to a total of 19 individuals. Fifteen were identified in
consultation with the thesis committee for this dissertation, and four others were suggested by
potential interview participants.
The initial approaches to the potential participants varied. In most cases, an email with a
condensed version of the information letter about the project was accompanied by a pdf file of a
letter with information about the interviews and an invitation to participate (see Appendix 7),
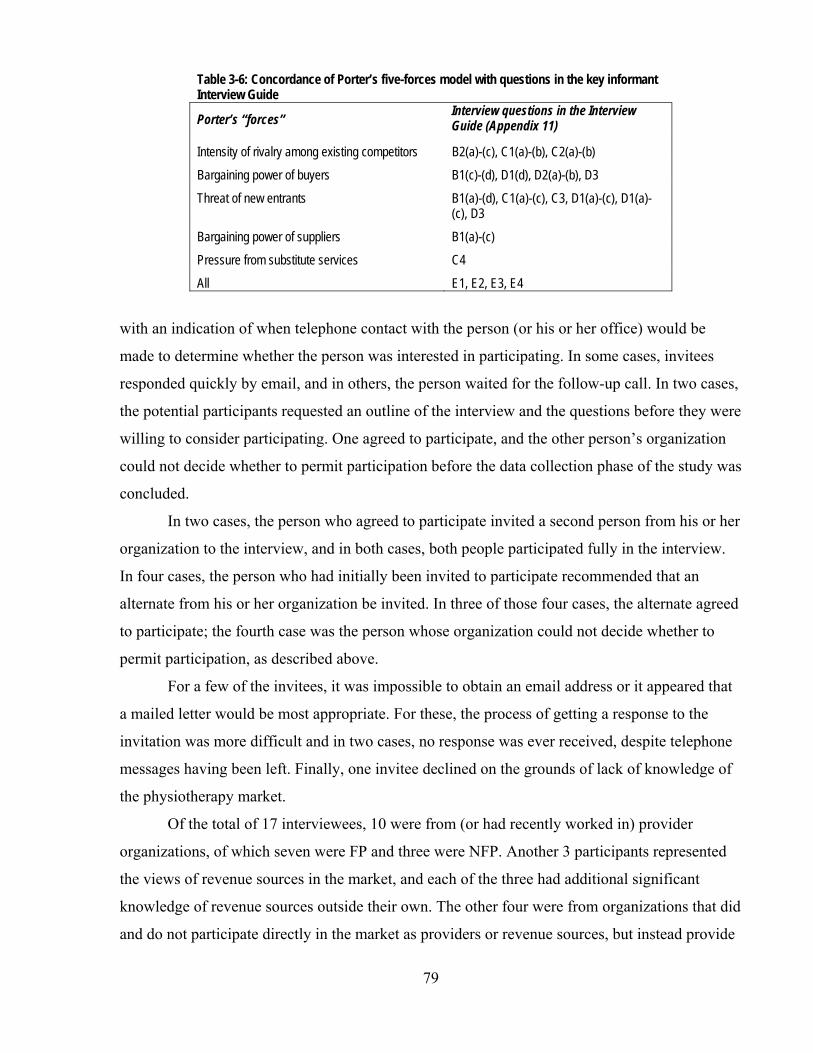
79
Table 3-6: Concordance of Porter’s five-forces model with questions in the key informant Interview Guide
Porter’s “forces” Interview questions in the Interview Guide (Appendix 11)
Intensity of rivalry among existing competitors B2(a)-(c), C1(a)-(b), C2(a)-(b)
Bargaining power of buyers B1(c)-(d), D1(d), D2(a)-(b), D3
Threat of new entrants B1(a)-(d), C1(a)-(c), C3, D1(a)-(c), D1(a)-(c), D3
Bargaining power of suppliers B1(a)-(c)
Pressure from substitute services C4
All E1, E2, E3, E4
with an indication of when telephone contact with the person (or his or her office) would be
made to determine whether the person was interested in participating. In some cases, invitees
responded quickly by email, and in others, the person waited for the follow-up call. In two cases,
the potential participants requested an outline of the interview and the questions before they were
willing to consider participating. One agreed to participate, and the other person’s organization
could not decide whether to permit participation before the data collection phase of the study was
concluded.
In two cases, the person who agreed to participate invited a second person from his or her
organization to the interview, and in both cases, both people participated fully in the interview.
In four cases, the person who had initially been invited to participate recommended that an
alternate from his or her organization be invited. In three of those four cases, the alternate agreed
to participate; the fourth case was the person whose organization could not decide whether to
permit participation, as described above.
For a few of the invitees, it was impossible to obtain an email address or it appeared that
a mailed letter would be most appropriate. For these, the process of getting a response to the
invitation was more difficult and in two cases, no response was ever received, despite telephone
messages having been left. Finally, one invitee declined on the grounds of lack of knowledge of
the physiotherapy market.
Of the total of 17 interviewees, 10 were from (or had recently worked in) provider
organizations, of which seven were FP and three were NFP. Another 3 participants represented
the views of revenue sources in the market, and each of the three had additional significant
knowledge of revenue sources outside their own. The other four were from organizations that did
and do not participate directly in the market as providers or revenue sources, but instead provide

80
advisory services to or advocacy services for participants (mostly providers) in the market. Of
these four, one was drawn from the wider rehabilitation field for a different perspective. The
participants’ experience in the market ranged (at the time of the interviews) from nine years to
30, with the majority having about 20 years in the market. The participants with the least
experience (less than 10 years in the market) were from provider organizations. Twelve of the
participants were female and five were male.
The 15 interviews of the 17 participants were conducted in January, February and March
2007 at times and places that were convenient for the interviewees. Thirteen of the interviews
were in person and 2 were by telephone. The length of the interviews varied between about 46
and 95 minutes, with the majority lasting about one hour.
By the thirteenth interview, very few new points were emerging, though obviously
emphasis varied according to the perspectives of the key informants. Since saturation had been
reached among the interviewees, no further interviews with similar participants were sought but
the final two scheduled interviews were conducted. A sixteenth interview, a time for which was
being negotiated before the time of the thirteenth interview, would have been conducted, but as
noted above, consent from the potential participant’s organization did not materialize before the
conclusion of the data collection phase at the end of March 2007.
Where key informants’ comments and views are discussed in Chapters 4 to 8, they are
paraphrased rather than quoted (to protect the confidentiality and anonymity of the participants)
and the informants whose views are presented are indicated by an alphanumeric code, where “P”
signifies an informant’s affiliation with a provider organization, “R” signifies a revenue source
affiliation, and “O” signifies the other affiliations. The numbers in the codes (for example, P-1 or
O-4) differentiate the informants.
As indicated above, the interviews were semi-structured to elicit from the individual
participants their observations of what they believed were the important elements of the
physiotherapy market, based on their knowledge and experience. This meant that participants did
not all address or mention all of the same aspects of the market. Accordingly, when key
informants’ views are discussed in Chapters 4 to 8 in relation to an issue, only those key
informants who mentioned the issue are indicated as sources with the appropriate alphanumeric
codes. The number of alphanumeric codes indicates whether an issue was widely or narrowed
viewed as important in the context of the interviews, and whether the views were of informants
from any of the provider, revenue source or other groups. If the key informants who discussed an

81
issue were in accord on that issue, the fact that there was no contrary view expressed by a key
informant is not recorded in this report, for the convenience of the reader and the flow of the text.
Though instances of disagreement were infrequent, when there was disagreement, the nature and
extent of the disagreement is specifically noted.
3.2.5.3 ANALYSIS – CODING The interviews were all transcribed and were analyzed with the assistance of NVivo 7
software. The initial codes that were used are the following, based on the areas of inquiry in the
interviews:
1. General health care environment 11. Bundled services
2. Political factors 12. Other providers – chiropractors, sports medicine, massage therapists 3. Taxes and regulation
4. Potential for growth – Ontario 13. Multiple payers 5. Potential for growth – elsewhere 14. One or more payers better 6. Small physiotherapist providers’ roles - Ontario 15. Preferred payers 7. Small physiotherapist providers’ role – elsewhere 16. Predominant payer 8. Level of competition 17. Advice to a new provider 9. Preferred provider networks 18. US investor in Ontario – why or why not? 10. Other referral sources 19. Other
In the course of the initial analysis, it was clear that different coding was necessary to
draw most deeply from the interviews, and the transcripts were recoded using this set of codes:
General systems issues Health human resources 1. Aging pop’n/baby boomers affect demand for physio 29. Two generations of health professionals 2. Willingness to pay out of pocket 30. Recruitment and retention a problem or not 3. Regulation of insurers – effect 31. The role/use of support personnel (general) 4. Regulation or demands by insurers – effect on
providers 32. Generalists versus specialized physiotherapists 33. Foreign-trained therapists
5. Regulation of providers and effect on them 34. Substitutes/competition: chiropractors 6. Effects of changes in hospitals 35. Substitutes/competition: kinesiologists 7. Effect of home care/CCAC changes 36. Substitutes/competition: massage therapists 8. Specialized clinics 37. Substitutes/competition: other professionals 9. Insurance affects who/what is covered 38. Other 10. Physician referrals and relationships 11. Demand varies seasonally The role of the small provider in the market 12. Presence and perception of US providers 39. Is changing 13. Preferred provider networks 40. Is different from the large provider 14. Other 41. Is the same as large provider 42. Other Accountability = Data collection & reporting to payers 15. Affects a provider’s business (keeping track of
outcomes) Opportunities for growth 43. In Ontario –baby boomers
16. Affects quality improvement by providers 44. In Ontario –other groups and practice areas 17. Effects on small providers 45. Outside Ontario –specific provinces 18. Effects on large providers 46. Outside Ontario –United States

82
19. Providers’ ability to comply with accountability requirements
47. Role of marketing 48. Other
20. Other Ranking revenue sources Key challenges 21. Payer(s) with best and worst fees 49. Complexity of payers 22. Effect of payer billing rules (in eyes of providers) 50. Complexity in accountability requirements 23. Patients are billed to avoid dealing with insurers 51. Business skills, business plans and experience 24. Mixing revenue sources – providers 52. Competition is heavy or not 25. Effect of change in MVA fees in 2003 53. Quality 26. Other fees affect providers 54. Fee levels 27. Comparison with US billing arrangements 55. Economies of scale 28. Other 56. Other
An impartial researcher supplemented the coding process by independently coding two (13.3%)
of the transcripts, and there was agreement on 94.4% of the coding, validating the process.
3.2.6 Ethics and confidentiality
3.2.6.1 SURVEY OF PHYSIOTHERAPY ORGANIZATIONS A one-year ethics approval from University of Toronto Health Sciences I Research Ethics
Board for the survey of physiotherapy organizations was obtained on August 6, 2004 (Protocol #
12125; see Appendix 8). An amendment of the protocol to authorize a follow-up phone call was
approved on May 31, 2005 (Protocol #14417; see Appendix 9). A one-year renewal of the ethics
approval was obtained on July 26, 2005 (Protocol #14891; see Appendix 10); two further one-
year renewals were approved on August 18, 2006 (Protocol #18138; see Appendix 11) and
August 28, 2007 (Protocol #20873, see Appendix 12).
Confidentiality undertakings were made to all participants in the information letter
inviting participation and on the survey questionnaire itself in the following format:
First information letter: When we receive your response, the information in it will be aggregated with all other responses and your response will be kept confidential. The number on your questionnaire will be used only to monitor returns and to prevent re-mailing to those who have already responded. Completed questionnaires will be kept in a secure, locked location in the Graduate Department of Health Policy, Management and Evaluation at the University of Toronto with access only by the University research team. All questionnaires will be destroyed within two years of the study’s end. Individual data will not be shared with any other organization and no information which could identify you or your organization will ever be released.

83
Survey questionnaire: Assurance of Privacy and Confidentiality Completed questionnaires will be kept in a secure, locked location in the Department of Health Policy, Management and Evaluation at the University of Toronto, and will be accessed only by the research team. Individual data will not be shared with any other organization and no information which could identify you or your organization will ever be released.
3.2.6.2 KEY INFORMANT INTERVIEWS An application for ethics review and approval to proceed with the key informant
interviews was made to the University of Toronto’s Health Sciences I Research Ethics Board on
November 30, 2006. On December 11, 2006, approval was given to proceed (Protocol #19127;
see Appendix 13).
In all 15 interview sessions, consent for all interviews and audio recording was obtained
in the form in Appendix 14 or, in one of the cases in which the interview was conducted by
telephone, the key informant emailed the principal investigator with an acknowledgement that
he/she had read and understood the consent form and agreed to participate under the terms and
conditions laid out in the consent form.
Confidentiality undertakings were made to the participants in the information letter
inviting participation, on the consent form and verbally in the interview. The confidentiality
undertakings were worded on the information letter in the following format:
The questions will cover such areas as the characteristics of the revenue sources in the market and the general health care and business environment. The questions will not seek any personal or confidential information other than the general source of your knowledge of the physiotherapy market. Your anonymity will be maintained at all times during this study. All information gathered will be kept in a secure location and will be destroyed within 20 months of your interview. Any data presented publicly (including any quotations, if applicable) will be presented in a manner so that it will not be possible to identify you as the source of data unless the information is already in the public domain or you give your express permission at some later date.
3.3 Outline of subsequent chapters
In the following chapters, the data and analysis are reported and applied to develop an
understanding of the Ontario physiotherapy market and to answer the research questions.
Chapter 4, a broad description of the physiotherapy market in Ontario, also looks at supplier
power and threat of substitutes. Chapter 5 addresses the issue of buyer power or revenue sources,
while Chapter 6 provides an analysis of the issues related to the rivalry of strategic provider

84
groups in the physiotherapy market. The threat of new entrants to the physiotherapy market is
examined in Chapter 7, and in Chapter 8, all the perspectives about the market are integrated to
answer the five research questions directly and to make broader observations.

85
Chapter 4 – Overview of the physiotherapy market
This chapter begins with a short survey of recent literature, reports and the views of key
informants regarding the current and future need for physiotherapy services in Ontario (section
4.1). All point to a generally rising though unquantified level of unsatisfied need or demand. This
information provides a context for understanding the dynamics of the physiotherapy market.
As a prelude to a more detailed examination of buyers and providers in Chapters 5 and 6,
section 4.2 introduces the groups of buyers and providers in the physiotherapy market, with an
indication of the complex relationships among them.
Section 4.3 discusses the services that are offered by provider organizations and section
4.4 describes the health professionals and others who deliver them. Section 4.4 includes an
analysis of data addressing the first component of the hypothesis for Research Question 1: the
extent to which FP/c, FP/s and NFP provider organizations differ in the use of non-
physiotherapists.
Section 4.5 considers the role of registered physiotherapists in the market – the demand
for them, their numbers, where they are in the province, and some general characteristics. A
discussion of geographic distribution addresses the second part of the hypothesis for the first
research question: that FP/c providers tend to concentrate in larger centres, NFP providers locate
in all areas, and FP/s providers share distribution characteristics of both FP/c and NFP provider
organizations.
4.1 Need for physiotherapy services
A few studies have attempted to establish the level of need for physiotherapy services in
Ontario, but not a lot is known. In a report to provide a basis for initiatives to enhance access to
care and services for people with arthritis, Badley & Glazier302 projected that there was a
growing need for physiotherapists and concluded that the distribution of physiotherapists should
be more aligned with the distribution of individuals with conditions such as arthritis.
More recently, Landry et al.,303 investigating rehabilitation services in Ontario for
policymakers, concluded that although it appeared that demands were not being fully met and
would increase in the future, there were insufficient data available to assess the extent of current
or future demand or the number of health human resources including physiotherapists that would
be required to meet any level of demand in the future.

86
A study by Passalent, Borsy & Cott287 looked at the availability of registered
physiotherapists (and occupational therapists) and the demand (which they defined as “need” and
“desire”) for services provided by those practitioners. They used a number of potential indicators
of demand, including reported utilization of service and the prevalence of a number of health
conditions that might lend themselves to treatment by physiotherapists: chronic conditions,
arthritis and rheumatism, back problems, repetitive strain injury and activity or participation
limitations. Their general conclusion from the prevalence data was that more people likely need
the services of physiotherapists than currently have access to them. They found that 7.6% of
Ontario residents accessed a physiotherapist (that is, at least one consultation) in 2003, but the
rate of access varied substantially from region to region across Ontario. They recommended that
publicly funded physiotherapist services be increased to increase and equalize availability of
service. However, they did not consider the extent to which the unsatisfied demand for
physiotherapy services might be satisfied by providers other than registered physiotherapists.
The majority of key informants (P-1, P-2, P-3, P-4, P-6, P-7, P-8, P-9, P-10, O-2, O-3, O-
4, R-1, R-3) said that one of the most important factors influencing the physiotherapy market,
like other parts of the health care system, is the aging of the population and the emergence of
baby boomers as the predominant consumers of health care in Canada. They said that the general
decrease in baby boomers’ physical function due to the natural processes of aging means that
there was and will continue to be an increasing potential for their use of the health care system.
These key informants said that, unlike previous generations, the baby boomers have a
broadly-shared expectation of a continuing high level of physical functioning while they age, and
they have significantly greater financial resources than previous generations. The first factor
means that in general baby boomers will demand health care services, including the kinds of
services provided in the physiotherapy market, in greater measure than previous generations. The
second factor means that they do or will have the power to bring pressure on the public system to
provide the services they want or will have the financial capacity to purchase those services
outside a publicly funded system.
They also talked about the baby boomers’ demands for health care services not simply
being in reaction to the onset of injury or disease, but also as a result of what one (P-4) called a
“low tolerance for morbidity”: they want the flexibility, the capacity and the continued
independence that comes from full physical function. Furthermore, another (P-3) said that baby
boomers were making demands on behalf of their parents, whose functional capacity may be
87
declining but who too may have the resources to ensure that continued independent living and
quality of life – as far as those can be derived from maintaining physical function. Several key
informants pointed to the prevention of injury and disease and health promotion as areas of
greater future demand in the market (this issue will be taken up in Chapter 6, section 6.3.2.4).
A key informant (O-4) noted that treatment of musculoskeletal and soft tissue injury is
predominant in the physiotherapy market now and for the last number of years and most research
and quality improvement activities have been in this area. This has been driven over the last
decades by the Workplace Safety and Insurance Board (“WSIB”) and the automobile (or motor
vehicle accident, “MVA”) insurers, who have paid for physiotherapy (and other) services for
people whose functioning has been reduced mostly through soft tissue injury. However, as the
population ages, there will be an increased importance of maintaining and improving function in
the face of cardiovascular disease, neurological disease and stroke, and the providers in the
market – and researchers – have not prepared themselves as well for patients’ demands for
demonstrably effective treatment in these areas.
Many of the key informants discussed the issue of whether baby boomers are willing to
purchase health care services outside the publicly funded system. Many said that with the decline
in publicly funded physiotherapy services – and most pointed to the decreased service available
in hospitals or on an outpatient basis (mentioned in Chapter 1 and discussed in sections 4.4.3.1 in
this Chapter and section 5.1.1 in Chapter 5) – there would be a natural increase in demand
because the utility of the services would be evident to baby boomers with injury, chronic disease
or the desire to maintain function. Two (O-1, R-2) noted the trend over the last decade of
employers offering executive medical benefits (physical examinations, stress tests, exercise and
dietary advice, and so on, provided by private clinics to senior executives of large corporations),
and one (O-1) said that private clinics would be attempting to broaden the appeal of such
services to the “middle class”. Three others (P-2, P-4, P-8) talked about opportunities for
personal trainer services that could be offered in the physiotherapy market for individuals willing
to pay for such services. Another (P-4) suggested that since it is usual to purchase services such
as chiropractic privately with out of pocket funds, it would eventually be the case that
physiotherapy services would be regarded in the same light.
Some (P-2, P-3, O-2) also talked about the increasing need for physiotherapy services
related to hospital-based surgical services, particularly the current cross-Canada emphasis on
decreasing wait times for hip and knee replacements. They said this is a potential source of

88
pressure for those services to be provided to be provided – and publicly-funded – by hospitals as
a way of managing the consequences of increased surgical throughput.
Overall, there was great confidence expressed by the majority of key informants that
baby boomers would provide a significant upward influence on demand for physiotherapy
services in the Ontario market. However, the key informants were less certain about the result of
that demand being exerted: whether it will result in services being publicly paid or privately paid.
4.2 Buyers and sellers
Landry28 provided a framework that introduces the complexity of the market and serves
as a guide to an examination of buyers and sellers of physiotherapy services in Ontario and the
potential relationships between them. Landry’s model of funding streams and delivery models is
reproduced here, with modifications, as Table 4-1 (next page).
The provider organization types were divided by Landry into public, private not-for-
profit and private for-profit “delivery models”. The strategic provider groups identified in
Chapter 2 for the purposes of this study correspond to Landry’s delivery models as indicated in
Table 4-2.
By “rehabilitation corporations”, Landry was referring to FP corporations, generally with
more than one location in the Ontario market. “Other corporations” means FP corporations
whose main business is not physiotherapy or rehabilitation but who provide some physiotherapy
services to their employees as a benefit or as part of a health and wellness service. “Sole owner
independents” are FP/s firms defined by Landry as having a single “owner” or sole proprietor. In
this study, FP/s firms include sole proprietorships and partnerships, as well as corporations the
Table 4-2: Correspondence of the four strategic provider groups identified in this study with Landry’s 9 “delivery models” Strategic provider groups
in this study Landry’s
“delivery models” FP/c Rehabilitation corporations
Other corporations FP/s Sole owner independent
Network-based independent NFP Hospital Public Hospital
Other NFP Government-owned hospital Other institutions Community organizations CCAC
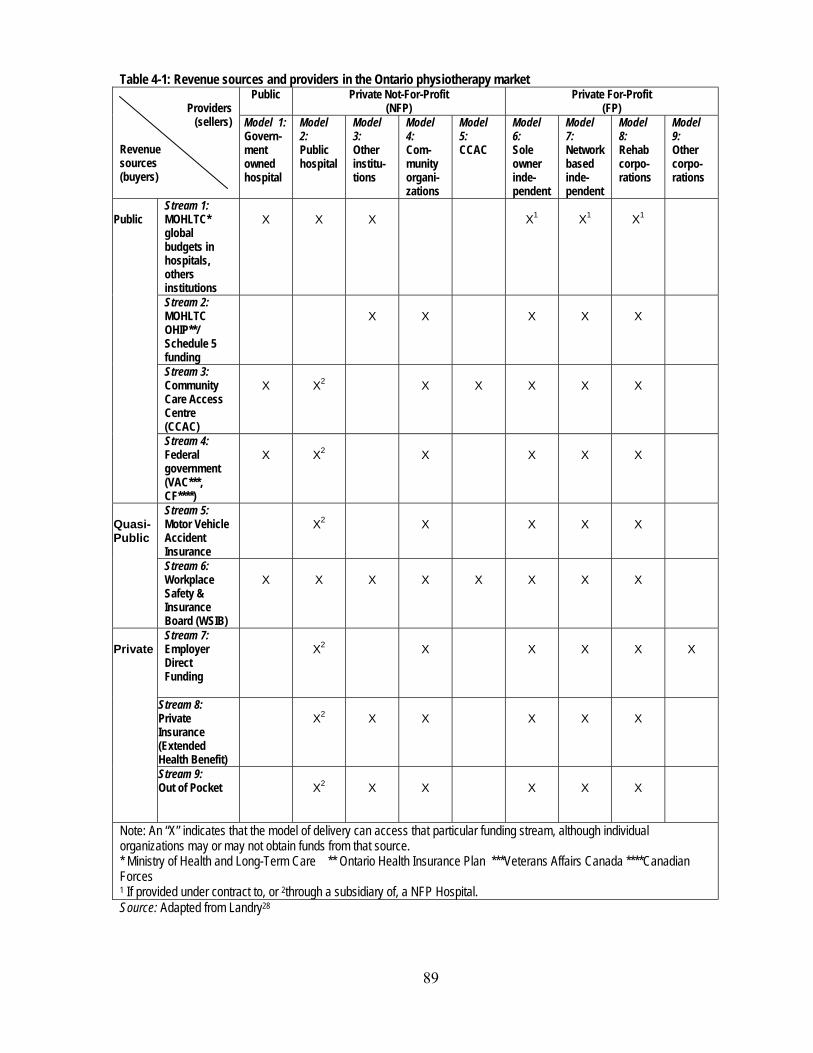
89
Table 4-1: Revenue sources and providers in the Ontario physiotherapy market
Providers (sellers)
Revenue sources (buyers)
Public Private Not-For-Profit (NFP)
Private For-Profit (FP)
Model 1: Govern-ment owned hospital
Model 2: Public hospital
Model 3: Other institu-tions
Model 4: Com- munity organi-zations
Model 5: CCAC
Model 6: Sole owner inde-pendent
Model 7: Network based inde-pendent
Model 8: Rehab corpo-rations
Model 9: Other corpo-rations
Public
Stream 1: MOHLTC* global budgets in hospitals, others institutions
X
X
X
X1
X1
X1
Stream 2: MOHLTC OHIP**/ Schedule 5 funding
X
X
X
X
X
Stream 3: Community Care Access Centre (CCAC)
X
X2
X
X
X
X
X
Stream 4: Federal government (VAC***, CF****)
X
X2
X
X
X
X
Quasi-Public
Stream 5: Motor Vehicle Accident Insurance
X2
X
X
X
X
Stream 6: Workplace Safety & Insurance Board (WSIB)
X
X
X
X
X
X
X
X
Private
Stream 7: Employer Direct Funding
X2
X
X
X
X
X
Stream 8: Private Insurance (Extended Health Benefit)
X2
X
X
X
X
X
Stream 9: Out of Pocket
X2
X
X
X
X
X
Note: An “X” indicates that the model of delivery can access that particular funding stream, although individual organizations may or may not obtain funds from that source. * Ministry of Health and Long-Term Care ** Ontario Health Insurance Plan ***Veterans Affairs Canada ****Canadian Forces 1 If provided under contract to, or 2through a subsidiary of, a NFP Hospital. Source: Adapted from Landry28
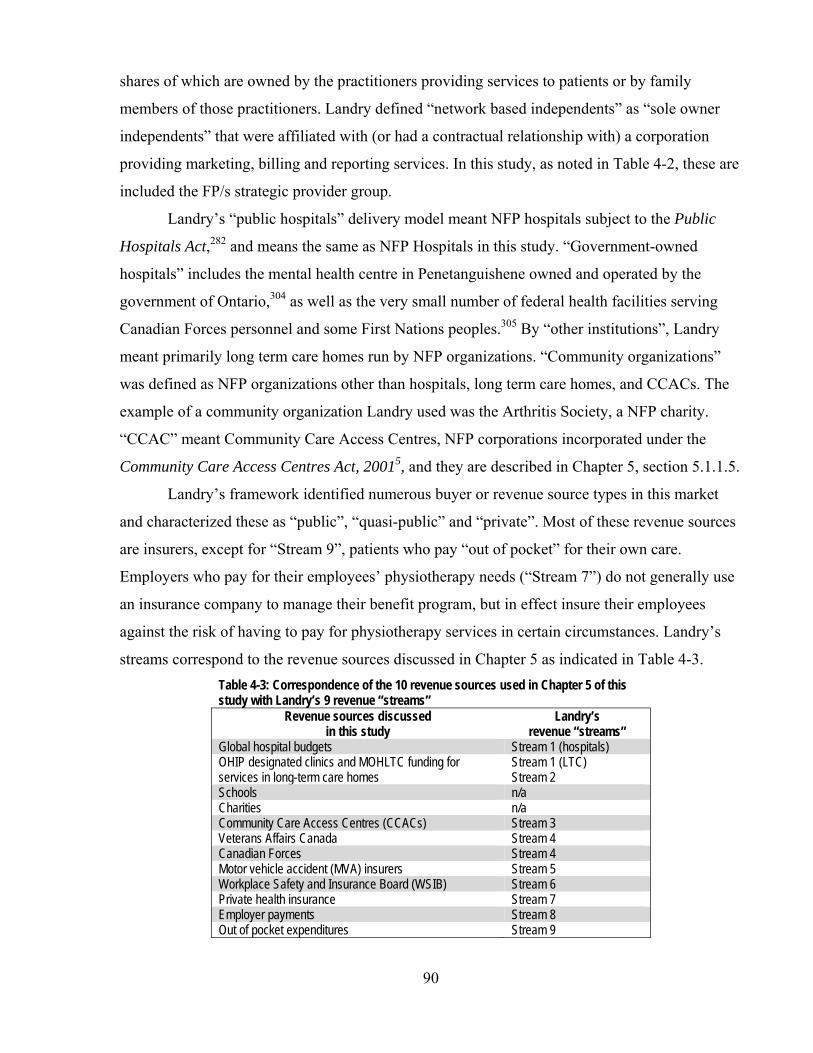
90
shares of which are owned by the practitioners providing services to patients or by family
members of those practitioners. Landry defined “network based independents” as “sole owner
independents” that were affiliated with (or had a contractual relationship with) a corporation
providing marketing, billing and reporting services. In this study, as noted in Table 4-2, these are
included the FP/s strategic provider group.
Landry’s “public hospitals” delivery model meant NFP hospitals subject to the Public
Hospitals Act,282 and means the same as NFP Hospitals in this study. “Government-owned
hospitals” includes the mental health centre in Penetanguishene owned and operated by the
government of Ontario,304 as well as the very small number of federal health facilities serving
Canadian Forces personnel and some First Nations peoples.305 By “other institutions”, Landry
meant primarily long term care homes run by NFP organizations. “Community organizations”
was defined as NFP organizations other than hospitals, long term care homes, and CCACs. The
example of a community organization Landry used was the Arthritis Society, a NFP charity.
“CCAC” meant Community Care Access Centres, NFP corporations incorporated under the
Community Care Access Centres Act, 20015, and they are described in Chapter 5, section 5.1.1.5.
Landry’s framework identified numerous buyer or revenue source types in this market
and characterized these as “public”, “quasi-public” and “private”. Most of these revenue sources
are insurers, except for “Stream 9”, patients who pay “out of pocket” for their own care.
Employers who pay for their employees’ physiotherapy needs (“Stream 7”) do not generally use
an insurance company to manage their benefit program, but in effect insure their employees
against the risk of having to pay for physiotherapy services in certain circumstances. Landry’s
streams correspond to the revenue sources discussed in Chapter 5 as indicated in Table 4-3. Table 4-3: Correspondence of the 10 revenue sources used in Chapter 5 of this study with Landry’s 9 revenue “streams”
Revenue sources discussed in this study
Landry’s revenue “streams”
Global hospital budgets Stream 1 (hospitals) OHIP designated clinics and MOHLTC funding for services in long-term care homes
Stream 1 (LTC) Stream 2
Schools n/a Charities n/a Community Care Access Centres (CCACs) Stream 3 Veterans Affairs Canada Stream 4 Canadian Forces Stream 4 Motor vehicle accident (MVA) insurers Stream 5 Workplace Safety and Insurance Board (WSIB) Stream 6 Private health insurance Stream 7 Employer payments Stream 8 Out of pocket expenditures Stream 9

91
Landry’s framework of providers has been adapted to show some additional relationships
between sellers and buyers that have emerged since his study, such as the ability of employers
and motor vehicle insurers to purchase services from FP or NFP subsidiaries of public (NFP)
hospitals, and a new “alternative payment” arrangement for OHIP-funded (“Stream 2”) services
in long term care homes. Also included are a wider range of sellers to the Workplace Safety and
Insurance Board (“Stream 6”).
Details of these revenue sources are reviewed in Chapter 5 and certain of the revenue
sources are singled out for deeper analysis to address strategic provider groups’ approaches to
the different contractual relationships available in the market. For current purposes, it is
sufficient to note that there are many possible combinations of buyers and sellers in a very
complex market. However, some provider types can have access to fewer buyers or revenue
sources than others. CCACs and government-owned hospitals can have the least. NFP Hospitals
can have only two sources (global budgets and WSIB) unless they incorporate subsidiaries to
deliver services to patients whose care is paid by other revenue streams. Community
organizations and FP providers can have access to almost all the revenue sources.
4.3 Services being bought and sold
The physiotherapy market was not defined for this study using an a priori list of services.
Instead, the approach was to identify providers of physiotherapy services and then to define the
services in the market as those identified by provider organizations – standalone private clinics
(FP/s and some Other NFP), different clinics owned by investor-owned corporations (FP/c and
some Other NFP), and rehabilitation or physiotherapy units in larger organizations, usually NFP
Hospitals. Respondents were asked this question:
3. In addition to physiotherapy, does your Setting provide the following services to clients?
Thirty-five different options for services were listed in Question 3, and for analytical
purposes, they were divided into two categories. “Common services” are those that were offered
by more than a third of all respondents to the survey. “Ancillary services” are those services that
are provided by less than a third of all respondent organizations, and Table 4-4 provides a
summary of the results.

92
Table 4-4: Proportions of physiotherapy provider organizations offering various services, by all providers and by strategic provider groups
All FP/c FP/s NFP
Hospital Other NFP n=346 n=41 n=228 n=43 n=34 Common services Physiotherapy 100.0% 100.0% 100.0% 100.0% 100.0% Exercise Therapy 87.3% 85.4% 87.7% 90.7% 82.4% Acupuncture 59.0% 65.9% 63.6% 53.5% 26.5% Functional Evaluations 53.2% 68.3% 48.7% 58.1% 58.8% Orthotics 46.0% 68.3% 42.5% 41.9% 47.1% Ergonomics 44.8% 61.0% 38.6% 65.1% 41.2% Manipulation Therapy 43.9% 63.4% 46.1% 30.2% 23.5% Ancillary services ADP* Evaluations 29.2% 36.6% 17.1% 67.4% 52.9% Occupational Therapy 28.9% 43.9% 12.7% 76.7% 58.8% Personal Training 27.5% 36.6% 28.5% 16.3% 23.5% Medical Services 27.2% 26.8% 15.8% 62.8% 58.8% Workplace Assessments 24.0% 34.1% 21.9% 27.9% 20.6% Nutritional/Weight Loss Counselling 23.7% 31.7% 16.2% 44.2% 38.2% Home Visiting 23.4% 22.0% 23.7% 23.3% 23.5% Cranial-sacral Therapy 22.8% 24.4% 27.2% 7.0% 11.8% Hydrotherapy 22.5% 26.8% 17.5% 41.0% 26.5% Psychological Evaluation 19.4% 29.3% 11.4% 34.9% 41.2% Case Management 17.1% 14.6% 11.8% 27.0% 41.2% Nursing Services 15.9% 22.0% 3.5% 53.5% 44.1% Audiology/SLP† 14.5% 12.2% 3.0% 51.2% 41.2% Chiropractic 13.6% 29.3% 12.0% 2.3% 17.6% Pilates 12.1% 12.2% 13.2% 4.7% 14.7% Vocational Rehabilitation 11.8% 14.6% 10.1% 16.0% 14.7% Recreation Therapy 11.3% 14.6% 3.5% 30.0% 35.3% DAC‡ Assessments 7.5% 14.0% 6.1% 9.0% 5.9% Home Making 5.2% 9.8% 2.2% 7.0% 17.6% Horticultural Therapy 4.3% 4.9% 2.2% 4.0% 17.6% Shiatsu 4.3% 4.9% 4.8% 0.0% 4.3% Music Therapy 4.3% 4.9% 0.9% 9.0% 20.0% Reflexology 3.8% 2.4% 4.4% 0.0% 5.9% Art Therapy 3.2% 7.3% 1.3% 7.0% 5.9% Naturopathic Medicine 3.2% 4.9% 3.9% 0.0% 0.0% Aromatherapy 2.9% 7.0% 2.6% 0.0% 2.9% Reiki 2.6% 2.4% 1.8% 0.0% 11.0% Tai Chi 1.7% 0.0% 1.3% 2.3% 5.9% Other 9.8% 7.3% 11.0% 7.0% 8.8% Source: Survey of Physiotherapy Provider Organizations, Question 3 * Assistive Devices Program of the Ministry of Health and Long-Term Care † Speech Language Pathology ‡ Designated Assessment Centre (see section 5.1.1.8)
Common services
The most common services, in addition to physiotherapy, were exercise therapy,
acupuncture, functional evaluations, orthotics, ergonomics, and manipulation therapy.
Exercise therapy was offered in over 80% of provider organizations responding to the
survey. This means that any patient, entering any of the provider organization types, would be

93
more likely than not to be able to find or encounter exercise therapy services. In the treatment of
physical injury and disability, and the pain that accompanies each, physical exercise is widely
seen by all professional groups as essential treatment. It is likely that all revenue sources would
pay for exercise therapy services as “physiotherapy”.
There is a difference in opinion in provider communities about acupuncture.306 On the
one hand, practitioners of Traditional Chinese Medicine (TCM) believe that acupuncture should
only be used in conjunction with a TCM assessment of bodily disharmonies and then only to
restore bodily balance. Others believe that acupuncture can be useful in conjunction with western
medicine concepts and understanding of anatomy and physiology for symptom relief and the
management of pain. The College of Physiotherapists first proposed a practice standard for
acupuncture in 1998,307 defining acupuncture in western rather than TCM terms as follows:
Acupuncture is a therapeutic treatment, which consists of inserting fine needles into the body at specific points along energy pathways or meridians. The age-old practice, which is widely used to relieve the symptoms of some physical and psychological conditions, is often integrated into the treatment of patients with pain or physical dysfunction.
The Ontario Physiotherapy Association308 reported in 2005 that 1600 members of its members,
or about a third of practicing physiotherapists, use acupuncture in their clinical practice. From
the survey results, it appears that almost two-thirds of the FP physiotherapy organizations offered
it in 2005, and more than half of the NFP Hospitals offer it as a service as well. Like exercise
therapy, acupuncture is probably paid for by all revenue sources. As will be shown in Chapter 5,
some revenue sources have specific fees for acupuncture and sometimes, as in the case of the
WSIB, the acupuncture fee is greater than for “physiotherapy”. For the other revenue sources, if
a physiotherapist provides acupuncture and bills for it, it is likely paid as “physiotherapy”.
Functional evaluations were also offered in the majority of provider organizations and
though this “assessment” function overlaps with the scope of practice for physiotherapists in the
Physiotherapy Act13 (discussed below in section 4.4.1), it is likely identified separately from
“physiotherapy” by some provider organizations because some revenue sources have different
rules for the payment of assessments. The WSIB, for example, sometimes requires a special
separate report concerning an injured worker’s “functional abilities”,309 and identifies a
“functional evaluation” as part of certain treatment protocols.310 A functional assessment is also
not specifically reimbursed by OHIP or by some private health insurers, and providers
commonly charge their patients for the functional evaluation or assessment.

94
The appearance of ergonomic assessments and advice within the common services
category (44.8% of respondents reported it) is also notable, as is the observation that workplace
assessments and counseling is the twelfth most frequently offered service (24.0% of the
organizations reported it). One of the key informants (P-3) commented that these sorts of
services – ergonomics and the accommodation of workplaces for injured workers – should be
widespread but that the market for these services has not been fully realized. Among current
revenue sources for the workplace assessment services are the WSIB, motor vehicle accident
insurers and employers, all of which are concerned with the impacts on a patients’ ability to
work both during and after treatment.
Orthotic services – assessing the need for and fitting orthopaedic braces and supports –
are available in almost half of the organizations, with a greater proportion of FP/c and NFP
Hospitals involved than FP/s and Other NFP provider organizations.
Manipulation therapy is a specialized branch of physiotherapy for patients with complex
musculoskeletal dysfunction, and the Canadian Physiotherapy Association offers certification in
this field.311 As well, the University of Western Ontario, in partnership with the Canadian
Physiotherapy Association, offers a master’s degree in manual and manipulative therapy.312 This
specialized service is offered in a higher proportion of FP/c provider organizations (63.4%) than
in other strategic provider groups.
Ancillary services
Services provided primarily by other health professionals, such as occupational therapy,
medical and nursing services and audiology and speech language pathology services fall in the
ancillary services category. There are also some offerings outside the medical model (that
focuses on the addressing a patient’s departures from the norms of function due to an injury or
disease313) or the physical rehabilitation model (which emphasizes the role of improved physical
conditioning to manage disability314). About one in five of the Other NFP groups offered
horticultural therapy and music therapy in addition to physiotherapy, and 11.8% offer reiki, a
“holistic, light-touch, energy-based modality”.315 While the absolute number of Other NFP
providers is small, and the number offering these non-traditional services even smaller, the Other
NFP providers may be leading the way in introducing novel or alternative treatments to the
market, where FP providers are still wary to offer them and NFP Hospitals may never offer them.
A number of FP/c providers, however, offered such ancillary or non-traditional services
as art therapy and aromatherapy outside the medical model. But more striking and potentially
95
more important are naturopathic services which can include “physical and mechanical techniques
applied to connective tissue” and “physical therapeutic procedures”.316;317 The new Naturopathy
Act, 2007,278 will provide a structure for the regulation of naturopaths as health professionals,
similar to physiotherapists13 and kinesiologists.274 There was no widespread incursion into the
field of naturopathy: only 3.2% of provider organizations said they offered the service. This is
likely due at least in part to the historical grounding of physiotherapy and physiotherapy training
in the medical or physical rehabilitation models, whereas naturopathy is focused on alterative or
complementary modalities. One key informant (O-2), however, highlighted the increased
attractiveness of naturopathy to the general public as a phenomenon that most physiotherapy
provider organizations have not yet acknowledged, let alone understood, in terms of potential
threat to market share.
Nutritional and weight loss counselling is another area that bears some scrutiny. As the
observations of an epidemic of obesity increase in Canada,318;319 these services may become
more common. But already by 2005, it was offered in 23.7% of the provider organizations that
responded to the survey. While proportionately more NFP Hospitals offer it than organizations in
any other strategic provider group, it was the relatively low proportion of FP/s providers (16.2%)
involved in this service that is most notable.
It is the FP/c providers, too, that may be seen as introducing some non-traditional
combination of services to the physiotherapy market. About 30% of those providers offered
chiropractic services in addition to physiotherapy, breaking down some of the traditional rivalry
between chiropractic and physiotherapy (P-2, P-4, P-5, P-8, P-9, O-1, O-2, O-4, R-3). FP/s
organizations (11.4%) and Other NFP organizations (17.6%) also offered chiropractic.
4.4 Eligible labour supply
4.4.1 Practitioners
The law permits anyone who wishes to do so to provide physiotherapy services in
Ontario but practitioners who call themselves “physiotherapists” or “physical therapists” in
Ontario are required by the Physiotherapy Act to register with the College of Physiotherapists of
Ontario (CPO) and submit themselves to regulation by the CPO.283;320 Similarly, provider
organizations may wish to advertise that they offer the services of “physiotherapists”, and the
therapists they employ – but not the organizations themselves – are subject to regulation by the
CPO.

96
There are two other categories of therapists in the market: therapists who are neither
registered physiotherapists nor supervised by them, and non-physiotherapists who are supervised
by registered physiotherapists. Physiotherapy provider organizations are free to employ these
other types of therapists.
The therapists who are not physiotherapists include other health professionals with a
scope of practice that is similar to or overlaps physiotherapists’ scope of practice, for example,
chiropractors, massage therapists, nurses, physicians and occupational therapists. There are also
some recently-recognized health professions for whom a statutory framework for regulation has
been passed by the Ontario legislature but not yet proclaimed into law. These are kinesiologists,
naturopaths, and Traditional Chinese Medicine practitioners and acupuncturists. Table 4-5
illustrates the overlap of the scopes of practice of each of these health professions.
Clearly, the health professionals in Table 4-5 are not fully interchangeable with one
another because some scopes of practice are very broad (for example, physicians’ scope of
practice) and some are narrower. However, they may be considered by patients or payers as
interchangeable in relation to particular conditions and treatments or in circumstances of
shortages of one or more kinds of health professionals in a geographic region.
For example, because a major part of their scope of practice focuses on the spine,
chiropractors are perceived as being expert in back problems while registered physiotherapists
are perceived as being expert in general musculoskeletal conditions, including back problems (P-
8). While most key informants (P-2, P-4, P-5, P-8, P-9, O-1, O-2, O-4, R-3) did not see that
chiropractors pose a competitive threat in the supply of labour to the market, several key
informants mentioned the superior marketing capacity of chiropractors and their professional
association, the Ontario Chiropractic Association.
The policies of the various insurers in the market provide some guidance on what they
perceive as acceptable practitioners in the market. For example, the Workplace Safety and
Insurance Board (WSIB)* has said that physiotherapists, chiropractors and massage therapists
are eligible to deliver its Program of Care for Acute Lower Back Injuries,321 and either
physiotherapists or chiropractors can be the leading health profession in its Community Clinics
programs.322 Motor vehicle accident (MVA) insurers† also recognize that chiropractors,
physiotherapists, massage therapists and kinesiologists may be able to treat MVA patients,
* The terms and conditions of the WSIB’s payment schemes are examined in Chapter 5, section 5.1.1.9. † The terms and conditions of motor vehicle accident insurers’ payment schemes are examined in Chapter 5, section
5.1.1.8.
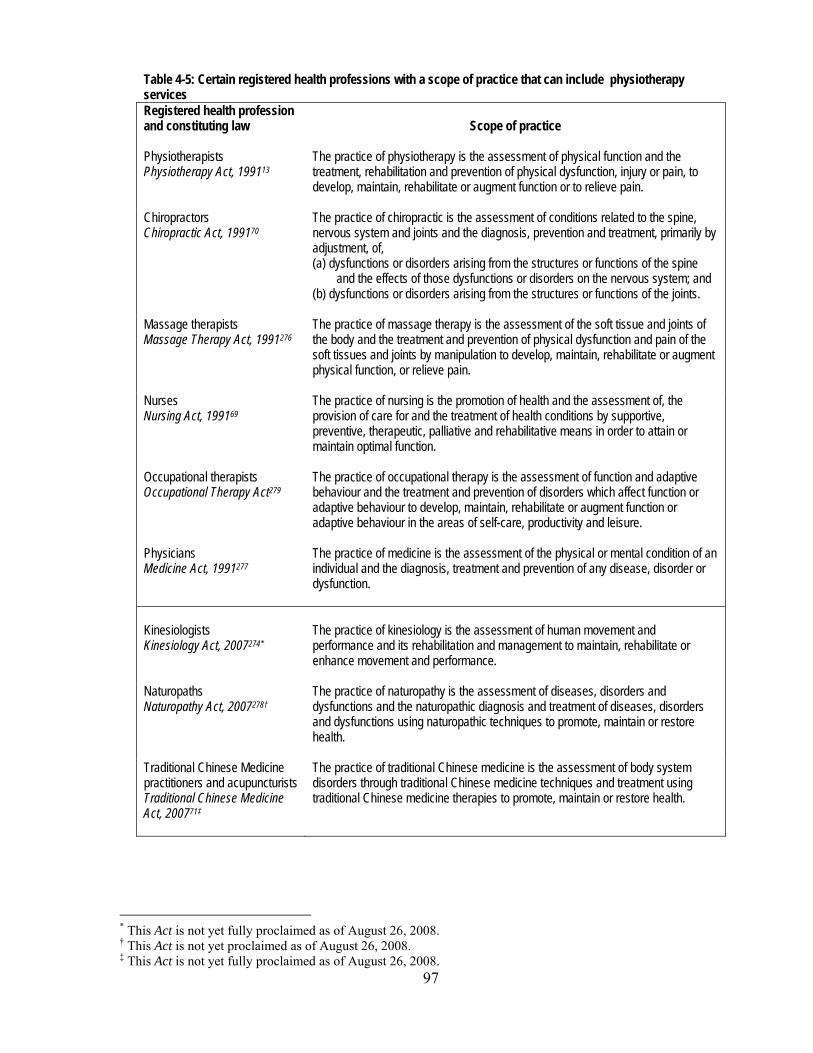
97
Table 4-5: Certain registered health professions with a scope of practice that can include physiotherapy services Registered health profession and constituting law Scope of practice Physiotherapists Physiotherapy Act, 199113
The practice of physiotherapy is the assessment of physical function and the treatment, rehabilitation and prevention of physical dysfunction, injury or pain, to develop, maintain, rehabilitate or augment function or to relieve pain.
Chiropractors Chiropractic Act, 199170
The practice of chiropractic is the assessment of conditions related to the spine, nervous system and joints and the diagnosis, prevention and treatment, primarily by adjustment, of, (a) dysfunctions or disorders arising from the structures or functions of the spine
and the effects of those dysfunctions or disorders on the nervous system; and (b) dysfunctions or disorders arising from the structures or functions of the joints.
Massage therapists Massage Therapy Act, 1991276
The practice of massage therapy is the assessment of the soft tissue and joints of the body and the treatment and prevention of physical dysfunction and pain of the soft tissues and joints by manipulation to develop, maintain, rehabilitate or augment physical function, or relieve pain.
Nurses Nursing Act, 199169
The practice of nursing is the promotion of health and the assessment of, the provision of care for and the treatment of health conditions by supportive, preventive, therapeutic, palliative and rehabilitative means in order to attain or maintain optimal function.
Occupational therapists Occupational Therapy Act279
The practice of occupational therapy is the assessment of function and adaptive behaviour and the treatment and prevention of disorders which affect function or adaptive behaviour to develop, maintain, rehabilitate or augment function or adaptive behaviour in the areas of self-care, productivity and leisure.
Physicians Medicine Act, 1991277
The practice of medicine is the assessment of the physical or mental condition of an individual and the diagnosis, treatment and prevention of any disease, disorder or dysfunction.
Kinesiologists Kinesiology Act, 2007274*
The practice of kinesiology is the assessment of human movement and performance and its rehabilitation and management to maintain, rehabilitate or enhance movement and performance.
Naturopaths Naturopathy Act, 2007278†
The practice of naturopathy is the assessment of diseases, disorders and dysfunctions and the naturopathic diagnosis and treatment of diseases, disorders and dysfunctions using naturopathic techniques to promote, maintain or restore health.
Traditional Chinese Medicine practitioners and acupuncturists Traditional Chinese Medicine Act, 200771‡
The practice of traditional Chinese medicine is the assessment of body system disorders through traditional Chinese medicine techniques and treatment using traditional Chinese medicine therapies to promote, maintain or restore health.
* This Act is not yet fully proclaimed as of August 26, 2008. † This Act is not yet proclaimed as of August 26, 2008. ‡ This Act is not yet fully proclaimed as of August 26, 2008.
98
depending on each health professional’s statutory scope of practice.323 Some private insurers also
recognize that such professionals as physiotherapists, chiropractors and massage therapists have
related scopes of practice by including them all under a single category of insured services under
their insurance policies.28
Key informants in general did not see massage therapists or occupational therapists as
widely interchangeable with physiotherapists. Their reasons were similar to those they used in
relation to chiropractors and physiotherapists: massage therapists and occupational therapists
may have overlapping scopes of practice but they are perceived as having different areas of
specialization – an emphasis on pain relief in the case of massage therapists, and facilitation of
achievement of job, household and leisure tasks in the case of occupational therapists, rather than
treatment of all types of physical dysfunction.
As will be seen in section 4.4.2, the provision of acupuncture by physiotherapy provider
organizations and by registered physiotherapists is widespread and the WSIB includes
acupuncture on its physiotherapy fee schedule.324 With full proclamation of the Traditional
Chinese Medicine Act, 2007,71 only acupuncturists registered with the College of Traditional
Chinese Medicine Practitioners and Acupuncturists will be able to call themselves
“acupuncturists”, though other health professionals will be able to provide acupuncture, provided
they conform to any acupuncture practice standards established by their regulatory college.
Whether this will have an effect on service provision by registered physiotherapists and patients’
and the public’s perception of them remains to be seen.
The other category of potential therapists consists of individuals who may be supervised
by registered physiotherapists. The College of Physiotherapists of Ontario (CPO) has established
a practice standard for registered physiotherapists who work alongside “support personnel” that
imposes on the physiotherapist the personal responsibility for the care provided by the support
personnel.325;326 The practice standard does not define specifically who such support personnel
can be, but it describes the work of such personnel as assisting the registered physiotherapist
deliver a physiotherapy treatment plan, and it does name individuals who have training in
athletic therapy or kinesiologists as potential supervised therapists. However, it must be
emphasized that none of these support personnel is prevented by law from providing
physiotherapy services on their own. The CPO rules about supervision apply to the registered
physiotherapist working with the support personnel; in the absence of a registered
physiotherapist (and in the absence of any payer rules) no regulation or supervisory duty applies.
99
In the course of constructing the survey of physiotherapy provider organizations for this
study, discussions with individuals led to the identification of five occupational titles of people
who are assistants to or supporters of physiotherapists: athletic therapists, kinesiologists,
ergonomists, physiotherapy assistants/aides and rehabilitation assistants.* A brief review of the
activities and place in the physiotherapy market of each of these groups follows.
Key informants said that kinesiologists are now widely used by registered
physiotherapists to assist with patients (P-2, P-4, P-5, P-8, P-9, O-4). When their new health
professional status is formally proclaimed, kinesiologists will likely cause some disruption to
current patterns of provision of care since these key informants think it is unlikely that
kinesiologists will continue to play their support role but will instead seek to provide care
unsupervised.
According to the Ontario Athletic Therapists Association (OATA), athletic therapists are
involved in “the assessment, prevention, immediate care, and reconditioning of musculoskeletal
injuries”.329 While the representatives of the OATA who objected to some of the wording of the
survey of physiotherapy provider organizations (see section 3.2.3.1, Chapter 3) maintained that
athletic therapy is a “profession”,330 athletic therapy is not an occupational grouping that is
subject to either the Regulated Health Professions Act66 or the Drugless Practitioners Act267 in
Ontario. Furthermore, individuals with training in athletic therapy are specifically mentioned as
an example of physiotherapist support personnel in the CPO’s practice standard for registered
physiotherapists.325 The Canadian Association of Athletic Therapists, and its Ontario affiliate,
OATA, are working to establish educational and practice standards for those who wish to call
themselves athletic therapists,331 one of the usual strategic steps unregulated professional
groupings take as they move toward a goal of self-regulation.64;332
Ergonomists also are not a regulated health profession in Ontario. The Canadian
Association of Ergonomists describes the work of ergonomists in this way:
Ergonomists contribute to the design and evaluation of tasks, jobs, products, environments and systems in order to make them compatible with the needs, abilities and limitations of people. Ergonomists use a holistic approach and will ensure that physical, cognitive, social, organizational, environmental and other relevant factors are taken into account when making recommendations regarding the design or modification of a system.333
* Question 3(b) of the survey questionnaire also listed occupational therapy assistants and personal support workers,
but the former are focused on assisting occupational therapists,327 and the latter provide personal and housekeeping care to people in long-term care and in their homes.328

100
The Ontario Ministry of Training, Colleges and Universities established a standard for
education programs for physiotherapy assistants at Ontario colleges of applied arts and
technology, and defines these personnel as “health workers who …. work under/with the
supervision of and in collaboration with registered physiotherapists.”334. They “assist registered
physiotherapists to teach and enable clients to effectively cope with their limitations in
movement, daily functioning, and activity whether temporary or permanent, during and
following recovery periods.”
There are no education standards for physiotherapy aides in Ontario, but the Alliance of
Canadian Physiotherapy Regulators and the Canadian Physiotherapy Association recommended
that the term “aides” be used to describe individuals with knowledge similar to that of
physiotherapy assistants but who gained their knowledge and skills through on-the-job rather
than academic training.335
The term “rehabilitation assistants” is not defined formally but is a job title used in some
Ontario workplaces to describe individuals with college-level training meeting physiotherapy
assistant and occupational therapy assistant327 education standards established by the Ministry of
Training, Colleges and Universities, or with equivalent experience.
In sum, there appears to be a list of potential suppliers of skilled labour for physiotherapy
services in the market including services provided by other health professionals. Similarly, there
is a broad range of unregulated therapists who provide services that can fall within the market.
While payers have formally recognized some areas of potential interchangeability, key
informants perceived that registered physiotherapists largely define the labour pool for the
physiotherapy market and that supporting and assisting personnel under supervision of registered
physiotherapists extend their reach. Section 4.4.3 examines the extent to which these assisting
and supporting personnel provided physiotherapy services in the market but first, section 4.4.2
examines which services are provided by registered physiotherapists.
4.4.2 Services provided by registered physiotherapists
Table 4-6 provides a different perspective on the services listed in Table 4-4 above.
Taking only those who said they offered a particular service, the percentage of provider
organizations whose registered physiotherapists always, sometimes and never offered the service
were calculated, totalling 100% and distributed over the three columns. The first column of
Table 4-6 shows the proportion of organizations whose physiotherapists always provided the
services. Aside from physiotherapy, more than three-quarters always had physiotherapists
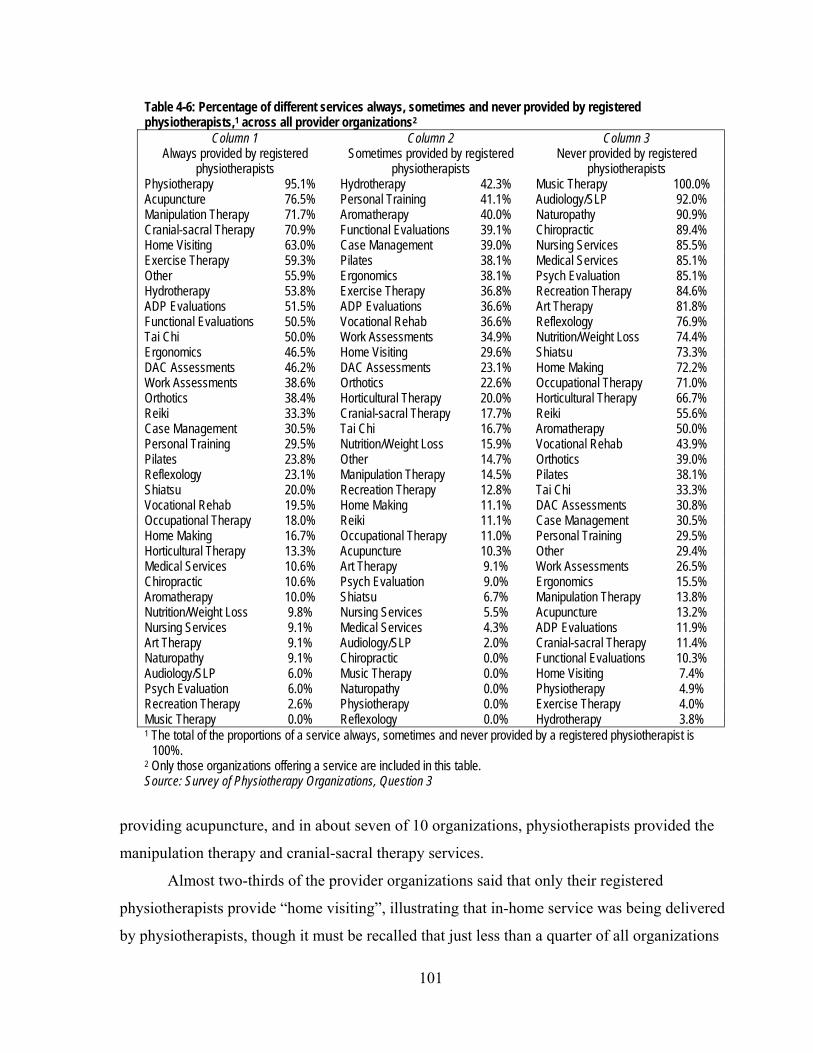
101
Table 4-6: Percentage of different services always, sometimes and never provided by registered physiotherapists,1 across all provider organizations2
Column 1 Always provided by registered
physiotherapists
Column 2 Sometimes provided by registered
physiotherapists
Column 3 Never provided by registered
physiotherapists Physiotherapy 95.1% Hydrotherapy 42.3% Music Therapy 100.0% Acupuncture 76.5% Personal Training 41.1% Audiology/SLP 92.0% Manipulation Therapy 71.7% Aromatherapy 40.0% Naturopathy 90.9% Cranial-sacral Therapy 70.9% Functional Evaluations 39.1% Chiropractic 89.4% Home Visiting 63.0% Case Management 39.0% Nursing Services 85.5% Exercise Therapy 59.3% Pilates 38.1% Medical Services 85.1% Other 55.9% Ergonomics 38.1% Psych Evaluation 85.1% Hydrotherapy 53.8% Exercise Therapy 36.8% Recreation Therapy 84.6% ADP Evaluations 51.5% ADP Evaluations 36.6% Art Therapy 81.8% Functional Evaluations 50.5% Vocational Rehab 36.6% Reflexology 76.9% Tai Chi 50.0% Work Assessments 34.9% Nutrition/Weight Loss 74.4% Ergonomics 46.5% Home Visiting 29.6% Shiatsu 73.3% DAC Assessments 46.2% DAC Assessments 23.1% Home Making 72.2% Work Assessments 38.6% Orthotics 22.6% Occupational Therapy 71.0% Orthotics 38.4% Horticultural Therapy 20.0% Horticultural Therapy 66.7% Reiki 33.3% Cranial-sacral Therapy 17.7% Reiki 55.6% Case Management 30.5% Tai Chi 16.7% Aromatherapy 50.0% Personal Training 29.5% Nutrition/Weight Loss 15.9% Vocational Rehab 43.9% Pilates 23.8% Other 14.7% Orthotics 39.0% Reflexology 23.1% Manipulation Therapy 14.5% Pilates 38.1% Shiatsu 20.0% Recreation Therapy 12.8% Tai Chi 33.3% Vocational Rehab 19.5% Home Making 11.1% DAC Assessments 30.8% Occupational Therapy 18.0% Reiki 11.1% Case Management 30.5% Home Making 16.7% Occupational Therapy 11.0% Personal Training 29.5% Horticultural Therapy 13.3% Acupuncture 10.3% Other 29.4% Medical Services 10.6% Art Therapy 9.1% Work Assessments 26.5% Chiropractic 10.6% Psych Evaluation 9.0% Ergonomics 15.5% Aromatherapy 10.0% Shiatsu 6.7% Manipulation Therapy 13.8% Nutrition/Weight Loss 9.8% Nursing Services 5.5% Acupuncture 13.2% Nursing Services 9.1% Medical Services 4.3% ADP Evaluations 11.9% Art Therapy 9.1% Audiology/SLP 2.0% Cranial-sacral Therapy 11.4% Naturopathy 9.1% Chiropractic 0.0% Functional Evaluations 10.3% Audiology/SLP 6.0% Music Therapy 0.0% Home Visiting 7.4% Psych Evaluation 6.0% Naturopathy 0.0% Physiotherapy 4.9% Recreation Therapy 2.6% Physiotherapy 0.0% Exercise Therapy 4.0% Music Therapy 0.0% Reflexology 0.0% Hydrotherapy 3.8% 1 The total of the proportions of a service always, sometimes and never provided by a registered physiotherapist is
100%. 2 Only those organizations offering a service are included in this table. Source: Survey of Physiotherapy Organizations, Question 3
providing acupuncture, and in about seven of 10 organizations, physiotherapists provided the
manipulation therapy and cranial-sacral therapy services.
Almost two-thirds of the provider organizations said that only their registered
physiotherapists provide “home visiting”, illustrating that in-home service was being delivered
by physiotherapists, though it must be recalled that just less than a quarter of all organizations

102
(23.4%) and less than a quarter in each of the strategic provider groups, offered in-home service.
A key informant (P-8) said that it is difficult to have a non-physiotherapist provide such services
in a patient’s home because a registered physiotherapist is not generally there to supervise the
services as required by the College of Physiotherapists of Ontario.336
Though exercise therapy is the most frequently offered service (after physiotherapy itself)
by provider organizations, Table 4-6 shows that 59.3% of provider organizations always had
their physiotherapists provide this service, and (from Column 2 of Table 4-6) almost all the rest
(36.8%) had their physiotherapists providing it sometimes. At the level of all organizations, this
indicates that there is some degree of substitution of other personnel for physiotherapists in the
delivery of this common service.
Additional analysis was undertaken to assess whether the strategic provider groups were
similar in their approach to provision of this service by physiotherapists.
Table 4-7 shows the results of the calculation of ratios, by strategic provider group, of the
number of responding provider organizations that said physiotherapists always provide the
exercise therapy service to the number that said physiotherapists sometimes provide the service.
NFP Hospitals were more likely always to have physiotherapists provide exercise therapy, while
FP/c providers are modestly more likely to have physiotherapists only sometimes involved. FP/s
providers fall in between those strategic provider groups, and Other NFP providers are similar to
the FP/c providers. There were only 12, or 4%, or organizations that never had physiotherapists
provide exercise therapy – 9 FP/s organizations (4.5% of their total number) and 3 Other NFP
organizations (10.7%). Table 4-7: Ratio of number of provider organizations in each strategic provider group whose physiotherapists always provided exercise therapy to the number whose physiotherapists sometimes provided exercise therapy Strategic provider group Ratio FP/c 0.9 FP/s 1.7 NFP Hospital 2.9 Other NFP 1.1 Source: Survey of Physiotherapy Provider Organizations, Question 3
In general, the top services listed in Column 2 in Table 4-6 (that is, services sometimes
provided by physiotherapists) provide some insight into services about which there is less
consensus that registered physiotherapists must provide them. Among the common services as

103
defined for this study, three (in addition to exercise therapy, already discussed), appear:
functional evaluations, ergonomics and orthotics.
Functional evaluations are provided by registered physiotherapists in 50.5% of the
provider organizations that provide such services, and in 39.1% of organizations they are
sometimes provided by registered physiotherapists. This common service, central to the scope of
practice of registered physiotherapists,* clearly can be provided by others and it perhaps
illustrates the propensity to involve other practitioners in the market. As noted above, one key
informant (P-3) commented on the lack of emphasis in the market on accommodations for
disabilities in the workplace. Part of the reason for this may be rooted in a lack of identification
of a single professional group in the market that is ideally suited for this kind of work, because of
the overlapping scopes of practice of several professions, lack of interest among physiotherapists
in giving advice rather than treating, or ambiguity in whether a health professional should be
involved in these sorts of issues at all.
The top services in Column 3 of Table 4-6 are services provided largely by other specific
health professionals such as audiologists, chiropractors and nurses, and so the widespread lack of
involvement by physiotherapists in these areas is understandable.
4.4.3 Supporting and assisting personnel
While registered physiotherapists are undeniably predominant in this market, there is
evidence that there are other personnel who are providing services that could be provided by
physiotherapists. This section investigates this phenomenon to answer the second component of
the hypothesis for the first research question: whether FP/c provider organizations use lower-cost
practitioners to provide physiotherapy services more than NFP organizations, with FP/s
providers in between. For this investigation, attention is turned to the five identified and
discussed above as supporting and assisting personnel groups: kinesiologists, athletic therapists,
ergonomists, physiotherapy assistants/aides and rehabilitation assistants.
The responses of the 324 respondents who answered Question 3 in the survey of
physiotherapy provider organizations about the presence of supporting personnel in their
organizations are summarized in Table 4-8. Clearly, the presence of support personnel across all
* The Physiotherapy Act, 199113 provides that the “practice of physiotherapy is the assessment of physical function
…”.

104
organization types was widespread: it was more likely than not that a patient randomly entering a
provider organization of any type would encounter a setting with support personnel.
Table 4-8: Proportion of different provider organization types employing personnel supporting or assisting registered physiotherapists FP/c
n=43 FP/s
n=209 NFP-Hospital
n=41 Other NFP
n=31 All
n=324 Athletic therapists 7.0% 5.3% 0.0% 9.7% 5.2% Ergonomists 4.7% 0.5% 0.0% 3.2% 1.2% Kinesiologists 48.8% 28.7% 9.8% 19.4% 71.9% Physiotherapy Assistants 32.6% 37.5% 63.4% 22.6% 36.1% Rehabilitation Assistants 2.3% 8.6% 24.4% 32.3% 12.0% At least one of the above 76.7% 58.5% 85.4% 64.5% 64.8% Source: Survey of Physiotherapy Provider Organizations, Question 3
Athletic therapists worked in 5.2% of all physiotherapy provider organizations, and they
were slightly more prevalent in Other NFP and FP/c organizations than in FP/s organizations.
They did not appear to be employed in NFP Hospitals. Ergonomists had minimal presence across
all provider organizations (1.2%) and in 4.7% of the FP/c organizations.
Kinesiologists worked in more than 70% of provider organizations; they worked in
almost 50% of FP/c provider organizations, almost 30% of FP/s organizations, almost 20% in
Other NFP organizations, and about 10% of NFP Hospitals.
Physiotherapy assistants were at work in almost two-thirds of NFP Hospitals, and they
were the most widely used assisting personnel in those settings. Almost four out of 10 FP/s
settings also used physiotherapy assistants. In the Other NFP provider organizations,
rehabilitation assistants, with their dual training or experience in physiotherapy and occupational
therapy, were the most frequently-encountered support personnel support to registered
physiotherapists, but they were also present in NFP-Hospitals to a substantial extent.
To test the hypothesis that FP/c would use lower-cost practitioners the most, NFP
Hospitals the least, with FP/s providers in between, the proportions of treatments provided by
supporting and assisting personnel among strategic provider groups was examined with a
Kruskal-Wallis ANOVA (Table A4-1 in Appendix 16). The descriptive statistics are provided in
Table 4-9. There was a significant difference and an almost significant difference between FP/s
and NFP Hospital providers and between FP/s and FP/c providers, respectively, with no
significant differences between any other pairs of provider groups. Thus, it appears that there is
an indication that FP/s providers use assisting and supporting personnel somewhat less than the
other providers but the differences are not as clear as might have been expected, and the

105
Table 4-9: Descriptive statistics: the proportion of treatments provided by assisting and supporting personnel, by strategic provider group
n Mean 95% CI
SE Median SD Min Max Lower Upper FP/c 40 16.61% 9.11% 24.12% 3.71 5.00% 23.47 0.0% 99.5% FP/s 223 9.40% 6.89% 11.92% 1.28 0.00% 19.05 0.0% 100.0% NFP Hospital 42 15.60% 10.36% 20.83% 2.59 10.0% 16.79 0.0% 60.0% Other NFP 31 13.68% 5.11% 22.24% 4.19 0.0% 23.24% 0.0% 90.0% All 336 11.43% 9.29% 13.57% 1.09 0.00% 19.91 0.0% 100.0% Source: Survey of Physiotherapy Provider Organizations, Question 3
differences are not in the hypothesized direction. The similarities between FP/c and NFP
Hospitals indicate that their approaches to using these extra personnel may be similar, contrary to
the hypothesis.
One of the factors that might contribute to increased levels of use of assistants and
supports to registered physiotherapists is the intensity of competition. As will be seen in Chapter
6, section 6.1.1, perceived competition levels tended to rise with the density of physiotherapists
in FP provider organizations. Accordingly, to test whether a greater proportion of treatments
were provided by assisting and supporting staff rather than registered physiotherapists,* a t-test
was performed comparing the proportions in the six survey counties with lower FP densities
(Oxford, Renfrew, Prescott Russell, Stormont Dundas Glengarry, Kenora and Rainy River) with
the six with higher FP densities (Ottawa, Wellington, Toronto, Elgin, Thunder Bay and
Middlesex). There was almost no difference between the mean of the two groups (Table 4-10),
and so it appeared that FP density levels and associated competition pressures do not drive the
use of supporting and assisting personnel. Table 4-10: Results of a t-test assessing the difference between the mean proportion of treatments provided by assistants to registered physiotherapists, by organizations in county groups with higher and lower density of FP physiotherapists N Mean SD SE Organizations in lower density counties 35 11.43% 19.49 2.00 Organizations in higher density counties 301 11.43% 20.00 1.25
t=.00
df=334
p=1.000
Source: Survey of Physiotherapy Provider Organizations, Question 5
This suggested the possibility of support for an alternative hypothesis in relation to use of
assistants and supports to regulated health professionals: the effect of professional socialization
and economies of scale. As was discussed in section 2.2.2.3 of Chapter 2, one of the defining
* Question 5(b) of the survey of provider organizations asked for the proportion of treatments provided by assistants
to registered physiotherapists in each organization.

106
features of FP/s provider organizations, if they are owned by a health professional, is that they
are expected to be more keenly protective of their profession and professional standards than
organizations owned by others. Therefore, they should be less willing to arrange for treatment to
be provided by assistants or support personnel without professional qualifications. As well, key
informants (P-1, P-3, P-4, P-6) said that because physiotherapist-owned organizations are smaller
than other organizations (discussed below in section 4.5.2), it would be harder to make full use
of an assistant in those organizations without reducing the owner’s own income.
Table 4-11 shows the results of a t-test to detect whether there was a significant
difference between the proportion of physiotherapy treatments provided by assistants in provider
organizations owned by physiotherapists and in those not so owned. There was a substantial and
significant difference between the groups, with the physiotherapist-owned clinics providing an
average of 8.15% of physiotherapy treatments by assisting and supporting personnel and those
not owned by physiotherapists, providing an average of 16.53%, roughly twice the proportion.
Table 4-11: Results of a t-test assessing the difference between the mean proportion of treatments provided by assistants to registered physiotherapists, by organization ownership (owned by registered physiotherapist, not owned by registered physiotherapist) N Mean SD SE Not owned by PT 142 16.53% 23.53 1.97 Owned by PT 170 8.15% 16.40 1.26 t=3.58* df=245.00 p=.001 *Variances assumed unequal: Levene’s statistic = 21.61, p<.001. Source: Survey of Physiotherapy Provider Organizations, Questions 5 and 22
4.5 Registered physiotherapists
4.5.1 High demand for labour
In general, there appears to be evidence of a high demand for registered physiotherapists.
Data from Statistics Canada and the Canadian Institute for Health Information (CIHI) about the
employment patterns of physiotherapists is limited though a major project is underway at the
CIHI to report more information about physiotherapists on a regular basis.337 Nonetheless, some
data have been compiled by Statistics Canada relating to employment rates and wages of
physiotherapists and other health professionals, using Statistics Canada’s National Graduate
Survey in 2000.293 Table 4-12, based on these data, provides an indication of a high level of
demand for physiotherapists across Canada. First, 99.2% of physiotherapy graduates were
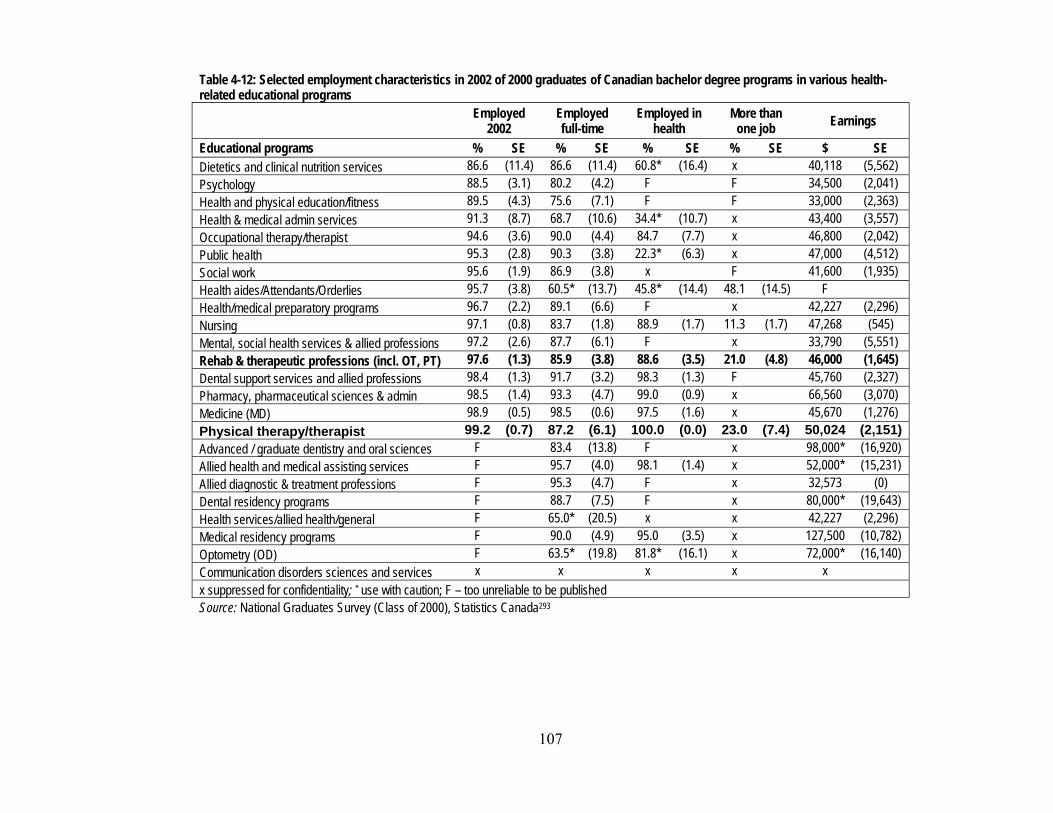
107
Table 4-12: Selected employment characteristics in 2002 of 2000 graduates of Canadian bachelor degree programs in various health-related educational programs
Employed
2002 Employed full-time
Employed in health
More than one job Earnings
Educational programs % SE % SE % SE % SE $ SE Dietetics and clinical nutrition services 86.6 (11.4) 86.6 (11.4) 60.8* (16.4) x 40,118 (5,562) Psychology 88.5 (3.1) 80.2 (4.2) F F 34,500 (2,041) Health and physical education/fitness 89.5 (4.3) 75.6 (7.1) F F 33,000 (2,363) Health & medical admin services 91.3 (8.7) 68.7 (10.6) 34.4* (10.7) x 43,400 (3,557) Occupational therapy/therapist 94.6 (3.6) 90.0 (4.4) 84.7 (7.7) x 46,800 (2,042) Public health 95.3 (2.8) 90.3 (3.8) 22.3* (6.3) x 47,000 (4,512) Social work 95.6 (1.9) 86.9 (3.8) x F 41,600 (1,935) Health aides/Attendants/Orderlies 95.7 (3.8) 60.5* (13.7) 45.8* (14.4) 48.1 (14.5) F Health/medical preparatory programs 96.7 (2.2) 89.1 (6.6) F x 42,227 (2,296) Nursing 97.1 (0.8) 83.7 (1.8) 88.9 (1.7) 11.3 (1.7) 47,268 (545) Mental, social health services & allied professions 97.2 (2.6) 87.7 (6.1) F x 33,790 (5,551) Rehab & therapeutic professions (incl. OT, PT) 97.6 (1.3) 85.9 (3.8) 88.6 (3.5) 21.0 (4.8) 46,000 (1,645) Dental support services and allied professions 98.4 (1.3) 91.7 (3.2) 98.3 (1.3) F 45,760 (2,327) Pharmacy, pharmaceutical sciences & admin 98.5 (1.4) 93.3 (4.7) 99.0 (0.9) x 66,560 (3,070) Medicine (MD) 98.9 (0.5) 98.5 (0.6) 97.5 (1.6) x 45,670 (1,276) Physical therapy/therapist 99.2 (0.7) 87.2 (6.1) 100.0 (0.0) 23.0 (7.4) 50,024 (2,151)Advanced / graduate dentistry and oral sciences F 83.4 (13.8) F x 98,000* (16,920) Allied health and medical assisting services F 95.7 (4.0) 98.1 (1.4) x 52,000* (15,231) Allied diagnostic & treatment professions F 95.3 (4.7) F x 32,573 (0) Dental residency programs F 88.7 (7.5) F x 80,000* (19,643) Health services/allied health/general F 65.0* (20.5) x x 42,227 (2,296) Medical residency programs F 90.0 (4.9) 95.0 (3.5) x 127,500 (10,782) Optometry (OD) F 63.5* (19.8) 81.8* (16.1) x 72,000* (16,140) Communication disorders sciences and services x x x x x x suppressed for confidentiality; * use with caution; F – too unreliable to be published Source: National Graduates Survey (Class of 2000), Statistics Canada293
108
employed within two years of finishing their training, and of those, all were employed in a health
occupation. These are higher proportions than for any other occupational group in this dataset.
Furthermore, the estimated gross annual earnings in 2002 of graduates of physiotherapy
programs in 2000 was higher ($50,024) than the average for all rehabilitation and therapeutic
professions ($46,000), and higher than many other occupational groups except medical residents,
dentists, optometrists and allied health and medical assisting services.
However, it must be noted that there are caveats to this portrayal of physiotherapists as
being high in demand. The first is that almost a quarter of the physiotherapy graduates were
employed in more than one job and about one in eight was employed part-time only. This may
point either to employees’ choices in employment arrangements – desiring part-time work to
balance family responsibilities with work, for example – or it could point to the inability of the
market to absorb the potential full-time contribution of 12.8% of graduates to the market.
These data pre-date a key shock to the market in 2003 (a significant drop in fees paid by motor
vehicle insurers, which is described in Chapter 5, section 5.1.5) that should have upset
employment and earnings patterns. However, key informants in 2007 said that there continued to
be a high level of competition among physiotherapy provider organizations to attract both new
graduates and experienced therapists, and the competition is fierce in both rural and urban areas
(P-1, P-3, P-5, P-10). They said that even those who are successful in attracting new graduates
with higher salaries and generous benefit packages (generally the FP/c organizations), there is a
frustrating loss of some of those new employees after about two years, when they have gained
the experience they believe they need to move on and establish their own businesses.
Overall, then, the available evidence indicates a high demand for physiotherapists in the
entire period from 2002 to 2007. There is likely a demand for other practitioners in the market to
fill gaps in availability of physiotherapists in certain regions, and also for assisting and
supporting personnel to supplement services registered physiotherapists’ services, at lower prices
than those physiotherapists are able to charge.
The level of unionization in the physiotherapy market is low, reflecting long-held beliefs
among physiotherapists that being a member of a union was inconsistent with professional
status.36 In an Ontario survey in 2003,338 Williams et al. found that 20% of physiotherapists’
primary (predominant) employment was covered by a collective agreement, and, of those with a
secondary place of employment, 9% were represented by a trade union. To place these rates in
context, the median monthly unionization rate in Ontario from January 2003 to August 2007 was
109
28.3%, and the median rate in the health care and social assistance sector (which includes the
majority of the places where physiotherapy services are provided in Ontario) was 45.6%.339 No
evidence was obtained over the course of this study that would indicate that the rate of
unionization from 2003 in the physiotherapy market changed significantly. Indeed, key
informants who did discuss trade union issues (P-1, P-3, O-2) talked about a possible decline in
the numbers of employees in provider organizations that have traditionally been unionized
providers (Community Care Access Centres (CCACs) and NFP hospitals). However, Randall
and Williams340 reported that when employees were discharged from CCACs and moved as a
group to a new employer, they continued to be members of their trade union and their new
employer was treated as a successor employer under Ontario labour laws, and subject to the
terms of the collective agreement with the former employer.
This finding of a low level of unionization accords with the high rate of employment in
the market and the demands for therapeutic expertise by provider organizations: physiotherapy
practitioners appear not to require the assistance of trade unions in achieving and keeping
relatively high levels of employment (at least among new graduates) and high earnings levels.
The rate of part-time work does, however, speak to a possible weakness of individual therapists
in demanding and receiving full-time status with benefits.
4.5.2 Number of registered physiotherapists
As outlined in Chapter 3, this study’s 2005 survey was distributed to a variety of
organizations not exclusively associated with registered physiotherapists. Seventeen (FP/c = 2,
FP/s=10, NFP-Hospital = 1, Other NFP = 4) or about 5% of the respondents replied to the survey
indicating that they provide physiotherapy services but do not employ registered
physiotherapists. The health professionals who predominantly provided physiotherapy services
in these organizations were chiropractors and massage therapists. Eleven of the seventeen had
either or both of these professionals. The others had a kinesiologist or a rehabilitation assistant
working alone.
Of all the other respondents (n=324), the mean number of physiotherapists across all
organizations was 4.38, and the median number was 2.00. The number of physiotherapists
ranged from 1 to 40 in these organizations (Table 4-13). NFP Hospitals had the greatest mean
number of physiotherapists (mean=11.50, median=5.50), with a fairly wide variation of numbers
greater than the median. The other organization types had similar mean numbers of
physiotherapists.

110
Table 4-13: Descriptive statistics: the number of registered physiotherapists in provider organizations with at least 1, by strategic provider groups
N Mean 95% CI
SE Median SD Min Max Lower Upper FP/c 39 3.28 1.68 4.88 0.79 2.00 4.93 1.00 30.00 FP/s 215 3.21 2.57 3.85 0.33 2.00 4.77 1.00 35.00 NFP Hospital 42 11.50 7.91 15.09 1.78 5.50 11.51 1.00 40.00 Other NFP 28 4.14 1.76 6.53 1.16 2.00 6.16 1.00 32.00 All 342 4.38 3.64 5.11 0.38 2.00 6.75 1.00 40.00 Source: Survey of Physiotherapy Provider Organizations, Question 2
Table A4-2 in Appendix 16 provides the results of a Kruskal-Wallis ANOVA. NFP
Hospitals had a significantly and substantially higher number of physiotherapists than the other
strategic groups, and those three other groups did not different significantly from one another.
A recurring theme in the key informant interviews was the difficulties and challenges that
providers, particularly those owned and operated by practicing registered physiotherapists,
encounter as they endeavour to run their businesses. One of the challenges was said (P-2, P-5) to
be that owner-physiotherapists, working alone, have no one to “cover” for them, that is, treat
their patients when they want to take a break from the stresses of their businesses. To test the
differences in sizes between provider organizations, a t-test was used to compare the mean
headcount of registered PTs in organizations not owned and owned by registered
physiotherapists. Table 4-14 confirms that there was a significant difference between the mean
headcounts of registered physiotherapists, and the mean number of physiotherapists in
organizations not owned by a physiotherapist was about twice the mean number in organizations
owned by a physiotherapist (5.65 and 2.90, respectively). Table 4-14: Results of a t-test assessing the difference between the mean number of registered physiotherapists, by organization ownership (owned by registered physiotherapist, not owned by registered physiotherapist) n Mean SD SE Not owned by registered physiotherapist 144 5.65 8.61 .72 Owned by registered physiotherapist 172 2.90 3.55 .27
t=3.58*
df=183.43
p<.001
*Variances assumed unequal: Levene’s statistic = 44.76, p<.001. Source: Survey of Physiotherapy Provider Organizations, Questions 2 and 22.
4.5.3 Geographic distribution of registered physiotherapists
As discussed in chapter 2, there are a number of alternative expectations about the
distribution of physiotherapy services across Ontario. If physiotherapy is a specialist service
111
requiring a critical mass to make it viable in a geographic area or if it is market-driven with
clustering of providers, the distribution should be skewed toward more populated regions,
especially those with academic health science centres. FP/c providers will be more highly
concentrated in more populated regions, and NFP will be relatively evenly distributed throughout
all regions. FP/s, being ‘not only for profit’, will fall between the FP/c and the NFP providers.
The populated and specialist regions could draw patients from nearby, resulting in a lower-
density of providers in contiguous regions. If services are distributed according to need and not
in response to market mechanisms, the number of all providers, including FP/c providers, would
be generally and similarly proportionate to the population across all regions. In addition, based
on Landry’s work,28 it is expected that there would be a continued drift away from provision of
physiotherapy services in NFP Hospitals toward FP providers.
This section reports the results of an analysis of the distribution of physiotherapists at the
provincial and county level in Ontario in 2003 and 2005, using the CPO Database described in
section 3.2.2.1 of Chapter 3.This database has allowed a comparison of the distribution of all
physiotherapists across counties regardless of the setting (FP or NFP) they work in. It also
permitted comparisons of the distribution of the distribution of physiotherapists who work in
each of the groupings of NFP Hospitals, Other NFP and all FP settings, and in different types of
counties (academic, contiguous and other counties).
Though use of data from the CPO gives insights into the distribution of regulated
physiotherapists in Ontario, it does not directly give a measure of the availability of all human
resources for the delivery of physiotherapy services in Ontario. Consequently, comparisons of
the rates of availability of regulated physiotherapists across the province give an appropriate
indication of the relative though not absolute scarcity or abundance of therapeutic resources
across the province. However, the analysis of the use of supporting and assisting personnel in
section 4.4.2 provided insights into the use of these additional resources: while there are such
personnel in physiotherapy provider organizations, they do not constitute a predominant
proportion.
4.5.3.1 THE PROVINCE-WIDE DISTRIBUTION OF PHYSIOTHERAPISTS Between 2003 and 2005, Ontario’s population grew by 2.5%, and the numbers of
registered physiotherapists grew by 2.3%. The all-Ontario all-physiotherapist density was almost
the same in 2005 as in 2003, with 3.863 physiotherapists in direct patient care per 10,000
residents in 2003 and 3.855 in 2005. A paired t-test demonstrated that there was no significant
112
difference between the county-level all-physiotherapist densities in 2003 and in 2005 (t=.359,
df=48, p=.721).
However, the proportion of physiotherapists in FP settings in 2003 grew from 49.2% in
2003 to 54.6% in 2005. Similarly, the all-Ontario density of physiotherapists in FP settings rose
from 1.90 to 2.11 per 10,000 population between those years, and this was a statistically
significant increase (t=-4.476, df=48, p=.000).
NFP Hospital physiotherapists constituted 43.6% of all physiotherapists in 2003 and this
decreased to 39.1% of the total in 2005. The all-Ontario hospital physiotherapist density declined
from 1.68 physiotherapists per 10,000 residents in 2003 to 1.51 physiotherapists in 2005. A
paired t-test showed that the change in NFP Hospital physiotherapist densities from 2003 to 2005
at the county level was statistically significant (t=3.389, df=48, p=.001).
Other NFP physiotherapists constituted 7.2% of all active physiotherapists in 2003 and
6.2% in 2005, with the province-wide density falling from 0.28 physiotherapists per 10,000
residents to 0.24 in 2005. Like the change in NFP Hospital physiotherapist densities, the Other
NFP physiotherapist density change from 2003 to 2005 at the county level was found to be
statistically significant (t=2.594, df=48, p=.013).
4.5.3.2 ARE PHYSIOTHERAPISTS DISTRIBUTED ACCORDING TO POPULATION? At the county-by-county level, the absolute number of physiotherapists was related to
population. The most-populated county, Toronto, had the most active physiotherapists, 1,258 for
its 2,611,661 residents in 2003, and 1,249 for its 2,607,637 residents in 2005. The least-
populated county, Manitoulin, had the smallest number of active physiotherapists, 2 and 1.8 in
2003 and 2005, respectively, and the population increased modestly from 13,346 to 13,395
residents. But there was considerable variation among counties when the physiotherapist density
(number of physiotherapists per 10,000 population) was considered.
Table 4-15 contains the data that emerged from the county-level analysis. In 2003, 13
counties, and in 2005, 14 counties, were above the all-Ontario density of physiotherapists. When
these are grouped into academic, contiguous and other counties, in Table 4-16, it is clear that the
distribution of physiotherapists across the province was not uniformly proportionate to
population. The academic counties, with less than 40% of the population, had more than half the
physiotherapists in the province. However, the contiguous counties, with a greater proportion of
the population than the academic counties, had less than 30% of total physiotherapists. The other
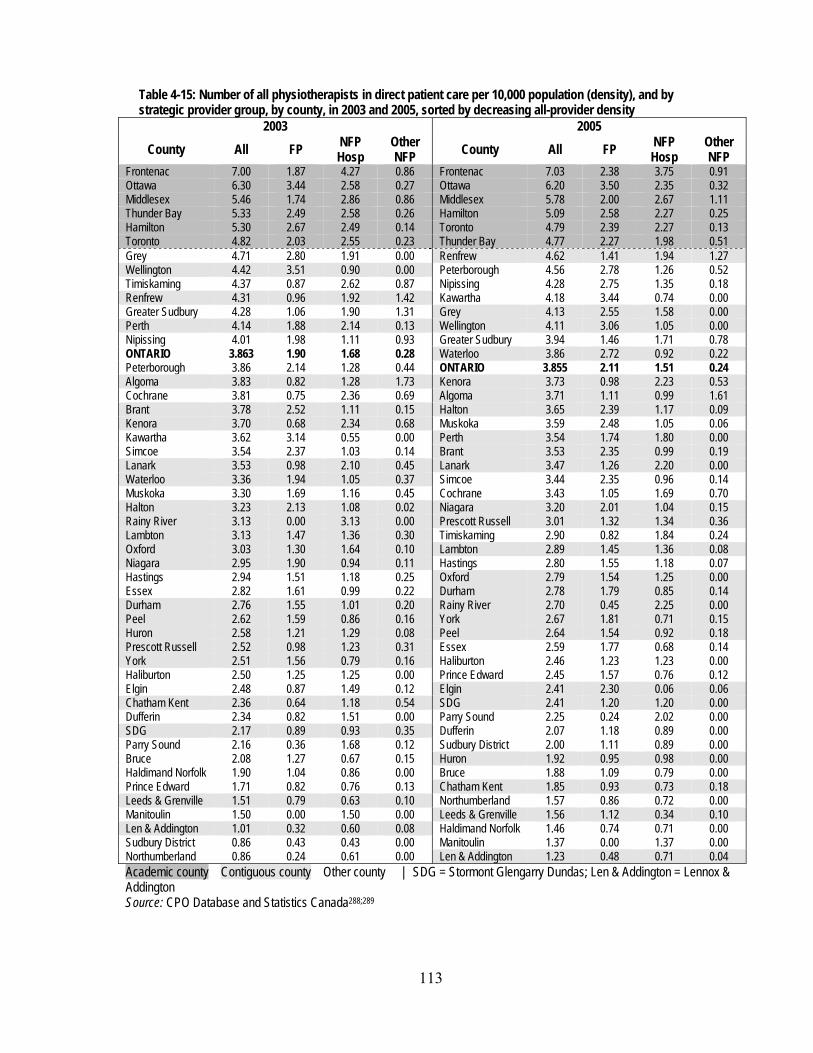
113
Table 4-15: Number of all physiotherapists in direct patient care per 10,000 population (density), and by strategic provider group, by county, in 2003 and 2005, sorted by decreasing all-provider density
2003 2005 County All FP NFP
Hosp Other NFP County All FP NFP
Hosp Other NFP
Frontenac 7.00 1.87 4.27 0.86 Frontenac 7.03 2.38 3.75 0.91 Ottawa 6.30 3.44 2.58 0.27 Ottawa 6.20 3.50 2.35 0.32 Middlesex 5.46 1.74 2.86 0.86 Middlesex 5.78 2.00 2.67 1.11 Thunder Bay 5.33 2.49 2.58 0.26 Hamilton 5.09 2.58 2.27 0.25 Hamilton 5.30 2.67 2.49 0.14 Toronto 4.79 2.39 2.27 0.13 Toronto 4.82 2.03 2.55 0.23 Thunder Bay 4.77 2.27 1.98 0.51 Grey 4.71 2.80 1.91 0.00 Renfrew 4.62 1.41 1.94 1.27 Wellington 4.42 3.51 0.90 0.00 Peterborough 4.56 2.78 1.26 0.52 Timiskaming 4.37 0.87 2.62 0.87 Nipissing 4.28 2.75 1.35 0.18 Renfrew 4.31 0.96 1.92 1.42 Kawartha 4.18 3.44 0.74 0.00 Greater Sudbury 4.28 1.06 1.90 1.31 Grey 4.13 2.55 1.58 0.00 Perth 4.14 1.88 2.14 0.13 Wellington 4.11 3.06 1.05 0.00 Nipissing 4.01 1.98 1.11 0.93 Greater Sudbury 3.94 1.46 1.71 0.78 ONTARIO 3.863 1.90 1.68 0.28 Waterloo 3.86 2.72 0.92 0.22 Peterborough 3.86 2.14 1.28 0.44 ONTARIO 3.855 2.11 1.51 0.24 Algoma 3.83 0.82 1.28 1.73 Kenora 3.73 0.98 2.23 0.53 Cochrane 3.81 0.75 2.36 0.69 Algoma 3.71 1.11 0.99 1.61 Brant 3.78 2.52 1.11 0.15 Halton 3.65 2.39 1.17 0.09 Kenora 3.70 0.68 2.34 0.68 Muskoka 3.59 2.48 1.05 0.06 Kawartha 3.62 3.14 0.55 0.00 Perth 3.54 1.74 1.80 0.00 Simcoe 3.54 2.37 1.03 0.14 Brant 3.53 2.35 0.99 0.19 Lanark 3.53 0.98 2.10 0.45 Lanark 3.47 1.26 2.20 0.00 Waterloo 3.36 1.94 1.05 0.37 Simcoe 3.44 2.35 0.96 0.14 Muskoka 3.30 1.69 1.16 0.45 Cochrane 3.43 1.05 1.69 0.70 Halton 3.23 2.13 1.08 0.02 Niagara 3.20 2.01 1.04 0.15 Rainy River 3.13 0.00 3.13 0.00 Prescott Russell 3.01 1.32 1.34 0.36 Lambton 3.13 1.47 1.36 0.30 Timiskaming 2.90 0.82 1.84 0.24 Oxford 3.03 1.30 1.64 0.10 Lambton 2.89 1.45 1.36 0.08 Niagara 2.95 1.90 0.94 0.11 Hastings 2.80 1.55 1.18 0.07 Hastings 2.94 1.51 1.18 0.25 Oxford 2.79 1.54 1.25 0.00 Essex 2.82 1.61 0.99 0.22 Durham 2.78 1.79 0.85 0.14 Durham 2.76 1.55 1.01 0.20 Rainy River 2.70 0.45 2.25 0.00 Peel 2.62 1.59 0.86 0.16 York 2.67 1.81 0.71 0.15 Huron 2.58 1.21 1.29 0.08 Peel 2.64 1.54 0.92 0.18 Prescott Russell 2.52 0.98 1.23 0.31 Essex 2.59 1.77 0.68 0.14 York 2.51 1.56 0.79 0.16 Haliburton 2.46 1.23 1.23 0.00 Haliburton 2.50 1.25 1.25 0.00 Prince Edward 2.45 1.57 0.76 0.12 Elgin 2.48 0.87 1.49 0.12 Elgin 2.41 2.30 0.06 0.06 Chatham Kent 2.36 0.64 1.18 0.54 SDG 2.41 1.20 1.20 0.00 Dufferin 2.34 0.82 1.51 0.00 Parry Sound 2.25 0.24 2.02 0.00 SDG 2.17 0.89 0.93 0.35 Dufferin 2.07 1.18 0.89 0.00 Parry Sound 2.16 0.36 1.68 0.12 Sudbury District 2.00 1.11 0.89 0.00 Bruce 2.08 1.27 0.67 0.15 Huron 1.92 0.95 0.98 0.00 Haldimand Norfolk 1.90 1.04 0.86 0.00 Bruce 1.88 1.09 0.79 0.00 Prince Edward 1.71 0.82 0.76 0.13 Chatham Kent 1.85 0.93 0.73 0.18 Leeds & Grenville 1.51 0.79 0.63 0.10 Northumberland 1.57 0.86 0.72 0.00 Manitoulin 1.50 0.00 1.50 0.00 Leeds & Grenville 1.56 1.12 0.34 0.10 Len & Addington 1.01 0.32 0.60 0.08 Haldimand Norfolk 1.46 0.74 0.71 0.00 Sudbury District 0.86 0.43 0.43 0.00 Manitoulin 1.37 0.00 1.37 0.00 Northumberland 0.86 0.24 0.61 0.00 Len & Addington 1.23 0.48 0.71 0.04 Academic county Contiguous county Other county | SDG = Stormont Glengarry Dundas; Len & Addington = Lennox & Addington Source: CPO Database and Statistics Canada288;289
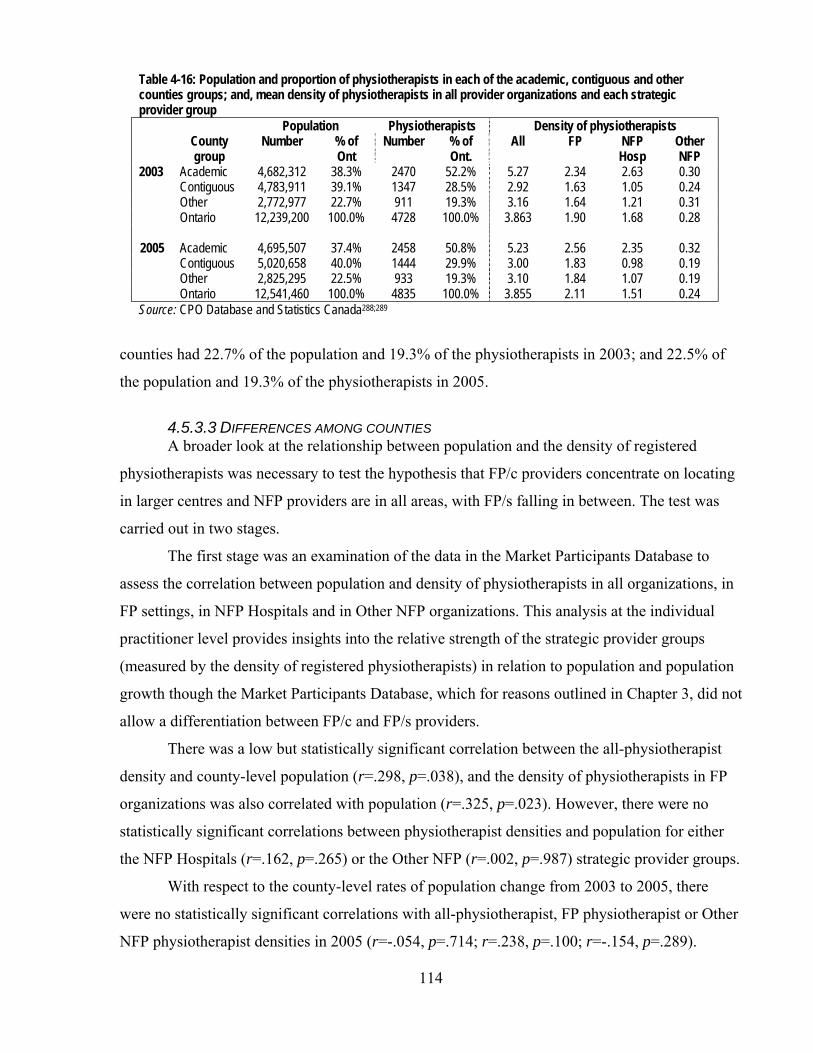
114
Table 4-16: Population and proportion of physiotherapists in each of the academic, contiguous and other counties groups; and, mean density of physiotherapists in all provider organizations and each strategic provider group
Population Physiotherapists Density of physiotherapists County
group Number % of
Ont Number % of
Ont. All FP NFP
Hosp Other NFP
2003 Academic 4,682,312 38.3% 2470 52.2% 5.27 2.34 2.63 0.30 Contiguous 4,783,911 39.1% 1347 28.5% 2.92 1.63 1.05 0.24 Other 2,772,977 22.7% 911 19.3% 3.16 1.64 1.21 0.31 Ontario 12,239,200 100.0% 4728 100.0% 3.863 1.90 1.68 0.28
2005 Academic 4,695,507 37.4% 2458 50.8% 5.23 2.56 2.35 0.32 Contiguous 5,020,658 40.0% 1444 29.9% 3.00 1.83 0.98 0.19
Other 2,825,295 22.5% 933 19.3% 3.10 1.84 1.07 0.19 Ontario 12,541,460 100.0% 4835 100.0% 3.855 2.11 1.51 0.24 Source: CPO Database and Statistics Canada288;289
counties had 22.7% of the population and 19.3% of the physiotherapists in 2003; and 22.5% of
the population and 19.3% of the physiotherapists in 2005.
4.5.3.3 DIFFERENCES AMONG COUNTIES A broader look at the relationship between population and the density of registered
physiotherapists was necessary to test the hypothesis that FP/c providers concentrate on locating
in larger centres and NFP providers are in all areas, with FP/s falling in between. The test was
carried out in two stages.
The first stage was an examination of the data in the Market Participants Database to
assess the correlation between population and density of physiotherapists in all organizations, in
FP settings, in NFP Hospitals and in Other NFP organizations. This analysis at the individual
practitioner level provides insights into the relative strength of the strategic provider groups
(measured by the density of registered physiotherapists) in relation to population and population
growth though the Market Participants Database, which for reasons outlined in Chapter 3, did not
allow a differentiation between FP/c and FP/s providers.
There was a low but statistically significant correlation between the all-physiotherapist
density and county-level population (r=.298, p=.038), and the density of physiotherapists in FP
organizations was also correlated with population (r=.325, p=.023). However, there were no
statistically significant correlations between physiotherapist densities and population for either
the NFP Hospitals (r=.162, p=.265) or the Other NFP (r=.002, p=.987) strategic provider groups.
With respect to the county-level rates of population change from 2003 to 2005, there
were no statistically significant correlations with all-physiotherapist, FP physiotherapist or Other
NFP physiotherapist densities in 2005 (r=-.054, p=.714; r=.238, p=.100; r=-.154, p=.289).

115
However, there was a statistically significant but low negative correlation between population
change and NFP Hospital physiotherapist density.
It was instructive to examine four counties with the highest rates of population growth in
Ontario in the period 2003 to 2005: Peel (8.3% growth in population), York (8.2%), Durham
(5.0%) and Halton (7.2%) (Table 4-17). They had populations comparable with or greater than
those of the highest-density counties. Hotelling’s basic premise of disproportionate attractiveness
of high-population areas to providers would have predicted that there would be a high density of
physiotherapists in each of these counties. However, they placed 33rd, 32nd, 30th and 17th,
respectively, in all-physiotherapist density in 2005 (Table 4-15). Even with respect to FP density
alone, they placed 26th, 19th, 20th, and 10th in 2005. Each was ranked higher in 2005 than in 2003
but clearly not at the top.
Table 4-17: Population in 2005 and population change from 2003 to 2005 for Ontario, academic counties and the four counties with the fastest-growing population from 2003 to 2005, in order of decreasing population County
County type 2005 population
Pop. change 2003 to 2005
Toronto Academic 2,607,637 -0.2% Peel Contiguous 1,215,261 8.2% York Contiguous 922,857 8.3% Ottawa Academic 832,550 1.1% Durham Contiguous 575,201 5.0% Hamilton Academic 519,878 0.6% Halton Contiguous 443,347 7.2% Middlesex Academic 434,272 1.3% Thunder Bay Academic 153,873 -0.6% Frontenac Academic 147,297 0.3% Ontario 12,541,460 2.5% Source: Statistics Canada288;289
The level of analysis for the second stage was the physiotherapy provider organizations
who responded to the survey. This allowed some analysis of FP/c and FP/s patterns as well as the
NFP providers groups. In this second stage, the distribution of organizations was assessed
comparing the three counties with the highest populations (Middlesex, Ottawa and Toronto) to
the nine counties with lower populations (Table 4-18).
Proportionately, twice as many FP/s organizations (14.9%) were located outside the
higher-population counties than FP/c organizations (7.3%). Also as expected, some of the NFP
providers – NFP Hospitals – were distributed more evenly across all counties than the FP
providers, with 37.2% of the NFP Hospital respondents in the lower-population counties. Other
NFP organizations were distributed like FP/s organizations.
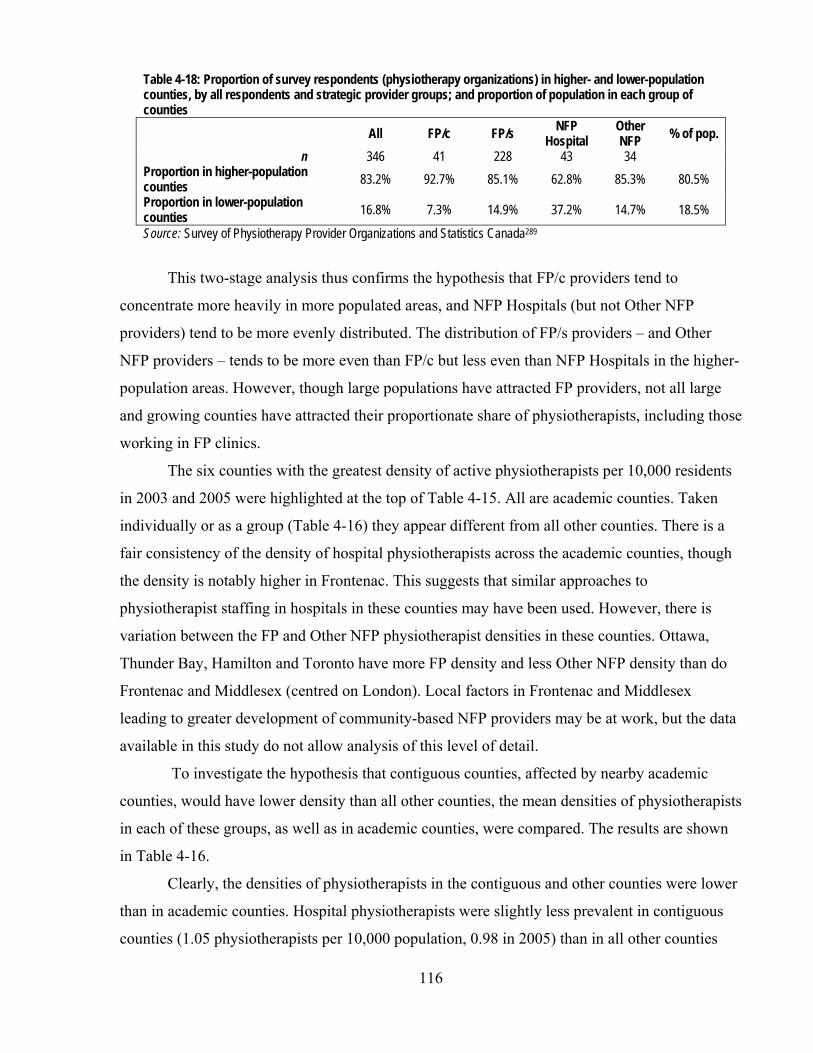
116
Table 4-18: Proportion of survey respondents (physiotherapy organizations) in higher- and lower-population counties, by all respondents and strategic provider groups; and proportion of population in each group of counties
All FP/c FP/s NFP Hospital
Other NFP % of pop.
n 346 41 228 43 34 Proportion in higher-population counties 83.2% 92.7% 85.1% 62.8% 85.3% 80.5% Proportion in lower-population counties 16.8% 7.3% 14.9% 37.2% 14.7% 18.5%
Source: Survey of Physiotherapy Provider Organizations and Statistics Canada289
This two-stage analysis thus confirms the hypothesis that FP/c providers tend to
concentrate more heavily in more populated areas, and NFP Hospitals (but not Other NFP
providers) tend to be more evenly distributed. The distribution of FP/s providers – and Other
NFP providers – tends to be more even than FP/c but less even than NFP Hospitals in the higher-
population areas. However, though large populations have attracted FP providers, not all large
and growing counties have attracted their proportionate share of physiotherapists, including those
working in FP clinics.
The six counties with the greatest density of active physiotherapists per 10,000 residents
in 2003 and 2005 were highlighted at the top of Table 4-15. All are academic counties. Taken
individually or as a group (Table 4-16) they appear different from all other counties. There is a
fair consistency of the density of hospital physiotherapists across the academic counties, though
the density is notably higher in Frontenac. This suggests that similar approaches to
physiotherapist staffing in hospitals in these counties may have been used. However, there is
variation between the FP and Other NFP physiotherapist densities in these counties. Ottawa,
Thunder Bay, Hamilton and Toronto have more FP density and less Other NFP density than do
Frontenac and Middlesex (centred on London). Local factors in Frontenac and Middlesex
leading to greater development of community-based NFP providers may be at work, but the data
available in this study do not allow analysis of this level of detail.
To investigate the hypothesis that contiguous counties, affected by nearby academic
counties, would have lower density than all other counties, the mean densities of physiotherapists
in each of these groups, as well as in academic counties, were compared. The results are shown
in Table 4-16.
Clearly, the densities of physiotherapists in the contiguous and other counties were lower
than in academic counties. Hospital physiotherapists were slightly less prevalent in contiguous
counties (1.05 physiotherapists per 10,000 population, 0.98 in 2005) than in all other counties
117
(1.21 in 2003, 1.07 in 2005), but much less prevalent than in the academic counties taken
together (2.63 in 2003, 2.35 in 2005). The density of FP physiotherapists was about the same in
contiguous counties (1.63 in 2003, 1.83 in 2005) as in other counties (1.64 in 2003, 1.84 in
2005), but again, less prevalent than in the academic counties (2.34 in 2003, 2.56 in 2005).
A one-way ANOVA with one between-subjects factor was used to test whether
differences among the mean physiotherapist densities (all physiotherapists and physiotherapists
in each of FP, NFP Hospital and Other NFP settings) in the three types of counties were
statistically significant in each of the years. The results are in Tables A4-3 to A4-6 in Appendix
16. In all cases except Other NFP physiotherapists, the academic counties were statistically
significantly different from the other two types of counties, but the non-academic county types
were not statistically different from each other. With these results, the proposition that there
would be lower density in the contiguous counties than in other counties was rejected.
Therefore, though it was hypothesized that larger centres would attract more FP/c
providers and a modest effect was found confirming this hypothesis, it was the larger counties
with academic health science centres that disproportionately attracted providers of all kinds.
Counties with large and growing populations were less likely than academic counties to attract
proportionally as many additional physiotherapists and physiotherapy providers.
4.5.4 Two cohorts of physiotherapists
While the preceding sections have provided a profile of the supply of labour to the
physiotherapy market divided on professional and geographic lines, several key informants (P-1,
P-2, P-3, P-4, P-7, P-9, P-10, O-2, O-3, R-2) described another cleavage in the group of
therapists supplying the market that has been driven by regulatory changes.
These key informants described changes that have taken place in the physiotherapy
market in terms of the experiences of therapists who are active in today’s physiotherapy market.
They generally described two different cohorts of therapists: those who had their formative
professional experiences and acquired their skills prior to and after the early 1990s. They alluded
to a fundamental change in the market over the threshold in the early 1990s, as the development
of a privately-funded market really started with the institution of no-fault MVA insurance in
1990. The no-fault system instituted a schedule of guaranteed benefits for victims of motor
vehicle accidents, and made these benefits available to a wider variety of claimants than under a
fault or tort system, which required victims to sue to recover losses. (The current insurance
benefits scheme is described in section 5.1.1.8 in Chapter 5). As expected, there was an increase

118
in demand for physiotherapy services, fuelled by the availability of a payment system for those
services. The FP provider part of the market flourished for some years.
The key informants described the first cohort as predominantly rooted in hospital-based
physiotherapy services where the majority of therapists were employed, and oriented to public
funding through global budgets in hospitals. They characterized the hospital setting as providing
a particularly rich experience, as it was possible to practice physiotherapy in different parts of the
hospital, gaining expertise with patients with various kinds of injuries and diseases. Particularly
important, according to several of the key informants, was the stability in employment that was
possible in the hospital environment. This stability allowed therapists the freedom to focus on
treatment rather than on both treating and running a business or looking for alternative
employment. Also important was the experience of working with other health professionals in
the hospital setting, including nurses and physicians, where there was a guaranteed flow of
patients and funding. Little business acumen was required of therapists in this environment
because of the nature of the funding arrangement.
In contrast, the second cohort of therapists has experienced the more dynamic
environment of the growth of private clinics and organizations and of more complicated
relationships with multiple payers since the mid 1990s. In such an environment, a therapist might
only experience one kind of practice in contrast to the experience of the earlier generation and
not be able to gain experience in a number of different areas. For this cohort of therapists,
acquiring business skills has been a natural part of their maturation process, but since there was
no common formal training in business practices in the university-level training process, the
acquisition of skills has depended on the exposure to the conduct of business in the organization
they happen to be in at their most formative stages.
For the second cohort, there was and is less stability in employment than the first cohort
experienced in hospital settings, and therapists in the second cohort have only ever experienced
the period of rapid growth in the private sector under the MVA regime and the subsequent
contraction of the opportunities in the late 1990s and the MVA insurers’ fee reduction in 2003
(discussed in section 5.2.8 in Chapter 5), which all the key informants viewed as fundamentally
market-changing.
As a result of the coexistence of these two cohorts, key informants said that there are
differences in values and norms that sometimes conflict. Key informants, who on the whole were
more familiar with the first cohort’s outlook, described the second cohort as more demanding.

119
The key informants also said that because there is still the need for an environment for newer
therapists to learn and acquire skills, those therapists find it convenient, useful and remunerative
to spend their early years after graduation working in larger organizations where possible. As
was explored in section 4.6.1, there were challenges with recruitment, and it was the larger
organizations, particularly FP organizations, that were able to pay better starting salaries. Some
of the key informants (P-2, P-4, P-7, P-9, O-2, O-3, R-2) said that new graduates tend to stay on
with the larger organizations. Others (P-1, P-3, P-10), however, talked about a pattern of
relatively new graduates learning within these larger organizations for about a two year period
and then some make the decision to leave and start their own organizations or take up a position
elsewhere.
4.6 Review of findings in this chapter
This chapter has provided an outline of the physiotherapy market in Ontario. The edges
of the market were fairly permeable, with overlaps with other markets. While the demand for
physiotherapy services has not been quantified in the literature, there is a consensus that demand
is rising not dropping.
There was a wide variety of buyers and sellers in the market, with many possible
combinations of relationships among them. There was also a wide variety of services offered by
physiotherapy organizations, and the types of services differed somewhat by strategic provider
group. Though most offer common services – physiotherapy, exercise therapy, acupuncture and
functional evaluations – the FP provider organizations tended to offer more ancillary services
and services outside the medical and physical rehabilitation models. Other NFP organizations
also offer a significant proportion of ancillary services. Registered physiotherapists tended to
provide the common services across all provider organizations.
Data from the key informants provided an alternative approach to the analysis of the
supply of therapeutic expertise, based not on geography or type of provider organizations, but on
the years in which the therapists had their formative professional experiences in the market.
Norms and values were perceived as different between one cohort (with formative experiences
before the early 1990s) and a second cohort typified as having more facility in a dynamic,
competitive market and more willing to move around to suit their individual preferences.
Findings regarding Hypothesis 1(a) It was hypothesized that lower-cost personnel (that is, personnel other than registered
physiotherapists and other health professionals) would be used more in FP/c provider

120
organizations to provide physiotherapy services to patients, less in NFP organizations, with FP/s
organizations in between. However, there were no significant differences in the use of these
personnel among FP/c, NFP Hospitals and Other NFP provider organizations. FP/s provider
organizations used fewer of the non-physiotherapist resources, though the differences between
FP/c and FP/s were not quite statistically significant. There were also no differences in the rates
of use of these personnel between physiotherapy providers in counties with high and low
densities of physiotherapists. There were differences, though, in the rates of use by
organizations owned by registered physiotherapists and those owned by others. The high demand
for labour was felt in all counties by all providers but there was a substantially lower rate of use
of assisting and supporting personnel in provider organizations owned by registered
physiotherapists than in organizations owned by others.
Findings regarding Hypothesis 1(b) The distribution of physiotherapy services across Ontario, measured by the distribution of
registered physiotherapists and by physiotherapy provider organizations, did not reflect fully the
hypothesized pattern. FP/c providers were modestly more associated with larger centres as
hypothesized, NFP providers were more evenly distributed across all counties, and FP/s provider
organizations were distributed like FP/c organizations but not quite as concentrated in larger
centres. However, the more obvious and dominant distribution pattern was the disproportionately
high presence of all strategic provider groups in academic counties with no statistically
significant differences in the distribution of therapists in all other counties. Physiotherapy service
providers were drawn strongly to academic centres and they were not drawn so much to areas of
high population growth, even among FP providers. These factors signal that the market was not
driven by usual demand characteristics but by different criteria. These alternative factors could
include the personal preferences and interests of therapists involved in the market, enabled by the
relatively high demand for their services.
Findings regarding Hypothesis 3(a) Research Question 3 concerned the role of labour suppliers and the pattern of supply of
patients. In this chapter, the first of the issues, labour supply, is addressed; the second part,
supply of patients, is studied in Chapter 6, section 6.1.4.
It was hypothesized in Chapter 2 that suppliers of labour would exert much pressure on
provider organizations if they are in short supply and have exclusive rights to supply the market.
The data confirmed that registered physiotherapists are the dominant occupational group
121
supplying the market and that they were in short supply. They did not, however, have a legal
right of exclusivity to supply labour to this market: their self-regulation rights extend only to
protection of title not to scope of practice. But there was no evidence of widespread unionization,
which would tend to enhance individual professionals’ power through collective bargaining.
However, the data also showed that, among health professionals, physiotherapists are the
preferred labour suppliers in this market, despite a wide range of other health professionals who
could supply some of the services provided by physiotherapists. Furthermore, as discussed,
different types of non-health professionals (for example, rehabilitation aides or physiotherapy
assistants) were supplying services in different types of provider organizations, demonstrating
that those other occupational groups were relatively weak across the market even if they had
some significant foothold in the supply of labour within some provider types.
Thus, while the apparent shortage of physiotherapists has gained them a significant
capacity to affect the structure of provider organizations in the market, the absence of protection
of scope of practice (that is, exclusive rights to supply certain procedures or modalities) does not
appear to have weakened this capacity. The net effect appears to be that individual
physiotherapists are generally able to assert their practice preferences in terms of location, kinds
of patients, professional autonomy and life-work balance. Therapists whose formative
experiences occurred in the 1990s and later appear to be willing to assert these preferences.
However, the collective power of the physiotherapy profession is lower than, for example,
physicians, shown by the recent rise of potential competitors with registered health professional
status.

122
Chapter 5 – Revenue sources, buyer power
In this chapter, various aspects of the revenue sources in the physiotherapy market are
examined. Section 5.1 opens with a review of the payment schemes of the different revenue
sources in the physiotherapy market. This review leads to a test of Hypotheses 2(a) and (b)
concerning the differences between public and private payers and their approaches to provider
organizations in the market, and the issue of the control of costs by multiple payers.
Section 5.1 also identifies the highest and lowest revenue niches, and the niches with the
lowest administrative burden in the market. The relevant data are analyzed in section 5.2 to test
Hypothesis 1(c) relating to comparative strategic provider group behaviour: that is, that FP/c
provider organizations, as compared with NFP providers, are more likely to serve higher-revenue
niche markets and niches with lower administrative burdens, and that FP/s providers fall between
these two groups.
After the consideration of the hypothesized relationship between strategic provider
groups and certain revenue sources, section 5.3 summarizes the findings in this chapter.
5.1 Revenue sources in the physiotherapy market
5.1.1 Revenue sources’ terms and conditions
Figure 4-1 in Chapter 4 provided a first look at the array of revenue sources in the
physiotherapy market, including public, quasi-public and private insurers and patients who buy
services on their own. This section looks at each of the revenue sources in turn, examining the
terms and conditions of the payment structures that are in place for each.
5.1.1.1 GLOBAL BUDGETS IN HOSPITALS Most hospitals in Ontario are private NFP corporations (section 2.2.2.3, Chapter 2). They
are essentially ‘screened providers’ in that the Ministry of Health and Long-Term Care
(MOHLTC) provides funds to only a certain number of licenced281 or approved282 institutions.
Physiotherapy services provided in hospitals are Medicare or “insured” services under the
Canada Health Act341 and the Ontario Health Insurance Act12 that must be provided free of
charge to insured persons. However, there is no general legislative obligation for a hospital to
provide physiotherapy services, and it is up to hospitals to decide whether to provide them or
make them available. Under Ontario Regulation 552342 under the Health Insurance Act, the use
of a physiotherapy service is an insured outpatient service only “where available in a hospital
123
when prescribed by a physician or a registered nurse in the extended class.”* This effectively
allows hospitals and, if a hospital makes services available, individual “prescribing” physicians
or nurses, to define whether physiotherapy services are “insured” Medicare services for patients,
and therefore available to them free of charge.
Though the major funder of NFP Hospitals, the MOHLTC, has developed targeted
“incremental funding” for specific services and “protected programs” that hospitals must
maintain,344 the majority of MOHLTC hospital funding is in the form of a global budget, that is,
an amount to provide hospital services to a segment of the population. The terms of the global
budget do not specify that physiotherapy services must be offered or that when hospitals that
decide to offer services, they must be provided by registered physiotherapists. Thus, there are
also no contractual obligations for hospitals to offer these services.
Furthermore, there have been contradictory informal signals from the Ministry
concerning outpatient physiotherapy services. On the one hand, the MOHLTC has been
encouraging hospitals to have a tight focus on acute care services to contain overall costs249 and
therefore such services as outpatient physiotherapy are among those to be considered by
hospitals for cutting as they face global budget constraints. An incentive inherent in a
constrained global budget is to reduce the number of patients if possible because the number of
patients does not increase or otherwise directly affect revenues.345 On the other hand, the
MOHLTC’s instructions to hospitals in the “Hospital Annual [Budget] Planning Submission”
processes over the past few years have emphasized the need to increase revenue generation to
supplement the global budget.133 This requirement may have increased the likelihood of hospitals
offering physiotherapy services to patients outside the hospital’s regular insured inpatient and
outpatient programs. Nonetheless, Landry28 documented the trends in this area in 2003, and
found a general though not universal reluctance for hospitals to offer physiotherapy services to
generate revenue from sources other than the MOHLTC. The analysis in Chapter 4, section
4.5.3, confirmed that hospitals were continuing to reduce their physiotherapy offerings in the
period after 2003.
5.1.1.2 OHIP – DESIGNATED CLINICS AND LONG TERM CARE Prior to 2005, under Ontario Regulation 552,346 there was public insurance (under the
Ontario Health Insurance Plan, “OHIP”) for physiotherapy delivered by personnel in a limited
* A “registered nurse in the extended class” is more commonly known as a nurse practitioner who unlike other
nurses, have the authority to diagnose and to prescribe certain drugs.343

124
number (94) of listed or designated ambulatory or outpatient clinics not affiliated with hospitals
across Ontario or delivered by one of 29 individuals who were authorized to treat only in
patients’ homes. These clinics and individuals were also able to generate revenue from other
sources.
In 2005, there was a substantial revision to the rules under Regulation 552, and this is
often referred to as “de-listing”, as physiotherapy was in part taken off the list of publicly insured
services. The process of revising the rules is described elsewhere347 but in essence, whereas
publicly-insured physiotherapy services were available to almost any Ontario resident who
presented with a treatable condition at one of the 94 ambulatory clinics prior to April 1, 2005, the
new rules limited eligibility to those under 20 years old or over 64 years old upon referral from a
physician or a nurse practitioner, or to anyone referred after an overnight stay in a hospital. There
is an upper limit of the number of treatments for each patient, though neither the regulation nor
policy defines the length or content of a “treatment”.
In addition, the list of 29 individuals authorized to treat in patients’ homes was abolished
as of April 1, 2005, and from that date, the regulation provides that the MOHLTC can contract
with individual physiotherapists to provide care in long term care homes in what is called an
‘alternative payment’ arrangement under OHIP in addition to any services provided by
designated clinics. The Ontario government said that this new arrangement was expected to
increase the availability of physiotherapy services to long term care home residents, and to
supplant the practice of some long term care homes of providing a limited range of
physiotherapy services out of a small multi-purpose “personal care” per-patient payment made
by the MOHLTC to the homes.28
In July 2007, a further change was made to the OHIP designated clinic and alternative
payment schemes.348 Prior to July 27, 2007, care was required to be provided by registered
physiotherapists. After this date, the range of possible providers was opened: “support workers”
who work for designated clinics can provide physiotherapy services and the clinic can be paid
for those services if the support worker meets the standards of the College of Physiotherapists of
Ontario and is supervised by a registered physiotherapist working for a designated clinic who has
a professional relationship with the patient.
The fee established for physiotherapy services at designated clinics and in long term care
homes was established under Ontario Regulation 552 at $12.20 per treatment, or $24.40 per
treatment if provided in a patient’s home. They continue to apply, whether the treatments are
125
provided by registered physiotherapists or support workers. These fees have been the same since
October 1, 1990. Taking into account changes in the consumer price index,349 the value of these
fees declined 32.7% between 1990 and 2005.
Under the Canada Health Act, these physiotherapy services are “extended health
services”, not subject to that Act’s general prohibition on extra-billing* and under the Ontario
Health Insurance Plan, providers are permitted to bill their patients above the regulated fee.350
The MOHLTC (OHIP) has substantially limited its financial exposure by limiting the
sites in which eligible care will be paid, by restricting patient eligibility, by requiring a
physician’s or a nurse practitioner’s referral, and by limiting the number of treatments. It has also
resisted provider advocates who want to update the fees, broaden the eligibility criteria, and
increase the number of providers eligible to bill OHIP for treatment (P-1). The upper limit on the
number of treatments and a relatively low fee that has been losing value in absolute terms for 15
years may provide an incentive for provider moral hazard, as providers may reduce the length of
individual visits or increase the number of visits to compensate for the low fee, or create a
‘special OHIP treatment plan’ for a patient commensurate with the fee.351
The OHIP expenditures on physiotherapy in designated clinics declined substantially –
by $14.2-million or 18% – in fiscal year 2005/06 from the levels in fiscal year 2004/05 and the
reason is likely the change in the patient eligibility criteria. The expenditure on provision of care
in long-term care homes by providers not affiliated with designated clinics was very small
($300,000). It should be noted that this alternative payment program actually started late in the
fiscal year though it was legally possible from the beginning of the fiscal year, April 1. Figure 5-
1 provides the details of the annual expenditures over the period 2000/01 to 2005/06.
Designated clinic patients could have other insurance coverage that could pay for their
treatment, such as private insurance or WSIB. One study of the patient profile of certain
designated clinics178 showed that about one-quarter of patients had private insurance, though the
majority of patients were under age 65 in these clinics (prior to April 1, 2005) and they would,
after the 2005 rule changes, no longer be eligible for treatment.
5.1.1.3 SCHOOLS The Schools revenue source funded physiotherapy services for students in some
elementary and secondary schools, but primarily in post-secondary schools. Since the funding
* “Extra-billing” is a term used to describe a health care provider’s practice of receiving public payment for a service
and also billing a patient for the same service.

126
arrangements were on a school-by-school basis, not a lot is known about the sources. It seems
likely that some schools had employees who provide physiotherapy services while others
contract with individuals and provider organizations for the care.
5.1.1.4 CHARITIES Charities are NFP corporations that enjoy certain tax advantages in Canada (see Chapter
2, section 2.4.4.1) in return for commitments to serve the community.* Some charities have been
formed to provide advocacy services in the health care field, and some to provide or fund health
services directly to patients in specific groups. One such group is the Arthritis Society,352 which
receives funding from the MOHLTC to provide advice and physiotherapy services to people
with arthritis, either directly or through contracted professionals.353 Other examples of charities
in Ontario providing health care-related services include brain injury associations.354;355 This
revenue source for physiotherapy services in Ontario is very small (see section 5.2.4), and the
purposes of the charities’ funding varies with the charity.
* Most NFP Hospitals in Ontario are not charities though may have sibling charitable foundations to raise tax-
creditable donations for primarily capital expenditures in the hospital.
Figure 5-1: OHIP payments to Designated Clinics and under the Alternative Payment Program for Long-Term Care Homes, 2000/01-2005/06, in millions of dollars
$49.1$55.6
$63.8$70.3
$78.7
$64.2
0
10
20
30
40
50
60
70
80
90
2000/01 2001/02 2002/03 2003/04 2004/05 2005/06
$ m
illio
ns
Designated clinics Alternative payment
$0.3

127
5.1.1.5 GLOBAL BUDGET FOR CCACS Community Care Access Centres (CCACs) are NFP corporations established under the
Community Care Access Centres Act, 2001,5 and are designated as the eligible recipients of
public funding from the MOHLTC under the Long-Term Care Act, 1994.6 They provide home
care services (including physiotherapy services) to people who need them. The majority of
patients are older adults, though they live in settings other than long-term care homes. As well,
CCACs provide physiotherapy and other services to patients discharged from acute care
hospitals after orthopaedic surgery, and they provide services to disabled persons who, with the
services, are able to live independently.356;357
As in the case of hospitals, the question of the allocation of the MOHLTC’s block grant
to a CCAC among various services comprising home care is in the discretion of the CCAC.
Unlike hospitals, CCACs are not intended to deliver services directly,340;356 and many of them
“divested” their physiotherapy staff and contracted with other providers for services.
Nonetheless, some CCACs in the northern part of the province in 2005 provided their therapy
services through directly-employed staff rather than through contract provider organizations.28;340
CCACs generally choose providers under a managed competition model,356 using a
common procurement approach approved by the MOHLTC. Potential providers are invited to
bid to supply services on terms set out in a Request for Proposals issued by a CCAC, and
proposals are assessed by the CCAC on quality and cost criteria.357 Decisions about contracts in
this sector generally have resulted in all-or-nothing awards, with the losers of the competitive
process, often not-for-profit incumbents,357 exiting from the market. A 2005 report357 on
managed competition in the home care sector recommended changes to allow incumbents in the
CCAC niche greater stability. The Ministry of Health and Long-Term Care (MOHLTC) accepted
this recommendation358 and has amended the managed competition criteria, commencing in
2007. Nonetheless, the prospect of established providers continuing to exit the market as a result
even of the amended competitive process led the Ontario government to suspend the process in
January 2008 until a more stable market rules could be established.359
The fees paid by the CCAC to the contracted agencies for therapy are specified in
contracts with each provider agency based on what the provider agencies committed to in their
proposal to the CCAC. Employees of agencies that contract with the CCACs decide which
persons will receive physiotherapy services, guided by the terms of the contract with the CCAC,
the availability of funding from the Ministry, the allocation of specified funds for therapy by the
individual CCAC, and the policies on client care of the CCAC. Using these techniques, the

128
Ministry and its agents, the CCACs, impose an upper limit on their financial exposure on an
annual basis.
Because the total CCAC funding is relatively constrained with global budgets, the CCAC
providers are likely to focus on their core patients, and to shed or avoid potential clients who
could benefit from less urgent physiotherapy services such as those focused on health promotion
and injury prevention.
5.1.1.6 VETERANS AFFAIRS CANADA In recognition of their service to Canada, certain veterans (retired or disabled former
members of the Canadian Forces) are entitled to receive health care services, including
physiotherapy. Under regulations260 made under the Department of Veterans Affairs Act,258 the
federal Department of Veterans Affairs offers a Health Benefits Program and a “Veterans
Independence Program” or “VIP” to provide non-institutional care to veterans. One of the
possible services is physiotherapy. Fees are established by the federal Department360 and are
administered by a private insurance company, Medavie Blue Cross.361 The Department pays
$40.00 for a physiotherapist visit ($50.35 for the first visit). Acupuncture is reimbursed at
$40.00. Both require a physician referral, and there is a right for the insurer to review the
circumstances of a treatment and to deny coverage on the basis of non-eligibility for the benefit,
that is, if the services are not medically necessary.360 As will be seen, this is a small program in
comparison with other programs in terms of provider revenues across Ontario.
5.1.1.7 CANADIAN FORCES Members of the Canadian Forces are entitled to a variety of health care services, and
these services are usually delivered in health care facilities run by the Canadian Forces Health
Services. However, certain services may not be available at those sites, and Canadian Forces
members, with authorization, can seek treatment from civilian providers. The Canadian Forces
contracted with the same insurance company as Veterans Affairs Canada, Medavie Blue Cross,
to administer these benefits.362 Members are eligible for physiotherapy when necessary at home,
and if delivered on an outpatient basis (in a private clinic, for example), they are eligible for up
to 20 treatments per year when authorized by a physician.363
129
5.1.1.8 MVA INSURANCE In Ontario in 2005, there were over 150 insurance companies licensed to sell policies that
insure against the effects of motor vehicle accidents (MVA). MVA insurance is mandatory for
all drivers of motor vehicles in Ontario.364
Prior to 1989, MVA victims were required to claim and demonstrate that someone else
was at fault for the MVA accident in order to receive a cash settlement to compensate for their
accident. While making these claims through the judicial system, MVA victims received
necessary hospital and physician services under the provincial health care plan. If they recovered
damages for compensation, the provincial health care plan received part of the damages to
reimburse the health care costs the MVA victims had incurred. The claims for compensation
through the judicial system were difficult, costly and generally lengthy, and in 1989, a no-fault
insurance scheme was introduced to increase access to vocational and rehabilitation (including
physiotherapy) services to all MVA victims, even if they were at fault or could not establish that
someone else had been negligent.
Since 1989, under the Ontario Insurance Act, 270 all MVA insurance policies in force in
Ontario contain provisions for no-fault Statutory Accident Benefits in accord with a regulation
under the Act. Except for services provided in hospitals and by physicians (both of which are
publicly insured under the Health Insurance Act),12 the Statutory Accident Benefits Schedule
(SABS)272 requires insurers to provide payment for all other necessary and appropriate care
required by an individual who suffers a motor vehicle accident, and that care can include
physiotherapy services. However, a MVA insurer is a ‘second’ payer – a patient’s public and
private insurance benefits are exhausted first before the MVA insurer becomes liable. The SABS
also includes benefits for short-term income loss if a claimant cannot work, and benefits for
permanent impairment if the claimant cannot work over the long term. Income benefits can be
suspended if a person is not pursuing recommended treatment.
The Financial Services Commission of Ontario (FSCO) is the government regulator of
the insurance industry in Ontario, and one of its mandates is to regulate the MVA insurance
market.268 It establishes standards for MVA insurers’ operations and makes regulations regarding
Statutory Accident Benefits. Prior to 1993, the only regulated limit on health professionals’ fees
was a global per-claim amount for all health services, $500,000. The lack of regulated fees led
many new and established providers to adopt a competitive strategy to concentrate on the MVA
niche and to charge significantly higher fees than were available in any other part of the market,
and their profitability increased substantially (P-2, O-1, R-2). As a result, health care spending
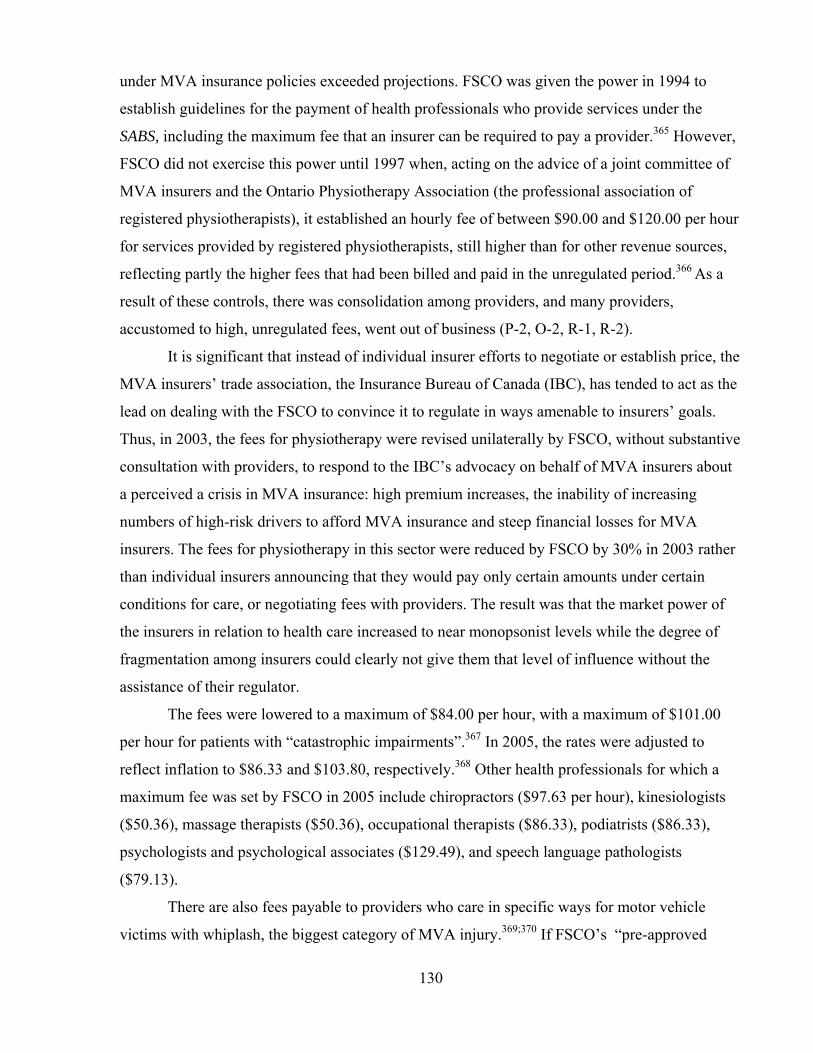
130
under MVA insurance policies exceeded projections. FSCO was given the power in 1994 to
establish guidelines for the payment of health professionals who provide services under the
SABS, including the maximum fee that an insurer can be required to pay a provider.365 However,
FSCO did not exercise this power until 1997 when, acting on the advice of a joint committee of
MVA insurers and the Ontario Physiotherapy Association (the professional association of
registered physiotherapists), it established an hourly fee of between $90.00 and $120.00 per hour
for services provided by registered physiotherapists, still higher than for other revenue sources,
reflecting partly the higher fees that had been billed and paid in the unregulated period.366 As a
result of these controls, there was consolidation among providers, and many providers,
accustomed to high, unregulated fees, went out of business (P-2, O-2, R-1, R-2).
It is significant that instead of individual insurer efforts to negotiate or establish price, the
MVA insurers’ trade association, the Insurance Bureau of Canada (IBC), has tended to act as the
lead on dealing with the FSCO to convince it to regulate in ways amenable to insurers’ goals.
Thus, in 2003, the fees for physiotherapy were revised unilaterally by FSCO, without substantive
consultation with providers, to respond to the IBC’s advocacy on behalf of MVA insurers about
a perceived a crisis in MVA insurance: high premium increases, the inability of increasing
numbers of high-risk drivers to afford MVA insurance and steep financial losses for MVA
insurers. The fees for physiotherapy in this sector were reduced by FSCO by 30% in 2003 rather
than individual insurers announcing that they would pay only certain amounts under certain
conditions for care, or negotiating fees with providers. The result was that the market power of
the insurers in relation to health care increased to near monopsonist levels while the degree of
fragmentation among insurers could clearly not give them that level of influence without the
assistance of their regulator.
The fees were lowered to a maximum of $84.00 per hour, with a maximum of $101.00
per hour for patients with “catastrophic impairments”.367 In 2005, the rates were adjusted to
reflect inflation to $86.33 and $103.80, respectively.368 Other health professionals for which a
maximum fee was set by FSCO in 2005 include chiropractors ($97.63 per hour), kinesiologists
($50.36), massage therapists ($50.36), occupational therapists ($86.33), podiatrists ($86.33),
psychologists and psychological associates ($129.49), and speech language pathologists
($79.13).
There are also fees payable to providers who care in specific ways for motor vehicle
victims with whiplash, the biggest category of MVA injury.369;370 If FSCO’s “pre-approved

131
framework” (PAF) specifying a certain treatment approach to whiplash injury is followed by a
physiotherapist or a chiropractor,272 the maximum fees payable are those listed in Table 5-1 and
the insurer cannot dispute the necessity of services provided under the framework. The week-by-
week fees for the PAF for a patient decreases over time, with the implication that the longer the
treatment time is, the less remunerative the fee per week is. This structure is intended to provide
an incentive for providers to discharge patients earlier rather than later.
Table 5-1: Fees for treatment of Whiplash Injuries under a MVA policy as of June 1, 2005 Service Fee Whiplash Associated Disorder Grade I Any treatment within Weeks 1 and 2 $302.51 Discharge any time during weeks 1 or 2 or at end of week 2, completion of discharge report and monitoring
$155.34
Any treatment within Weeks 3 and 4 $163.52 Final assessment and completion of discharge report $81.76 Supplementary goods and services $122.64 Transfer fee if changing initiating health practitioner $49.06 Whiplash Associated Disorder Grade II Any treatment in Week 1 $245.28 Any treatment within Weeks 2 and 3 $441.50 Discharge at end of week 3 and monitoring $163.52 Any treatment within Weeks 4, 5 and 6 $416.98 Final assessment and completion of discharge report $81.76 Supplementary goods and services $163.52 Transfer fee if changing initiating health practitioner $49.06 Source: FSCO369;370
Providers are required to provide a MVA insurer treatment plans and periodic reports in
all cases, and the reports that are in certain cases very detailed. The reporting requirements are
significantly more rigorous than required for all other revenue sources – key informants called
the requirements “onerous” (P-3) and said that when the latest reporting requirements were
introduced, the administrative costs went “through the roof” (P-2) – and are expected to become
greater if an electronic reporting system is implemented in the MVA sector in 2008 (O-4).* In
addition, providers can bill for the completion of certain reports, including a treatment plan, at a
rate of $63.72 in 2005. Samples of the Treatment Plan form, the Pre-Approved Framework
Treatment Plan form and the Auto Insurance Standard Invoice to bill for services in effect in
* An electronic reporting and system, “HCAI” (Health Claims for Auto Insurance), has been planned for some years,
to be operated by a NFP organization sponsored by the MVA insurers. The implementation of the system began in March 2007, with compulsory reporting by providers scheduled for February 1, 2008. On March 12, 2008, the use of HCAI was suspended because of technical problems.371

132
2005 are provided in Appendix 15. Table 5-2 gives a summary of the extensive information
required in these forms.
Reflecting the fees charged in the unregulated period before 1993, the fees under MVA
insurance remain high compared with fees payable in other insurers’ schemes, though there is
considerable latitude for the insurer to question a provider’s judgment and to deny benefits as not
medically necessary or ineffective, with a lengthy dispute resolution process.372 While an
insurer’s denial of payment may be appealed, this can be a costly and time-consuming process.
As a key informant (P-4) said,
[I]t's a pain in the butt to get them to pay. You know, we fight with insurance companies all the time … it's just a waste of my secretarial time to try to get them to pay. So when we do treat an MVA, for instance, the patient pays up front and the patient fights with the insurance company, which is very unattractive. If you’re coming in every day, and you could be in for six months, it's a huge outlay for the patients. But it's a pain, so we will fill out all the forms and we’ll charge the [insurer] for us filling out the forms but the patient pays and then they go after it. And whenever we make an exception to that rule and say we'll bill for them, we regret it every single time.
In 2005, multidisciplinary Designated Assessment Centres, set up to provide an
independent assessment of the patient’s condition and treatment needs, were part of the dispute
resolution process. They were abolished in April 2006 and replaced by insurers’ access to
independent examinations conducted by individual health practitioners, including, where
relevant, physiotherapists.
Therefore, though the MVA fees are the highest potential revenue source in the market,
there are costs associated with the generation of this revenue – reporting and possible dispute
resolution – aside simply from the costs of treatment.
Though FSCO’s and the insurers’ roles are legally clearly distinct in the setting of fee
guidelines, with insurers making requests or recommendations and FSCO deciding on the
guidelines, key informants said that some providers have the impression that FSCO and insurers
work so closely together that the distinction between them is blurred (P-9, O-1, R-2).
One motor vehicle insurer, Aviva Canada, has created a formal preferred provider
network, branding it “Premiere Healthcare”.373 Providers become members of the network by
entering into a contract with Aviva and undergoing accreditation by CARF-Canada, based in
Edmonton, which is an affiliate of the Commission on Accreditation of Rehabilitation Facilities
of Tuscon, Arizona.374 In return for a provider entering into a contract, Aviva adjusters refer
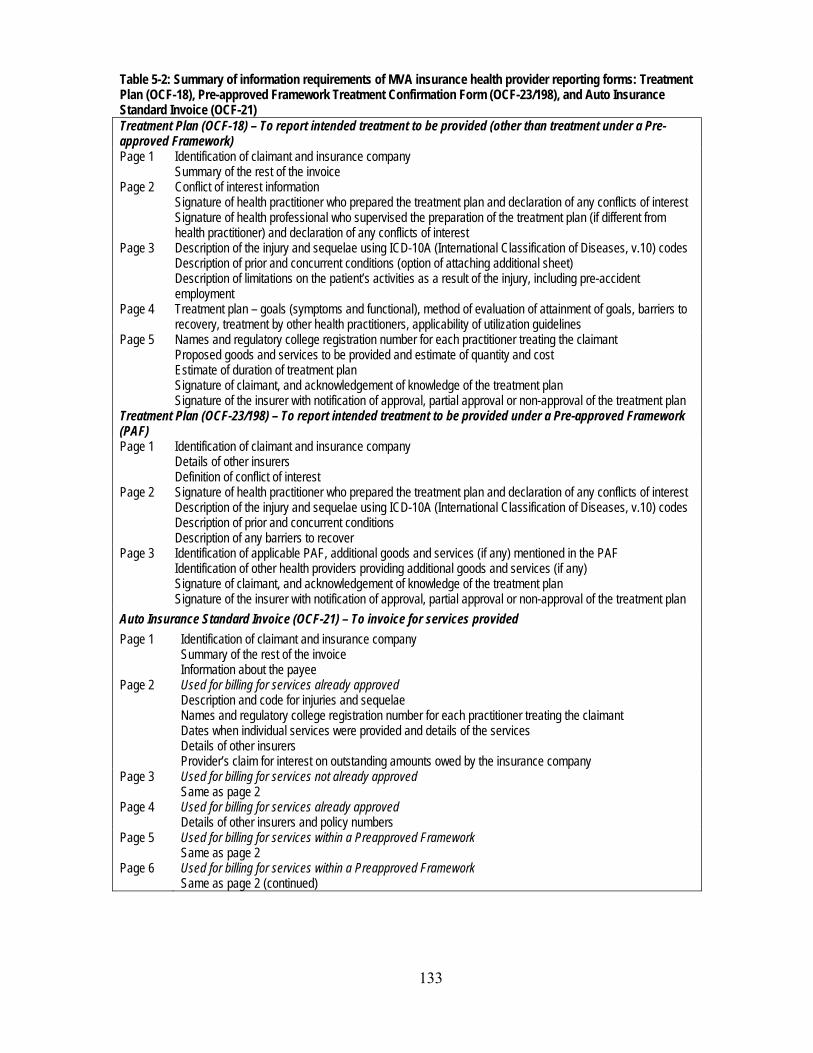
133
Table 5-2: Summary of information requirements of MVA insurance health provider reporting forms: Treatment Plan (OCF-18), Pre-approved Framework Treatment Confirmation Form (OCF-23/198), and Auto Insurance Standard Invoice (OCF-21) Treatment Plan (OCF-18) – To report intended treatment to be provided (other than treatment under a Pre-approved Framework) Page 1 Identification of claimant and insurance company
Summary of the rest of the invoice Page 2 Conflict of interest information
Signature of health practitioner who prepared the treatment plan and declaration of any conflicts of interest Signature of health professional who supervised the preparation of the treatment plan (if different from health practitioner) and declaration of any conflicts of interest
Page 3 Description of the injury and sequelae using ICD-10A (International Classification of Diseases, v.10) codes Description of prior and concurrent conditions (option of attaching additional sheet) Description of limitations on the patient’s activities as a result of the injury, including pre-accident employment
Page 4 Treatment plan – goals (symptoms and functional), method of evaluation of attainment of goals, barriers to recovery, treatment by other health practitioners, applicability of utilization guidelines
Page 5 Names and regulatory college registration number for each practitioner treating the claimant Proposed goods and services to be provided and estimate of quantity and cost Estimate of duration of treatment plan Signature of claimant, and acknowledgement of knowledge of the treatment plan Signature of the insurer with notification of approval, partial approval or non-approval of the treatment plan
Treatment Plan (OCF-23/198) – To report intended treatment to be provided under a Pre-approved Framework (PAF) Page 1 Identification of claimant and insurance company
Details of other insurers Definition of conflict of interest
Page 2 Signature of health practitioner who prepared the treatment plan and declaration of any conflicts of interest Description of the injury and sequelae using ICD-10A (International Classification of Diseases, v.10) codes Description of prior and concurrent conditions Description of any barriers to recover
Page 3 Identification of applicable PAF, additional goods and services (if any) mentioned in the PAF Identification of other health providers providing additional goods and services (if any) Signature of claimant, and acknowledgement of knowledge of the treatment plan Signature of the insurer with notification of approval, partial approval or non-approval of the treatment plan
Auto Insurance Standard Invoice (OCF-21) – To invoice for services provided Page 1 Identification of claimant and insurance company
Summary of the rest of the invoice Information about the payee
Page 2 Used for billing for services already approved Description and code for injuries and sequelae Names and regulatory college registration number for each practitioner treating the claimant Dates when individual services were provided and details of the services Details of other insurers Provider’s claim for interest on outstanding amounts owed by the insurance company
Page 3 Used for billing for services not already approved Same as page 2
Page 4 Used for billing for services already approved Details of other insurers and policy numbers
Page 5 Used for billing for services within a Preapproved Framework Same as page 2
Page 6 Used for billing for services within a Preapproved Framework Same as page 2 (continued)
134
patients* to the accredited members of the network but make sure that patients are aware that
they are free to choose another provider if they desire. In addition to getting access to these
referrals, providers in the network are exempted by the insurer from some of the reporting
exigencies. For example, the insurer waives certain of the regulated reporting requirements for
its preferred providers. But key informants generally observed that the network had not achieved
the levels of consistency and coverage across the province necessary to generate all the possible
benefits of such a network, such as improved flow of outcomes data to the insurer and noticeable
increases in quality or decreases in costs. Aviva would undoubtedly prefer to establish one or a
few preferred providers with coverage across the province, but no organization has this reach and
Aviva needed to establish several networks (O-2, R-2). To create province-wide coverage of
preferred providers, Aviva asked interested FP/c providers to add smaller FP/s providers as
partners in the networks. The cost of becoming a preferred provider is significant, involving
accreditation, and some FP/s providers have lost interest in the arrangement and have dropped
out (O-4).
Key informants observed that other MVA insurers have not followed the example of
Aviva Canada nor are they likely to do so in the future (P-9, O-4, R-1). One of these key
informants suggested that more preferred provider networks might materialize if FSCO, the
regulator, encouraged others to follow Aviva (R-1). Other key informants were not convinced
that an insurer-by-insurer approach is feasible in an MVA sector as small and as specialized as
Ontario’s and in an environment that favours patient choice, reducing insurers’ capacity to direct
patients to certain providers.
5.1.1.9 WORKPLACE SAFETY AND INSURANCE BOARD The Workplace Safety and Insurance Board (WSIB) is a NFP statutory corporation
established in 1917 to provide no-fault insurance coverage for almost 70% of Ontario workers if
they are injured or contract diseases as a result of their work.376 The WSIB is an agency of the
government and is governed by a Board of Directors appointed by the Ontario government and
the WSIB’s operations are governed by the Workplace Safety and Insurance Act, 1997.16
* All MVA accidents involving personal injury or property damage exceeding $1000 must by law be reported to
police “forthwith”375, and police routinely determine whether those involved in MVA accidents are uninsured and thus guilty of an offence.364 Once the police are involved, their accident report is routinely notified immediately to the MVA insurers involved, and the insurance company’s claims adjuster, in contact with the accident victim as a result of this information, is in a position to influence the treatment an accident victim may need other than during emergency or inpatient hospital care.

135
The WSIB has the statutory authority to set the amount of fees it pays to health care
providers and has the statutory right to decide whether health care services are necessary,
appropriate and sufficient.377 There is no obligation for the WSIB to negotiate fees, and prior to
1999, the WSIB set fees unilaterally. In 1999, the WSIB committed publicly to discuss – but not
negotiate – fees with provider associations.378
Providers must seek payment for treatments for injured workers only from the WSIB and
are prohibited from charging workers for their care.379 The Canada Health Act380 and the Ontario
Health Insurance Act381 specifically exclude health care paid by the WSIB from the definition of
“insured services”. This means that the WSIB pays for hospital and physician care provided to
injured workers,* whereas all the hospital and physician care for other residents of Ontario is
paid by global budgets and OHIP, respectively. In addition to paying for health care for injured
workers, the WSIB also pays income replacement benefits at the rate of 85% of pre-injury after-
tax wages. If a worker does not participate in health care services in a manner that the WSIB
considers appropriate, the WSIB can reduce or suspend income replacement benefits for the
period of non-participation.383
Since January 1, 2004, the WSIB has permitted patients direct access to physiotherapists,
whereas previously, a referral from a physician was necessary.324
There were four different kinds of treatment provided in the physiotherapy market and
paid for by the WSIB in 2005: fee-for-service physiotherapy; acupuncture; Community Clinic
care; a “program of care for acute lower back injury”.† In 2004, the WSIB paid $18.41‡ for a fee-
for-service “visit” of a patient to a physiotherapist and $38.78 for an acupuncture treatment. In
addition, if the therapist provided a progress or narrative report, the fee was $23.54; and for a
Physiotherapy Assessment Report, the fee was $18.41. Finally, a therapist, if asked to do so by a
patient’s employer, could complete a Functional Abilities Form for Timely Return to Work, for a
fee of $40.00, paid by the WSIB.324
The length of a “visit” is not specified by the WSIB, and so it is left to the therapist to
decide what appropriate treatment in a “visit” is. However, the WSIB allows up to 12 weeks of
treatment after which pre-approval is required, which depends on the injury and the patient’s
* The WSIB pays hospitals at a daily rate set for each hospital by the MOHLTC for the purposes of billing other
provincial public health insurance plans;382 the fees paid to physicians are the same as OHIP pays. † A second Program of Care, for Upper Extremity Injuries, was instituted on October 1, 2005, but consideration of
that Program of Care has been excluded from this study because it came into place after the bulk of the data collection through the Survey of Physiotherapy Provider Organizations.
‡ The WSIB increased the fee for a physiotherapy treatment to $24.00 as of February 25, 2008.384
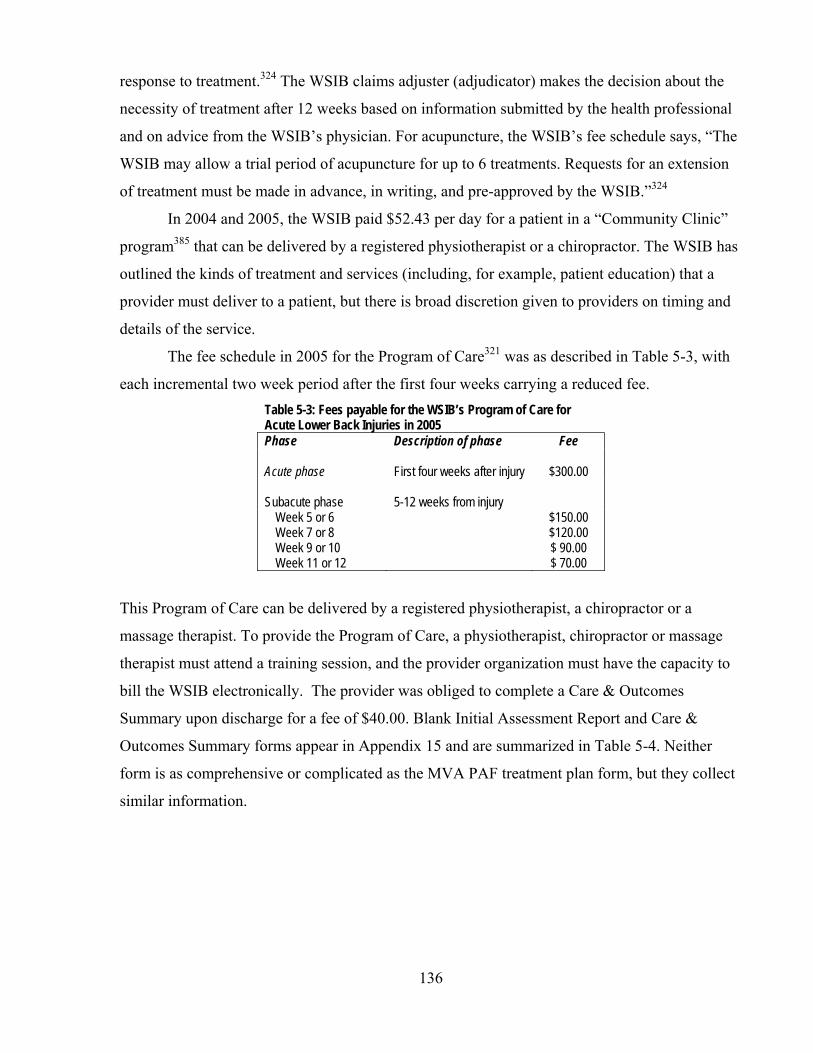
136
response to treatment.324 The WSIB claims adjuster (adjudicator) makes the decision about the
necessity of treatment after 12 weeks based on information submitted by the health professional
and on advice from the WSIB’s physician. For acupuncture, the WSIB’s fee schedule says, “The
WSIB may allow a trial period of acupuncture for up to 6 treatments. Requests for an extension
of treatment must be made in advance, in writing, and pre-approved by the WSIB.”324
In 2004 and 2005, the WSIB paid $52.43 per day for a patient in a “Community Clinic”
program385 that can be delivered by a registered physiotherapist or a chiropractor. The WSIB has
outlined the kinds of treatment and services (including, for example, patient education) that a
provider must deliver to a patient, but there is broad discretion given to providers on timing and
details of the service.
The fee schedule in 2005 for the Program of Care321 was as described in Table 5-3, with
each incremental two week period after the first four weeks carrying a reduced fee. Table 5-3: Fees payable for the WSIB’s Program of Care for Acute Lower Back Injuries in 2005 Phase Description of phase Fee Acute phase
First four weeks after injury
$300.00
Subacute phase
5-12 weeks from injury
Week 5 or 6 Week 7 or 8 Week 9 or 10 Week 11 or 12
$150.00 $120.00 $ 90.00 $ 70.00
This Program of Care can be delivered by a registered physiotherapist, a chiropractor or a
massage therapist. To provide the Program of Care, a physiotherapist, chiropractor or massage
therapist must attend a training session, and the provider organization must have the capacity to
bill the WSIB electronically. The provider was obliged to complete a Care & Outcomes
Summary upon discharge for a fee of $40.00. Blank Initial Assessment Report and Care &
Outcomes Summary forms appear in Appendix 15 and are summarized in Table 5-4. Neither
form is as comprehensive or complicated as the MVA PAF treatment plan form, but they collect
similar information.
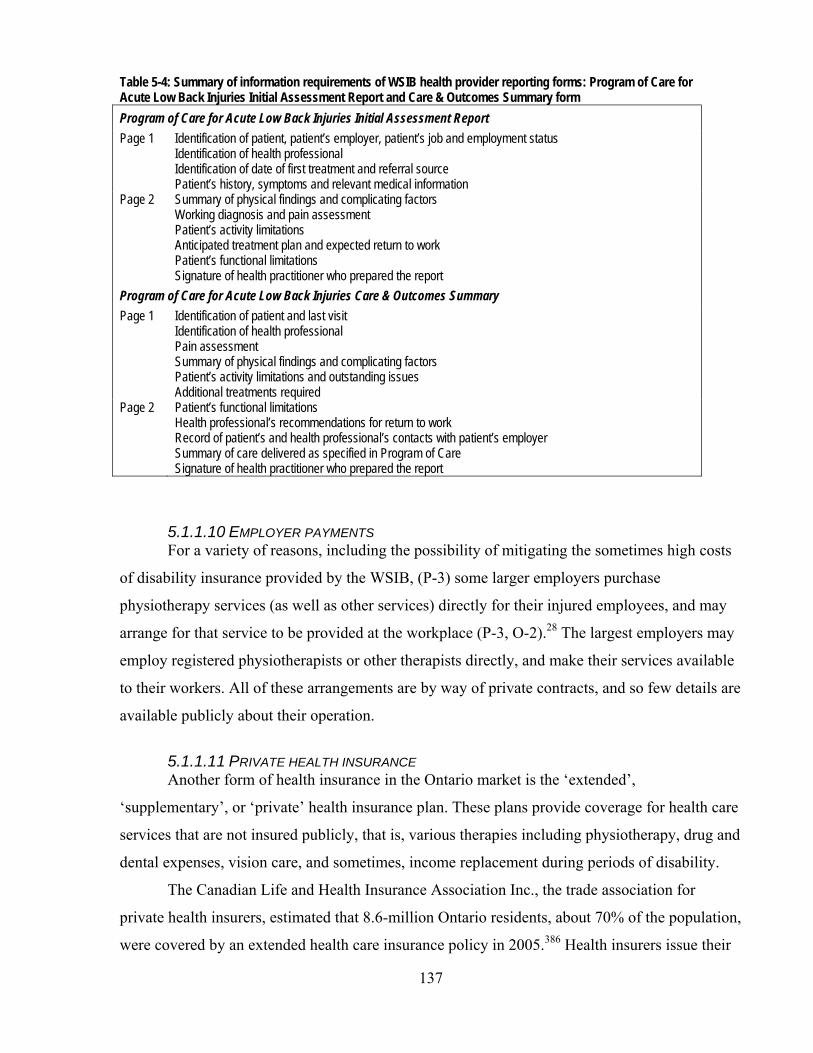
137
Table 5-4: Summary of information requirements of WSIB health provider reporting forms: Program of Care for Acute Low Back Injuries Initial Assessment Report and Care & Outcomes Summary form Program of Care for Acute Low Back Injuries Initial Assessment Report Page 1 Identification of patient, patient’s employer, patient’s job and employment status
Identification of health professional Identification of date of first treatment and referral source Patient’s history, symptoms and relevant medical information
Page 2 Summary of physical findings and complicating factors Working diagnosis and pain assessment Patient’s activity limitations Anticipated treatment plan and expected return to work Patient’s functional limitations Signature of health practitioner who prepared the report
Program of Care for Acute Low Back Injuries Care & Outcomes Summary Page 1 Identification of patient and last visit
Identification of health professional Pain assessment Summary of physical findings and complicating factors Patient’s activity limitations and outstanding issues Additional treatments required
Page 2 Patient’s functional limitations Health professional’s recommendations for return to work Record of patient’s and health professional’s contacts with patient’s employer Summary of care delivered as specified in Program of Care Signature of health practitioner who prepared the report
5.1.1.10 EMPLOYER PAYMENTS For a variety of reasons, including the possibility of mitigating the sometimes high costs
of disability insurance provided by the WSIB, (P-3) some larger employers purchase
physiotherapy services (as well as other services) directly for their injured employees, and may
arrange for that service to be provided at the workplace (P-3, O-2).28 The largest employers may
employ registered physiotherapists or other therapists directly, and make their services available
to their workers. All of these arrangements are by way of private contracts, and so few details are
available publicly about their operation.
5.1.1.11 PRIVATE HEALTH INSURANCE Another form of health insurance in the Ontario market is the ‘extended’,
‘supplementary’, or ‘private’ health insurance plan. These plans provide coverage for health care
services that are not insured publicly, that is, various therapies including physiotherapy, drug and
dental expenses, vision care, and sometimes, income replacement during periods of disability.
The Canadian Life and Health Insurance Association Inc., the trade association for
private health insurers, estimated that 8.6-million Ontario residents, about 70% of the population,
were covered by an extended health care insurance policy in 2005.386 Health insurers issue their
138
own policies (called “insured contracts”) and these constituted 63% of the total private health
insurance premiums paid in 2005, or $7-billion. Of this total, 88% of the premiums ($6.2-billion)
were paid for group plans sponsored by employers, unions and others, and 12% of the premiums
were for insurance policies purchased by individuals. Various life insurers administer “uninsured
contracts” on behalf of employers – these are contractual obligations made by employers to their
employees to pay certain health care expenses – and the premium equivalents for these plans
totaled $4.2-billion.
Unfortunately, there are no figures available regarding the total payments under health
insurance plans for physiotherapy services. Instead, reports386 confirm that in 2005, a total of
$9.1-billion was paid under health insurance plans across Canada, of which 27% or $2.5-billion
was for dental care; 22% of $2.0-billion was for income replacement, and 48% ($4.4-billion) was
for “medical/hospital coverage” which includes physiotherapy, drugs, upgrades to private and
semi-private hospital rooms, vision care, chiropractic services, ambulance transportation, and
private duty nursing. Expenditures on physiotherapy would be a minor part of this
medical/hospital category after drug coverage and hospital semi-private ward coverage.
Private health insurance plans typically have a maximum coverage amount for
physiotherapy services, for example, $200, $500 or $1000 per year, and the maximum might
apply to chiropractic, massage therapy and physiotherapy services as a group (P-2, P-7),28 with
the latter two types payable only upon a referral from a physician. In addition, many health plans
provide for a deductible or co-payments.387 The requirements for provider reporting to the
insurance company are generally modest; usually, it is the insured patient who makes the claim
with an itemized bill from the provider corroborating information for the claim such as purpose,
duration and fee for the treatments and whether the basis of the claim is a work injury and
therefore eligible for WSIB coverage and ineligible under the private insurance policy. Two
samples of claim forms are provided in Appendix 15.
The levels of coverage and the fees payable to various health professionals are
established in the policies prepared by the private health insurers, and where employers pay for
the policies, they are able to choose a standard or customized policy, depending on their
willingness to pay for them.
From the interviews with the key informants, one of the niches with the lowest
administrative burden was private insurance (P-2, P-5, P-9) for several reasons. First, the way a
provider bills private insurers is very straightforward compared to, for example, the reporting
139
and billing forms for MVA insurance and WSIB (see Tables 5-2 and 5-4, and Appendix 15), for
which details about the treatment plan and sometimes the outcome were required. With private
insurance, there is no need to seek the insurer’s permission to proceed with treatment: the
insurer’s liability is usually clear after it is determined by a patient that he or she has insurance
and physiotherapy is one of the benefits under the policy.
To simplify matters even further for themselves, it was a common though not universal
practice for providers to bill their patients and leave it to their patients to seek reimbursement
from their insurer (P-5, P-9, 0-2). This means that the patient assesses the suitability of the price
after considering the reimbursement terms from his or her insurer, and, with the input of the
therapist on the question of need, the patient, not the insurer, makes the consequential decisions
about the level or duration of payment.
Finally, there was the least amount of dissatisfaction with the level of the fees charged to
private insurers than with the level of any other fee. While providers reported that the median fee
charged to private insurers is $45.00, they were free to charge their patients over and above this
amount, and 36.7% of the respondents to the Survey of Physiotherapy Provider Organizations
said they sometimes charged patients on top of what the patients’ private insurance companies
paid and 14.4% said they always charged more. This was the highest percentage of extra-billing
of all the revenue types.
It must be noted, however, that collecting payments from individuals rather than an
insurer may expose the provider to the higher risks that the individuals will not pay or will not be
able to pay, leaving the provider with bad debts. However, in response to questions about the
‘worst payer’ and ‘best payer’ in the market, most key informants did not see this as a problem
though they did mention collection problems with some insurers. Two key informants (P-4, P-5)
said that this risk is sometimes managed by providers by requiring payment at the time of
treatment, though this not a universal practice and is adjusted to individual circumstances.
There was also information from key informants (P-3, P-4, P-5, P-9, O-2) about the need
to coordinate benefits either between two private insurers (as a result of separate private
insurance policies held by spouses with duplicate coverage, for example) or between a private
insurer at the beginning of an MVA insurance claim (for MVA insurers are the second payer,
after other insurers). The survey data confirmed (n=330) that there was always a need to bill two
payers (2.7%) and sometimes bill two payers (60.9%). About a third (36.4%) said they did not
have to work with the patient to coordinate two insurers. But when there are two payers, 89.7%
140
of the respondents (n=172) said that it was necessary to bill a private insurer until coverage runs
out, and then bill a MVA insurer and 7.4% said that there was an assortment of combinations of
different payers.
5.1.1.12 OUT OF POCKET EXPENDITURES Patients are also free to purchase their own physiotherapy services.* Patients may pay the
entire cost of their care if they are uninsured and if they have reached the limit of their private
insurance coverage. In addition, a patient may pay part of the cost of care if there is a co-
payment or deductible required in their private health insurance policy. The fees for these
services are established by the provider and agreed by the patient.
Out of pocket revenues share many of the attributes of private insurance with respect to
the ease of billing and reporting to the payer. As well, there are no regulatory constraints on the
ability of the provider organization to charge for services as it sees fit. There are, however, some
of the same issues about the collection of payments from individuals who are paying for
themselves, though providers may institute administrative remedies such as requirements for
advance payments.
5.1.2 Complexity of the revenue sources
5.1.2.1 PAYMENT STRUCTURES The preceding sections show that though there is a broad range of revenue sources across
the public, quasi-public and private sectors, all rely on providers to identify whether patients
need physiotherapy services that the providers can provide. However, the payment schemes
reveal different revenue sources’ perceptions of their vulnerabilities and strengths with respect to
providers and patients as the revenue sources endeavour to maintain their viability or
profitability. The arrangements range from higher levels of control by the insurer over the form
of treatment, as in the case of the MVA and some WSIB revenue sources, to very little direct
control, as in the case of global budgets to hospitals and OHIP payments to the designated
clinics. There is also a wide range of fees and fee types, and though it is possible to classify the
different revenue sources and groups of payers according to their public, quasi-public or private
status, there are similarities and differences among and within these groups.
For example, while public insurers and employers limit the number of providers
(hospitals, OHIP designated clinics and providers contracted to CCACs or the employer) that can
* There are two exceptions: patients cannot buy or pay for physiotherapy services provided as an inpatient hospital
service or for those provided in designated clinics and paid directly by OHIP.263
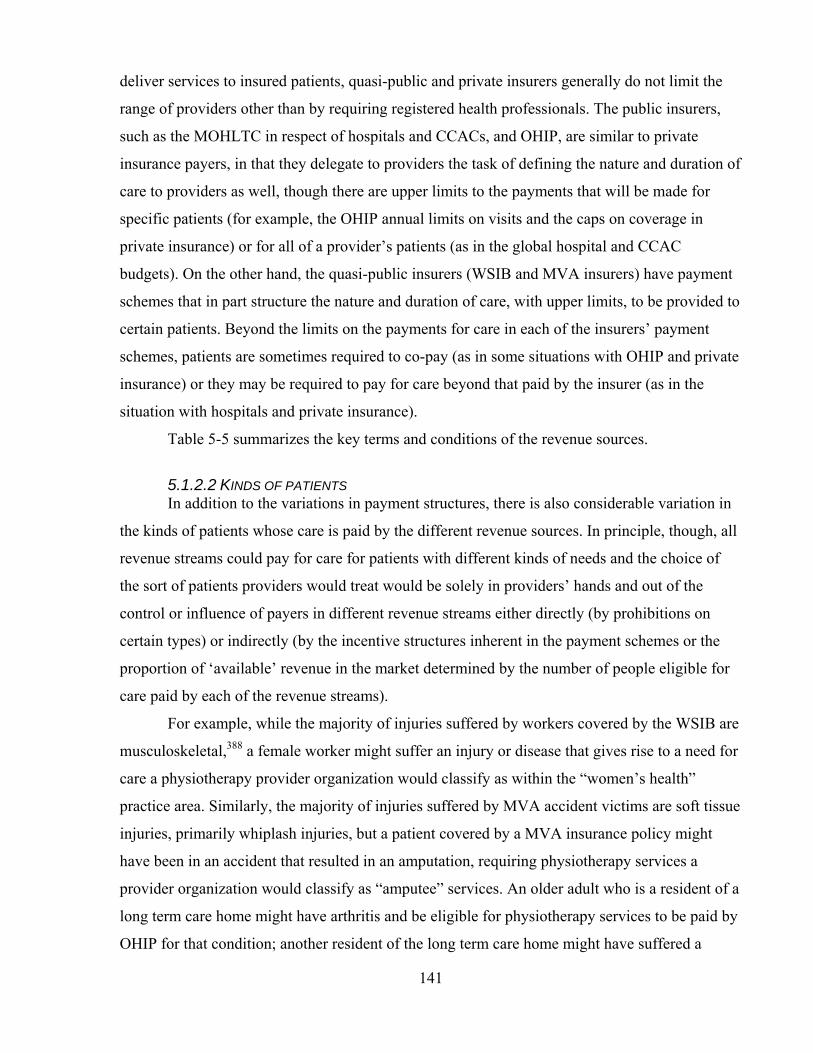
141
deliver services to insured patients, quasi-public and private insurers generally do not limit the
range of providers other than by requiring registered health professionals. The public insurers,
such as the MOHLTC in respect of hospitals and CCACs, and OHIP, are similar to private
insurance payers, in that they delegate to providers the task of defining the nature and duration of
care to providers as well, though there are upper limits to the payments that will be made for
specific patients (for example, the OHIP annual limits on visits and the caps on coverage in
private insurance) or for all of a provider’s patients (as in the global hospital and CCAC
budgets). On the other hand, the quasi-public insurers (WSIB and MVA insurers) have payment
schemes that in part structure the nature and duration of care, with upper limits, to be provided to
certain patients. Beyond the limits on the payments for care in each of the insurers’ payment
schemes, patients are sometimes required to co-pay (as in some situations with OHIP and private
insurance) or they may be required to pay for care beyond that paid by the insurer (as in the
situation with hospitals and private insurance).
Table 5-5 summarizes the key terms and conditions of the revenue sources.
5.1.2.2 KINDS OF PATIENTS In addition to the variations in payment structures, there is also considerable variation in
the kinds of patients whose care is paid by the different revenue sources. In principle, though, all
revenue streams could pay for care for patients with different kinds of needs and the choice of
the sort of patients providers would treat would be solely in providers’ hands and out of the
control or influence of payers in different revenue streams either directly (by prohibitions on
certain types) or indirectly (by the incentive structures inherent in the payment schemes or the
proportion of ‘available’ revenue in the market determined by the number of people eligible for
care paid by each of the revenue streams).
For example, while the majority of injuries suffered by workers covered by the WSIB are
musculoskeletal,388 a female worker might suffer an injury or disease that gives rise to a need for
care a physiotherapy provider organization would classify as within the “women’s health”
practice area. Similarly, the majority of injuries suffered by MVA accident victims are soft tissue
injuries, primarily whiplash injuries, but a patient covered by a MVA insurance policy might
have been in an accident that resulted in an amputation, requiring physiotherapy services a
provider organization would classify as “amputee” services. An older adult who is a resident of a
long term care home might have arthritis and be eligible for physiotherapy services to be paid by
OHIP for that condition; another resident of the long term care home might have suffered a
142
Table 5-5: Summary of terms and conditions of the revenue sources
Dedu
ctib
les
Copa
ymen
ts
Maxim
um m
pa
ymen
t
Cond
ition
al co
ver
No cl
aims
bonu
s
Prov
ider
sc
reen
ing
Selec
tive
cont
ract
ing
Prea
ppro
vals
Prac
tice g
uide
Prot
ocol
s
Repo
rting
Inde
pend
ent
exam
inat
ions
Maxim
um
paym
ent
Pros
pect
ive
paym
ent
Pay f
or
perfo
rman
ce
Pay f
or
outc
omes
Prac
tice
prof
iling
Public revenue sources Global hospital budget (1) X X (1) OHIP Designated Clinics (2) X X OHIP Long Term Care (2) X X
CCAC (2) (1) X X (1) Veterans Affairs Canada (2) X X X X X
Canadian Forces (2) X X X X X
Quasi-public revenue sources
MVA insurance (2) X (3)(4) (4) X X X (4)
WSIB (2) X (4) (4) X X (4)
Private revenue sources
Schools* (2)
Charities* (2)
Employers* (2) X
Private insurance X X X X
Out of pocket* * Detailed information about these revenue sources is not known. (1) Global budget affects more than physiotherapy services (2) Copayments (extra-billing) charged by some providers: see section 5.2.3 (3) Not all insurers in this group (4) For some programs only

spinal injury and be in need of physiotherapy services that a provider would classify as
“neurology” or “neurotrauma” services.
Table 5-6 provides a summary of the most likely practice areas* in which services would
be paid by the various revenue sources, based on the nature of patients covered by each, and the
structure (terms and conditions) of the payment schemes. This Table illustrates that revenue
sources overlap in the kinds of patients they treat, and that the private insurance and out of
pocket revenue sources offer the most generalized scope of coverage.
Table 5-6: Most likely practice areas in which services would be paid by the various revenue sources
Ampu
tees
Arth
ritis
Card
iolo
gy/
Resp
irolo
gy
Ment
al he
alth
Neur
olog
y/ Ne
urot
raum
a
Orth
opae
dic/
mus
culo
skele
tal
Pallia
tive
Prev
entio
n/
healt
h pr
omot
ion
Spor
ts m
edici
ne
Wom
en’s
healt
h
Public revenue sources Global hospital budget X* X* X* X* X X OHIP Long Term Care X X X X
OHIP General X X178 X
CCAC X X Veterans Affairs Canada X X X
Canadian Forces X X
Quasi-public revenue sources
MVA insurance X X X
WSIB X388 X388
Private revenue sources
Schools X X
Charities X X
Employers X
Private insurance X X X X X X X X X
Out of pocket X X X X X X X X X * Acute care hospitals are likely to provide physiotherapy services in these areas during a patient’s acute phase, and
then, if discharge is to a rehabilitation hospital or chronic care hospital, the services are likely to be provided on longer-term basis.
* The practice areas are common ones, identified by the Canadian Physiotherapy Association in its divisional
structure and by the College of Physiotherapists of Ontario in its annual registration process. These practice areas were also used in Question 6 of the Survey of Physiotherapy Provider Organizations.

144
The publicly-paid schemes tend to be oriented to older patients (as in the OHIP long-term
care and CCAC streams) or to patients with acute care needs (as in hospitals), though working-
age patients predominated in the OHIP designated clinics prior to the partial de-listing in April
2005.178 Consequently, physiotherapy services paid publicly tend to be related to arthritis and
orthopaedic and musculoskeletal conditions, with cardiology/respirology and palliative services
are in hospitals. In specialized rehabilitation hospitals and chronic continuing care hospitals, also
publicly-paid by global hospital budgets, the emphasis is on more specialized, longer-term niche
services to patients with neurology/neurotrauma conditions, in addition to services to patients
with orthopaedic and musculoskeletal problems.
The WSIB and private insurance streams are focused more on working-age people since
both generally require an employment connection. As between the two, the WSIB payments tend
to focus on musculoskeletal conditions, which predominate among work-related injuries, with
some emphasis on amputations and neurological/neurotrauma injuries. Private insurance tends to
focus on orthopaedic and musculoskeletal conditions, but also areas not covered by other
revenue sources, including sports medicine.
MVA insurance tends to focus on the post-acute phases of injury (since acute hospital
care is paid by global hospital budgets) and then on musculoskeletal (whiplash) or serious
impairments in the amputee or neurology/neurotrauma areas. Patients who pay out of pocket buy
services that they are not entitled to under other revenue sources and these services could reach
across all practice areas. The smaller revenue streams, Schools, Charities, Canadian Forces and
Veterans Affairs, each focus on specialized patient populations, and the practice areas they focus
consequently vary.
The complexity of revenue sources in the physiotherapy market does not fit into any one
category of the four identified by Tuohy, Flood & Stabile21 and discussed in section 2.2.3.2 in
Chapter 2:
1. Parallel public and private systems – the same services are insured publicly and privately in a health care market
2. Co-payment – services are partly insured publicly and partly privately 3. Group-based – public insurance for health services is available to some population
groups and private insurance is available for the others 4. Sectoral – certain health care sectors, such as hospitals and physicians, are insured
publicly, and the others are privately insured. Indeed, the physiotherapy market displays all of these, with overlaps among the types. Tables 5-
5 and 5-6 illustrate that for similar conditions, there can be public or private payment for the

145
services. Co-payments come in the usual type – the private insurer pays part and the patient pays
part – but services can also partly publicly-paid and partly privately-paid: patients may receive
publicly-paid inpatient physiotherapy services and then for post-acute care, they may rely on
private insurance or their own resources. Much of the insurance available for physiotherapy is
essentially group-based: for example, injured workers, victims of motor vehicle accidents and
members of the Canadian Forces. Finally, insurance in this market is partly sectorally based –
hospital-based services and services in designated clinics are publicly-paid, services in FP
provider organizations are, as will be seen in section 5.1.5, generally privately-paid.
In sum, the variations in the payment schemes and the practice areas commonly paid do
not divide into a simple public/private dichotomy.
5.1.3 Negotiation of fees
From the review of the structure of the revenue sources in this market, there is a strong
indication that providers are largely price-takers, that is, they have little scope for negotiation
overall except with patients who pay some or all of the cost of their physiotherapy services and
they have little say in insurers’ fee-setting. Professional associations representing groups of
providers have been excluded from key moments in fee-setting, as in the case of the adjustment
to fees in the MVA revenue source in 2003.
Data from the Survey of Physiotherapy Provider Organizations provided an opportunity
to test the extent to which individual providers have an opportunity to negotiate fees. Table 5-7
illustrates the median fees that providers reported receiving from each of the various revenue
Table 5-7: Median fees received from different revenue sources, all providers MVA Pre-Approved Framework $1165.00 WSIB Program of Care (Lower Back) $660.00 MVA insurance $84.00 CCAC $61.00 Other $60.00 Canadian Forces $45.00 Employers $45.00 Out of pocket $45.00 Private insurance $45.00 Charity $40.00 Schools $40.00 Veterans Affairs $40.00 WSIB fee for service $18.41 MOHLTC LTC $12.60 OHIP $12.20 Source: Survey of Physiotherapy Provider Organizations, Questions 12 and 13
146
sources, arranged from highest to lowest, and it is significant that in all cases in which a fee is
specified by a revenue source, that fee was reported. It appears that, in general, providers have
not negotiated significant departures (upward or downward) from the established fees.
An inquiry was made in the survey questionnaire about the total program fee that is paid
by a motor vehicle insurer for treatment under the Pre-Approved Framework and by the WSIB
under its Program of Care for Lower Back Injuries. In both cases, the median fee reported by
respondents was the maximum fee claimable by a provider under the respective payment
schedules without seeking additional approval. This is so even though, as will be recalled from
earlier in this chapter, it appears to have been the intent of both FSCO (with respect to the motor
vehicle insurers and the PAF) and the WSIB (in respect of the Program of Care) that the
payments under those programs be structured to front-end payments to encourage earlier
discharges, and to pay lower than maximum allowable fees in each case.
To get an indication of the satisfaction with the fees set by insurers in the market, a
question in the survey asked respondents whether they felt that the fees paid by various revenue
sources were too low or not. It was certainly expected that respondents would not hesitate to
register their complaints about fee levels in general in their responses to the questions. The
survey was released a little more than a year after FSCO’s guideline that dropped fees for
treatment for non-catastrophic MVA injuries by 30%, and around the time that the MOHLTC
was de-listing some physiotherapy services from coverage and raising concern in the
physiotherapy community about a public perception that physiotherapy services were not as
valuable as previously thought. The results, in Table 5-8, must be read cautiously, since it is to
be expected that in this environment there would have been ‘venting’ by respondents as they
reacted to contemporary events. There is enough variation in the opinions offered about the
various revenue sources to conclude that the relative values are valid. The most dissatisfaction is
clearly with the WSIB fee for service, followed by the OHIP fee. Interestingly enough, while the
fees paid by motor vehicle insurers were said by a majority of respondents to be too low, the pre-
approved framework fee (“MVA – PAF” in Table 5-8), the largest but with the most reporting
responsibilities attached, was said to be too low by a larger percentage of respondents than the
fee for service (“MVA – Fee for service”) that was cut in 2003. While providers do not have
significant scope for negotiating with insurers, they do have a high degree of discretion of
providers to identify patients’ needs and to fill those needs. Therefore, it would generally be

147
Table 5-8: Respondents’ views of adequacy of selected fees and their stated propensity to charge patients extra, in descending order of percentage of respondents who said the fee was too low
n
Fee is: Extra-bill patients? Too low Not too low Never Sometimes Always
WSIB – Fee for service 212 98.6% 1.4% 93.0% 3.3% 3.8% OHIP 75 92.0% 8.0% 83.3% 16.7% 0.0% MVA – PAF* 215 76.3% 23.7% 93.0% 5.1% 1.9% OHIP LTC 41 70.7% 29.3% 85.4% 7.3% 7.3% Veterans Affairs 87 69.0% 31.0% 80.4% 6.9% 12.6% WSIB – Community clinic 84 66.7% 33.3% 90.5% 4.8% 4.8% MVA – Fee for service 233 66.1% 33.9% 90.1% 6.4% 3.4% WSIB – POC** 136 65.4% 34.6% 94.8% 2.2% 2.9% Schools 51 64.7% 35.3% 66.7% 19.6% 13.7% Private insurance 215 59.1% 40.9% 48.4% 36.7% 14.4% CCAC 51 56.9% 43.1% 92.2% 3.9% 3.9% Canadian Forces 50 44.0% 56.0% 92.0% 4.0% 4.0% Employer 56 39.3% 60.7% 83.9% 12.5% 3.6% Charities 27 37.0% 63.0% 92.6% 0.0% 7.4% * Pre-Approved Framework for Whiplash Injuries ** Program of Care for Lower Back Injuries
expected that extra-billing of patients would not be necessary – adjustments could be made by
providers at the therapy level, in the length and content of individual treatments, their frequency
and their overall duration and the results generally conformed to these expectations. For
example, the key informants mentioned the flexibility of providers in accommodating the
circumstances of patients whose insurance programs had limits or caps or low fees. If a patient’s
limit is reached within a certain time period, providers may sometimes postpone or modify a
treatment plan so that treatments fall in a new time period with renewed eligibility, or providers
may arrange for less costly group treatment rather than individual treatments if it is possible to
do so (P-4, P-9).
However, there were two significant observations about the propensity to charge patients
on top of the payer’s fee. First, only for private insurance (the largest source of revenue in the
market) did more than 50% of providers always or sometimes extra-bill (Table 5-8). For private
insurance, of course, there is a pre-established limit to the reimbursement that patients may seek
from their insurer, and that can in part explain the propensity to extra-bill.
Providers also take advantage of the ability of extra-billing in the case of OHIP patients –
one in six providers sometimes bills such patients. Though the government (OHIP) has
constrained its own expenditures on physiotherapy with a fee that has declined significantly in
real terms over nearly twenty years, some patients are asked to absorb part of the effect of that
low feel level.

148
Second, the decision to extra-bill is not consistently related to the degree of unhappiness
with a revenue source fee level. For example, 93% of respondents said they never bill WSIB
patients extra, though 98.6% said the fee for service is too low, and 51.6% of providers extra-
billed their private insurance patients, while 40.9% said that the private insurance fees are too
low. Aside from the case of private insurance, statutory prohibitions on extra-billing seem to
have had general spillover effects in other areas where there is no prohibition, though when fees
are exceptionally low as in the case of OHIP, the opportunity to extra-bill seems to be the more
frequently chosen option.
The explanation of the different fees in the market, then, bears some additional
explanation. The MVA fees reflect the fees paid when that market was unregulated, though there
was a significant downward adjustment in 2003 toward the levels paid by the other revenue
sources. The special program fees for MVA PAFs and WSIB programs of care reflect a premium
the revenue sources are willing to pay for health professionals to follow protocols and for the
disclosure of extra information about treatment and about the patients. The OHIP fee for service
and the WSIB’s fee for service stand out as particularly low. In these market niches, the public
and quasi-public revenue sources have exercised their statutory right to set fees below other rates
in the market, using monopsonistic power in each niche. The tenacity they have shown in
maintaining these fees at a specific level (declining in value over time) is noteworthy. The
providers eligible to receive the OHIP fee for service are limited in their number, and are
reluctant to give up their ability to bill for a number of reasons, including the possibility that the
fee will increase one day. They have accommodated the low fees by altering treatment
arrangements, and diverting patients to pay with private insurance when possible. The providers
accepting the WSIB fee for service value the relationships they build with patients and their
families, seeing the possibility that those people will need services in the future and will pay with
another revenue source.
Most of the other revenue sources pay about the same for treatments -- $40.00 to $45.00.
Median treatment fees in the CCAC section were higher, $61.00, reflecting the finding of
Randall and Williams that managed competition in that niche increased prices.340
5.1.4 Relative value of revenue sources
To determine the relative value of the revenue sources, it is usual to look solely at the fee
levels for a unit or service and compare them. However, the basic fee does not account for
variations in patient care that may arise as a result of the different fee levels. Furthermore,
149
looking solely at the fee level does not take into account the limits providers face on the
availability of certain revenue sources to them, whether self-imposed (that is, as a result of
personal preferences), environmental (for example, local geographic and economic factors), or
market-based (for example, strong ties of loyalty of insurers and patients to another provider). In
sum, looking only at the fee level does not allow an examination of the mix of revenues that a
provider organization develops and the dynamic of “cost-shifting” (discussed in Chapter 2,
section 2.2.3.3) that each provider is able to manage as a result of a mix of revenues.
The Revenue Relative Value Index (RRVI) described in Chapter 3, section 3.3.4.4,
provides a way to look at the differences in the value of the different revenue sources, calculated
from data reported by provider organizations. Figure 5-2 illustrates the results of the calculations
for each revenue source.* The RRVIs corroborate the views of the key informants that the most
valuable generally-available revenue source for a provider organization is MVA insurance
especially as those organizations develop a revenue mix that includes other revenue sources.
They also corroborate the key informants’ view that WSIB revenues are (along with MOHLTC
payments for physiotherapy services for residents of long-term care homes) the least valuable in
providers’ mix of revenues.
The “Other” category in Figure 5-2 represents specific revenue sources that individual
providers have managed to find and gain access to. Generally, they are not widely available but
the high RRVI does show that there are revenue sources outside the mainstream sources
discussed through this study that can be available and that can be successfully used to shift costs
or internally subsidize services that are paid by less lucrative sources. They are, though,
relatively rare in the revenue mix or provider organizations – they constitute an average of 2.8%
of providers’ revenues, with a median of 0%.
It is tempting to suggest that a wise provider should switch to serving only MVA patients
and as noted above, some provider organizations have taken this strategic approach to the
market. However, as will be discussed below, concentrating on one revenue source carries some
* The magnitude of the RRVI for MVA insurance and the differences between the RRVIs for MVA and private
insurance require a comment regarding the potential impact of this information in Table 5-7. That Table, which was developed using the data about the proportion of providers’ patients whose care is paid by different revenue sources, indicated that private insurance is the predominant revenue source in the market, with 32.7% of patients’ care paid through these policies. MVA insurance patients constituted the next biggest portion, at 14.3%. The RRVIs indicate that MVA insurance provides more value in terms of revenue to providers than private insurance, but even adjusting for different weights in financial terms, private insurance remains the predominant source of revenue across the market.

150
risks, particularly in this market. In addition, the number of MVA patients is limited, and in some
regions, it might be impossible to treat only MVA patients.
5.1.5 Specific revenue sources and revenue mixes
As a provider runs its business, it endeavours to ensure that its revenues and costs are
such that it maintains a level of profitability that is acceptable to shareholders in the case of FP/c
organizations, the owners in FP/s organizations, and the members and board of a corporation
running a NFP Hospital or Other NFP organization. A provider’s revenue mix is the result of a
combination of factors, such as the availability of patients whose care is paid by the different
revenue streams, the preferences of the provider, and the extent of competition. Table 5-9
illustrates the different kinds of costs that a provider incurs in providing a service and the
relationship of those costs to fees from various sources, or revenue, and profits. Table 5-9: Profits, revenues and costs
Profit = Fee A - ( Therapeutic expertise cost A + Billing and
reporting cost A + Overhead ) +
Fee B - ( Therapeutic expertise cost + Billing and
reporting cost B + Overhead ) + …
Figure 5-2: Revenue Relative Value Index (RRVI) for each revenue source

151
The review of the revenue sources in section 5.2.1 revealed the variety of terms and
conditions in the payment schemes of various buyers of physiotherapy services. Complying with
these terms and conditions has costs for a provider that offset the gross revenue that they are able
to generate from a revenue source, and those costs typically would fall into the category of
‘billing and reporting’, and sometimes in the category of ‘therapeutic expertise costs’ if a certain
health professional group, for example, or a certain ratio of staff to patients is specified either by
a payer or under the terms of a collective (labour) agreement with an organization. The cost of
reporting is sometimes explicitly recognized, for example, in the fee that MVA insurers pay for
reporting outcomes of treatment according to a PAF: the MVA insurer pays $63.72 for a report,
about the same that is paid for 45 minutes of treatment. When the reporting obligation is not
explicitly recognized, as in the case of private insurance, the provider absorbs the cost. Even with
explicit payments, the full cost to the provider – diverting him or her from other preferred
activities or requiring the hiring of administrative staff, for example – may not be compensated.
Table 5-10 provides information about the mean proportion of all providers’ patients
whose care is paid by each of the different revenue sources. The same information is provided by
strategic provider group. Overall, private insurance is the largest mean percentage source of
revenue across the market, followed by motor vehicle accident insurance, hospital budgets and
out of pocket spending.
Several key informants stressed that there is considerable risk to a physiotherapy provider
organization if it has only one revenue source. The key informants illustrated their point by
recalling the abrupt change in the fee schedule for physiotherapy treatment for MVA patients in
2003, which caused substantial disruption and dislocation in the market (P-1, P-2, P-3, P-4, O-2,
O-4, R-2, R-4). They also noted that the change in the extent of public insurance (OHIP) for care
delivered in designated clinics was an abrupt change that caused disruption (P-1, P-2, O-2, O-4).
Of the 321 organizations that responded to the survey question about the proportions of
their clients whose care is paid by different revenue sources, 42, about one in eight, said that they
had a single revenue source (Table 5-11).
That the first two sole revenue sources are global hospital budgets and payments from the
OHIP for long term care patients is understandable since those providers are able, and in the case
of hospitals, largely perceived, to rely heavily on a single revenue source. NFP Hospitals have
the legal flexibility to modify their physiotherapy offerings because they control the allocation of

152
Table 5-10: Descriptive statistics for revenue sources (percentage of patients), by all providers and strategic provider groups All FP/c FP/s NFP Hospital Other NFP Private insurance Mean 32.71 36.13 39.45 2.02 17.32 CI 95% 29.29, 36.14 11.31, 24.30 35.37, 43.52 -0.37, 4.42 6.21, 28.43 Median 30.00 35.50 40.00 0.00 0.00 Standard deviation 31.17 29.45 30.57 7.30 28.66 MVA Mean 14.29 17.81 17.07 2.06 4.67 CI 95% 12.04, 15.54 11.31, 24.30 14.15, 20.00 0.36, 3.76 -0.30, 9.64 Median 10.00 10.00 10.00 0.00 0.00 Standard deviation 20.45 19.20 21.96 5.18 12.82 Global budget Mean 10.87 0.56 0.53 80.88 9.96 CI 95% 7.66, 14.07 -.57, 1.68 -0.67, 1.13 70.84, 90.91 -0.65, 20.57 Median 0.00 0.00 0.00 93.50 0.00 Standard deviation 29.21 3.33 4.74 30.53 27.37 Out of pocket Mean 10.69 3.95 14.23 0.35 5.71 CI 95% 8.54, 12.84 2.34, 5.58 11.28, 17.18 -0.04, 0.72 0.11, 11.32 Median 5.00 2.00 5.00 0.00 0.00 Standard deviation 19.58 4.79 22.16 1.17 14.48 WSIB Mean 10.12 13.26 10.92 8.64 1.83 CI 95% 8.67, 11.66 9.27, 17.26 9.06, 12.78 3.84, 13.43 -0.22, 3.88 Median 5.00 10.00 5.00 5.00 0.00 Standard deviation 13.53 11.81 13.97 14.59 5.30 OHIP Mean 7.90 11.25 7.90 n/a 14.29 CI 95% 5.21, 10.59 1.19, 21.31 4.75, 11.06 n/a 0.47, 28.10 Median 0.00 0.00 0.00 n/a 0.00 Standard deviation 24.46 24.46 23.68 n/a 35.64 CCAC Mean 3.56 5.36 2.85 2.76 7.86 CI 95% 1.64, 5.47 -2.23, 12.95 0.82, 4.88 -2.57, 8.09 -2.29, 18.00 Median 0.00 0.00 0.00 0.00 0.00 Standard deviation 17.43 22.42 15.24 16.22 26.16 Employers Mean 2.46 6.52 2.25 0.16 1.99 CI 95% 1.15, 3.76 -0.92, 13.98 0.80, 3.70 -.07, 0.38 -0.82, 4.79 Median 0.00 0.00 0.00 0.00 0.00 Standard deviation 11.86 22.02 10.88 0.68 7.24 MOHLTC LTC Mean 2.36 3.14 1.35 n/a 12.52 CI 95% 0.86, 3.87 1.32, 21.63 -0.02, 2.71 n/a 0.01, 25.03 Median 0.00 0.00 0.00 n/a 0.00 Standard deviation 13.72 13.01 10.24 n/a 32.27 All others Mean 4.59 2.13 3.22 0.61 23.86 CI 95% 2.93, 6.25 0.80, 3.47 1.92, 4.53 -.0.15, 1.36 8.96, 38.75 Median 0.00 0.00 0.00 0.00 0.00 Standard deviation 15.12 3.94 9.80 2.30 38.42 Source: Survey of Physiotherapy Provider Organizations, Question 9

153
Table 5-11: Revenue sources of organizations with only one revenue source, by all provider organizations and by strategic provider group
Sole revenue Source
Number of organizations
n=321 Global hospital budget 9 OHIP LTC 9 Out of pocket 7 OHIP 5 CCAC 3 Private insurance 2 Charity 1 Employer 1 MVA insurance 1 School 1 Other 3 All 42 Source: Survey of Physiotherapy Provider Organizations, Question 9
their global budget within the hospital. Accordingly, concentration on these single revenue
sources is not as risky as perhaps with other revenue sources.
Seven organizations in the survey sample concentrated on patients who pay for their
physiotherapy services on their own. Relying on this revenue source alone eliminates the
pressure that insurers can exercise through their payment schemes. Nonetheless, one of the seven
indicated it was not happy with its patient profile, and some of this unhappiness may reflect the
degree of risk and the obligation to negotiate with many individual patients.
It is more usual that physiotherapy organizations have more than one revenue source.
However, there were no substantial correlations between the proportions of providers’ receipts
from any two revenue sources (Table A5-1 in Appendix 16 provides the results of the correlation
analysis). Global hospital budgets were negatively correlated with a number of the other revenue
sources (OHIP, Veterans Affairs, MVA insurance, private insurance, and out of pocket
payments) though the correlations were very low. Similarly, there were statistically significant
correlations, most positive but some negative, between other pairs of revenue sources but all
were very low. Overall, this indicates that there were no pairs of revenue sources that form the
core of revenue across providers. Instead, it appears that different providers received revenue
from different sources in different combinations.
The mean number of revenue sources for all reporting physiotherapy provider
organizations was 3.52. Table 5-12 provides the details of the mean number of revenue sources
for each of the strategic provider groups. An analysis of variance (ANOVA) was conducted to
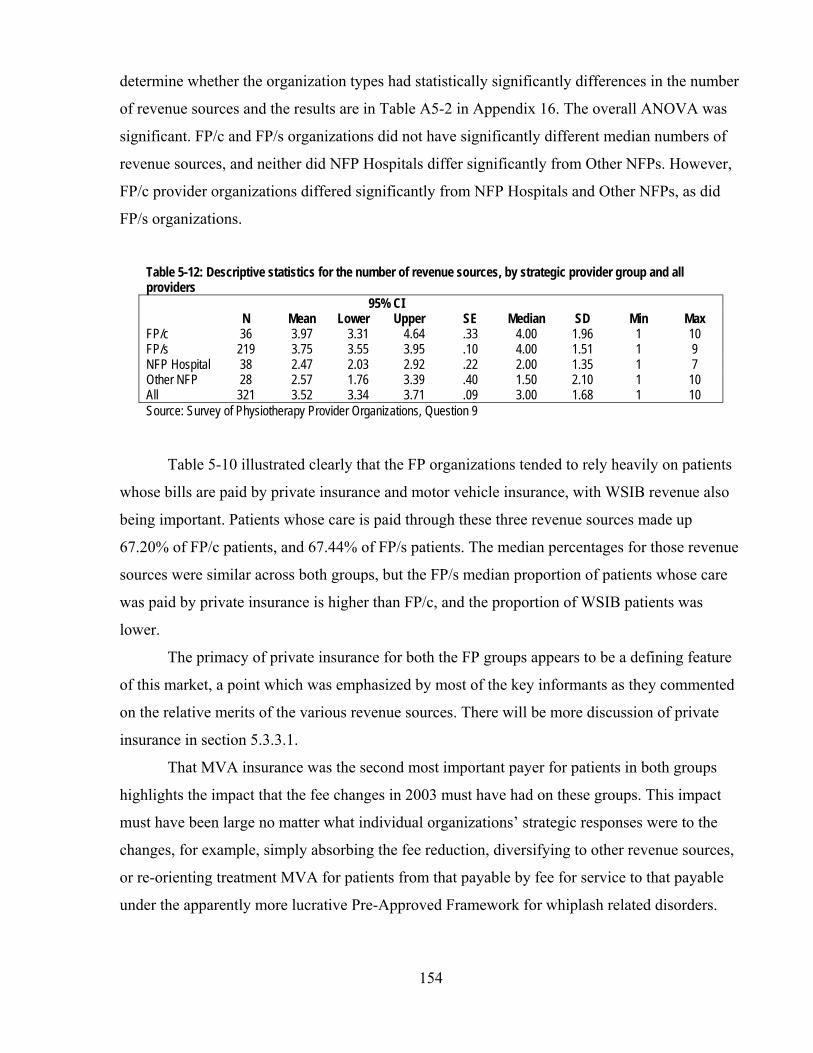
154
determine whether the organization types had statistically significantly differences in the number
of revenue sources and the results are in Table A5-2 in Appendix 16. The overall ANOVA was
significant. FP/c and FP/s organizations did not have significantly different median numbers of
revenue sources, and neither did NFP Hospitals differ significantly from Other NFPs. However,
FP/c provider organizations differed significantly from NFP Hospitals and Other NFPs, as did
FP/s organizations.
Table 5-12: Descriptive statistics for the number of revenue sources, by strategic provider group and all providers
N Mean 95% CI
SE Median SD Min Max Lower Upper FP/c 36 3.97 3.31 4.64 .33 4.00 1.96 1 10 FP/s 219 3.75 3.55 3.95 .10 4.00 1.51 1 9 NFP Hospital 38 2.47 2.03 2.92 .22 2.00 1.35 1 7 Other NFP 28 2.57 1.76 3.39 .40 1.50 2.10 1 10 All 321 3.52 3.34 3.71 .09 3.00 1.68 1 10 Source: Survey of Physiotherapy Provider Organizations, Question 9
Table 5-10 illustrated clearly that the FP organizations tended to rely heavily on patients
whose bills are paid by private insurance and motor vehicle insurance, with WSIB revenue also
being important. Patients whose care is paid through these three revenue sources made up
67.20% of FP/c patients, and 67.44% of FP/s patients. The median percentages for those revenue
sources were similar across both groups, but the FP/s median proportion of patients whose care
was paid by private insurance is higher than FP/c, and the proportion of WSIB patients was
lower.
The primacy of private insurance for both the FP groups appears to be a defining feature
of this market, a point which was emphasized by most of the key informants as they commented
on the relative merits of the various revenue sources. There will be more discussion of private
insurance in section 5.3.3.1.
That MVA insurance was the second most important payer for patients in both groups
highlights the impact that the fee changes in 2003 must have had on these groups. This impact
must have been large no matter what individual organizations’ strategic responses were to the
changes, for example, simply absorbing the fee reduction, diversifying to other revenue sources,
or re-orienting treatment MVA for patients from that payable by fee for service to that payable
under the apparently more lucrative Pre-Approved Framework for whiplash related disorders.

155
The WSIB revenue source was quite important to both FP/c and FP/s strategic groups,
despite the low fees paid by the WSIB for physiotherapy services, and, as will be seen below, the
negative impression that low fee had among providers.
It is in the remaining approximate third of their patients that the two FP strategic groups
differed the most. Both depended significantly on public payers (OHIP for long-term care
patients and care in designated clinics, and CCAC for home care patients), but FP/c
organizations on average tapped these public sources for a greater portion of their revenues than
FP/s organizations – with means of 19.65% and 12.10%, respectively.
The FP/c and FP/s groups also differed in the importance each places on uninsured payers
– employers who pay for their employees’ care and individual patients who pay out of pocket.
The mean proportions of patients of FP/c and FP/s for each revenue source were 6.52% and
2.25% for employer revenue, respectively, and 3.95% and 14.23% for out of pocket spending.
FP/c provider organizations depended on the employer revenue more, where a single contract is
negotiated with an employer to treat multiple patients; FP/s providers depended substantially on
out of pocket payments, where individual arrangements are made with each patient.
NFP Hospitals, as would reasonably be expected, relied on revenues from their global
budgets from the MOHLTC. Significant as well was the proportion of physiotherapy revenue
hospitals reported from WSIB patients – a mean of 8.64% and a median of 5.00%. As was
described earlier in Chapter 2, because care provided to WSIB patients is not an “insured
service” under the Canada Health Act380 or the Ontario Health Insurance Act,389 hospitals can
receive revenue from the WSIB outside their global budgets either in the form of per-day
payments for inpatient stays or in the form of fee-for-service payments for outpatient
physiotherapy services.
The relatively heterogeneous revenue sources of the Other NFP providers were also
significant. Like the FP providers, the largest proportion of Other NFP organizations’ patients
was paid by private insurance, followed by public sources, OHIP and global hospital budgets.
NFP Hospitals appeared definitively to constitute a strategic group because of their
reliance on MOHLTC revenue for their physiotherapy service offerings and the consequential
services they offer and the patients they serve. However, from these data there is little indication
that the FP/c and FP/s groups differentiated themselves in the approach to revenues in the market
except in the area of out of pocket revenue, where a bigger share of FP/s providers’ patients’ care
is paid by patients themselves. The Other NFP group was similar to the FP groups, with the
156
private insurance stream and the public streams being important, but differed with much fewer
MVA patients, and a greater variety of “other” revenue sources.
5.2 Strategic provider groups and four revenue sources
Hypothesis 1(c) stated that FP and NFP providers would differ in their approach to
specific revenue sources. Specifically, it was hypothesized that different strategic provider
groups would respond in accord with their expected reactions to different revenue sources’
payment structures. Thus, FP/c provider organizations, as compared to NFP organizations,
should be found to be more likely to service higher-revenue niche markets or niche markets with
lower administrative burden. FP/s provider organizations would be expected to fall between the
FP/c and NFP groups in their reaction to these markets. The discussion of the revenue sources in
section 5.1 allows the identification and therefore the direct examination of the strategic provider
groups’ interactions with the revenue sources with the highest revenue fee (MVA insurance), the
lowest revenue fee (WSIB fee for service), and the lowest administrative burden (private
insurance and out of pocket spending).
5.2.1 Highest revenue fee – MVA insurance
The RRVIs indicated that MVA insurance was the single most valuable revenue source to
providers in financial terms. As discussed in section 5.1.1.8, the fee for service is relatively high
and the program for whiplash injury (Pre-Approved Frameworks or PAFs) appear lucrative, and
attractive if for no other reason than their predictable schedules of payments. But the costs of
generating this revenue are higher than for, for example, private health insurance.
It must also be noted that considering this revenue source is subject to some cautions. In
principle, NFP Hospitals are prohibited from participating in this market, and indirectly they
receive compensation for the treatment of motor vehicle accident patients through their global
budgets, conceptually funded in small part by a general levy on MVA insurers.273 However, as in
the case of private insurance, some hospitals have found means to avoid the prohibition, and in
their survey responses, some hospitals reported a small proportion of their physiotherapy patients
have their care paid for by MVA insurers.
Despite the high RRVI for MVA insurance and its apparent value, a considerable
proportion of provider organizations reported that they did not treat MVA patients. Table 5-13
provides details. About one out of five FP organizations did not treat MVA patients, whereas for
the NFP providers, the proportion was almost four out of five. Of the organizations that did not

157
treat MVA patients at all, 39.4% had a single revenue source (other than MVA), indicating that a
good proportion specialize in other fields, and exclude not only MVA patients but patients whose
care was paid by other insurers as well.
Table 5-13: Proportion of provider organizations that do not treat MVA patients
All FP/c FP/s NFP-Hospital Other NFP n=321 n=40 n=213 n=37 n=31
Treat MVA patients 67.6% 77.5% 77.9% 29.7% 29.0% Do not treat MVA patients 32.4% 22.5% 22.1% 70.3% 71.0%
Source: Survey of Physiotherapy Provider Organizations, Question 9
Table 5-14: Descriptive statistics for the proportion of patients whose care is paid for by MVA insurance, by strategic provider group and all providers
n Mean 95% CI
SE Median SD Min Max Lower Upper FP/c 36 18.05% 2.09% 5.29% 0.79 1.50% 4.72 0% 20% FP/s 219 17.11% 14.18% 20.03% 1.45 10.00% 21.97 0% 100% NFP Hospital 38 2.06% 0.35% 3.76% 0.84 0.00% 5.18 0% 25% Other NFP 28 4.67% -0.30% 9.64% 2.42 0.00% 12.82 0% 60% All 321 14.35% 12.09% 16.60% 1.14 10.00% 20.51 0% 100% Source: Survey of Physiotherapy Organizations, Question 9
The descriptive statistics in Table 5-14 illustrate the proportions of clients whose care
was paid for by MVA insurers in each of the organization types. In contrast to the organizations
that did not treat MVA patients at all, it is striking that there were FP/s provider organizations
that concentrated heavily on MVA patients. In all, 9.3% of provider organizations had 40% of
more of their patients’ care paid by the MVA revenue source.
Table A5-3 in Appendix 16 provides the results of a Kruskal-Wallis ANOVA,
confirming that there were statistically significant differences between the FP and the NFP
provider organizations as expected. But within each of those groupings, there were no significant
differences and the expected difference between FP/c and FP/s providers did not materialize.
5.2.2 Lowest revenue fee – WSIB
The most widely available revenue source* with the lowest fee was the WSIB’s fee for
service, $18.41 per treatment. Table 5-15 shows that 98.6% of respondents to the particular
survey question viewed the fee too low. This was the largest proportion of provider
* As described in section 5.1.1.2, there is a very low fee paid by OHIP to designated physiotherapy clinics. However,
since these fees are available only to the designated clinics and not to any other providers, they have not been used as the indicator of take-up of patients whose care is paid by a low-revenue stream. On the other hand, though some providers will not treat WSIB patients because of their own focus (for example, children’s treatment centres), the WSIB does not prohibit any provider from treating WSIB patients and billing for those treatments.

158
dissatisfaction with any fee in the survey. Though there is no particular requirement from the
WSIB about the content of a treatment that will be paid by this fee, there is an expectation by the
WSIB that a registered physiotherapist will be providing or supervising the treatment.
Despite the clear, unequivocal and near-universal dissatisfaction with the WSIB’s fees,
especially its $18.41 fee for service, there were services provided to WSIB patients by the
majority of FP providers, and about seven in 10 NFP Hospitals (Table 5-15). Other NFP
providers treated WSIB patients less: only about one in five. But it is important to notice that a
much lower proportion of FP/s provider organizations treated WSIB patients than FP/c provider
organizations, and this echoes the comments of key informants (P-9, O-2, O-4) who said that the
combination of low fees, the complexity of the WSIB and the changes it has made in the recent
past in adding new programs of care to the list of services it will pay for had a disproportionate
effect on FP/s providers. Since the FP/s strategic group was more numerous than any of the other
groups, their rate of avoiding WSIB patients would likely be noticeable to those patients. Quite
striking was the larger proportion of FP/c providers who seem to be able to withstand the widely-
perceived problems of the WSIB and its fees. Table 5-15: Proportion of provider organizations that do not treat WSIB patients
All FP/c FP/s NFP-Hospital Other NFP n=321 n=36 n=219 n=37 n=31
Treat WSIB patients 56.7% 75.0% 56.2% 68.4% 21.4% Do not treat WSIB patients 43.3% 25.0% 43.8% 31.6% 78.6%
Source: Survey of Physiotherapy Organizations, Question 9
Table 5-16: Descriptive statistics for the proportion of patients whose care is paid for by the WSIB, by strategic provider group and all providers
N Mean 95% CI
SE Median SD Min Max Lower Upper FP/c 36 13.51% 9.38% 17.63% 2.03 10.00% 12.19 0% 40% FP/s 219 10.94% 9.08% 12.81% 0.95 5.00% 13.99 0% 70% NFP Hospital 38 8.64% 3.84% 13.43% 2.37 5.00% 14.59 0% 70% Other NFP 28 1.82% -0.22% 3.88% 1.00 0.00% 5.30 0% 20% All 321 10.16% 8.67% 11.66% 0.76 5.00% 13.59 0% 70% Source: Survey of Physiotherapy Organizations, Question 9
Table 5-16 provides the descriptive statistics on the proportion of the different strategic
provider groups’ patients whose care was paid by the WSIB. Except for the Other NFP group,
there were fewer apparent differences among the groups than in the case of MVA insurance. The
means and medians and standard deviations appear roughly similar, indicating that there was a
similarity among the groups. The Other NFP group was notable for its virtual absence from this
revenue source. The results of a Kruskal-Wallis test (Table A5-4, Appendix 16) confirm the
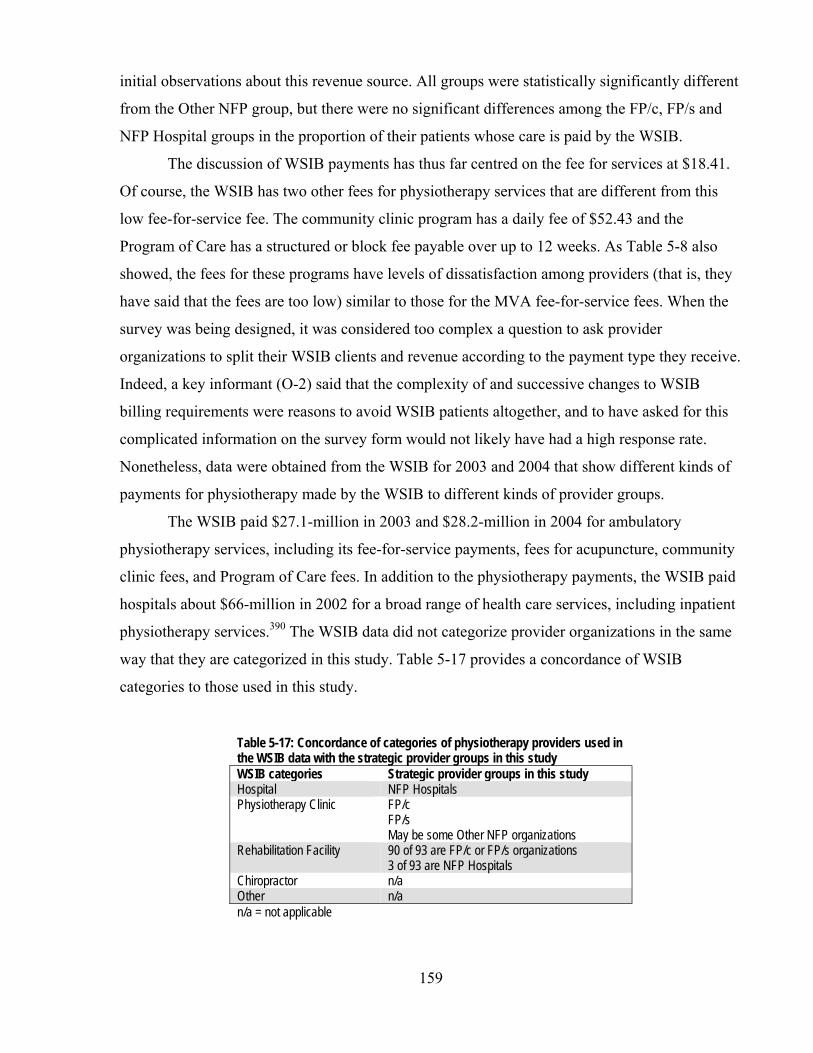
159
initial observations about this revenue source. All groups were statistically significantly different
from the Other NFP group, but there were no significant differences among the FP/c, FP/s and
NFP Hospital groups in the proportion of their patients whose care is paid by the WSIB.
The discussion of WSIB payments has thus far centred on the fee for services at $18.41.
Of course, the WSIB has two other fees for physiotherapy services that are different from this
low fee-for-service fee. The community clinic program has a daily fee of $52.43 and the
Program of Care has a structured or block fee payable over up to 12 weeks. As Table 5-8 also
showed, the fees for these programs have levels of dissatisfaction among providers (that is, they
have said that the fees are too low) similar to those for the MVA fee-for-service fees. When the
survey was being designed, it was considered too complex a question to ask provider
organizations to split their WSIB clients and revenue according to the payment type they receive.
Indeed, a key informant (O-2) said that the complexity of and successive changes to WSIB
billing requirements were reasons to avoid WSIB patients altogether, and to have asked for this
complicated information on the survey form would not likely have had a high response rate.
Nonetheless, data were obtained from the WSIB for 2003 and 2004 that show different kinds of
payments for physiotherapy made by the WSIB to different kinds of provider groups.
The WSIB paid $27.1-million in 2003 and $28.2-million in 2004 for ambulatory
physiotherapy services, including its fee-for-service payments, fees for acupuncture, community
clinic fees, and Program of Care fees. In addition to the physiotherapy payments, the WSIB paid
hospitals about $66-million in 2002 for a broad range of health care services, including inpatient
physiotherapy services.390 The WSIB data did not categorize provider organizations in the same
way that they are categorized in this study. Table 5-17 provides a concordance of WSIB
categories to those used in this study.
Table 5-17: Concordance of categories of physiotherapy providers used in the WSIB data with the strategic provider groups in this study WSIB categories Strategic provider groups in this study Hospital NFP Hospitals Physiotherapy Clinic FP/c
FP/s May be some Other NFP organizations
Rehabilitation Facility 90 of 93 are FP/c or FP/s organizations 3 of 93 are NFP Hospitals
Chiropractor n/a Other n/a n/a = not applicable

160
In 2003, hospitals received 4.8% and, in 2004, 4.6% of the WSIB’s payments for
physiotherapy services, $1.3-million in 2003, dropping 4.9% to $1.2-million in 2004 Table 5-
18). Private clinics’ share was 78.7% in 2003 and 80.7% in 2004 ($21.3-million and $22.8-
million, respectively). However, for their 4.8% share of WSIB payments in 2003, hospitals
treated 8.5% of WSIB ambulatory physiotherapy patients; in 2004, they treated 7.6% of WSIB
Table 5-18: Shares of WSIB payments and patients, by provider groups, 2003 and 2004
WSIB payments WSIB patients Payments per
patient Total Increase Proportion Total Increase Proportion Average Increase 2003 2003 to 2003 2003 2003 to 2003 2003 2003 to 2004 2004 2004 2004 2004 2004 2004 2004
Hospitals $1,293,239 -4.9% 4.8% 6,151 -5.2% 8.5% $210.25 6.0% $1,229,253 4.6% 5,831 7.6% $222.82 Physiotherapy Clinics
$21,331,220 6.9% 78.7% 55,065 5.9% 76.1% $387.38 1.0% $22,813,546 80.7% 58,327 76.4% $391.13 Rehabilitation Facilities
$2,658,392 -20.5% 9.8% 2,856 -18.2% 3.9% $930.81 -2.9% $2,112,132 7.5% 2,336 3.1% $904.17
Chiropractors $1,395,580 24.0% 5.1% 6,799 27.6% 9.4% $205.26 -2.8% $1,729,928 6.1% 8,674 11.4% $199.44
Other $437,145 -24.5% 1.6% 1,462 -21.9% 2.0% $299.00 -3.3% $330,243 1.2% 1,142 1.5% $289.18
Total $27,115,576 4.1% 100.0% 72,333 5.5% 100.0% $374.87 -1.4% $28,215,102 100.0% 76,310 100.0% $369.74
Source: WSIB database
patients dropped 5.2% from 6,151 to 5,831. The average WSIB payment per hospital
physiotherapy patient in 2003 was $210.25, and 6% more, $222.82, in 2004. From among the
provider categories in the WSIB data, only chiropractors had a lower per-patient payment in both
years.
By way of contrast, rehabilitation facilities received 9.8% of WSIB payments and treated
only 3.9% of WSIB patients. The average per-patient payment to these facilities was $980.81 in
2003 and $904.17 in 2004. Some of the differences in per-patient payments among the provider
groups are undoubtedly due to different patient groups and in the type of service provided by
each provider group. Physiotherapy clinics, however, which provide the greatest proportion of
WSIB patients’ physiotherapy services, received 84.2% higher per-patient WSIB payments
($387.38 per patient) than hospitals in 2003 and 75.5% higher in 2004 ($391.13). This indicates
perhaps that hospitals were treating patients only with the most easily treated conditions,
referring other patients to private physiotherapy clinics or multidisciplinary rehabilitation
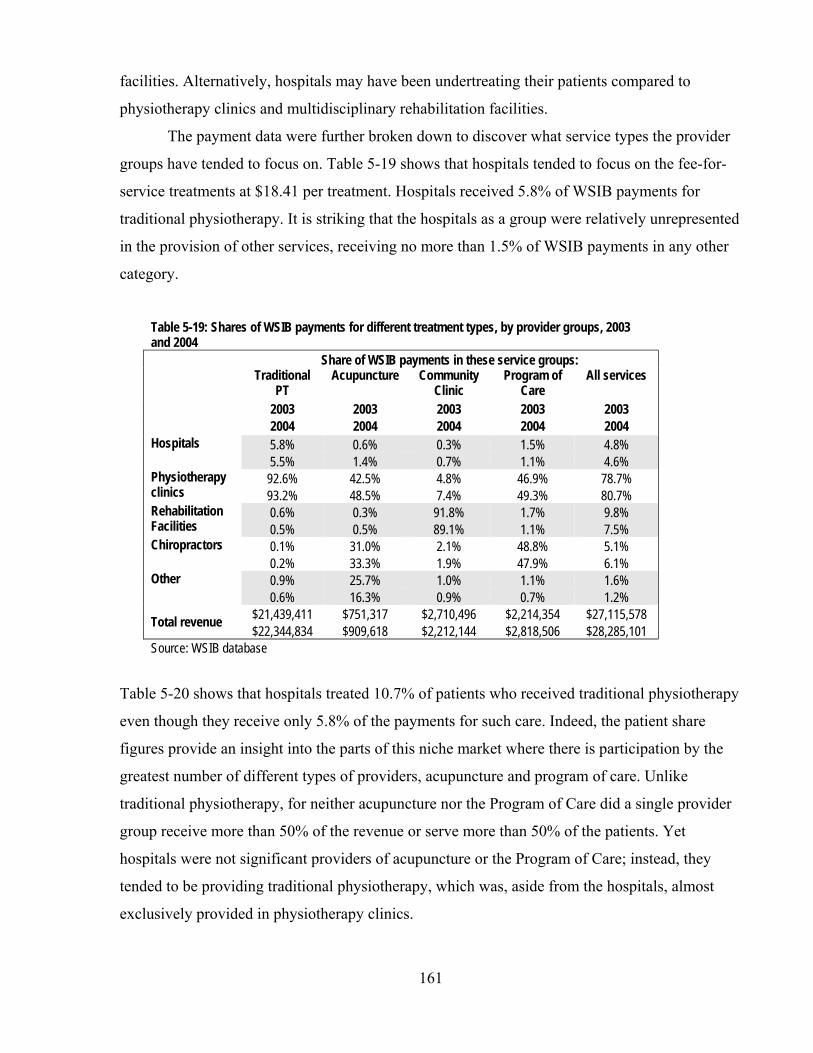
161
facilities. Alternatively, hospitals may have been undertreating their patients compared to
physiotherapy clinics and multidisciplinary rehabilitation facilities.
The payment data were further broken down to discover what service types the provider
groups have tended to focus on. Table 5-19 shows that hospitals tended to focus on the fee-for-
service treatments at $18.41 per treatment. Hospitals received 5.8% of WSIB payments for
traditional physiotherapy. It is striking that the hospitals as a group were relatively unrepresented
in the provision of other services, receiving no more than 1.5% of WSIB payments in any other
category.
Table 5-19: Shares of WSIB payments for different treatment types, by provider groups, 2003 and 2004
Share of WSIB payments in these service groups: Traditional
PT Acupuncture Community
Clinic Program of
Care All services
2003 2003 2003 2003 2003 2004 2004 2004 2004 2004 Hospitals 5.8% 0.6% 0.3% 1.5% 4.8%
5.5% 1.4% 0.7% 1.1% 4.6% Physiotherapy clinics
92.6% 42.5% 4.8% 46.9% 78.7% 93.2% 48.5% 7.4% 49.3% 80.7%
Rehabilitation Facilities
0.6% 0.3% 91.8% 1.7% 9.8% 0.5% 0.5% 89.1% 1.1% 7.5%
Chiropractors 0.1% 31.0% 2.1% 48.8% 5.1% 0.2% 33.3% 1.9% 47.9% 6.1%
Other 0.9% 25.7% 1.0% 1.1% 1.6% 0.6% 16.3% 0.9% 0.7% 1.2%
Total revenue $21,439,411 $751,317 $2,710,496 $2,214,354 $27,115,578 $22,344,834 $909,618 $2,212,144 $2,818,506 $28,285,101
Source: WSIB database
Table 5-20 shows that hospitals treated 10.7% of patients who received traditional physiotherapy
even though they receive only 5.8% of the payments for such care. Indeed, the patient share
figures provide an insight into the parts of this niche market where there is participation by the
greatest number of different types of providers, acupuncture and program of care. Unlike
traditional physiotherapy, for neither acupuncture nor the Program of Care did a single provider
group receive more than 50% of the revenue or serve more than 50% of the patients. Yet
hospitals were not significant providers of acupuncture or the Program of Care; instead, they
tended to be providing traditional physiotherapy, which was, aside from the hospitals, almost
exclusively provided in physiotherapy clinics.
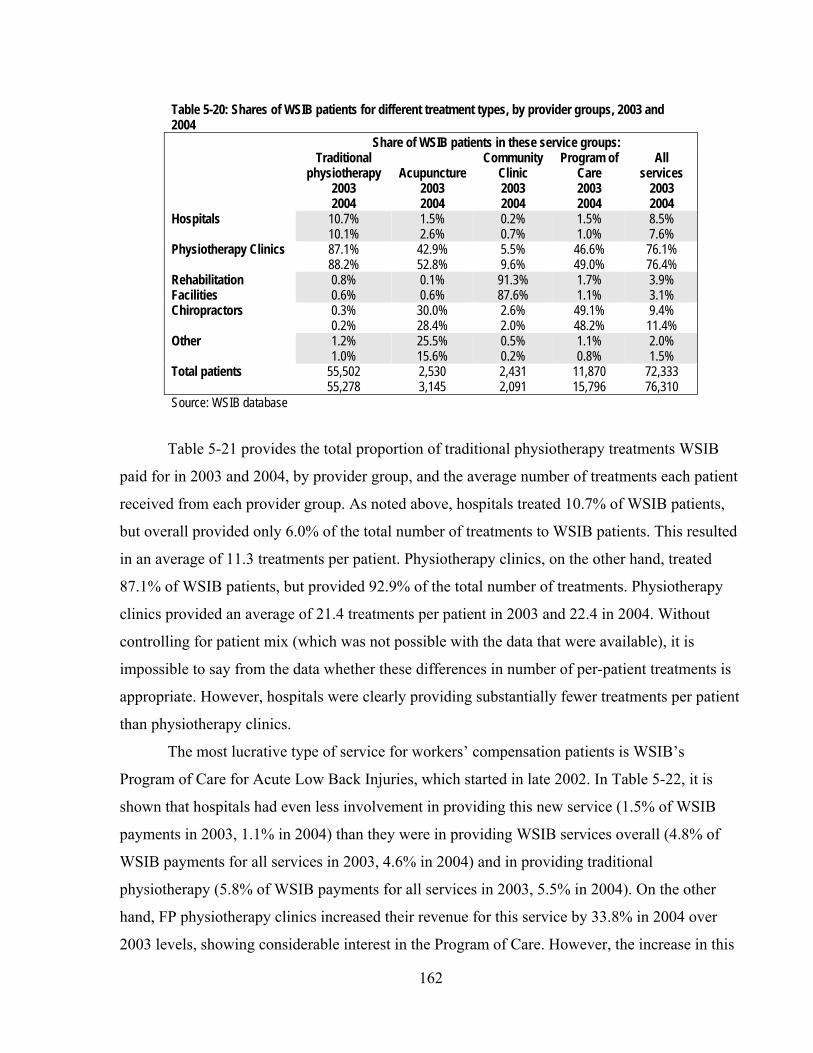
162
Table 5-20: Shares of WSIB patients for different treatment types, by provider groups, 2003 and 2004
Share of WSIB patients in these service groups: Traditional
physiotherapy 2003 2004
Acupuncture 2003 2004
Community Clinic 2003 2004
Program of Care 2003 2004
All services
2003 2004
Hospitals 10.7% 10.1%
1.5% 2.6%
0.2% 0.7%
1.5% 1.0%
8.5% 7.6%
Physiotherapy Clinics 87.1% 88.2%
42.9% 52.8%
5.5% 9.6%
46.6% 49.0%
76.1% 76.4%
Rehabilitation Facilities
0.8% 0.6%
0.1% 0.6%
91.3% 87.6%
1.7% 1.1%
3.9% 3.1%
Chiropractors 0.3% 0.2%
30.0% 28.4%
2.6% 2.0%
49.1% 48.2%
9.4% 11.4%
Other 1.2% 1.0%
25.5% 15.6%
0.5% 0.2%
1.1% 0.8%
2.0% 1.5%
Total patients 55,502 55,278
2,530 3,145
2,431 2,091
11,870 15,796
72,333 76,310
Source: WSIB database
Table 5-21 provides the total proportion of traditional physiotherapy treatments WSIB
paid for in 2003 and 2004, by provider group, and the average number of treatments each patient
received from each provider group. As noted above, hospitals treated 10.7% of WSIB patients,
but overall provided only 6.0% of the total number of treatments to WSIB patients. This resulted
in an average of 11.3 treatments per patient. Physiotherapy clinics, on the other hand, treated
87.1% of WSIB patients, but provided 92.9% of the total number of treatments. Physiotherapy
clinics provided an average of 21.4 treatments per patient in 2003 and 22.4 in 2004. Without
controlling for patient mix (which was not possible with the data that were available), it is
impossible to say from the data whether these differences in number of per-patient treatments is
appropriate. However, hospitals were clearly providing substantially fewer treatments per patient
than physiotherapy clinics.
The most lucrative type of service for workers’ compensation patients is WSIB’s
Program of Care for Acute Low Back Injuries, which started in late 2002. In Table 5-22, it is
shown that hospitals had even less involvement in providing this new service (1.5% of WSIB
payments in 2003, 1.1% in 2004) than they were in providing WSIB services overall (4.8% of
WSIB payments for all services in 2003, 4.6% in 2004) and in providing traditional
physiotherapy (5.8% of WSIB payments for all services in 2003, 5.5% in 2004). On the other
hand, FP physiotherapy clinics increased their revenue for this service by 33.8% in 2004 over
2003 levels, showing considerable interest in the Program of Care. However, the increase in this

163
Table 5-21: Proportion of WSIB-paid regular physiotherapy treatments and number of treatments per patient, by provider group, 2003 and 2004
Portion of regular physiotherapy
treatments Treatments per
patient 2003 2004 Hospitals 6.0% 11.3
5.7% 11.9 Physiotherapy clinics 92.9% 21.4
93.4% 22.4 Rehabilitation facilities 0.5% 13.4
0.4% 15.2 Other 0.5% 7.2
0.5% 8.8 Total/mean
100.0% 20.0 21.2
Source: WSIB database
Table 5-22: Share of WSIB payments for Program of Care, by provider groups, 2003 and 2004 WSIB payments Portion of payments 2003 Increase 2003 2004 2004 Hospitals $33,180 -7.0% 1.5%
$30,860 1.1% Physiotherapy clinics $1,037,882 33.8% 46.9%
$1,388,965 49.3% Rehab Facilities $37,942 -21.6% 1.7%
$29,730 1.1% Chiropractors $1,080,328 24.9% 48.8%
$1,349,111 47.9% Other $25,022 -20.7% 1.1%
$19,840 0.7% Total $2,214,354 27.3% 100.0%
$2,818,506 100.0% Source: WSIB database
type of payment was 23.6% of the total increase in 2004 paid to physiotherapy clinics by the
WSIB. They were continuing and expanding their interest in fee for service work while
increasing the number of treatments per patient by 4.7% (from 21.4 to 22.4).
Table 5-22 also shows that in the Program of Care’s first year of availability, 2003,
hospitals were paid $33,180 for this service, and physiotherapy clinics and chiropractors as
groups were each paid more than $1-million, with 46.9% of the payments and 48.8%,
respectively. In 2004, hospitals decreased their revenues for this service but both physiotherapy

164
clinics and chiropractors increased their revenues in this area by substantial percentages, 33.8%
and 24.9% respectively.
Hospitals have a very low participation rate in the WSIB physiotherapy niche market, and
this reflects the incentive in their predominant revenue source, a global budget from the
MOHLTC, for the provider to shed patients when possible. It is also highly consistent with the
expectation that not-for-profits’ interest in commercial markets would be low. Further, where
hospitals have participated in the market more than any other area is in traditional physiotherapy,
the least lucrative of all the service types paid for by WSIB. Within that service type, they
provide significantly fewer treatments to patients than private physiotherapy clinics do, again
reflecting the incentive inherent in a global budget. They also participated less in the program of
care, the most lucrative service, than private physiotherapy clinics, multidisciplinary
rehabilitation facilities and chiropractors.
This suggests that if NFP Hospitals compete for a revenue source, they do so at a lower
profit level than FP providers and they are less responsive to price signals in the market. It also
suggests the extent to which a large revenue source with particular incentives can dominate the
orientation of providers so that they do not respond to incentives from other revenue sources.
Here, the incentive in a global budget crowds out the expected effect of differential fees for
services from another revenue source.
5.2.3 Niches with low administrative burden
One part of Hypothesis 1(c) relating to differential strategic provider group responses to
revenue sources in the market was that FP/c providers will seek out the niches in the market that
have the lowest administrative burden as a means of minimizing cost and maximizing profit. It
was hypothesized that NFP providers would be less concerned with administrative burden and
FP/s providers would be in between FP/c and NFP provider organizations. ‘Administrative
burden’ is defined in terms of the schematic in Table 5-9 and means a combination of the billing
and reporting cost and the overhead cost for a revenue source. As described in sections 5.2.1.11
and 5.2.1.12, private insurance and out of pocket spending were the two niches with the lowest
administrative burden, and they were therefore used to test the hypothesis.
One drawback of using private insurance and out of pocket spending to indicate the take-
up of low-cost niches is that hospitals, significant providers of physiotherapy services in Ontario,
are not generally able to gain access to payment for these patients. In general, as observed in
Chapter 2, section 2.2.3.3 and section 5.1.1.1, the Canada Health Act4 and the Ontario Health

165
Insurance Act12 provide that medically necessary services provided in a hospital are publicly
“insured services” and therefore may not be paid privately. This illustrates a strong structural
reason for the NFP Hospitals constituting a distinct strategic provider group. However, some
hospitals are finding a means of getting around this apparent barrier by incorporating and
operating subsidiaries.28 Indeed, in the responses to the survey, 15.8% of NFP Hospitals reported
a portion of their patients had their physiotherapy services paid for by private insurers, with top-
up payments from patients themselves (Table 5-23). These developments aside, however, the test
of FP and NFP organizations’ responses to this low cost niche was conducted in full knowledge
that a significant portion of the NFP provider organizations, hospitals, would likely have a
different strategic response to the private insurance and out of pocket revenue sources than other
providers. But it was also clear that Other NFP provider organizations in general are not
prohibited by law from sharing in these revenue sources.
5.2.3.1 PRIVATE INSURANCE Table 5-23 provides information about the proportion of providers that treat patients
whose care is paid by private insurance. FP providers (more than 8 in 10) treat these patients, and
a third of Other NFP providers treat them as well.
Table 5-23: Proportion of provider organizations that treat private insurance patients
All FP/c FP/s NFP-Hospital Other NFP n=321 n=36 n=219 n=37 n=31
Treat private insurance patients 70.4% 83.3% 82.6% 15.8% 32.1% Do not treat these patients 29.6% 16.7% 17.4% 84.2% 67.9%
Source: Survey of Physiotherapy Provider Organizations, Question 9
The descriptive statistics for the proportions of patients whose care is paid for by private
insurance appears in Table 5-24. Reflecting earlier findings, the Table shows that the FP provider
organizations had a larger proportion of their patients’ care being paid for by private insurance
Table 5-24: Descriptive statistics for the proportion of patients whose care is paid for by private insurance, by strategic provider group and all providers
N Mean 95% CI
SE Median SD Min Max Lower Upper FP/c 36 36.00% 25.97% 46.04% 4.94 35.50% 29.65 0% 100% FP/s 219 39.41% 35.35% 43.46% 2.06 40.00% 30.46 0% 100% NFP Hospital 38 2.03% -0.37% 4.43% 1.18 0.00% 7.30 0% 40% Other NFP 28 17.32% 6.21% 28.43% 5.42 0.00% 28.66 0% 80% All 321 32.67% 29.26% 36.09% 1.74 30.00% 31.11 0% 100% Source: Survey of Physiotherapy Provider Organizations, Question 9

166
than NFP provider organizations. It also shows that there was a substantial variation in the
proportion of private insurance in the FP groups.
The results of a Kruskal-Wallis one-way ANOVA (Appendix 16, Table A5-5) indicate
that the FP groups did not differ significantly, nor did the NFP groups, but there were significant
differences between each of combinations of FP and NFP organizations. As a group, Other NFP
providers were unlike the FP provider groups, but there were Other NFP providers – a clear
minority – whose proportion of private insurance patients was as high as the mean proportion in
the FP groups. However, these Other NFP providers were in the clear minority within their
group: the median proportion of private insurance patients was 0%.
5.2.3.2 OUT OF POCKET REVENUES Two key informants (P-4, P-10) discussed a distinct preference among provider
organizations for patients who pay out of pocket: since those patients are paying their own
money for service, they tend to be more motivated to participate in the therapy and to get full
value out of it. Treating patients who pay their own bills is not as widely spread as this
advantage, along with the low administrative burden, might suggest. Table 5-25 illustrates that
the FP/s providers had the greatest proportion of their number treating self-paying patients
(75.3%), 61.1% of FP/c providers also treated these patients, and only 13.2% of NFP Hospitals
and 28.6% of Other NFP providers. The effect of these rates is reflected in the descriptive
statistics in Table 5-26 for the strategic provider groups, where mean percentages roughly
followed this pattern.
Table 5-25: Proportion of provider organizations that treat patients who pay for their own care
All FP/c FP/s NFP-Hospital Other NFP n=321 n=36 n=219 n=38 n=28
Treat self-paying patients 62.3% 61.1% 75.3% 13.2% 28.6% Do not treat self-paying patients 37.7% 38.9% 24.7% 13.2% 71.4% Source: Survey of Physiotherapy Provider Organizations, Question 9
Table 5-26: Descriptive statistics for the proportion of patients who pay for their own care, by strategic provider group and all providers
n Mean 95% CI
SE Median SD Min Max Lower Upper FP/c 36 3.69% 2.09% 5.29% 0.79 1.50% 4.72 0% 20% FP/s 219 14.87% 11.77% 17.98% 1.58 5.00% 23.32 0% 100% NFP Hospital 38 0.34% -0.42% 0.73% 0.19 0.00% 1.17 0% 5% Other NFP 28 5.71% 0.12% 11.32% 2.73 0.00% 14.45 0% 60% All 321 11.10% 8.84% 13.36% 1.15 5.00% 20.57 0% 100% Source: Survey of Physiotherapy Provider Organizations, Question 9

167
A Kruskal-Wallis ANOVA confirmed that FP/c and FP/s organizations differed
significantly (Appendix 16, Table A5-6), with FP/s providers having had a greater proportion of
their patients who paid their own bills than their FP/c counterparts. Despite having had fewer of
their patients paying on their own than FP/s providers, FP/c providers still got some of their
revenues directly from patients whereas NFP Hospitals got relatively no revenue from this
source (given the number of Hospitals and the variances in their responses, the proportion was
not statistically different from zero). Other NFP organizations were also significantly different
from NFP Hospitals in that they collected a greater proportion of their revenues from out of
pocket payments, and FP/c and Other NFP organizations were statistically significantly different
in their patterns regarding this kind of revenue.
5.3 Overview of findings in this chapter
The second research question, addressed explicitly in this chapter, asked whether public
and private payers in a market are similar or different in their approaches to and relationships
with providers, and what their effect was on the supply of services in the market.
The extensive analysis of the 11 different revenue sources in this chapter identified that
there were no characteristics that allowed them to be categorized neatly into “public” and
“private” types of approaches or relationships with providers. Instead, there is evidence of
substantial complexity of revenue sources, with varying relative values of the revenue sources
and different risks and advantages for providers associated with each. On a general level, then,
the market is characterized by the multitude of buyers (or groups of buyers as in the case of
MVA insurers, backed and supported by their governmental regulator) with different purposes,
goals and strategies that result in a web of complexity.
Findings regarding Hypothesis 2(a) It was hypothesized in Chapter 2, section 2.2.3.5, that private payers, with their focus on
making profits, would be more attentive to cost control and use different approaches to paying
providers than public payers, focusing on other factors. However, the analysis of terms and
conditions of the payment structures for the 11 revenue sources showed that there was little
difference between public and private revenue sources in this market in their potential to apply
cost pressures on providers, though the methods, timing and degree of the pressures varied across
revenue sources.

168
With respect to public and quasi-public revenue sources, OHIP and WSIB exercised the
power in their niches to control costs by keeping their fees for services significantly lower than
other revenue sources. The MOHLTC recently made changes to the OHIP scheme to redirect
spending, but the designated clinics have found ways to generate income from this low income
niche, undoubtedly by changing treatment plans to reflect the fee and charging patients with
private insurance outside the OHIP strictures. As for the WSIB revenue source, despite the low
fee, providers have taken the treatment challenge up, deriving benefits out of the potential future
therapeutic relationships with WSIB claimants, their friends and families.
While private revenue sources generally had higher fees in their payment structures, they
adopted a wide variety of other terms and conditions in those structures to control the costs, and
sometimes, to control the content and duration of care, and in other cases, to control
predominantly the total potential total liability of the insurer for each patient.
The distinction between public and private payers certainly had broad analytical
application when the majority of care was either paid publicly in hospitals or paid privately in a
small but identifiable private FP group of providers.364;365
With the proliferation of payment
schemes and approaches to the market (for example, the introduction of managed competition for
CCAC-paid therapy and the availability of program fees (MVA and WSIB)), the market has
become more complex and considerably more dynamic, and a simple public/private distinction
for payers does not reflect this complexity.
Findings regarding Hypothesis 2(b) It was also hypothesized in Chapter 2, section 2.2.3.5, that multiple payers in a market
have less control over costs and the supply of services than when there is a single payer. While
advocates in favour of a single, monopsonist public payer in the Medicare market promote such a
payer’s power to control cost, quality and access, in the physiotherapy market, there was no
revenue source in the physiotherapy market that dominated it and had enough power
singlehandedly to influence cost and provider behaviour across the market. However, the
multiplicity of revenue sources had an effect similar to that of a monopsonist. Since no revenue
source (other than hospital global budgets, dominating a niche but not appearing to influence
payment structures elsewhere) was large enough to support the entire revenue needs of many
individual providers or a strategic provider group, provider organizations generally had to
diversify to survive. But neither was any provider organization or corporate owner of provider
169
organizations large or influential enough to bargain effectively with a revenue source over the
terms and conditions of payment.*
The revenue sources had and continue to have substantially different terms and
conditions in their payment schemes, and, as a group, reflected all four variations in the Tuohy,
Flood and Stabile’s typology (Chapter 2, section 2.2.3.2) of possible mixes of public and private
insurance: parallel and private systems, co-payments, group-based, and sectoral.21 The high level
of differentiation among buyers’ demands in terms of their payment schemes and also in terms of
the insured patients meant that there were few opportunities for providers to consolidate and
standardize service offerings to gain significant scale economies. While each of the revenue
sources left the decision about the specific form of treatment to the providers, provider
organizations were required to work within the applicable terms and conditions. For example,
organizing an approach for optimal treatment within the confines of the OHIP fee of $12.20 is
different from organizing approaches to satisfy the requirements of a Pre-Approved Framework
paid for by a MVA insurer, to satisfy the terms of treatments paid by the WSIB with a fee of
$18.41 with a 12-week initial limit, or to satisfy the needs of a patient whose private insurance
plan pays for up to $250 of treatment with a deductible or co-payment for every treatment. To
emphasize the importance of insurers’ differentiated demands, it is possible to imagine that if
patients rather than the fragmented insurers were paying for the physiotherapy services in this
market, providers might have standardized their service offerings into a smaller number of
physiotherapy programs or types of care, and standardized their fees or billing practices. There
was little difference between the public and private revenue sources in this market in their
potential to apply competitive pressure on provider organizations, though the methods, timing
and degree of pressure vary across payers.
But the collective power of highly differentiated revenue sources was neither inevitable
nor unqualified. For example, there was substantial disruption to the market in the mid 1990s
when one revenue source, MVA, did not control its costs and MVA insurance revenues became
more widely available to providers. When the MVA insurers moved in concert to encourage their
regulator to control some of the cost inflation, the boom in this niche abated, and some providers
either exited the market or, to survive, diversified their revenue sources. The impact of the
revenue sources depended, then, on each of the revenue sources maintaining a control on costs
and requiring a differentiated kind or style of service. * The only exception might have been the members of Aviva Canada’s preferred provider network, but Aviva
largely offered network membership on its own terms rather than on negotiated terms.

170
The result was a high degree of fragmentation among provider organizations, and those
providers’ responses were as complex as the revenue sources. A few provider organizations have
concentrated on a single revenue source, particularly MOHLTC funding. Most organizations
diversified their revenue sources, though there were no common or predominant pairs of revenue
sources that provider organizations relied on. Provider organizations reacted to the revenue
complexity and, presumably, local economic and demographic conditions generally by
developing a unique mix of revenues to support them in achieving their own goals of
sustainability and profitability, and their therapists’ goals in terms of practice preferences.
Findings regarding Hypothesis 1(c) With the description of the revenue sources in section 5.1, it was possible to test whether
FP/c providers were, as hypothesized, different from NFP providers in four specific revenue
sources – MVA, WSIB, private insurance and out of pocket spending.
In the case of WSIB revenues, the statistical test did not show NFP Hospitals as
significantly different from FP providers in the proportion of clients whose care was paid for by
WSIB, probably due to the numbers of reporting providers and variations among them. But there
was a distinctly different approach to the market. NFP Hospitals tended to concentrate on the
least lucrative form of WSIB revenue and treat patients less than their FP counterparts.
NFP and FP providers were found to be different as expected with respect to the highest
revenue niche (MVA insurance) and to the lowest administrative burden (private insurance and
out of pocket spending). However, the hypothesized differences between FP/c and FP/s providers
were not generally found. Instead, the proportions of their patients from MVA, WSIB and
private insurance were not significantly different. Only in the out-of-pocket segment was there a
difference in the proportion of patients, and FP/s providers unexpectedly have a higher
proportion of patients. A smaller proportion of FP/s providers treated WSIB patients than FP/c
providers, also contrary to expectations.
These findings are consistent with the findings in Chapter 4 of few differences between
FP/c and FP/s providers on matters of geographical location and internal labour organization, but
of clear distinctions between the FP and NFP providers.
In the next chapter, the discussion turns to rivalry among incumbent providers, with
emphasis on the kinds of patients and conditions the strategic groups serve.

171
Chapter 6 – Rivalry among strategic groups of providers
This chapter reviews some of the patterns and behaviours of participants already in the
market – an assessment of aspects of the rivalry among strategic groups of providers.
In section 6.1, providers’ perceptions of the degree of competition and of the major
competitors in the market are considered. This permits a test of Hypothesis 1(d) that FP/c
providers perceive greater competition, NFP providers perceive less, and FP/s provider
organizations are in between. There is also an examination of who competes with whom in this
market, of regional variations, and of some potential competitive strategies associated with
perceptions of competition faced by provider organizations.
The issue of supply of patients to physiotherapy provider organizations is examined in
section 6.1.4 to test Hypothesis 3(b) that there is little effect of patient referral sources on
providers if patients have direct access to providers, as they do in the case of physiotherapists in
Ontario.
Section 6.2 examines the variety of services that different providers groups offered in the
market. This discussion addresses the hypothesis (1(e)) that FP/c providers offer a wide variety
of services to maximize opportunities for cross-selling or for building a reputation for full
service. Other NFP provider organizations were hypothesized as offering the fewest number of
services, and FP/s providers were hypothesized as being between the two, adopting
characteristics and motivations of both. NFP Hospitals, institutionally constituted as
organizations with an emphasis on many services aside from physiotherapy, were expected to
offer the broadest range of services.
It was also hypothesized (1(f)) that FP/c providers would treat patients with less complex
conditions that NFP providers do, especially, as in this market, where there are tightly controlled
fee structures and a limited interest across the market (except among NFP providers with
communitarian, altruistic or social mandate) in paying a premium for complex services. Again,
FP/s provider organizations were expected to fall in between FP/c and NFP providers. Section
6.2 examines four different areas of practice – orthopaedic and musculoskeletal, sports medicine,
prevention and health promotion, and neurology and neurotrauma – to detect differences in the
kinds of patients that each of the strategic groups concentrates on or specializes in.
Section 6.3 provides an analysis of providers’ statements in the survey about their wait
lists to determine if these lists vary. It was hypothesized (Hypothesis 1(g)) that FP/c providers

172
would have the shortest wait lists, reflecting their ability and motivation to respond to market
demand, and the NFP providers having the longest, reflecting their constrained resources or the
maximization of other goals than profit.
Section 6.4 provides an overview of the findings reported in this chapter.
6.1 Perceptions of competition
6.1.1 The amount of competition
Competition is an important feature of ideal markets, and even in health care markets,
competition can be influential. To assess providers’ views of the competition they face, the
following question was asked in the survey of organizations providing physiotherapy services in
Ontario:
17. How would you describe the amount of competition that your Setting faces for physiotherapy clients?
Respondents were requested to indicate their description on a five-point Likert scale: 1
signified “No Competition” and 5, “A Lot of Competition”. No descriptors were given for points
2, 3 and 4 on the scale. The descriptive statistics are provided in Table 6-1 and the results are
illustrated in Figure 6-1.
Table 6-1: Descriptive statistics for the perception of competition, on a scale of 1 to 5, from “no competition” to “a lot of competition”, by strategic provider group and all providers
N Mean 95% CI
SE Median SD Min Max Lower Upper FP/c 40 4.08 3.66 4.49 .21 5.00 1.31 1 5 FP/s 222 3.78 3.63 3.94 .08 4.00 1.18 1 5 NFP Hospital 42 1.93 1.56 2.30 .19 1.00 1.20 1 5 Other NFP 31 2.29 1.77 2.81 .26 2.00 1.42 1 5 All 335 3.45 3.29 3.60 .08 4.00 2.02 1 5 Source: Survey of Physiotherapy Provider Organizations, Question 17
While at least one respondent in each strategic provider group said that there was “no
competition” and one said there was a “lot of competition”, there were clear differences among
the strategic groups. Fifty-five per cent of the FP/c providers said they faced “a lot of
competition” and 35.6% of the FP/s providers did as well. In contrast, 52.4% of the NFP
Hospitals and 41.9% of Other NFP providers said that they faced no competition.
To assess whether the mean ratings of competition levels of the four strategic groups of
FP/c, FP/s, NFP-Hospital and Other NFP were significantly different, an analysis of variance

173
(ANOVA) was undertaken (Appendix 16, Table A6-1). Essentially, the mean competition rating
levels of the FP/c and FP/s providers were not significantly different, nor were the means of the
NFP Hospital and Other NFP provider groups. However, each of the FP provider groups’ ratings
was significantly higher than each of the NFP provider groups. Thus, the hypothesis is partially
supported and partially rejected: while FP providers said they were, as expected, subject to more
competition than NFP providers, the expected difference between perceptions of competition
between FP/c and FP/s providers was not found.
As was shown in section 4.3.1, there is considerable variation in the density of registered
physiotherapists across Ontario counties, with particular concentrations of physiotherapists in
large centres with academic health centres and it was conceivable that there would be a
relationship between the perceptions of competition levels and the density of therapists. Pearson
correlation coefficients were calculated to assess the strength of a relationship between the mean
level of competition reported in responses from each of the surveyed counties* and, either the
density of registered physiotherapists employed in all organizations or in FP organizations only. * One county had too few respondents to be included in this analysis.
Figure 6-1: Proportion of survey respondents’ perceptions of competition, by strategic provider group
10.0%
52.4%41.9%
12.2%
19.0%
22.6%
12.5%
19.4%
16.7%
9.7%
20.0%
28.4%
7.1%
16.1%
55.0%
35.6%
4.8%9.7%
4.5%
2.5%
0%
10%
20%
30%
40%
50%
60%
70%
80%
90%
100%
FP/c FP/s NFP-Hospital Other NFP
Prop
ortio
n of
resp
onde
nts
No competition 2 3 4 A lot of competition
Source: Survey of Physiotherapy Provider Organizations, Question 17

174
While, as been discussed in Chapter 4, registered physiotherapists are not the only therapists
offering services in this market, their presence is substantial.
The correlation between perceived level of competition and all-physiotherapist density
was not statistically significant (r=.495, p=.10) but with the small number of counties under
consideration, the power of this correlation analysis was low. On the other hand, the correlation
between the perception of competition and the density of physiotherapists in FP settings was
moderate (r=.67, p=.017), confirming a link between competition levels and density. Thus, not
only did FP provider organizations perceive more competition, providers reported higher
competition in areas where there were more physiotherapists in FP organizations per 10,000
population.
Before drawing conclusions about these perceptions of competition, however, it is
important to assess the question from other perspectives and to corroborate that the reported
perceptions of competition were accurate indications of actual competition. In the next section,
6.1.2, there is a consideration of the nature of the competition – who was perceived to be
competing with whom? – and the views of the key informants on the variations in the levels of
competition in the market. In section 6.2.1, there is further analysis of the breadth of the service
provider groups’ service offerings to assess the extent to which they have the same competitive
strategies in the market, and in section 6.2.2, there is a consideration of the strategic provider
groups’ involvement in four specific practice areas.
6.1.2 Competing with whom?
In general, respondents to the survey, especially FP providers, indicated that they felt
competitive pressures and there appeared to be heightened competition in certain areas. But
whom did the provider organizations perceive as their most serious competitors? In the survey
questionnaire, there was a question that probed this issue. Question 18 asked:
If you have competition for physiotherapy clients, what would you say are your two top competitors?
Table 6-2 provides a summary of the responses to the question about top competitors.
Overall, three organization types emerged as the top competitors most frequently reported
by all respondents: FP/s provider organizations (cited by 44.6%), FP/c organizations (30.4%) and
chiropractic clinics (8.6%). Another 16.9% of respondents cited another provider category but no
one other category totaled more than 5%.

175
There was reasonable consistency in responses between the two FP strategic provider
groups, with the FP/c providers pointing to a slightly higher proportion of other FP/c providers as
their top competitor than FP/s providers did. Also notable were NFP providers’ perceptions.
First, compared to FP providers, they tended to identify FP/s providers organizations more often
as their top competitors. Second, they tended to identify more frequently that chiropractic clinics
were their top competitors than FP providers did.
Table 6-2: Perceived top competitor reported by provider organizations, by strategic provider group and all providers
All FP/c FP/s NFP
Hospital Other NFP
n 280 31 211 21 17 Top competitor FP/s 44.6% 41.9% 42.7% 42.9% 76.5% FP/c 30.4% 35.5% 34.1% 9.5% 0.0% NFP Hospital 3.6% 0.0% 3.3% 9.5% 5.9% Chiropractic clinic 8.6% 3.2% 8.5% 14.3% 11.8% Complementary/alternative clinic 1.1% 0.0% 0.9% 4.8% 0.0% Massage Therapist 1.1% 0.0% 1.4% 0.0% 0.0% Physiatrist 0.4% 0.0% 0.0% 4.8% 0.0% Other physician 0.4% 0.0% 0.5% 0.0% 0.0% Sports medicine clinic 2.5% 3.2% 2.8% 0.0% 0.0% Other 7.5% 16.1% 5.7% 14.3% 5.9% Source: Survey of Physiotherapy Provider Organizations, Question 18
The NFP Hospital provider group most frequently identified FP/s providers as their top
competitors, and the second most frequently reported top competitors were chiropractic clinics.
FP/c providers and Other NFP providers were each identified by 9.5% of the NFP Hospitals as
the third-ranked top competitors. The Other NFP providers were similarly focused on FP/s
providers as their top competitors, and they rated chiropractic clinics as their second top
competitors less frequently than NFP Hospitals did.
Question 18 in the survey also asked for each respondent’s number two competitor and
the results, in relation to the most often identified top competitors, are illustrated in Table 6-3.
Among those rating a FP/s clinic as the top first competitor, FP/c organizations were named most
often as the second top competitor, and among those who rated a FP/c clinic as their first top
competitor, FP/s clinics were most frequently named as the second top competitor. In both cases,
chiropractic clinics were named as the second top competitor, but by just more than 20% of the
respondents. All the other categories of potential competitors were rated by less than 5% of the
respondents each.
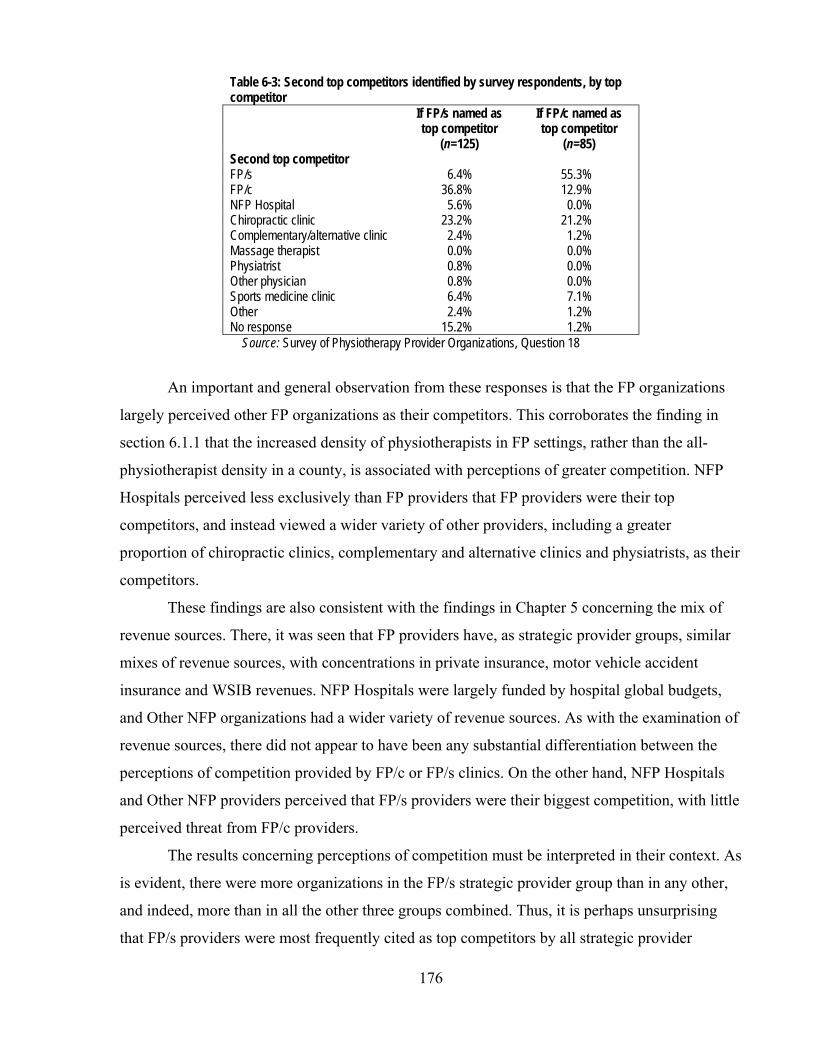
176
Table 6-3: Second top competitors identified by survey respondents, by top competitor If FP/s named as
top competitor (n=125)
If FP/c named as top competitor
(n=85) Second top competitor FP/s 6.4% 55.3% FP/c 36.8% 12.9% NFP Hospital 5.6% 0.0% Chiropractic clinic 23.2% 21.2% Complementary/alternative clinic 2.4% 1.2% Massage therapist 0.0% 0.0% Physiatrist 0.8% 0.0% Other physician 0.8% 0.0% Sports medicine clinic 6.4% 7.1% Other 2.4% 1.2% No response 15.2% 1.2%
Source: Survey of Physiotherapy Provider Organizations, Question 18
An important and general observation from these responses is that the FP organizations
largely perceived other FP organizations as their competitors. This corroborates the finding in
section 6.1.1 that the increased density of physiotherapists in FP settings, rather than the all-
physiotherapist density in a county, is associated with perceptions of greater competition. NFP
Hospitals perceived less exclusively than FP providers that FP providers were their top
competitors, and instead viewed a wider variety of other providers, including a greater
proportion of chiropractic clinics, complementary and alternative clinics and physiatrists, as their
competitors.
These findings are also consistent with the findings in Chapter 5 concerning the mix of
revenue sources. There, it was seen that FP providers have, as strategic provider groups, similar
mixes of revenue sources, with concentrations in private insurance, motor vehicle accident
insurance and WSIB revenues. NFP Hospitals were largely funded by hospital global budgets,
and Other NFP organizations had a wider variety of revenue sources. As with the examination of
revenue sources, there did not appear to have been any substantial differentiation between the
perceptions of competition provided by FP/c or FP/s clinics. On the other hand, NFP Hospitals
and Other NFP providers perceived that FP/s providers were their biggest competition, with little
perceived threat from FP/c providers.
The results concerning perceptions of competition must be interpreted in their context. As
is evident, there were more organizations in the FP/s strategic provider group than in any other,
and indeed, more than in all the other three groups combined. Thus, it is perhaps unsurprising
that FP/s providers were most frequently cited as top competitors by all strategic provider

177
groups: it was more likely that FP/s providers were located near a respondent, constituting
possible – and perceived – competition.
FP providers’ perceptions of the competitive threat of FP/c providers are all the more
remarkable in contrast. In the sample, there were almost seven times as many FP/s providers as
FP/c providers, yet FP/c providers were named almost as frequently as FP/s providers as top
competitors among FP providers. Thus, it appears that the prevalence of organizations alone – at
least in the case of FP/c organizations – was not associated with their being perceived as
competitors. Some other factor or competition strategy – their profile in a local area, their
marketing, or the general impression of the relative market power of FP/c providers, perhaps –
raised the prospect of their competitive power in the perceptions of FP provider organizations.
In a similar vein, NFP Hospitals were more evenly distributed than FP/c and FP/s
providers across all regions (Chapter 4, section 4.6.3.3) and were more numerous in the overall
survey sample than FP/c organizations. Their mere presence in all regions, however, did not
prompt other providers to name them as top competitors though a small proportion did so.
Key informants also did not name NFP Hospitals as significant competitive threats to FP
providers. Two key informants (P-5, O-2) said that hospital-based providers that provide
physiotherapy services in return for revenue other than global budget revenue concentrate on
serving different market segments than FP physiotherapy providers. Generally, these key
informants perceived that NFP Hospitals concentrate on more complex injuries and conditions.
For example, Toronto Western Hospital, through its Rehab Solutions subsidiary, operates three
clinics, one at its main hospital site, one in Mississauga, just west of Toronto, and one in
Cambridge, 100 km southwest of Toronto.391 The target market is patients with complex injuries
who are insured by the WSIB.392
Therefore, NFP Hospitals’ service offerings, their propensity to refer privately-insured
patients to FP providers28 for post-acute physiotherapy and their generally low profile in such
niches as workers’ compensation (Chapter 5, section 5.3.6) are likely among the reasons they
were not often named as competitors, despite their prevalence.
Finally, while they were named third in the list of top competitors, chiropractic clinics are
seen as competitors by a minority of the respondents. This mirrored the views of several key
informants who discussed but minimized the competitive impact of a long perceived rivalry
between physiotherapy and chiropractic (P-2, P-4, P-5, P-8, P-9, O-1, O-2, O-4, R-3).

178
6.1.3 Competition and service mix
Before turning to consider the variety of services provided in the market by the strategic
provider organization groups, it is useful to reflect on a potential link between competition and
the patients a provider served. When looking at a market, it is to be expected that perceptions of
high levels of competition would drive specific competitive strategies. For example, with little
possibility of price competition (section 5.1.3) and little capacity explicitly to differentiate on
quality, a provider organization might change the profile of the patients it serves as a competitive
strategy to better achieve its objectives. Question 14 in the survey of provider organizations
asked:
Does your Organization have the profile or range of clients it wants now? (Yes/No)
Overall, among the survey respondents, seven in 10 were satisfied with the range of
patients they had, and the proportion rose among the NFP providers (see Table 6-4). FP/s
providers were the most dissatisfied with their patient profiles, slightly more so than
FP/c providers, and NFP providers were substantially more satisfied with their patient mix.
Table 6-4: Responses to the survey question, “Does your Organization have the profile or range of clients it wants now? (Yes/No)”, by strategic provider group and all respondents FP/c FP/s NFP-Hospital Other NFP All
n 37 214 40 31 322 Yes 70.3% 67.8% 80.0% 87.1% 71.4% No 29.7% 32.2% 20.0% 12.9% 28.6%
Source: Survey of Physiotherapy Provider Organizations, Question 14
Not all the respondents who indicated they wanted to change their patient profile (n=92)
provided information about what specific change they would like to make. However, among
those who did (n=77), the majority expressed a desire to change their mix of revenue sources and
the next biggest group wished to change the kinds of services they provided, for example, to less
complex cases or more spinal cord. The results are in Table 6-5. Among those who wanted to Table 6-5: Changes to the profile or range of patients provider organizations said they would like to be serving if they were dissatisfied with their current patient profile n=77 Different revenue sources 59.7% Different services 14.3% More patients 11.7% Patients in different age groups 10.4% Other 3.9% Source: Survey of Physiotherapy Provider Organizations, Question 14a

179
change their revenue sources, 54.3% wanted to increase the proportion of patients whose care
was paid by private insurance or out of pocket.
To assess the relationship between competition and satisfaction with current patient
profile, a logistic regression was conducted, with satisfaction with patient profile as the binary
dependent variable and the competition rating (1-5) as the independent variable. The type of
organization could affect the satisfaction level, since some providers are able to serve only
certain populations. Consequently, three dummy variables were entered for strategic provider
group independent variables in a first model but they were not significant (Wald statistics for
FP/c, FP/s and Other NFP =.533 (p=.465), .005 (p=.943) and .208 (p=.649), respectively). The
results of a second model, without the organizational variables, were significant (Hosmer and
Lemeshow Test p=.170), and the model predicted 71.5% of the responses correctly. The results
are reported in Table 6-6.
Table 6-6: Logistic regression results: modeling the probability of a physiotherapy organization perceiving more competition being dissatisfied with its patient profile
Independent variable
Wald statistic
p
Odds ratio
95% CI
‘Dissatisfied with patient profile’
18.44 p<.001 1.55 1.27-1.89
Every one point increase in the perception of competition on the survey scale was
associated with a provider being 1.5 times more likely to want to change its patient profile. Of
course, the desire to change patient profiles is different from actually taking steps to achieve a
different mix. Nevertheless, it is important that where competition was perceived as greater – in
areas of higher density of physiotherapists in FP settings – the market was likely to be more
dynamic as providers contemplate, and some probably embark on, changes to their competitive
strategy.
6.1.4 Competition for the supply of patients
In chapter 4, sections 4.5.1 and 4.5.4, competition among provider organizations for the
supply of labour was considered. Another supply issue that provider organizations have is the
recruitment of patients. Hypothesis 3(b) stated that if patients have direct access to providers that
there should be little effect of patient referral sources on provider organizations.
As regulated health professionals in Ontario since 1991, registered physiotherapists have
full legal authority for these health professionals to treat patients without the requirement of a

180
referral from other health professionals. Thus, provider organizations’ ability to market their
services should be important to their survival.
However, prior to 1991, members of the profession were not able to treat patients except
on referral from physicians, a situation the profession had long supported to boost the credibility
of the profession but then, from the 1970s, had fought to overturn.36 Reflecting this history,
various revenue sources still required a referral from a physician for treatment by registered
physiotherapists: global hospital budgets, OHIP designated clinics (for patients between ages 19
and 64) and for patients in long term care homes; Veterans Affairs, Canadian Forces and
(usually) private health insurance (usually). Even for those revenue sources without this sort of
precondition, it is common for patients to seek assistance first from a physician for the acute
phase of an injury, for example, before consulting with a physiotherapist, and physicians are in a
position to recommend physiotherapy services (P-1, P-2, P-3, O-2).
Therefore, as several key informants observed, successful patient recruitment by
physiotherapy provider organizations often occurs as the result of the cultivation of relationships
with other local health care providers, including local physicians. Since physician services were
traditionally organized on a solo or small practice model in Ontario,* physiotherapy
organizations have been required to develop relationships at a very local level. As an illustration,
a key informant (P-9) described a street along which there was exceptionally high competition
among physiotherapy provider organizations. Several provider organizations – both FP/c and
FP/s – had located there and the choices for treatment were broad. As a result, maintaining
relationships with the local physicians was an endless challenge for these provider organizations.
Some key informants (P-1, P-3, P-4, P-9) stressed that provider organizations tied to a single
corporate owner generally have a significant degree of autonomy, allowing FP/c provider
organizations to match their FP/s competitors in seeking local links with referral sources in the
market.
According to key informants (P-1, P-2, P-3, P-6, O-2, R-1, R-2, R-3), some provider
organizations have engaged in ‘backward integration,’ that is, forming strong links with
physicians and physician groups through common ownership or other financial arrangements, in
order to gain access to patients. To be successful, these sorts of arrangements must be highly
selective, since not many physicians’ practices will focus exclusively on the sorts of patients who * In 2003-2004, 69% of Ontario’s general practitioners were in solo practice.393 This pattern has changed rapidly
since 2005: in 2007, 62.3% of general practitioners were in group practices.394 This change in practice orientation may have an influence on the referral patterns and the relationships of individual physicians with physiotherapy provider organizations in their community.

181
generally need physiotherapy services and the average physician’s practice is unlikely to
generate the number of referrals required by a physiotherapy provider for survival. In addition,
the Ontario College of Physiotherapists has viewed these sorts of arrangements as potential
problems, and has, in its Code of Ethics, prohibited the payment of fees for referrals.395 The
question of a more formal arrangement between referral source and physiotherapists (for
example, through common ownership of the two) has not been formally considered and decided
by the College in its ethics code.
Finally, it is conceivable that provider organizations might generate patient referrals as a
result of alliances with certain revenue sources. However, the norm of patient choice rules out
the ability of revenue sources to require patients to use specific providers. In addition, as was
seen in Chapter 5, no revenue source was important enough to the average FP or Other NFP
provider that an alliance with a single revenue source could be sufficient. The issue of whether
membership of a preferred provider network enhances a provider organization’s likelihood of
survival in the market is taken up in Chapter 7, section 7.1.4.
6.2 Variety of services and patients in the market
6.2.1 Variety of services
One area in which the different profit orientations and corporate forms of providers was
expected to make a difference was in the number of services that each organization offered. The
hypothesis (1(e)) was that FP/c providers, eager for as many sales as possible in addition to or
instead of physiotherapy, would offer more than FP/s provider organizations. In turn, because
they were thought to specialize in a narrower range of activities defined by community need or
stakeholder pressure, Other NFP providers were expected to offer the least number of services.
NFP Hospitals, able and constituted to offer their broad array of services beyond physiotherapy,
were expected to offer the greatest number of services.
The data used to examine the number of services were from the Survey of Physiotherapy
Provider Organizations, using the list of common and ancillary services as defined in Chapter 4,
section 4.3. Table 6-7 provides that list along with the proportions of all providers and of
providers within each strategic provider group that offered each of the services. Table 6-8
contains the descriptive statistics for the number of services (including physiotherapy itself)
offered by all provider organizations and by strategic provider groups. Tables A6-2 to A6-4 in
Appendix 16 provide the results of the Kruskal-Wallis ANOVAs that were conducted.
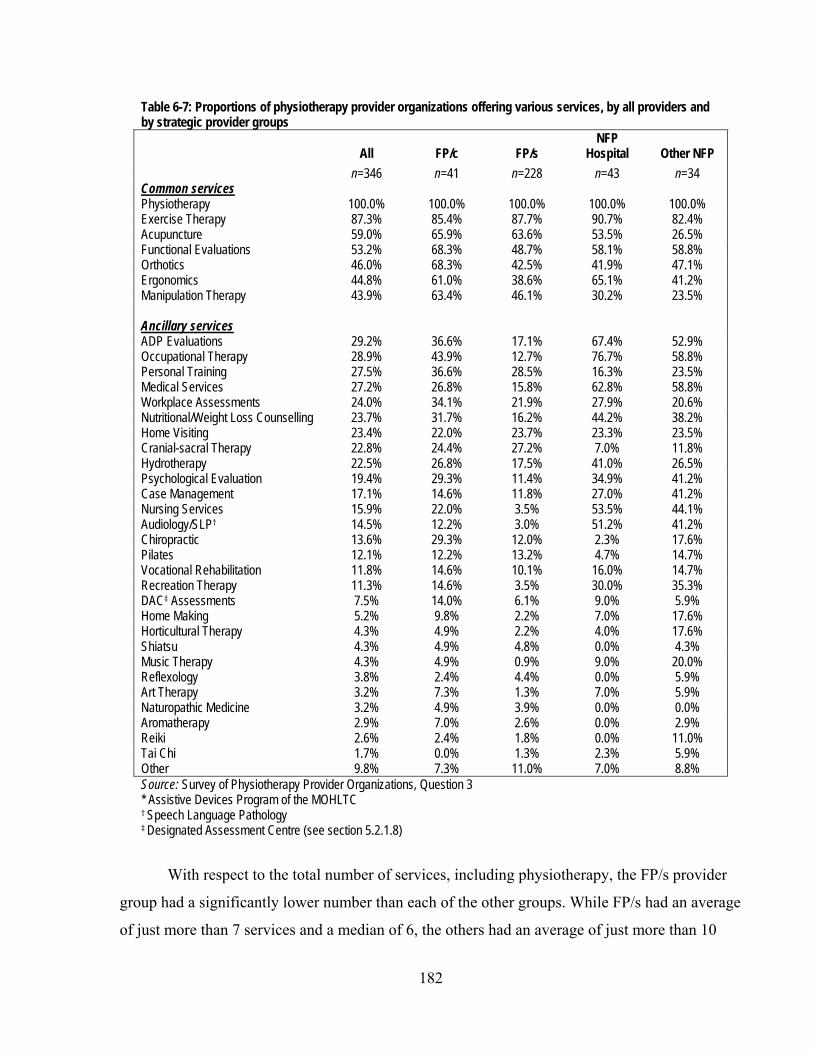
182
Table 6-7: Proportions of physiotherapy provider organizations offering various services, by all providers and by strategic provider groups
All FP/c FP/s NFP
Hospital Other NFP n=346 n=41 n=228 n=43 n=34 Common services Physiotherapy 100.0% 100.0% 100.0% 100.0% 100.0% Exercise Therapy 87.3% 85.4% 87.7% 90.7% 82.4% Acupuncture 59.0% 65.9% 63.6% 53.5% 26.5% Functional Evaluations 53.2% 68.3% 48.7% 58.1% 58.8% Orthotics 46.0% 68.3% 42.5% 41.9% 47.1% Ergonomics 44.8% 61.0% 38.6% 65.1% 41.2% Manipulation Therapy 43.9% 63.4% 46.1% 30.2% 23.5% Ancillary services ADP Evaluations 29.2% 36.6% 17.1% 67.4% 52.9% Occupational Therapy 28.9% 43.9% 12.7% 76.7% 58.8% Personal Training 27.5% 36.6% 28.5% 16.3% 23.5% Medical Services 27.2% 26.8% 15.8% 62.8% 58.8% Workplace Assessments 24.0% 34.1% 21.9% 27.9% 20.6% Nutritional/Weight Loss Counselling 23.7% 31.7% 16.2% 44.2% 38.2% Home Visiting 23.4% 22.0% 23.7% 23.3% 23.5% Cranial-sacral Therapy 22.8% 24.4% 27.2% 7.0% 11.8% Hydrotherapy 22.5% 26.8% 17.5% 41.0% 26.5% Psychological Evaluation 19.4% 29.3% 11.4% 34.9% 41.2% Case Management 17.1% 14.6% 11.8% 27.0% 41.2% Nursing Services 15.9% 22.0% 3.5% 53.5% 44.1% Audiology/SLP† 14.5% 12.2% 3.0% 51.2% 41.2% Chiropractic 13.6% 29.3% 12.0% 2.3% 17.6% Pilates 12.1% 12.2% 13.2% 4.7% 14.7% Vocational Rehabilitation 11.8% 14.6% 10.1% 16.0% 14.7% Recreation Therapy 11.3% 14.6% 3.5% 30.0% 35.3% DAC‡ Assessments 7.5% 14.0% 6.1% 9.0% 5.9% Home Making 5.2% 9.8% 2.2% 7.0% 17.6% Horticultural Therapy 4.3% 4.9% 2.2% 4.0% 17.6% Shiatsu 4.3% 4.9% 4.8% 0.0% 4.3% Music Therapy 4.3% 4.9% 0.9% 9.0% 20.0% Reflexology 3.8% 2.4% 4.4% 0.0% 5.9% Art Therapy 3.2% 7.3% 1.3% 7.0% 5.9% Naturopathic Medicine 3.2% 4.9% 3.9% 0.0% 0.0% Aromatherapy 2.9% 7.0% 2.6% 0.0% 2.9% Reiki 2.6% 2.4% 1.8% 0.0% 11.0% Tai Chi 1.7% 0.0% 1.3% 2.3% 5.9% Other 9.8% 7.3% 11.0% 7.0% 8.8% Source: Survey of Physiotherapy Provider Organizations, Question 3 * Assistive Devices Program of the MOHLTC † Speech Language Pathology ‡ Designated Assessment Centre (see section 5.2.1.8)
With respect to the total number of services, including physiotherapy, the FP/s provider
group had a significantly lower number than each of the other groups. While FP/s had an average
of just more than 7 services and a median of 6, the others had an average of just more than 10
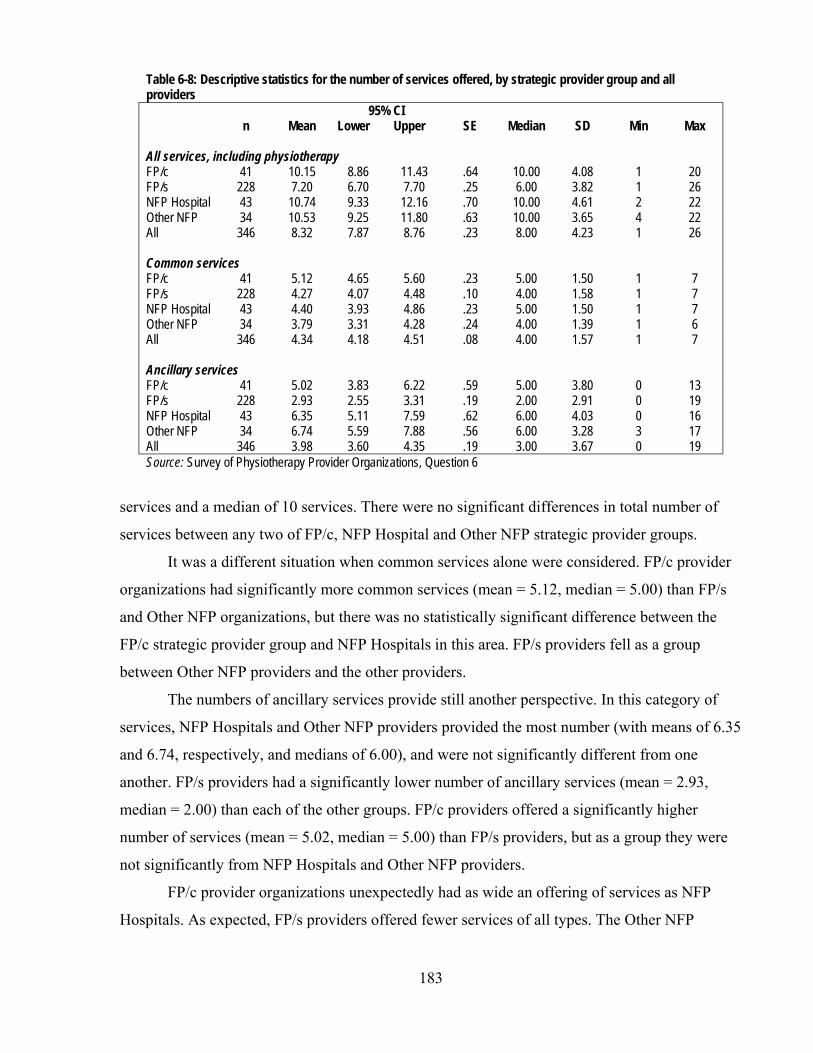
183
Table 6-8: Descriptive statistics for the number of services offered, by strategic provider group and all providers
n Mean 95% CI
SE Median SD Min Max Lower Upper All services, including physiotherapy FP/c 41 10.15 8.86 11.43 .64 10.00 4.08 1 20 FP/s 228 7.20 6.70 7.70 .25 6.00 3.82 1 26 NFP Hospital 43 10.74 9.33 12.16 .70 10.00 4.61 2 22 Other NFP 34 10.53 9.25 11.80 .63 10.00 3.65 4 22 All 346 8.32 7.87 8.76 .23 8.00 4.23 1 26 Common services FP/c 41 5.12 4.65 5.60 .23 5.00 1.50 1 7 FP/s 228 4.27 4.07 4.48 .10 4.00 1.58 1 7 NFP Hospital 43 4.40 3.93 4.86 .23 5.00 1.50 1 7 Other NFP 34 3.79 3.31 4.28 .24 4.00 1.39 1 6 All 346 4.34 4.18 4.51 .08 4.00 1.57 1 7 Ancillary services FP/c 41 5.02 3.83 6.22 .59 5.00 3.80 0 13 FP/s 228 2.93 2.55 3.31 .19 2.00 2.91 0 19 NFP Hospital 43 6.35 5.11 7.59 .62 6.00 4.03 0 16 Other NFP 34 6.74 5.59 7.88 .56 6.00 3.28 3 17 All 346 3.98 3.60 4.35 .19 3.00 3.67 0 19 Source: Survey of Physiotherapy Provider Organizations, Question 6
services and a median of 10 services. There were no significant differences in total number of
services between any two of FP/c, NFP Hospital and Other NFP strategic provider groups.
It was a different situation when common services alone were considered. FP/c provider
organizations had significantly more common services (mean = 5.12, median = 5.00) than FP/s
and Other NFP organizations, but there was no statistically significant difference between the
FP/c strategic provider group and NFP Hospitals in this area. FP/s providers fell as a group
between Other NFP providers and the other providers.
The numbers of ancillary services provide still another perspective. In this category of
services, NFP Hospitals and Other NFP providers provided the most number (with means of 6.35
and 6.74, respectively, and medians of 6.00), and were not significantly different from one
another. FP/s providers had a significantly lower number of ancillary services (mean = 2.93,
median = 2.00) than each of the other groups. FP/c providers offered a significantly higher
number of services (mean = 5.02, median = 5.00) than FP/s providers, but as a group they were
not significantly from NFP Hospitals and Other NFP providers.
FP/c provider organizations unexpectedly had as wide an offering of services as NFP
Hospitals. As expected, FP/s providers offered fewer services of all types. The Other NFP
184
providers unexpectedly offered as great a variety of services as the FP/c and NFP Hospital
groups.
FP/c providers distinguished themselves in the area of the most common services,
providing a greater variety of these commonly-offered services than FP/s and Other NFP
providers, and the same number as NFP Hospitals. FP/c providers, then, appear to have had a
competitive strategy to match and exceed the variety of service offerings of as many of their
potential competitors in the market as possible.
Of course, this is not to say that the FP/c provider organizations and NFP Hospitals
offered the same services. The actual services offered by the FP/c provider organizations differed
somewhat from those offered by NFP Hospitals. As Table 6-7 illustrates, a greater proportion of
FP/c provider organizations offered the following common services than NFP Hospitals did:
acupuncture, functional evaluations, orthotics and manipulation therapy. Further, among the
ancillary services, more than 50% of NFP Hospitals offered ADP evaluations, occupational
therapy, medical services, nursing services and audiology/speech language pathology, while a
minority of FP/c providers offered these services.
The competitive advantage (or strategy) of NFP Hospitals was, in keeping with their
broader service mandate as hospitals, to offer a greater variety of ancillary services, with a
relatively narrower offering of common services. This latter is consistent with the finding in
Chapter 5 regarding NFP Hospitals’ take-up of the WSIB niche. In section 5.2.2, NFP Hospitals
were shown to have largely continued to provide traditional physiotherapy services to injured
workers rather than expanding to newer, more lucrative formats.
The Other NFP providers also differentiated themselves in the market by offering a
smaller variety of the common services and a wider variety of ancillary services, probably
reflecting their differentiation from other providers in the market by their concentration on
groups of patients who were underserved either on the basis of their need (or demand) for
different kinds of services or on the basis of the nature of their injury or illness (this latter aspect
is examined in section 6.2.2).
FP/s provider organizations, on the other hand, tended to focus on a smaller number of
the basic, or common, services, and also did not provide as many of the ancillary services as
other strategic provider groups, positioning themselves and competing in the market in different
ways than the other groups. These findings about FP/s service offerings were corroborated by the
views of one of the key informants (R-2) who observed that therapists in FP/s organizations

185
engage in fewer sales of ancillary services and of services that are perceived to have only
marginal utility from the patient’s health perspective than larger corporate organizations would.
Another key informant (P-9) explained that smaller organizations were more likely to be “hands-
on” in their therapeutic approach, with less involvement of equipment and different modalities,
resulting in a smaller variety of services being offered. The corollary was also pointed out by two
key informants (P-1, R-2): because of their narrower focus, FP/s providers could not offer a
continuum of services. This may have implications in the future, if revenue sources require the
capacity for providers to deliver a broader range of services, as the WSIB and the MVA insurers
do in the case of their Programs of Care and Pre-Approved Frameworks (Chapter 5, sections
5.1.1.8 and 5.1.1.9).
6.2.2 Mix of patients
Another dimension on which theory and the literature suggests that there should be
differences between FP and NFP providers is the kinds of patients they seek out and treat. In
general, theory suggests that FP providers, in circumstances of tight control of health care
spending, will seek out patients whose problems are less complex and NFP provider
organizations, for a variety of reasons, will seek out other patients whose needs – including those
that are complex – are not addressed by FP providers.
For the purposes of this part of the study, broad ‘areas of practice’ drawn from Question
6 of the survey of physiotherapy organizations were used to assess the kinds of patients that
various provider organizations served. Respondents to the survey reported the proportion of their
patients in each of the categories. Table 6-9 illustrates the distribution of areas of practice across Table 6-9: Mean percentage makeup of practice areas, by all providers and by strategic providers groups
All FP/c FP/s NFP
Hospital Other NFP n=331 n=40 n=220 n=42 n=29 Orthopaedic and musculoskeletal 53.2% 54.4% 56.8% 52.1% 26.1% Sports medicine 12.7% 15.7% 13.4% 2.1% 18.8% Arthritis 12.6% 11.0% 12.8% 9.8% 16.5% Neurology/neurotrauma patients 8.2% 3.9% 7.7% 11.3% 14.0% Other 5.0% 1.0% 4.5% 4.9% 14.3% Prevention, health promotion 3.4% 11.3% 2.2% 1.6% 4.5% Cardiology & respirology 2.2% 0.6% 0.5% 11.8% 3.2% Women's health 1.1% 0.5% 1.4% 0.5% 0.1% Palliative 1.0% 1.1% 0.5% 3.4% 1.0% Amputees 0.5% 0.2% 0.3% 1.9% 0.7% Mental health 0.3% 0.4% 0.2% 0.6% 0.8% Source: Survey of Physiotherapy Provider Organizations, Question 6

186
all the organizations and the distribution of practice areas by strategic provider groups.
While the FP/c, FP/s and NFP Hospitals looked roughly similar across the practice areas,
the Other NFP provider group did not. The Other NFP group had a more even distribution of
practice areas than a concentration in any one area. One strand of not-for-profit theory suggests
that different groups of social entrepreneurs have gathered to meet different needs in different
niches that are not met by other providers. What appears from this composite picture of the Other
NFP group is that there was either diversity of practice areas and less concentration across the
providers in this group, or subgroups of Other NFP providers specialized in different areas.
A Kruskal-Wallis analysis of the differences in the mean number of practice areas for
each strategic provider group was undertaken to assist with this question about the Other NFP
provider group as well as more general issues across all groups. The descriptive statistics are
provided in Table 6-10, and the results of the analysis of variance appear in Table A6-5 of
Appendix 16. Table 6-10: Descriptive statistics of the number of provider organizations’ practice areas, by all providers and by strategic provider group
n Mean 95% CI
SE Median SD Min Max Lower Upper FP/c 40 3.60 3.08 4.12 .26 3.00 1.63 1 8 FP/s 221 3.43 3.23 3.62 .10 3.00 1.48 1 9 NFP Hospital 42 5.19 4.58 5.80 .30 5.00 1.97 1 9 Other NFP 29 3.79 3.00 4.59 .39 4.00 2.09 1 8 All 332 3.70 3.52 3.89 .09 4.00 1.72 1 9 Source: Survey of Physiotherapy Provider Organizations, Question 6
Other NFP groups were statistically indistinguishable from FP/c and FP/s provider
groups in the number of practice areas, and the number of practice areas for each of these groups
was significantly lower than the number of NFP Hospitals’ practice areas. This clarifies that
Other NFP providers did not individually serve a larger variety of patients than providers in the
FP groups; instead, the wide variety of patients appears to have been a result of greater diversity
across Other NFP providers: collectively, they served a wider array of patients and concentrate
less in specific areas, particularly orthopaedics and musculoskeletal patients, than the other
provider groups.
In the previous section, one of the findings was the wide variety of services, both
common and ancillary, offered by FP/c providers. A reason for that wide service offering might
have been that these organizations served a wider range of patients with fundamentally different
needs. Here, it has been found that they served no greater variety of patients than other strategic
187
provider groups. Thus, the competitive strategy for FP/c providers therefore appears to have been
to diversify service offerings to increase the possibility of cross-selling rather than to diversify
patient type. (Subsequent sections will examine the degree to which FP/c provider groups deal
with the same or different types of patients.) On the other hand, the FP/s provider groups served
a similarly narrow group range of patients but their competitive strategy in serving this group
was not to offer a wider variety of services; instead, they focused fewer services on similar
numbers of types or groups of patients.
As with their greater variety of ancillary services than other strategic provider groups,
and consistent with their broader mandate as hospitals, NFP Hospitals also served a wider variety
of patients than the other provider groups. They appear therefore to have diversified their service
offerings and to have had a diversity of patients, unlike the FP/c providers who increased the
variety of services for a smaller variety of patient types.
The mix of patients across all strategic provider groups was undoubtedly influenced by
the revenue sources and the structure of their payment schemes. Certainly, the NFP Hospital
provider group is highly influenced by the mandate from the MOHLTC to provide a broad
spectrum of care. However, as was discussed in Chapter 5, sections 5.2.5 and 5.3, there were few
differences between the major revenue sources of the FP/c and FP/s provider groups. There was
no significant difference in the mean number of revenue sources that each relied on, and there
were only minor differences in the actual revenue sources that each strategic provider group
accessed. For example, FP/c providers differentiated themselves from FP/s providers with a
somewhat greater emphasis on WSIB patients and FP/s providers concentrated more on patients
who paid out of pocket than FP/c providers, but in general, their revenue sources were similar.
Thus, the finding that there is a difference in the breadth of the service offerings between the two
FP groups is significant.
As for Other NFP providers, the discussion in section 5.2.5 concluded that their profile of
revenue sources was similar to FP providers, as was the mean number of revenue sources the
provider organizations relied on, though they had fewer MVA patients and a greater variety of
other revenue sources. Thus, they are similar to FP organizations in the number of different
patient groups they individually serve, but there is considerably more variation across all Other
NFP organizations.
With respect to the actual patient groups served, Table 6-7 illustrates that patients with
orthopaedic and musculoskeletal problems constitute the largest mean proportion of patients
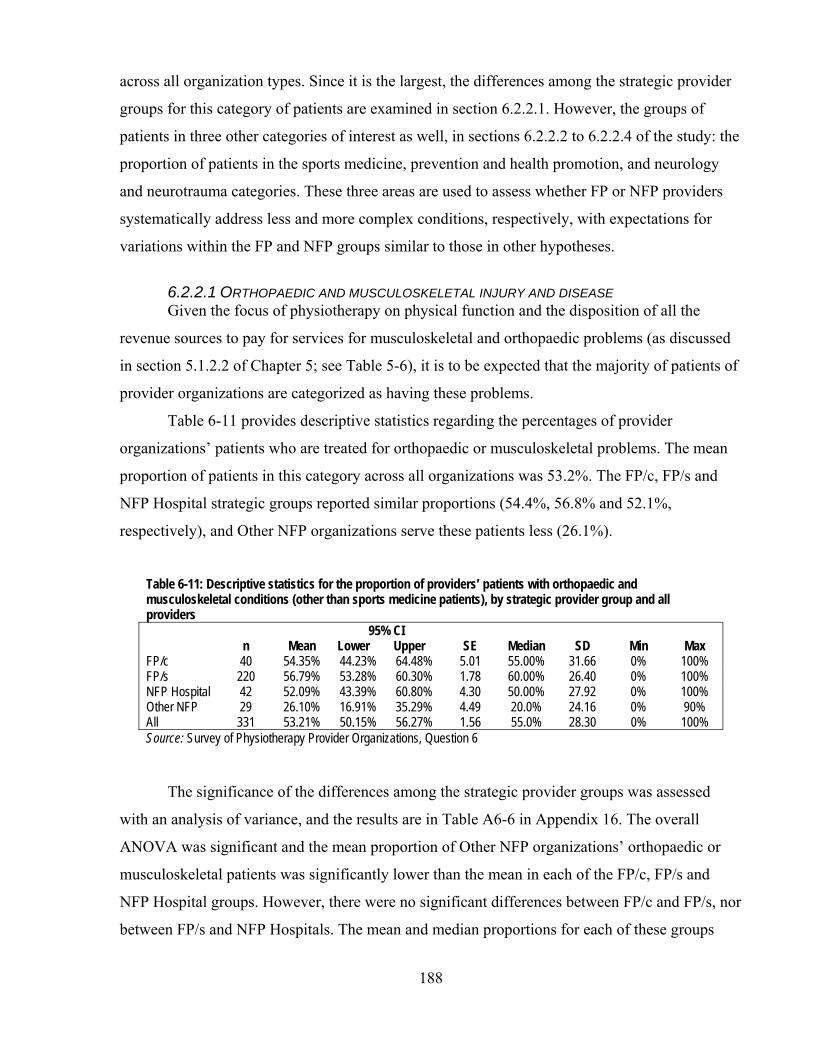
188
across all organization types. Since it is the largest, the differences among the strategic provider
groups for this category of patients are examined in section 6.2.2.1. However, the groups of
patients in three other categories of interest as well, in sections 6.2.2.2 to 6.2.2.4 of the study: the
proportion of patients in the sports medicine, prevention and health promotion, and neurology
and neurotrauma categories. These three areas are used to assess whether FP or NFP providers
systematically address less and more complex conditions, respectively, with expectations for
variations within the FP and NFP groups similar to those in other hypotheses.
6.2.2.1 ORTHOPAEDIC AND MUSCULOSKELETAL INJURY AND DISEASE Given the focus of physiotherapy on physical function and the disposition of all the
revenue sources to pay for services for musculoskeletal and orthopaedic problems (as discussed
in section 5.1.2.2 of Chapter 5; see Table 5-6), it is to be expected that the majority of patients of
provider organizations are categorized as having these problems.
Table 6-11 provides descriptive statistics regarding the percentages of provider
organizations’ patients who are treated for orthopaedic or musculoskeletal problems. The mean
proportion of patients in this category across all organizations was 53.2%. The FP/c, FP/s and
NFP Hospital strategic groups reported similar proportions (54.4%, 56.8% and 52.1%,
respectively), and Other NFP organizations serve these patients less (26.1%).
Table 6-11: Descriptive statistics for the proportion of providers’ patients with orthopaedic and musculoskeletal conditions (other than sports medicine patients), by strategic provider group and all providers
n Mean 95% CI
SE Median SD Min Max Lower Upper FP/c 40 54.35% 44.23% 64.48% 5.01 55.00% 31.66 0% 100% FP/s 220 56.79% 53.28% 60.30% 1.78 60.00% 26.40 0% 100% NFP Hospital 42 52.09% 43.39% 60.80% 4.30 50.00% 27.92 0% 100% Other NFP 29 26.10% 16.91% 35.29% 4.49 20.0% 24.16 0% 90% All 331 53.21% 50.15% 56.27% 1.56 55.0% 28.30 0% 100% Source: Survey of Physiotherapy Provider Organizations, Question 6
The significance of the differences among the strategic provider groups was assessed
with an analysis of variance, and the results are in Table A6-6 in Appendix 16. The overall
ANOVA was significant and the mean proportion of Other NFP organizations’ orthopaedic or
musculoskeletal patients was significantly lower than the mean in each of the FP/c, FP/s and
NFP Hospital groups. However, there were no significant differences between FP/c and FP/s, nor
between FP/s and NFP Hospitals. The mean and median proportions for each of these groups

189
were at least 50% whereas the mean and median proportions of the Other NFP organizations
were each about half of the other groups’.
The available data did not differentiate between levels of complexity in this category of
patients, and undoubtedly there are differences if not between provider organization types then
between individual provider organizations. Cott et al.396 found, however, that patients with acute
musculoskeletal conditions were less likely to receive physiotherapy services from organizations
in Ontario that receive public funds for their services. In this study, as was illustrated in Chapter
3 using Landry’s28 model, this means NFP Hospitals, some Other NFP, and a very small number
of FP/s. Cott et al. also found that patients with chronic musculoskeletal problems and general
debility were four times more likely to be treated in settings that receive public funding.
The proportions of patients of the Other NFP providers show, however, that there were
other practice area or patient mixes possible and necessary in this market. However, such mixes
may have resulted only when there was the kind of specific orientation to specialized or
underserved patient groups that the literature and theory suggest arise in NFP provider
organizations. The different mix also was likely related to the wider range of revenue sources
that Other NFP providers as a group receive (section 5.3.2, Chapter 5); they as a group did not
rely on single revenue sources as heavily as other strategic provider groups did and so their
patient mix was also less concentrated on specific patient groups.
6.2.2.2 SPORTS MEDICINE A potential indicator of differences among strategic provider groups regarding types of
services relates to sports medicine. While sports medicine patients may present initially with
significant injuries, they are on the whole relatively healthy, have few co-morbidities, and are in
a good state of physical fitness. They are also generally highly motivated to work on their
rehabilitation. For example, one FP sports medicine clinic in Toronto, Toronto Sports & Exercise
Medicine Institute (SEMI), promoted its services on its website with the following testimonial:397
In February 2005, I slipped on some ice fracturing my left upper arm at the shoulder. My life changed in an instant and three weeks later, I had undergone major surgery to the shoulder and remained in a sling for 7 weeks. When I was ready for rehabilitation, I wanted to consider a clinic that was not only convenient but a clinic that would help me to focus on getting back to optimal health so I could play golf and ski again. This is very important to me as I have been very active in those two sports. I picked SEMI. Presently I am receiving physiotherapy, chiropractic and massage therapy. Each of these health professionals have been working very hard to assist me back to optimal health with the goal that I will be playing recreational sports once again. Because of their commitment to my health,

190
I am pleased to say that I have been able to get out on the links sooner than expected and the surgeon is pleased with my progress. At this point, I will not require further surgery.
Theory and the literature would predict that FP providers, especially FP/c providers,
would offer sports medicine services because, focusing on patients who are healthier than most,
it is relatively less complex than other potential services. Table 6-12 provides the descriptive
statistics for the proportion of sports medicine patients for each of the strategic provider groups.
Table 6-12: Descriptive statistics for the proportion of providers’ patients in the practice area of sports medicine, by strategic provider group and all providers
n Mean 95% CI
SE Median SD Min Max Lower Upper FP/c 40 15.73% 8.19% 23.27% 3.72 10.00% 23.57 0% 100% FP/s 220 13.41% 11.27% 15.57% 1.09 10.00% 16.18 0% 85% NFP Hospital 42 2.14% 0.53% 3.75% 0.79 0.00% 5.15 0% 20% Other NFP 29 18.83% 5.78% 31.88% 6.37 0.00% 34.30 0% 100% All 331 12.74% 10.68% 14.80% 1.04 5.00% 19.01 0% 100% Source: Survey of Physiotherapy Provider Organizations, Question 6
The most obvious observation is that NFP Hospitals, with a mean proportion of 2.1% of
patients, were not involved in sports medicine to the extent that the other provider groups were:
the mean proportion of such patients in the FP and Other NFP groups was at least six times that
of the NFP Hospital group. However, it must be noted that the range of the proportion of sports
medicine patients was very large in the FP/c, FP/s and Other NFP groups (100%, 85% and
100%, respectively) and the median proportion of patients in the FP groups was 10% and 0% in
both the NFP groups.
To assess whether the differences in the proportions of sports medicine patients among
the organization types was statistically significant, a Kruskal-Wallis one-way ANOVA was
undertaken. The results are in Table A6-7 in Appendix 16. Overall, the ANOVA was significant
and the proportion of sports medicine patients across NFP Hospital provider organizations was
significantly different than those of the FP/c and FP/s strategic provider groups, but different not
from the proportions of Other NFP providers. The proportions for the FP/c and FP/s providers
groups, FP/c and Other NFP provider groups, and FP/s and Other NFP provider groups were not
significantly different, though as noted, there was a substantial range of proportions in each of
these groups, signalling that there was a range of competitive strategies employed within each
group.

191
The results were as expected with respect to the FP providers as compared to the NFP
Hospitals. Though hospitals likely see very seriously injured sports medicine patients for the
acute phase of their injuries (for example, for any necessary surgery), those patients did not make
nearly as significant a portion of the patients of the hospitals’ physiotherapy departments or
rehabilitation units as other patients did. This reflects an observation by three key informants (P-
1, P-2, P-3) that privately-insured patients are less likely to be treated by hospital physiotherapy
departments than those who do not have such private insurance. With their global budgets, NFP
Hospitals have an incentive to shed patients when possible, and certain patients’ access to private
insurance provides an opportunity that does not affect their access to care. It seems likely that
patients in need of sports medicine services would be active post-secondary students, persons of
working age and retired persons. Each of these groups generally has access to insurance plans
that pay at least part of the cost of sports medicine treatment (section 5.2, Chapter 5), and so,
when NFP Hospitals have these sorts of acute care patients who could benefit from sports
medicine treatment, they are likely to be referred to providers outside the hospital.
Unexpectedly, the NFP organizations as a group attracted as big a proportion of their
patients from this pool of easier-to-treat patients as the FP organizations did. However, there was
a wide distribution of the proportion of sports medicine patients among the other NFP providers.
As noted, the median proportion of sports medicine patients was 0%, indicating that a minority
of Other NFP providers appear to have been responding to a demand for sports medicine services
that FP providers could have been expected to respond to but did not.
6.2.2.3 PREVENTION AND HEALTH PROMOTION Another area in which there is less complexity in general is in the area of prevention and
health promotion. These services are delivered to people who have not yet been injured, or who
are working on preventing their next injury. Prevention and health promotion is an area that has
had long policy support398 but no so much financial support. In the Ontario government, a
Ministry devoted to Health Promotion was established in June, 2005, and there a law was
recently passed by the Ontario Legislature to create a new Agency for Health Protection and
Promotion.280 As discussed in Chapter 2, section 2.4.2.4, professional associations are supportive
of services in this area and so it can be expected that there will be such services offered in the
market, but theory and logic suggest that FP providers are likely to be more involved in this low-
complexity niche than NFP providers are.
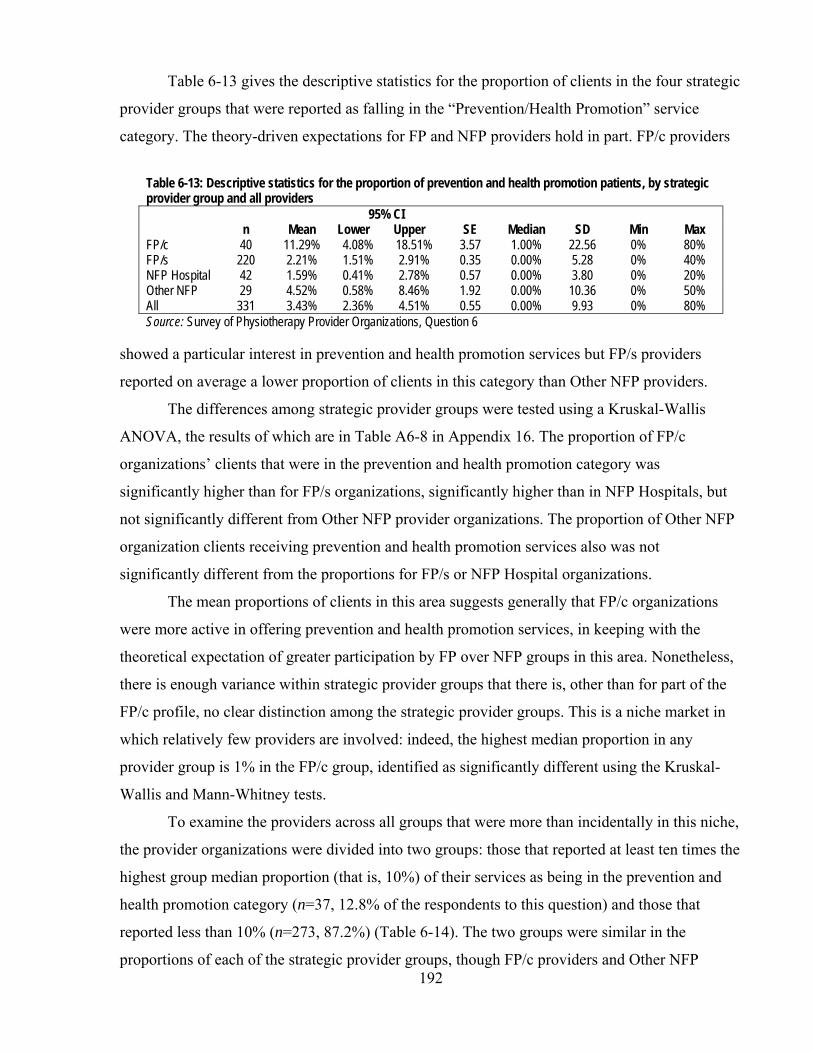
192
Table 6-13 gives the descriptive statistics for the proportion of clients in the four strategic
provider groups that were reported as falling in the “Prevention/Health Promotion” service
category. The theory-driven expectations for FP and NFP providers hold in part. FP/c providers
Table 6-13: Descriptive statistics for the proportion of prevention and health promotion patients, by strategic provider group and all providers
n Mean 95% CI
SE Median SD Min Max Lower Upper FP/c 40 11.29% 4.08% 18.51% 3.57 1.00% 22.56 0% 80% FP/s 220 2.21% 1.51% 2.91% 0.35 0.00% 5.28 0% 40% NFP Hospital 42 1.59% 0.41% 2.78% 0.57 0.00% 3.80 0% 20% Other NFP 29 4.52% 0.58% 8.46% 1.92 0.00% 10.36 0% 50% All 331 3.43% 2.36% 4.51% 0.55 0.00% 9.93 0% 80% Source: Survey of Physiotherapy Provider Organizations, Question 6
showed a particular interest in prevention and health promotion services but FP/s providers
reported on average a lower proportion of clients in this category than Other NFP providers.
The differences among strategic provider groups were tested using a Kruskal-Wallis
ANOVA, the results of which are in Table A6-8 in Appendix 16. The proportion of FP/c
organizations’ clients that were in the prevention and health promotion category was
significantly higher than for FP/s organizations, significantly higher than in NFP Hospitals, but
not significantly different from Other NFP provider organizations. The proportion of Other NFP
organization clients receiving prevention and health promotion services also was not
significantly different from the proportions for FP/s or NFP Hospital organizations.
The mean proportions of clients in this area suggests generally that FP/c organizations
were more active in offering prevention and health promotion services, in keeping with the
theoretical expectation of greater participation by FP over NFP groups in this area. Nonetheless,
there is enough variance within strategic provider groups that there is, other than for part of the
FP/c profile, no clear distinction among the strategic provider groups. This is a niche market in
which relatively few providers are involved: indeed, the highest median proportion in any
provider group is 1% in the FP/c group, identified as significantly different using the Kruskal-
Wallis and Mann-Whitney tests.
To examine the providers across all groups that were more than incidentally in this niche,
the provider organizations were divided into two groups: those that reported at least ten times the
highest group median proportion (that is, 10%) of their services as being in the prevention and
health promotion category (n=37, 12.8% of the respondents to this question) and those that
reported less than 10% (n=273, 87.2%) (Table 6-14). The two groups were similar in the
proportions of each of the strategic provider groups, though FP/c providers and Other NFP

193
providers were slightly over-represented and FP/s and NFP-Hospitals slightly under-represented
in the group offering more prevention and health promotion services that in the general sample.
Table 6-14: Characteristics of providers with more and less than 10% of their clients receiving prevention and health promotion services (PHPS) Providers with less
than 10% PHPS clients
Providers with 10% or more PHPS
clients n=273 n=37 FP/c 12.1% 16.2% FP/s 67.0% 64.9% Hospitals 13.2% 11.95% Other NFPs 7.7% 8.7% Total 100.0% 100.0% Source: Survey of Physiotherapy Provider Organizations, Question 6
The revenue sources of the two groups were examined with particular emphasis on private
insurance and out of pocket spending since they were identified in section 5.1.2.2 in Chapter 5 as
having the greatest likelihood of being connected with health promotion. The two groups were
not statistically different with respect to the proportion from any revenue source except for out of
pocket expenditures (Table 6-15). Those with more than 10% of their clients receiving
prevention and health promotion services received a mean of 18.87% of their revenue directly
from their clients, while a mean of 9.71% of the revenue was out of pocket for those providers
with less than 10% of prevention and health promotion clients. While this does not establish a
general relationship between the receipt of out of pocket revenues and prevention and health
promotion services, it does strongly suggest that among providers who provide more prevention
and health promotion services, there are organizations that derive significantly greater proportion
of their revenue from their patients directly than providers who deliver fewer such services. As
several key informants (P-1, P-2, P-3, P-4, P-8, P-9, P-10, O-1, O-2) pointed out, the provision of
services to preserve and enhance health status among patients who have no specific injury or
disease is an area for potential growth, but they emphasized that insurers in general do not cover
these kinds of services. They said that providers’ success in offering in these services depends on
patients’ interest in, ability and willingness to pay for their own care.
6.2.2.4 NEUROLOGY AND NEUROTRAUMA To measure any differential approach by different provider organizations to patients with
more complex conditions, this study also examined providers’ involvement in the area of
neurology and neurotrauma. Conditions commonly included in this category are brain injury and

194
spinal cord injury, and courses of treatment in this area are generally long and complex.399-402
Thus, this constituted a reasonable test of propositions about the tendency of FP providers to
avoid patients with complex problems and of NFP providers to treat them. Table 6-15: Results of 14 t-tests comparing the mean proportion of clients whose care was paid by different revenue sources, by two groups, those with more than 10% of clients receiving prevention and health promotion services (PHPS) and those with less than 10% Providers with less
than 10% PHPS clients
Providers with 10% or more PHPS
clients
Revenue source Proportion of clients t* p Out of pocket 9.71% 18.87% -2.14 .04** Private insurance 33.83% 31.82% .39 .70 Motor vehicle insurance 14.69% 14.24% .13 .90 WSIB 13.89% 12.48% .56 .58 Hospital global budget 12.27% 6.51% 1.52 .14 MOHLTC (LTC) 2.77% 5.43% -.69 .50 OHIP 6.30% 4.19% .64 .53 Employer 2.35% 3.62% -.51 .61 CCAC 3.07% 2.84% .09 .93 Schools 0.44% 1.21% -1.26 .21 Veterans Affairs 0.61% 0.49% .41 .68 Canadian Forces 0.35% 0.16% -1.18 .24 Charities 0.42% 0.00% 1.13 .26 Other 2.71% 1.35% .99 .33 * variances assumed unequal; **significant at the p<.05 level Source: Survey of Physiotherapy Provider Organizations, Questions 6 and 9
The descriptive statistics for the proportion of neurology and neurotrauma patients for
organizations in each of the strategic provider groups are provided in Table 6-16. As theory
suggests, FP/c organizations tended to be less involved in treating these patients with their
complex problems, and the Other NFPs appear to more involved.
Table 6-16: Descriptive statistics for the proportion of neurology/neurotrauma patients, by strategic provider group and all providers
n Mean 95% CI
SE Median SD Min Max Lower Upper FP/c 40 3.89% 0.78% 7.00% 1.54 0.00% 9.71 0% 50% FP/s 220 7.67% 4.98% 10.34% 1.36 0.00% 20.16 0% 100% NFP Hospital 42 11.26% 6.76% 15.77% 2.23 8.00% 14.46 0% 57% Other NFP 29 14.01% 6.82% 21.20% 3.51 5.00% 18.91 0% 70% All 331 8.21% 6.21% 10.22% 1.02 0.00% 18.54 0% 100% Source: Survey of Physiotherapy Provider Organizations, Question 6
To assess whether the differences in the proportion of neurology and neurotrauma
patients among the organization types was statistically significant, a Kruskal-Wallis ANOVA
was undertaken. The results are in Table A6-9 in Appendix 16. Overall, the ANOVA was
significant, and the proportions of these patients treated by FP providers were not significantly
195
different from each other, but each of them was significantly different from the proportions
treated by each of the NFP provider groups. Similarly, the proportions of patients served by each
of the NFP provider groups were not significantly different. The mean proportion of neurology
and neurotrauma patients across FP/c and FP/s organizations was between one-third and two-
thirds of the proportion in the NFP groups. Furthermore, the median proportion in the FP groups
was 0% while it was 8% in the NFP Hospital group and 5% in the Other NFP group.
This suggests that though there clearly are differences in the proportion of clients with
neurology and neurotrauma conditions among all provider organizations, the expected
differences between FP and NFP providers were found.
The analysis in section 5.1 in Chapter 5 showed that the revenue sources that would most
likely pay for treatment for neurological and neurotrauma injuries are global hospital budgets,
MVA insurance, WSIB, private insurance and out of pocket. Clearly, the global budgets are
providing the means for NFP Hospitals to have a higher proportion of their patients in this
category than other providers, and NFP Hospitals may also have some revenue from WSIB for
these patients as well. The FP provider groups had a significantly higher proportion of their
revenue from MVA insurance and WSIB than the other strategic provider groups, but FP
providers have on average a lower proportion of neurology/neurotrauma patients. Thus, they
appear to be relying on the MVA and WSIB patients with less complex conditions than the NFP
providers whose proportions of neurology and neurotrauma patients is higher.
Nonetheless, it is important to recall that not all FP providers avoid these patients; the
data in Table 6-16 illustrate that some FP/c providers have as much as 50% of their patients in
this category, and some FP/s providers specialize entirely in this patient group.
What might explain the wide variation in proportion of patients with neurology and
neurotrauma patients across the strategic provider groups? In NFP Hospitals, inpatient neurology
and neurotrauma programs likely drive physiotherapy offerings in this area. For the other
providers, key informants (P-4, P-8, O-2, O-4, R-2) indirectly suggested that the preferences of
individual therapists drive their specialization decisions. They undertake additional training,
often at their own expense, to be able to treat patients with specific conditions and once trained,
they seek out these sorts of patients. It therefore seems plausible that the decision of any provider
organization, other than NFP Hospitals, to specialize in treating these sorts of patients is the
result of the desires of individual therapists or the owners of the physiotherapy organizations,

196
driven by their particular professional interests and specialties, as well as the willingness of
revenue sources to pay for services.
6.3 Wait lists
It is commonly observed that FP providers ration care, or control their patient intake, by
their setting of prices, and NFP providers ration care by imposing wait lists. However, there were
relatively few wait lists for service reported by provider organizations that responded to the
survey. Of the 340 organizations that answered the question about wait lists, 246 or 72.4% said
that they had no waiting list (Table 6-17).
Table 6-17: Reported length of wait lists, all respondents Length of wait list Proportion of respondents No wait list 72.4% Up to 1 week wait list 5.3% 1-2 week wait list 5.6% 2-4 week wait list 7.4% More than 4 week wait list 9.4% Source: Survey of Physiotherapy Provider Organizations, Questions 19 and 19a
This included 83.7% of FP/c providers, 79.6% of FP/s providers, 25.0% of NFP Hospitals and
66.7% of Other NFP providers. Figure 6-2 illustrates the distribution of wait list reports across
the strategic provider groups, and Table 6-18 provides descriptive statistics. These make it clear
that NFP providers have on average the longest wait lists, with NFP Hospitals averaging the
longest of the NFP providers but with the Other NFP significant differences among the other
groups. The results are reported in Table A6-10 in Appendix 16.
The fact that there were so few waiting lists is notable in itself. Despite projections of
increasing needs for physiotherapy services (section 4.4 in Chapter 4), the current providers
seem to be able to provide at roughly the level of demand, without imposing delays in service. It
is important to note, however, that while in NFP Hospitals part of the difference between need
and expressed demand is represented by the waiting lists – in four out of 10 such hospitals, waits
for service exceed four weeks and in only one in four is the wait less than a week – in the other
strategic groups, access may be modulated by the requirements to pay and by the terms and
conditions of insurers’ payment schemes. Cott et al.396 found, for example, that 85.6% of the
Ontario physicians they surveyed perceived the greatest barrier to their patients’ access to
rehabilitation was the cost of services when the patient (or the patient’s insurer) would be

197
Table 6-18: Descriptive statistics for the reported length of wait lists, in weeks, for physiotherapy services, by strategic provider group and all providers
n Mean 95% CI
SE Median SD Min Max Lower Upper FP/c 39 0.49 0.09 0.90 0.20 0.00 1.25 0.0 5.0 FP/s 227 0.52 0.34 0.70 0.09 0.00 1.35 0.0 10.0 NFP Hospital 41 6.78 4.29 9.27 1.23 4.00 7.88 0.0 36.0 Other NFP 32 3.81 0.25 7.39 1.75 0.00 10.06 0.0 52.0 All 340 1.59 1.08 2.10 0.26 0.00 4.79 0.0 52.0 Source: Survey of Physiotherapy Provider Organizations, Question 19 and 19a
required to cover the cost. But Landry et al.178 found that in almost three-quarters of the patients
receiving treatment at an OHIP designated clinic had private insurance or were able to pay for
their care when the public funding was withdrawn. Consequently, physicians’ perspectives may
be leading to ‘under-referrals’ to FP/c and FP/s organizations with private insurance revenues
and ‘over-referrals’ to NFP Hospitals and designated clinics (some, FP/s organizations) with
OHIP revenues, resulting in shorter and longer queues, respectively.
For the purposes of this study, the most important observation is that, if they have to wait
for physiotherapy services, patients in NFP Hospitals are more likely to wait and wait longer
than patients in other settings. Unexpected, however, were the results from the Other NFP
Source: Survey of Physiotherapy Provider Organizations, Questions 19 and 19a
82.0% 79.7%
24.4%
69.7%
7.0%7.7% 5.7%
4.9%
5.1% 4.8%
24.4%
6.1%43.9%
21.2%
2.6%
0.0%
2.4%
3.0%
2.6%2.6%
0%
10%
20%
30%
40%
50%
60%
70%
80%
90%
100%
FP/c FP/s NFP-Hospital Other NFP
Prop
ortio
n of
resp
onde
nts
No wait list Up to 1 week wait 1-2 weeks 2-4 weeks More than 4 weeks
Figure 6-2: Proportion of each strategic provider group reporting wait lists of different lengths

198
strategic provider group, where there was no statistically significant difference in the length of
waiting lists from the FP providers. Within this category, there is a wide variation in the length
of the wait lists, with some provider organizations with little or no waiting time and one with a
wait list of a year.
In the survey of physiotherapy provider organizations, one of the questions was this:
19b. If you have a wait list, do you suggest clients go to other providers with a shorter wait list?
The responses to Question 19b provide some insight into the behavior of providers when
faced with the possibility of referring their patients to another provider with no wait list, or a
shorter one.
The number of survey respondents who answered this question was less than half of all
respondents (n=140), but this was larger than the number that had a wait list at the time they
responded to the survey (n=91).
Table 6-19 illustrates the reported propensity to refer patients to another provider in the
face of a wait list. Among the providers who responded to this question, the FP providers – along
with the Other NFP providers – were less inclined to refer patients to another setting when they
had a wait list. A greater proportion of NFP Hospitals (which had the longest mean wait times)
said they referred patients to other providers in the face of wait lists. This is clearly consistent
with the incentive inherent in hospitals’ global budgets – encouraging them to shed patients
when possible in the face of financial constraints.
Table 6-19: Providers’ stated propensity to refer patients to another provider organization in the face of a wait list, by strategic provider group n Never refer Sometimes refer Always refer FP/c 14 42.9% 50.0% 7.1% FP/s 80 32.5% 48.8% 18.8% NFP Hospital 32 15.6% 46.9% 37.5% Other NFP 14 30.0% 49.3% 20.7% Source: Survey of Physiotherapy Provider Organizations, Question 19b
It should be noted that there may be differences in the ranges of alternative providers to
whom patients can be referred. In some cases, there may be a limitation because of the first
provider’s specialization. For example, some of Other NFP organizations specialize in providing
services in long-term care homes, and referrals to others are not possible because of payer
restrictions. Similarly, providers under contract to CCACs also would not be able to refer

199
patients to other providers. However, NFP Hospitals were clearly identifying opportunities for
patients, presumably with private insurance, to avoid long waits by going elsewhere.
6.4 Overview of findings in this chapter
After this review of several different perspectives on competition, services, patients
served, and wait lists, what are the general observations?
Findings regarding Hypothesis 1(d) First, there was no indication that NFP Hospitals as a group regarded themselves as
subject to competitive forces: more than half said they face “no competition”. Nor did other
providers feel pressure from NFP Hospitals; if anything, other providers regarded providers in
the FP/c and FP/s groups as key competitors, and competitive pressure was felt most in areas of
higher density of physiotherapists working in FP organizations. In addition, FP/c providers posed
a competitive threat in the market among FP/c, FP/s and Other NFP providers out of proportion
to their prevalence in the market. Furthermore, higher perceptions of competition were
associated with higher dissatisfaction with patient mix.
Findings regarding Hypothesis 1(e) While FP/c providers did not see NFP Hospitals as their competitors, they offered more
common services and the same number of ancillary services as these larger organizations (and
more than the other groups). While FP/s providers felt competitive pressures as much as FP/c
providers, in distinct contrast to the FP/c providers, the FP/s providers on average provided fewer
services than FP/c providers as well as the other strategic provider groups. The strategy of FP/s
providers was therefore to offer fewer common and ancillary services than FP/c providers, but to
as wide a variety of patient types.
NFP Hospitals had a different strategy in this market than the other groups. They offered
as broad an array of services overall as FP/c providers – a narrower range of common services
but as many ancillary services as FP/c providers. While NFP Hospitals’ and FP/c providers’
general approach to the marker was similar, their actual service offerings differed.
The Other NFP group emerged as a heterogeneous group with respect to services; with
respect to the number of services, they resembled NFP Hospitals – fewer common services than
FP/c providers but as many ancillary services. As with FP/c providers, however, their actual
service offerings were different from NFP Hospitals’.

200
Findings regarding Hypothesis 1(f) The FP/c providers tended to focus as a group on patients with less complex problems
than NFP Hospitals, though a minority of individual FP/c providers, driven by the expertise and
interest of individual therapists, did focus on the more complex patients. Surprisingly, though,
FP/c providers had not pursued the less complex sports medicine portion of the market as fully as
they might have done; certain Other NFP providers concentrated in this area more than FP/c
providers.
In the specific areas of practice discussed, FP/s providers appeared to be very similar to
FP/c providers with respect to the proportion of their patients with orthopaedic and
musculoskeletal conditions and neurology and neurotrauma, but they were less involved in sports
medicine and prevention and health promotion. NFP Hospitals tended to concentrate on
orthopaedic and musculoskeletal conditions (like the FP providers), but they provided more
physiotherapy services to patients with complex problems, and fewer less complex problems.
The Other NFP group resembled NFP Hospitals in their interest in patients with complex
conditions and they resembled FP providers in their interest in the sports medicine niche. But
they were clearly different from the other groups – in the relatively small proportion of their
patients with musculoskeletal and orthopaedic patients, the ‘bread and butter’ of other
organizations.
Findings regarding Hypothesis 1(g) Both FP/c and FP/s provider groups had very little in the way of wait lists. The NFP
Hospitals had the longest wait lists and they tended to refer patients to other providers more than
any of the other strategic provider groups.
General comments The view of the rivalry among the strategic provider groups that emerges from the
analysis in this chapter is not simple. While strategic provider groups do conform to expectations
in some aspects of their business, confirming that different competitive strategies are being used
by each of the strategic groups in this market, in other parts of their business, they seem to
converge. The net result from this consideration of service types is that profit orientation and
corporate form of providers do appear to have a place in determining the competitive strategy of
providers, but factors like the personal preferences of individual therapists and the terms and
conditions of revenue sources are also influential. As well, while in previous chapters the
differences between FP/c and FP/s providers seemed relatively modest, the findings in this

201
chapter suggest different approaches to the market. FP/c providers appear to have been more
actively seeking out opportunities for cross-selling and offering a wider range of purchase
options than FP/s providers. The competitive strategy of FP/s was to emphasize the
fundamentals, or core, of physiotherapy services, with greater emphasis on provision by
registered physiotherapists (section 4.4.3, Chapter 4).
Findings regarding Hypothesis 3(b) It was hypothesized in Chapter 2 that referral sources would have little effect on the
structure of provider organizations if patients have a right of direct access to the dominant health
profession. While patients have had this direct access to registered physiotherapists since 1991,
the data collected in this study suggest strongly that the profession’s historical ties with
physicians have survived the acquisition of direct access rights, and relationships between
provider organizations and referring physicians are very important. Since physicians in this
period were mostly organized as small practices, FP/s provider organizations with local contacts
had the competitive advantage in this area; FP/c organizations mimicked FP/s organizations in
their approach to referral sources. This assisted in the predominance of the FP/s organizational
form in the market.
The analysis of rivalry among providers in the physiotherapy market gives some
perspectives on the structure of the market and the relative positioning of the various strategic
provider groups within it. The next chapter turns to the question of entry into and exit from the
market and the question of foreign investment.

202
Chapter 7 – The threat of new entrants
This chapter reviews certain aspects of the threat of new entrants in the physiotherapy
market to address the fourth and fifth research questions concerning the characteristics of
provider organizations that survive and the penetration of foreign providers into the market.
The chapter begins in section 7.1 with a short discussion of the contestability of the
market and the identification of factors that reduce contestability. There is then a review of the
rates of entry to, exit from, and survival in the physiotherapy market and the broader
rehabilitation services market, and the sizes of the provider organizations. There is also an
investigation of the contribution to provider organizations’ survival of certain strategies to deal
with labour supply and patient supply. These discussions allow a test of Hypotheses 4(a) and (b)
concerning the consolidation over time of provider organizations into a smaller number of
corporately-owned organizations and certain strategies regarding significant barriers to entry that
surviving provider organizations adopted.
The issue of foreign investment is addressed by examining the ownership of the insurers
and providers in the market, using data from such sources as the insurers’ trade associations, the
survey of physiotherapy organizations, certain corporate filings with the U.S. Securities and
Exchange Commission, and the views of key informants. This allows a test of Hypothesis 5, that
there was a significant presence of foreign corporate providers and insurers in the market
because there are no special provisions in trade treaties to protect domestic providers and foreign
providers have significant experiential and financial advantages over domestic providers.
General observations about the threat of new entrants in the physiotherapy market are
made at the end of the chapter.
7.1 Survival in the physiotherapy market
In the previous chapters, many aspects of the market have been discussed that affect the
contestability of the market.
With respect to the production of physiotherapy services, most physiotherapy services in
the market are ambulatory, usually associated with high contestability and low entry and exit
barriers. While in some cases in this market it is necessary to establish a new business location
for a physiotherapy organization with more costly amenities to meet the expectations of certain
patient groups (P-2), it is also possible for therapists to operate with very little equipment (P-4,
P-5). While not great, operational costs for ambulatory physiotherapy services vary according to

203
location, for example, the cost of rental or ownership of premises differs considerably between
urban (especially Toronto) locations and rural (P-2, P-5, P-9). Of course, some physiotherapy
services are offered on an inpatient basis, and the costs to establish and run those services are
more than in an ambulatory setting.
Chapter 5 identified certain revenue sources, like private insurance, out of pocket and
WSIB, that are relatively inexpensive to secure, while certain other revenue sources can be
somewhat more costly or difficult to gain access to. The roster of OHIP designated clinics and
hospitals eligible for global budgets are closed, but most other sources are open to all providers.
Nonetheless, gaining access to revenue sources also generally means gaining access to referral
sources, primarily through family physicians, and as discussed in Chapter 6, section 6.2.4, there
are a variety of ways to accomplish this. Personal contact and building relationships are the most
common. While these can be time consuming, financial incentives for referrals have been
prohibited by the College of Physiotherapists of Ontario.
With respect to labour inputs, as was discussed in Chapter 4, the use of non-registered
physiotherapists to provide physiotherapy services is not prohibited by law (as long as they do
not call themselves “physiotherapists”). Nonetheless, the majority of provider organizations
responded to the terms and conditions of most revenue sources and predominantly use registered
physiotherapists to provide physiotherapy services. As discussed in Chapter 4, section 4.5.1,
there is keen competition among provider organizations for registered physiotherapists,
highlighting the reduced contestability in the market due to labour supply constraints.
In sum, the physiotherapy market is highly contestable overall but certain aspects pose
some difficulties for new entrants, and, as discussed in Chapter 2, section 2.1.4.1, these barriers
also pose a threat to incumbent provider organizations. Two production characteristics in this
market that reduce contestability – supply of registered physiotherapists and supply of patients –
are examined in relation to the likelihood of survival in section 7.1.2 following an examination
of entry, exit and survival rates in section 7.1.1.
7.1.1 Entry and survival rates
Table 7-1 provides information about the all-Ontario rates of entry and survival for the
organizations in the Market Participants Database between 2003 and 2005 organized in
descending order of survival rates. Of the provider organizations that existed in 2003, 80.4%
survived until 2005. The 516 or 19.6% of organizations that left the market over the time period
were replaced by 1063 or more than twice as many provider organizations so that new provider

204
Table 7-1: Ontario and county level provider organization numbers in 2003 and 2005, and exits, survival rates, net gains, net growth rate, and proportion of new provider organizations among providers existing in 2005 (in descending order of survival rate)
Provider orgns in
2003 Exit Survival
rate New
entrants Net gain Net
growth rate
Provider orgns in
2005
% of new provider
orgns Ontario 2640 515 80.5% 1061 546 20.7% 3186 33.3% Lennox & Addington 4 0 100.0% 0 0 0.0% 4 0.0% Oxford 18 0 100.0% 14 14 77.8% 32 43.8% Rainy River 2 0 100.0% 1 1 50.0% 3 33.3% Sudbury District 3 0 100.0% 1 1 33.3% 4 25.0% Renfrew 16 1 93.8% 7 6 37.5% 22 31.8% Middlesex 99 7 92.9% 36 29 29.3% 128 28.1% Ottawa 171 14 91.8% 69 55 32.2% 226 30.5% Algoma 26 3 88.5% 5 2 7.7% 28 17.9% Kenora 16 2 87.5% 6 4 25.0% 20 30.0% Durham 105 15 85.7% 37 22 21.0% 127 29.1% Prescott Russell 14 2 85.7% 2 0 0.0% 14 14.3% Timiskaming 7 1 85.7% 5 4 57.1% 11 45.5% Elgin 13 2 84.6% 6 4 30.8% 17 35.3% Grey 26 4 84.6% 11 7 26.9% 33 33.3% Perth 13 2 84.6% 6 4 30.8% 17 35.3% Wellington 39 6 84.6% 25 19 48.7% 58 43.1% Waterloo 93 15 83.9% 33 18 19.4% 111 29.7% Hamilton 145 24 83.4% 51 27 18.6% 172 29.7% Bruce 12 2 83.3% 1 -1 -8.3% 11 9.1% Frontenac 38 7 81.6% 17 10 26.3% 48 35.4% Haliburton 5 1 80.0% 0 -1 -20.0% 4 0.0% Thunder Bay 50 10 80.0% 20 10 20.0% 60 33.3% Toronto 622 125 79.9% 251 126 20.3% 748 33.6% Peterborough 34 7 79.4% 7 0 0.0% 34 20.6% Essex 76 16 78.9% 25 9 11.8% 85 29.4% Lanark 14 3 78.6% 10 7 50.0% 21 47.6% SDG 14 3 78.6% 11 8 57.1% 22 50.0% Lambton 23 5 78.3% 6 1 4.3% 24 25.0% Chatham Kent 18 4 77.8% 23 19 105.6% 37 62.2% Cochrane 22 5 77.3% 12 7 31.8% 29 41.4% Simcoe 110 25 77.3% 43 18 16.4% 128 33.6% Huron 13 3 76.9% 12 9 69.2% 22 54.5% Hastings 30 7 76.7% 11 4 13.3% 34 32.4% Niagara 100 24 76.0% 30 6 6.0% 106 28.3% York 167 40 76.0% 85 45 26.9% 212 40.1% Peel 195 47 75.9% 63 16 8.2% 211 29.9% Brant 28 7 75.0% 12 5 17.9% 33 36.4% Halton 104 26 75.0% 41 15 14.4% 119 34.5% Kawartha Lakes 8 2 75.0% 10 8 100.0% 16 62.5% Northumberland 12 3 75.0% 3 0 0.0% 12 25.0% Haldimand Norfolk 11 3 72.7% 11 8 72.7% 19 57.9% Leeds & Grenville 11 3 72.7% 7 4 36.4% 15 46.7% Dufferin 7 2 71.4% 5 3 42.9% 10 50.0% Nipissing 31 10 67.7% 6 -4 -12.9% 27 22.2% Prince Edward 6 2 66.7% 2 0 0.0% 6 33.3% Greater Sudbury 37 13 64.9% 16 3 8.1% 40 40.0% Muskoka 22 8 63.6% 6 -2 -9.1% 20 30.0% Parry Sound 8 3 62.5% 0 -3 -37.5% 5 0.0% Manitoulin 2 1 50.0% 0 -1 -50.0% 1 0.0% Source: Market Participants Database SDG = Stormont Dundas and Glengarry
205
organizations constituted 38.4% of all the provider organizations in the market in 2005.
At the county level, there was wide variation with no readily discernible pattern even between
regions. For example, three counties, Lennox and Addington (in southeastern Ontario), Oxford
(in the southwest) and Sudbury District (in the so-called ‘near north’) all retained their entire
complement of provider organizations from 2003 to 2005; three other counties in the same
regions, Leeds and Grenville (southeast), Haldimand Norfolk (southwest) and Nipissing (near
north) had lower provider survival rates, around 70%.
Among the five counties with the largest populations (Toronto, Peel, York, Ottawa and
Durham), with 48.7% of Ontario’s population, there was also a variety of survival, net growth
and new provider rates. In this group, for example, survival (91.8%) and net growth (32.2%)
rates were the highest in Ottawa; the lowest survival rate and net growth rates were in Peel
(75.9% and 8.2%, respectively). York, with a survival rate close to Peel’s (76.0%) had the
highest proportion of new providers in 2005 (40.1%) and Durham had the lowest proportion of
new providers in 2005 (29.1%). Toronto, the largest county in terms of number of providers and
population, heavily influenced and therefore was close to the provincial average on all measures.
Similarly, the five least-populated counties, with a total of 0.8% of the population of
Ontario, varied widely. Providers in Rainy River and Sudbury District in 2003 all survived into
2005, and a third and quarter of their providers in 2005, respectively, were new. There were no
new providers in Haliburton in 2005, and the survival rate was 80.0%. Provider organizations in
Prince Edward County and Manitoulin had among the lowest survival rates of all counties
(66.7% and 50.0%, respectively) but 33.3% and none of their providers in 2005 were new,
respectively.
Indicators of changing demand and of levels of competition (Chapter 4, section 4.5.3.3
and Chapter 6, section 6.1.1) were used to assess their relationship with the varied rates of
provider organization survival across counties. There were no statistically significant correlations
between the survival rate and either county-level population growth (r=.13, p=.359) or density of
FP physiotherapists (r=-.05, p=.755). There were also no significant correlations between the
proportion of new providers in 2005 and population growth (r=.06, p=.681) or FP density (r=.19,
p=.197). Finally, contrary to others’ findings in other markets in Canada,203;204;403 there was no
correlation at the county level between entry and exit rates for all providers (r=.09, p=.561)
though there was a low correlation for CPO organizations alone (r=.29, p=.05). Accordingly, the
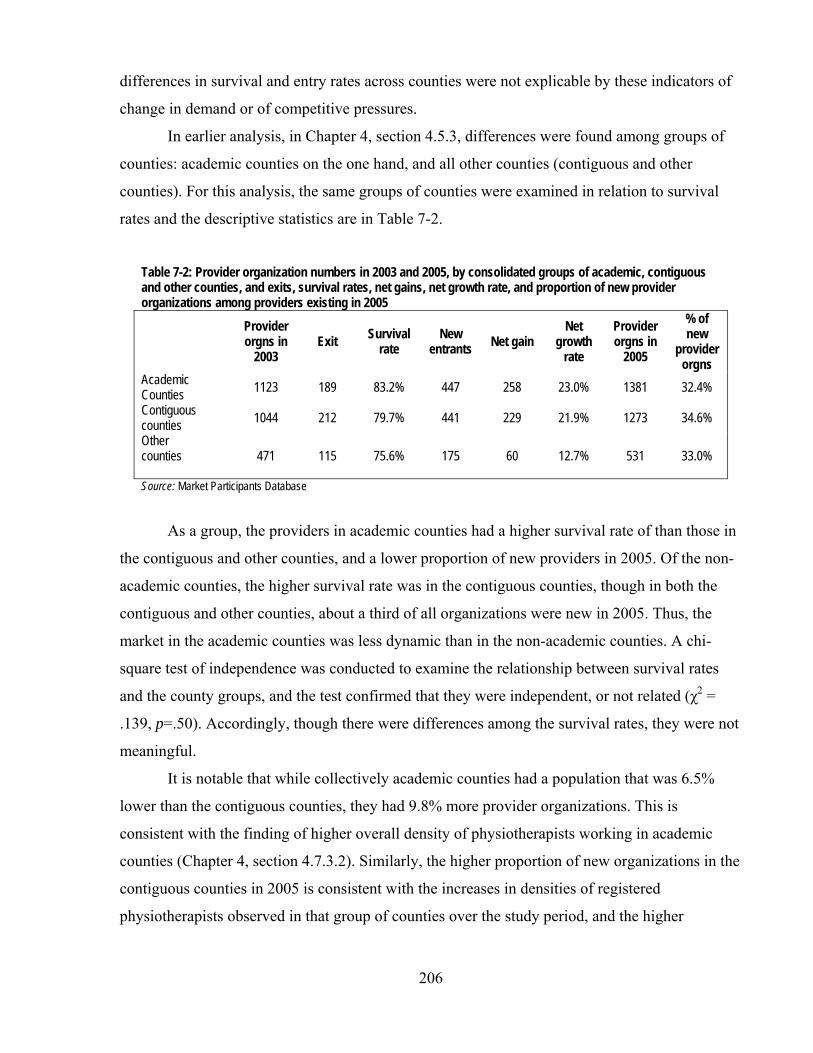
206
differences in survival and entry rates across counties were not explicable by these indicators of
change in demand or of competitive pressures.
In earlier analysis, in Chapter 4, section 4.5.3, differences were found among groups of
counties: academic counties on the one hand, and all other counties (contiguous and other
counties). For this analysis, the same groups of counties were examined in relation to survival
rates and the descriptive statistics are in Table 7-2.
Table 7-2: Provider organization numbers in 2003 and 2005, by consolidated groups of academic, contiguous and other counties, and exits, survival rates, net gains, net growth rate, and proportion of new provider organizations among providers existing in 2005
Provider orgns in
2003 Exit Survival
rate New
entrants Net gain Net
growth rate
Provider orgns in
2005
% of new
provider orgns
Academic Counties 1123 189 83.2% 447 258 23.0% 1381 32.4% Contiguous counties 1044 212 79.7% 441 229 21.9% 1273 34.6% Other counties
471 115 75.6% 175 60 12.7% 531 33.0%
Source: Market Participants Database
As a group, the providers in academic counties had a higher survival rate of than those in
the contiguous and other counties, and a lower proportion of new providers in 2005. Of the non-
academic counties, the higher survival rate was in the contiguous counties, though in both the
contiguous and other counties, about a third of all organizations were new in 2005. Thus, the
market in the academic counties was less dynamic than in the non-academic counties. A chi-
square test of independence was conducted to examine the relationship between survival rates
and the county groups, and the test confirmed that they were independent, or not related (χ2 =
.139, p=.50). Accordingly, though there were differences among the survival rates, they were not
meaningful.
It is notable that while collectively academic counties had a population that was 6.5%
lower than the contiguous counties, they had 9.8% more provider organizations. This is
consistent with the finding of higher overall density of physiotherapists working in academic
counties (Chapter 4, section 4.7.3.2). Similarly, the higher proportion of new organizations in the
contiguous counties in 2005 is consistent with the increases in densities of registered
physiotherapists observed in that group of counties over the study period, and the higher
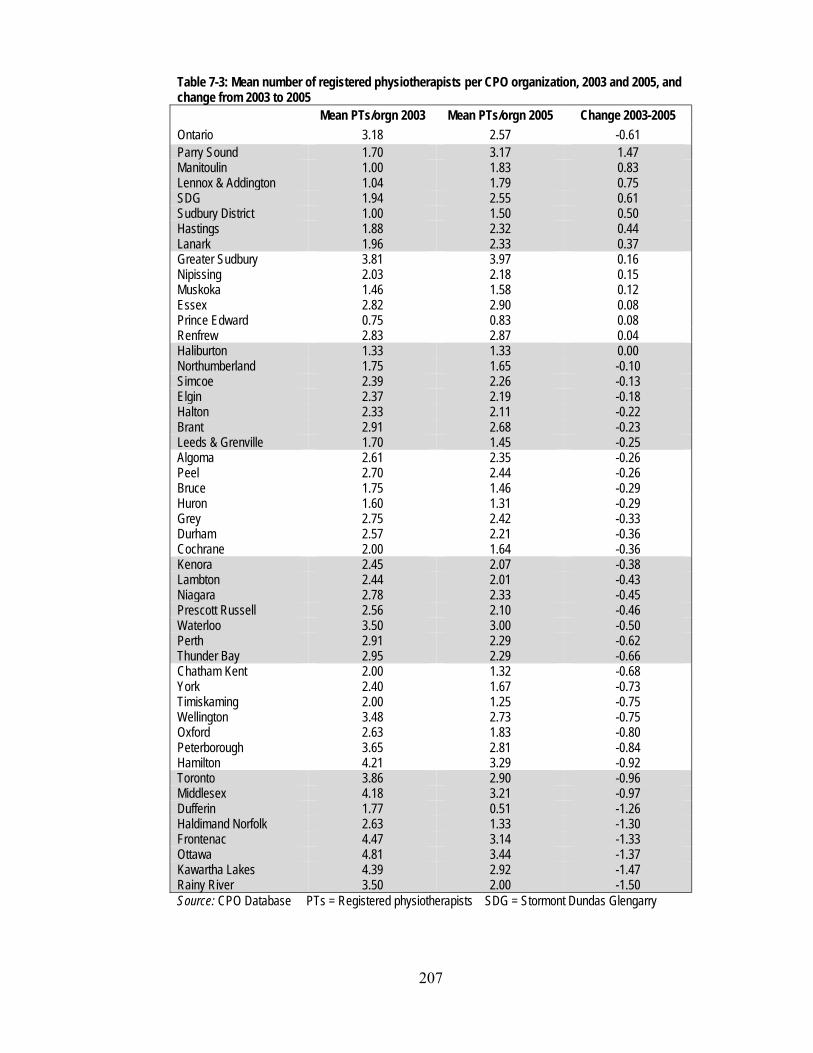
207
Table 7-3: Mean number of registered physiotherapists per CPO organization, 2003 and 2005, and change from 2003 to 2005
Mean PTs/orgn 2003 Mean PTs/orgn 2005 Change 2003-2005 Ontario 3.18 2.57 -0.61 Parry Sound 1.70 3.17 1.47 Manitoulin 1.00 1.83 0.83 Lennox & Addington 1.04 1.79 0.75 SDG 1.94 2.55 0.61 Sudbury District 1.00 1.50 0.50 Hastings 1.88 2.32 0.44 Lanark 1.96 2.33 0.37 Greater Sudbury 3.81 3.97 0.16 Nipissing 2.03 2.18 0.15 Muskoka 1.46 1.58 0.12 Essex 2.82 2.90 0.08 Prince Edward 0.75 0.83 0.08 Renfrew 2.83 2.87 0.04 Haliburton 1.33 1.33 0.00 Northumberland 1.75 1.65 -0.10 Simcoe 2.39 2.26 -0.13 Elgin 2.37 2.19 -0.18 Halton 2.33 2.11 -0.22 Brant 2.91 2.68 -0.23 Leeds & Grenville 1.70 1.45 -0.25 Algoma 2.61 2.35 -0.26 Peel 2.70 2.44 -0.26 Bruce 1.75 1.46 -0.29 Huron 1.60 1.31 -0.29 Grey 2.75 2.42 -0.33 Durham 2.57 2.21 -0.36 Cochrane 2.00 1.64 -0.36 Kenora 2.45 2.07 -0.38 Lambton 2.44 2.01 -0.43 Niagara 2.78 2.33 -0.45 Prescott Russell 2.56 2.10 -0.46 Waterloo 3.50 3.00 -0.50 Perth 2.91 2.29 -0.62 Thunder Bay 2.95 2.29 -0.66 Chatham Kent 2.00 1.32 -0.68 York 2.40 1.67 -0.73 Timiskaming 2.00 1.25 -0.75 Wellington 3.48 2.73 -0.75 Oxford 2.63 1.83 -0.80 Peterborough 3.65 2.81 -0.84 Hamilton 4.21 3.29 -0.92 Toronto 3.86 2.90 -0.96 Middlesex 4.18 3.21 -0.97 Dufferin 1.77 0.51 -1.26 Haldimand Norfolk 2.63 1.33 -1.30 Frontenac 4.47 3.14 -1.33 Ottawa 4.81 3.44 -1.37 Kawartha Lakes 4.39 2.92 -1.47 Rainy River 3.50 2.00 -1.50 Source: CPO Database PTs = Registered physiotherapists SDG = Stormont Dundas Glengarry

208
proportion of new organizations in both the non-academic county groups was consistent with the
increase in the density of physiotherapists working in FP settings (Chapter 4, section 4.6.3.2).
While in general there was an increase in the number of provider organizations across
Ontario and in the majority of counties from 2003 to 2005, there was also a change in the size of
the provider organizations. Table 7-3 provides the resulting all-Ontario data at the top and the
county data ordered from the county with the biggest average gain in physiotherapists per
organization to the county with the biggest loss.
The all-Ontario figures show that across the province, the mean number of
physiotherapists per provider organization fell by 0.61, or about 19.2% from 2003 to 2005.
Though the overall capacity (as measured by the total number of registered physiotherapists
across Ontario) increased from 2003 to 2005 at just less than the rate of increase in the
population (Chapter 4, section 4.6.3.1), and the number of physiotherapy organizations
increased, the capacity of the average physiotherapy organization in 2005 was 82.1% of the level
in 2003. While this change was probably not noticeable to the average patient, it is still notable
that at a provincial level and in 35 of the 49 counties (with 87.1% of Ontario’s population), more
provider organizations were becoming available to patients, but they were on average smaller in
size.
To assess this pattern in organization size, the mean numbers of physiotherapists in
different groups of provider organizations were examined: the CPO provider organizations that
were in existence in 2003, those that exited between 2003 and 2005, those that entered, and all
the CPO organizations that existed in 2005. The results are in Table 7-4.
Table 7-4: Mean number of registered physiotherapists per CPO provider organization
Provider orgns
in 2003 Exiting
providers New
entrants Provider orgns
in 2005
n 1,491 350 743 1,884 Mean number of physiotherapists
per organization 3.18 1.35 1.02 2.57
Standard deviation 5.54 2.78 1.09 4.67 Source: CPO Database
As this Table shows, there were 350 CPO physiotherapy organizations with a mean
number of physiotherapists per organization (1.35) that exited the market between 2003 and
2005. This mean was smaller than the mean number of physiotherapists (3.18) among all the
organizations that existed in 2003. Moreover, the 350 exiting organizations were replaced by
209
more than twice as many organizations (743) with an even smaller mean number of
physiotherapists per organization (1.02).
7.1.2 Survival
It was hypothesized that in a contestable market like the physiotherapy market, the
providers that survive in a market adopt strategies to address the production characteristics of the
market that pose significant barriers to entry. To assess whether strategies focused on the supply
of registered physiotherapists and the supply of patients increased the rate of survival, subgroups
in the Market Participants Database were compared.*
The first comparison was between those serving their patients with registered
physiotherapists and those with no registered physiotherapists. Responses to the second market
challenge, the supply of patients, was assessed by comparing the survival rates of provider
organizations with preferred provider arrangements with revenue sources and those who did not,
and by comparing those who marketed their services in the Yellow Pages (YP) with those who
did not. Becoming a preferred provider should mean easier and less costly access to a group of
patients than recruiting patients one by one. The number of ways each organization has
publicized its services was assumed to reflect the ways the organization perceived and portrayed
itself in the market – as a purveyor of broad rehabilitation services, of physiotherapy or
physiotherapist services, of sports medicine, or of some combination – and consequently, the
range of patients each was trying to attract.
Table 7-5 provides the survival and entry rates, net gain, and proportion of new providers
among all providers and in each of the subgroups. Table 7-6 provides expanded and different
information: survival rates for the subsets of advertisers in the YP, grouped by the number of YP
headings organizations advertised under, as well as the survival rates for groups of providers that
had a combination of attributes. For example, the survival rates of organizations that had
registered physiotherapists and were also preferred providers are labeled “CPO & Preferred”. For
each of the categories in Table 7-6, there are corresponding survival rates for the groups of
providers not falling within the categories.
Among the three main provider categories listed in Table 7-5 (CPO, Preferred, and YP),
the rate of survival among CPO organizations was the lowest, 76.5%, and more than twice as
many new CPO organizations entered the market (1061) as left (515). The exit rate among
* Details about the subgroups and the preferred provider arrangements and Yellow Pages advertising measures are in
Chapter 3, section 3.3.3.2.

210
Table 7-5: Survival rates and new providers across Ontario, by all provider organizations in the Market Participant Database, and in subsets of the Database
Existed
2003 Exited Survival
rate Entered Net gain Net
growth Existed in 2005 % new
All 2640 515 80.5% 1061 546 20.7% 3186 33.3%
Subset CPO 1491 350 76.5% 743 393 26.4% 1884 39.4% Preferred 214 39 81.8% 310 271 126.7% 485 63.9% YP 1931 341 82.3% 464 123 6.4% 2054 22.6% Source: Market Participants Database
Table 7-6: Survival rates of provider organizations in subgroups of the Market Participants Database, compared with the survival rates of provider organizations not in the subgroups, with chi-square statistics
In subgroup Not in subgroup Groups n Survived Survival
rate n Survived Survival rate Chi-
square P
All 2640 2125 80.5% - - - - -
CPO 1491 1141 76.5% 1149 880 76.6% 0.00 >.05 Preferred 214 175 81.8% 2426 1928 79.5% 0.07 >.05 YP 1931 1590 82.3% 709 482 68.0% 7.94 <.01**
1 heading 1538 1231 80.0% 1102 854 77.5% 0.29 >.05 2 headings 356 324 81.0% 2284 1788 78.3% 3.30 >.05 3 headings 34 32 94.1% 2606 2093 80.3% 0.41 >.05 4 headings 3 3 100% 2637 2122 80.5% 0.07 >.05
CPO & Preferred 180 177 98.3% 2460 1948 79.2% 3.88 <.05* CPO & YP 805 776 96.4% 1835 1349 73.5% 19.28 <.01** Preferred & YP 147 151 97.4% 2489 1978 79.5% 2.88 >.05 CPO, Preferred & YP 140 140 100.0% 2500 1985 79.4% 3.52 >.05 * Significant at the .05 level ** Significant at the .01 level Source: Market Participants Database
preferred providers was 19.2%, and the number of new organizations (310) was substantially
more than the number that that exited (39). This was likely due to the new opportunities
primarily for preferred provider status with CCACs as they divested their own staff (Chapter 5,
section 5.1.1.5) but also with the WSIB as it implemented its Program of Care (Chapter 5,
section 5.1.1.9). Among those that advertised in the YP, 341 or 17.7% exited, and they were
replaced by 464 provider organizations.
These data initially indicate higher exit or failure rates for providers with registered
physiotherapists working in them than for the other groups, but Table 7-6 shows CPO
organizations were as likely to exit as all non-CPO organizations (76.5% and 76.6% of providers
in each of the groups survived, respectively, and a chi-square test of independence showed that

211
the relation between having registered physiotherapists and survival was not significant (χ2 =
.000, p>.05). This indicates, contrary to expectations, that employing registered physiotherapists
did not increase the stability of those provider organizations in the market over that of
organizations with no physiotherapists.
The results relating to preferred provider status also showed that that factor did not make
any difference to survival rates – the survival rate for preferred providers was 81.8% and for all
provider organizations that were not preferred providers, 79.5%, and a chi-square test of
independence showed that the relation between preferred provider status and survival was not
significant (χ2 = .07, p>.05).
As illustrated in Tables 7-5 and 7-6, the organizations that advertised in the YP were
more likely to survive than other groups of providers – 82.3% of the organizations that
advertised survived while 68.0% of non-advertisers survived. However, the number of headings
under which providers advertised themselves did not make a difference, due in part to the
relative infrequency at which provider advertised under more than one heading. Chi-square tests
of independence showed the relationships between the number of YP headings and the survival
rates were not significant.
The information in Table 7-5 also shows that a combination of using registered
physiotherapists and either being a preferred provider (“CPO & Preferred”) or advertising in the
YP (“CPO & YP”) was associated with survival rates over those of organizations that did not do
these in the same combinations. This emphasizes that a multifaceted competitive strategy
appears to increase the likelihood of survival, but just as importantly, it signifies that more
established organizations with larger capacity may have been best positioned to survive in the
market.
Discussion
The combination of factors explored here relating to the supply of registered
physiotherapists and the supply of patients does not explain survival of firms in the market.
Undoubtedly part of the reason for this finding is that registered physiotherapists are as equipped
as anyone (and possibly more) with the skills and knowledge to provide services in this market,
and so they are more likely to enter it. One of the obvious options open to them is to enter it as a
new graduate of a university program by opening a private (FP/s) clinic, and the small size of the
new provider organizations suggests that this was likely. But as several of the key informants (P-
1, P-2, P-3, P-4, P-9, R-2, R-3) said, professional skills do not constitute the entire set of skills

212
required in the physiotherapy market. While good clinical skills may be sufficient for a
successful practice in a hospital setting with its substantial management and organization
infrastructure, in the private practice setting (where it appears most growth in this market was
taking place), physiotherapists also require business acumen, business planning skills, and
knowledge of “how things work”. The curricula for registered physiotherapists in universities in
Ontario includes only a small portion devoted to the business environment and business skills (P-
9, O-4).404-408 Thus, unless new registered physiotherapists spend some time in an organization
owned by someone else where they can learn these skills (P-9), their learning about the business
realities and the complexities of the market occurs after they have made the decision to enter the
market, and as a result, they, like new market entrants in other industries, are more likely to exit
than more mature incumbents are.204
Another likely contributor to the lower survival rate for CPO organizations was the high
demand for physiotherapists (Chapter 4, section 4.6.1). With this level of demand, registered
physiotherapists could easily exit the market in the capacity of owner of a FP/s provider
organization and re-enter it as an owner of another FP/s organization (in a partnership, for
example) or as an employee of a provider organization. Since provider organizations had on
average small numbers of registered physiotherapists, the loss of one or two therapists could be
fatal to an organization. Thus, the high demand for labour created an opportunity for individual
therapist mobility, with a consequential instability among provider organizations.
Preferred provider status also did not increase the likelihood of survival, contrary to
expectations, affirming that the decision of many providers not to become preferred providers is
a rational competitive strategy. Nonetheless, preferred provider status may have a bigger impact
on profitability than on the much starker measure of failure in the market. Broadly positioning an
organization in the market appears to have had a relationship with increased survival rates,
though the utility of advertising beyond two areas of an organization’s purported specialization
seems low. The likelihood that an advertiser will survive may in fact be more related to
incumbency and underlying financial strength rather than to advertising and marketing.
These findings raise by negative implication the importance of other factors to the
survival of provider organizations in the market. Key informants emphasized the reputational
aspects of a provider organization’s business to its survival and long-term success and such
observations are consistent with the findings in Chapters 4 and 5. There, it was shown that
providers, especially FP and the more entrepreneurial NFP Hospitals, emphasize their local

213
credibility and reputation by developing relationships in the community among referring
physicians, patients, patients’ families and their employers. This assists in ensuring not only the
professional credibility of the practitioners who work in the organizations, but also the credibility
needed to maintain the profile and volume of patients and level of profitability for their purposes.
Thus, the finding of the lack of a relationship between the use of registered
physiotherapists and organizational survival does not mean that the use of registered
physiotherapists is unimportant. Indeed, many revenue sources in the market insist on the
presence of registered physiotherapists as a condition of payment, and the employment of
registered physiotherapists may lend a level of credibility to a provider organization – especially
since such physiotherapists are in such high demand that, within the provider community, there
is significant competition for these therapists. In fact, increased competition for these resources
likely actually increases the reputation, prestige and perceived importance of organizations using
registered physiotherapists. But no competitive strategic advantage accrued since they are used
broadly.
Similarly, preferred provider status can also mean, as in the case of WSIB patients, the
opportunity to establish therapeutic relationships that can extend beyond the initial care episode
to the patient’s future needs and beyond the patient to his or her family and friends. As noted by
two key informants (P-3, O-2), some provider organizations regard treating WSIB patients as a
loss leader. The information about the survivors’ propensity to advertise adds to this theme of the
importance of reputation. Providers seek to build their profile in the community through various
means, one of which may be advertising in the Yellow Pages.
Overall, the exit rates from the market illustrate that this market is similar to that in many
other industries in Canada.204 There is considerable entry but there is also considerable exit from
the market. Evidence from many other industries has established that it is the more recent
entrants who are most likely to exit, and that the rate of exit declines with duration of
incumbency. While the time period covered by this study does not permit an examination of the
effect of length of incumbency, the data on the relatively small size of exiting provider
organizations (usually though not necessarily associated with short incumbency204) appears to
emphasize that the pattern in other industries also occurs in the physiotherapy market. Some of
the new entrants – and some of the providers who have been in the market longer – may leave
for personal reasons, including retirement, but others obviously do for reasons related to the
realization that their expectations going into the market were unrealistic, and their strategies for
214
overcoming various challenges were insufficient, especially in light of the significant advantage
that incumbent providers enjoy in their relationship with patients and their families, referral
sources and payers (P-2, P-4, P-5). In addition, as observed, given the high demand for
physiotherapists, they appear to have significant opportunities for mobility, with effects on the
stability of provider organizations and especially FP/s organizations.
7.2 Foreign investment in the market
As discussed in Chapter 2, section 2.2.4.5, the business of health insurance is open to
foreign investment under NAFTA and the GATS. In addition, under NAFTA, only certain
providers are protected from foreign investment. OHIP designated clinics (a provincial program
that existed on January 1, 1994) are one group. The MOHLTC’s restricted list of hospitals
eligible for global budgets also limits foreign investors’ rights to own hospitals, but individual
hospitals that contract out physiotherapy services are likely required under NAFTA to be open to
American, Mexican and Canadian contractors. All the other physiotherapy services in the market
are commercially offered and so are open to competition from foreign investors.
In this largely contestable market with no widespread protection for domestic providers
under NAFTA, it was expected that there would be a significant presence of foreign participants
in this market, particularly assuming, as many do (Chapter 2, section 2.2.4.4), that foreign
investors have superior access to capital, superior managerial expertise, and experience in other
markets with for-profit and not-for-profit competitors.
This section reviews the profile of insurers in the physiotherapy market, and then turns to
consider foreign providers in the market and the three cases in which foreign investors have had
a role to play in provider organizations in Ontario.
7.2.1 Insurers
In Chapter 5, the review of the various revenue sources showed that, of the insurers in the
market, several are public and quasi-public – the MOHLTC, CCACs, Veterans Affairs Canada,
Canadian Forces and the Workplace Safety and Insurance Board. Two are private – MVA
insurance and private insurance.
In the MVA sector, some insurers are transnational giants with operations in Ontario;
others are small Ontario insurers operating only in their locality. Aviva Canada Inc., for example,
operates in Ontario through several subsidiaries and had 12.4% of the Ontario market in 2005. It
is a subsidiary itself of Aviva plc, headquartered in London, United Kingdom, the fifth largest
215
insurance company in the world, with £41.5-billion in premium revenue and £364-billion of
assets under management in 2005.409 Another example is State Farm Mutual Automobile
Insurance Company, with assets of $90-billion at the end of 2005, and part of the State Farm
Group, headquartered in Illinois.410 It had 10.77% of the Ontario MVA insurance market in
2005.411 An example of a small Ontario-based insurer is Farmer’s Mutual Insurance Company of
Lindsay, which has provided insurance to central Ontario farmers and others since 1895, and had
$152-million in assets at the end of 2005.412 In the second quarter of 2005, Farmer’s had 0.28%
of the Ontario MVA insurance market.411
Foreign-owned MVA insurance companies have a significant place in the market. In
2005, the largest three insurers in terms of premiums collected were foreign and had a little more
than a third (34.06%) of the market (Table 7-7). Together, the foreign-owned companies in the
market with at least 1% of the market each had about 41.96% of the market. Overall, the top 20
domestic and foreign firms had 82.61% of the market.
While the ownership of the larger insurers in the sector is skewed toward foreign
ownership, it is important that in the MVA sector, the insurers do not and cannot distinguish
themselves from one another or from domestically-owned insurers in terms of quality and price
of health care provided to customers: the terms of the benefits they offer are highly regulated
(section 5.1.1.8, Chapter 5). Instead, they compete on the basis of the price of their insurance
products and rely on customer loyalty for repeat sales.
Instead of individual insurer efforts to negotiate or dictate price, the MVA insurers’ trade
association, the Insurance Bureau of Canada, has tended to act as the lead on dealing with the
FSCO to convince it to regulate in ways amenable to insurers’ goals. The result is that the market
power of the insurers in relation to health care is well beyond the level expected, given the
degree of fragmentation among them. Thus, contrary to expectations arising from some of the
globalization literature, foreign firms have not diluted governmental power or the ability of
governments to regulate. However, foreign insurers, along with Canadian insurers, pressured
their regulator to control costs on their behalf.
One hundred and twenty-seven insurers offered private health insurance in Canada in
2002,413 and 126 in 2004.414 Foreign-owned insurers occupied 26% of the combined life and
health insurance market in terms of premium revenue in 2002; the proportion had changed to
17% by 2005. Life insurers dominated the health insurance business: in 2002, 83 life insurance
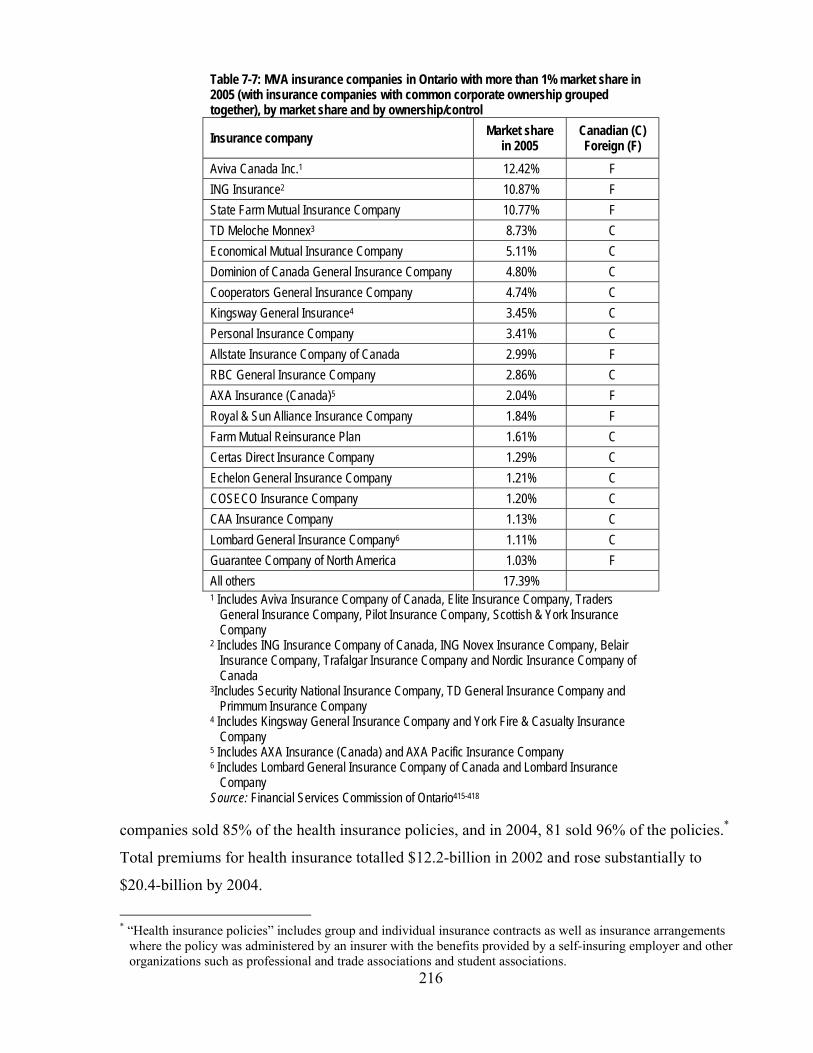
216
Table 7-7: MVA insurance companies in Ontario with more than 1% market share in 2005 (with insurance companies with common corporate ownership grouped together), by market share and by ownership/control
Insurance company Market share in 2005
Canadian (C) Foreign (F)
Aviva Canada Inc.1 12.42% F ING Insurance2 10.87% F State Farm Mutual Insurance Company 10.77% F TD Meloche Monnex3 8.73% C Economical Mutual Insurance Company 5.11% C Dominion of Canada General Insurance Company 4.80% C Cooperators General Insurance Company 4.74% C Kingsway General Insurance4 3.45% C Personal Insurance Company 3.41% C Allstate Insurance Company of Canada 2.99% F RBC General Insurance Company 2.86% C AXA Insurance (Canada)5 2.04% F Royal & Sun Alliance Insurance Company 1.84% F Farm Mutual Reinsurance Plan 1.61% C Certas Direct Insurance Company 1.29% C Echelon General Insurance Company 1.21% C COSECO Insurance Company 1.20% C CAA Insurance Company 1.13% C Lombard General Insurance Company6 1.11% C Guarantee Company of North America 1.03% F All others 17.39% 1 Includes Aviva Insurance Company of Canada, Elite Insurance Company, Traders
General Insurance Company, Pilot Insurance Company, Scottish & York Insurance Company
2 Includes ING Insurance Company of Canada, ING Novex Insurance Company, Belair Insurance Company, Trafalgar Insurance Company and Nordic Insurance Company of Canada
3Includes Security National Insurance Company, TD General Insurance Company and Primmum Insurance Company
4 Includes Kingsway General Insurance Company and York Fire & Casualty Insurance Company
5 Includes AXA Insurance (Canada) and AXA Pacific Insurance Company 6 Includes Lombard General Insurance Company of Canada and Lombard Insurance
Company Source: Financial Services Commission of Ontario415-418
companies sold 85% of the health insurance policies, and in 2004, 81 sold 96% of the policies.*
Total premiums for health insurance totalled $12.2-billion in 2002 and rose substantially to
$20.4-billion by 2004.
* “Health insurance policies” includes group and individual insurance contracts as well as insurance arrangements
where the policy was administered by an insurer with the benefits provided by a self-insuring employer and other organizations such as professional and trade associations and student associations.

217
Canadian life and health insurers as a group derive more than half of their premium
revenue from sales of life and health insurance policies outside of Canada, primarily in the
United States, the United Kingdom and Ireland.413;414 This fact provides the rationale for
Canada’s commitment regarding health insurance under the GATS (Chapter 2, section 2.2.5.3).
7.2.2 Provider organizations
Gildiner, in her study of Ontario’s rehabilitation market from 1985 to 1999,419;420 argued
that the market in the late 1990s was in transition, and that the provision of rehabilitation
services had been transformed from “a mixture of public provision … and ‘mom-and-pop’
provider-owned clinics, into a market characterized by large interests due to mergers and
acquisitions, frequently by investor-owned, for-profit (and often US-based) companies.”419 The
data examined in this study do not substantiate these observations.
The proportion of investor-owned, FP/c organizations in the insurance or funding side of
the market is substantial but less than 50% in the MVA and private insurance sectors.
Furthermore, in the private insurance sector, it appears that foreign insurers’ market share is
declining over time. On the provider side of the market, FP/c providers are in the minority, and
the market is characterized not by large interests, but by a high level of involvement of small
businesses, FP/s providers, in this market and declining but still significant involvement by NFP
Hospitals. The question remains, however: to what extent is the provider side of the market
foreign-owned?
7.2.2.1 MOSTLY CANADIAN In response to inquiries about the level of foreign investment in the physiotherapy
market, all key informants expressed the opinion that there was only a small amount of foreign
ownership. Some were able to identify specific clinics or organizations (including LifeMark
Health and CBI, the first two cases presented below) that had been foreign-owned in the past.
Several identified specific clinics that they believed were foreign-owned and that were, at least at
the time of the interviews, providing services in the ‘executive medical’ sector, that is, enhanced
access to diagnostic services that were not ‘medically necessary’ (and therefore not insured
publicly) including physical examinations and such diagnostic techniques as magnetic resonance
imaging. Key informants (P-2, P-4, P-8) said that these clinics often had a component of their
services connected to physical conditioning such as weight loss, fitness or other health promotion
activities.

218
The results of the survey of physiotherapy organizations corroborated the views of the
key informants. The sole proprietorship FP/s organizations were necessarily based in Ontario to
provide services in the province. As for the corporate and partnership organizations, survey
respondents overwhelmingly said that they were also based in Ontario or Canada (97.2%) (Table
7-8). Indeed, one of the few foreign-owned corporations was bought out by its Canadian
management just after the survey was conducted (see section 7.3.2.3, below), putting the
proportion of corporations or partnerships based in Canada up to 98.9%.
Table 7-8: Responses to question about where a provider organization was based, if a corporation or a partnership Corporation or partnership based in: n=178 Ontario 95.5% Canada 1.7% Outside Canada 2.8% Source: Survey of Physiotherapy Provider Organizations, Question 24
To understand this dominance of domestic ownership in the provider side of the
physiotherapy market, the next three sections provide case studies of the three largest
corporations operating in the Ontario physiotherapy market in 2007 that have had or have some
level of foreign ownership.
7.2.2.2 CASE 1: LIFEMARK HEALTH In their studies of parts of the health care system in Canada in the late 1990s, both
Fuller206 and Gildiner420 specifically referred to Columbia Health Care as one of the prime
examples of how Canadian health care was being ‘privatized’ and transferred to American
investors’ control. Fuller documented the history of Columbia Health Care up to 1998. She noted
that Columbia Health Care was started in 1978 as a small innovative rehabilitation services
provider in British Columbia, focused on patients whose care was paid for by that province’s
workers’ compensation system and by the publicly-owned MVA insurer. In 1987, Columbia
expanded to Ontario to provide services to the Ontario injured workers. Its founder sold
Columbia in 1990 to a Canadian entrepreneur, who raised capital in private markets for
expansion, and within three years, Columbia went from two clinics to 18, with annual revenues
of $11-million.
In 1995, the company was sold to Sun Healthcare Group, Inc., of Albuquerque, New
Mexico. Sun Healthcare Group was at the time a large provider of hospital services in the United
219
States, and was involved in outpatient rehabilitation (which made Columbia Health Care
complementary to its business lines), skilled nursing facilities and long term care homes. It was
also owned health care businesses in Europe and South America. After acquiring Columbia, Sun
Healthcare made more acquisitions in Canada, further extending the reach of Columbia. During
the expansion, the executive in charge of Columbia de-emphasized the American ownership of
Columbia in media reports, saying that he did not want it to appear that the company was owned
by US investors.
In 1997, Sun Healthcare reorganized its Canadian subsidiary, Columbia Health Care Inc.,
and relocated the headquarters from Ontario to Calgary. As Fuller was completing her book in
1998, the company maintained that it was going to continue to play an active role in Canadian
health care.
However, this did not occur. Sun Healthcare announced in May 1997 that its outpatient
facilities in Canada – its 100% interest in Columbia Health Care Inc. – were for sale.421 By
1998, in part related to the efforts of health maintenance organizations and the federal
government in the United States to squeeze providers’ earnings, but also because Sun Healthcare
was overextended in foreign and domestic (US) markets,421 it headed toward bankruptcy
protection in the United States, which it was formally granted in October 1999. A small part of
the Canadian holdings had already been sold in 1998 to a newly-formed Canadian company
called LifeMark Health Limited, but the bulk remained unsold until after protection from
bankruptcy was received. At the end of 1997, the Canadian assets of Sun Healthcare were valued
on its books at $22.5-million (US), having been reduced by $7.0-million that year in recognition
of their likely sale value and the costs of selling them.422
At the end of 1998, the book value of Columbia was $11.6-million, with Sun Healthcare
having recorded another loss of over $11.4-million in the value of this asset in 1998,421 and in
1999, it recorded another $2-million loss. The rest of the Canadian operations were finally
purchased by LifeMark Health Limited in March 1999. LifeMark Health, as Columbia Health
Care, Inc. was, is headquartered in Calgary, and the senior management is almost exclusively
made up of registered physiotherapists.423 Though LifeMark Health advertises prominently on its
website that it is 100% Canadian owned, the details of the ownership are not public information.
Nonetheless, it appears that a labour-sponsored capital venture company, Canadian Medical
Discoveries Fund, is a small investor ($300,000) in the company.424 Furthermore, the Canadian
Imperial Bank of Commerce (CIBC) was involved in the financing of the purchase of LifeMark
220
Health by the Canadian management, and CIBC was (and may still be) an equity holder, along
with a private equity fund.425 Alaris Income Growth Fund, based in Calgary, is also a private
investor in LifeMark Health.426;427 Thus, while LifeMark Health may appear on the surface to be
owned by its management – a large FP/s organization – this is a FP/c organization with
Canadian-based shareholders who have expectations for growth and for profits to be generated
and distributed.
LifeMark Health continues to be heavily involved in the rehabilitation market across
Canada, describing itself as “one of Canada’s largest providers of physiotherapy, rehabilitation
and occupational health services”.423 LifeMark is also diversifying, however, and has acquired,
for example, MEDI-Chair Inc.,* a wholesaler and franchisor of a line of home medical
equipment products.428
7.2.2.3 CASE 2: CBI HEALTH Canadian Back Institute (CBI, or now, CBI Health) was started by Dr. Hamilton Hall in
1974, a leading Canadian orthopaedic surgeon, providing a new way to approach back problems
and back pain. The company expanded in the late 1980s, as CBI became a WSIB preferred
provider. In 1997, CBI started a period of aggressive acquisition, first acquiring Dynamic
Rehabilitation as the company’s rehabilitation consulting arm. By February 1998, CBI had 19
clinics across Canada,420 and in that month, Select Medical Corporation of Mechanicsburg,
Pennsylvania, bought 73% of the shares of CBI.429
Started in 1997, Select Medical Corporation is one of the largest operators of specialty
acute hospitals for long term care patients, as well as a significant provider of outpatient
rehabilitation services in the United States, and with its purchase of CBI, it was a significant
provider of rehabilitation services in Canada as well. Leveraging CBI’s revenue stream, Select
Medical borrowed in Canadian capital markets to prepare Select for its initial public offering in
American and Canadian equity markets in April 2001.430 In Canada, CBI continued its
acquisitions, adding such companies such as Star Rehab in Saskatoon in 2000431 and Concordia
Sports Medicine & Physiotherapy in Montreal in 2005.432
In December 2005, Select Medical agreed to sell its shares in CBI to Callisto Capital
LP,433 a private equity firm based in Toronto that makes investments on behalf of Canadian
pension funds and other investors. The purchase price was about $90-million. Callisto then sold
shares to the senior management of the Canadian subsidiary.434 The transaction was financed
* Alaris Income Growth Fund also owns a share of MEDI-Chair Inc.426

221
with equity, held by Callisto and by the management group, and by debt, held by CIBC, BMO
Bank of Montreal, CIBC Mezzanine Finance and BMO Capital Corporation.435 As in other
leveraged management buyouts, the debt is to be repaid out of CBI’s revenue, and the debt
holders have an ultimate first claim ahead of equity holders on the assets of the company in the
event of insolvency or other breach of any relevant covenants in the debt instruments.436 Since in
a service business like CBI the more important assets of the business are its cash flow and
reputation (“goodwill”) rather than its real estate and capital assets, debt holders have an active
interest, like the equity holders, in the continuing profitability of the business.
Following the management buyout, CBI Health continued its acquisitions, branching into
primary medical care clinics with Care Point Medical Centres in 2006,437 and into in-home
health care with Aetas Health Care, operating in Alberta and Ontario.438
The fact of CBI Health’s continued growth as a Canadian-owned corporation in the
Canadian market is important to this case study, but it is also important that the American former
owner of CBI, Select Medical Corporation, has continued its growth in the outpatient
rehabilitation sector in the United States, buying troubled HealthSouth Corporation’s* outpatient
rehabilitation division in 2007 for $245-million (US).439
7.2.2.4 CASE 3: ALEGRO HEALTH CORPORATION WorkAble Centres Inc. was established in 1993 to take advantage of the potential for
rehabilitation services in the workers’ compensation and MVA sectors in Ontario. WorkAble
established several clinics in Ontario and contracted with individual employers to provide
workplace-based physiotherapy and other services. WorkAble branched out to locations in Nova
Scotia. A related company, Direct Health Solutions, was established to provide independent
medical and functional assessments and, like WorkAble, expanded in Ontario, Nova Scotia and
New Brunswick.
In 2001, however, a new company was formed, Alegro Health Corporation, with the
same management and owners as WorkAble. In 2002, the company made its initial public
offering and has been listed on the Toronto Venture Exchange since that time. In 2003, Alegro
bought WorkAble Centres from its CEO in a non-arm’s length transaction.
* Healthsouth Corporation was the subject of criminal and securities frauds investigations by the United States
government, and was sued civilly by investors, claimants, insurers and others, as a result of actions of the management group of the corporation in the 1990s. As of the middle of 2007, some of the claims against Healthsouth had been resolved by way of agreements to pay hundreds of millions of dollars, but there remained several substantial unresolved claims.439
222
Since 2003, however, Alegro has departed from a concentration on physiotherapy and
rehabilitation. In 2005, it bought Don Mills Surgical Unit Ltd.,* one of only a very few private
hospitals permitted to operate in Ontario and receive payments from OHIP for surgical
procedures performed on its premises.440 In early 2007, Alegro made a proposal to Ontario’s
Ministry of Health and Long-Term Care to provide 1,500 knee replacement surgeries per year† at
a price per surgery that Alegro claimed was less than what is paid for such surgeries in not-for-
profit hospitals in Ontario.441 While little is known about the profile of the patients Alegro
proposed to provide surgical services to, it is significant to this study that the proposal would
have tied Alegro’s physiotherapy services to its surgical offering. The proposal was turned down
by the Minister of Health, not on the basis that the surgical capacity was not needed in the
province, but upon a stated preference for increased capacity to be developed by NFP rather than
in FP providers.216
In May 2007, Alegro entered a joint venture with Cincero Inc., headquartered in
Mississauga, to undertake clinic trials of pharmaceuticals in a new company called Canam
Research.442 Finally, since July 2007, it has been engaged in a “strategic alliance” with Global
Healthcare Investments and Solutions, LLC (GHIS), of Rancho Santa Fe, California,443 under
which GHIS became a shareholder of Alegro in return for offering “strategic and business
development consulting services” to assist Alegro in moving into areas of health care it has not
been involved in before.444
7.2.2.5 DISCUSSION It is almost as risky observing trends and drawing conclusions from these three case
studies as it was for other researchers to observe trends from two of the cases at an earlier time.
But the benefit of the passage of time allows a reassessment of some of the factors that seemed
important in the 1990s to examinations and commentaries on foreign ownership in the
rehabilitation market.
Importantly, this review of the extent of foreign investment in the market has led to a
rejection of the hypothesis that there is a significant presence of foreign corporate providers in
the physiotherapy market because domestic providers are not protected under international trade
treaties. A number of observations are possible that provide reasons for the small foreign
presence. * “One Medical Place”, the organization authorized in a regulation under the Health Insurance Act12 to offer insured
services and to receive payments from OHIP, operates as Don Mills Surgical Unit Ltd. † This proposal was also discussed in Chapter 2, section 2.2.5.2.

223
First, as much as corporations from the United States may be perceived to be superior in
the approach to competitive health care markets, these case studies highlight that even the largest
and apparently well-managed corporations in the health care field are susceptible to the same
failings of judgment and miscalculations as others. Both the examples of US-based Sun
Healthcare (in the LifeMark case) and Healthsouth (part of the CBI case) illustrate that rapid
expansion and overdiversification may be poor competitive strategies – and particularly, as
illustrated in Healthsouth’s case, that the quality of the management can be vitally important.
The second observation is that Canadian physiotherapy and broader rehabilitation
markets are not as lucrative as earlier researchers – and many if not all market participants and
foreign investors – perceived in the 1990s. All key informants mentioned the pressure that the
buyers (insurers) in the market can exert and the control that they have wielded over the past few
years, keeping profit margins extremely tight. Certainly the departure of Select Medical
Corporation from the Canadian market also highlighted this aspect, since Select Medical exited
the Canadian outpatient rehabilitation market only to expand by acquisition in the same field in
the United States. There, the market is presumably more lucrative than in Canada, and in
addition, conditions are more conducive to integration of physiotherapy with specialty hospitals
and contract rehabilitation services.
Third, there appears to be a limit to the capacity of Ontario governments and regulators to
withstand the pressure of interest groups representing consumers and insurance companies and
their objections to rising premiums, rising costs and falling profits. While FSCO’s lowering of
the fees paid for physiotherapy and other health services in 2003 was one response to rising
costs, a government committed to letting free and competitive markets work might have had
another response. It might have allowed the pressures of rising health care costs on insurers to
lead to a consolidation of the fragmented MVA insurer sector to the point that larger insurers
could have greater bargaining power in their relationships with providers themselves. Another
alternative would have been for insurers to develop a greater capacity within themselves to
manage the health care being delivered to their customers in a style, for example, more akin to
the health maintenance organizations in the United States. Aviva Canada’s efforts to create a
preferred provider network goes some way toward this model, but some key informants’ view
that the method will neither be highly successful nor followed by others is significant. These
comments all point to distinct governmental responses in the Canadian and American markets.
224
Fourth, predictions about transnational investment patterns assume similarity in markets
and a good deal of the discussion about removing trade barriers is about harmonizing technical
standards and processes. Many of these assumptions hold true in manufacturing, and that is the
source of many of the expectations about the effects of foreign investment. Whereas knowledge
of manufacturing in the United States may have significant application in Canada, the know-how
gained from operating in the American health care market may not all apply in the Canadian
context. Attempts to integrate health services vertically as U.S. firms including those of Select
Medical, creating links between their acute care and outpatient rehabilitation businesses, are
received well in the United States. Alegro Health’s proposal to integrate its physiotherapy and its
surgical businesses vertically into an effective pathway of care for patients in search of knee
replacement in Ontario was rebuffed. The prospect of FP providers fulfilling a public policy goal
of integrated care was unacceptable, even though the private hospital was already a provider of
surgical services paid by OHIP.
Furthermore, on the insurer side, while basic principles of insurance apply in Ontario’s
insurance market, the tight regulation and segmentation into distinctly different insurance
product lines also appears to make foreign insurers’ expertise less than fully applicable in the
Canadian market. Because of the discontinuity of payment schemes, integration of physiotherapy
services into a continuum of care for patients is very difficult. Again, Aviva Canada’s approach
is illustrative. Its preferred provider network, a modified managed care approach, may not
succeed as it has in other, American markets.
Fifth, all key informants highlighted the impact of a dominant bias of in the Canadian
public and among governments against FP/c providers, especially foreign FP/c providers, being
involved in Canadian health care. They said that the efforts of the major FP/c providers to
emphasize their Canadian ownership illustrates strongly the need for them to be and appear to be
Canadian and allied with perceived Canadian health care values. The efforts of the Canadian
manager of Columbia Health Care (in the LifeMark case) to dissemble the American ownership
of Columbia bolsters this point. Being Canadian-owned as well as Canadian-managed appears to
be a positive strategic differentiator in this market.
Sixth, the key to success and growth for FP/c physiotherapy and rehabilitation
corporations in Canada appears to be diversification out of rehabilitation. LifeMark’s MEDI-
Chair business, CBI’s primary care business, and Alegro’s branching out into surgery and
225
clinical trials* and its strategic alliance with GHIS all suggest strongly that either the
physiotherapy market on its own is too constrained by payers for significant profits or future
gains – even if demand or need are not constrained – or that it is too small, or both. All key
informants said that the potential for growth in the Ontario physiotherapy market is very limited
except in narrow and largely untested areas.
7.3 Overview of findings in this chapter
The Ontario physiotherapy market is contestable – the costs of entry and exit in this
market are low – and the rates of entry and survival at the provincial level reflect those costs.
While the trends in entry, exit and survival were similar at the provincial level and at the
level of different county types – academic, contiguous and other – there was a wide variation
among individual counties that does not seem related to the draw of academic counties, nor to
potential demographically-driven demand changes, nor to pressures due to competition. A key
demographic change (population growth) and the level of competition and location clearly
should have made a difference if there was a significant connection between entry and exit
decisions and these sorts of conditions of the market.
Instead, it appears that, despite key informants’ claims of ‘saturation’ in some areas of the
province (P-2, P-3, P-4, P-5, P-8, P-9), the studies discussed in Chapter 4, section 4.1, indicated
that there was (and continues to be) a significant level of unsatisfied need and demand for
physiotherapy services across the province, and factors more intrinsic to their individual
competitive strategies and the practitioners in the organizations may have been driving entry into
and exit from the market. Such a possibility draws upon the findings in Chapter 4 and 5, where,
for example, the kinds of patients that organizations serve, their degree of specialization, and the
mix of revenues they have, often reflected factors within the organizations themselves and the
therapists in them rather than the corporate form or the profit orientation of the organization.
There was also a noticeable and widespread trend in areas of the province where the vast
majority of the population lives: provider organizations were becoming more numerous but on
average smaller. This is consistent with the findings in Chapter 4 about trends in demand for
services, demand for labour, and a shift in the proportion of registered physiotherapists from
NFP to FP provider organizations.
* The expansion into the clinical trial business is also a strategy of the AIM Health Group, another Canadian-owned
FP/c provider in the Canadian physiotherapy and rehabilitation market.445
226
Findings regarding Hypotheses 4(a) and (b) Hypothesis 4(a) predicted that there would be a consolidation over time of provider
organizations into a smaller number of corporately-owned organizations in this market. While
undoubtedly there was some consolidation of ownership of provider organizations in the market,
the average size of provider organizations decreased in the period 2003 to 2005 and the number
of small provider organizations rose substantially, and the market was dominated by FP/s
organizations rather than FP/c organizations. Thus, there was no evidence of a corporatization of
the provider side of the market. The key informants’ observations about the difficulties of FP/c
provider organizations in keeping recent graduates employed beyond a couple of years (Chapter
4, section 4.5.4) because they want to move to employment settings with more autonomy and
more independence corroborates these findings.
It was also hypothesized (4(b)) that those firms that addressed two features that lowered
contestability of the market – supply of labour and supply of patients – would be more likely to
survive. The results showed that neither had the expected effect. The high mobility of registered
physiotherapists was offered as a possible explanation of the first finding. As for the second, it
was suggested that having preferred provider status was merely an incidental tactic supporting
the more important strategy of attracting and keeping patients through relationships with
physicians in the community and small networks of patients. These alternative suggestions offer
possibilities for future research.
Findings regarding Hypothesis 5 While most revenue sources in this market are public or quasi-public, foreign investment
is fairly high for some of the private revenue sources – as high as 42% of the MVA insurance
sector flows to foreign-owned firms – but there is a small and apparently declining proportion in
the private insurance sector. Despite being open for foreign investment, the market is
characterized by a paucity of foreign ownership and control of providers. This is contrary to
expectations in the fifth hypothesis, and contrary to what seemed to be inevitable trends in the
1990s. This low level of foreign influence points to the nature of the physiotherapy market in
Ontario as compared particularly to the United States market. In Ontario, high levels of payer
control appear to have discouraged widespread consolidation within the providers of
physiotherapy services, rendering the market relatively unattractive to foreign investors. The
extremely limited scope for vertical integration of care by FP providers also appears to be

227
limiting opportunities in the market. As well, the positive image that results from being
Canadian-owned physiotherapy services provider appeared to be significant.
228
Chapter 8 – Discussion and conclusions
This pioneering study of this health care market partly within Medicare and partly outside
has provided a significant range of observations about the functioning of such markets and about
assumptions of behaviour of multiple payers and providers. This chapter starts with a review of
the findings relating to the study’s five research questions (sections 8.1.1 to 8.1.5). Next, in
section 8.1.6, there is a consideration of the features of this market that contributed to the array
of provider types, using transaction costs theory and agency theory. In section 8.17, there are
some observations from a market-level perspective: the physiotherapy market does not conform
to the common expectations about the operation of a health care market, and even though it has
attributes of non-health care markets, it does not behave like them either.
A number of implications for the physiotherapy market and for Canadian health policy
emerge from the findings in this study and they are recorded in sections 8.2 and 8.3.
Finally, because of the nature of the market inquiry in this case, a number of
methodological challenges were encountered, and recording them here can assist future research
efforts in examining other markets in Canada.
8.1 Review of findings
8.1.1 Research Question 1: Behaviour of FP and NFP provider organizations
The literature suggested that there would be differences in behaviour of provider
organizations, depending on their profit orientation and corporate structure. The expectations
were tested against various indicators of market behaviour – use of lower-cost therapists,
location, access to different revenue sources, perceptions of competition, the variety of services
offered, the provision of less and more complex services, and the length of wait lists. In general,
FP and NFP provider organizations differed, with the differences in the expected directions.
However, it was between the FP/c and FP/s groups that the expected differences were not found;
also, NFP Hospitals did not always behave as hypothesized, nor did the smaller Other NFP
group.
8.1.1.1 FP/C AND PF/S PROVIDER ORGANIZATIONS While the FP strategic provider groups were different from the NFP provider groups,
FP/c and FP/s provider organizations behaved similarly in the market. Based on the literature, it
229
was hypothesized that shareholder pressures in FP/c organizations would mean significantly
different approaches to the market than the ‘not only for profit’ FP/s organizations, influenced by
their owners and their closer personal stake in a health profession. However, this study has
illustrated that the differentiation in the literature does not hold at least in the circumstances of
this market. FP/c and FP/s organizations relied on similar, diversified revenue sources, treated
similar patients, and located disproportionately in larger, academic counties. Furthermore, at the
level of the provider organization, FP/c and FP/s providers were similarly small with the same
mean and median number of physiotherapists. Further, FP/s providers, without the corporate
structures of FP/c provider organizations and their access to capital, emerged as the competitors
in the market that were mimicked by the FP/c organizations. This is contrary to a common
assumption that corporations will dominate and displace small, independent providers.
There were some differences between FP/c and FP/s providers – in the number of
services provided and in the proportion of non-registered physiotherapists who provide
physiotherapy services. These areas illustrate the variations in competitive strategy between the
two groups. FP/c organizations tended to provide more opportunities for the sale of multiple,
related services, and FP/s organizations tended to provide patients with the advantage of
personalized, professionally-delivered, though more basic services. FP/c providers tended to
control their costs by using more supporting and assisting personnel while the FP/s provider
organizations appeared to have been controlling costs through their owners supplying labour,
achieving the additional benefits of professional and operational autonomy.
The differences in competitive strategy and capacity suggested the possibility of a more
significant cleavage between the provider groups in the future, and this will be taken up in
section 8.2.
8.1.1.2 NFP HOSPITALS AND OTHER NFP PROVIDERS The NFP Hospital group clearly differentiated itself from the other groups as a result of
close allegiance to the demands and expectations of its majority funder and revenue source, the
MOHLTC. Consistent with the expectations about organizations with NFP status, this group
tended to be less oriented to commercial services, and more to the complex services associated
with its acute care services, which were not provided elsewhere in the health care system. Also
as predicted, NFP Hospitals offered a greater variety of ancillary services, even if their range of
common physiotherapy services was, with the FP/s group of providers, the narrowest. They felt
less competitive pressure than the FP providers, with the majority clearly perceiving that they

230
were isolated from competition. The NFP Hospitals providing physiotherapy services were more
evenly distributed across the province than other provider groups, and did not tend to concentrate
as heavily as other groups in the academic counties. This undoubtedly was a result of their
broader service objective to serve the acute care needs of certain populations, often defined by a
local catchment area, and the terms of their global budgets from the MOHLTC.
In the study period, the proportion of Ontario’s registered physiotherapists employed in
NFP Hospitals declined, continuing a trend observed by Landry28 for an earlier time period. The
absolute number of physiotherapists employed in NFP Hospitals also declined. Under financial
pressure from the MOHLTC and with the incentives inherent in a global budget to shed patients,
NFP Hospitals continued to shift their focus toward their core, inpatient services, and away from
outpatient care. NFP Hospitals were more willing than FP organizations to refer their patients
elsewhere to avoid the effects of their wait lists, which were longer on average than for other
groups. Even when there was MOHLTC pressure to increase non-MOHLTC revenues – a
circumstance in which the literature suggests there would be NFP interest in commercial
revenues – NFP Hospitals as a group did not increase their offerings of outpatient physiotherapy
services and, in the WSIB niche, they provided services less intensively and in ways that were
less remunerative than their FP counterparts did.
Other NFP providers also constituted themselves as a distinct though small strategic
provider group. They were more heterogeneous than other groups, with a diverse set of
individual competitive strategies, generally specializing in niche areas. For example, some
focused on such segments of the market as sports medicine, which can be partly covered by
private insurance sources but generally needs additional funding streams. Others focused on
more specialized services like neurology, evidently filling service gaps in a local area, but the
area of specialization appeared to be congruent with the interests and specialties of the
organization’s managers and therapists. As with NFP Hospitals, wait lists tended to be longer
with this group, but they were more inclined than NFP Hospitals to keep their patients instead of
referring them to other providers. Compared with NFP Hospitals, Other NFP provider
organizations as a group had a significantly broader range of revenue sources, and so they were
not dominated by the objectives of a single revenue source as the NFP Hospitals were.
Individually, these organizations tended to focus on roughly the same number of revenue sources
as all other provider groups, and were likely subject to some pressure from those revenue
sources.

231
Other NFP providers did not focus exclusively on marginalized sectors of society as the
specialization in sports medicine by some providers illustrated. While they perceived themselves
as less affected by competition than FP providers, they were more attuned to competitive
pressures from other providers in the market, especially FP/s providers. Thus, especially when
compared to the NFP Hospitals strategic provider group, they appeared to have been influenced
by the competition from FP providers.
Therefore, as a group, the Other NFP providers conformed more to the usual expectations
of NFP providers in a health care market, with the objectives emerging as a result of the
combination of influences from their managers, employees, communities and revenue sources.
These observations about the differences emphasize a point not generally discussed in the
literature, that is, that NFP providers are not all of a single type and may not be motivated and
operated on the same basis. It is important, then, when examining NFP behaviour, to understand
the full range of pressures and influences in their environments.
8.1.2 Research Question 2: Fragmented payers and cost control
The substantial effect of the revenue sources in this market was highlighted by the fact
that key informants, the documents reviewed for this study, and the databases used, generally
categorized patients in terms of the revenue sources for the care provided to those patients
instead of in terms of the patients’ needs or conditions or some other attribute personal to them.
There was little difference between the public and private revenue sources in this market
in their potential to apply pressure on providers, though the methods, timing and degree of
pressure varied across revenue sources.
The impact of the revenue sources depended on each of the revenue sources maintaining
a control on costs and requiring a differentiated kind or style of service. It is very significant that
the collective power of the revenue sources did not depend on coordination of cost control
efforts. Gildiner446 argued that it was this uncoordinated effort – she labeled it “policy drift”
when state ministries did not coordinate their efforts in relation to selected parts of the
rehabilitation market – that was leading to extensive involvement of investor-owned corporate
providers and high levels of buyer control of practice decisions in the form of “managed care” in
the 1990s. However, this study shows that because the revenue sources were not coordinated,
corporate providers did not enter the market, and FP/s providers were in a better competitive
position.
232
While advocates in favour of a single, monopsonist public payer in the Medicare market
promote such a payer’s power to control cost, quality and access, in the physiotherapy market,
there was no revenue source in the physiotherapy market that dominated it and had enough
power singlehandedly to influence cost and provider behaviour across the market. However, the
multiplicity of revenue sources had an effect similar to that of a monopsonist. Since no revenue
source (other than hospital global budgets) was large enough to support the entire revenue needs
of many individual providers or a strategic provider group, provider organizations generally had
to diversify to survive. But neither was any provider organization or corporate owner of provider
organizations large or influential enough to bargain effectively with a revenue source over the
terms and conditions of payment.*
The revenue sources had and continue to have substantially different terms and
conditions in their payment schemes, and, as a group, reflected all four variations in the Tuohy,
Flood and Stabile’s typology (Chapter 2, section 2.4.3.3) of possible mixes of public and private
insurance: parallel and private systems, co-payments, group-based, and sectoral.21
The presence of atomized revenue sources systematically reduced the opportunities for
vertical integration that the corporate owners of FP/c provider organizations might in other
circumstances have sought and achieved to increase revenue and the total amount of service
provided to individual patients. For example, integrating acute hospital care paid by global
hospital budgets with post-acute physiotherapy services paid for by any one of a number of other
revenue sources with distinct payment schemes is especially difficult. NFP Hospitals in Ontario,
who might be the best positioned to integrate vertically with their otherwise broad service
offerings, moved away from a strategy of integrating outpatient physiotherapy services for
patients, under financial pressure from their dominant revenue source. Two examples from the
case studies in Chapter 7 illustrate the paucity of opportunities of FP providers to achieve
vertical integration as well: Select Medical Corporation’s retreat to the U.S. market where
vertical integration was possible and Alegro Health’s unsuccessful bid to supply orthopaedic
surgery with physiotherapy services.
With fewer possibilities for standardization across revenue streams, the potential
advantages of horizontal integration through corporate ownership of provider organizations also
appear to have been reduced. While there were still opportunities for integration of support
functions like billing, reporting on patient flow and outcomes, this study found that corporate * The only exception might have been the members of Aviva Canada’s preferred provider network (Chapter 5,
section 5.1.1.8), but Aviva largely offered network membership on its own terms rather than on negotiated terms.

233
owners delegated significant autonomy to FP/c provider organizations so that they could respond
to their local community needs, mimicking the approach of FP/s organizations. As an additional
consequence, this study found that significant corporate groups that control FP/c provider
organizations had a strategy to diversify out of this market to increase revenues and profits rather
than continuing to operate solely within its confines.
These findings, then, emphasize the generally understood importance of payers or
revenue sources in a health care market. However, how each behaves and how they affect
providers’ behaviour can be quite different than expected. It is the combination of strategies of
the payers and the interaction of those strategies that contribute to the structure of the market,
and the nature of the strategies cannot be assumed simply on the basis of the payers’ status as
public or private.
8.1.3 Research Question 3: Labour supply and supply of patients
Another key market factor was significant competition for labour supply, particularly
competition for registered physiotherapists. Wage and employment data indicated high demand,
and most key informants confirmed that competition was stiff across the province – in urban and
rural areas, even if for different reasons. Because they were in high demand, physiotherapists
were likely to be able to move from one organization to another easier than if there had been a
surplus of therapists.
There was a significant challenge for provider organizations that employed
physiotherapists to ensure constantly that working conditions and professional development
opportunities – as well as wages – were adequate to recruit and retain staff successfully. That
there were so many FP/s organizations owned and operated by physiotherapists suggests that it
was very difficult for employers of physiotherapists to get this combination of factors right, even
when paying a premium. The tension between providers as they attempted to recruit and retain
physiotherapists points to further pressures for FP/c provider organizations to mimic FP/s
providers to satisfy individual therapists’ professional and personal needs and preferences.
Another feature of this market also touches on the question of physiotherapist mobility.
Of the two cohorts who worked in this market (Chapter 4, section 4.5.4), the first cohort, with
formative experiences prior to the 1990s, though accustomed through experience to upheaval,
could be expected to have been more likely affiliated with longer-established incumbent
organizations. The second cohort was generally more accustomed to and comfortable with
movement between work settings, and within the entrepreneurial challenges arising out of the
234
multiplicity of revenue sources in the market. Thus, mobility may be increasing in this market as
an increasing cohort of physiotherapists with more recent formative experiences regard
movement not only as usual or natural but desirable. The high mobility of physiotherapists
explains in part why their presence in a provider organization was no more likely to survive than
provider organizations without registered physiotherapists.
An important finding that emerged from this study was that health professionals in a
market can have a significant structural effect on the market even if they do not have collective
power gained through a strong self-regulatory scheme or unionization. While registered
physiotherapists collectively did not have the monopoly over supply of labour in this market, the
shortage of physiotherapists and their historical reputation as suppliers contributed significantly
to the market structure: the dominance of FP/s provider organizations with the individual
therapists’ clinical interests and commitment to professional standards and autonomy as among
the primary goals.
With revenue sources fragmented in this market, the key to a successful supply of
patients for provider organizations was not generally through alliances with revenue sources, for
example, through buyers’ preferred provider networks. Revenue sources in this market could not
require patients to use specific providers, and so such alliances were not likely to be significant
generators of patient volumes. Second, no revenue source was important enough to the average
FP or Other NFP provider that an alliance with a single revenue source could be sufficient and
multiple memberships could be costly to acquire and maintain. While membership of a preferred
provider network may have an effect on a provider organization’s profitability and may have
been a way for developing relationships with patients and their families, various kinds of
relationships with referral sources – local physicians – were thought to be more important.
Thus, the capacity for revenue sources to affect a market with financial incentives
premised on practitioners’ self-interest may be less than is sometimes assumed447 especially
when there is a strong influence of professional norms and a desire for autonomy. Thus,
Freidson’s observation that incentives that appeal to practitioners’ sense of professionalism may
be most effective in a market64 seems applicable in this market.
FP and Other NFP provider organizations depended heavily on relationships with local
physicians for their supply of patients. NFP Hospitals did as well, but also important was the
capacity for physicians to reduce the supply of patients for outpatient physiotherapy services in a

235
hospital by identifying opportunities to refer hospital patients with insurance coverage to
provider organizations outside the hospitals.
Since physician services have traditionally been organized on a small-practice model in
Ontario, physiotherapy organizations have been required to develop relationships at a very local
level to develop referral patterns, and corporate-level contacts were unlikely to be as effective as
localized contacts. For these reasons, the more personal approach FP/s provider organizations
brought to the market was successful and they were consequently perceived as key competitors.
Thus, four key informants (P-1, P-3, P-4, P-9) stressed that provider organizations tied to a single
corporate owner generally have a significant degree of autonomy, with freedom to mimic their
FP/s competitors in seeking local links with referral sources in this market.
8.1.4 Research Question 4: Entry, exit and survival in this market
The survival rate of provider organizations in the physiotherapy market – 80.4% of
providers survived from 2003 to at least 2005 – is within the range of other health and social
services industries in Canada reported by Baldwin et al.204 With respect to size, exiting provider
organizations had on average less than half the number of registered physiotherapists (1.35) than
the entire group of provider organizations that existed in 2003 (3.18) The study period was too
short to determine whether longer incumbency in the market increased the likelihood of survival
but the small size of exiting provider organizations, usually though not necessarily associated
with short incumbency,204 suggested that the physiotherapy market is like other markets in this
respect. In addition, while the number of provider organizations increased, their average size (as
measured by the number of registered physiotherapists) declined, and the new entrant provider
organizations were smaller both than the provider organizations that left the market and those
that survived.
County-level population growth and competition levels were not associated with entry or
survival rates, and two market factors – employing physiotherapists and being a preferred
provider – did not have the hypothesized positive effect on survival, though the marketing effort
represented by Yellow Pages advertising did.
These findings illustrate strongly that assumptions about inevitable consolidation in a
health care market can be wrong. Here, the other features of the market – atomized demand, high
cost control and health professionals’ strong desire for professional and personal autonomy – can
contribute to the continued dominance of small, FP/s provider organizations.

236
8.1.5 Research Question 5: Foreign investment
This study’s hypothesis about foreign investment in the physiotherapy market – that there
was a significant presence of foreign corporate providers and insurers – was not supported at all
by the findings. Only in one revenue stream, MVA insurance, did foreign insurers have a
significant presence, and the proportion of foreign owned MVA insurance companies declined in
the study period. There was also a decline in foreign ownership in the private insurance sector.
Furthermore, there was very little foreign ownership of provider organizations, and two of the
three case studies showed that foreign investors in provider organizations had divested their
Canadian holdings. Foreign corporate providers were less interested in this market than domestic
corporate providers – and therefore left the market and stayed away. These findings are
important for advocates in favour or against foreign corporate involvement in a Canadian health
care market since they indicate that analogies from other industries are not applicable to health
care markets, and an examination of underlying market structure and the comparative
attractiveness are necessary before predicting foreign investment in a health care market.
8.1.6 Key organization-level features of the market
To illustrate the key structural features of the market that have contributed to the findings
from all five research questions, an explanatory framework, derived from Porter’s “five forces
model”,15 was developed (Figure 8-1).
The competitive pressure of buyers (revenue sources) in this market had a very
significant effect in shaping the competitive strategies of the FP provider organizations, to the
point that there were few differences between the FP/c and FP/s strategic provider groups. They
also significantly affected NFP Hospitals, and to a lesser extent, Other NFP providers also. The
key structural features were fragmented buyers and cost control by buyers. Labour supply, in
high demand, and the suppliers of patients (referrals) to physiotherapy organizations also had
significant effects on the general trend of dominant presence of small provider organizations in
the market.
There was little evidence of competitive pressures from substitutes, though there were
indications that changing health human resources regulations may make the market more
susceptible to these pressures in the future.
Transactions cost theory (section 2.2.2.2, Chapter 2) provides the best general
explanation of the market phenomena discussed in this study. The essential transaction in this
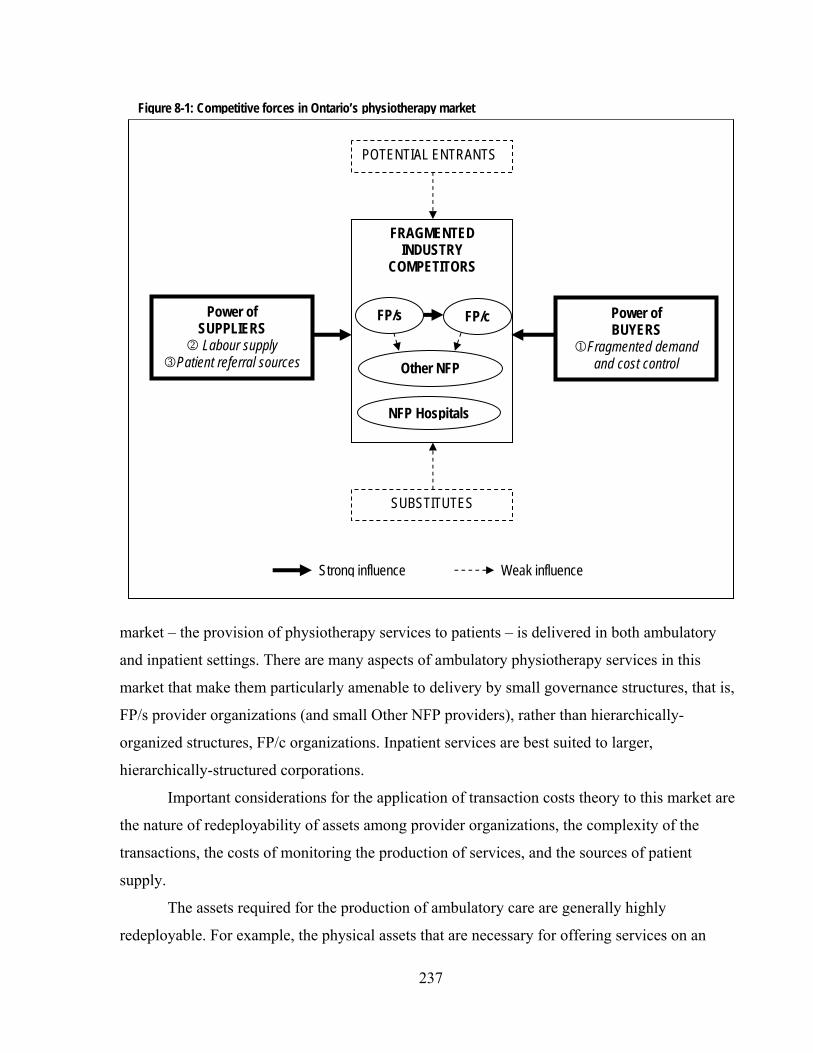
237
market – the provision of physiotherapy services to patients – is delivered in both ambulatory
and inpatient settings. There are many aspects of ambulatory physiotherapy services in this
market that make them particularly amenable to delivery by small governance structures, that is,
FP/s provider organizations (and small Other NFP providers), rather than hierarchically-
organized structures, FP/c organizations. Inpatient services are best suited to larger,
hierarchically-structured corporations.
Important considerations for the application of transaction costs theory to this market are
the nature of redeployability of assets among provider organizations, the complexity of the
transactions, the costs of monitoring the production of services, and the sources of patient
supply.
The assets required for the production of ambulatory care are generally highly
redeployable. For example, the physical assets that are necessary for offering services on an
Figure 8-1: Competitive forces in Ontario’s physiotherapy market
POTENTIAL ENTRANTS
FRAGMENTED INDUSTRY
COMPETITORS
FP/s FP/c
Other NFP
NFP Hospitals
Power of BUYERS
1Fragmented demand and cost control
Power of SUPPLIERS
2 Labour supply 3Patient referral sources
SUBSTITUTES
Strong influence Weak influence
238
ambulatory basis are minimal or – in the case of premises – can be disposed to other uses either
within the market or outside it. With respect to human assets, physiotherapists are so
redeployable that some market participants expressed frustration at the rates at which provider
organizations gain and lose therapists (section 4.5.1, Chapter 4). Even premium wages paid by
FP/c provider organizations did not necessarily secure long tenure of therapists; physiotherapists
in this market were profession-oriented and appeared to place significant value on professional
autonomy and control over their own areas of practice.
The services provided on an ambulatory basis are complex since they are responsive not
only to patients’ needs but to the structure of the payment scheme of the revenue source or
sources paying for the care. Therapists design treatment plans tailored to a patient’s needs and
the practicalities of who will pay for the services when and under what circumstances.
These kinds of complex services are not so easily observable remotely from a corporate
headquarters. The extent of the data collection that the MVA insurers developed to try to monitor
delivery of their Pre-Approved Framework for whiplash injuries, and that the WSIB developed
to try to monitor the delivery of its Program of Care (Tables 5-2 and 5-4, Chapter 5), illustrate
the cost of such remote verification of the provision of physiotherapy services. Such services are
more suited to monitoring by peers, who can observe and assess variations reflecting specific
circumstances. (They are also suited to monitoring by patients who may not know the mechanics
and rationale for their treatment but will understand the outcome.) Thus, a small organization
with internal, peer-oriented monitoring capability is likely to be the least costly form for
providing ambulatory services.
Patient supply in this market is secured at the local level, and local rather than centralized
or regionalized corporate efforts to secure patient supply were the most effective at the lowest
cost. It was the expertise of local provider organizations in developing relationships with referral
sources that resulted in a flow of business, and to date, regional or provincial corporate branding
has little effect on these referral patterns.
Thus, in the ambulatory setting, the best ‘governance structure’ is the small FP/s provider
organization or small Other NFP providers.
A different set of forces was at play in inpatient care. The inpatient niche is much less
contestable than ambulatory services (section 2.2.5.1, Chapter 2). Though labour inputs appear in
aggregate to be as redeployable as in the other parts of the market, there are higher needs to
integrate physiotherapy services, including specialized services, with other hospital services.

239
This integration is more feasible within a hierarchical rather than through a market (or
contracted) organization. As well, the physical premises for these inpatient services are
obviously less redeployable than an ambulatory setting. While the allocation of a global budget
within a hospital has its own internal complexities and costs, the complexities are more easily
accommodated within a hierarchical structure where authority can be exercised to enforce
decisions rather than resorting to constant bargaining to achieve the desired allocations and
service integration. For these reasons, NFP Hospitals appear to be the ideal governance structure
for inpatient services.
While the conclusion that hospitals are the most effective place for the delivery of
inpatient services may appear simplistically obvious, it is the implications of this observation in
two areas that makes it more compelling. First, while there was evidence that a few hospitals in
Ontario have contracted with other, FP providers for the provision of physiotherapy services in
those hospitals, this was fairly limited in extent across the province, and for the reasons laid out
here, it seems unlikely that market (contract) arrangements for these services would be the ideal
governance structure nor that such arrangements would be, in the long term, sustainable.
Contracting for outpatient services would seem to have greater potential success though it is less
likely to be as successful as care provided in free-standing FP/s structures, contracted on a
patient-by-patient basis.
The finding also suggests that NFP Hospitals are indeed less suited to producing for the
multi-payer environment of ambulatory services. From the perspective of minimizing transaction
costs, the overall costs of producing ambulatory physiotherapy services are lower in FP/s
organizations than in NFP Hospitals. The low level of production of WSIB outpatient services by
NFP Hospitals underlines this conclusion. It is important to acknowledge that these observations
have implications for access, particularly where non-hospital revenue sources are not available to
all patients.
In these ways, transaction costs theory provides a strong rationale for the market structure
for the period under study, with a particular emphasis on the rationale for the predominance of
FP/s provider organizations. The application of the theory also suggests strongly that this well-
established market is likely to continue largely in its current form, including the continued
reduced market share for NFP Hospitals.
The conclusions about the appropriate settings for ambulatory and inpatient
physiotherapy services are subject, of course, to considerations of potential shocks to the market

240
and potential alternative policies and methods for allocating access to physiotherapy services.
These will be discussed in section 8.3.
One aspect of the market that transaction costs theory does not explain well is the
continued viability and existence of corporately-owned FP/c provider organizations. If the
market is structured in such a way to favour the small, locally-connected, health-professional-run
FP/s provider organization as the ideal governance structures, why do FP/c provider
organizations continue to exist?
To some extent, the evidence shows that FP/c provider organizations, though owned
corporately, function like their FP/s competitors, with considerable autonomy. The premium
wages they pay (compared to FP/s providers) and the need to return a profit to shareholders may
be accommodated within the economies of scale they are able to generate on corporately-
provided functions, such as billing and reporting systems.
But agency theory provides some additional explanations. First, the owners and
management are merged in FP/s, resulting in unity of purpose and direction and consensus in the
kinds of tradeoffs that are to be made in such areas as revenues and professional preferences.
However, disinterested shareholders of corporate owners of FP/c organizations are likely not
quite so amenable to making these kinds of tradeoffs. Despite potential problems aligning
incentives between shareholders and managers, at a certain point, shareholders’ demands for
returns on investment require adjustments to corporate strategy. Thus, in reaction to the
significant constraints within the physiotherapy market, the corporations active in the
physiotherapy market have been moving to diversify out of the market into other areas – some
connected to physiotherapy services, some not, including home medical equipment, clinical
trials, surgical services -- that, at least on their face, are more amenable to hierarchical
governance (within a corporation).
Second, there is a pervasive concern about the quality and effectiveness of physiotherapy
services just as there is for other health services. Two revenue sources, WSIB and MVA insurers,
have demanded data to monitor quality, and FP/c organizations seem better structured to manage
these additions to the basic provision of physiotherapy services. Similarly, Aviva Canada’s
preferred provider network arrangement increased the costs of the services provided in terms of
accreditation and the building of business processes and systems to maintain accreditation, and
these are more effectively accommodated by FP/c providers. Domestic corporate owners appear
to be convinced that these kinds of costlier demands by revenue sources will continue and

241
spread, providing them with a clear advantage, a better organization form, to handle these costs
in the longer term. The question of monitoring quality and effectiveness is taken up in section
8.3, in the discussion of the future of the physiotherapy market.
The finding of an absence of foreign investors in this market reflects the predominant
market features as well. Aside from those discussed, there is no compelling role for corporately-
owned provider organizations operating exclusively in the physiotherapy market, and it is
understandable that foreign corporations would not be interested in this market.
8.1.7 Market-level observations – neither planned nor ideal
While transaction costs theory and agency theory provide some explanations for the
organizational arrangements in the market, the constitution of the entire market did not behave in
a way that theory would suggest. The physiotherapy market in Ontario cannot be characterized
as either a planned health care market or a standard market with the attributes of ideal markets as
described in Chapter 2, section 2.1 Instead, it has features of both. The interesting result is that
individual physiotherapists’ professionalism and preferences are the predominant guiding forces
in this market, with government plans and policies, prices, and perhaps even patients’
preferences taking subordinate roles.
Not a planned market
As discussed in Chapter 2, section 2.2.4, a significant portion of the Canadian health care
system is planned in the sense that there is substantial governmental control or influence over
significant aspects of the market, including what services will be provided, how they will be
provided, and who has access to them. Under the Canada Health Act17 and related provincial
laws, there is a single public payer – a government or government agency – in each province and
territory for hospital and physician services under Medicare. The payers in each jurisdiction have
a significant say in defining the content of these services, and there is also substantial
governmental influence over the entry and exit of health service providers that serve Medicare
patients through influence over capital financing, designation of providers eligible for public
funding, and educational policies and funding. Furthermore, the central policy objective that
Medicare was designed to achieve was ensuring that hospital and physician services are provided
on the basis of a person’s need rather than his or her ability to pay.
In contrast, there is no centralized planning or control of the physiotherapy market. The
Ontario government has a direct interest only in parts of the physiotherapy market – directly
providing revenue in three streams for providers it designates, but the degree of control in these

242
areas is limited. For example, in NFP Hospitals, where there is an opportunity for governmental
involvement because of global budget funding arrangements, government has not taken up the
opportunity in respect of physiotherapy services, and policy decisions about the allocation of
resources within individual hospitals are left to hospital managers and boards of directors. In any
event, NFP Hospitals have a declining share of this market and FP providers have an increasing
share, partly encouraged by public funding pressures on hospitals. Where elements of
governmental control were exercised in this market, as in fee-setting for OHIP designated
clinics, only blunt, indirect instruments were infrequently used, as in the case of the Financial
Commission of Ontario’s change in 2003 in the maximum level of fees physiotherapy providers
could charge MVA insurers.
With respect to providers, the government has established a framework for the scope of
practice of some of the potential providers in the market (Chapter 4, section 4.4.1) but has not
established significant control over aspects of labour supply or the role of potential substitutes.
Indeed, it has recently broadened the range of provider groups who will self-regulate and who
may be involved in this market, but has not constrained the potential of unregulated providers in
the market.
Therefore, the government does not play a major role in shaping the market either in
respect of the kinds of services that are supplied, nor who can provide them nor who has access
to them. This relative absence of governmental influence in the market is unexpected in Canada,
particularly in contrast to Medicare services. For example, as discussed earlier (section 8.1.2),
Gildiner446 catalogued the lack of coordinated or sustained regulatory or even supervisory efforts
on the part of three Ontario government ministries in the broader field of rehabilitation
(encompassing physiotherapy) and called this level of governmental involvement “policy drift”.
This she contrasted with the rehabilitation market of an earlier time, in which the majority of
physiotherapy services were provided in NFP Hospitals, assumed and believed to be extensions
of, or subject to significant control and regulation by, the government.
The result of this lack of significant government involvement is that usual mechanisms in
a planned market for establishing priorities among patients and among types of care, for setting
price levels, for increasing or decreasing supply of services, are not widely in evidence. A
consequence is that answers to the important question about whether needs – or demands – for
physiotherapy are being met in this market are not known. The review of attempts to estimate
need and even supply in Chapter 4, section 4.1, illustrated the problems that researchers

243
dedicated to discovering the relationship of need or demand and supply have had. While there
are clear shifts in the settings where care is delivered and some indications in the literature that
there are issues of inadequate access for at least some patients with needs as a result of policy
decisions and non-decisions, it has been difficult to quantify the extent to which there are needs
and gaps between need and supply and what effect the shift of physiotherapy services out of NFP
Hospitals into community-based FP settings has had.
Not a standard market
While not a planned market, this market is one that appears in several respects to be
guided by market principles and forces, and there is, unlike other health care markets in Canada,
scope for competition among providers and patient choice of type of practitioner. There is the
opportunity for individuals to purchase certain services without health professionals acting in a
gatekeeper role even if the services may not be strictly “needed”. There are significant
opportunities for substitution of providers because of fairly loose occupational protection for
self-regulated physiotherapists. Indeed, the recognition of new groups – kinesiologists,
naturopaths, and traditional Chinese medicine practitioners – as self-regulated health
professionals widens even further the range of choices patients have for their physiotherapy
services, creating opportunities for competition among practitioners and provider organizations.
In such a market, with attributes similar to those in a standard (or ideal) market,
expectations in the literature would be for price signals to play an important part in decisions
about which services would be supplied in the market and by whom. It would also be expected
that profit-seeking providers would dominate the market.
Nonetheless, in this unplanned, relatively unregulated market the extent of involvement
of individual consumers in the buying decisions is limited. Though some participants hope that
there will be increased buying from individual patients as needs increase over time and patients’
expectations change, there continued to be heavy reliance on insurance (Chapter 5, section
5.2.3.2).
However, there is no evidence that insurers coordinated their pricing practices to reflect
their relative valuations of the physiotherapy services for different groups of patients. Nor is
there evidence that they adjusted their fee schedules to ensure an optimum level of service for
any of their covered patients:* largely, payers left questions of extent and type of treatment to
* While MVA insurers (with the assistance of FSCO) and the WSIB appear to have set the fees they were willing to
pay for their PAF and Programs of Care with patients’ needs in mind, it is reasonable to expect that cost-control goals were in play as well. Furthermore, these fees constitute only part of the services they insure.
244
providers, reducing the amount of information the payer’s price conveyed to providers. Instead,
this study found a largely uncoordinated but effective strategy of overall cost control by insurers.
Even if the insurers in this market had been making calculated decisions about the value
of physiotherapy services for their customers relative to other insurers’ customers, the provider
organizations did not appear to respond to the price signals as they might be expected to. While
they certainly were not indifferent to the need to generate a surplus of revenue over expenses
over time, provider organizations have not worked to achieve this goal in a consistent fashion.
The choices of the revenue sources pursued by the dominant FP/s provider organizations
reflected combinations of revenue sources based on factors other than price alone. While FP/c
providers might be expected to have been more adept or interested in optimal revenue mixes, the
study did not show that their choices were much different from the FP/s providers. Thus, while in
a standard market prices guide the ‘appropriate’ production of services, in this market, other
considerations appear to be at least as important if not more.
Conclusion
In sum, though this is a health care market, it is not characterized by a high level of
planning as in other areas of health care in Canada. Also, in this market, with multiple payers and
multiple competing providers, with significant potential choices among providers and relatively
little formal regulation of fees across the market, expectations that profit maximization would
predominantly motivate sellers and prices would guide what services are produced and for whom
were not met. Instead, the market had characteristics of both planned and standard markets, and
the professional norms and practice preferences of individual practitioners emerged as very
significant factors in overall market performance in responding to the needs (and demands) of
Ontario patients. This means that the important questions whether those needs and demands are
being met remains unanswered and whether the pattern of provision is appropriate from a policy
perspective has yet to be explored.
8.2 Implications for the future of the physiotherapy market
The physiotherapy market in the period under study was in a state of high fragmentation
of both buyers and sellers. The principal factors giving rise to this level of fragmentation were
the regulatory framework which recognizes a wide variety of distinct insurance types, and the
power of the highly differentiated revenue sources and the power of suppliers to the market –
both labour and referrals of patients. The structure of the market was also affected by the absence

245
of an effective source of substitute services, and by the small size of the new entrants into the
market. Changes in any of these dimensions could disrupt the market, and a brief review of some
of the potential sources for change follow.
The revenue sources and the dominant players in the market, the FP/s provider
organizations, appeared to have reached a state of relative balance among themselves. The
revenue sources appear to be able to continue to be able to control costs with the range of tools
available to them, and the FP/s have accommodated these circumstances, setting the tone for the
market and for an increasingly fragmented provider organization pool.
In light of this balance, it seems unlikely that changes will be made to bring the various
insurance niches more in line with each other. Indeed, it was the attempted alignment of MVA
insurance with the WSIB scheme (introducing principles of no-fault and comprehensive benefits
for the victims of accidents) that caused major disruptions in the MVA market in the 1990s.
The capacity of the revenue sources to maintain a level of cost control has been relatively
solid, but it remains a possibility that any one of the revenue sources might undergo some
significant change that disrupts the current state as the changes to the MVA insurance regime did
in the 1990s and the early 2000s. One potential source of disruption could be the apparently
increasing interest in the quality of care and in the accountability of providers for improved
health and health outcomes of their patients. If the various interested revenue sources increase
their demands for formal reporting on quality and evidence of continuing improvement, the
burdens of data collection and reporting may be, as discussed, an advantage for FP/c providers,
leading to a systematic preference for FP/c and the decline in the importance of FP/s providers.
Whether this interest in quality reporting will materialize in more insistent demands is not
known, but there are some observations about the market that suggest that this might be difficult.
First, in the WSIB and MVA niches where demands for data reporting have been introduced, a
significant number of FP/c and FP/s providers do not provide services to patients whose care is
paid for by those revenue sources, at least in part driven by the low fees paid by the WSIB and
the 30% cut in MVA fees in 2003 and in part by the desire not to bear the burden of reporting. If
fewer providers are in these niches, the capacity of these revenue sources to require information
and reporting would be reduced, and their capacity to act on the information they receive would
be limited. Revenue sources’ capacity to make demands and induce compliance is also limited
by the fact that they do not have common services or information requirements. If they did, their
combined attractiveness as revenue sources, and consequently, their combined power, might

246
have influenced more providers to develop the capacity to respond, and such a capacity might
encourage FP/s providers to consolidate into FP/c providers.
The observation that FP/s providers having less capacity to cope with the strict
requirements for detailed reporting to certain insurers, particularly MVA insurance and WSIB,
may obscure the obverse: while they may not be positioned to deal with demanding controls of
the revenue sources, FP/s providers may be best positioned to be deal with the tasks of
determining patients’ different levels of abilities to pay and settling on individualized rather than
standardized fees for patients who pay for their own care. Several key informants (P-1, P-2, P-3,
P-5, P-9) agreed that FP/s providers have an advantage in the area of trust and reputation in their
local community that FP/c providers can overcome but only with considerable effort and
infrastructure. Thus, though increases in demands for reporting on process and outcomes may
favour FP/c provider organizations for specific revenue sources, it is not likely to mean the
demise of FP/s providers.
While it is impossible for any provider in the market to claim that emphasis on quality
and outcomes is undesirable, there appears to be a significant issue as to whether it is the revenue
sources that should be collecting information on quality and outcomes and acting on that
information. Health professionals and, potentially, patients, may perceive payers’ interest in
quality to be tainted by payers’ natural interest in cost control. Health professionals’ expectations
of professional autonomy and self-regulation suggest more involvement by professional
associations and the regulatory Colleges rather than by payers in the monitoring of quality, but
whether these organizations have the means to do so as vigorously as certain of the revenue
sources would want is not clear. Several key informants (P-3, P-4, P-8, P-9, R-1) intimated that
Colleges outside Ontario (particularly Alberta’s) might provide models for enhanced
involvement in quality monitoring and the development of the therapists in the Ontario market.
Regarding the supply of labour to the market, the introduction of new regulated health
professionals clearly has the potential to dilute the influence of registered physiotherapists. It
also raises the possibility of increased competitive pressure from substitute services as new
professional groups organize their service offerings to the public. Increased supply of labour may
decrease mobility and the opportunities for physiotherapists. However, the effect of this increase
in supply of regulated health professionals in the physiotherapy market is unlikely to have a
significant near-term effect. There appears to be a deep conservatism built into revenue sources’
payment structures as they use gatekeepers (principally physicians) to control access to

247
physiotherapists, who have been able to accept patients directly for many years. Furthermore,
these patterns of referrals from physicians are likely to remain stable for some time.
If larger physician group practice models such as Family Health Teams448 continue to
encouraged in Ontario, the FP/s providers’ advantage may be reduced and the capacity of FP/c
providers, who have a wider variety of services on offer, may have greater advantages with the
larger referral sources. Furthermore, such models as Family Health Teams emphasize
interprofessional or multidisciplinary care, breaking down the concept that only a specific
professional grouping can provide certain kinds of care. This may further encourage the
development of the influence of the new health professional groups and substitutes. However,
even with Family Health Teams’ multidisciplinary approach, physicians in those Teams, not
responsible or perhaps even aware of the costs of care beyond their walls, are unlikely to change
quickly their patterns of referral to health professionals they have trusted for years.
With respect to the revenue sources in the market, the nature of Medicare (physician and
hospital services) funding in the country continues to be in contention. In several provinces,
including, of course, Québec where the Chaoulli156 case originated, there have been recent
government statements about the possibility of introducing more private funding for Medicare
health care. In Ontario, the Ontario Chamber of Commerce has recently tried to re-energize the
debate in favour of private funding and delivery of health care services.32 Any concrete moves in
this area could introduce additional possibilities for vertical integration in those provinces, as
private insurers would desire to engage in financing a full range of health services, and their
demands and offerings might spread to Ontario. However, the Supreme Court of Canada’s
decision in the Chaoulli case156 appeared to permit, in keeping with Charter rights, the purchase
of truncated or circumscribed insurance products only – that is, private insurance only for any
failure of the publicly-financed health care system to provide timely care in cases of high risk of
death or serious disability. While it is doubtful that these kinds of insurance products would be
offered by insurers,449;450 even if they were, they seem unlikely to upset current models of
delivery very much, based on the result of current fragmentation among revenue sources in the
physiotherapy market.
8.3 Implications for Canadian health policy
These findings provide several implications with respect to the health policy issues that
were raised at the outset of this study report: FP and NFP delivery of care, the role of public and

248
private financing of health care, the role of health professional groups that are less powerful than
physicians, and patterns of investment in a health care market by FP entrepreneurs.
First, this study of the physiotherapy market has shown that while common stereotypes
about FP and NFP health care providers may provide a general guide to their behaviour, the
incentives and motivations inherent in the stereotypes may not reflect the pressures that such
providers face in real, not ideal, markets.
In particular, this study has shown that strong pressure from revenue sources can manifest
and influence significantly the organizational form of health care providers even though no
revenue source dominates the market. In this market, the wide range of revenue sources and their
complex web of different coverage, terms and conditions – and the regulatory structure and the
willingness of public payers tenaciously to resist price inflation – were such that predictions of
overwhelming dominance by corporately-owned providers were found not to be correct. In fact,
small domestic provider organizations, most health professional-owned, were found best able to
respond organizationally to the structure of the revenue sources. The small providers’ behaviours
were mimicked by the corporately-owned provider organizations. Other NFP providers were also
similar to FP/s providers, though they found opportunities in this market to specialize in niches.
However, it must be noted that the general pressures for profits that are expected from
shareholders of FP/c firms do not merely disappear or go into suspension when the FP/s form is
dominant. In this market, there was evidence of diversification by FP/c corporate owners out of
this market in search of better profit opportunities.
NFP Hospitals, best suited to responding to the pressures of the MOHLTC global budget
revenue source, had a significant but declining position in the market. While the various threads
of NFP theory suggest different possible motivating factors for NFP behaviour, the NFP
Hospitals in this study illustrate that NFP providers can be dominated by their revenue source,
and they may avoid commercial opportunities to expand their service offerings because of
political or managerial constraints even if their dominant funding is constrained. Accordingly,
popular conceptions of a profound community orientation of NFP providers (inherent in many of
the arguments of opponents of ‘for-profit health care’) may not reflect the actual forces at play,
and scrutiny of revenue sources’ demands is required to understand the rationale for NFP
providers’ actions. In particular, some NFP providers (hospitals) may be less suited for the
provision of certain kinds of care – here, ambulatory care in the circumstances of multiple cost-
conscious revenue sources – than other organizations types.
249
From these observations, it appears important that there be meaningful cost control
capacity among payers in health care fields where FP provider organizations are permitted to
operate, and that, where it is possible for care to be delivered by smaller professional-owned
provider organizations, that there be effective education and regulatory systems in place to instill
and sustain professionalism (also discussed below). With respect to health care fields that require
more complicated, larger corporate organization forms, NFP provider organizations may be most
reliably called upon to provide services while conforming to payers’ demands, because FP
providers are likely to avoid the market if there is effective cost and revenue control. However, it
also appears important to ensure that the payer demands relayed to NFP provider organizations
align with public policy goals at the community or provincial level.
The single payer model, much admired for its ability to contain Medicare costs in
Canada, is not the only model that can achieve cost control. In the physiotherapy market, a
complex mix of revenue sources, each with its own scope of coverage and payment approach,
has contained costs. The objective has been achieved because a variety of public and quasi-
public payers have resisted an upward drift of costs. As well, among the private payers, this cost
containment has been achieved with the assistance and periodic intervention of a public regulator
(for MVA insurance) or through caps on coverage (as in private insurance) that effectively shift
the risk of payment for unplanned quantities of care to patients or, to a limited extent, to
providers. Thus, while opening markets to private insurers could be unaccompanied by
significant regulatory mechanisms, it is appropriate regulation that may keep the insurance
market viable in the long term by backstopping levels of price and overall cost control.
Regulation could be especially necessary if there are numerous insurers in a market none of
which enough power to negotiate successfully with providers or if insurers’ interests do not
necessarily align with broader public policy goals of, for example, access or quality.
With respect to the supply of health care labour, the usual Ontario discussion revolves
around physicians, the power of their professional association bargaining agent, the Ontario
Medical Association, and the mechanisms for paying them through a monopsonistic public payer
(Medicare). Physicians’ significant power is not matched by physiotherapists’ in the market
examined here, but the influence that physiotherapists have has arisen from apparent shortages
and not, it appears, from the strength or role of their professional association in the market.
Physiotherapists’ influence is expressed in their high mobility and appears to result in
individuals’ capacity to find a place in the market to accommodate their preferred practice style

250
and areas of specialization. While the revenue sources have a heavy influence on the practice of
physiotherapy and the broader provision of physiotherapy services, individual physiotherapists
have been able to maintain, outside the MVA PAFs and the WSIB Program of Care, a high
degree of autonomy in practice. The need or desire for this degree of autonomy is an interesting
one, especially in light of the historical subordination of physiotherapists to physicians.36 While
theories of professionalism suggest autonomy of the profession is a goal of self-regulation, the
desire for individual autonomy may be more a result of the domination of the physiotherapy
profession by women.36;451
Thus, the lesson from the physiotherapy case is that constrained labour supply can lead to
individual professionals acting on their preferences, and in circumstances such as in the
physiotherapy market, that can mean that a high level of reliance must be placed on
professionalism and professional obligations to patients. It therefore seems important that public
policy makers should be able to assure themselves that the education and regulatory schemes
support a model of professionalism that meets and achieves public goals. Those goals may
change over time, for example, from an emphasis on access to an emphasis on quality, and
professional education and regulatory bodies should have the capacity and inclination to move in
keeping with those public goals. There were indications in this market that a new quality agenda
is being driven at least in part by certain revenue sources, whereas regulators of the profession
might need to assume a larger role to ensure public rather than a narrower private or payer
definition of quality.
Finally, with respect to the expectations in the literature regarding foreign investment in
Canadian health care, a contribution of this study is in highlighting that formal trade and
investment barriers and treaties form only one part of foreign investors’ decisions about potential
investment or divestment. While the physiotherapy market in Ontario has been open to foreign
investment under NAFTA since 1994, there has been little foreign interest in the market, and
what interest there has been has largely dissipated. The structure of a market can play a very
significant role in that such foreign investment can be deterred by relatively unfavourable market
conditions – in the physiotherapy market, the influence of revenue sources and suppliers makes
the market unattractive to corporately-owned provider organizations, and it has been effective to
render the market unpalatable to foreign investors.
Thus, policy makers should observe that blunt instruments like protection for domestic
firms may not be necessary if there are other features of a market, such as effective regulatory

251
powers, regulation, and the capacity for tight payer cost control. These can render the market
more amenable to small businesses and NFPs than to domestic and especially foreign FP/c
organizations.
The bias toward NFP organizations and Canadian service delivery in Canadian health
care markets discussed in Chapter 2, section 2.3.4.2, appears to have had little practical direct
effect on this market. Its structure is most conducive to the existence of small FP or NFP
provider organizations, and the preference for Canadian providers is accommodated through the
supply and regulation of labour to the market: as discussed in Chapter 2, section 2.1.4, the
College of Physiotherapists requires Canadian citizenship or permanent resident or refugee status
for registration.67
8.4 Study challenges and limitations – opportunities for research
While this case study of the physiotherapy market in Ontario was designed to collect and
triangulate data to ensure a full picture of the market, there were challenges that were
encountered. Since this was a pioneering study of a health care market partly inside and partly
outside Medicare, documenting these challenges may be of assistance to future researchers.
Furthermore, the limitations to the study also suggest areas of future research.
8.4.1 Methodological challenges
One of the most significant challenges in approaching this study of the physiotherapy
market was the decision about what aspects of the market to consider. As others have done,287;396
one approach might have been to define the market with reference to an arbitrary though sensible
and significant emphasis on labour inputs, and in particular, registered physiotherapists. Another
approach would have been to define the market by selecting a few major revenue sources in the
market, as Gildiner did419;420;446 or to study the market using broad categories of public and
private funding streams.287 Using either of these approaches would have made the data collection
and analysis significantly narrower. Instead, Porter’s generic ‘five forces’ model provided a
framework within which a wider variety of factors could be considered, and this enriched the
analysis and the findings. For example, without the more comprehensive approach, it is unlikely
that the effect of the complexity of the revenue sources and the comparative strength of
registered physiotherapists would not have been uncovered.

252
A second methodological issue was how to define the physiotherapy market. For this
study, it was decided to define the physiotherapy market principally by asking a broad array of
providers to self-identify as participants in the physiotherapy market and taking their responses
about many aspects of their market activities, including labour inputs and revenue sources, as the
defining features of the market. Of course, devising questions to elicit this kind of data requires
some definition of what possibly could be included in the market. For example, the survey
questionnaire asked respondents whether they offered any of 34 different services in addition to
physiotherapy, from acupuncture to workplace assessments and counselling, and 13 possible
revenue sources. Once the responses were tabulated, it emerged that there were a number of
features of this market for which other data were not readily available. For example, the total
values and distribution of the private insurance and MVA insurance revenue streams are largely
unknown, since it is largely private FP insurance companies who guard their financial data as
proprietary.* The triangulation strategy described in Chapter 3 was designed to compensate for
some of these expected data challenges, but in many areas, only after the study was it possible to
describe the data that would have been helpful. For example, the role of professionalism and the
potential effect of female domination of the physiotherapy profession arose as possible
explanatory factors, and data about the gender of professionals might have cast additional light
on the similarities and differences among different strategic groups of provider organizations.
Fortunately, one of contributions of this study is a keener picture of some of the factors that
appear to make a difference in defining health care market structures, and with this study at hand,
participants in such markets may be able to be convinced to share their data with researchers
because of the potential policy implications.
Another significant challenge was the use of a multitude of data sources. For example,
the survey of physiotherapy provider organizations was a significant undertaking, involving
many hours of work by the principal investigator and several research assistants in developing
the instrument, distributing it, receiving it, tabulating the results and analyzing the data. Key
informant interviews were believed necessary to gain further insights into the operation of the
market, and to interpret and contextualize the survey results, but the work involved in
organizing, conducting and transcribing the interviews was also significant. As it turned out, the
survey results also helped to interpret the key informant interview data. The richness of the
collected data has resulted in a significantly more nuanced view of this market and the factors * In the case of the MVA insurance information, even though a major cooperative effort to collect data has been
underway for years, it appears that it will be several more years before even aggregated data are available.371

253
affecting its structure. However, the investment of time and resources was significant and future
researchers should not underestimate the challenges in this regard.
8.4.2 Limitations and opportunities for future research
Any study has its limitations as the study design and practical in-study developments
determine what is to be considered and what is excluded. This study was not exceptional in this
regard.
First, the time period for the study, from 2003 to 2005, was generally calm, aside from
the disruption in fees in the MVA market in 2003 and some disruption in 2005 in the eligibility
criteria for patients whose care in designated clinics was paid by OHIP. This raises the
possibility that the study period has captured not a long term view of the market that may go
through cycles, but instead, has captured a picture of the market at a point of low volatility. Thus,
the finding of relative dominance of domestically-owned FP/s provider organizations in the
market, unexpected from the point of view of FP theory and expectations of foreign investment
levels, may not be an enduring phenomenon. Just as previous studies of this market in times of
extreme volatility and change led to some unfulfilled predictions about future directions for the
market, so this study may lead to flawed predictions.
However, the findings about the market have been placed in their historical context, and
the patterns found in the period 2003 to 2005 appeared to be only incrementally and not
substantially different from those commonly observed over the previous decade. This reduces the
potential negative impact of the choice of this low-volatility period.
The second limitation was in the investigation of the entry, exit and survival patterns in
this market. While rates were examined and potential reasons for market participants to enter or
exit the market were inferred from market conditions, possible future work in this area could
include firm-level characteristics of entrants, survivors and those who leave the market.
A third limitation concerns the investigation of the extent of foreign investment in the
physiotherapy market. The study considered the international trade treaties that apply to this
market and the structure of the market itself, but very few factors extrinsic to the physiotherapy
market have been explored. For example, investment decisions are commonly influenced by
relevant tax considerations, but no investigation of such factors was undertaken in this study.
A fourth limitation is in the area of the role that gender of health professionals can have
in a market. Heap’s study of the history of the physiotherapy profession36 highlights the
importance of gender in the profession’s early development. An interesting next set of questions

254
could involve an investigation of any differences in market participation by female and male
physiotherapists and provider organizations controlled by them.
Fifth, two important issues that have not been addressed in detail are the issues of quality
of care and outcomes. In some measure, this approach reflects the general approach in the
market, that is, to entrust the question of quality and outcomes to the health professionals in the
market, and to entrust the question of access to the payers for services. As discussed in the
previous section, however, there were undercurrents of concern expressed by revenue sources
and key informants about quality and outcomes in the provider community based on either the
providers’ incapacity or unwillingness of some providers to report or keep data on process and
outcomes. Possible future work in this market could usefully include investigations of the
activities focused on quality and outcomes at the provider organization level.
This study has also identified a market that is neither a planned one (like Medicare
markets) nor a standard (or ideal) market but has aspects of both. It has advanced the
understanding about the pattern of provision of service that can emerge in such markets, and this
gives rise to the potential for future research into the content of the factors that are important in
this market, professional norms and individual preferences. Such future work could highlight
what influences the development of the norms and preferences and what policy levers could
influence them if different patterns of service provision were desired.
Despite these limitations, this study has examined a range of issues, all involving the
operation of health care markets, including the impact of the interaction of public and private
payers and FP and NFP providers; the influence of health care professionals on the structure of a
market and on the activities of provider organizations in that market; the factors influencing
provider organizations’ entry into, survival in and exit from health care markets; and, the role of
foreign investors in Canadian health care. This study has advanced the understanding of these
contentious issues in Canadian health care policy and how they can affect and be affected by the
structure of a market. It has also advanced the understanding of additional policy levers that may
be available to deal with markets with public and private payers, FP and NFP providers, and the
potential for foreign corporate investors.
255
1. Manitoba Centre for Health Policy. Term list. 2008. Accessed August 5, 2008 at http://mchp-
appserv.cpe.umanitoba.ca/list.php?type=glossary.
2. Culyer AJ. The dictionary of health economics. Cheltenham, UK: Edward Elgar, 2005.
3. Health Canada. Canada Health Act glossary of terms. 2008. Accessed August 5, 2008, at http://www.hc-sc.gc.ca/hcs-sss/medi-assur/res/gloss-eng.php.
4. Canada. Canada Health Act, R.S. 1985, c.C-6. 2003.
5. Ontario. Community Care Access Centres Act, 2001, S.O. 2001, c.33. 2003.
6. Ontario. Long Term Care Act, 1994, S.O. 1994, c.26. 1994.
7. Deber, R. B. Delivering health care services: public, not-for-profit, or private? 2002. Ottawa, Commission on the Future of Health Care in Canada.
8. Organisation for Economic Co-operation and Development. OECD benchmark definition of foreign direct investment, 4th edition. 2008. Accessed August 5, 2008, at http://www.oecd.org/dataoecd/26/50/40193734.pdf.
9. Ontario. Regulated Health Professionals Act, 1991, S.O. 1991, s.27. 2007.
10. Health Canada. Canada's health care system (Medicare). 2008. Accessed August 5, 2008, at http://www.hc-sc.gc.ca/hcs-sss/medi-assur/res/gloss-eng.php.
11. Niche. The Canadian Oxford Dictionary. Don Mills, ON: Oxford University Press, 1998.
12. Ontario. Health Insurance Act, R.S.O. 1990, c.H6. 1990.
13. Ontario. Physiotherapy Act, 1991, S.O. 1991, c.38. 1991.
14. Practitioner. The Canadian Oxford Dictionary. Don Mills, ON: Oxford University Press, 1998.
15. Porter ME. Competitive strategy: techniques for analyzing industries and competitors. New York: Free Press, 1980.
16. Ontario. Workplace Safety and Insurance Act, 1997, S.O. 1997, c.16, Sched.A. 1997.
17. Canada. Canada Health Act, R.S.C. 1985, c.C-6. 1984.
18. Commission on the Future of Health Care in Canada. Building on values: the future of health care in Canada -- Final report. 2002. Ottawa, Commission on the Future of Health Care in Canada.
19. Canadian Life and Health Insurance Association Inc. Submission to the Commission on the Future of Health Care in Canada regarding the role of supplementary health insurance in Canada's health system. 2001. http://www.hc-sc.gc.ca/english/pdf/romanow/pdfs/Canadian%20Life%20and%20Health%20Insurance%20Association%20Inc.pdf.
20. Flood CM, Stabile M, Tuohy CH. The borders of solidarity: how countries determine the public/private mix in spending and the impact on health care. Health Matrix 2002;12:297-356.
256
21. Tuohy CH, Flood CM, Stabile M. How does private finance affect public health care systems? Marshalling the evidence from OECD nations. Journal of Health Politics, Policy and Law 2004;29:359-96.
22. Exploring social insurance: can a does of Europe cure Canadian health care finance? Kingston, ON: McGill-Queen's University Press, 2008.
23. Den Exter A. Blending private and social health insurance in the Netherlands: challenges posed by the EU. In Flood CM, Roach K, Sossin.L., eds. Access to care, access to justice: the legal debate over private health insurance in Canada, pp 257-77. Toronto: University of Toronto Press, 2005.
24. Canadian Health Services Research Foundation. Myth: a parallel private system would reduce waiting times in the public system. 2005. Ottawa, Canadian Health Services Research Foundation.
25. Ontario Physiotherapy Association. Physiotherapy in Ontario. 2006. Accessed August 8, 2006, at http://www.opa.on.ca/physio_ontario.shtml.
26. Coyte P,.McKeever P. Home care: passing the buck. Canadian Journal of Nursing Research 2001;33:11-26.
27. Flood CM,.Archibald T. The illegality of private health care in Canada. CMAJ 2001;164:825-30.
28. Landry, M. D. Physical therapy services in Ontario: assessing a changing public/private mix. 2005. Department of Health Policy, Management and Evaluation, University of Toronto.
29. Deber R,.Williams AP. Policy, payment and participation: Long-term care (LTC) reform in Ontario. Canadian Journal on Aging 1995;14:294-318.
30. Migue J-L. Funding and production of health services: outlook and potential solutions. Ottawa: Commission on the Future of Health Care in Canada, 2002.
31. Crowley, B. L., Ferguson, B., Zitner, D., and Skinner, B. J. Definitely not the Romanow report: achieving equity, sustainability, accountabiliyt and consumer empowerment in Canadian health care. 2002. Accessed on June 3, 2007, at http://www.aims.ca/library/notromanow.pdf.
32. Ontario Chamber of Commerce. A second opinion. 2008. Accessed May 10, 2008, at http://occ.on.ca/private/499.
33. Esmail, N. and Walker, M. How good is Canadian health care? 2007 report: an international comparison of health systems. 2007. Accessed July 17, 2007, at http://www.fraserinstitute.org/commerce.web/product_files/HowGoodHC2007rev.pdf.
34. Castonguay, C. Towards significant changes. 2007. Accessed July 14, 2007, at http://www.aims.ca/library/CHCCGCommentary1E.pdf.
35. Woolhandler S, Campbell T, Himmelstein DU. Costs of health care administration in the United States and Canada. N Engl J Med 2003;349:768-75.
36. Heap R. Physiotherapy's quest for professional status in Ontario, 1950-1980. Canadian Bulletin of Medical History 1995;12:69-99.
37. McKendry, R. Physicians for Ontario: too many? too few? Report of the fact finder on physician resources in Ontario. 1999. Accessed April 15, 2007, at http://www.health.gov.on.ca/english/public/pub/ministry_reports/mckendry/mckendry.html.
38. Chan, B. Supply of physicians' services in Ontario. 1999. North York, Institute for Clinical Evaluative Studies.

257
39. Lomas J, Woods J, Veenstra G. Devolving authority for health care in Canada's provinces: 1. An introduction to the issues. CMAJ 1997;156:371-7.
40. Ontario Health Services Restructuring Commission. Looking back, looking forward: the Ontario Health Services Restructuring Commission (1996-2000): a legacy report. 2000. Toronto, Ontario Health Services Restructuring Commission.
41. Tuohy CH. Accidental logics: the dynamics of change in the health care arena in the United States, Britain, and Canada. New York: Oxford University Press, 1999.
42. Evans RG. Strained mercy: the economics of Canadian health care. Toronto: Butterworths, 1984.
43. Wal-Mart Stores Inc. 400 Health Clinics to Open in Wal-Mart Stores During Next Three Years. 2007. Accessed July 15, 2008, at http://walmartstores.com/FactsNews/NewsRoom/6419.aspx.
44. White, B. Trouble for Wal-Mart's in-store health clinics. 2008. Accessed July 15, 2008, at http://www.bloggingstocks.com/2008/05/14/wal-marts-in-store-heatlh-clinics-to-show-slower-growth/.
45. Bowe, C. Wal-Mart health clinics divide US medics. 2007. Accessed July 15, 2008, at http://www.ft.com/cms/s/5b301a64-093c-11dc-a349-000b5df10621,Authorised=false.html?_i_location=http%3A%2F%2Fwww.ft.com%2Fcms%2Fs%2F0%2F5b301a64-093c-11dc-a349-000b5df10621.html%3Fnclick_check%3D1&_i_referer=&nclick_check=1.
46. North American Free Trade Agreement. 1994. Accessed on August 8, 2006, at http://www.dfait-maeci.gc.ca/nafta-alena/agree-en.asp.
47. General Agreement on Trade in Services. 1995. Accessed on September 6, 2006 at http://www.wto.org/english/docs_e/legal_e/26-gats.pdf.
48. Johnson, J. R. How will international trade agreements affect Canadian health care? 2002. Ottawa, Commission on the Future of Health Care in Canada.
49. Grieshaber-Otto J, Sinclair S. Bad medicine: trade treaties, privatization and health care reform in Canada. Ottawa: Canadian Centre for Policy Alternatives, 2004.
50. Donaldson C. Economics of health care financing: the visible hand, 2d. ed. 2004.
51. Culyer AJ. The nature of the commodity 'health care' and its efficient allocation. Oxford Economic Papers 1971;23:189-211.
52. Phelps CE. Health economics, 3d ed. Boston, Toronto: Addison Wesley, 2003.
53. Deber RB. Getting what we pay for: myths and realities about financing Canada's health care system. Health Law in Canada 2000;21:4-56.
54. Sappington DEM. Incentives in principal-agent relationships. Journal of Economic Perspectives 1991;5:45-66.
55. Choudhry S, Choudhry NK, Brown AD. Unregulated private markets for health care in Canada? Rules of professional misconduct, physician kickbacks and physician self-referral. CMAJ 2004;170:1115-8.
56. Robinson JC. The end of asymmetric information. Journal of Health Politics, Policy and Law 2001;26:1045-53.
57. Leonard KJ,.Wiljer D. Patients are destined to manage their care. Healthcare Quarterly 2007;10:76-8.
258
58. Deber RB, Kraetschmer N, Urowitz S, Sharpe N. Do people want to be autonomous patients? Preferred roles in treatment decision-making in several patient populations. Health Expectations 2007;doi: 10.1111/j.1369-7625.2007.00441.x.
59. Eisenhardt KM. Agency theory: an assessment and review. Academy of Management Review 1989;14:57-74.
60. Cutler DM, Zeckhauser R. Insurance markets and adverse selection. In Culyer AJ, Newhouse JP, eds. Handbook of health economics, Amsterdam: Elsevier, 2000.
61. Dhaval, D. and Kaestner, R. Health insurance and ex ante moral hazard: evidence from Medicare. 2006. Accessed February 12, 2008, at http://www.nber.org/papers/w12764.
62. Williamson OE. Calculativeness, trust, and economic organization. Journal of Law and Economics 1993;36:453-86.
63. Ontario, Health Professions Legislation Review. Striking a new balance: a blueprint for the regulation of Ontario's health professions: recommendations of the Health Professions Legislation Review. 1989. Toronto, Queen's Printer.
64. Freidson E. Professionalism reborn: theory, prophecy, and policy. Chicago: University of Chicago Press, 1994.
65. College of Physiotherapists of Ontario. About the college: who we are. 2006. Accessed on November 22, 2006, at http://www.collegept.org/college/default.aspx?xml=about/who/default.xml&bct=2.2.
66. Ontario. Regulated Health Professionals Act, 1991, S.O. 1991, c.18, as amended by S.O. 2007, c.10. 2007.
67. Ontario. Regulation 532/98, as amended to O.Reg. 68/06. 2008.
68. Ontario. Health Professionals Procedural Code, being Schedule 2 of the Regulated Health Professionals Act, 1991, S.O. 1991. 2007.
69. Ontario. Nursing Act, 1991, S.O. 1991, c.32. 1991.
70. Ontario. Chiropractic Act, 1991, S.O. 1991, c.21. 1991.
71. Ontario. Traditional Chinese Medicine Act, 2006, S.O. 2006, c.27. 2007.
72. Ontario. Local Health System Integration Act, 2006, S.O. 2006, c.4, s.28. 2006.
73. Hotelling H. Stability in competition. Economic Journal 1929;39:41-57.
74. Kim J,.Mahoney JT. Property rights theory, transaction costs theory, and agency theory: an organizational economics approach to strategic management. Managerial and Decision Economics 2005;26:223-42.
75. Williamson OE. Transaction cost economics: how it works; where it is headed. De Economist 1998;146:23-58.
76. Williamson OE. The mechanisms of governance. New York: Oxford University Press, 1996.
77. Williamson OE. The economic institutions of capitalism. New York: Free Press, 1985.
78. Shepard A. Contractual form, retail price, and asset characteristics in gasoline retailing. RAND Journal of Economics 1993;24:58-77.

259
79. Hubbard TN. Affiliation, integration and information: ownership incentives and industry structure. Journal of Industrial Economics 2004;LII:201-27.
80. Williamson OE. The theory of the firm as governance structure: from choice to contract. The Journal of Economic Perspectives 2002;16:171-95.
81. Jensen MC,.Meckling WH. Rights and production functions: an application to labor-managed firms and codetermination. Journal of Business 1979;52:469-506.
82. Robinson JC. Organizational economics and health care markets. Health Services Research 2001;36:177-89.
83. Hubbard TN. Viewpoint: empirical reseach on firms' boundaries. Canadian Journal of Economics 2008;41:341-59.
84. Masten SE. The organization of production: evidence from the aeropace industry. Journal of Law and Economics 1984;27:403-17.
85. Jensen MC,.Meckling WH. Theory of the firm: managerial behavior, agency costs and ownership structure. Journal of Financial Economics 1976;3:305-60.
86. Hill CWL,.Jones TM. Stakeholder-agency theory. Journal of Management Studies 1992;29:131-54.
87. Ontario. Business Corporations Act, R.S.O. 1990, c.B.16, s.115(1). 2007.
88. Canada. Canada Business Corporations Act, R.S., 1985, c. C-44, s.102(1). 2008.
89. Ontario. Business Corporations Act, R.S.O. 1990, c.B.16, s.133. 2007.
90. Canada. Canada Business Corporations Act, R.S., 1985, c. C-44, s.121. 2008.
91. Ontario. Corporations Act, R.S.O. 1990, c.C.38, s.4. 1990.
92. Canada. Canada Corporations Act, S.C. 1970, c.C-32, s.154, s.157. 2007.
93. Williamson OE. Managerial discretion and business behavior. The American Economic Review 1963;53:1032-57.
94. Robinson JC. Theory and practice in design of physician payment incentives. The Milbank Quarterly 2001;79:149-77.
95. Silverman EM, Skinner JS, Fisher ES. The association between for-profit hospital ownership and increased medicare spending. N Engl J Med 1999;341:420-6.
96. Silverman E,.Skinner J. Medicare upcoding and hospital ownership. Journal of Health Economics 2004;23:369-89.
97. Currie J,.Fahr J. Hospitals, managed care and the charity caseload in California. Journal of Health Economics 2004;23:421-42.
98. Cutler, D. M. and Horwitz, J. R. Converting hospitals from not-for-profit to for-profit status. 2000. Cambridge, Massachusetts, National Bureau of Economic Research.
99. Marsteller JA. Nonprofit conversion: theory, evidence and state policy options. Health Services Research 1998;33:1495-535.
260
100. Premier's Advisory Council on Health in Alberta. A framework for reform: report of the Premier's Advisory Council on Health in Alberta. 2001. Premier's Advisory Council on Health in Alberta.
101. Harris M, Manning P. A Canada strong and free. Vancouver: Fraser Institute, 2005.
102. Norton EC,.Staiger DO. How hospital ownership affects access to care for the uninsured. RAND Journal of Economics 1994;25:171-85.
103. Sloan FA. Commercialism in nonprofit hospitals. Journal of Policy Analysis and Management 1998;17:234-52.
104. Rosenau PV,.Linder SH. Two decades of research comparing for profit and nonprofit health provider performance in the United States. Social Science Quarterly 2003;84:219.
105. Picone G, Chou S-Y, Sloan F. Are for-profit hospital conversions harmful to patients and the Medicare? RAND Journal of Economics 2002;33:507-23.
106. McGregor MJ, Cohen M, McGrail K, Broemeling AM, Adler RN, Schulzer M et al. Staffing levels in not-for-profit and for-profit long-term care facilities: does type of ownership matter? CMAJ 2005;172:645-9.
107. Ontario. Business Corporations Act, R.S.O. 1990, c.B.16, s.3.1. 2007.
108. Ontario. Regulated Health Professionals Act, 1991, S.O. 1991, c.18, s.85.8. 2007.
109. Starr P. The social transformation of American medicine. New York: Basic Books, 1982.
110. Evans, R. G., Barer, M. L., Lewis, S. J., Rachlis, M., and Stoddart, G. Private highway, one-way street: the deklein and fall of Canadian medicare? 2000. Accessed April 4, 2007 at http://www.chspr.ubc.ca/files/publications/hpru00-03.pdf.
111. Hirshhorn, R. and Stevens, D. Organization and supervisory law in the nonprofit sector. 1997. Ottawa, Canadian Policy Research Networks.
112. Arrow KJ. Uncertainty and the welfare economics of medical care. American Economic Review 1963;53:941-73.
113. Hansmann HR. The role of nonprofit enterprise. Yale Law Journal 1980;89:835-901.
114. Scott JT. Defining the nonprofit sector. In Hirshhorn R, ed. The emerging sector: in search of a framework, Ottawa: Canadian Policy Research Networks, 1997.
115. Ontario Ministry of the Attorney General. Not-for-Profit Incorporator's Handbook. 8-18-2004. http://www.attorneygeneral.jus.gov.on.ca/english/family/pgt/nfpinc/.
116. Ontario. Corporations Act, R.S.O. 1990, c.C.38, s.126(1). 1990.
117. Canada. Canada Corporations Act. 2007.
118. Income Tax Act, R.S.C. 1985, c.1 (5th Supp.), sections 149.1(2)(b), 149.1(3)(b) and 149.1(4)(b). 2007.
119. Weisbrod BA. Toward a theory of the voluntary nonprofit sector in a three-sector economy. In Rose-Ackerman S, ed. The economics of nonprofit institutions: studies in structure and policy, pp 21-44. New York: Oxford University Press, 1986.
120. Salamon LM. Of market failure, voluntary failure, and third party government: toward a theory of government-nonprofit relations in the modern welfare state. In Salamon LM, ed. Partners in public service:

261
government-nonprofit relations in the modern welfare state, pp 33-52. Baltimore, MD: Johns Hopkins University Press, 1995.
121. Ben-Ner A,.Van Hoomissen T. Nonprofit organizations in the mixed economy: a demand and supply analysis. Annals of Public and Cooperative Economics 1991;69:519-60.
122. Chu v. Scarborough Hospital Corporation, 2007 CanLII 33757, 228 O.A.C. 131 (ON S.C.D.C.). 2007.
123. Fama EF,.Jensen MC. Separation of ownership and control. Journal of Law and Economics 1983;26:301-26.
124. Williamson OE. Organization form, residual claimants, and corporate control. Journal of Law and Economics 1983;26:351-66.
125. Deneffe D,.Masson RT. What do not-for-profit hospitals maximize? International Journal of Industrial Organization 2002;20:461-92.
126. Wright DJ. Specialist payment schemes and patient selection in private and public hospitals. Journal of Health Economics 2007;26:1014-26.
127. James E. How nonprofits grow: a model. In Rose-Ackerman S, ed. The economics of nonprofit institutions: studies in structure and policy, pp 185-95. New York: Oxford University Press, 1986.
128. Schiff J,.Weisbrod BA. Competition between for-profit and nonprofit organizations in commercial markets. Annals of Public and Cooperative Economics 1991;62:619-40.
129. Rose-Ackerman S. Altruism, nonprofits, and economic theory. Journal of Economic Literature 1996;XXXIV:701-28.
130. Pauly MV,.Redisch M. The not-for-profit hospital as a physician's cooperative. American Economic Review 1973;63:87-99.
131. Weisbrod BA. Modeling the nonprofit organization as a multiproduct firm: a framework for choice. In Weisbrod BA, ed. To profit or not to profit: the commercial transformation of the nonprofit sector, New York: Oxford University Press, 1998.
132. Frumkin P. On being nonprofit: a conceptual and policy primer. Cambridge, MA: Harvard University Press, 2002.
133. Ontario Hospital Association. Hospital spending facts. 2005. http://www.fundingfacts.com/oha/Advocacy_LND_WebStation.nsf/page/Funding+Facts.
134. Canadian Institute for Health Information. Health care in Canada 2006. 2006. Ottawa, Canadian Institute for Health Information.
135. Canadian Institute for Health Information. National health expenditure trends, 1975-2007. 2007. Ottawa, Canadian Institute for Health Information.
136. Ontario. Public Hospitals Act, R.S.O. 1990, c.P.40, ss.8, 9. 1996.
137. Trypuc J, Hudson A, MacLeod H. Ontario's wait time strategy: part 1. Healthcare Quarterly 2006;9:44-51.
138. Hudson AR. What pay for what performance? Healthcare Papers 2006;6:67-70.
139. Duggan M. Hospital market structure and the behavior of not-for-profit hospitals. RAND Journal of Economics 2002;33:433-46.

262
140. Mark TL. Psychiatric hospital ownership and performance: do nonprofit organizations offer advantages in markets characterized by asymmetric information? Journal of Human Resources 1995;31:631-49.
141. Potter SJ. A longitudinal analysis of the distinction between for-profit and no-for-profit hospitals in America. Journal of Health and Social Behaviour 2001;42:17-44.
142. Duggan MG. Hospital ownership and public medical spending. Quarterly Journal of Economics 2000;115:1343-74.
143. Keeler EB, Melnick G, Zwamziger J. The changing effects of competition on non-profit and for-profit hospital pricing behavior. Journal of Health Economics 1999;18:99-116.
144. Kuttner R. Must good HMOs go bad? First of two parts: the commercialization of prepaid group health care. New England Journal of Medicine 1998;338:1548-63.
145. Sloan FA, Trogdon JG, Curtis LH, Schulman KA. Does the ownership of the admitting hospital make a difference? Outcomes and process of care of Medicare beneficiaries admitted with acute myocardial infarction. Medical Care 2003;41:1193-206.
146. Needleman J. The role of nonprofits in health care. Journal of Health Politics, Policy and Law 2001;26:1113-30.
147. Hirth RA. Consumer information and competition between nonprofit and for-profit nursing homes. Journal of Health Economics 1999;18:219-40.
148. Grabowski DC,.Hirth RA. Competitive spillovers across non-profit and for-profit nursing homes. Journal of Health Economics 2003;22:1-22.
149. Spector WD. The impact of ownership type on nursing home outcomes. Health Economics 1998;7:639-53.
150. Sloan FA, Picone GA, Taylor DHJr, Chou S. Hospital ownership and the cost and quality of care: is there a dime's worth of difference? Journal of Health Economics 2001;20:1.
151. Newhouse JP, Williams AP, Bennett BW, Schwartz WB. Does the geographical distribution of physicians reflect market failure? Bell Journal of Economics 1982;13:493-505.
152. Rosenthal MB, Zaslavsky A, Newhouse JP. The geographic distribution of physicians revisited. Health Services Research 2005;40:1931-52.
153. Tepper, J. D., Schultz, S. E., Rothwell, D. M., and Chan, B. T. B. Physician services in rural and northern Ontario. ICES investigative report. 2005. Toronto, Institute for Clinical Evaluative Sciences.
154. Dranove D, Satterthwaite MA. The industrial organization of health care markets. In Culyer AJ, Newhouse JP, eds. Handbook of Health Economics, volume 2, pp 1093-139. Amsterdam: Elsevier, 2000.
155. Marmor, T. R. Expert witness report. 1998. Accessed on May 18, 2007, at http://www.law.utoronto.ca/healthlaw/docs/chaoulli/marmor_expertwitness.doc.
156. Chaoulli v. Québec (Attorney General), [2005] 1. S.C.R. 791; 2005 SCC 35. 2005.
157. Aron DC, Gordon HS, DiGiuseppe DL, Harper DL, Rosenthal GE. Variations in risk-adjusted cesarean delivery rates according to race and health insurance. Medical Care 2000;38:35-44.
158. Bhattacharya J, Goldman D, Sood N. The link between public and private insurance and HIV-related mortality. Journal of Health Economics 2003;22:1105-22.

263
159. Marquis MS,.Long SH. The role of public insurance and the public delivery system in improving birth outcomes for low-income pregnant women. Medical Care 2002;40:1048-59.
160. Ungar WJ, Daniels C, McNeill T, Seyed M. Children in need of pharmacare. Canadian Journal of Public Health 2003;94:121-6.
161. Barer ML, Evans RG, Labelle RJ. Fee controls as cost control: tales from the frozen north. The Milbank Quarterly 1988;66:1-64.
162. Horne JM,.Beck RG. Further evidence on public versus private administration of health insurance. Journal of Public Health Policy 1981;2:274-90.
163. Woolhandler S,.Himmelstein DU. Paying for national health insurance -- and not getting it. Health Aff 2002;21:88-98.
164. Brooks JM, Dor A, Wong HS. Hospital-insurer bargaining: an empirical investigation of appendectomy pricing. Journal of Health Economics 1997;16:417-34.
165. Holmes JS. The effects of ownership and ownership change on nursing home industry costs. Health Services Research 1996;31:327-46.
166. Glazer J,.McGuire TG. Multiple payers, commonality and free-riding in health care: Medicare and private payers. Journal of Health Economics 2002;21:1049-69.
167. Rosenman R, Li T, Friesner D. Grants and cost shifting in outpatient clinics. Applied Economics 2000;32:835-47.
168. Dranove D. Pricing by non-profit institutions. Journal of Health Economics 1988;7:47-57.
169. Morrisey MA. Cost shifting in health care: separating evidence from rhetoric. Washington, D.C.: American Enterprise Institute, 1994.
170. Showalter MH. Physicians' cost shifting behaviour: Medicaid versus other patients. Contemporary Economic Policy 1997;15:74-84.
171. Robinson JC. Entrepreneurial challenges to integrated health care. In Mechanic D, Rogut L, Colby D, Knickman J, eds. Policy challenges in modern health care, pp 53-67. New Brunswick, NJ: Rutgers University Press, 2006.
172. Bazzoli GJ. Medical service risk and the evolution of provider compensation arrangements. Journal of Health Politics and Law 2001;26:1003-18.
173. Robinson JC. Consolidation of medical groups into physician practice management organizations. JAMA, The Journal of the American Medical Association 1998;279:144.
174. Ontario. Local Health System Integration Act, 2006, S.O. 2006, c.4, s.20(1). 2006.
175. Ontario. Workplace Safety and Insurance Act, S.O. 1997, c.16, Sched. A, s.33(1). 1997.
176. Beck G,.Horne J. Utilization of publicly insured health servcies in Saskatchewan, suring and after copayment. Medical Care 1980;8:787-806.
177. Manning WG, Newhouse JP, Duan N, Keeler EB, Leibowitz A, Marquis SA. Health insurance and the demand for medical care: evidence from a randomized experiment. American Economic Review 1987;77:251-77.

264
178. Landry MD, Cott CA, Deber R, Jaglal S, Laporte A, Holyoke P et al. Assessing the consequences of delisting publicly-funded community-based physical therapy on self-reported health in Ontario, Canada. International Journal of Rehabilitation Research 2006;29:303-7.
179. Gruber, J. The role of consumer copayments for health care: lessons from the RAND health insurance experiment and beyond. 2006. Menlo Park, California, Kaiser Family Foundation.
180. Davis DA,.Taylor-Vaisey A. Translating guidelines into practice: a systematic review of theoretic concepts, practical experience and research evidence in the adoption of clinical practice guidelines. CMAJ 1997;157:408-16.
181. Cabana MD, Rand CS, Powe NR, Wu AW, Wilson MoH, Abboud PA et al. Why don't physicians follow clinical practice guidelines?: a framework for improvement. JAMA 1999;282:1458-65.
182. Landry MD, Williams AP, Deber RB, Verrier MC. On evidence-based decision-making: implications for physical therapy in the post-Kirby, post-Romanow era. Physiotherapy Canada 2004;56:7-13.
183. Rappolt S. Clinical guidelines and the fate of medical autonomy in Ontario. Social Science & Medicine 1997;44:977-87.
184. Kuhlmann E. Modernising health care: reinventing professions, the state and the public. London: Policy Press, 2006.
185. Pink GH, Brown AD, Struder ML, Reiter KL, Leatt P. Pay-for-performance in publicly financed healthcare: some international experience and considerations for Canada. Healthcare Papers 2006;6:8-26.
186. Wodchis WP, Ross JS, Detsky AS. Is P4P really FFS? JAMA 2007;298:1797-9.
187. Deber R,.Lewis S. Thoughts on the day: strategic purchasing and equity. HealthcarePapers 2007;8:114-23.
188. Chalkley M,.Khalil F. Third party purchasing of health services: patient choice and agency. Journal of Health Economics 2005;24:1132-53.
189. Feasby TE,.Gerdes C. Pay-for-performance: can it work in Canada? Healthcare Papers 2006;6:47-50.
190. Golden BR. The cost of pay-for-performance in healthcare: an alternative view. Healthcare Papers 2006;6:39-46.
191. Culyer T. Paying for performance: neither the end of the beginning nor the beginning of the end. Healthcare Papers 2006;6:34-8.
192. Brown AD, Bhimani H, MacLeod H. Making performance reports work. Healthcare Papers 2005;6:8-22.
193. Chan B, Anderson GM, Thériault M-E. High-billing general practitioners and family physicians in Ontario: how do they do it? CMAJ 1998;158:741-6.
194. Chan L, Koepsell TD, Deyo RA, Esselman PC, Haselkorn JK, Lowery JK et al. The effect of Medicare's payment system for rehabilitation hospitals on length of stay, charges, and total payments. N Engl J Med 1997;337:978-85.
195. Dor A,.Farley DE. Payment source and the cost of hospital care: evidence from a multiproduct cost function with multiple payers. Journal of Health Economics 1996;15:1-21.
196. Rosenthal MB. Risk sharing and the supply of mental health services. Journal of Health Economics 2000;19:1047-65.
265
197. Wodchis WP. Physical rehabilitation following Medicare prospective payment for skilled nursing facilities. Health Services Research 2005;39:1299-318.
198. Cao Z,.McGuire TG. Service-level selection in HMOs in Medicare. Journal of Health Economics 2003;22:915-31.
199. Coburn AF, Long SH, Marquis MS. Effects of changing Medicaid fees on physician participation and enrollee access. Inquiry 1999;36:265-79.
200. Ontario. Labour Relations Act, 1995, S.O. 1995, c.1, Sched. A. 2007.
201. Baumol WJ, Panzar JC, Willig RD. Contestable markets and the theory of industrial structure. New York: Harcourt Brace Jovanovich, 1982.
202. Baumol WJ. Contestable markets: an uprising in the theory of industry structure. American Economic Review 1982;72:1-15.
203. Geroski PA. What do we know about entry? International Journal of Industrial Organization 1995;13:421-40.
204. Baldwin J, Bian L, Dupuy R, Gellatly G. Failure rates for new Canadian firms: new perspectives on entry and exit. Ottawa: Statistics Canada, 2000.
205. Preker AS, Harding A, Travis P. "Make or buy" decisions in the production of health care goods and services: new insights from institutional economics and organizational theory. Bulletin of the World Health Organization 2000;78:779-89.
206. Fuller C. Caring for profit: how corporations are taking over Canada's health care system. Vancouver: New Star Books and Canadian Centre for Policy Alternatives, 1998.
207. Barlow M. Profit is not the cure: a citizen's guide to saving Medicare. Toronto: McClelland & Stewart Ltd., 2002.
208. Sinclair S. Protecting Medicare from foreign commercial interests. In Campbell B, Marchildon G, eds. Medicare: facts, myths, problems and promise, pp 99-105. Toronto: James Lorimer & Company, Ltd., 2007.
209. Canadian Institute for Health Information. Exploring the 70/30 split: how Canada's health care system is financed. 2005. Ottawa, Canadian Institute for Health Information.
210. Standing Senate Committee on Social Affairs Science and Technology. The health of Canadians: the federal role: volume six: recommendations for reform. Final report on the state of the health care system in Canada. 2002. Ottawa, Standing Senate Committee on Social Affairs Science and Technology.
211. Government of Alberta. Getting on with better health care. 2005. Accessed on June 13, 2007, at http://www.health.gov.ab.ca/key/AHW_WebFinal_REV.pdf.
212. Alberta Department of Health and Wellness. Request for proposals ("RFP") number 05-190: Getting on with better health care: health benefit design options. 2005. Accessed June 15, 2007, at http://www.health.gov.ab.ca/key/RFPHealthBenefitDesign.pdf.
213. Cryderman, K. It's the highway for 'third way': disappointed Klein blames campaign of 'misinformation' that made Albertans fearful. Edmonton Journal. 4-21-2006.
214. Alberta Department of Health and Wellness. Key health initiatives. 2007. Accessed June 15, 2007 at http://www.health.gov.on.ca/healthrenewal/renewal.htm.
266
215. Ontario. Local Health Systems Integration Act, S.O. 2006, c.4, Preamble. 2006.
216. Priest, L. Smitherman won't outsource keen operations. Globe and Mail. 3-16-2007.
217. Soroka, S. N. Canadian perceptions of the health care system: a report to the Health Council of Canada. 2007. Toronto, Health Council of Canada.
218. Montreal Economic Institute. Using private insurance to finance health care. 2005. http://www.iedm.org/uploaded/pdf/nov05_en.pdf.
219. Sanger M. Reckless abandon: Canada, the GATs and the future of health care: executive summary. Ottawa: Canadian Centre for Policy Alternatives, 2000.
220. Falter LB. The reality of two-tiered health care in Canada: a political economy perspective on physiotherapy in Canada. Physiotherapy Canada 2003;55:97-104.
221. Arthurs H. The hollowing out of corporate Canada. In Jensen J, Santos B, eds. Globalizing institutions: case studies in social regulation and innovation, pp 29-51. London: Ashgate Press, 2000.
222. Arthurs H. Globalization of the mind: Canadian elites and the structuring of legal fields. Canadian Journal of Law and Society 1998;12:219-46.
223. Martin, R. and Nixon, G. Whoa, Canada: more must be done to protect companies from foreign takeovers; the country's place in the world depends on it. Globe and Mail. 7-1-2007.
224. McDougall JN. Drifting together: the political economy of Canada-US integration. Peterborough: Broadview Press, 2006.
225. Carroll WK. Corporate power in a globalizing world: a study in elite social organization. Don Mills, ON: Oxford University Press, 2004.
226. Burke M. Efficiency and the erosion of health care in Canada. In Burke M, Mooers C, Shields J, eds. Restructuring and resistance: Canadian public policy in an age of global capitalism, pp 178-93. Halifax: Fernwood Publishing, 2000.
227. Clarkson S. Uncle Sam and us: globalization, neoconservatism, and the Canadian state. Toronto and Washington, DC: University of Toronto Press and Woodrow Wilson Center Press, 2002.
228. Krugman P. Increasing returns and economic geography. Journal of Political Economy 1991;99:483-199.
229. Krugman P,.Venables AJ. Globalization and the inequality of nations. The Quarterly Review of Economics 1995;110:857-80.
230. Clarkson S. The multi-level state: Canada in the semi-periphery of both continentalism and globalization. Review of International Political Economy 2001;8:501-27.
231. Dollar D,.Kraay A. Spreading the wealth. Foreign Affairs 2002;81:120.
232. Bhagwati J. In defense of globalization. New York: Oxford University Press, 2004.
233. Dollar D,.Kraay A. Trade, growth and poverty. The Economic Journal 2004;114:F22-F49.
234. Ross RJS, Trachte KC. Global capitalism: the new Leviathan. Albany, NY: State University of New York Press, 1990.
235. Ostry A. International trade regulation and publicly funded health care in Canada. International Journal of Health Services 2001;31:475-80.

267
236. Adlung R,.Carzaniga A. Health services under the General Agreement on Trade in Services. Bulletin of the World Health Organization 2001;79:352-63.
237. VanDuzer, J. A. Health, education and social services in Canada: the impact of the GATS. 2004. Accessed on September 6, 2006 at http://www.ftc.gov/reports/healthcare/040723healthcarerpt.pdf.
238. Canadian Centre for Policy Alternatives. Putting health first: Canadian health care reform, trade treaties and foreign policy. Ottawa: Commision on the Future of Health Care in Canada, 2002.
239. Metalclad v. the United Mexican States, Case No. ARB(AF)97/1, International Centre of Settlement of Investment Disputes (Additional Facility); 2001 British Columbia Supreme Court 1529. 1997.
240. United Parcel Service of America v. Government of Canada. 6-11-2007. Accessed on June 18, 2007, at http://www.dfait-maeci.gc.ca/tna-nac/documents/MeritsAward24May2007.pdf.
241. Smith RD. Foreign direct investment and trade in health services: a review of the literature. Social Science & Medicine 2004;59:2313-23.
242. Chanda R. Trade in health services. Bulletin of the World Health Organization 2002;80:158-63.
243. Luff D. Regulation of health services and international trade law. In Mattoo A, Sauvè P, eds. Domestic regulation and services trade liberalisation, pp 191-210. Washington, DC: World Bank/Oxford University Press, 2003.
244. Hoberg G. Canada and North American integration. Canadian Public Policy 2000;26:S35-S50.
245. Skogstad G. Globalization and public policy: Situating Canadian analyses. Canadian Journal of Political Science 2000;33:805-28.
246. Baldwin, J. R., Gellatly, G., and Sabourin, D. Changes in foreign control under different regulatory climates: multinationals in Canada. 2006. Ottawa, Statistics Canada.
247. Conference Board of Canada. The NAFTA effect: multinational enterprises in Canada. 2006. Ottawa, Conference Board of Canada.
248. Hoberg G, Banting KG, Simeon R. The scope for domestic choice: policy autonomy in a globalizing world. In Hoberg G, ed. Capacity for choice: Canada in a new North America, pp 252-98. Toronto: University of Toronto Press, 2002.
249. IBM Business Consulting Services. Report on the integration of primary health care nurses into the province of Ontario: final report, June 30, 2003. 2003. Accessed on June 7, 2007, at http://www.health.gov.on.ca/english/public/pub/ministry_reports/nurseprac03/nursepract03_mn.html.
250. Yin RK. Case study research: design and methods, 3d. ed. Thousand Oaks, California: Sage Publications, 2003.
251. King G, Keohane RO, Verba S. Designing social inquiry: scientific inference in qualitative research. Princeton, New Jersey: Princeton University Press, 1994.
252. Campbell DT, Stanley JC. Experimental and quasi-experimental designs for research. Boston: Houghton Mifflin Company, 1963.
253. Kerlinger FN. Foundations of behavioral research, second edition. New York: Holt, Rinehart and Winston, Inc., 1973.
254. Patton MQ. Enhancing the quality and credibility of qualitative analysis. Health Services Research 1999;34:1189-208.

268
255. Patton MQ. Qualitative research and evaluation methods, 3d ed. Thousand Oaks, California: Sage Publications, 2002.
256. United Kingdom. Constitution Act, being Schedule B to the Canada Act, 1982 (U.K.), 1982, c.11. 1982.
257. Canada. Canada Corporations Act, S.C. 1970, c.C-32. 2007.
258. Canada. Department of Veterans Affairs Act, R.S., 1985, c.V-1. 1985.
259. Canada. Income Tax Act, R.S.C. 1985, c.1 (5th Supp.), sections 149.1(2)(b), 149.1(3)(b) and 149.1(4)(b). 2007.
260. Canada. Veterans Health Care Regulations, SOR/90-594, as amended. 2006.
261. Ontario. Business Corporations Act, R.S.O. 1990, c.B.16. 2007.
262. Ontario. Chiropractic Act, 1991, S.O. 1991, c.21. 2007.
263. Ontario. Commitment to the Future of Medicare Act, 2004, S.O. 2004, c.5. 2007.
264. Ontario. Compulsory Automobile Insurance Act, R.S.O. 1990, c.C26. 1990.
265. Ontario. Consumer Protection Act, 2002. 2002.
266. Ontario. Corporations Act, R.S.O. 1990, c.C.38. 1990.
267. Ontario. Drugless Practitioners Act, R.S.O. 1990, c.D.18. 1991.
268. Ontario. Financial Services Commission of Ontario Act, 1997, S.O. 1997, c.28. 2007.
269. Ontario. R.R.O.1990, Regulation 552, made under the Health Insurance Act, R.S.O. 1990, c.H.6. 2007.
270. Ontario. Insurance Act, R.S.O.1990, c.I-8. 2007.
271. Ontario. Automobile Insurance, R.R.O., Reg.664, made under the Insurance Act, R.S.O. 1980, c.I.8. 2007.
272. Ontario. Statutory Accident Benefits Schedule -- Accidents on or after November 1, 1996, O.Reg. 403/96. 1996.
273. Ontario. Assessment of Health Systems Costs, O.Reg. 401/96. 1996.
274. Ontario. Kinesiology Act, 2007, S.O. 2007, c.10, Sched. O. 2007.
275. Ontario. Local Health System Integration Act, 2006, S.O. 2006, c.17. 2007.
276. Ontario. Massage Therapy Act, 1991, S.O. 1991, c.27. 1991.
277. Ontario. Medicine Act, 1991, S.O. 1991, c.30. 1991.
278. Ontario. Naturopathy Act, 2007, S.O. 2007, c.10, Sched. P. 2007.
279. Ontario. Occupational Therapy Act, 1991, S.O. 1991, c.33. 1991.
280. Ontario. Ontario Agency of Health Protection and Promotion Act, 2007, S.O. 2007, c.10, Sched. K. 2007.
281. Ontario. Private Hospitals Act, R.S.O. 1990, c.P-24. 1990.
269
282. Ontario. Public Hospitals Act, R.S.O. 1990, c.P.40. 1990.
283. College of Physiotherapists of Ontario. 'Holding out' by unregulated health practitioners. 2004. Accessed on September 14, 2006 at http://www.collegept.org/college/content/pdf/en/guide/HoldingOut.pdf.
284. Shipton D, Badley EM. Availability of services. In Badley EM, Glazier RH, eds. Arthritis and related conditions in Ontario: ICES research atlas. 2nd ed., Toronto: Institute for Clinical Evaluative Studies, 2004.
285. Kralj B. Physician distribution and physician shortage intensity in Ontario. Canadian Public Policy 2001;27:167-78.
286. Pong, R. W. and Pitblado, J. R. Geographic distibution of physicians in Canada: beyond how many and where. 2005. Ottawa, Canadian Institute for Health Information.
287. Passalent, L., Borsy, E., and Cott, C. Ontario community rehabilitation: a profile of demand and provision. 2007. Toronto, Arthritis Community Research & Evaluation Unit, University Health Network.
288. Statistics Canada. Annual Demographic Statistics 2003. 2004. Ottawa, Ministry of Industry.
289. Statistics Canada. Annual demographic statistics 2005. 2006. Ottawa, Ministry of Industry.
290. Statistics Canada. Postal code conversion file, version 4G. 2006. Ottawa, Statistics Canada.
291. Statistics Canada. PCCF+ Version 4G User's Guide. 2006. Accessed on February 12, 2006, at http://www.statcan.ca/english/freepub/92F0153GIE/92F0153G1E2005002.pdf.
292. Ontario Ministry of Health and Long-Term Care. Local Health Integration Networks: building a true system: bulletin no. 1 - October 6, 2004. 2004. Accessed on June 28, 2005 at http://www.health.gov.on.ca/transformation/lhin/100604/lhin_bul_1_100604.pdf.
293. Personal communication with Chantal Vaillancourt, Analyst, Culture, Tourism and the Centre for Education Statistics Division, Statistics Canada, August 30, 2006. 2006.
294. Canadian Institute for Health Information. Health human resources databases development project. 2007. Accessed on April 4, 2007, at http://secure.cihi.ca/cihiweb/dispPage.jsp?cw_page=hhr_physio_e.
295. McMaster University School of Rehabilitation Science. MSc PT Degree. 2007. Accessed April 15, 2007, at http://www.srs-mcmaster.ca/nbspnbspProgramsnbspnbspnbspnbsp/MScPT/tabid/525/Default.aspx.
296. Dillman DA. Mail and internet surveys. New York: John Wiley & Sons, Inc., 2000.
297. Barnett V. Sample survey principles and methods. London: Edward Arnold, 1991.
298. Pett MA. Nonparametric statistics for health care research: statistics for small samples and unusual distributions. Thousand Oaks, CA: Sage Publications, 1997.
299. Wengraf T. Qualitative research interviewing: biographic narrative and semi-structured methods. Thousands Oaks, California: Sage Publications, 2001.
300. Warren CAB. Qualitative interviewing. In Gubrium JF, Holstein JA, eds. Handbook of interview research: context and method, pp 83-101. Thousand Oaks, California: Sage Publications, 2001.
301. Odendahl T, Shaw AM. Interviewing elites. In Gubrium JF, Holstein JA, eds. Handbook of interview research: context and method, pp 299-316. Thousand Oaks, California: Sage Publications, 2001.
270
302. Badley EM, Glazier RH. Arthritis and related conditions in Ontario: ICES research atlas. 2nd. ed. Toronto: Institute for Clinical Evaluative Sciences, 2006.
303. Landry, M. D., Jaglal, S., Wodchis, W., and Cott, C. A. Forecasting demand for rehabilitation services across Ontario's continuum of care. 2006. Toronto, Toronto Rehabilitation Institute.
304. Ontario. R.R.O.1990, Regulation 744, s.1, as amended, made under the Mental Hospitals Act, R.S.O. 1990, c.M.8. 2006.
305. Ontario. R.R.O.1990, Regulation 552, Schedule 2,, made under the Health Insurance Act, R.S.O. 1990, c.H.6. 1990.
306. MPP Consultation Group on Traditional Chinese Medicine and Acupuncture. Traditional Chinese medicine and acupuncture in Ontario: report to the Minister of Health and Long-Term Care. 2005. Accessed September 12, 2007, at http://www.health.gov.on.ca/english/public/pub/ministry_reports/tc_med/tc_med_eng.pdf.
307. College of Physiotherapists of Ontario. The practice of acupuncture by physiotherapists. 1998. Toronto, College of Physiotherapists of Ontario.
308. Ontario Physiotherapy Association. Response to consultation on the regulation of acupuncture in Ontario. 2005. Accessed on August 1, 2007, at http://www.opa.on.ca/pdfs/policy_acu_response_05.pdf.
309. Ontario. Workplace Safety and Insurance Act, S.O. 1997, c.16, Sched. A, s.33(3) and (5). 1997.
310. Workplace Safety and Insurance Board. Program of care: upper extremity injuries. 2005. Accessed on September 12, 2007, at http://www.wsib.on.ca/wsib/wsibsite.nsf/LookupFiles/DownloadableFileUEI_POC_Booklet/$File/UEI_POC_BOOKLET.pdf.
311. Orthopaedic Division of the Canadian Physiotherapy Association. Orthopaedic Division. 2007. Accessed September 13, 2007, at http://www.orthodiv.org.
312. University of Western Ontario School of Physical Therapy. Manipulative therapy. 2007. Accessed on June 13, 2007, at http://www.uwo.ca/fhs/pt/new/prospective/mclsc/manipulative_therapy.html.
313. Bickenbach JE, Chatterji S, Badley EM, Üstün TB. Models of disablement, universalism and the international classificantion of impairments, disabilities and handicaps. Social Science & Medicine 1999;48:1173-87.
314. Pransky GS, Shaw WS, Franche R-L, Clarke A. Disability prevention and communication among workers, physicians, employers and insurers -- current models and opportunities for improvement. Disability & Rehabilitation 2004;26:625-34.
315. Canadian Reiki Association. Reiki FAQs. 2007. Accessed on August 1, 2007, at http://www.reiki.ca/faq.htm.
316. Board of Directors of Drugless Therapy - Naturopathy. Principles and modalities. 2007. Accessed on August 1, 2007 at http://www.boardofnaturopathicmedicine.on.ca/principles_modalities.html.
317. Ontario. Naturopathy Act, 2007, S.O. 2007, c.10, Sched. P, s.3. 2007.
318. Raine, K. Overweight and obesity in Canada. 2004. Ottawa, Canadian Institute for Health Information.
319. Bélanger-Ducharme F,.Tremblay A. Prevalence of obesity in Canada. Obesity Reviews 2005;6:183-6.
320. Ontario. Physiotherapy Act, 1991, S.O. 1991, c.38, s.8(2). 1991.

271
321. Workplace Safety and Insurance Board. Program of Care for Acute Low Back Injuries Fees. 2003. Accessed on November 28, 2003, at http://www.wsib.on.ca/wsib/wsibsite.nsf/public/programcarelowbackfeeschedule.
322. Workplace Safety and Insurance Board. Community clinics. 2007. Accessed on June 18, 2007, at http://www.wsib.on.ca/wsib/wsibsite.nsf/public/HealthClinics.
323. Ontario. R.R.O., Reg.664, s.5, made under the Insurance Act, R.S.O. 1980, c.I.8. 1990.
324. Workplace Safety and Insurance Board. Fee schedule: physiotherapy. 2004. Accessed on October 21, 2006 at: http://www.wsib.on.ca/wsib/wsibsite.nsf/LookupFiles/HealthProfessionalsFeeSchedules2004Physiotherapist04/$File/Physio04.pdf.
325. College of Phyisotherapists of Ontario. Physiotherapists working with physiotherapist support personnel. 2007. Accessed on August 1, 2007, at http://www.collegept.org/college/content/pdf/en/guide07/III.B.14.Physiotherapy_Support.pdf.
326. College of Phyisotherapists of Ontario. Guide to the standard for physiotherapists working with physiotherapist support personnel. 2007. Accessed on August 1, 2007, at http://www.collegept.org/college/content/pdf/en/guide07/III.B.15.Physio_Support_Personnel_Guide.pdf.
327. Ontario Ministry of Training, Colleges and Universities. Occupational therapist assistant program standard. 1999. Accessed on August 1, 2007, at http://www.edu.gov.on.ca/eng/general/college/progstan/health/ota.html.
328. Health Professions Regulatory Advisory Council. The regulation of personal support workers. 2006. Toronto, Health Professions Regulatory Advisory Council.
329. Ontario Athletic Therapist Association. Scope of practice. 2007. Accessed August 1, 2007, at http://www.athletictherapist.on.ca/index.cfm?150B1D1A202F69313E07155A50520B1C003B2E397C38061643563B0E39012E22202828005F70753D2C5442797166737B555F707520272236017C63707D504D010041.
330. Personal communication with Kirsty Mackenzie, Vice-President of the Ontario Athletic Therapists Association, March 13. 2005.
331. Ontario Athletic Therapist Association. Frequent questions. 2007. Accessed on August 1, 2007, at http://www.athletictherapist.on.ca/index.cfm?150B1D1A202F69313E07155A50520B1C003B2E397C2D0408157032212D4E7E7764737955491570323C26380A0F69767A534C0701475D.
332. Welsh S, Kelner M, Wellman B, Boon H. Moving forward? Complementary and alternative practitioners seeking self-regulation. Sociology of Health and Illness 2004;26:216-41.
333. Canadian Association of Ergonomists. What is ergonomics and what is an ergonomist? 2007. Accessed June 25, 2007 at http://www.ace-ergocanada.ca/index.php?command=buildBlock&contentid=142.
334. Ontario Ministry of Training, Colleges and Universities. Physiotherapist assistant program standard. 1999. Accessed on August 1, 2007, at http://www.edu.gov.on.ca/eng/general/college/progstan/health/pta.html.
335. Canadian Alliance of Physiotherapy Regulators and Canadian Physiotherapy Association. Physiotherapy Health Human Resources Background Paper. 2002.
336. College of Phyisotherapists of Ontario. Physiotherapists working with physiotherapist support personnel. 2005. Accessed on August 1, 2007, at http://www.collegept.org/college/content/pdf/en/guide07/III.B.14.Physiotherapy_Support.pdf.
272
337. Canadian Institute for Health Information. Health Human Resources Databases Development Project -- Physiotherapist Database (PTDB). 2007. Accessed June 15, 2007, at http://www.cihi.ca/cihiweb/dispPage.jsp?cw_page=hhr_physio_e.
338. Williams, A. P., Rappolt, S. G., Verrier, M. C., Deber, R. B., Lum, J. M., Landry, M. D., and Syed, S. 2003 survey of physiotherapists' (blue): summary of results. 2003.
339. Statistics Canada. Table 2820077 Labour force survey estimated, employees by union coverage, North American Industry Classification System (NAICS), sex and age group, unadjusted for seasonality, monthly (table). CANSIM II (database) Series V3321913-15, V3321955-57. 2007. Accessed September 22, 2007.
340. Randall GE,.Williams AP. Exploring the limits to market-based reform: managed competition and rehabilitation home care services in Ontario. Social Science & Medicine 2006;62:1594-604.
341. Canada. Canada Health Act, R.S.C. 1985, c.C-6, s.3. 1984.
342. Ontario. R.R.O.1990, Regulation 552, s.8(2.1), made under the Health Insurance Act, R.S.O. 1990, c.H.6. 2003.
343. Ontario. Nursing Act, 1991, S.O. 1991, c.32, s.5.1. 2008.
344. Reeleder D, Goel V, Singer PA, Martin DK. Accountability agreements in Ontario hospitals: are they fair? Journal of Public Administration Research and Theory Advance Access 2006;December 26, 2006.doi:10.1093/jopart/mul024.
345. Topp A,.Hundert A. Paying for institutional quality: reaching the limits of funding policy? Healthcare Quarterly 2006;9:46-9.
346. Ontario. R.R.O.1990, Regulation 552, s.21(2), made under the Health Insurance Act, R.S.O. 1990, c.H.6. 2005.
347. Gordon M, Waines B, Englehart J, Montgomery S, Devitt R, Holyoke P et al. The consequences of delisting publicly-funded, community-based physical therapy services in Ontario: a health policy analysis. Physiotherapy Canada 2006;59:58-69.
348. Ontario. R.R.O. 1990, Regulation 552, as amended to O.Reg. 404/07. 2007.
349. Statistics Canada. Table 176-0003 Consumer price index (CPI) statistics, alternative measures, unadjusted and seasonally adjusted, monthly (percent unless otherwise noted) (table). CANSIM (database). Version updated July 18, 2007. 2007. Accessed August 1, 2007, at http://cansim2.statcan.ca/cgi-win/cnsmcgi.exe?Lang=E&RootDir=CII/&ResultTemplate=CII/CII___&Array_Pick=1&ArrayId=1760003.
350. Ontario. Commitment to the Future of Medicare Act, 2004, S.O. 2004, c.5, s.10(4). 2007.
351. Holyoke, P. D. and Elkan, L. Rehabilitation services inventory & quality project: phase one report. 1995. Toronto, Institute for Work & Health.
352. Arthritis Society. Registered Charity Information Return for The Arthritis Society/La société d/Arthrite Ontario Division 2006. 2006. Accessed August 30, 2007 at http://www.cra-arc.gc.ca/ebci/haip/srch/sec/SrchInput05Render-e?bn=108071671RR0004&fpe=2006-03-31&formId=19&name=THE+ARTHRITIS+SOCIETY%2FLA+SOCIETE+D%27ARTHRITE+ONTARIO+DIVISION.
353. Arthritis Society. Arthritis Rehabilitation and Education Program (AREP). 2007. Accessed August 30, 2007, at http://www.arthritis.ca/local%20programs/ontario/aprograms/therapist/default.asp?s=1.
273
354. Brain Injury Association Quinte District. Registered Charity Information Return for Brain Injury Association Quinte District. 2005. Accessed August 30, 2007 at http://www.cra-arc.gc.ca/ebci/haip/srch/sec/SrchInput05Render-e?bn=861059517RR0001&fpe=2005-12-31&formId=19&name=BRAIN+INJURY+ASSOCIATION+QUINTE+DISTRICT.
355. Brain Injury Association of Sault Ste.Marie and District. Registered Charity Information Return for Brain Injury Association of Sault Ste. Marie and District. 2006. Accessed August 30, 2007 at http://www.cra-arc.gc.ca/ebci/haip/srch/sec/SrchInput05Render-e?bn=138351226RR0001&fpe=2006-03-31&formId=19&name=BRAIN+INJURY+ASSOCIATION+OF+SAULT+STE.+MARIE+AND+DISTRICT.
356. Baranek PM, Deber RB, Williams AP. Almost home: reforming home and community care in Ontario. Toronto: University of Toronto Press, 2004.
357. Caplan, E. Realizing the potential of home care: competing for excellence by rewarding results. 2005. http://www.health.gov.on.ca/english/public/pub/ministry_reports/ccac_05/ccac_05.html.
358. Ontario Ministry of Health and Long-Term Care. Choosing quality, rewarding excellence: Ontario's response to the Caplan report on home care. 2006. Toronto, Ministry of Health and Long-Term Care.
359. Ontario Ministry of Health and Long-Term Care. McGuinty government halts bidding process for home care contracts across the province. 2008. Accessed February 1, 2008, at http://www.health.gov.on.ca/english/media/news_releases/archives/nr_08/jan/nr_20080128.html.
360. Veterans Affairs Canada. POC 12 - Related health services. 2007. Accessed on April 10, 2007 at http://www.vac-acc.gc.ca/providers/sub.cfm?source=pro_infoguide/poc12.
361. Canadian Association of Blue Cross Plans. Federal programs: Veterans Affairs Canada. 2007. Accessed June 18, 2007, at http://www.bluecross.ca/federalprograms.html.
362. Department of National Defence. Backgrounder - Canadian Forces health care identification card. 2005. Accessed April 15, 2007, at http://www.forces.gc.ca/site/newsroom/view_news_e.asp?id=1724.
363. Department of National Defence. Eligible health services. 2004. Accessed June 18, 2007, at http://www.forces.gc.ca/health/services/hig/engraph/eligible_hs_e.asp?Lev1=&Lev2=1&Lev3=6#1h.
364. Ontario. Compulsory Automobile Insurance Act, R.S.O. 1990, c.C26, s.2(3). 2008.
365. Ontario. Insurance Act, R.S.O.1990, c.I-8, s.268.3. 1993.
366. Ontario Insurance Commission. Bulletin: Physiotherapy fees and utilization guidelines for auto insurance accident claimants. 1997. Accessed September 12, 2006, at http://www.fsco.gov.on.ca/english/pubs/bulletins/autobulletins/archives/a-12_97.asp.
367. Financial Services Commission of Ontario. Professional Services Guideline: Superintendent's Guideline No. 05/03. 2003. Accessed on August 8, 2006, at http://www.ontarioinsurance.com/_6a1nmoqb3f4j46rrddlqmsqb3c5q6irreec_/happy.nsf/798eadeccc317fa0852562f400606ac6/c27abd08930083aa85256da5006791ed/$FILE/SIGuideline05-03.pdf.
368. Financial Services Commission of Ontario. Professional Services Guideline: Superintendent's Guideline No. 01/05. 2005. Accessed on August 8, 2006, at http://www.fsco.gov.on.ca/english/pubs/bulletins/autobulletins/2005/a-06_05.pdf.
369. Financial Services Commission of Ontario. Pre-approved framework guideline for whiplash associated disorder grade I injuries with or without complaint of back symptoms: Superintendent's Guideline No. 01/03. 2003. Accessed on August 8, 2006, at
274
http://www.ontarioinsurance.com/_6a1nmoqb3f4j46rrddlqmsqb3c5q6irreec_/happy.nsf/798eadeccc317fa0852562f400606ac6/c27abd08930083aa85256da5006791ed/$FILE/SIGuideline01-03.pdf.
370. Financial Services Commission of Ontario. Pre-approved framework guideline for whiplash associated disorder grade II injuries with or without complaint of back symptoms: Superintendent's Guideline No. 02/03. 2003. Accessed on August 8, 2006, at http://www.ontarioinsurance.com/_6a1nmoqb3f4j46rrddlqmsqb3c5q6irreec_/happy.nsf/798eadeccc317fa0852562f400606ac6/c27abd08930083aa85256da5006791ed/$FILE/SIGuideline02-03.pdf.
371. HCAI Processing. Welcome to the HCAI information resource site. 2008. Accessed April 19, 2008, at http://www.hcaiinfo.ca/index.asp.
372. Ontario. Insurance Act, R.S.O.1990, c.I-8, ss.279-287. 1993.
373. Aviva Canada Inc. How Premiere Healthcare works. 2007. Accessed on March 15, 2007, at https://www.avivacanada.com/product.php?content=HEALTHCARE_HOW_IT_WORKS&language=ENGLISH.
374. CARF - Commission on the Accreditation of Rehabilitation Facilities. About CARF Canada. 2007. Accessed on March 8, 2007, at http://www.carfcanada.org/Providers.aspx?content=content/Canada/About.htm.
375. Ontario. Highway Traffic Act, R.S.O. 1990, c.H.8., s.199(1). 2008.
376. Workplace Safety and Insurance Board. Coverage under the Workplace Safety and Insurance Act. 2002. Toronto, Workplace Safety and Insurance Board.
377. Ontario. Workplace Safety and Insurance Act, S.O. 1997, c.16, Sched. A, s.33(1) and (2). 1997.
378. Workplace Safety and Insurance Board. Health care model. 1999. Accessed on November 28, 2003 at http://www.wsib.on.ca/wsib/wsibsite.nsf/LookupFiles/DownloadableFileHealthCareModel/$File/Health1d.pdf.
379. Ontario. Workplace Safety and Insurance Act, S.O. 1997, c.16, Sched. A, s.33(5). 1997.
380. Canada. Canada Health Act, R.S.C. 1985, c.C-6, s.2. 1984.
381. Ontario. R.R.O.1990, Regulation 552, s.11.2(2), made under the Health Insurance Act, R.S.O. 1990, c.H.6. 2005.
382. Workplace Safety and Insurance Board. Fee schedule: hospitals. 2004. Accessed on October 21, 2006 at: http://www.wsib.on.ca/wsib/wsibsite.nsf/LookupFiles/HealthProfessionalsFeeSchedules2004Hospital2004/$File/Hosp04.pdf.
383. Ontario. Workplace Safety and Insurance Act, S.O. 1997, c.16, Sched. A, s.43. 1997.
384. Workplace Safety and Insurance Board. Fee schedule: physiotherapy. 2008. Accessed on April 12, 2008, at http://www.wsib.on.ca/wsib/wsibobj.nsf/LookupFiles/DownloadableFilePhysiotherapy/$File/2714A.pdf.
385. Personal communication with Karen Hann, Director, Health Care Management, Health Services Division, Workplace Safety and Insurance Board, May 6. 2004.
386. Canadian Life and Health Insurance Association Inc. Facts & figures: life and health insurance in Ontario, 2005 ed. 2006. http://www.clhia.ca/prov/fact2004_on.pdf.
387. Canadian Life and Health Insurance Association Inc. A guide to supplementary health insurance. 2006. Accessed on September 3, 2006 at http://www.clhia.ca/download/Health_Brochure_EN.pdf.
275
388. Workplace Safety and Insurance Board. Workplace Safety and Insurance Board statistical supplement 05. 2006. Accessed on October 21, 2006, at http://www.wsib.on.ca/wsib/wsibobj.nsf/LookupFiles/DownloadableFile2005StatisticalSupplement/$File/2278A_StatSup.pdf.
389. Ontario. R.R.O.1990, Regulation 552, s.3(3), made under the Health Insurance Act, R.S.O. 1990, c.H.6. 1994.
390. Personal communication with Karen Hann, Director, Health Care Management, Health Services Division, Workplace Safety and Insurance Board, May 6. 2004.
391. UHN Rehab Solutions. Satellite clinics. 2006. Accessed January 14, 2007, at http://www.uhnrehabsolutions.com/index.php?option=com_content&task=view&id=49&Itemid=113.
392. UHN Rehab Solutions. About us. 2006. Accessed January 14, 2007, at http://www.uhnrehabsolutions.com/index.php?option=com_content&task=view&id=52&Itemid=119.
393. Schultz SE, Tepper J, Guttmann A, Jaakkimainen L. Characteristics of primary care practice. In Jaakkimainen L, Upshur R, Klein-Geltink JE, Leong A, Maaten S, Schultz SE et al, eds. Primary care in Ontario: ICES atlas, pp 175-206. Toronto: Institute for Clinical Evaluative Sciences, 2006.
394. College of Physicians and Surgeons of Ontario. 2007 registration statistics and survey findings: reaping the rewards - striving for sustainability. 2008. Accessed April 21, 2008, at http://www.cpso.on.ca/Publications/2007%20Reg%20Stats%20and%20Survey.pdf.
395. College of Physiotherapists of Ontario. Code of ethics. 2000. Accessed on August 8, 2006, at http://www.collegept.org/college/content/pdf/en/guide/Code_Ethics.pdf.
396. Cott CA, Devitt RMA, Falter L-B, Soever LJ, Passalent LA. Barriers to rehabilitation in primary health care in Ontario: funding and wait times for physical therapy services. Physiotherapy Canada 2007;59:173-83.
397. Toronto Sports & Exercise Medicine Institute. Testimonials. 2005. Accessed on March 18, 2007, at http://www.semisportsmed.com/hm/inside.php?sid=4.
398. Lalonde, M. A new perspective on the health of Canadians. 1974. Ottawa, Minister of Supply and Services Canada.
399. Canadian Institute for Health Information. The burden of neurological diseases, disorders and injuries in Canada. 2007. Ottawa, Canadian Institute for Health Information.
400. National Institute of Neurological Disorders and Stroke. Traumatic brain injury: hope through research. 2002. Bethesda, MD, National Institute of Neurological Disorders and Stroke.
401. National Institute of Neurological Disorders and Stroke. Spinal cord injury: hope through research. 2003. Bethesda, MD, National Institute of Neurological Disorders and Stroke.
402. Toronto Rehabilitation Institute. +5: Report on rehabilitation research 2005/06. 2006. Toronto, Toronto Rehabilitation Institute.
403. Caves RE. Industrial organization and new findings on the turnover and mobility of firms. Journal of Economic Literature 1998;XXXVI:1947-82.
404. McMaster University School of Rehabilitation Science. Curriculum design MSc(PT). 2007. Accessed on June 13, 2007, at http://www.srs-mcmaster.ca/nbspnbspProgramsnbspnbspnbspnbsp/MScPT/CourseListing/tabid/1575/Default.aspx.

276
405. Université d'Ottawa, Faculté des sciences de la santé. Maîtrise ès sciences de la santé en physiothérapie - description des cours. 2007. Accessed on June 13, 2007, at http://www.sante.uottawa.ca/pdf/PHT_Description_des_cours.pdf.
406. University of Toronto Department of Physical Therapy. Master's entry to practice curriculum. 2007. Accessed on June 13, 2007, at http://www.physicaltherapy.utoronto.ca/Prospective_Students/Master_s_Entry_to_Practice_Curriculum.htm.
407. Queen's University School of Graduate Studies and Research. Rehabilitation therapy. 2007. Accessed on June 13, 2007, at http://www.queensu.ca/calendars/sgsr/pg312.html.
408. University of Western Ontario, School of Physical Therapy. Professional program (MPT) courses. 2007. Accessed on June 13, 2007, at http://www.uwo.ca/fhs/pt/new/prospective/mpt/courses.html.
409. Aviva plc. Aviva world - your global contacts and products directory. 2007. Accessed June 18, 2007, at http://www.aviva.com/avivaworld/index.asp?pageid=177.
410. State Farm Mutual Automobile Insurance Company. 2005 annual report to State Farm mutual policyholders. 2006. Accessed on April 4, 2007, at http://www.statefarm.com/about/media/annualrep.asp.
411. Financial Services Commission of Ontario. Auto Insurance Rates for the Fourth Quarter of 2005 [Bill 5]. 2006. Accessed on April 4, 2007, at http://www.fsco.gov.on.ca/english/insurance/auto/rates/q4-2005.asp.
412. Farmer's Mutual Insurance Company. Balance sheet, December 31, 2005. 2007. Accessed on April 4, 2007, at http://www.farmerslindsay.com/engine.cfm?i=41.
413. Canadian Life and Health Insurance Association Inc. Canadian life and health insurance facts, 2003 edition. 2003. Toronto, Canadian Life and Health Insurance Association Inc.
414. Canadian Life and Health Insurance Association Inc. Canadian life and health insurance facts, 2005 edition. 2005. Toronto, Canadian Life and Health Insurance Association Inc.
415. Financial Services Commission of Ontario. Auto Insurance Rates for the Second Quarter of 2006 [Bill 5]. 2006. Accessed on April 4, 2007, at http://www.fsco.gov.on.ca/english/insurance/auto/rates/q2-2006.asp.
416. Financial Services Commission of Ontario. Auto Insurance Rates for the Third Quarter of 2006 [Bill 5]. 2006. Accessed on April 4, 2007, at http://www.fsco.gov.on.ca/english/insurance/auto/rates/q3-2006.asp.
417. Financial Services Commission of Ontario. Auto Insurance Rates for the Fourth Quarter of 2006 [Bill 5]. 2007. Accessed on April 4, 2007, at http://www.fsco.gov.on.ca/english/insurance/auto/rates/q4-2006.asp.
418. Financial Services Commission of Ontario. Auto Insurance Rates for the First Quarter of 2007 [Bill 5]. 2007. Accessed on April 4, 2007, at http://www.fsco.gov.on.ca/english/insurance/auto/rates/q1-2007.asp.
419. Gildiner, A. What's past is prologue: a historical-institutionalist analysis of public-private change in Ontario's rehabilitation health sector, 1985-1999. 2001. University of Toronto, Department of Health Policy, Management and Evaluation.
420. Gildiner A. Measuring shrinkage in the welfare state: forms of privatization in a Canadian health-care sector. Canadian Journal of Political Science 2006;39:53-75.
421. Sun Healthcare Group Inc. Form 10-K for 12/31/99, filed 7/14/00, SEC [United States Securities and Exchange Commission] File 1-12040, Accession Number 904978-0-23. 2000. Accessed March 14, 2007, at http://www.secinfo.com/drJxt.5x.htm.

277
422. Sun Healthcare Group Inc. Form 10-K for 12/31/00, filed 4/2/01, SEC [United States Securities and Exchange Commission] File 1-12040, Accession Number 904978-1-6. 2001. Accessed March 14, 2007, at http://www.secinfo.com/drJxt.49x.htm.
423. Lifemark Health Limited. Lifemark Health. 2007. Accessed on April 1, 2007, at http://www.lifemark.ca/About.aspx.htm.
424. Canadian Medical Discoveries Fund. Our portfolio: view by company. 2007. Accessed April 15, 2007, at http://www.cmdf.com/en/portfolio/company.asp?id=201.
425. Mayer-Brown LLP. Mayer-Brown: Matthew A. Posthuma, partner. 2007. Accessed November 18, 2007, at http://www.mayerbrown.com/lawyers/profile.asp?hubbardid=P165940047.
426. Alaris Income Growth Fund. Alaris investments. 2007. Accessed November 17, 2007, at http://www.alarisfund.com/investments.html.
427. Alexander, F. and Pasternak, S. B. Tax stifles Royal Bank, CIBC, TD profits as trust IPOs dry up. 2007. Accessed November 17, 2007, at http://www.bloomberg.com/apps/news?pid=20601082&sid=acWTOvg2Pn5Q&refer=canada.
428. MEDIchair Inc. MEDIchair history. 2005. Accessed August 8, 2007, at http://www.medichair.com/corporate/history.asp.
429. Select Medical Corporation. Form S-1/A, filed 12/7/00, SEC [United States Securities and Exchange Commission] File 333-48856, Accession Number 1036050-0-2107. 2000. Accessed July 18, 2007, at http://www.secinfo.com/dvJxt.512k.htm.
430. Select Medical Corporation. Form 10-Q, filed 6/30/01, SEC [United States Securities and Exchange Commission] File 0-32499, Accession Number 1036050-1-500846. 2001. Accessed July 18, 2007, at http://www.secinfo.com/dvJxt.4F931.htm.
431. CBI Health Inc. Star Rehabilitation. 2007. Accessed on August 1, 2007, at http://www.cbi.ca/default3.cfm.
432. Concorida Sports Medicine and Physiotherapy. Concordia Physio Sport. 2007. Accessed on August 1, 2007, at http://www.concordiasportsmed.com/eng/about_us.ch2.
433. Select Medical Corporation. Form 8-K, filed 12/28/05, SEC [United States Securities and Exchange Commission] File 1-31441, Accession Number 893220-5-2997. 2005. Accessed July 18, 2007, at http://www.secinfo.com/dr89b.z2Tq.htm.
434. CBI Health. CBI Health completes management buyout agreement with Select Medical Corporation. 2006. Accessed on April 1, 2007, at https://www.cbi.ca/aboutcbi/news.cfm?d=2006-03-23.
435. Lexpert.ca. Callisto Capital acquires Canadian Back Institute. 2006. Accessed on November 17, 2007, at http://www.lexpert.ca/deal.php?id=3389.
436. Brealey RA, Myers SC. Principles of corporate finance. New York: McGraw-Hill/Irwin, 2003.
437. Pender Financial Group Corporation. Pender Financial Group announces sale of Care Point Medical Centres to CBI Health. 2006. Accessed June 18, 2007, at http://www.penderfinancial.com/pdfs/Pender%20News%20Release%2008-16-06%20(Sale%20CarePoint-07).pdf.
438. CBI Health. Toronto, June 28, 2007. 2007. Accessed July 18, 2007, at http://www.cbi.ca/aboutcbi/news.cfm?d=2007-06-28.
278
439. Healthsouth Corporation. Form 10-Q, filed 8/8/07, SEC [United States Securities and Exchange Commission] File 1-10315, Accession Number 1378862-7-42. 2007. Accessed August 21, 2007, at http://www.secinfo.com/d1a2H1.ul5.htm.
440. Ontario. R.R.O. 1990, Regulation 552, Schedule 1, Part 1, Item 1. 2001.
441. Priest, L. Ontario mulls private knee operations: one-stop shopping proposal under review. Globe and Mail. 3-15-2007.
442. Alegro Health Corporation. Alegro board announces clinic drug trials joint venture. 2007. Accessed on July 17, 2007, at http://www.207.61.233.212/press%20release0507.pdf.
443. Global Healthcare Investments & Solutions, LLC. Global Healthcare Investments & Solutions -- company and contact details. 2007. Accessed on November 17, 2007, at http://www.ghis.us/company_contact_details.html.
444. Alegro Health Corporation. Alegro board announces significant strategic alliance. 2007. Accessed on July 17, 2007, at http://www.207.61.233.212/AlgeroPressMay107/pdf.
445. AIM Health Group. AIM Health group divisions. 2007. Accessed on November 17, 2007, at http://www.aimhealthgroup.com/divisions.htm.
446. Gildiner A. The organization of decision-making and the dynamics of policy drift: a Canadian health sector example. Social Policy and Administration 2007;41:505-24.
447. Hurley J, Pasic D, Lavis JN, Mustard C, Culyer AJ, Gnam W. Parallel lines do intersect: interactions between the workers' compensation and provincial publicly financed healthcare systems in Canada. Healthcare Policy 2008;3:100-12.
448. Ontario Ministry of Health and Long-Term Care. Family health teams. 2007. Accessed September 17, 2007, at http://www.health.gov.on.ca/transformation/fht/fht_mn.html.
449. Deber RB, Gildiner A, Baranek P. Why not private health insurance? 1. Insurance made easy. CMAJ 1999;161:539-42.
450. Canadian Life and Health Insurance Association Inc. Presentation on the consultation document "Guaranteeing access: meeting the challenges of equity, efficiency and quality". 2006.
451. Heap R. Training women for a new "women's profession": physiotherapy education at the University of Toronto, 1917-40. History of Education Quarterly 1995;35:135-58.

Appendix 1 – Survey Questionnaire
279

2005 Survey of Organizations Providing Physiotherapy/ Physical Therapy Services in Ontario
Investigators: Raisa B. Deber, PhD
Paul Holyoke, PhD (Candidate) Molly C. Verrier, Dip P&OT, MHSc
Research Coordinator:
Cathy Bezic
About this Survey
This survey is part of a research study which examines service delivery and access to physiotherapy services in Ontario. The results of this survey will be reported in aggregated form only; no individual responses will be identifiable. The results of the research study will be made available to physiotherapists, policy makers and others who have an interest in these issues.
Supported by a grant from the Canadian Institutes of Health Research
ID Number: RON-
280

2005 Survey of Organizations Providing Physiotherapy/Physical Therapy Services in Ontario
WHO SHOULD RESPOND TO THIS QUESTIONNAIRE This survey is designed for Organizations that include physiotherapy services among the services they have provided during the past six months. If your Organization has provided physiotherapy services in the last six months: The onsite Administrator or Manager of your Organization, or other person who knows about the services you have provided and the clients you have served, should complete this questionnaire.
• If your Organization is a hospital, long-term care facility, workplace, school or other institution, the Administrator or Manager of the rehabilitation or physiotherapy unit may be the best person to complete this questionnaire.
DEFINITIONS OF TERMS USED IN THIS QUESTIONNAIRE “Organization” We define Organization broadly to include all sole proprietorships, partnerships, professional and other corporations, for-profit and not-for-profit, in the private sector and in the public sector. When we ask questions about your Organization, we would like you to think of the entire Organization. “Setting” When we refer to Setting in this questionnaire, we want you to think of the activities that occur in (or out of) the service delivery setting at the mailing address where you received this questionnaire, even if your Organization has other Settings or sites. • In a hospital, long-term care facility, workplace, school or other institution, please
consider the rehabilitation or physiotherapy unit or department associated with the mailing address where you received this questionnaire as your Setting.
“Typical month” When answering this questionnaire, please think about a recent month which best characterizes your Organization’s provision of physiotherapy services. This should be a month in which most or all staff at your Setting were at work and not, for example, on holiday or on reduced hours. “Clients” For simplicity, we use the term Clients in this questionnaire to refer to the persons who receive physiotherapy services from your Organization. Depending on your Organization, “clients” could include patients, customers, residents, employees and/or students. “Physiotherapy” and “physiotherapist” For simplicity, we use the terms “physiotherapy” and “physiotherapist” throughout this questionnaire and these are intended to mean the same as “physical therapy” and “physical therapist”. “Regulated physiotherapist” “Regulated physiotherapist” means a physiotherapist who is a member of the College of Physiotherapists of Ontario. “Physiotherapy services” “Physiotherapy services” refers to physiotherapy services whether or not these are performed by regulated physiotherapists.
281

INSTRUCTIONS 1. Most questions can be answered by checking a box or filling in a blank. Note that the survey
is printed on both sides of the paper. 2. The terms we have used are defined on page 2. 3. While some questions may not specifically apply to your Organization, it is important that
you answer those that do apply to ensure that the results accurately reflect the pattern of access and service delivery across Ontario.
4. We are very interested in any additional thoughts you might have about this survey or about access to physiotherapy services in Ontario. We have left space on the back page for this purpose.
5. Please do not remove the identification number on this questionnaire. It will be used only to monitor returns and prevent re-mailing to those who have already responded.
6. Please return the completed questionnaire in the prepaid envelope. Thank you for your participation!
ASSURANCE OF PRIVACY AND CONFIDENTIALITY Completed questionnaires will be kept in a secure, locked location in the Department of Health Policy, Management and Evaluation at the University of Toronto, and will be accessed only by the research team. Individual data will not be shared with any other organization and no information which could identify you or your organization will ever be released. QUESTIONS ABOUT THE QUESTIONNAIRE If you have any questions, please feel free to contact Cathy Bezic, Research Coordinator, at: Phone: 416-946-3043 Email: [email protected] Address: 2005 Survey of Organizations Providing Physiotherapy Services in Ontario Department of Health Policy, Management and Evaluation
University of Toronto 12 Queen’s Park Crescent West, McMurrich Building, 2nd Floor Toronto, Ontario M5S 1A8
RESULTS OF THE SURVEY Aggregate results will be available on-line later this year on the M-THAC website (www.m-thac.org).
BEGINNING OF QUESTIONNAIRE SECTION 1: PROVISION OF PHYSIOTHERAPY SERVICES 1. Does your Organization provide physiotherapy services? (Circle Yes or No)
Yes If YES, please proceed to question 2 and the rest of the questionnaire
No If NO, please return this questionnaire in the prepaid envelope so that we don’t send you any unnecessary reminders. Thanks for your participation!
282

SECTION 2: CHARACTERISTICS OF YOUR SETTING 2. For each of the categories of workers listed below, how many people work in (or out of) your Setting
in a typical month? How many Full Time Equivalents? a) REGULATED HEALTH PROFESSIONALS Number of people Number of Full Time Equivalents Physiotherapists
Audiologists and Speech Language Pathologists
Chiropodists
Chiropractors
Dietitians
Massage Therapists
Nurses
Occupational Therapists
Physiatrists
Other Physicians
Podiatrists
Other (specify: )
b) ASSISTANTS TO REGULATED HEALTH PROFESSIONALS Athletic Therapists
Ergonomists
Kinesiologists
Occupational Therapy Assistants
Personal Support Workers
Physiotherapy Assistants/Aides
Rehabilitation Assistants
Other (specify: )
c) PRACTITIONERS OF COMPLEMENTARY AND ALTERNATIVE MEDICINE Acupuncturists
Aromatherapists Homeopaths
Naturopaths
Osteopaths
Other (specify: ) d) OTHERS Case Managers Home Makers
Home Visitors
Vocational Rehabilitation Counsellors
Management Staff
Administrative Staff
Other (specify: )
283

3. In addition to physiotherapy, does your Setting provide the following services to clients? For each
service you provide, please indicate whether it is provided by regulated physiotherapists.
Circle Yes or No
If yes, circle whether a regulated physiotherapist provides the service: Always Sometimes Never
Acupuncture Yes No A S N
Audiology and/or Speech Language Pathology Yes No A S N
Aromatherapy Yes No A S N
Art Therapy Yes No A S N
Assistive Devices Program evaluations Yes No A S N Case Management Yes No A S N
Chiropractic Yes No A S N
Cranial-sacral Therapy Yes No A S N
Designated Assessment Centre Assessments Yes No A S N
Ergonomic Assessments and Advice Yes No A S N
Exercise Therapy Yes No A S N
Functional Evaluations Yes No A S N
Home Making Yes No A S N
Home Visiting Yes No A S N
Horticultural Therapy Yes No A S N
Hydrotherapy Yes No A S N
Manipulation Therapy Yes No A S N
Medical/Physician Services Yes No A S N
Music Therapy Yes No A S N
Naturopathic Medicine Yes No A S N
Nursing Services Yes No A S N
Nutritional and/or Weight Loss Counselling Yes No A S N
Occupational Therapy Yes No A S N
Orthotics Yes No A S N
Personal Training Yes No A S N
Pilates Yes No A S N
Psychological Evaluation and/or Counselling Yes No A S N
Recreation Therapy Yes No A S N
Reflexology Yes No A S N
Reiki Yes No A S N
Shiatsu Yes No A S N
Tai Chi Yes No A S N
Vocational Rehabilitation Yes No A S N Workplace Assessments and Counselling Yes No A S N Other (specify: ) Yes No A S N 284

4. Approximately how many physiotherapy treatments does your Setting perform in a typical month? Example: if your Setting has 2 people who each provide physiotherapy services to 15 clients in a typical day and each works 20 days in a typical month, for the purposes of this question, your Setting provides 2 people x 15 clients x 20 days = 600 physiotherapy treatments in a typical month.
(Fill in number)
5. Of the number of physiotherapy treatments indicated in question 4, approximately what percentage
are performed by:? (Percentages should add up to 100%)
a) Regulated physiotherapists %
b) Assistants to regulated physiotherapists %
c) Other (specify: )
TOTAL 100% 6. Of the physiotherapy services your Setting provides in a typical month, approximately what
percentage falls into each of the following service categories? (Percentages should add up to 100%)
a) Amputees %
b) Arthritis %
c) Cardiology/Respirology %
d) Mental Health %
e) Neurology/Neurotrauma %
f) Orthopaedics/Musculoskeletal Disease/Trauma (other than Sports Medicine) %
g) Palliative Care %
h) Prevention/Health Promotion %
i) Sports Medicine %
j) Women’s Health %
k) Other (specify: ) %
TOTAL 100%
7. Of the physiotherapy services your Setting provides in a typical month, approximately what
percentage is delivered to each of the following age categories? (Percentages should add up to 100%)
a) Children, under 18 years old %
b) Adults, aged 18-65 %
c) Seniors, over 65 years old %
TOTAL 100% 8. Approximately what percentage of your Setting’s total revenues come from services provided by
regulated physiotherapists in a typical month? (If your Setting is funded by a budget from a larger organization, approximately what percentage of your total budget is allocated for regulated physiotherapists in a typical month?) (Circle one answer only)
a) 0% b) 1-19% c) 20-39% d) 40-59% e) 60-79% f) 80-100%
285
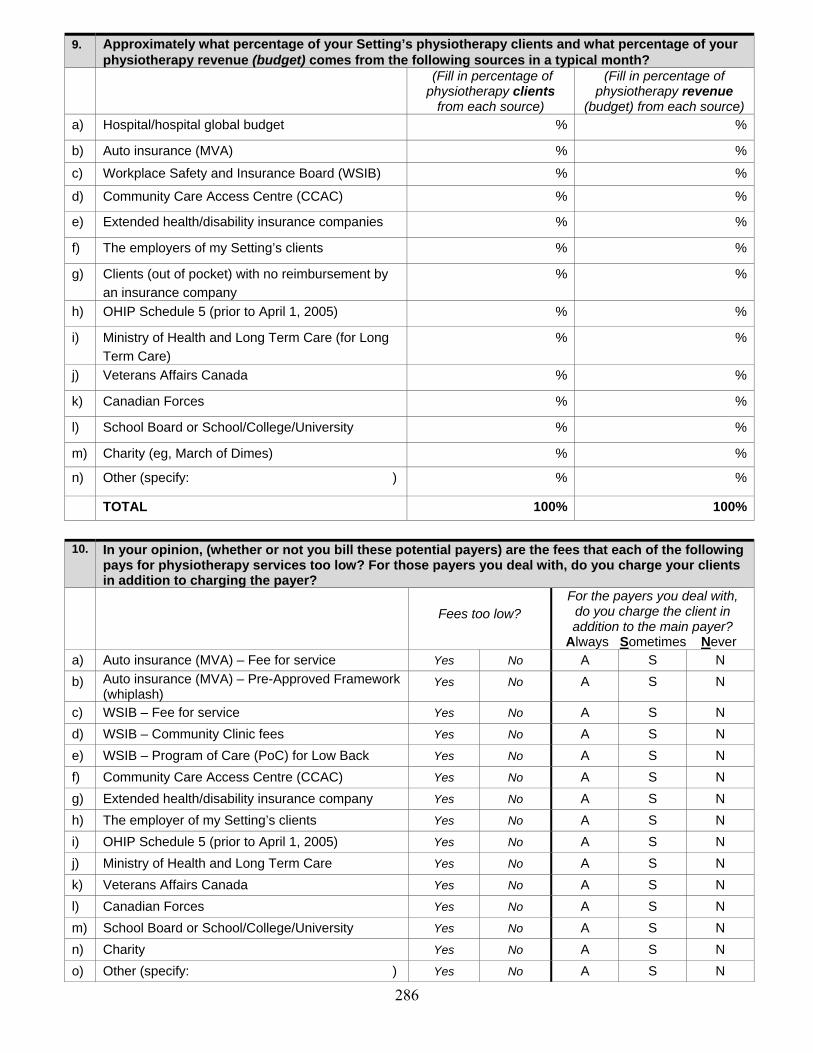
9. Approximately what percentage of your Setting’s physiotherapy clients and what percentage of your
physiotherapy revenue (budget) comes from the following sources in a typical month? (Fill in percentage of
physiotherapy clients from each source)
(Fill in percentage of physiotherapy revenue
(budget) from each source) a) Hospital/hospital global budget % %
b) Auto insurance (MVA) % %
c) Workplace Safety and Insurance Board (WSIB) % %
d) Community Care Access Centre (CCAC) % %
e) Extended health/disability insurance companies % %
f) The employers of my Setting’s clients % %
g) Clients (out of pocket) with no reimbursement by an insurance company
% %
h) OHIP Schedule 5 (prior to April 1, 2005) % %
i) Ministry of Health and Long Term Care (for Long Term Care)
% %
j) Veterans Affairs Canada % %
k) Canadian Forces % %
l) School Board or School/College/University % %
m) Charity (eg, March of Dimes) % %
n) Other (specify: ) % %
TOTAL 100% 100%
10. In your opinion, (whether or not you bill these potential payers) are the fees that each of the following
pays for physiotherapy services too low? For those payers you deal with, do you charge your clients in addition to charging the payer?
Fees too low?
For the payers you deal with, do you charge the client in addition to the main payer?
Always Sometimes Never a) Auto insurance (MVA) – Fee for service Yes No A S N b) Auto insurance (MVA) – Pre-Approved Framework
(whiplash) Yes No A S N
c) WSIB – Fee for service Yes No A S N d) WSIB – Community Clinic fees Yes No A S N e) WSIB – Program of Care (PoC) for Low Back Yes No A S N f) Community Care Access Centre (CCAC) Yes No A S N g) Extended health/disability insurance company Yes No A S N h) The employer of my Setting’s clients Yes No A S N i) OHIP Schedule 5 (prior to April 1, 2005) Yes No A S N j) Ministry of Health and Long Term Care Yes No A S N k) Veterans Affairs Canada Yes No A S N l) Canadian Forces Yes No A S N m) School Board or School/College/University Yes No A S N n) Charity Yes No A S N o) Other (specify: ) Yes No A S N
286

11. Some therapists are paid by two or more payers for the same client for various reasons (for example,
when one insurer doesn’t cover the full treatment cost or coverage runs out and the client or another insurer is then charged). How frequently does this occur in your Setting?
a) Always b) Sometimes c) Never
11a. If you answered ALWAYS or SOMETIMES to question 11, what is most common combination of
payers for the same client?
Payer #2
12. What is the typical or average fee paid by the following payers for one unit of physiotherapy service?
(Fill in typical fee only for the payers your Setting typically deals with)
a) Auto insurance (MVA) – Fee for service $ b) WSIB – Fee for service $ c) Community Care Access Centre (CCAC) $
d) Extended health/disability insurance company $ e) The employers of my Setting’s clients $ f) Clients (out of pocket) $
g) OHIP Schedule 5 (typical fee prior to April 1, 2005) $
h) Ministry of Health and Long Term Care $
i) Veterans’ Affairs Canada $
j) Canadian Forces $
k) School Board or School/College/University $
l) Charity $
m) Other (specify: ) $
13. What is the typical total program fee paid by the following payers for services to your clients?
(Fill in typical total program fee only for the payers your Setting typically deals with)
a) Auto insurance (MVA)- Pre-Approved Framework (Whiplash) $
b) WSIB – Program of Care (PoC) for Low Back $ 14. Does your Organization have the profile or range of clients it wants now? (Circle Yes or No)
a) Yes b) No
14a. If you answered NO to question 14, what is the profile or range of clients you would like to be serving? (Fill in answer)
Payer #1
287
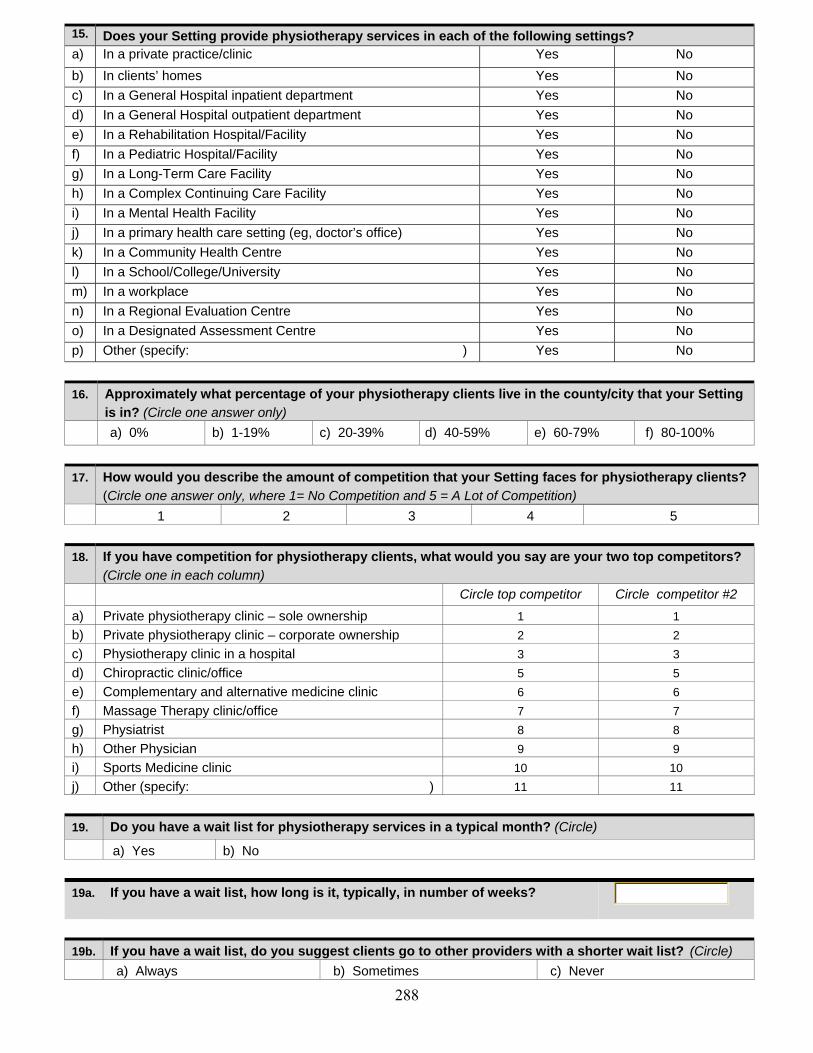
15. Does your Setting provide physiotherapy services in each of the following settings? a) In a private practice/clinic Yes No b) In clients’ homes Yes No c) In a General Hospital inpatient department Yes No d) In a General Hospital outpatient department Yes No e) In a Rehabilitation Hospital/Facility Yes No f) In a Pediatric Hospital/Facility Yes No g) In a Long-Term Care Facility Yes No h) In a Complex Continuing Care Facility Yes No i) In a Mental Health Facility Yes No j) In a primary health care setting (eg, doctor’s office) Yes No k) In a Community Health Centre Yes No l) In a School/College/University Yes No m) In a workplace Yes No n) In a Regional Evaluation Centre Yes No o) In a Designated Assessment Centre Yes No p) Other (specify: ) Yes No 16. Approximately what percentage of your physiotherapy clients live in the county/city that your Setting
is in? (Circle one answer only) a) 0% b) 1-19% c) 20-39% d) 40-59% e) 60-79% f) 80-100% 17. How would you describe the amount of competition that your Setting faces for physiotherapy clients?
(Circle one answer only, where 1= No Competition and 5 = A Lot of Competition) 1 2 3 4 5
18. If you have competition for physiotherapy clients, what would you say are your two top competitors?
(Circle one in each column) Circle top competitor Circle competitor #2
a) Private physiotherapy clinic – sole ownership 1 1 b) Private physiotherapy clinic – corporate ownership 2 2 c) Physiotherapy clinic in a hospital 3 3 d) Chiropractic clinic/office 5 5 e) Complementary and alternative medicine clinic 6 6 f) Massage Therapy clinic/office 7 7 g) Physiatrist 8 8 h) Other Physician 9 9 i) Sports Medicine clinic 10 10 j) Other (specify: ) 11 11 19. Do you have a wait list for physiotherapy services in a typical month? (Circle)
a) Yes b) No
19a. If you have a wait list, how long is it, typically, in number of weeks?
19b. If you have a wait list, do you suggest clients go to other providers with a shorter wait list? (Circle) a) Always b) Sometimes c) Never 288

SECTION 3: CHARACTERISTICS OF YOUR ORGANIZATION 20. How many Settings does your Organization have?
If there is only one setting in your organization, GO TO QUESTION 22 If there is more than 1, GO TO QUESTION 21
21. Are your Organization’s other Settings… (Circle all that apply)
a) Elsewhere in this county/city? Yes No
b) Elsewhere in Ontario but outside this county/city? Yes No
c) Elsewhere in Canada, but outside Ontario? Yes No
d) In the United States? Yes No
e In other countries? Yes No 22. Sometimes an Organization is owned by a health professional who provides services to the
Organization’s clients. Are any of your Organization’s owners: (Circle all that apply) a) A regulated physiotherapist who provides such services Yes No
b) A regulated physiotherapist who does not provide such services Yes No c) A physician who does provides services for such services Yes No d) A physician who does not provide such services Yes No e) Another regulated health professional who provides such services Yes No f) Another regulated health professional who does not provide such services Yes No
g) Someone other than a regulated health professional? Yes No 23. What best describes the ownership of your Organization? (Circle one answer only)
a) Owned by one individual b) Owned by a partnership of two or more people c) Owned by a Professional Corporation d) Owned by a corporation (eg, name has Ltd., Inc., or Corp.) listed on the stock exchange e) Owned by a corporation (eg, name has Ltd., Inc., or Corp.) not listed on the stock exchange
f) Don’t know 24. If your Organization’s owner is a partnership or a corporation, where is the partnership or corporation
based? (Circle one answer only)
a) Ontario
b) Elsewhere in Canada, outside Ontario
c) Outside Canada
d) Don’t know 25. Does your Organization have non-profit status? (Circle Yes or No) a) Yes b) No
SECTION 4: OPINIONS ON ACCESS TO PHYSIOTHERAPY SERVICES 26. Do you think there are people in your county/city who don’t have access to the physiotherapy
services they need? (Circle one answer only)
a) Many people b) Some people c) A few people d) No one
289

26a. If you answered MANY, SOME or FEW to question 26, how much does each of the following contribute to the problems of access? (Check one box in each line)
Contributes a great deal
Contributes somewhat
Doesn’t contribute at all
a) There aren’t enough therapists in my county/city
b) People don’t know the value of physiotherapy
c) Other health professionals don’t refer their clients
d) People cannot afford to pay for physiotherapy services
e) Government is not permitting appropriate access
f) Community Care Access Centres are not providing appropriate access
g) WSIB is not permitting appropriate access
h) Auto insurance companies are not permitting appropriate access
i) Extended health/disability insurance companies are not permitting appropriate access
j) Government does not pay appropriate fees
k) Community Care Access Centres do not pay appropriate fees
l) WSIB does not pay appropriate fees
m) Auto insurance companies do not pay appropriate fees
f) Extended health/disability insurance companies do not pay appropriate fees
g) Paperwork is too big a burden
h) Other (specify: )
27. How frequently does your Setting encounter people who can’t afford physiotherapy services and
don’t have sufficient insurance? (Circle the most appropriate response)
a) Every day b) At least once a week c) At least once every two weeks d) At least once a month e) At least once a year f) Rarely or never 27a. If your Setting encounters people who can’t afford physiotherapy services of who don’t have
sufficient insurance, are the people: (Circle all applicable) a) Children, under 18 years old b) Adults, aged 18-65
c) Seniors, over 65 years old
27b. If your Setting encounters people who can’t afford physiotherapy services or who don’t have
sufficient insurance, how frequently do you: Always Sometimes Never Not Applicable
Refer them to an OHIP Schedule 5 clinic? A S N N/A
Refer them to a hospital outpatient clinic? A S N N/A
Treat them at this Setting anyway? A S N N/A
Other (specify: ) A S N N/A
290

SECTION 5: ADDITIONAL COMMENTS 28. We are very interested in any additional thoughts you might have about this survey or about access
to physiotherapy services in Ontario.
END OF QUESTIONNAIRE
Now that you have finished the questionnaire, would you please put it in the prepaid envelope and send it in. Thank you for your participation!
2005 Survey of Organizations Providing Physiotherapy Services in Ontario Department of Health Policy, Management and Evaluation, University of Toronto
12 Queen’s Park Crescent West, McMurrich Building, 2nd Floor Toronto, Ontario M5S 1A8
416-946-3043
291

Appendix 2 – Survey – First Information Letter
292

2
2005 Survey of Organizations Providing Physiotherapy Services in Ontario
NOTE: This letter should be directed to the person who knows about the services your organization has provided and about the clients your organization has served. Generally, this would be the onsite Administrator or Manager of your organization; in a hospital, long-term care facility, workplace, school or other institution, the Administrator or Manager of the physiotherapy or rehabilitation unit may be the best person to receive this letter. Dear Colleague, We would like to invite you and your organization to volunteer to participate in this important research study by completing the enclosed questionnaire. It should take no more than 20 minutes to complete and most questions can be answered by circling a number or filling in a blank. While some questions may not specifically apply to your organization, it is important that you answer those that do apply to ensure that the results of the research study accurately reflect how the different payment streams affect cost and access to physiotherapy services provided by different organizations across Ontario.
This study is particularly important given changing government policies, insurers’ practices, hospital priorities, demographics, and rehabilitation providers’ own practice preferences. Though many people have speculated what the effect of these changes is, the results of the enclosed survey will help establish what actually is happening.
When we receive your response, the information in it will be aggregated with all other responses and your response will be kept confidential. The number on your questionnaire will be used only to monitor returns and to prevent re-mailing to those who have already responded. Completed questionnaires will be kept in a secure, locked location in the Graduate Department of Health Policy, Management and Evaluation at the University of Toronto with access only by the University research team. All questionnaires will be destroyed within two years of the study’s end. Individual data will not be shared with any other organization and no information which could identify you or your organization will ever be released. The aggregated responses to the survey will be available to you in 2005 on the website of the Medicare to Home and Community Research Unit (www.m-thac.org) and will be shared with physiotherapists, policy makers, and others who have an interest in these areas.
Please take the time to complete the enclosed questionnaire. Your response is vital to ensure that the patterns of access and service delivery are accurately and effectively reflected. If you have any questions or suggestions, please contact our Research Coordinator, Cathy Bezic, by telephone at 416-946-3043 or by email at [email protected].
Thank you again for your crucial contribution to this research about access to physiotherapy services in Ontario.
Sincerely,
Raisa B. Deber, PhD Paul Holyoke, PhD (Candidate) Molly C. Verrier, Dip P & OT, MHSc
293

Appendix 3 – Survey – Reminder Card
294

2005 Survey of Organizations Providing Physiotherapy Services in Ontario
NOTE: This card should be directed to the person who knows about the physiotherapy
services your organization has provided. Recently, we sent you and your organization an invitation to participate in an important research study by answering questions about the services you offer. If you have already sent back your questionnaire, please accept our thanks. If not, we hope you will do so today. Your answers will contribute to a better understanding of the issues of access to and delivery of physiotherapy services in Ontario. The University of Toronto research team will keep all individual responses secure, private and confidential and no organization or individual will be identified.
Thank you for your participation!
If you did not receive a survey, or have questions, contact Cathy Bezic, Research Coordinator, tel: 416-946-3043, email: [email protected].
295

Appendix 4 – Survey – Second Information Letter
296

[front] If you are not the most appropriate person in your organization to receive this letter, please redirect it to the onsite Administrator or Manager of your organization, or other person who knows about the physiotherapy services your organization has provided and about the clients your organization has served. Thank you.
Dear Colleague, We are conducting a study examining patterns of access to physiotherapy services in Ontario and we would like to invite you and your organization to volunteer to participate in this study by completing the enclosed questionnaire.
This study is particularly important given changing government policies, insurers’ practices, hospital priorities, demographics, and rehabilitation providers’ own practice preferences. Though many people have speculated what the effect of these changes is, the results of the enclosed survey will help establish what actually is happening. The aggregated responses will be available to you later in 2005 on the website of the Medicare to Home and Community Research Unit (www.m-thac.org).
The questionnaire should take about 20-25 minutes to complete and most questions can be answered by circling a number or filling in a blank. While some questions may not specifically apply to your organization, it is important that you answer those that do apply to ensure that the results of the research study accurately reflect how the different payment streams affect cost and access to physiotherapy services provided by different organizations across the province.
Please take the time to complete the enclosed questionnaire. Your response is vital to ensure that the patterns of access and service delivery are accurately and effectively reflected. If you have any questions or suggestions, please contact our Research Coordinator, Cathy Bezic, by telephone at 416-946-3043 or by email at [email protected]. On the other side of this letter, we have provided details about the measures we are taking to ensure the confidentiality, privacy and security of your response.
Thank you again for your crucial contribution to this research about access to physiotherapy services in Ontario.
Sincerely, Raisa B. Deber, PhD Paul Holyoke, PhD (Candidate) Molly C. Verrier, Dip P & OT,
MHSc PS: Thanks again for your assistance in this research study.
297

[back]
Confidentiality, privacy and security measures for the 2005 Survey of Organizations Providing Physiotherapy Services in Ontario
When we receive your response, the information in it will be aggregated with all other responses and your response will be kept confidential. The number on your questionnaire will be used only to monitor returns and to prevent re-mailing to those who have already responded. Completed questionnaires will be kept in a secure, locked location in the Graduate Department of Health Policy, Management and Evaluation at the University of Toronto with access only by the University research team. All questionnaires will be destroyed within two years of the study’s end. Individual data will not be shared with any other organization and no information which could identify you or your organization will ever be released.
The aggregated responses to the survey will be available to you in 2005 on the website of the Medicare to Home and Community Research Unit (www.m-thac.org) and will be shared with physiotherapists, policy makers, and others who have an interest in these areas.
298

1
Appendix 5 – Survey – Codebook
299

2
CodeBook QID=########## Section 1 1) Does your organization provide, or have you in the last six months provided, physiotherapy services? Variable Name Type Value Description Organi_1 Boolean 0,1 0=No, 1=Yes Section 2 2) For each of the categories of workers listed below, how many people work in (or out of) your Setting in a typical month? How many Full Time Equivalents? Regulated Health Professionals Variable Name Type Value Description
Variable Name Type Value Description
Phys_2 Numeric 0 - 99 # of Physiotherapists PhysF_2 Numeric 0 - 99 # of Full Time Equivalents Aud_2 Numeric 0 - 99 # of Audiologists AudF_2 Numeric 0 - 99 # of Full Time Equivalents Chi_2 Numeric 0 - 99 # of Chirpodists ChiF_2 Numeric 0 - 99 # of Full Time Equivalents Chr_2 Numeric 0 - 99 # of Chiropractors ChrF_2 Numeric 0 - 99 # of Full Time Equivalents Die_2 Numeric 0 - 99 # of Dietitions DieF_2 Numeric 0 - 99 # of Full Time Equivalents Mas_2 Numeric 0 - 99 # of Massage Therapists MasF_2 Numeric 0 - 99 # of Full Time Equivalents Nur_2 Numeric 0 - 99 # of Nurses NurF_2 Numeric 0 - 99 # of Full Time Equivalents Occ_2 Numeric 0 - 99 # of Occupational Therapists OccF_2 Numeric 0 - 99 # of Full Time Equivalents Phs_2 Numeric 0 - 99 # of Physiatrists PhsF_2 Numeric 0 - 99 # of Full Time Equivalents OPhy_2 Numeric 0 - 99 # of Other Physicians OPhyF_2 Numeric 0 - 99 # of Full Time Equivalents Pod_2 Numeric 0 - 99 # of Podiatrist PodF_2 Numeric 0 - 99 # of Full Time Equivalents Oth_2 Numeric 0 - 99 # of Psychologists OthF_2 Numeric 0 - 99 # of Full Time Equivalents Wot_2 Char Char Description of Other
300

Assistants to Regulated Health Professionals Variable Name Type Value Description
Variable Name Type Value Description
Ath_2 Numeric 0 - 99 # of Atheletic therapists AthF_2 Numeric 0 - 99 # of Full Time Equivalents Ergo_2 Numeric 0 - 99 # of Ergonomists ErgoF_2 Numeric 0 - 99 # of Full Time Equivalents Kine_2 Numeric 0 - 99 # of Kinesiologists KineF_2 Numeric 0 - 99 # of Full Time Equivalents Occu_2 Numeric 0 - 99 # of Occupational Therapy Assistants OccuF_2 Numeric 0 - 99 # of Full Time Equivalents PSW_2 Numeric 0 - 99 # of Personal Support Workers PSWF_2 Numeric 0 - 99 # of Full Time Equivalents PhyA_2 Numeric 0 - 99 # of Physiotherapy Assitants/Aides PhyAF_2 Numeric 0 - 99 # of Full Time Equivalents Reha_2 Numeric 0 - 99 # of Rehabilitation Assistants RehaF_2 Numeric 0 - 99 # of Full Time Equivalents Oth2_2 Numeric 0 - 99 # of Other OthF2_2 Numeric 0 - 99 # of Full Time Equivalents Woth2_2 Char Char Description of Other
Practioners of Complementary and Alternative Medicine Variable Name Type Value Description
Variable Name Type Value Description
Acu_2 Numeric 0 - 99 # of Acupuncturists AcuF_2 Numeric 0 - 99 # of Full Time Equivalents Aro_2 Numeric 0 - 99 # of Aromatherapists AroF_2 Numeric 0 - 99 # of Full Time Equivalents Hom_2 Numeric 0 - 99 # of Homeopaths HomF_2 Numeric 0 - 99 # of Full Time Equivalents Nat_2 Numeric 0 - 99 # of Naturopaths NatF_2 Numeric 0 - 99 # of Full Time Equivalents Ost_2 Numeric 0 - 99 # of Osteopaths OstF_2 Numeric 0 - 99 # of Full Time Equivalents Oth3_2 Numeric 0 - 99 # of Others OthF3_2 Numeric 0 - 99 # of Full Time Equivalents Woth3_2 Char Char Description of Other
Others Variable Name Type Value Description
Variable Name Type Value Description
Case_2 Numeric 0 - 99 # of Case Managers CaseF_2 Numeric 0 - 99 # of Full Time Equivalents HomM_2 Numeric 0 - 99 # of Home Makers HomMF_2 Numeric 0 - 99 # of Full Time Equivalents HomV_2 Numeric 0 - 99 # of Home Visitors HomVF_2 Numeric 0 - 99 # of Full Time Equivalents Voca_2 Numeric 0 - 99 # of Vocational Rehabilitation VocaF_2 Numeric 0 - 99 # of Full Time Equivalents Man_2 Numeric 0 - 99 # of Management Staff ManF_2 Numeric 0 - 99 # of Full Time Equivalents Admin_2 Numeric 0 - 99 # of Administrative Staff AdminF_2 Numeric 0 - 99 # of Full Time Equivalents Oth4_2 Numeric 0 - 99 # of Others OthF4_2 Numeric 0 - 99 # of Full Time Equivalents Woth4_2 Char Char Description of Other
301

3) In addition to physiotherapy, does your Setting provide the following services to clients? For each service you provide, please indicate whether it is provided by regulated physiotherapists Variable Name Type Value Description Acu_3 Numeric 0, 1, 2, 3 0=No, 1=Never, 2=Sometimes, 3=Always Audi_3 Numeric 0, 1, 2, 3 0=No, 1=Never, 2=Sometimes, 3=Always Aroma_3 Numeric 0, 1, 2, 3 0=No, 1=Never, 2=Sometimes, 3=Always Art_3 Numeric 0, 1, 2, 3 0=No, 1=Never, 2=Sometimes, 3=Always ADP_3 Numeric 0, 1, 2, 3 0=No, 1=Never, 2=Sometimes, 3=Always CasM_3 Numeric 0, 1, 2, 3 0=No, 1=Never, 2=Sometimes, 3=Always Chi_3 Numeric 0, 1, 2, 3 0=No, 1=Never, 2=Sometimes, 3=Always Cran_3 Numeric 0, 1, 2, 3 0=No, 1=Never, 2=Sometimes, 3=Always DACA_3 Numeric 0, 1, 2, 3 0=No, 1=Never, 2=Sometimes, 3=Always Ergo_3 Numeric 0, 1, 2, 3 0=No, 1=Never, 2=Sometimes, 3=Always Exer_3 Numeric 0, 1, 2, 3 0=No, 1=Never, 2=Sometimes, 3=Always Func_3 Numeric 0, 1, 2, 3 0=No, 1=Never, 2=Sometimes, 3=Always HomM_3 Numeric 0, 1, 2, 3 0=No, 1=Never, 2=Sometimes, 3=Always HomV_3 Numeric 0, 1, 2, 3 0=No, 1=Never, 2=Sometimes, 3=Always Hor_3 Numeric 0, 1, 2, 3 0=No, 1=Never, 2=Sometimes, 3=Always Hyd_3 Numeric 0, 1, 2, 3 0=No, 1=Never, 2=Sometimes, 3=Always Man_3 Numeric 0, 1, 2, 3 0=No, 1=Never, 2=Sometimes, 3=Always MedP_3 Numeric 0, 1, 2, 3 0=No, 1=Never, 2=Sometimes, 3=Always Mus_3 Numeric 0, 1, 2, 3 0=No, 1=Never, 2=Sometimes, 3=Always Nat_3 Numeric 0, 1, 2, 3 0=No, 1=Never, 2=Sometimes, 3=Always Nur_3 Numeric 0, 1, 2, 3 0=No, 1=Never, 2=Sometimes, 3=Always Nut_3 Numeric 0, 1, 2, 3 0=No, 1=Never, 2=Sometimes, 3=Always Occ_3 Numeric 0, 1, 2, 3 0=No, 1=Never, 2=Sometimes, 3=Always Ort_3 Numeric 0, 1, 2, 3 0=No, 1=Never, 2=Sometimes, 3=Always PerTr_3 Numeric 0, 1, 2, 3 0=No, 1=Never, 2=Sometimes, 3=Always Pil_3 Numeric 0, 1, 2, 3 0=No, 1=Never, 2=Sometimes, 3=Always PsyE_3 Numeric 0, 1, 2, 3 0=No, 1=Never, 2=Sometimes, 3=Always Rec_3 Numeric 0, 1, 2, 3 0=No, 1=Never, 2=Sometimes, 3=Always Ref_3 Numeric 0, 1, 2, 3 0=No, 1=Never, 2=Sometimes, 3=Always Rei_3 Numeric 0, 1, 2, 3 0=No, 1=Never, 2=Sometimes, 3=Always Shi_3 Numeric 0, 1, 2, 3 0=No, 1=Never, 2=Sometimes, 3=Always
302

Tai_3 Numeric 0, 1, 2, 3 0=No, 1=Never, 2=Sometimes, 3=Always Voca_3 Numeric 0, 1, 2, 3 0=No, 1=Never, 2=Sometimes, 3=Always Work_3 Numeric 0, 1, 2, 3 0=No, 1=Never, 2=Sometimes, 3=Always Oth_3 Numeric 0, 1, 2, 3 0=No, 1=Never, 2=Sometimes, 3=Always Woth_3 Char Char Description of Other
4) Approximately how many physiotherapy treatments does your Setting Perform in a typical month? Variable Name Type Value Description Treat_4 Numeric 0 - 99 # of Treatments
5) Of the number of physiotherapy treatments in question 4, approximately how many are performed by:? Trereg_5 Numeric 0, 1 - 99 0=None, 1-99= # of Treatments Trrga_5 Numeric 0, 1 - 99 0=None, 1-99= # of Treatments Tro_5 Numeric 0, 1 - 99 0=None, 1-99= # of Treatments
6) Of the physiotherapy services your Setting provides in a typical month, approximately what percentage falls into each of the following service categories? Variable Name Type Value Description Amp_6 Decimal 0 < 1 % of Amputees Service Arth_6 Decimal 0 < 1 % of Arthritis Service Car_6 Decimal 0 < 1 % of Cardiology Service Men_6 Decimal 0 < 1 % of Mental Serivice Neu_6 Decimal 0 < 1 % of Neurology Service Ortho_6 Decimal 0 < 1 % of Orthopaedics/Musco Service Pallia_6 Decimal 0 < 1 % of Palliative Service Prev_6 Decimal 0 < 1 % of Prevention Service Spo_6 Decimal 0 < 1 % of Sports Medicine Service Wom_6 Decimal 0 < 1 % of Woman's health Service Oth_6 Decimal 0 < 1 % of Other Service Woth_6 Char Char Description of Other = 1 Total = 100%
303

7) Of the physiotherapy services your Setting provides, what percentage is in each of the following categories? Variable Name Type Value Description Child_7 Decimal 0 < 1 % of Children, under 18 years old Adu_7 Decimal 0 < 1 % of Adults, aged 18 to 65 Adu65_7 Decimal 0 < 1 % of Adults, aged 65 and older
8) Approximately what percentage of your Setting’s revenues come from services provided by regulated physiotherapists in a typical month? Variable Name Type Value Description Rev_8 Numeric 0 - 5 0= 0% 1=1-19% 2=20-39% 3=40-59% 4=60-79% 5=80-100%
9) Approximately what percentage of your Setting’s physiotherapy clients and what percentage of your physiotherapy revenue (budget) comes from the following sources in a typical month?
(Fill in percentages of clients from each source)
(Fill in percentages of revenue (budget) from each source)
Variable Name Type Value Description
Variable Name Type Value Description
Budg_9 Decimal 0 < 1 % of Clients BudgR_9 Decimal 0 < 1 % of Revenue(budget) MVA_9 Decimal 0 < 1 % of Clients MVAR_9 Decimal 0 < 1 % of Revenue(budget) WSIB_9 Decimal 0 < 1 % of Clients WSIBR_9 Decimal 0 < 1 % of Revenue(budget) CCAC_9 Decimal 0 < 1 % of Clients CCACR_9 Decimal 0 < 1 % of Revenue(budget) Ext_9 Decimal 0 < 1 % of Clients ExtR_9 Decimal 0 < 1 % of Revenue(budget) Emp_9 Decimal 0 < 1 % of Clients EmpR_9 Decimal 0 < 1 % of Revenue(budget) Poc_9 Decimal 0 < 1 % of Clients PocR_9 Decimal 0 < 1 % of Revenue(budget) OHIP_9 Decimal 0 < 1 % of Clients OHIPR_9 Decimal 0 < 1 % of Revenue(budget) LTC_9 Decimal 0 < 1 % of Clients LTCR_9 Decimal 0 < 1 % of Revenue(budget) VAC_9 Decimal 0 < 1 % of Clients VACR_9 Decimal 0 < 1 % of Revenue(budget) CanFo_9 Decimal 0 < 1 % of Clients CanFR_9 Decimal 0 < 1 % of Revenue(budget) Scho_9 Decimal 0 < 1 % of Clients SchoR_9 Decimal 0 < 1 % of Revenue(budget)
304

Char_9 Decimal 0 < 1 % of Clients CharR_9 Decimal 0 < 1 % of Revenue(budget) Oth_9 Decimal 0 < 1 % of Clients OthR_9 Decimal 0 < 1 % of Revenue(budget) Woth_6 Char Char Description of Other = 1 Total = 100% = 1 Total = 100%
10) In your opinion, are the fees that each of the following potential payers pay for physiotherapy services too low? For the payers you deal with, do you charge your clients in addition to charging the payer? Variable Name Type Value Description Variable Name Type Value Description MVFee_10 Boolean 0, 1 0=No, 1=Yes MVFeC_10 Numeric 0, 1 1=Never, 2=Sometimes, 3=Always MVPre_10 Boolean 0, 1 0=No, 1=Yes MVPrC_10 Numeric 0, 1 1=Never, 2=Sometimes, 3=Always WSFee_10 Boolean 0, 1 0=No, 1=Yes WSFeC_10 Numeric 0, 1 1=Never, 2=Sometimes, 3=Always WSCom_10 Boolean 0, 1 0=No, 1=Yes WSCoC_10 Numeric 0, 1 1=Never, 2=Sometimes, 3=Always WSPro_10 Boolean 0, 1 0=No, 1=Yes WSPrC_10 Numeric 0, 1 1=Never, 2=Sometimes, 3=Always CCAC_10 Boolean 0, 1 0=No, 1=Yes CCACC_10 Numeric 0, 1 1=Never, 2=Sometimes, 3=Always Hea_10 Boolean 0, 1 0=No, 1=Yes HeaC_10 Numeric 0, 1 1=Never, 2=Sometimes, 3=Always Set_10 Boolean 0, 1 0=No, 1=Yes SetC_10 Numeric 0, 1 1=Never, 2=Sometimes, 3=Always OHIP_10 Boolean 0, 1 0=No, 1=Yes OHIPC_10 Numeric 0, 1 1=Never, 2=Sometimes, 3=Always Min_10 Boolean 0, 1 0=No, 1=Yes MinC_10 Numeric 0, 1 1=Never, 2=Sometimes, 3=Always Vet_10 Boolean 0, 1 0=No, 1=Yes VetC_10 Numeric 0, 1 1=Never, 2=Sometimes, 3=Always Can_10 Boolean 0, 1 0=No, 1=Yes CanC_10 Numeric 0, 1 1=Never, 2=Sometimes, 3=Always Scho_10 Boolean 0, 1 0=No, 1=Yes SchoC_10 Numeric 0, 1 1=Never, 2=Sometimes, 3=Always Char_10 Boolean 0, 1 0=No, 1=Yes CharC_10 Numeric 0, 1 1=Never, 2=Sometimes, 3=Always Oth_10 Boolean 0, 1 0=No, 1=Yes OthC_10 Numeric 0, 1 1=Never, 2=Sometimes, 3=Always Woth_10 Char Char Description of Other
11) Some therapists are paid by two or more payers for the same client for various reasons (for example, when one insurer doesn’t cover the full treatment cost or coverage runs out and the client or another insurer is then charged). How frequently does this occur in your Setting? Thera_11 Numeric 1, 2, 3 1=Never, 2=Sometimes, 3=Always
11)a) If you answered ALWAYS or SOMETIMES to question 11, what is most common combination of payers for the same client? Pay_1_11 Numeric 0 - 99 Combination of Payers for same Client Pay_2_11 Numeric 0 - 99 Combination of Payers for same Client
305

12) What is the typical or average fee paid by the following payers for a unit of physiotherapy service? Variable Name Type Value Description MVA_12 Numeric 0 - 99 Avg. fee paid by payers WSIB_12 Numeric 0 - 99 Avg. fee paid by payers CCAC_12 Numeric 0 - 99 Avg. fee paid by payers Ext_12 Numeric 0 - 99 Avg. fee paid by payers Set_12 Numeric 0 - 99 Avg. fee paid by payers Poc_12 Numeric 0 - 99 Avg. fee paid by payers OHIP_12 Numeric 0 - 99 Avg. fee paid by payers LTC_12 Numeric 0 - 99 Avg. fee paid by payers VAC_12 Numeric 0 - 99 Avg. fee paid by payers CanFo_12 Numeric 0 - 99 Avg. fee paid by payers Scho_12 Numeric 0 - 99 Avg. fee paid by payers Char_12 Numeric 0 - 99 Avg. fee paid by payers Oth_12 Numeric 0 - 99 Avg. fee paid by payers Woth_12 Char Char Description of Other
13) What is the typical total program fee paid by the following payers for services to your clients? Variable Name Type Value Description MVA_13 Numeric 0 - 99 Avg. total program fee WSIB_13 Numeric 0 - 99 Avg. total program fee
14) Does your Organization have the profile or range of clients it wants now? Variable Name Type Value Description Pro_14 Boolean 0, 1 0=No, 1=Yes Ran_14a AlphaNum Any Range of clients
306
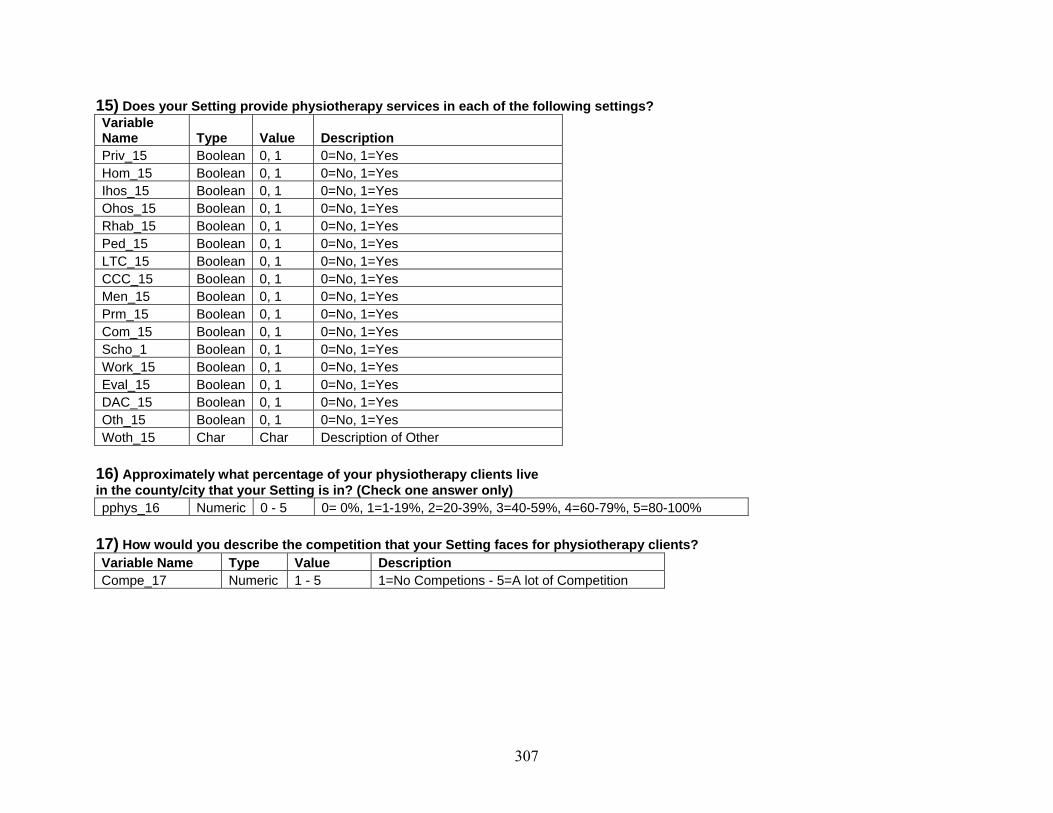
15) Does your Setting provide physiotherapy services in each of the following settings? Variable Name Type Value Description Priv_15 Boolean 0, 1 0=No, 1=Yes Hom_15 Boolean 0, 1 0=No, 1=Yes Ihos_15 Boolean 0, 1 0=No, 1=Yes Ohos_15 Boolean 0, 1 0=No, 1=Yes Rhab_15 Boolean 0, 1 0=No, 1=Yes Ped_15 Boolean 0, 1 0=No, 1=Yes LTC_15 Boolean 0, 1 0=No, 1=Yes CCC_15 Boolean 0, 1 0=No, 1=Yes Men_15 Boolean 0, 1 0=No, 1=Yes Prm_15 Boolean 0, 1 0=No, 1=Yes Com_15 Boolean 0, 1 0=No, 1=Yes Scho_1 Boolean 0, 1 0=No, 1=Yes Work_15 Boolean 0, 1 0=No, 1=Yes Eval_15 Boolean 0, 1 0=No, 1=Yes DAC_15 Boolean 0, 1 0=No, 1=Yes Oth_15 Boolean 0, 1 0=No, 1=Yes Woth_15 Char Char Description of Other
16) Approximately what percentage of your physiotherapy clients live in the county/city that your Setting is in? (Check one answer only) pphys_16 Numeric 0 - 5 0= 0%, 1=1-19%, 2=20-39%, 3=40-59%, 4=60-79%, 5=80-100%
17) How would you describe the competition that your Setting faces for physiotherapy clients? Variable Name Type Value Description Compe_17 Numeric 1 - 5 1=No Competions - 5=A lot of Competition
307

18) If you have competition for physiotherapy clients, what would you say are your two top competitors? (Check one in each column) Com_1_18 Numeric 1 - 10 1= Private Physio. Sole Ownership Com_2_18 Numeric 1 - 10 2= Private Physio. Corp. Ownership 3= Physio. Clinic in hospital 4= Chiropractic Clinic/Office 5= Comple. And Alter. Medicine Clinic 6= Massage Therapy Clinic/Office 7= Physiatrist 8= Other Physician 9= Sports Medicine Clinic 10= Other
19) Do you have a wait list for physiotherapy services in a typical month? 19)a) If you have a wait list, how long is it, typically, in number of weeks? List_19 Numeric 0, 1 - 52 0=No, 1 - 52= # of weeks for waiting list
19)b) If you have a wait list, do you suggest clients go to other providers with a shorter wait list? Llist_19b Numeric 1, 2, 3 1=Never, 2=Sometimes, 3=Always
Section 3: Characteristics of your organization 20) How many Settings does your Organization have? If there is only one setting in your organization, GO TO QUESTION 22 If there is more than 1, GO TO QUESTION 21 Sett_20 Numeric 1 - 99 # of settings in organization
21) Are your Organization’s other Settings… (Circle all that apply) Variable Name Type Value Description city_21 Boolean 0, 1 0=No, 1=Yes On_21 Boolean 0, 1 0=No, 1=Yes Out_21 Boolean 0, 1 0=No, 1=Yes Us_21 Boolean 0, 1 0=No, 1=Yes Oth_21 Boolean 0, 1 0=No, 1=Yes
308

22) Is any your Organization’s owners: (Circle all that apply) Variable Name Type Value Description Reg_22 Boolean 0, 1 0=No, 1=Yes NReg_22 Boolean 0, 1 0=No, 1=Yes Own_22 Boolean 0, 1 0=No, 1=Yes Phys_22 Boolean 0, 1 0=No, 1=Yes NPhys_22 Boolean 0, 1 0=No, 1=Yes Pro_22 Boolean 0, 1 0=No, 1=Yes NPro_22 Boolean 0, 1 0=No, 1=Yes
23) What best describes the ownership of your Organization? (Circle one answer only) Org_23 Numeric 1 - 5 1=Owned by Individual
2= Owned by a partnership of two or more
3= Owned by a Professional Corp 4= Owned by a private Corp 5= Owned by a public Corp 6= Don’t know
24) If your Organization’s owner is a partnership or a corporation, where is the partnership or corporation based? (Check one answer only) Variable Name Type Value Description Base_24 Numeric 1 - 4 1= Ontario 2= Outside Ontario 3= Outside Canada 4= Don’t know
25) Does your Organization have non-profit status? NonP_25 Boolean 0, 1 0=No, 1=Yes
SECTION 4: 26) Do you think there are people in your county/city who don’t have access to the physiotherapy services they need? Acce_26 Numeric 1 - 5 1 = No One 2 = A few people 3 = Some people 4 = Many people
309

26)a) If you answered MANY, SOME or FEW to question 28, how much does each of the following contribute to the problems of access? (check one box in each line) Variable Name Type Value Description Nenu_26a Numeric 1 - 3 1= Contributes a great deal, 2 = Contributes somewhat, 3 = Doesn't contribute at all Nphys_26a Numeric 1 - 3 1= Contributes a great deal, 2 = Contributes somewhat, 3 = Doesn't contribute at all Cli_26a Numeric 1 - 3 1= Contributes a great deal, 2 = Contributes somewhat, 3 = Doesn't contribute at all Pay_26a Numeric 1 - 3 1= Contributes a great deal, 2 = Contributes somewhat, 3 = Doesn't contribute at all Ins_26a Numeric 1 - 3 1= Contributes a great deal, 2 = Contributes somewhat, 3 = Doesn't contribute at all f_26a Numeric 1 - 3 1= Contributes a great deal, 2 = Contributes somewhat, 3 = Doesn't contribute at all g_26a Numeric 1 - 3 1= Contributes a great deal, 2 = Contributes somewhat, 3 = Doesn't contribute at all h_26a Numeric 1 - 3 1= Contributes a great deal, 2 = Contributes somewhat, 3 = Doesn't contribute at all i_26a Numeric 1 - 3 1= Contributes a great deal, 2 = Contributes somewhat, 3 = Doesn't contribute at all j_26a Numeric 1 - 3 1= Contributes a great deal, 2 = Contributes somewhat, 3 = Doesn't contribute at all k_26a Numeric 1 - 3 1= Contributes a great deal, 2 = Contributes somewhat, 3 = Doesn't contribute at all l_26a Numeric 1 - 3 1= Contributes a great deal, 2 = Contributes somewhat, 3 = Doesn't contribute at all m_26a Numeric 1 - 3 1= Contributes a great deal, 2 = Contributes somewhat, 3 = Doesn't contribute at all n_26a Numeric 1 - 3 1= Contributes a great deal, 2 = Contributes somewhat, 3 = Doesn't contribute at all o_26a Numeric 1 - 3 1= Contributes a great deal, 2 = Contributes somewhat, 3 = Doesn't contribute at all p_26a Numeric 1 - 3 1= Contributes a great deal, 2 = Contributes somewhat, 3 = Doesn't contribute at all
27) How frequently does your Setting encounter people who can’t afford physiotherapy services and don’t have sufficient insurance? (Check the most appropriate response) Variable Name Type Value Description Cant_27 Numeric 1 - 6 1 = Everyday 2 = Once a week 3 = Once every 2 weeks 4 = Once a month 5 = Once a year 6 = Rarely or never
310

27)a) If your Setting encounters people who can’t afford physiotherapy services of who don’t have sufficient insurance, are the people: (Circle all applicable) Chil_27a Boolean 0, 1 0=No, 1=Yes AduA_27a Boolean 0, 1 0=No, 1=Yes AduO_27a Boolean 0, 1 0=No, 1=Yes
27)b) How frequently do you: Variable Name Type Value Description OHIP_27b Numeric 1, 2, 3 1=Never, 2=Sometimes, 3=Always Out_27b Numeric 1, 2, 3 1=Never, 2=Sometimes, 3=Always Tre_27b Numeric 1, 2, 3 1=Never, 2=Sometimes, 3=Always Oth_27b Numeric 1, 2, 3 1=Never, 2=Sometimes, 3=Always
28) We are very interested in any additional thoughts you might have about this survey or about access to physiotherapy services in Ontario Variable Name Type Value Description Last_28 Char Any Additional thoughts about Survey
311

Appendix 6 – Key Informants Interview Guide
312

Interview Guide for Key Informant Interviews An exploration of the structure of the Ontario physiotherapy (PT) market: behaviour in a multi-payer, multi-provider health care market
____________________________
ID #____________________________________________________________________ Date of interview _________________________________________________________ Time started _____________________________________________________________ Time finished ____________________________________________________________
My name is Paul Holyoke. I am a PhD student in the Department of Health
Policy, Management and Evaluation at the University of Toronto.
I am studying the structure of the physiotherapy market in Ontario, and the
information I gain from this interview and other interviews like it, will be used for
my doctoral thesis and publications and presentations arising from it.
The purpose of this interview is to ask you a series of questions so that I can
better understand how attractive the Ontario physiotherapy or rehabilitation
market is for new and existing physiotherapy providers.
I want to begin by assuring you that your answers to the following questions will
remain anonymous. Following analysis, the data that I gather in these interviews
will be reported in a way that ensures that no individual can ever be identified
unless the information is already in the public domain or you give express
permission at a later date.
You may refuse to answer any of the questions I am going to ask you, and you
may stop the interview at any time.
313

I would like to ask your permission to record the interview to ensure that I have
correctly interpreted your answers. The tape will be destroyed once the analysis
of the data has been completed.
[Introduce the consent form and ask the person to sign it]
Part A: Background information on Key Informant & the “physiotherapy market” First, I would like to ask you some information about your background and how you have gained your knowledge of the physiotherapy market in Ontario. A.1. What is your current title or position? A.2. How many years of experience with the physiotherapy or rehabilitation market do you have? A.3. What roles have given you your knowledge about the physiotherapy or rehabilitation market in Ontario?
(Prompt: The person might deliver services him or herself, own or manage a business that provides or provided services, or advise owners of businesses that are or were interested in providing services, or studying the services.)
I would like to clarify what I mean when I say the “Ontario physiotherapy market”.
1. I mean all services that are provided by individual health care providers or
health care organizations that involve what they would call “physiotherapy” or
“physical therapy”, whether they are provided by regulated physiotherapists or
not.
314

2. These services may be provided on their own or they might be integrated with
a whole range of other health care services, perhaps in a bundle of services
called “rehabilitation services”.
3. Finally, when I talk about the “Ontario physiotherapy market”, I include all
physiotherapy services, regardless who pays for them, including patients
themselves, employers, OHIP, auto insurance, private insurance, workers’
compensation, community care access centres, etc.
Part B. General Health Care and Business Environment B1.(a) First, I’d like to discuss the general health care environment in Ontario as if affects decisions to start up a physiotherapy services business in Ontario, or to stay in the market, or to expand. Here, I’m thinking of such things as the provincial health strategy, the federal government’s health agenda, the debate over public vs. private, the limits to public spending on health care, the availability of health human resources. Of these and other factors about the general health care market do you think would affect the business decisions to establish in Ontario, or to stay, or to expand, or to quit the market. Would these factors have a positive or negative effect? General health care environment might mean
• there is a positive or negative environment for privately-delivered health care,
• public cost containment might mean possibilities for private provision, • government is or is not supporting physiotherapy or rehabilitation, • might be challenges in getting the appropriate health human
resources, etc. B1.(b) Do you think the factors you have mentioned would have a different impact on various types of providers -- not-for-profit providers; small health professional-owned provider organizations; for-profit, Canadian investor-owned providers; foreign-owned corporate providers? If so, how? B1.(c) I’d like you to think about the level of taxes and the amount of government regulation of health care businesses in Ontario. Here I’m looking at levels of corporate and personal taxation, but also governmental price-setting, the regulation of health professionals, the regulation of training for health professionals, the prohibition on private spending for some types of care….
315

What effect would the tax level and regulation have on someone wanting to start a physiotherapy business, keep one going, or expand one?
Possible prompts – regulation includes setting fee schedules for MVA; regulating health professions and what they can do, workers’ compensation, etc.
B1.(d) Again, I’d like to know if you think taxation and regulation issues would have different effects on the four types of organizations I mentioned before: not-for-profit providers; small health professional-owned provider organizations; for-profit, Canadian investor-owned providers; foreign-owned corporate providers. B2.(a) One of the factors that new and established providers may look at is expanding their business. In your view, how big the potential for growth is in the Ontario physiotherapy market? B2.(b) From what you know, is the potential to grow in Ontario bigger or smaller than the potential in other provinces or US states? What makes this so? B2.(c) Does the potential for growth have different implications for any of the organization types? Part C. Other providers in the market C1.(a) One feature that appears to be significant as I look at the for-profit side of the Ontario physiotherapy market is a significant presence of small businesses, with one or two or maybe three physiotherapists in them, with the businesses presumably owned by those physiotherapists. What effect would the presence of these small businesses have on the decision of a person or a company starting or acquiring a new physiotherapy business in Ontario?
Possible prompts – For example, does this make it easy comparatively easy to achieve economies of scale? Do they provide opportunities for acquisition? Are they easy or hard to compete against? Are these small providers, since they are owned by health professionals, more inclined to have a focus on the personal preferences of the owners rather than profit, for example?
C1.(b) Does Ontario differ from other provinces or US states in this respect? C1.(c) Does the presence of all these small physiotherapy businesses have different implications for any of the organization types who are thinking of entering the market or expanding?
316

C2.(a) I’d like to turn to the question of competition in the Ontario market, and I’m thinking of all providers, not just the small ones we’ve just talked about. From your perspective, how competitive is the Ontario physiotherapy market? Does competition vary across the province or in different market segments? Is this profile of competition good or bad for organizations thinking of entering the market or leaving it? C2.(b) Does Ontario differ from other provinces or US states with respect to this level of competition? If so, how is it different and what makes it different? If not, what are the reasons for the similarities? C3. Another way the market can be attractive is if there are effective ways to find and get access to patients, say through strategic alliances with other providers or hospitals or through advertising or preferred provider networks, that sort of thing. Are you aware of any particular practices or patterns for these or any other ways to get access to patients? If so, what are the most effective? Are they equally available to not-for-profit providers; small health professional-owned provider organizations; for-profit, Canadian investor-owned providers; foreign-owned corporate providers? C4. Though I am concentrating on the physiotherapy market, there are clearly other kinds of services that can compete with physiotherapy services in certain circumstances, for example, chiropractic or sports medicine clinics or massage therapy. How would these alternative providers affect a person or organization looking at setting up a physiotherapy services business in Ontario?
(Possible prompts – integrated services? substituted services?, broader range of services?)
D. Payers in the market D1.(a) Other people who have looked at the physiotherapy market or the rehabilitation market in Ontario have remarked on the wide range of different payers in Ontario, each with its own approach, fee levels and billing requirements. The conclusion that most researchers or health care analysts draw is that it is hard to make sense of the market because of this. But I’d like to know what you think this means for providers. Is the multitude of payers an advantage or a disadvantage? D1.(b) Based on what you know about various payers and their practices, would it be advisable for a new PT business to concentrate on providing services that would be paid by one or only a few of these payers, or would it be better to diversify the revenue sources? D1.(c). Are some payers are better than others for providers? If so, why?
317

D1(d). With many payers, it’s possible that they are looking for different things from providers, say, for example, volume discounts or in particular bundle of services or waiting times, etc. Are you aware of any such payer practices that make the market attractive? D2.(a) In many markets, people look for the possibility that one or more payers have predominant roles in the market as a result of their buying power or influence. Do you have a sense that there is a dominant payer or payers that set the tone for the physiotherapy market in Ontario, or does the variety of payers mean that no single payer or couple of payers play a dominating role? D2.(b) Does Ontario differ from other provinces or US states with respect to this wide variety of payers? Does this make Ontario more attractive or less attractive? D3. Given the issues you’ve raised about the multiple payers, are there different implications for any of the four types of organizations? E. General Questions E1. I’d like to move to more general questions, perhaps covering some of the things we’ve talked about, or perhaps covering new areas. What kinds of things would a new physiotherapy business owner be wise to be especially careful about in establishing in the Ontario market? E2. From what you know, should a for-profit organization from the United States be interested in operating a physiotherapy services business in Ontario? Why or why not? E3. From what you know, are there a lot of American for-profit organizations that own physiotherapy services businesses in Ontario? If yes, why do you think they have invested in this market? If no, why do you think they have not invested in this market? E4. I’d like to turn it over to you. Are there any features of the Ontario physiotherapy market that I’ve not mentioned or that we haven’t discussed that make it attractive or unattractive for any of the organization types? E5. Finally, I wonder if you know of anyone else I should be talking to who would have some good insights into the kinds of issues I’ve discussed with you? Thank you for participating in this interview.
318

Appendix 7 – Key Informants Interviews – Information Letter and Invitation to Participate
319

DATE CONTACT NAME & ADDRESS Dear (NAME); As a follow-up to our recent telephone conversation, I am formally writing to invite you to participate in a research project conducted in the Department of Health Policy, Management and Evaluation at the University of Toronto, entitled An exploration of the structure of the Ontario physiotherapy (PT) market: behaviour in a multi-payer, multi-provider health care market. The study is funded by the Canadian Institutes of Health Research, and the results will be used in my PhD thesis. The PT market in Ontario is complex because of how broad “physiotherapy” is, the rich mix of payers and providers, and certain general market conditions, including the market’s openness to participation by foreign investors and to competition. This research project is examining this market because it is particularly relevant as Canadians and their governments face important questions about whether to expand the small number and types of payers and providers currently in the broader health care system, and if so, how best to modify existing market constraints in that broader system to achieve that end. You have been asked to participate in the research because of your knowledge of the market. If you agree, you will take part in a face to face interview in which questions will be asked about the features of the Ontario PT market that may make it particularly attractive or unattractive for domestic and foreign providers to enter or stay in this market. The questions will cover such areas as the characteristics of revenue sources in the market and the general health care and business environment. The questions will not seek any personal or confidential information other than the general source of your knowledge of the physiotherapy market. The interview will last approximately sixty minutes. Your anonymity will be maintained at all times during this study. The questions will not seek any personal or confidential information other than the general source of your knowledge of the physiotherapy market. All information gathered will be kept in a secure location and will be destroyed within 20 months of your interview. Any data presented publicly (including any quotations, if applicable) will be presented in a manner so that it will not be possible to identify you as the source of data unless the information is already in the public domain or you give your express permission at some later date. I will be contacting you again in a few days to verify that you are interested in participating in the study, and we can schedule a convenient date, time and location for the interview. In the meantime, if you have any questions or concerns about the study, please feel free to contact me at 519-846-9743 or by email at [email protected]. You may also wish to contact Dr. Raisa Deber at 416-978-8366 or by email at [email protected]. Yours truly, _________________________ Paul Holyoke. LL.B., M.Sc.(Econ.), PhD (Candidate) University of Toronto
320

Appendix 8 – Survey – Original Ethics Approval
321

Simcoe Hall 27 King’s College Circle Toronto Ontario M5S 1A1 Telephone 416/ 978-3165 Fax 416/ 946-5763 email: [email protected]
UNIVERSITY OF TORONTO Office of the Vice-President, Research and Associate Provost
Ethics Review Office PROTOCOL REFERENCE # 12125 July 26, 2004 Prof. R. Deber Health Policy Management & Evaluation McMurrich Building, 2nd Floor 12 Queen’s Park Crescent West University of Toronto
Mr. P. Holyoke Health Policy Management & Evaluation McMurrich Building, 2nd Floor 12 Queen’s Park Crescent West University of Toronto
Dear Prof. Deber & Mr. Holyoke: Re: The Effect of the Structure of the Physiotherapy Market in Ontario on Patient Access and Cost” by Prof. R. Deber (supervisor), Mr. P. Holyoke (student) The Health Sciences I Research Ethics Board (REB) has considered this study at its most recent meeting; draft minutes are enclosed for your information and response: Review Rating: A. Approval pending satisfactory response to concerns in the minutes. Researchers are requested to submit 2 copies of cover letter addressing points raised therein, together with 2 copies of revised study documents, with changes in BOLD. Revisions to be reviewed by the Ethics Review Office. Please address individual review points in a cover letter and attach the revised materials to your response. Additions/revisions to the original protocol and supporting documents should be highlighted in some way (e.g., bold, underline or italicize). If your revisions are more than fifteen pages, please submit two copies to the Ethics Review Unit in Simcoe Hall. If your revisions are fifteen pages or less you have the option to submit one copy by email ([email protected]), or fax (416-946-5763). We hope this is helpful. We look forward to hearing from you. Yours sincerely, Marianna Richardson Ethics Review Coordinator
322
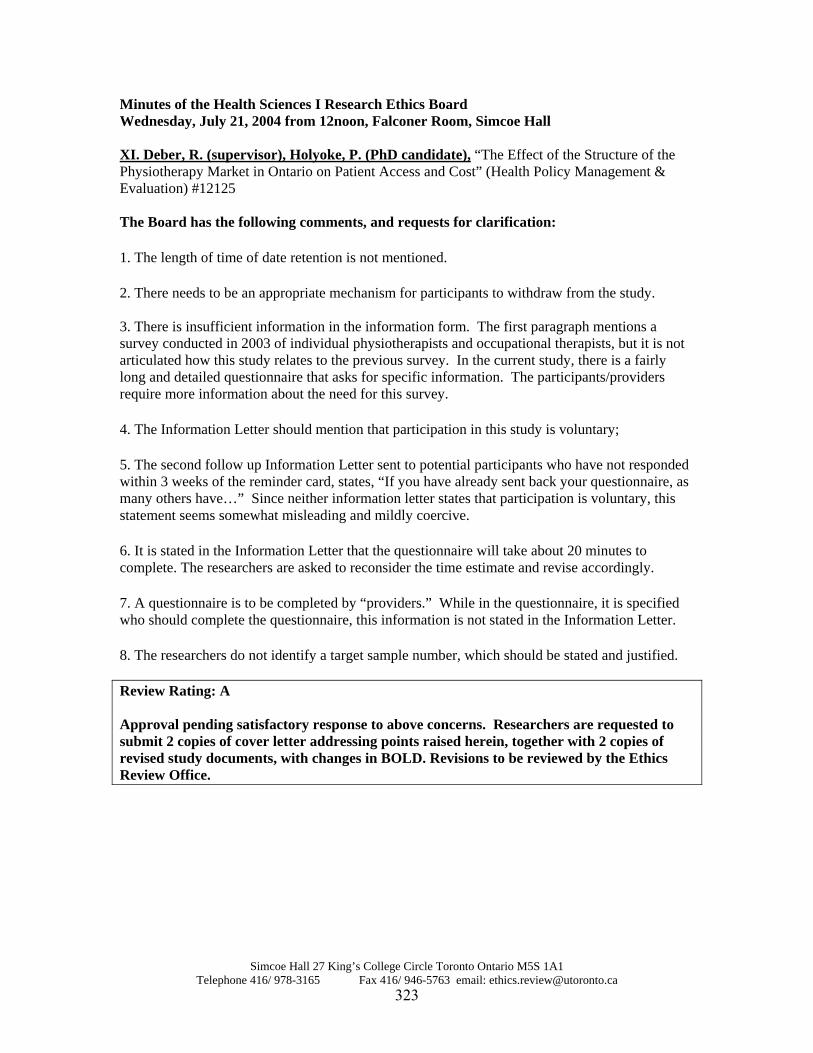
Simcoe Hall 27 King’s College Circle Toronto Ontario M5S 1A1 Telephone 416/ 978-3165 Fax 416/ 946-5763 email: [email protected]
Minutes of the Health Sciences I Research Ethics Board Wednesday, July 21, 2004 from 12noon, Falconer Room, Simcoe Hall XI. Deber, R. (supervisor), Holyoke, P. (PhD candidate), “The Effect of the Structure of the Physiotherapy Market in Ontario on Patient Access and Cost” (Health Policy Management & Evaluation) #12125 The Board has the following comments, and requests for clarification:
1. The length of time of date retention is not mentioned.
2. There needs to be an appropriate mechanism for participants to withdraw from the study. 3. There is insufficient information in the information form. The first paragraph mentions a survey conducted in 2003 of individual physiotherapists and occupational therapists, but it is not articulated how this study relates to the previous survey. In the current study, there is a fairly long and detailed questionnaire that asks for specific information. The participants/providers require more information about the need for this survey.
4. The Information Letter should mention that participation in this study is voluntary;
5. The second follow up Information Letter sent to potential participants who have not responded within 3 weeks of the reminder card, states, “If you have already sent back your questionnaire, as many others have…” Since neither information letter states that participation is voluntary, this statement seems somewhat misleading and mildly coercive.
6. It is stated in the Information Letter that the questionnaire will take about 20 minutes to complete. The researchers are asked to reconsider the time estimate and revise accordingly.
7. A questionnaire is to be completed by “providers.” While in the questionnaire, it is specified who should complete the questionnaire, this information is not stated in the Information Letter.
8. The researchers do not identify a target sample number, which should be stated and justified.
Review Rating: A Approval pending satisfactory response to above concerns. Researchers are requested to submit 2 copies of cover letter addressing points raised herein, together with 2 copies of revised study documents, with changes in BOLD. Revisions to be reviewed by the Ethics Review Office.
323

Appendix 9 – Survey – Protocol Amendment Approval
324
Simcoe Hall 27 King’s College Circle Toronto Ontario M5S 1A1 Telephone 416/ 978-3165 Fax 416/ 946-5763 email: [email protected]
UNIVERSITY OF TORONTO Office of the Vice-President, Research and Associate Provost Ethics Review Office
PROTOCOL REFERENCE # 14417 May 31, 20054 Prof. R. Deber Health Policy Management & Evaluation McMurrich Building, 2
nd Floor
12 Queen’s Park Crescent West University of Toronto
Mr. P. Holyoke Health Policy Management & Evaluation McMurrich Building, 2
nd Floor
12 Queen’s Park Crescent West University of Toronto
Dear Prof. Deber & Mr. Holyoke: Re: “The Effect of the Structure of the Physiotherapy Market in Ontario on Patient Access and Cost” by Prof. R. Deber (supervisor), Mr. P. Holyoke (student) We are writing to advise you that a member of the Health Sciences I Research Ethics Board has granted approval to the amendment to the above-named research study. Ongoing projects must be renewed prior to the expiry date (August 5, 2005). The amendment consists of adding a follow-up telephone call after the second survey mailing to ensure surveys have been received. The following document (received May 9, 2005) has been approved for use in this study: First Information Letter, Reminder Card, Second Invitation/Information Letter, Telephone Script for Follow-up Call after mailing of second Invitation/Information Letter, and Amended Protocol Form. During the course of the research, any significant deviations from the approved protocol (that is, any deviation which would lead to an increase in risk or a decrease in benefit to participants) and/or any unanticipated developments within the research should be brought to the attention of the Ethics Review Unit. Best wishes for the successful completion of your project. Yours sincerely,
Marianna Richardson Ethics Review Coordinator
xc: Dr. N. Kreiger, Chair, Health Sciences I Research Ethics Board Prof. R. Cockerill, Graduate Coordinator, Health Policy Management & Evaluation
325

Appendix 10 – Survey – First Ethics Approval Renewal
326

Simcoe Hall 27 King’s College Circle Toronto Ontario M5S 1A1 Telephone 416/ 978-3165 Fax 416/ 946-5763 email: [email protected]
UNIVERSITY OF TORONTO Office of the Vice-President, Research and Associate Provost Ethics Review Office
PROTOCOL REFERENCE #14891 July 26, 2005 Professor Raisa Deber Dept of Health Policy, Mgmt & Evaluation McMurrich Building Toronto ON M5S 1A8
Mr. M. Holyoke Health Policy Management & Evaluation McMurrich Building, 2nd Floor 12 Queen’s Park Crescent West University of Toronto
Dear Professor Deber & Mr. Holyoke: Re: Your research protocol entitled, “The Effect of the Structure of the Physiotherapy Market in
Access and Cost. ( Paul Holyoke)” ETHICS APPROVAL Original Approval Date: August 6, 2004 Renewal 1 of 4 Expiry Date: August 4, 2006 We are writing to advise you that a member of the Health Sciences I Research Ethics Board has granted annual re-approval to the above-named research study, under the Board’s expedited review process for a period of one year. Ongoing projects must be renewed prior to the expiry date. Your ethics protocol approval is valid for a period of 1 year. It is the responsibility of the investigator to maintain a valid approval throughout the duration of the research activity, and to report to the Ethics Review Office of its completion. Annual Renewal of Ethics Approval forms and Study Completion Report forms can be found at http://www.research.utoronto.ca/ethics_hsmaterials.html We understand there have been no changes to the protocol or consent documents since the original approval in 2004. During the course of the research, any significant deviations from the approved protocol (that is, any deviation which would lead to an increase in risk or a decrease in benefit to human subjects) and/or any unanticipated developments within the research should be brought to the attention of the Office of Research Services. Best wishes for the successful completion of your project. Yours sincerely,
Marianna Richardson Ethics Review Coordinator xc: Mr. W. Maurice, Grants Officer, Health Sciences
327

Appendix 11 – Survey – Second Ethics Approval Renewal
328

Simcoe Hall 27 King’s College Circle Toronto Ontario M5S 1A1 Telephone 416/ 978-3165 Fax 416/ 946-5763 email: [email protected]
UNIVERSITY OF TORONTO Office of the Vice-President, Research and Associate Provost Ethics Review Office
PROTOCOL REFERENCE #14891 now #18138 August 18, 2006 Professor Raisa Deber Dept of Health Policy, Mgmt & Evaluation McMurrich Building Toronto ON M5S 1A8
Mr. M. Holyoke Health Policy Management & Evaluation McMurrich Building, 2
nd Floor
12 Queen’s Park Crescent West University of Toronto
Dear Professor Deber & Mr. Holyoke: Re: Your research protocol entitled, “The Effect of the Structure of the Physiotherapy Market in Access
and Cost” ETHICS APPROVAL Original Approval Date: August 6, 2004 Next Expiry Date: August 5, 2007 Renewal: 2 of 4 We are writing to advise you that the Health Sciences I Research Ethics Board has granted annual renewal of ethics approval to the above referenced research study through the REB’s expedited process. Ongoing projects must be renewed prior to the expiry date. We understand that there have been no changes to the consent documents since the original approval date. Participants should receive a copy of their consent form. During the course of the research, any significant deviations from the approved protocol (that is, any deviation which would lead to an increase in risk or a decrease in benefit to participants) and/or any unanticipated developments within the research should be brought to the attention of the Ethics Review Office. Best wishes for the successful completion of your project. Yours sincerely,
Jenny Peto Ethics Review Coordinator xc: Mr. W. Maurice (Grants Officer, Health Sciences)
329

Appendix 12 – Survey – Third Ethics Approval Renewal
330
Simcoe Hall 27 King’s College Circle Toronto Ontario M5S 1A1 Telephone 416/ 978-3165 Fax 416/ 946-5763 email: [email protected]
UNIVERSITY OF TORONTO Office of the Vice-President, Research and Associate Provost Ethics Review Office
PROTOCOL REFERENCE #14891, #18138 now #20873 August 28, 2007 Professor Raisa Deber Health Policy Management & Evaluation 155 College St. Toronto, ON M5T 3M6
Mr. M. Holyoke Health Policy Management & Evaluation 155 College St. Toronto, ON M5T 3M6
Dear Professor Deber & Mr. Holyoke: Re: Your research protocol entitled, “The Effect of the Structure of the Physiotherapy Market in Access and Cost” ETHICS APPROVAL Original Approval Date: August 6, 2004
Next Expiry Date: August 5, 2008 Renewal: 3 of 4 We are writing to advise you that the Health Sciences I Research Ethics Board has granted annual renewal of ethics approval to the above referenced research study through the REB’s expedited process. Ongoing projects must be renewed prior to the expiry date. We understand that there have been no changes to the consent documents since the original approval date. Participants should receive a copy of their consent form. During the course of the research, any significant deviations from the approved protocol (that is, any deviation which would lead to an increase in risk or a decrease in benefit to participants) and/or any unanticipated developments within the research should be brought to the attention of the Ethics Review Office. Best wishes for the successful completion of your project. Yours sincerely,
Jenny Peto Ethics Review Coordinator xc: Mr. W. Maurice (Grants Officer, Health Sciences)
331

Appendix 13 – Key Informants Interview – Ethics Approval
332

UNIVERSITY OF TORONTO Office of the Vice-President, Research and Associate Provost Ethics Review Office
PROTOCOL REFERENCE #19127 December 11, 2006 Prof. Raisa Deber Health Policy Management & Evaluation 155 College St. Toronto, ON M5T 3M6
Mr. Paul Holyoke Health Policy Management & Evaluation 155 College St. Toronto, ON M5T 3M6
Dear Prof. Deber and Mr. Holyoke: Re: Your research protocol entitled “An exploration of the structure of the Ontario physiotherapy (PT) market:
behaviour in a multi-player, multi-provider health care market” ETHICS APPROVAL Original Approval Date: December 11, 2006 Expiry Date: December 10, 2007 We are writing to advise you that a member of the Health Sciences I Research Ethics Board has granted approval to the above-named research study, for a period of one year, under the REB’s expedited review process. Ongoing projects must be renewed prior to the expiry date. The following consent documents (received November 30, 2006) have been approved for use in this study: Consent to participate in a research study and letter to participants. Participants should receive a copy of their consent form. During the course of the research, any significant deviations from the approved protocol (that is, any deviation which would lead to an increase in risk or a decrease in benefit to participants) and/or any unanticipated developments within the research should be brought to the attention of the Ethics Review Office. Best wishes for the successful completion of your project. Yours sincerely,
Jenny Peto Ethics Review Coordinator xc: Mr. W. Maurice (Grants Officer, Health Sciences)
333

Appendix 14 – Key Informants Interview – Consent Form
334

Consent to participate in a research study (consent form on reverse side)
PARTICIPANT’S COPY Title of study: An exploration of the structure of the Ontario physiotherapy (PT) market: behaviour in a multi-payer, multi-provider health care market Investigators Paul Holyoke, LL.B., M.Sc.(Econ.), PhD (Candidate), Department of Health Policy,
Management and Evaluation, University of Toronto Raisa B. Deber PhD, Professor, Department of Health Policy, Management and Evaluation,
University of Toronto Purpose of the study and the interview This study will examine the nature of payers and providers in the Ontario PT market and how they interact. One aspect of the study is an analysis of the reasons for the current level of foreign and domestic ownership of for-profit PT provider organizations, and it is this aspect that is being investigated at this time. The proposed interview will be comprised of questions about features of the Ontario PT market that may make it particularly attractive or unattractive for domestic and foreign for-profit providers to enter or stay in this market. The questions will cover such areas as the characteristics of revenue sources in the market and the general health care and business environment. Potential benefits and harm There is no risk of harm to any participant. Rather, through participation, you will contribute to the understanding of the pattern of ownership in the PT market, and a summary of the results of the interviews will be made available to you upon the completion of the study, if you request it. Anonymity Your anonymity will be maintained at all times during this study. The questions will not seek any personal or confidential information other than the general source of your knowledge of the physiotherapy market. All information gathered will be kept in a secure location and will be destroyed within 20 months of your interview. Any data presented publicly will be presented in a manner so that it will not be possible to identify you as a source of data.
335

Consent to participate in a research study (description of study on reverse side)
I, ____________________________ (participant’s name), understand that I am being asked to participate in a University of Toronto study described on the reverse side of this sheet to answer questions relating to features of the Ontario PT market that may make it particularly attractive or unattractive for domestic and foreign providers to enter or stay in this market. I am volunteering to participate in this study, and I understand that I may refuse to answer any question during the interview and that I may withdraw from the study at any time. I understand what this study involves and I freely agree to take part, and I have been provided with a copy of this signed consent form. I am also giving my consent for my interview to be audio taped to ensure accurate interpretation of my responses. ____________________________ __________________________ ____________ Signature of participant Name (please print) Date
336

Appendix 15 – Forms for completion by physiotherapy provider organizations and others
337

Auto Insurance Standard Invoice (OCF-21)
Claim Number:
Policy Number:
Date of Accident: (YYYYMMDD)
Use this form for accidents that occur on or after November 1, 1996 for medical and rehabilitation goods and services that are payable by an automobile insurer. The User Manual for completion of the form and its versions may be found at www.autoinsurancereforms.on.ca.Attach Version C - pages 2 and 3 for Pre-approved Frameworks (PAFs). Attach Version A - page 2 where there is a previously approved treatment or assessment plan. Version B - pages 2 and 3 must be used for all other goods and services and may be used for previously approved treatment plans and assessments, at the discretion of the provider. Please provide all information requested. Confidentiality: Collection, use and disclosure of this information is subject to all applicable privacy legislation.
Part 1 ApplicantInformation
Date Of Birth (YYYYMMDD) Gender R Male R Female
Telephone Number Extension
Last Name
First Name Middle Name
Address
City Province Postal Code
--
Company Name City or Town of Branch Office (if applicable)
Adjuster Last Name Adjuster First Name
Adjuster Telephone Extension Adjuster Fax
Part 2 Insurance CompanyInformation
Name of policy holder same as: R Applicant OR
Policy Holder Last Name Policy Holder First Name
Invoice Number
First Invoice R Yes R No
Last Invoice R Yes R No
DAC Type (if applicable)
R Med / Rehab
R Disability
R Post 104 weeks
R Attendant Care
Part 3 Invoice Information
R Catastrophic
For previously approved goods and services, please complete the following:
Type of Plan or Pre-approved Framework Plan Date (YYYYMMDD)
Plan Number
Approved Amount
PreviouslyBilled
R Treatment Plan (OCF-18) X
R DAC Plan (OCF-11) X
R Assessment Plan (OCF-22) X
R PAF Type: '
X Attach Version A or B ' Attach Version C
For all other invoices, attach Version B
OCF-21 (11/04) Page 1 of 6
Facility Name (if applicable) AISI Facility Number (if applicable)
Payee Last Name Payee First Name Payee Number (if applicable)
Address
City Province Postal Code
--Telephone Number Extension Fax Number
Email Address
R I wish to declare that I have no conflicts of interest relating to this invoice, and I have determined, after making reasonable inquiries, that there are no conflicts of interest relating to this invoice on the part of any person who referred the applicant to a person who provided goods or services referred to in this invoice.
Or R I am declaring the following conflicts of interest relating to this invoice:
I certify that the information provided is true and correct. I understand that it is an offence under the Insurance Act to knowingly make a false or misleading statement or representation to an insurer under a contract of insurance. I further understand that it is an offence under the federal Criminal Code for anyone, by deceit, falsehood, or other dishonest act, to defraud or attempt to defraud an insurance company. This information will be used for processing payments of claims; identifying and analysing the nature, effects and costs of goods and services that are provided to automobile accident victims, by health care providers; and detecting and preventing fraud.
Part 4 Payee Information
Name of Health Professional or Authorized Signatory (please print) Signature of Health Professional or Authorized Signatory Date (YYYYMMDD)
338

OCF-21 - Version A - page 2 This form may be used for billing goods and services that have been previously approved by the insurer through an OCF-18, OCF-11, or OCF-22. This form may not be used for Pre-approved Frameworks (use Version C - pages 2 and 3) or goods and services that have not been previously approved (use Version B - pages 2 and 3).
Injuries and Sequelae
Description Code
Injury details are not required if they are the same as those on an approved plan. Refer to the User Manual at www.autoinsurancereforms.on.ca for coding.
Providers
Ref Type Last Name First Name
Regulated (College Registration
Number)
Unregulated (AISI Number if
applicable, or blank)
Hourly Rate For Insurer's Use
A B C D E F
Provider details are not required if they are the same as those on an approved plan. Refer to the User Manual at www.autoinsurancereforms.on.ca for coding.
G/SRef
Month (yyyy-mm): P S T
G S T
Cost/ Day
Total Count
Total Cost 1 2 3 4 5 6 7 8 9 10 11 12 13 14 15 16 17 18 19 20 21 22 23 24 25 26 27 28 29 30 31
Refer to the previously approved plan for each good and service reference number (G/S Ref). Enter the Provider Reference from the previously approved plan or the Provider table above at the intersection of the date of service and the G/S Ref indicating the provider who rendered or prescribed the service or good.
MOH Insurer 1 Insurer 2 Sub-Total: Chiropractic:
Account Activity Since Last Invoice (if Interest is being charged) MOH:
Physiotherapy: Prior Balance: Other Insurer 1 + 2: Massage Therapy: GST (if applicable):
1Other Service Type: Payment Received from Auto Insurer: PST (if applicable):
Total: 2Overdue Amount: 2Interest:
Oth
er In
sura
nce
1Please Specify Other Service Type:
2The insurer shall pay interest on overdue outstanding balances as required by the Statutory Accident Benefits Schedule.
Auto Insurer Total:
Make cheque payable to: Other Information:
For insurer's use only Reviewed By: Approved By: Payee Name:
Payment Amount: Total Interest Grand Total
R Additional sheets attached
OCF-21 (11/04) Page 2 of 6
339

OCF-21 - Version B - page 2
Version B - pages 2 and 3 are used together for billing goods and services that have not been previously approved by the insurer through an OCF-18, OCF-11, or OCF-22. They may be used, at the discretion of the provider, for billing any goods or services except Pre-approved Frameworks (use Version C - pages 2 and 3).
Injuries and Sequelae
Description Code
Injury details are not required if they are the same as those on a previously approved plan.
Refer to the User Manual at www.autoinsurancereforms.on.ca for coding.
Providers
Ref Type Last Name First Name
Regulated(College Registration
Number)
Unregulated(AISI Number if
applicable, or blank)
Hourly Rate For Insurer's Use
A B C D E F
Provider details are not required if they are the same as those on a previously approved plan. Refer to the User Manual at www.autoinsurancereforms.on.ca for coding.
Date of Service YYYY MM DD
Description Code Attribute
Provider Reference Quantity Measure GST
(�) PST (�) Cost
Refer to the User Manual at www.autoinsurancereforms.on.ca for coding. Sub-Total R Additional sheets attached
OCF-21 (11/04) Page 3 of 6
340
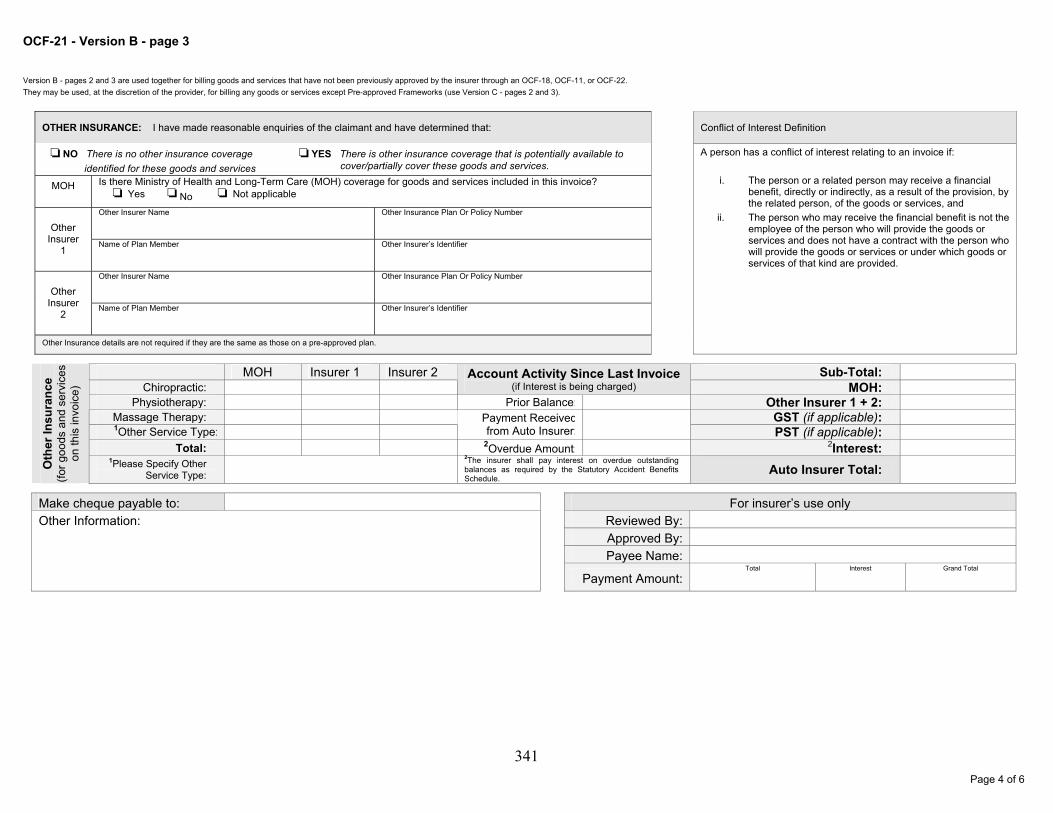
OCF-21 - Version B - page 3
Version B - pages 2 and 3 are used together for billing goods and services that have not been previously approved by the insurer through an OCF-18, OCF-11, or OCF-22. They may be used, at the discretion of the provider, for billing any goods or services except Pre-approved Frameworks (use Version C - pages 2 and 3).
Conflict of Interest Definition
MOH Insurer 1 Insurer 2 Sub-Total: Chiropractic:
Account Activity Since Last Invoice (if Interest is being charged) MOH:
Physiotherapy: Prior Balance: Other Insurer 1 + 2: Massage Therapy: GST (if applicable): 1Other Service Type:
Payment Received from Auto Insurer: PST (if applicable):
Total: 2Overdue Amount: 2Interest:
Oth
er In
sura
nce
(for g
oods
and
ser
vice
son
this
invo
ice)
Make cheque payable to: Other Information:
1Please Specify Other Service Type:
2The insurer shall pay interest on overdue outstanding balances as required by the Statutory Accident Benefits Schedule.
Auto Insurer Total:
OTHER INSURANCE: I have made reasonable enquiries of the claimant and have determined that:
R NO There is no other insurance coverage identified for these goods and services
R YES There is other insurance coverage that is potentially available to cover/partially cover these goods and services.
MOH Is there Ministry of Health and Long-Term Care (MOH) coverage for goods and services included in this invoice? R Yes R No R Not applicable
Other Insurer
1
Other Insurer Name Other Insurance Plan Or Policy Number
Name of Plan Member Other Insurer’s Identifier
Other Insurer
2
Other Insurer Name Other Insurance Plan Or Policy Number
Name of Plan Member Other Insurer’s Identifier
Other Insurance details are not required if they are the same as those on a pre-approved plan.
A person has a conflict of interest relating to an invoice if:
i. The person or a related person may receive a financial benefit, directly or indirectly, as a result of the provision, by the related person, of the goods or services, and
ii. The person who may receive the financial benefit is not the employee of the person who will provide the goods or services and does not have a contract with the person who will provide the goods or services or under which goods or services of that kind are provided.
For insurer’s use only Reviewed By: Approved By: Payee Name:
Payment Amount: Total Interest Grand Total
OCF-21 (11/04)
Page 4 of 6
341

OCF-21 - Version C - page 2 Version C, pages 2 and 3 are attached to OCF-21 page 1 and used to bill for goods and services within the guidelines of a Pre-approved Framework. For all other goods and services attach Version A or B.
Injuries and Sequelae
Description Code
Injury details are not required if they are the same as those on the Pre-approved Framework Treatment Confirmation Form (OCF-23/198) Refer to the User Manual at www.autoinsurancereforms.on.ca for coding.
Providers
Ref Type Last Name First Name
Regulated (College Registration
Number)
Unregulated (AISI Number if
applicable, or blank)
Hourly Rate For Insurer's Use
A B C D E F
Refer to the User Manual at www.autoinsurancereforms.on.ca for coding.
Goods and Services Rendered (PAF providers are required to declare the information requested below on every treatment, service and good delivered. Failure to provide this information may delay payment)
Date of Service Description Code Attribute
Provider Reference Quantity Measure YYYY MM DD
Refer to the User Manual at www.autoinsurancereforms.on.ca for coding. R Additional sheets attached
OCF-21 (11/04)
Page 5 of 6
342

OCF-21 - Version C - page 3 Version C, pages 2 and 3 are attached to OCF-21 page 1 and used to bill for goods and services within the guidelines of a Pre-approved Framework. For all other goods and services attach Version A or B.
Reimbursable Fees Within the PAF Guidelines:
Description Code Attribute Cost
Refer to the User Manual at www.autoinsurancereforms.on.ca for coding. PAF Fee Totals:
Other Reimbursable Goods and Services Approved by the Insurer: Date of Service Description Code Attribute Provider
Reference Quantity Measure GST (�)
PST (�) Cost YYYY MM DD
Refer to the User Manual at www.autoinsurancereforms.on.ca for coding. Other Goods and Services Total:
MOH Insurer 1 Insurer 2 Sub-Total: Chiropractic:
Account Activity Since Last Invoice (if Interest is being charged) MOH:
Physiotherapy: Prior Balance: Other Insurer 1 + 2: Massage Therapy: GST (if applicable): 1Other Service Type:
Payment Received from Auto Insurer: PST (if applicable):
Total: 2Overdue Amount: 2Interest:
Oth
er In
sura
nce
(for g
oods
and
serv
ices
on
this
invo
ice)
Make cheque payable to: Other Information:
1Please Specify Other Service Type:
2The insurer shall pay interest on overdue outstanding balances as required by the Statutory Accident Benefits Schedule.
Auto Insurer Total:
For insurer’s use only Reviewed By: Approved By: Payee Name:
Payment Amount: Total Interest Grand Total
OCF-21 (11/04)
Page 6 of 6
343

Trea
Use this fClaim
Polic
Date o
To the Applicant: Please complete Parts 1 and 2. After your health practitioner has reviewed your Treatment Confirmation Form with you, sign Part 12. Your health practitioner will complete all other parts of the form. A health practitioner (chiropractor, dentist, occupational therapist, optometrist, physician, physiotherapist, nurse practitioner, psychologist, speech language pathologist) must sign Part 5. Collection, use and disclosure of this information is subject to all applicable privacy legislation. Additional disclosure and consent may be required depending on the manner in which the information is used and disclosed. Please provide all information requested.
To the Initiating HeaUse this form for accservices provided in aConsent: It is the recollection, use and diform. The Ontario ClInformation should b
Date Of Birth (YYYYMMDD) Gender
Male Female
Last Name
First Name Middle Nam
Address
Part 1 Applicant Information To be completed by the applicant
City Province
Company Name City or Town of Bra
Adjuster Last Name Adjuster First Name
Adjuster Telephone Extension Adjuster Fax
Part 2 Insurance Company Information To be completed by the applicant Name of policy holder:
Same as Applicant , OR: Policy Holder Last Name
OTHER INSURANCE: Is there other insurance coverage for any goods an Treatment Confirmation Form? I have made reasonable enquiries of the applicant a NO There is no other insurance coverage
identified for these goods and services YES The
ava
MOH
Is there Ministry of Health and Long-Term Care (MOH) coveragConfirmation Form?
Yes No Not applicable Other Insurer Name Oth
Other Insurer
1 Name of Plan Member Oth
Other Insurer Name Oth
Part 3 Other Insurance Information To be completed by the Initiating Health Practitioner with Information from the Applicant
Other Insurer
2 Name of Plan Member Oth
Part 4 Conflict of Interest Definition
A person has a conflict of interest relating to a Pre-approved Framework Treatment Co i) the person or a related person may receive a financial benefit, directly or
another person, of goods or services contemplated by the Pre-approved Frii) the person who may receive the financial benefit is not the employee of th
have a contract with the person who will provide the goods or services or un 344
Pre-approved Frameworktment Confirmation Form
(OCF-23/198)orm for accidents that occur on or after October 1, 2003 Number:
y Number: f Accident: (YYYYMMDD)
lth Practitioner:idents that occur on or after October 1, 2003 for goods and ccordance with a Pre-approved Framework (PAF) Guideline.
sponsibility of the initiating Health Practitioner to ensure that the sclosure of information submitted are authorized by a consent aims Form 5 (OCF-5) Permission to Disclose Health e used as a consent form.
Telephone Number Extension
e
Postal Code
nch Office (if applicable)
Policy Holder First Name
d services listed in this Pre-approved Framework
nd have determined that: re is other insurance coverage that is potentially ilable to cover/partially cover these goods and services. e for any goods and services included in this Treatment
er Insurance Plan Or Policy Number
er Insurer’s Identifier
er Insurance Plan Or Policy Number
er Insurer’s Identifier
OCF-23/198 (10/03 revised) Page 1 of 3
nfirmation Form if,
indirectly, as a result of the provision, by the related person or amework Treatment Confirmation Form, and e person who will provide the goods or services and does not der which goods or services of that kind are provided.

OCF-23/198 (10/03 revised) Page 2 of 3
Name of Initiating Health Practitioner (please print) College Registration Number
Facility Name (if applicable) AISI Facility Number (if applicable)
Address
City Province Postal Code
Telephone Number Extension Fax Number
Email Address
You are a: Chiropractor Dentist Nurse Practitioner Occupational Therapist Optometrist Physician Physiotherapist Psychologist Speech-Language
Pathologist
I am not the first Initiating Health Practitioner
Conflict of Interest Declaration
I wish to declare that I have no conflicts of interest relating to this Pre-approved Framework Treatment Confirmation Form, and I have determined, after making reasonable inquiries, that there are no conflicts of interest relating to this form on the part of any person who referred the applicant to a person who will provide goods or services contemplated in this form; or
I am declaring the following conflicts of interest relating to this Pre-approved Framework Treatment Confirmation Form: I certify that the goods and services contemplated are reasonable and necessary for the treatment and rehabilitation of the applicant for the injuries identified in Part 6, and the treatment proposed is in accordance with a PAF Guideline. I have reviewed the proposed treatment with the applicant. I certify that the information provided is true and correct. I understand that it is an offence under the Insurance Act to knowingly make a false or misleading statement or representation to an insurer under a contract of insurance. I further understand that it is an offence under the federal Criminal Code for anyone, by deceit, falsehood, or other dishonest act, to defraud or attempt to defraud an insurance company.
Part 5 Signature of Initiating Health Practitioner
Name of Initiating Health Practitioner (please print) Signature of Initiating Health Practitioner Date (YYYYMMDD)
To the Health Professional: Please complete the following information based on your most recent examination of the applicant named above and return the form to the insurance company listed in Part 2. Please print clearly.
Provide a description (list most significant first) and associated ICD-10-CA code for injuries and sequelae that are the direct result of the automobile accident.
Injury Description Injury Code
Part 6 Injury and Sequelae Information
Note : Refer to the User manual at www.autoinsurancereforms.on.ca for ICD-10-CA coding information.
Part 7 Prior and Concurrent Conditions
a) Prior to the accident, did the applicant have any disease, condition or injury that could affect his/her response to treatment for the injuries identified in Part 6?
No Unknown Yes (please explain)
b) If Yes to “a” above, did the applicant undergo investigation or receive treatment for this disease, condition or injury in the past
year? No Unknown Yes (please explain and identify provider, if known)
Part 8 Barriers to Recovery
a) Have you identified any barriers to recovery that may affect the success of this treatment for this particular applicant? (For assistance in identifying barriers to recovery, please refer to the user manual at www.autoinsurancereforms.on.ca.)
No Yes (please explain)
345

Applicant Name: Policy Number: Provider Name: OCF23/198 - FAX BACK Claim Number:
Provider Fax: Date of Accident:
OCF-23/198 (10/03 revised) Page 3 of 3
Part 9 PAF Pre-approved Services Category Description Maximum Fee Estimated Fee
PAF (identify which PAF Guideline) Supplementary Goods & Services
Other Pre-approved Services (including radiology)
Part 9 Sub-Total
Provider Provider Reference
Provider Type
Last Name First Name
Regulated (College
Registration Number)
Unregulated (AISI Number if applicable, or
blank)
Hourly Rate (if applicable)
A
B
C
Part 10 Other Health Providers (required only if Part 11 Services are rendered by Other Providers) D
Part 11 Other Goods or Services Within the PAF Guidelines Requiring Insurer Approval Estimated
Description Code Attribute Provider Reference Quantity Measure Cost
Part 11 Sub-Total: Note : Refer to the User Manual coding guidelines posted at www.autoinsurancereforms.on.ca. Attributes codes are used to further qualify the service codes and are described in the manual.
Note : Payment by auto insurer is secondary to available collateral benefits. Total:
Briefly explain why the goods and services in Part 11 are being proposed and the treatment goal:
I have reviewed this form. I have been informed about and agree with the proposed treatment. I certify that, to the best of my knowledge, the information I have provided is accurate. Payment for this treatment is pre-approved, and/or subject to the approval of the insurer. For services requiring insurer approval, I understand that, if I undertake those services prior to approval by the insurer or a Designated Assessment Centre, I may be responsible to my provider for any goods or services provided. All services are subject to coverage issues or exclusions. I consent to sharing of personal information between my Initiating Health Practitioner and my insurer. If this OCF-23/198 is not being completed by the first Initiating Health Practitioner, I consent to the insurer contacting the first Initiating Health Practitioner to determine the amount of the PAF goods and services that have been consumed. In the event that my insurer disputes the application, I authorize my insurance company and treating health professionals to give the Designated Assessment Centre any information relating to my health condition, treatment and rehabilitation received as a result of the automobile accident, for the purpose of determining my eligibility for benefits. I authorize the Designated Assessment Centre to consult with my treating health professionals if necessary. I also authorize the Designated Assessment Centre to give my insurance company and treating health professionals a copy of its report. I understand that it is an offence under the Insurance Act to knowingly make a false or misleading statement or representation to an insurer under a contract of insurance. I further understand that it is an offence under the federal Criminal Code for anyone, by deceit, falsehood, or other dishonest act, to defraud or attempt to defraud an insurance company.
Part 12 Signature of Applicant
Must be completed unless waived by insurer
Name of Applicant or Substitute Decision Maker (please print) Signature of Applicant or Substitute Decision Maker Date (YYYYMMDD)
I waive the requirement of the Applicant’s signature.
I have reviewed this Pre-approved Framework Treatment Confirmation Form, and based upon the information provided, I confirm that the policy referred to in Part 2 was in force at the time of the accident.
If other goods or services requiring insurer approval have been proposed in Part 11, I Approve Partially approve
(explanation to follow or attached) Do not approve
(explanation to follow or attached) Name of Adjuster (please print) Signature of Adjuster Date (YYYYMMDD)
Part 13 Signature of Insurer
To the insurer: Please provide a copy of this page to the Applicant and the Initiating Health Practitioner indicated in Part 5.
346

347

348

349

350

351
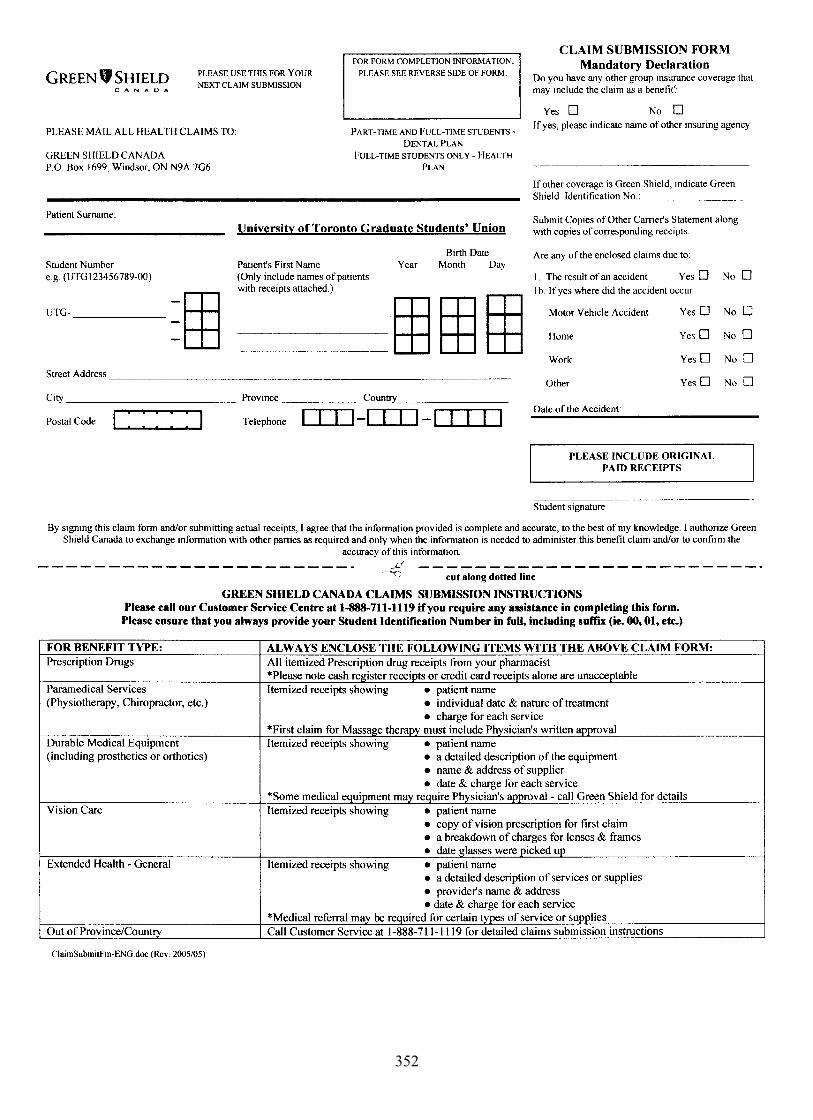
352

Appendix 16 – Details of the results of specific statistical tests
353

Table A4-1: Summary of Kruskal-Wallis ANOVA of the proportion of treatments provided by assisting and supporting personnel, by strategic provider groups
Χ2 df p 19.52 3 .000
Mann-Whitney U Tests
z p FP/c and FP/s -2..32 .020 FP/c and NFP-Hospital -.85 .397 FP/c and Other NFP -.93 .353 FP/s and NFP-Hospital -4.24 .000* FP/s and Other NFP -.61 .540 NFP-Hospital and Other NFP -1.96 .051 *Significant at the .0125 level. NOTE: The distribution of the dependent variables was not normal (Kolmogorov-Smirnoff statistics were all significant (p<.001)) though the variances were homogeneous (Levene’s statistic = 2.10, p=.10). Accordingly, the nonparametric Kruskal-Wallis one-way ANOVA was used.
Table A4-2: Summary of Kruskal-Wallis ANOVA of the number of registered physiotherapists in provider organizations with at least 1, by strategic provider groups
Χ2 df p 40.28 3 .000
Mann-Whitney U Tests
z p FP/c and FP/s -.56 .578 FP/c and NFP-Hospital -4.54 .000* FP/c and Other NFP -.31 .757 FP/s and NFP-Hospital -6.27 .000* FP/s and Other NFP -.81 .421 NFP-Hospital and Other NFP -3.55 .000* *Significant at the .0125 level. NOTE: The distribution of the dependent variables was not normal (Kolmogorov-Smirnoff statistics were all significant (p<.001)) and the variances were not homogeneous (Levene’s statistic = 30.163, p<.001). Accordingly, the nonparametric Kruskal-Wallis one-way ANOVA was used.
354

Table A4-3: Summary of ANOVA for the densities of all registered physiotherapists per 10,000 population, by groups of counties, 2003 and 2005
2003 Academic
Counties Contiguous
Counties Other
Counties n 6 23 20
Mean 5.70 3.00 2.86 SD 0.80 0.85 1.16
Range 4.82-7.00 1.01-4.42 0.86-4.71 SS (between) SS (within) df MS(between) MS (within) F ratio
40.49 44.69 [2,46] 20.25 0.97 20.84 Post hoc Bonferroni tests p<.001 Contiguous Other Academic p<.001 p<.001 Contiguous P=1.00
2005 Academic
Counties Contiguous
Counties Other
Counties N 6 23 20
Mean 5.61 2.97 2.87 SD 0.90 0.84 1.01
Range 4.77-7.03 1.23-4.62 1.37-4.56 SS (between) SS (within) df MS(between) MS (within) F ratio
38.11 44.69 [2,46] 19.06 0.86 22.84 Post hoc Bonferroni tests p<.001 Contiguous Other Academic p<.001 p<.001 Contiguous P=1.00
355
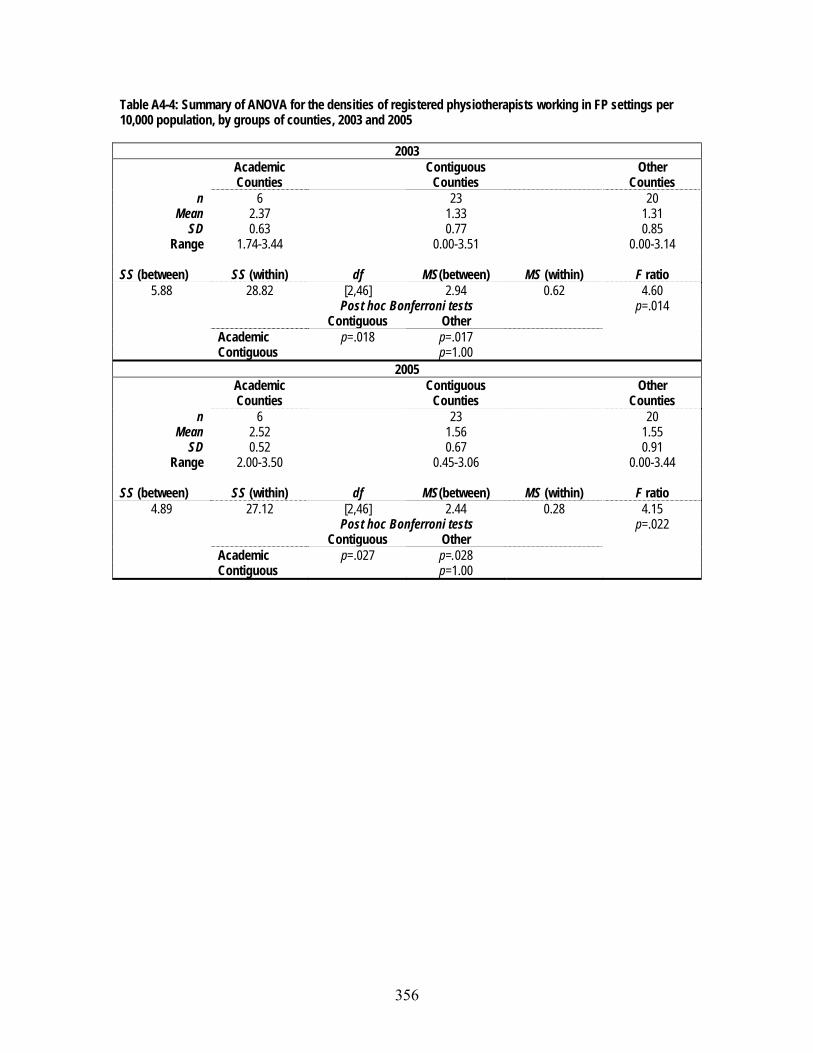
Table A4-4: Summary of ANOVA for the densities of registered physiotherapists working in FP settings per 10,000 population, by groups of counties, 2003 and 2005
2003 Academic
Counties Contiguous
Counties Other
Counties n 6 23 20
Mean 2.37 1.33 1.31 SD 0.63 0.77 0.85
Range 1.74-3.44 0.00-3.51 0.00-3.14 SS (between) SS (within) df MS(between) MS (within) F ratio
5.88 28.82 [2,46] 2.94 0.62 4.60 Post hoc Bonferroni tests p=.014 Contiguous Other Academic p=.018 p=.017 Contiguous p=1.00
2005 Academic
Counties Contiguous
Counties Other
Counties n 6 23 20
Mean 2.52 1.56 1.55 SD 0.52 0.67 0.91
Range 2.00-3.50 0.45-3.06 0.00-3.44 SS (between) SS (within) df MS(between) MS (within) F ratio
4.89 27.12 [2,46] 2.44 0.28 4.15 Post hoc Bonferroni tests p=.022 Contiguous Other Academic p=.027 p=.028 Contiguous p=1.00
356
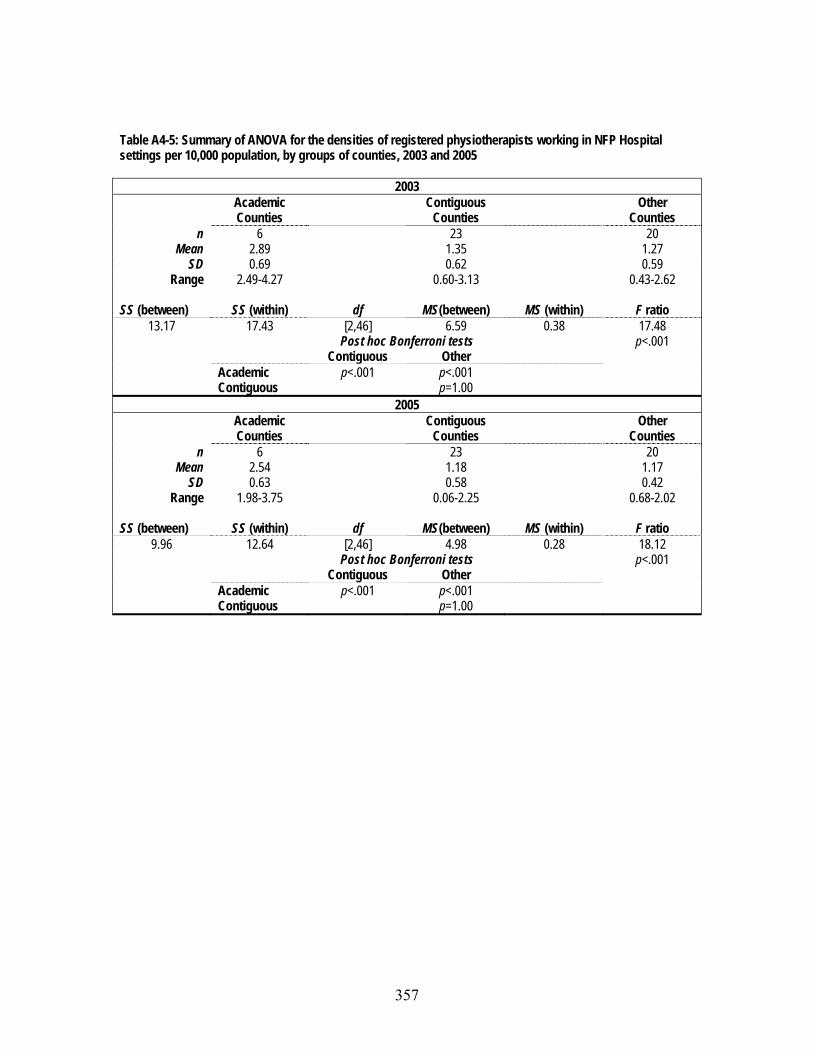
Table A4-5: Summary of ANOVA for the densities of registered physiotherapists working in NFP Hospital settings per 10,000 population, by groups of counties, 2003 and 2005
2003 Academic
Counties Contiguous
Counties Other
Counties n 6 23 20
Mean 2.89 1.35 1.27 SD 0.69 0.62 0.59
Range 2.49-4.27 0.60-3.13 0.43-2.62 SS (between) SS (within) df MS(between) MS (within) F ratio
13.17 17.43 [2,46] 6.59 0.38 17.48 Post hoc Bonferroni tests p<.001 Contiguous Other Academic p<.001 p<.001 Contiguous p=1.00
2005 Academic
Counties Contiguous
Counties Other
Counties n 6 23 20
Mean 2.54 1.18 1.17 SD 0.63 0.58 0.42
Range 1.98-3.75 0.06-2.25 0.68-2.02 SS (between) SS (within) df MS(between) MS (within) F ratio
9.96 12.64 [2,46] 4.98 0.28 18.12 Post hoc Bonferroni tests p<.001 Contiguous Other Academic p<.001 p<.001 Contiguous p=1.00
357

Table A4-6: Summary of ANOVA for the densities of registered physiotherapists working in Other NFP settings per 10,000 population, by groups of counties, 2003 and 2005
2003 Academic
Counties Contiguous
Counties Other
Counties n 6 23 20
Mean 0.44 0.33 0.29 SD 0.33 0.43 0.38
Range 0.14-0.86 0.00-1.73 0.00-1.31 SS (between) SS (within) df MS(between) MS (within) F ratio
0.11 7.44 [2,46] 0.54 0.16 0.33 p=.720
2005 Academic
Counties Contiguous
Counties Other
Counties n 6 23 20
Mean 0.54 0.23 0.15 SD 0.39 0.41 0.24
Range 0.13-1.11 0.00-1.61 0.00-0.78 SS (between) SS (within) df MS(between) MS (within) F ratio
0.11 7.44 [2,46] 0.05 0.16 2.97 p=.06
358
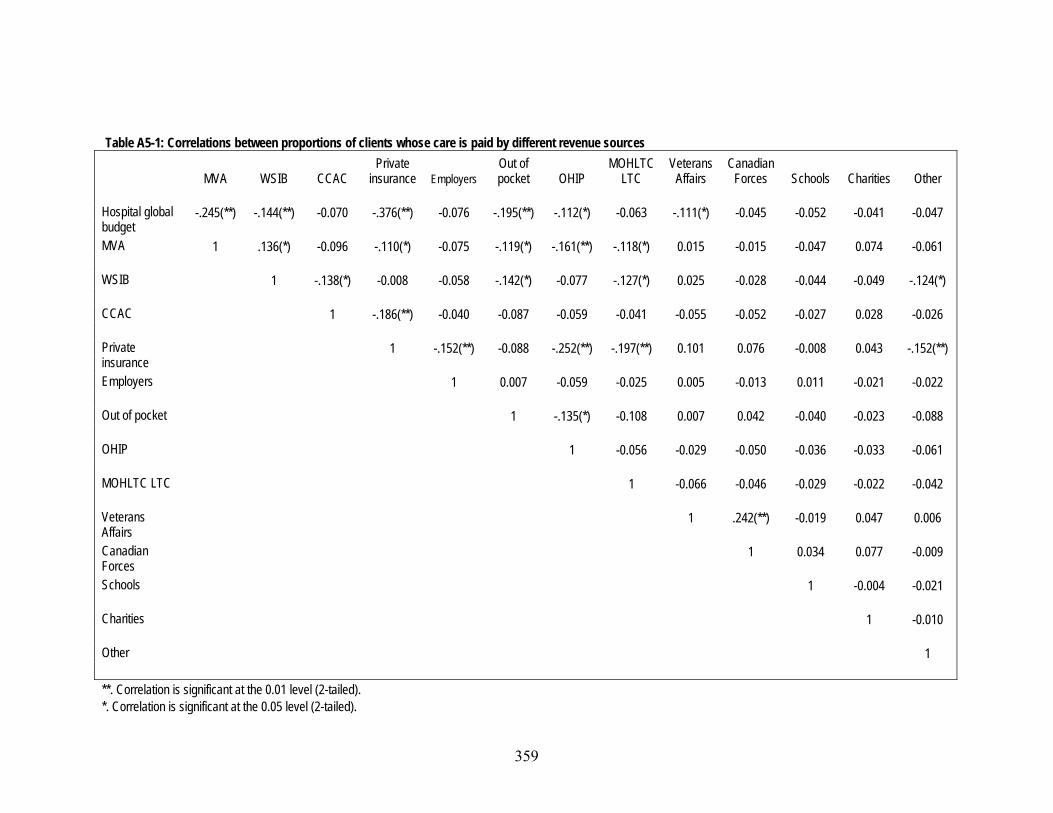
Table A5-1: Correlations between proportions of clients whose care is paid by different revenue sources
MVA WSIB CCAC Private
insurance Employers Out of pocket OHIP
MOHLTC LTC
Veterans Affairs
Canadian Forces Schools Charities Other
Hospital global budget
-.245(**) -.144(**) -0.070 -.376(**) -0.076 -.195(**) -.112(*) -0.063 -.111(*) -0.045 -0.052 -0.041 -0.047
MVA 1 .136(*) -0.096 -.110(*) -0.075 -.119(*) -.161(**) -.118(*) 0.015 -0.015 -0.047 0.074 -0.061
WSIB 1 -.138(*) -0.008 -0.058 -.142(*) -0.077 -.127(*) 0.025 -0.028 -0.044 -0.049 -.124(*)
CCAC 1 -.186(**) -0.040 -0.087 -0.059 -0.041 -0.055 -0.052 -0.027 0.028 -0.026
Private insurance
1 -.152(**) -0.088 -.252(**) -.197(**) 0.101 0.076 -0.008 0.043 -.152(**)
Employers 1 0.007 -0.059 -0.025 0.005 -0.013 0.011 -0.021 -0.022
Out of pocket 1 -.135(*) -0.108 0.007 0.042 -0.040 -0.023 -0.088
OHIP 1 -0.056 -0.029 -0.050 -0.036 -0.033 -0.061
MOHLTC LTC 1 -0.066 -0.046 -0.029 -0.022 -0.042
Veterans Affairs
1 .242(**) -0.019 0.047 0.006
Canadian Forces
1 0.034 0.077 -0.009
Schools 1 -0.004 -0.021
Charities 1 -0.010
Other 1
**. Correlation is significant at the 0.01 level (2-tailed). *. Correlation is significant at the 0.05 level (2-tailed).
359

Table A5-2: Summary of ANOVA and post hoc Bonferroni tests of the number of revenue sources, by strategic provider group SS (between) SS (within) df MS(between) MS (within) F ratio
85.63 820.49 [3,317] ?? ?? 11.03 p<.001 Post hoc Bonferroni tests FP/s NFP Hospital Other NFP FP/c p=1.000 p<.001* p<.001* FP/s p<.001* p<.001* NFP Hospital p=1.000 * Significant at the .0125 level.
Table A5-3: Summary of Kruskal-Wallis one-way ANOVA and Mann-Whitney U pairwise tests of the proportion of patients whose care is paid by MVA insurance, by strategic provider group
Χ2 df p 56.19 3 .000
Mann-Whitney U Tests
z p FP/c and FP/s -0.67 .506 FP/c and NFP-Hospital -4.72 .000* FP/c and Other NFP -3.94 .000* FP/s and NFP-Hospital -6.10 .000* FP/s and Other NFP -4.83 .000* NFP-Hospital and Other NFP -0.70 .703 *Significant at the .0125 level NOTE: While the distribution of the independent variables was normal, the variances were not homogeneous (Levene’s statistic = 9.05, p<.001). Accordingly, the nonparametric Kruskal-Wallis ANOVA was used. Table A5-4: Summary of Kruskal-Wallis one-way ANOVA and Mann-Whitney U pairwise tests of the proportion of patients whose care is paid by WSIB, by strategic provider group
Χ2 df P 20.76 3 .000
Mann-Whitney U Tests
z P FP/c and FP/s -1.75 .080 FP/c and NFP-Hospital -2.19 .029 FP/c and Other NFP -4.55 .000* FP/s and NFP-Hospital -0.46 .649 FP/s and Other NFP -3.75 .000* NFP-Hospital and Other NFP -3.68 .000* *Significant at the .0125 level NOTE: While the distribution of the independent variables was normal, the variances were not homogeneous (Levene’s statistic = 7.60, p<.001). Accordingly, the nonparametric Kruskal-Wallis ANOVA was used.
360

Table A5-5: Summary of Kruskal-Wallis one-way ANOVA and pairwise Mann-Whitney U tests of the proportion of patients whose care is paid by private insurance, by strategic provider group
Χ2 df p 69.42 3 .000
Mann-Whitney U Tests
z p FP/c and FP/s -.59 .553 FP/c and NFP-Hospital -5.92 .000* FP/c and Other NFP -3.08 .002* FP/s and NFP-Hospital -7.61 .000* FP/s and Other NFP -4.08 .000* NFP-Hospital and Other NFP -1.95 .051 *Significant at the .0125 level NOTE: While the distribution of three of the four independent variables was normal, the fourth (FP/c) was not (Komogorov-Smirnov statistic = .138, p=.08) and the variances were not homogeneous (Levene’s statistic = 26.56, p<.001). Accordingly, the nonparametric Kruskal-Wallis ANOVA was used.
Table A5-6: Summary of Kruskal-Wallis one-way ANOVA and pairwise Mann-Whitney U tests of the proportion of patients whose care is paid by themselves, by strategic provider group
Χ2 df p 66.18 3 .000
Mann-Whitney U Tests
z p FP/c and FP/s -3.26 .001* FP/c and NFP-Hospital -4.44 .000* FP/c and Other NFP -1.57 .116 FP/s and NFP-Hospital -7.09 .000* FP/s and Other NFP -3.94 .000* NFP-Hospital and Other NFP -2.12 .034 *Significant at the .0125 level NOTE: While the distribution of the independent variables was normal, the variances were not homogeneous (Levene’s statistic = 16.44, p<.001). Accordingly, the nonparametric Kruskal-Wallis ANOVA was used.
Table A6-1 Summary of ANOVA for the rating of competition, by different provider organizations SS (between) SS (within) df MS(between) MS (within) F ratio
179.27 495.57 [3,331] 59.76 1.50 39.91 p<.001 Post hoc Bonferroni tests FP/s NFP-Hospital Other NFP FP/c p=1.000 p<.001 p<.001 FP/s p<.001 p<.001 NFP-Hospital p=1.000
361
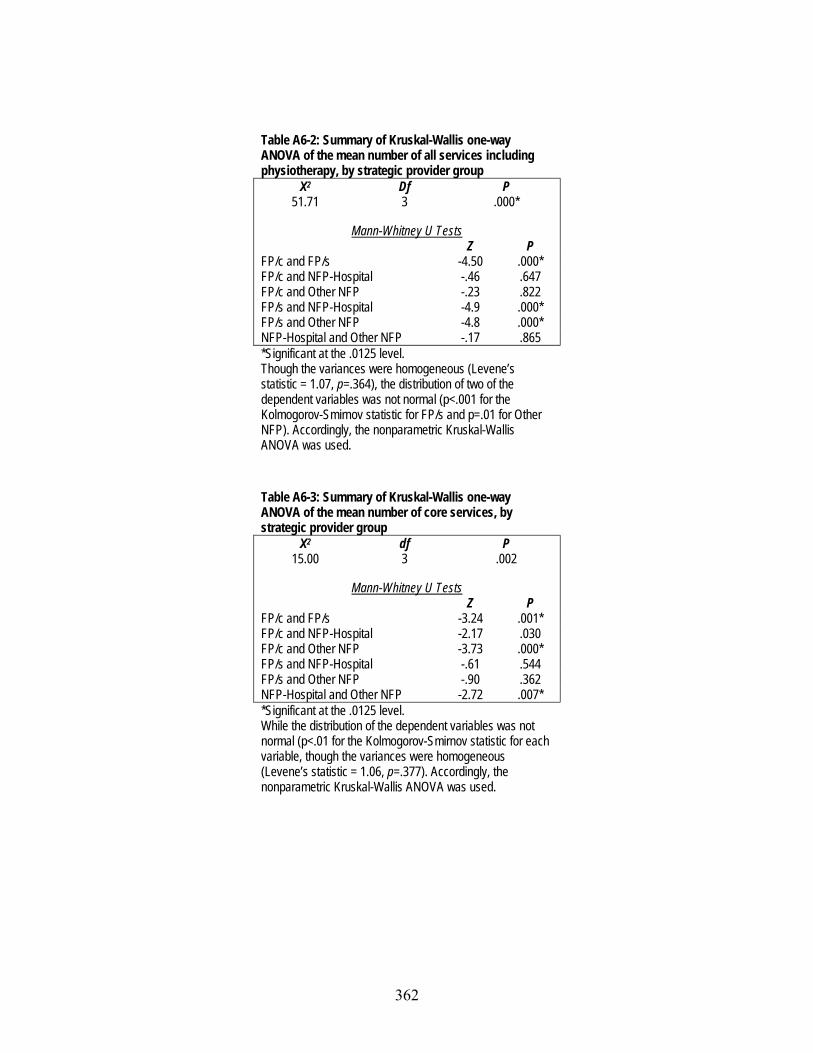
Table A6-2: Summary of Kruskal-Wallis one-way ANOVA of the mean number of all services including physiotherapy, by strategic provider group
Χ2 Df P 51.71 3 .000*
Mann-Whitney U Tests
Z P FP/c and FP/s -4.50 .000* FP/c and NFP-Hospital -.46 .647 FP/c and Other NFP -.23 .822 FP/s and NFP-Hospital -4.9 .000* FP/s and Other NFP -4.8 .000* NFP-Hospital and Other NFP -.17 .865 *Significant at the .0125 level. Though the variances were homogeneous (Levene’s statistic = 1.07, p=.364), the distribution of two of the dependent variables was not normal (p<.001 for the Kolmogorov-Smirnov statistic for FP/s and p=.01 for Other NFP). Accordingly, the nonparametric Kruskal-Wallis ANOVA was used.
Table A6-3: Summary of Kruskal-Wallis one-way ANOVA of the mean number of core services, by strategic provider group
Χ2 df P 15.00 3 .002
Mann-Whitney U Tests
Z P FP/c and FP/s -3.24 .001* FP/c and NFP-Hospital -2.17 .030 FP/c and Other NFP -3.73 .000* FP/s and NFP-Hospital -.61 .544 FP/s and Other NFP -.90 .362 NFP-Hospital and Other NFP -2.72 .007* *Significant at the .0125 level. While the distribution of the dependent variables was not normal (p<.01 for the Kolmogorov-Smirnov statistic for each variable, though the variances were homogeneous (Levene’s statistic = 1.06, p=.377). Accordingly, the nonparametric Kruskal-Wallis ANOVA was used.
362
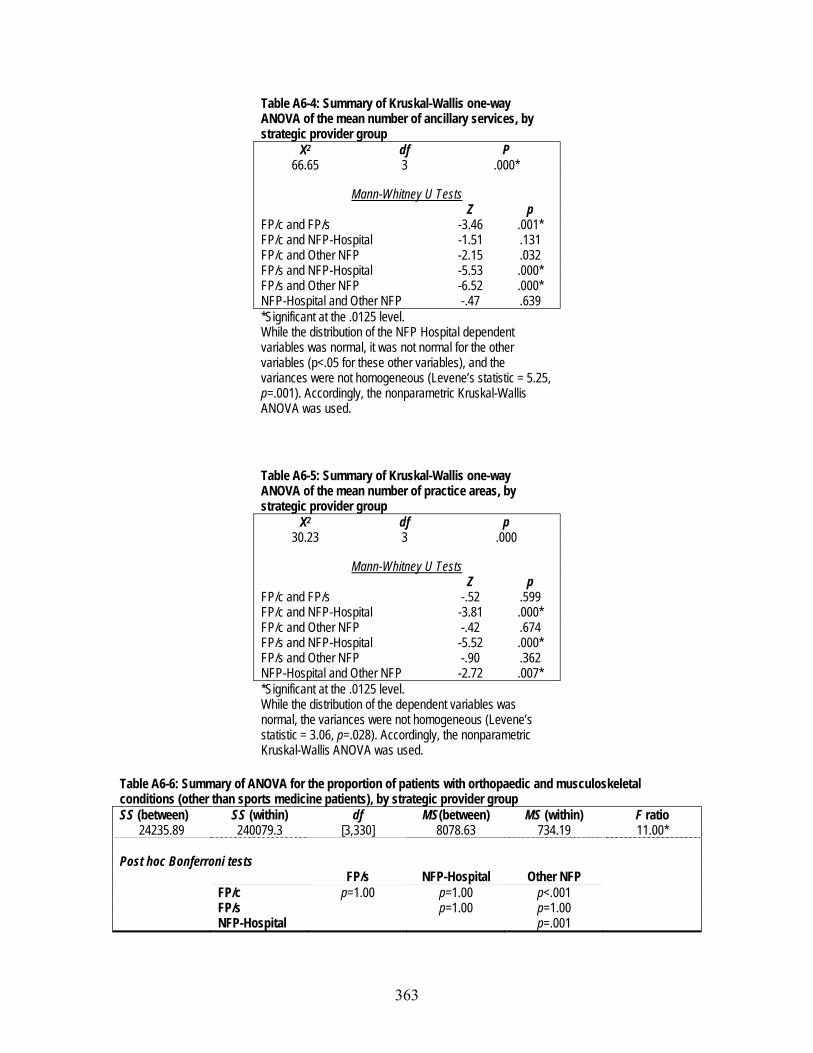
Table A6-4: Summary of Kruskal-Wallis one-way ANOVA of the mean number of ancillary services, by strategic provider group
Χ2 df P 66.65 3 .000*
Mann-Whitney U Tests
Z p FP/c and FP/s -3.46 .001* FP/c and NFP-Hospital -1.51 .131 FP/c and Other NFP -2.15 .032 FP/s and NFP-Hospital -5.53 .000* FP/s and Other NFP -6.52 .000* NFP-Hospital and Other NFP -.47 .639 *Significant at the .0125 level. While the distribution of the NFP Hospital dependent variables was normal, it was not normal for the other variables (p<.05 for these other variables), and the variances were not homogeneous (Levene’s statistic = 5.25, p=.001). Accordingly, the nonparametric Kruskal-Wallis ANOVA was used.
Table A6-5: Summary of Kruskal-Wallis one-way ANOVA of the mean number of practice areas, by strategic provider group
Χ2 df p 30.23 3 .000
Mann-Whitney U Tests
Z p FP/c and FP/s -.52 .599 FP/c and NFP-Hospital -3.81 .000* FP/c and Other NFP -.42 .674 FP/s and NFP-Hospital -5.52 .000* FP/s and Other NFP -.90 .362 NFP-Hospital and Other NFP -2.72 .007* *Significant at the .0125 level. While the distribution of the dependent variables was normal, the variances were not homogeneous (Levene’s statistic = 3.06, p=.028). Accordingly, the nonparametric Kruskal-Wallis ANOVA was used.
Table A6-6: Summary of ANOVA for the proportion of patients with orthopaedic and musculoskeletal conditions (other than sports medicine patients), by strategic provider group SS (between) SS (within) df MS(between) MS (within) F ratio
24235.89 240079.3 [3,330] 8078.63 734.19 11.00* Post hoc Bonferroni tests FP/s NFP-Hospital Other NFP FP/c p=1.00 p=1.00 p<.001 FP/s p=1.00 p=1.00 NFP-Hospital p=.001
363

Table A6-7: Summary of Kruskal-Wallis one-way ANOVA of the proportion of sports medicine patients, by strategic provider group
Χ2 df P 35.95 3 .000
Mann-Whitney U Tests
z p FP/c and FP/s -.13 .894 FP/c and NFP-Hospital -4.75 .000* FP/c and Other NFP -1.78 .076 FP/s and NFP-Hospital -5.81 .000* FP/s and Other NFP -1.99 .046 NFP-Hospital and Other NFP -1.75 .081 *Significant at the .0125 level. NOTE: While the distribution of the dependent variables was normal, the variances were not homogeneous (Levene’s statistic = 18.57, p<.001). Accordingly, the nonparametric Kruskal-Wallis ANOVA was used.
Table A6-8: Summary of Kruskal-Wallis ANOVA of the proportion of prevention and health promotion clients, by strategic provider group
Χ2 Df P 13.95 3 .003*
Mann-Whitney U Tests
z P FP/c and FP/s -3.65 .000* FP/c and NFP-Hospital -2.50 .013* FP/c and Other NFP -1.47 .140 FP/s and NFP-Hospital -.37 .715 FP/s and Other NFP --1.17 .243 NFP-Hospital and Other NFP -.75 .451 *Significant at the .0125 level. NOTE: While the distribution of the dependent variables was normal, the variances were not homogeneous (Levene’s statistic = 32.43, p<.001). Accordingly, the nonparametric Kruskal-Wallis ANOVA was used.
364

Table A6-9: Summary of Kruskal-Wallis ANOVA of the proportion of neurology/neurotrauma patients, by strategic provider group
Χ2 d P 28.76 3 .000*
Mann-Whitney U Tests
z P FP/c and FP/s -.92 .360 FP/c and NFP-Hospital -4.00 .000* FP/c and Other NFP -2.68 .007* FP/s and NFP-Hospital -4.69 .000* FP/s and Other NFP -2.59 .010* NFP-Hospital and Other NFP -.352 .725 * Significant at the .0125 level. NOTE: While the variances were homogeneous (Levene’s statistic = 32.43, p<.001), the distribution of the dependent variables was not normal (Kolmogorov-Smirnoff statistics were all significant (p<.001)). Accordingly, the nonparametric Kruskal-Wallis ANOVA was used.
Table 6-10: Summary of Kruskal-Wallis ANOVA of the length of wait lists, by strategic provider groups
Χ2 df p 73.67 3 .000
Mann-Whitney U Tests
z p FP/c and FP/s -.26 .797 FP/c and NFP-Hospital -5.51 .000* FP/c and Other NFP -1.60 .111 FP/s and NFP-Hospital -8.42 .000* FP/s and Other NFP -1.90 .057 NFP-Hospital and Other NFP -3.33 .001* *Significant at the .0125 level. The distribution of the dependent variables was not normal (Kolmogorov-Smirnoff statistics were all significant (p<.001)) and the variances were homogeneous (Levene’s statistic = 41.258, p<.001). Accordingly, the nonparametric Kruskal-Wallis one-way ANOVA was used.
365